
Study on Temperature Characteristics of Lubrication Film of Valve Plate Pair in Axial Piston Pumps


Abstract
:1. Introduction
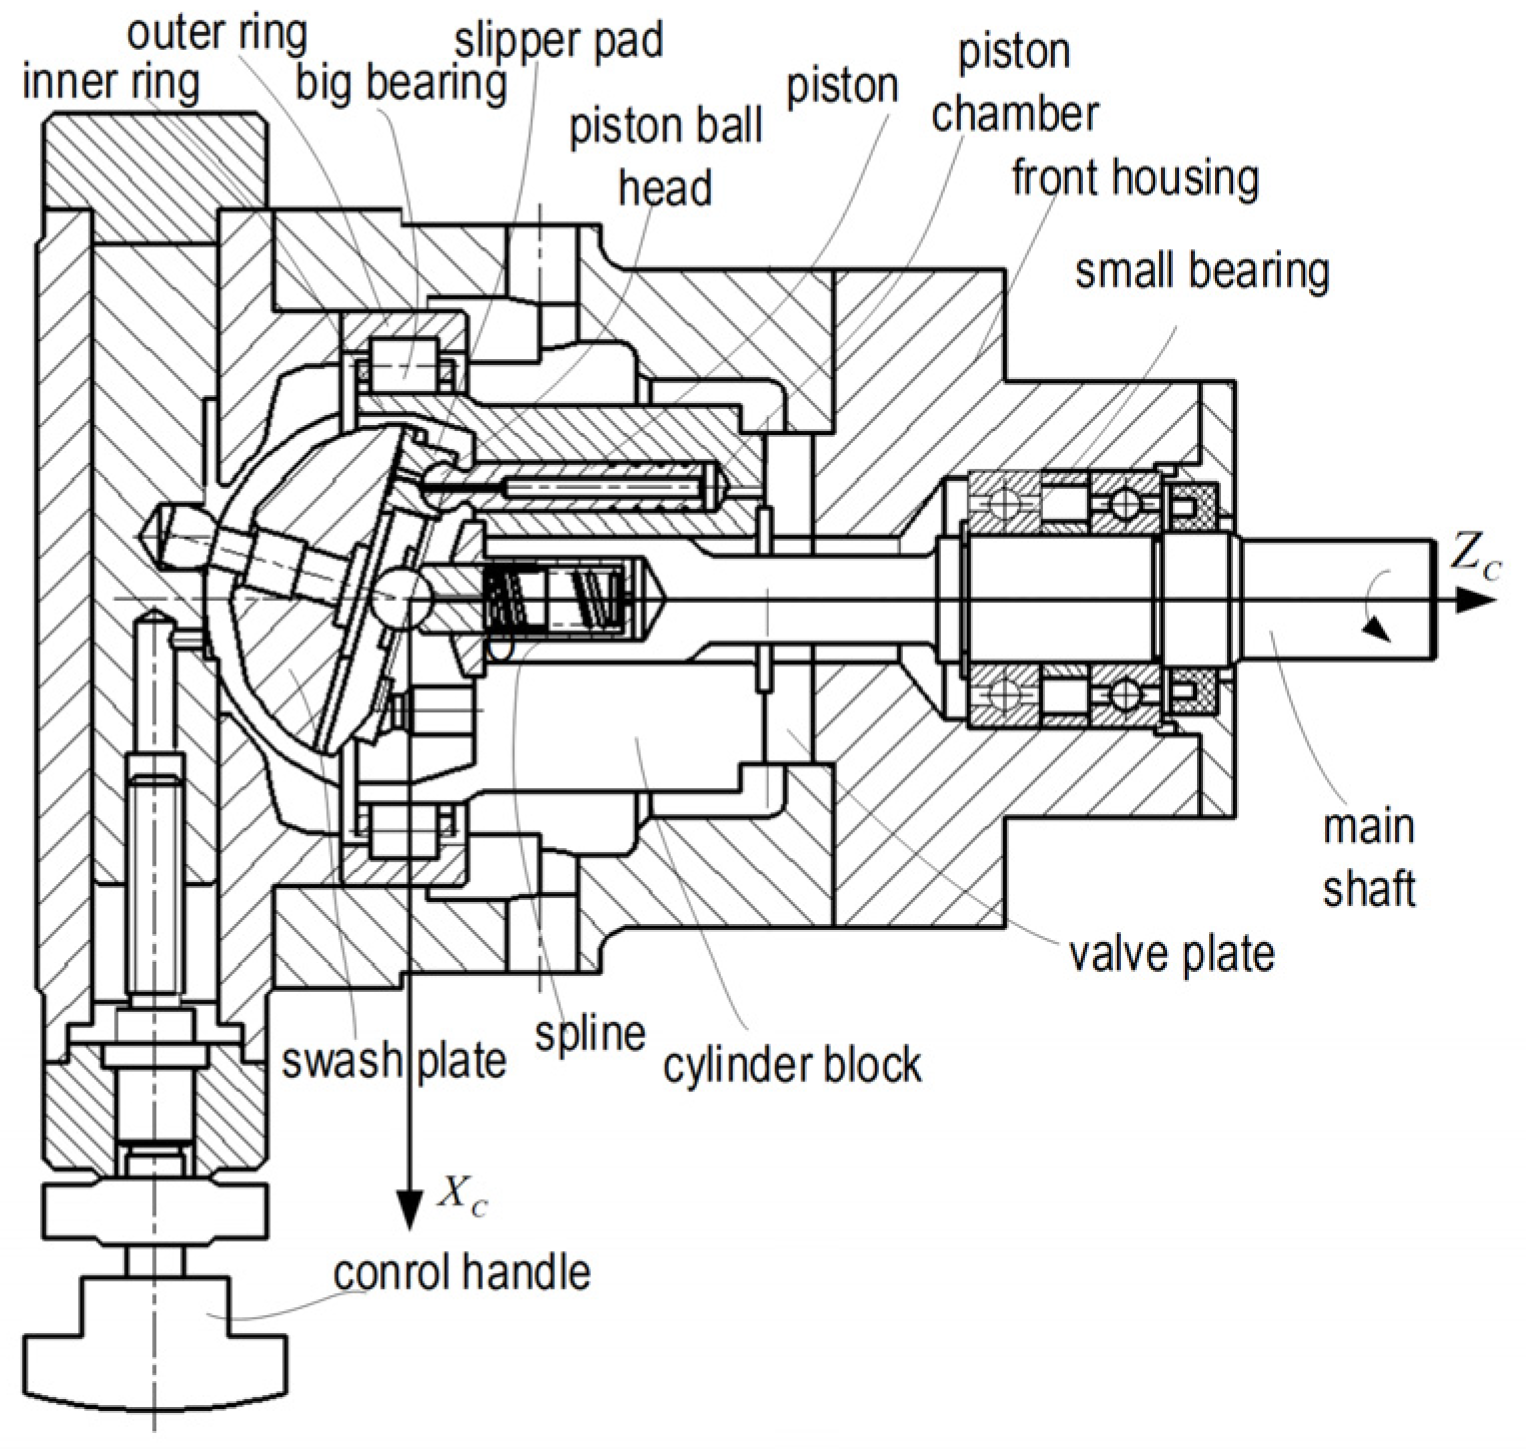
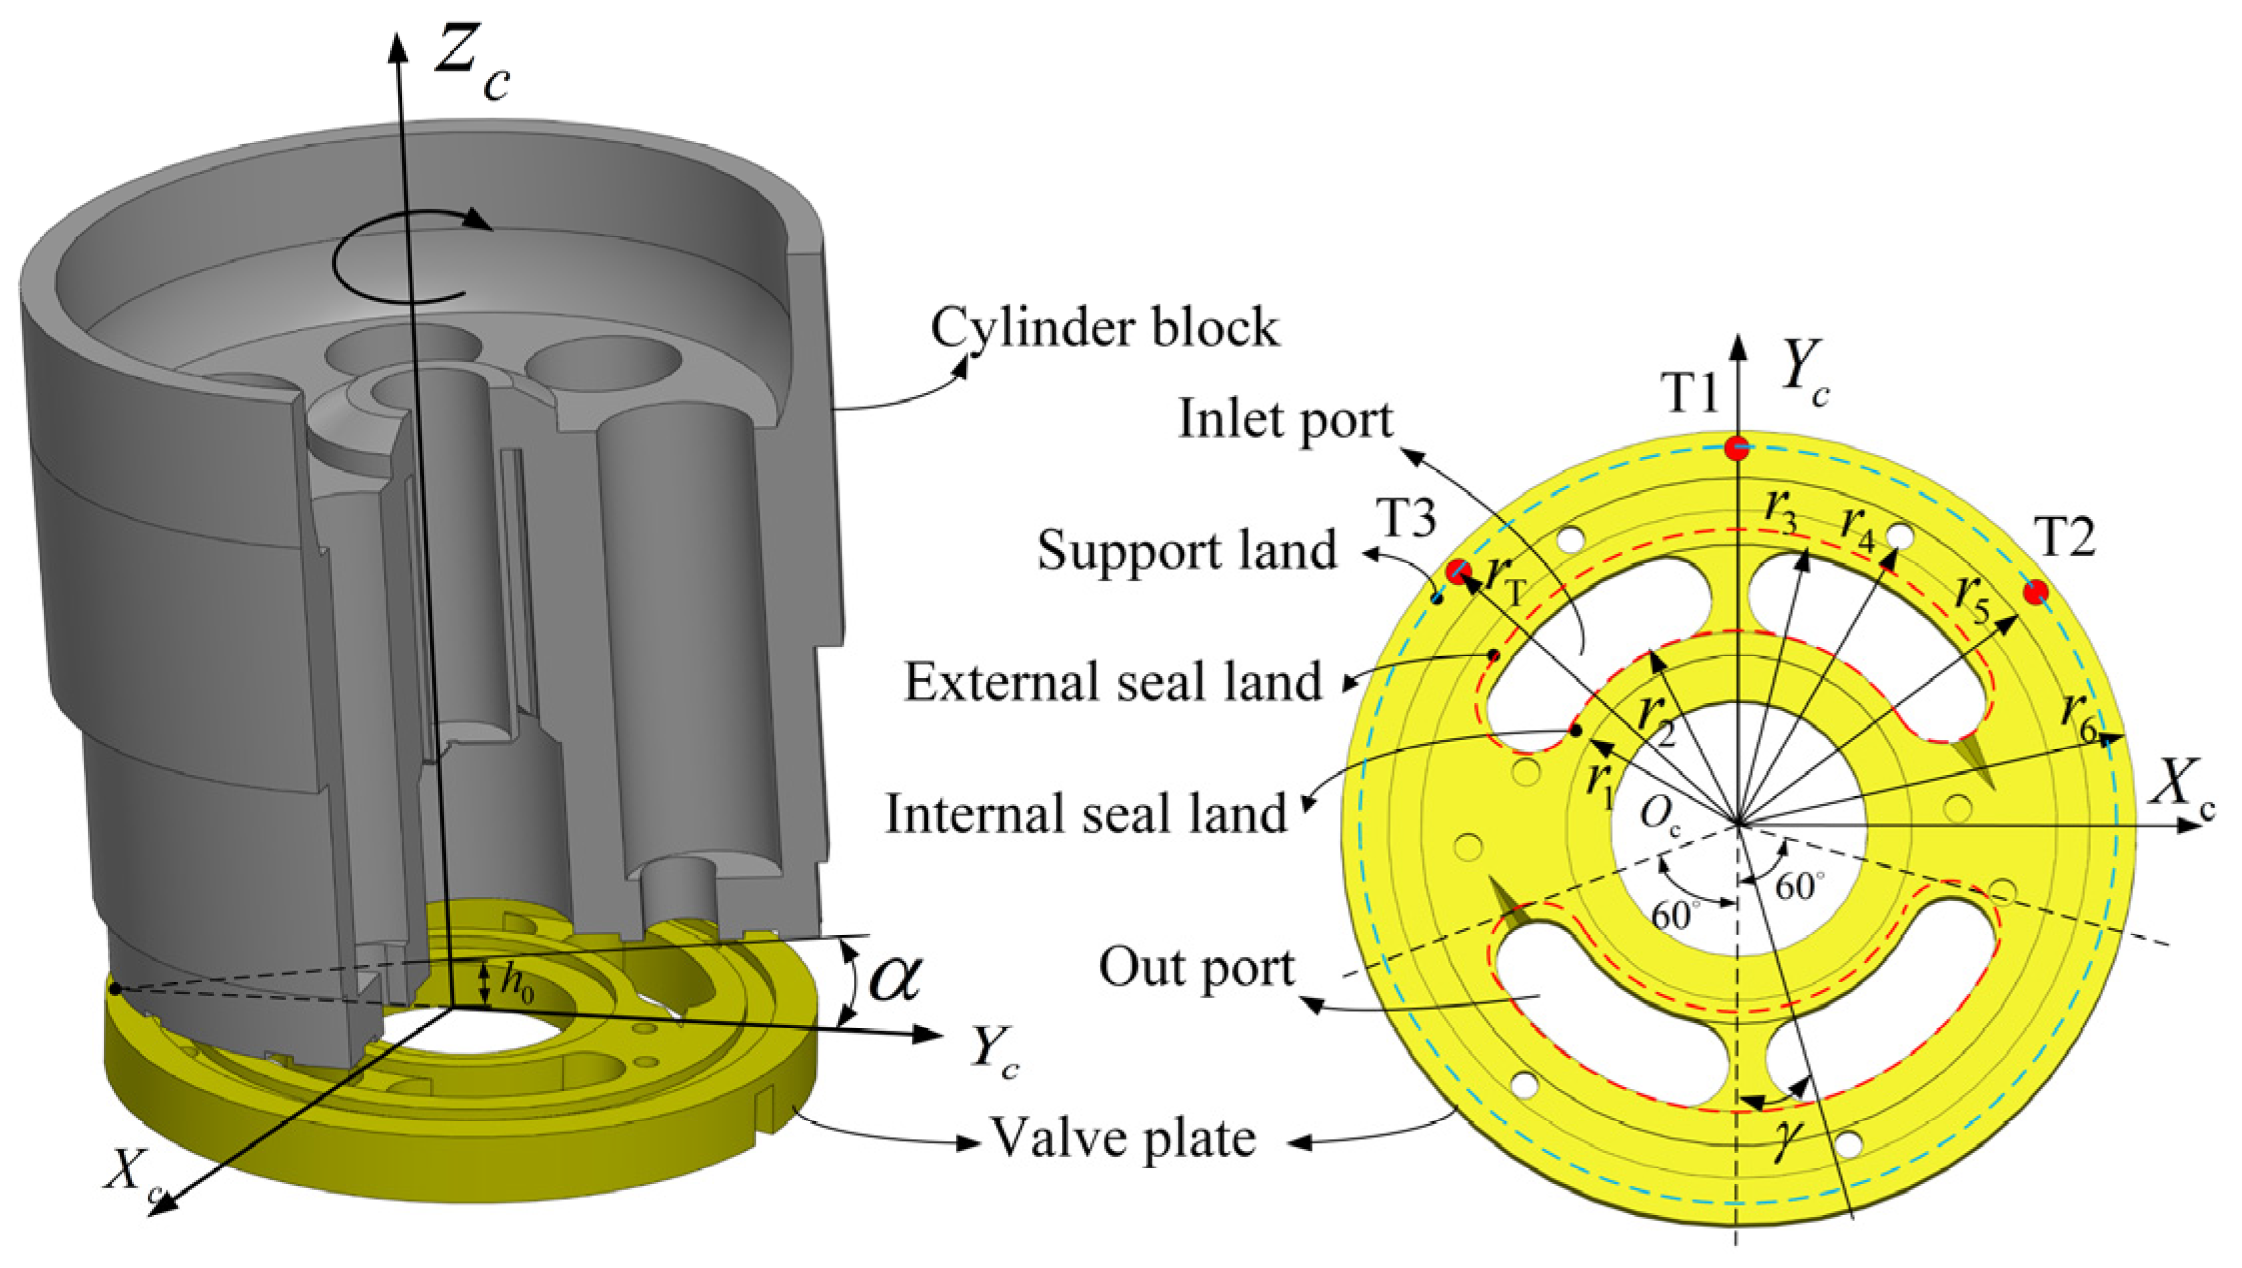
2. Modeling
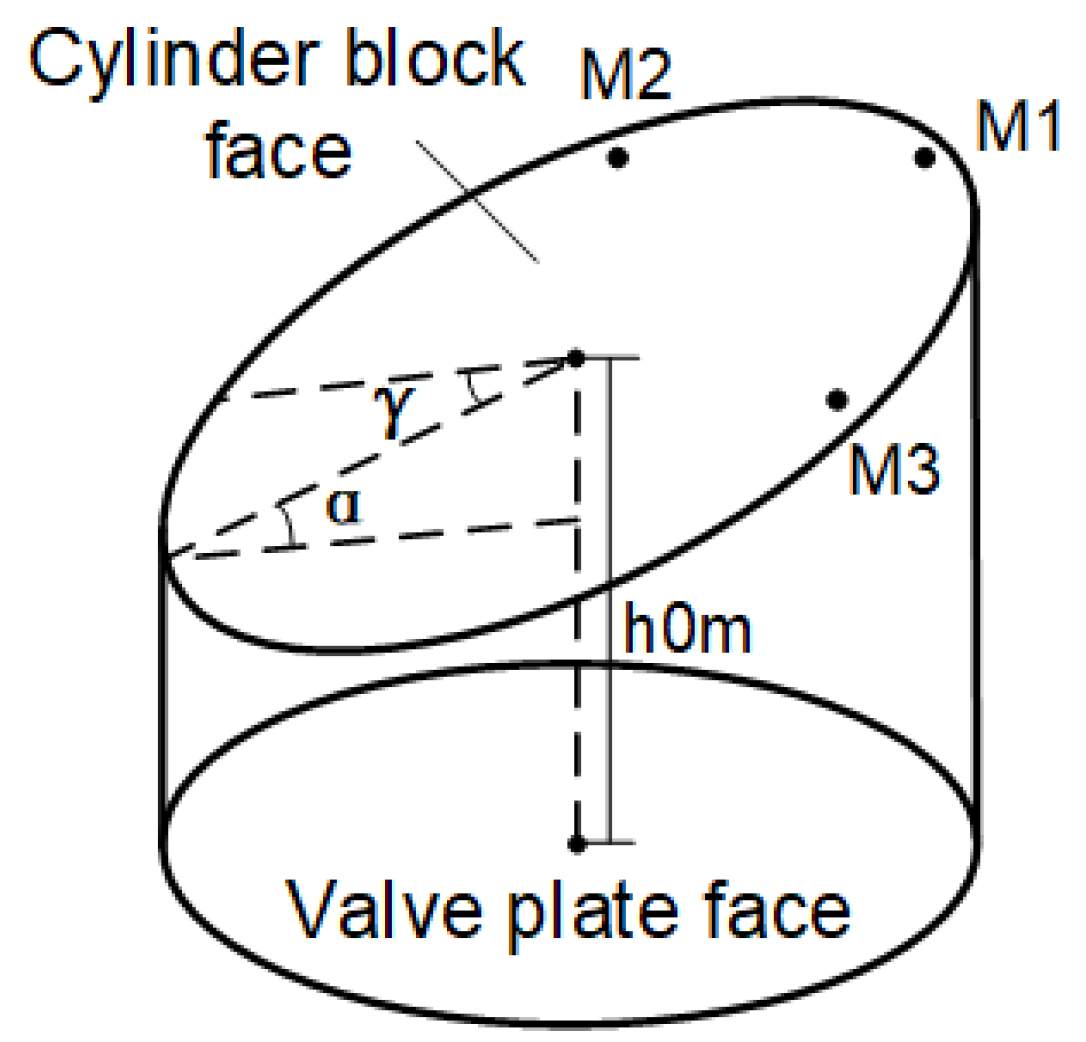
2.1. Modeling of Lubricating Film Shape
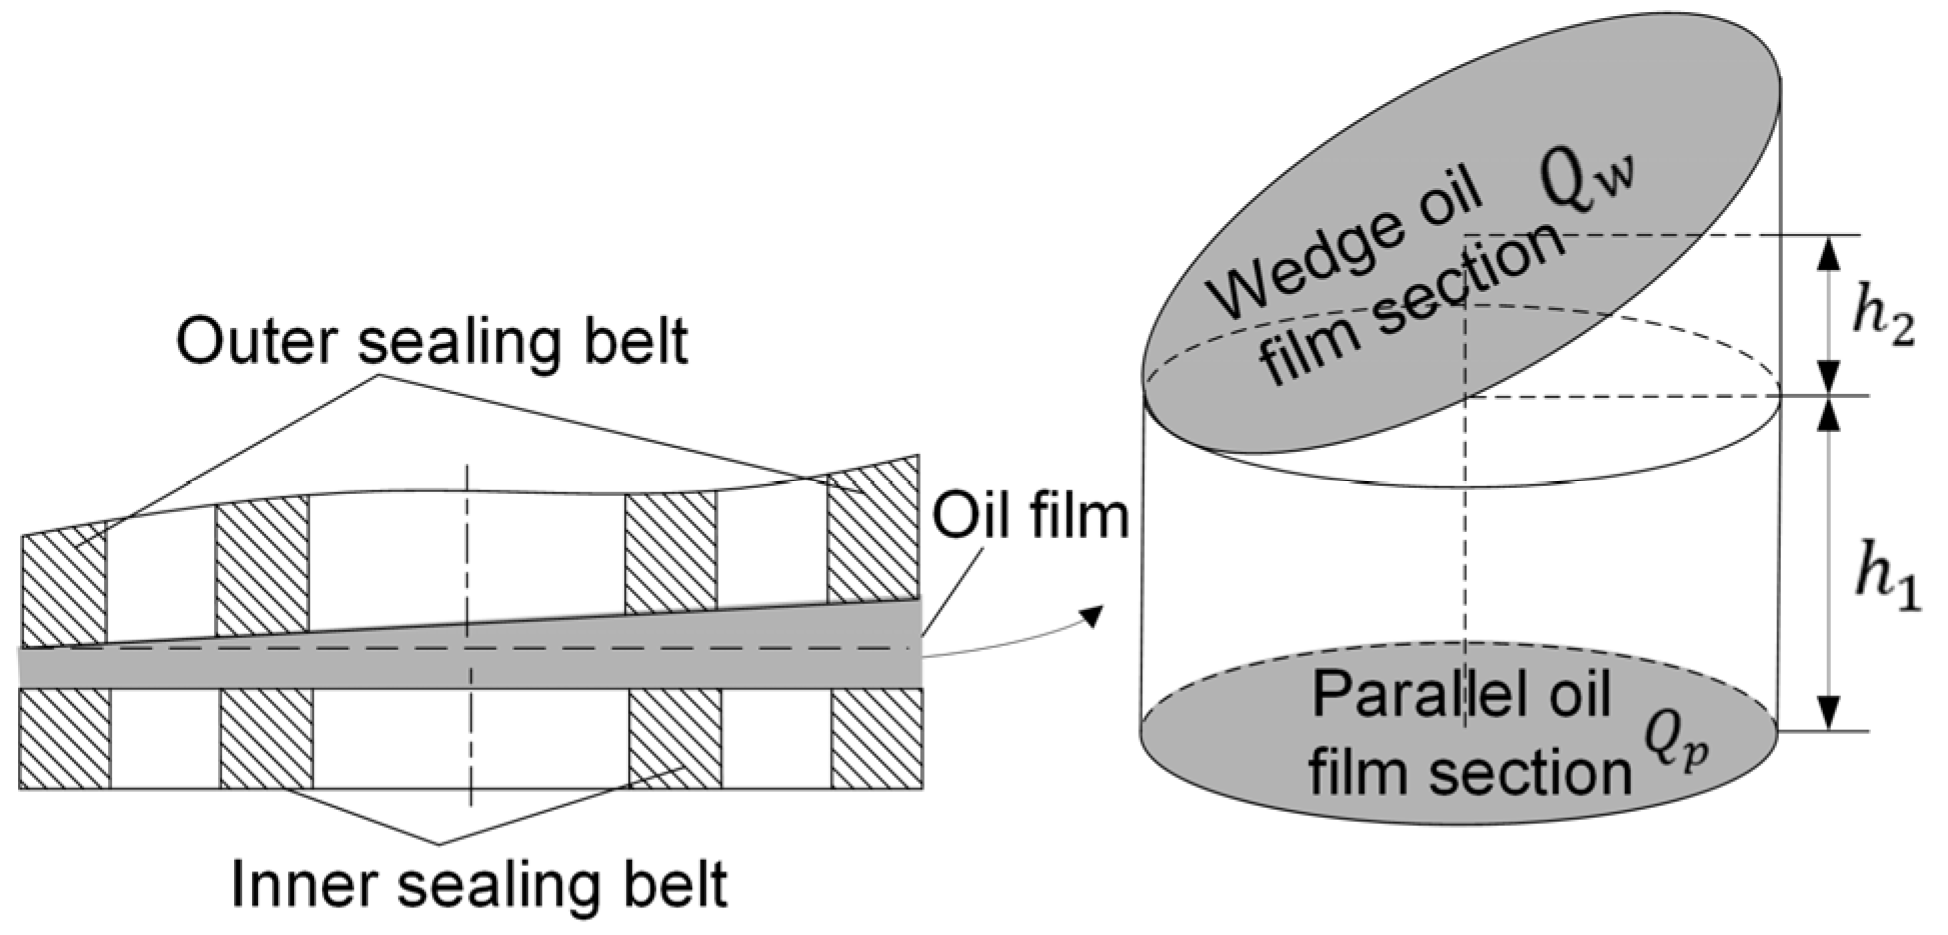
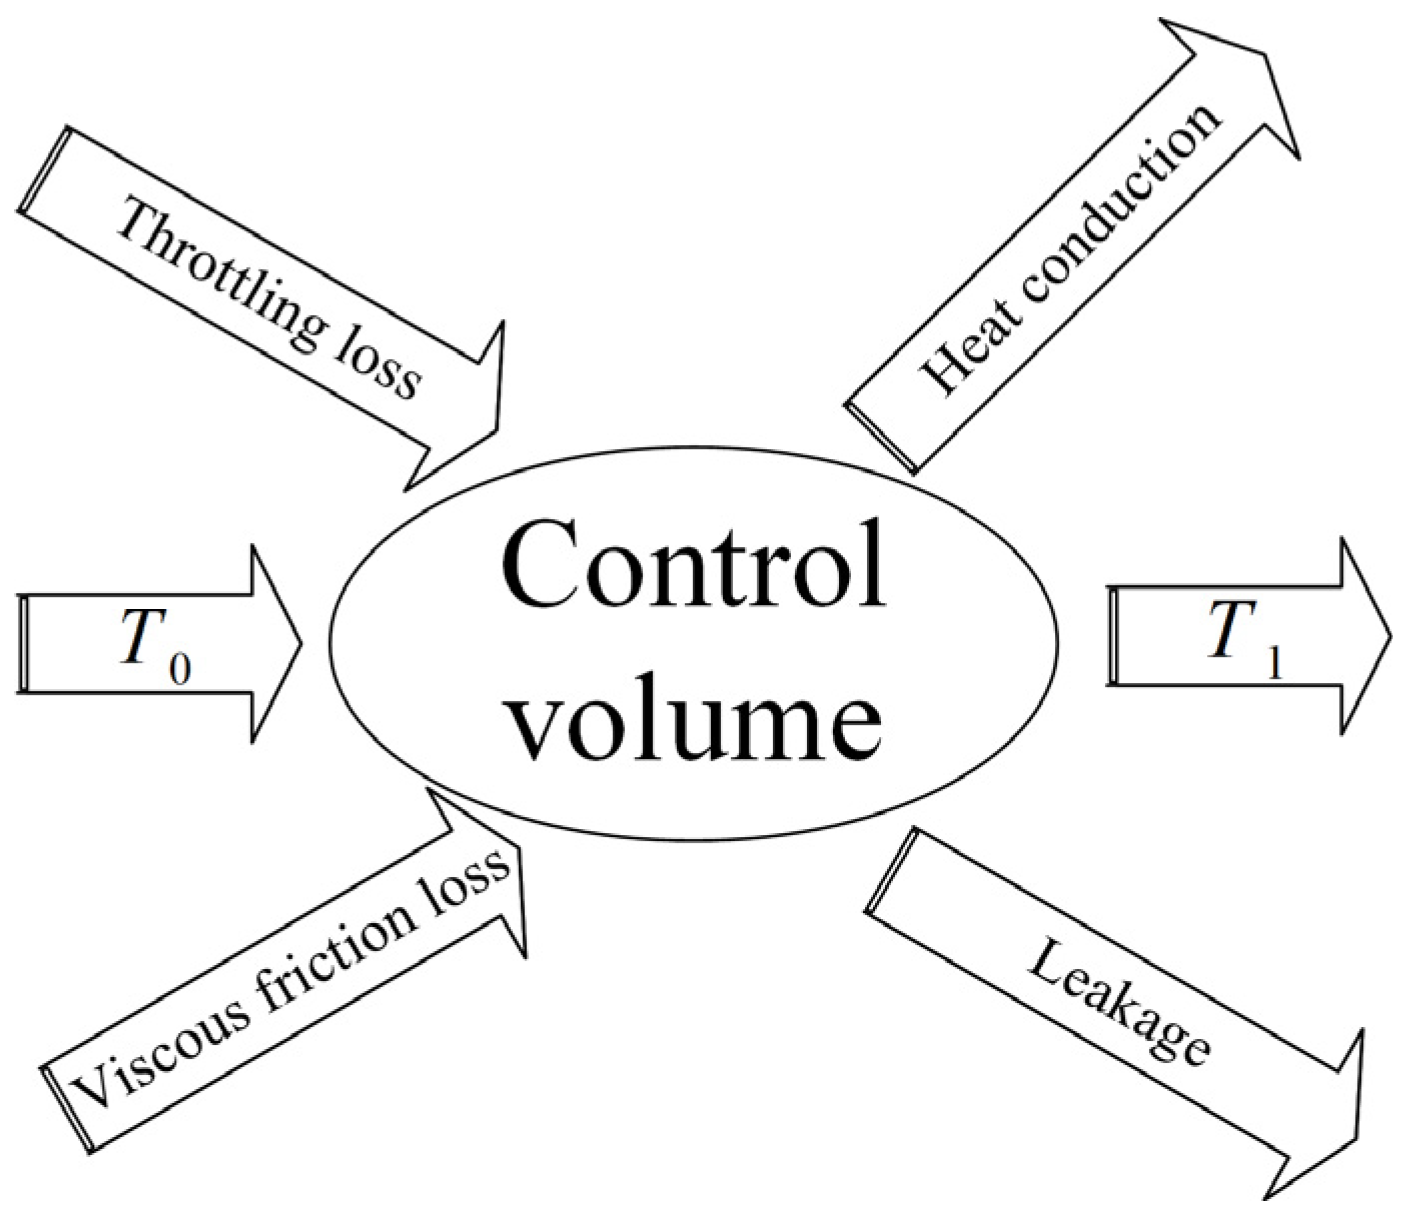
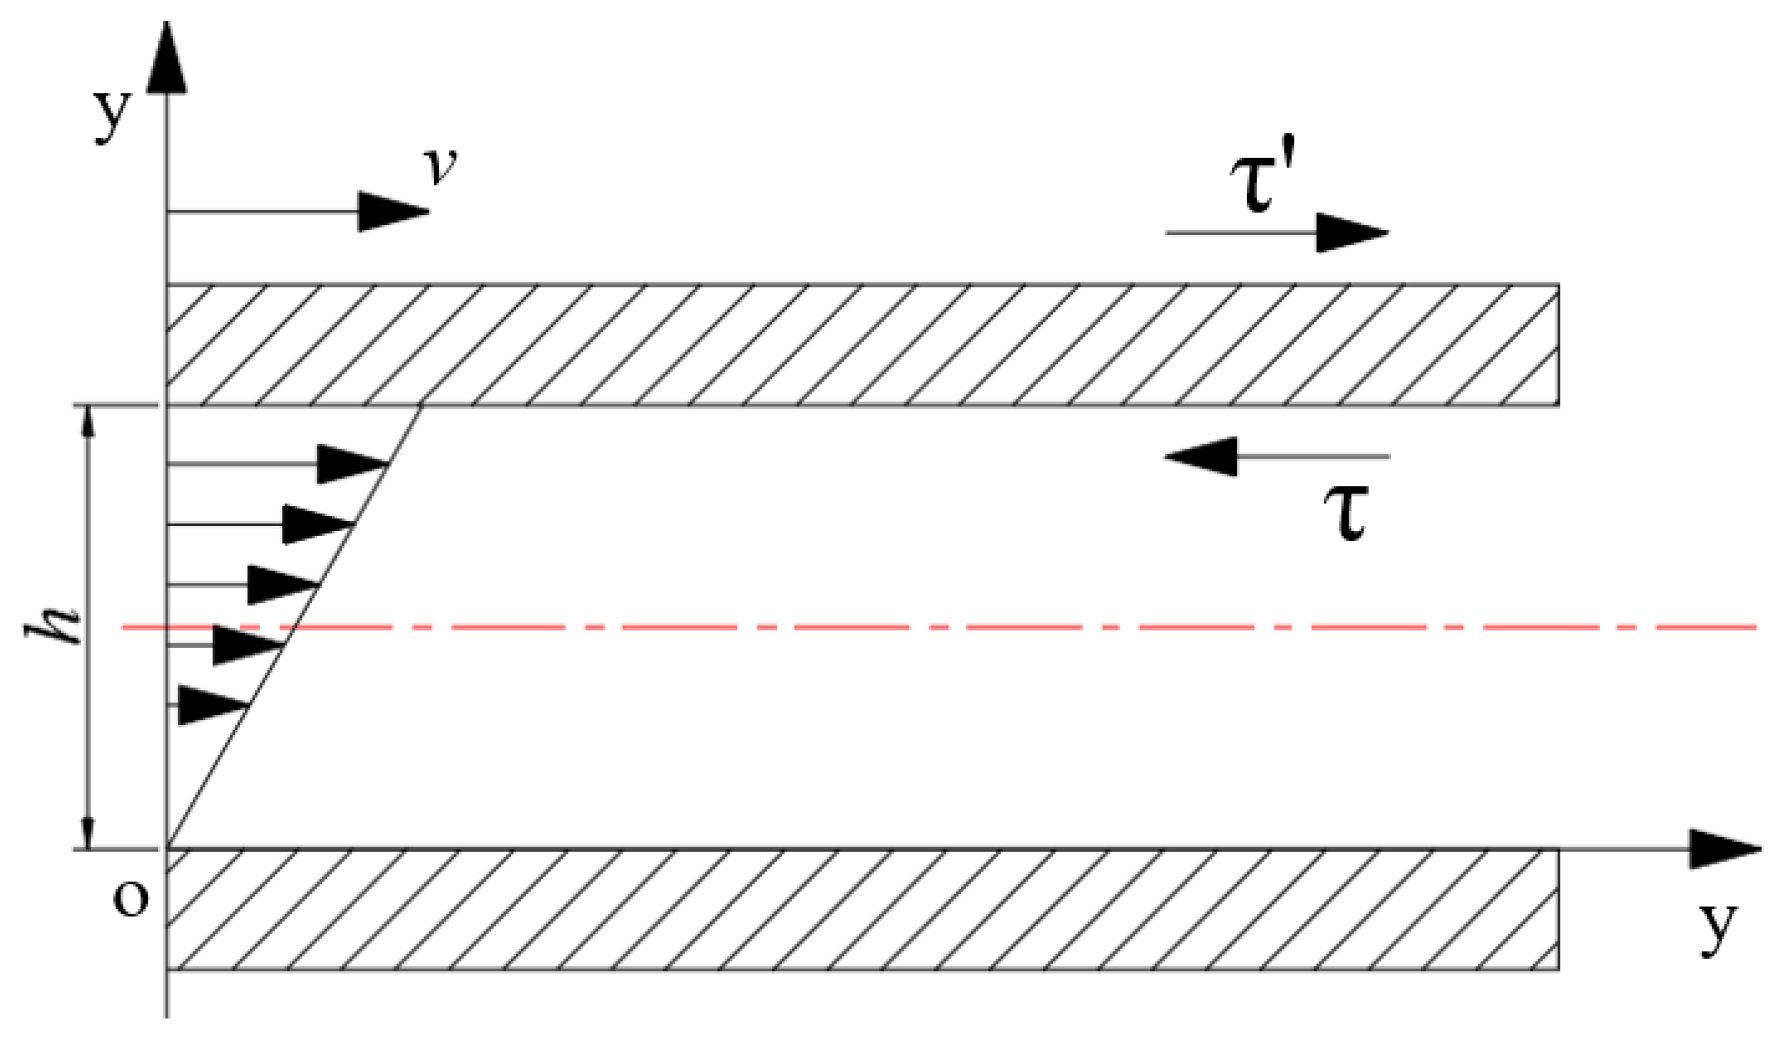
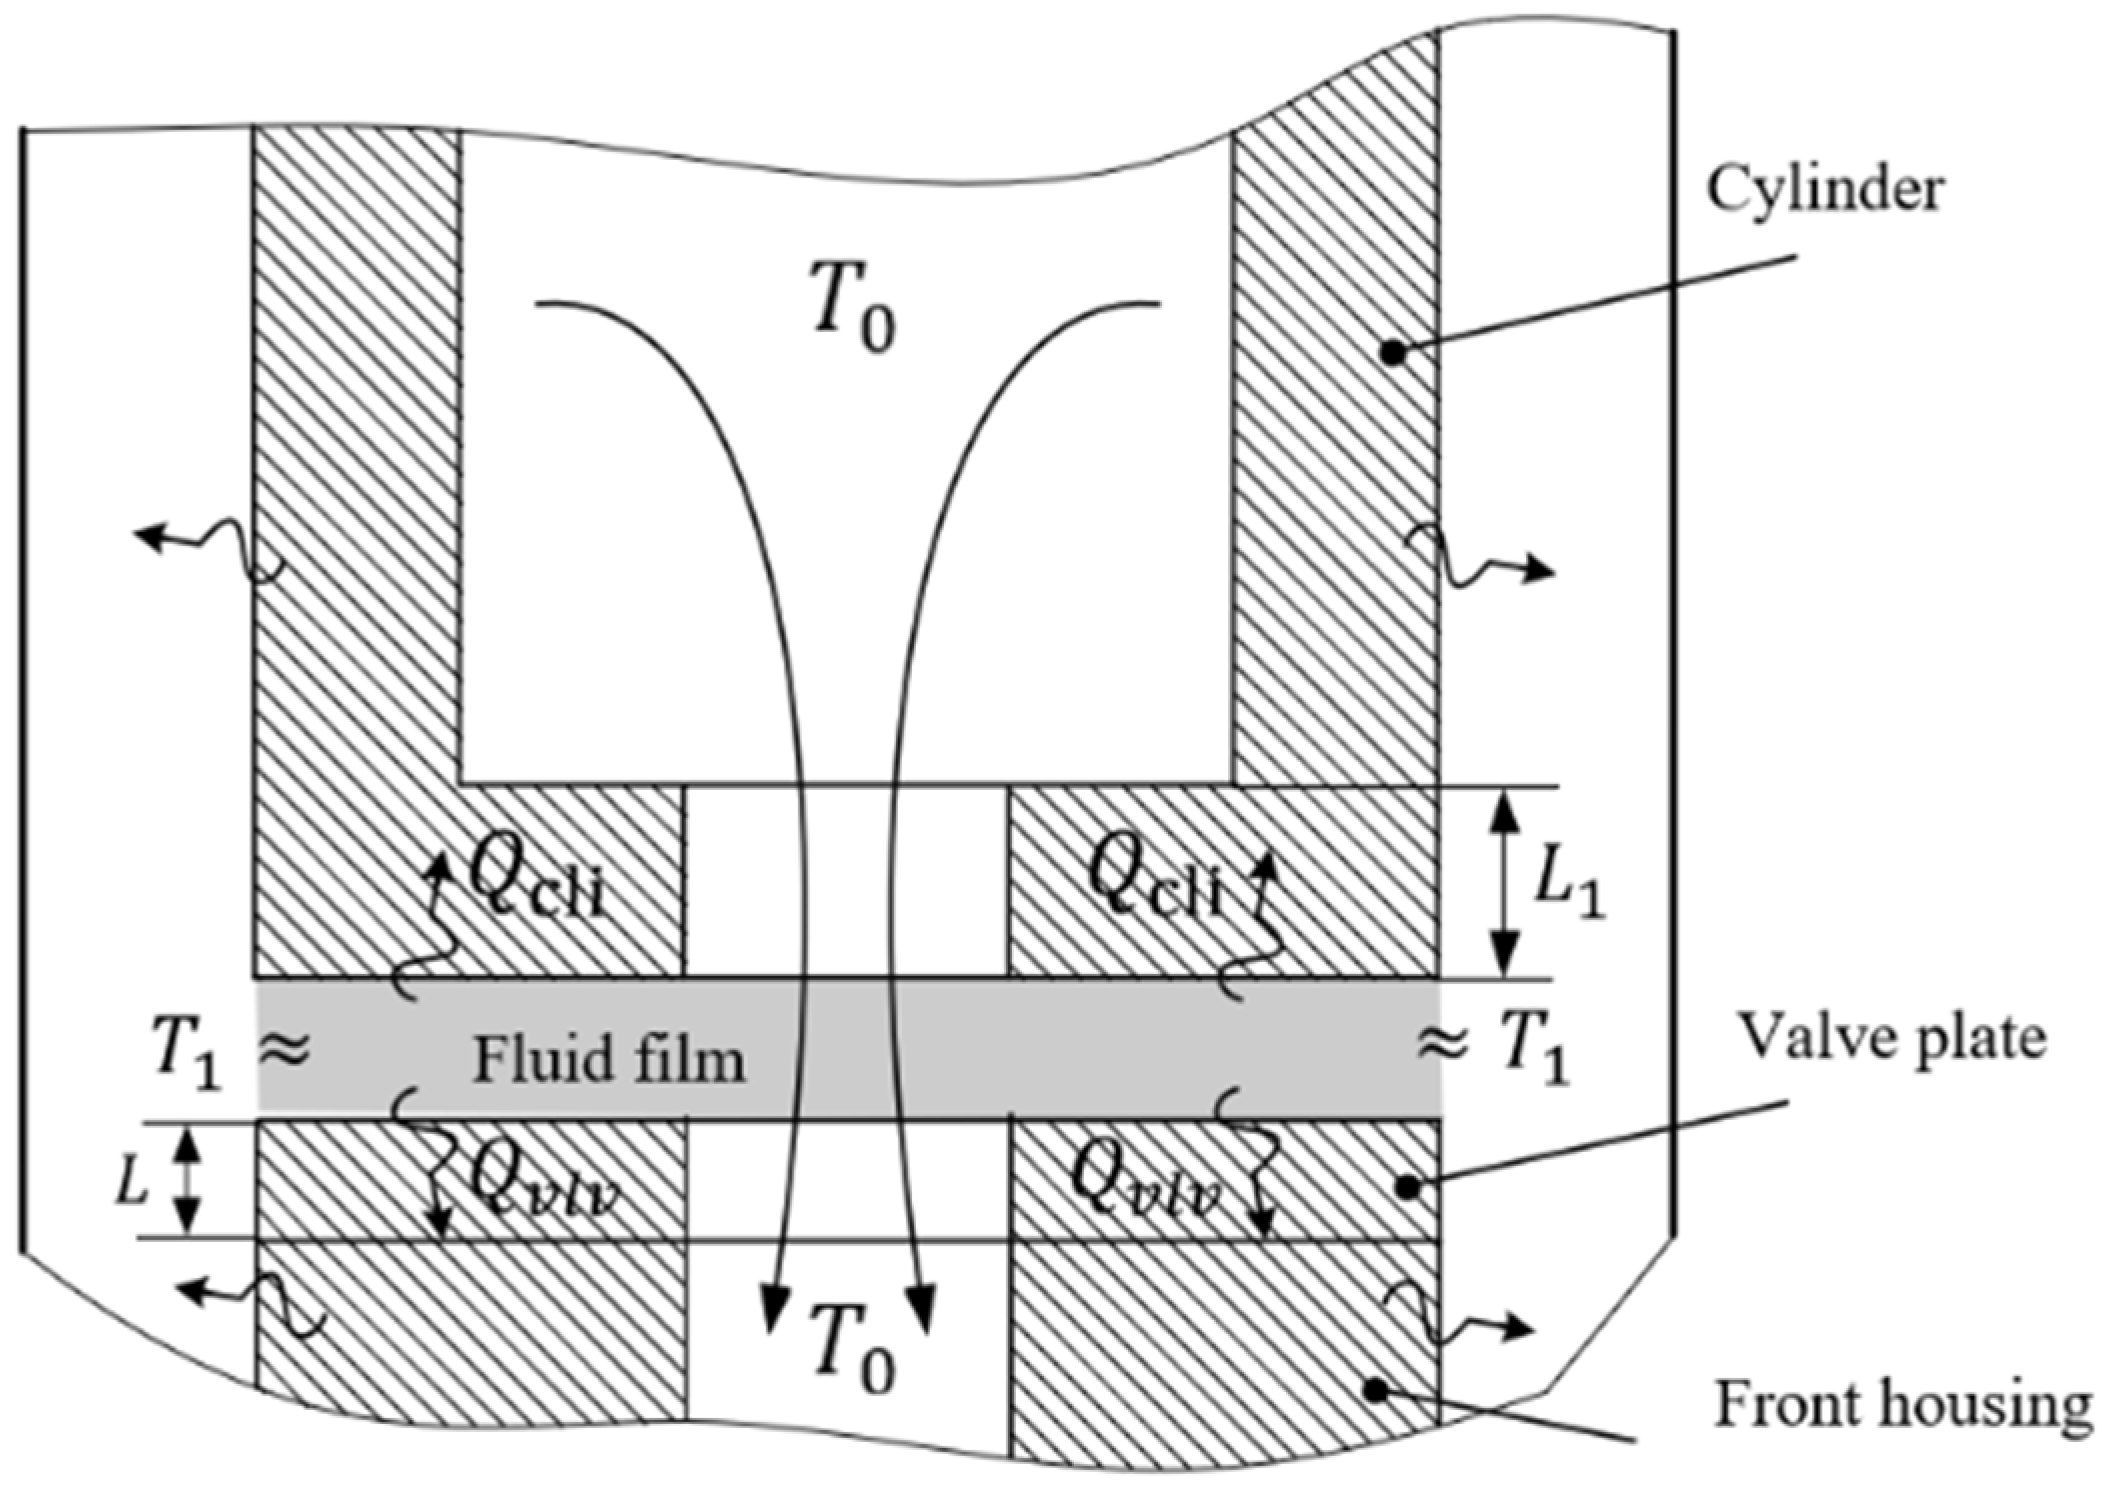
2.2. Modeling of Film Temperature
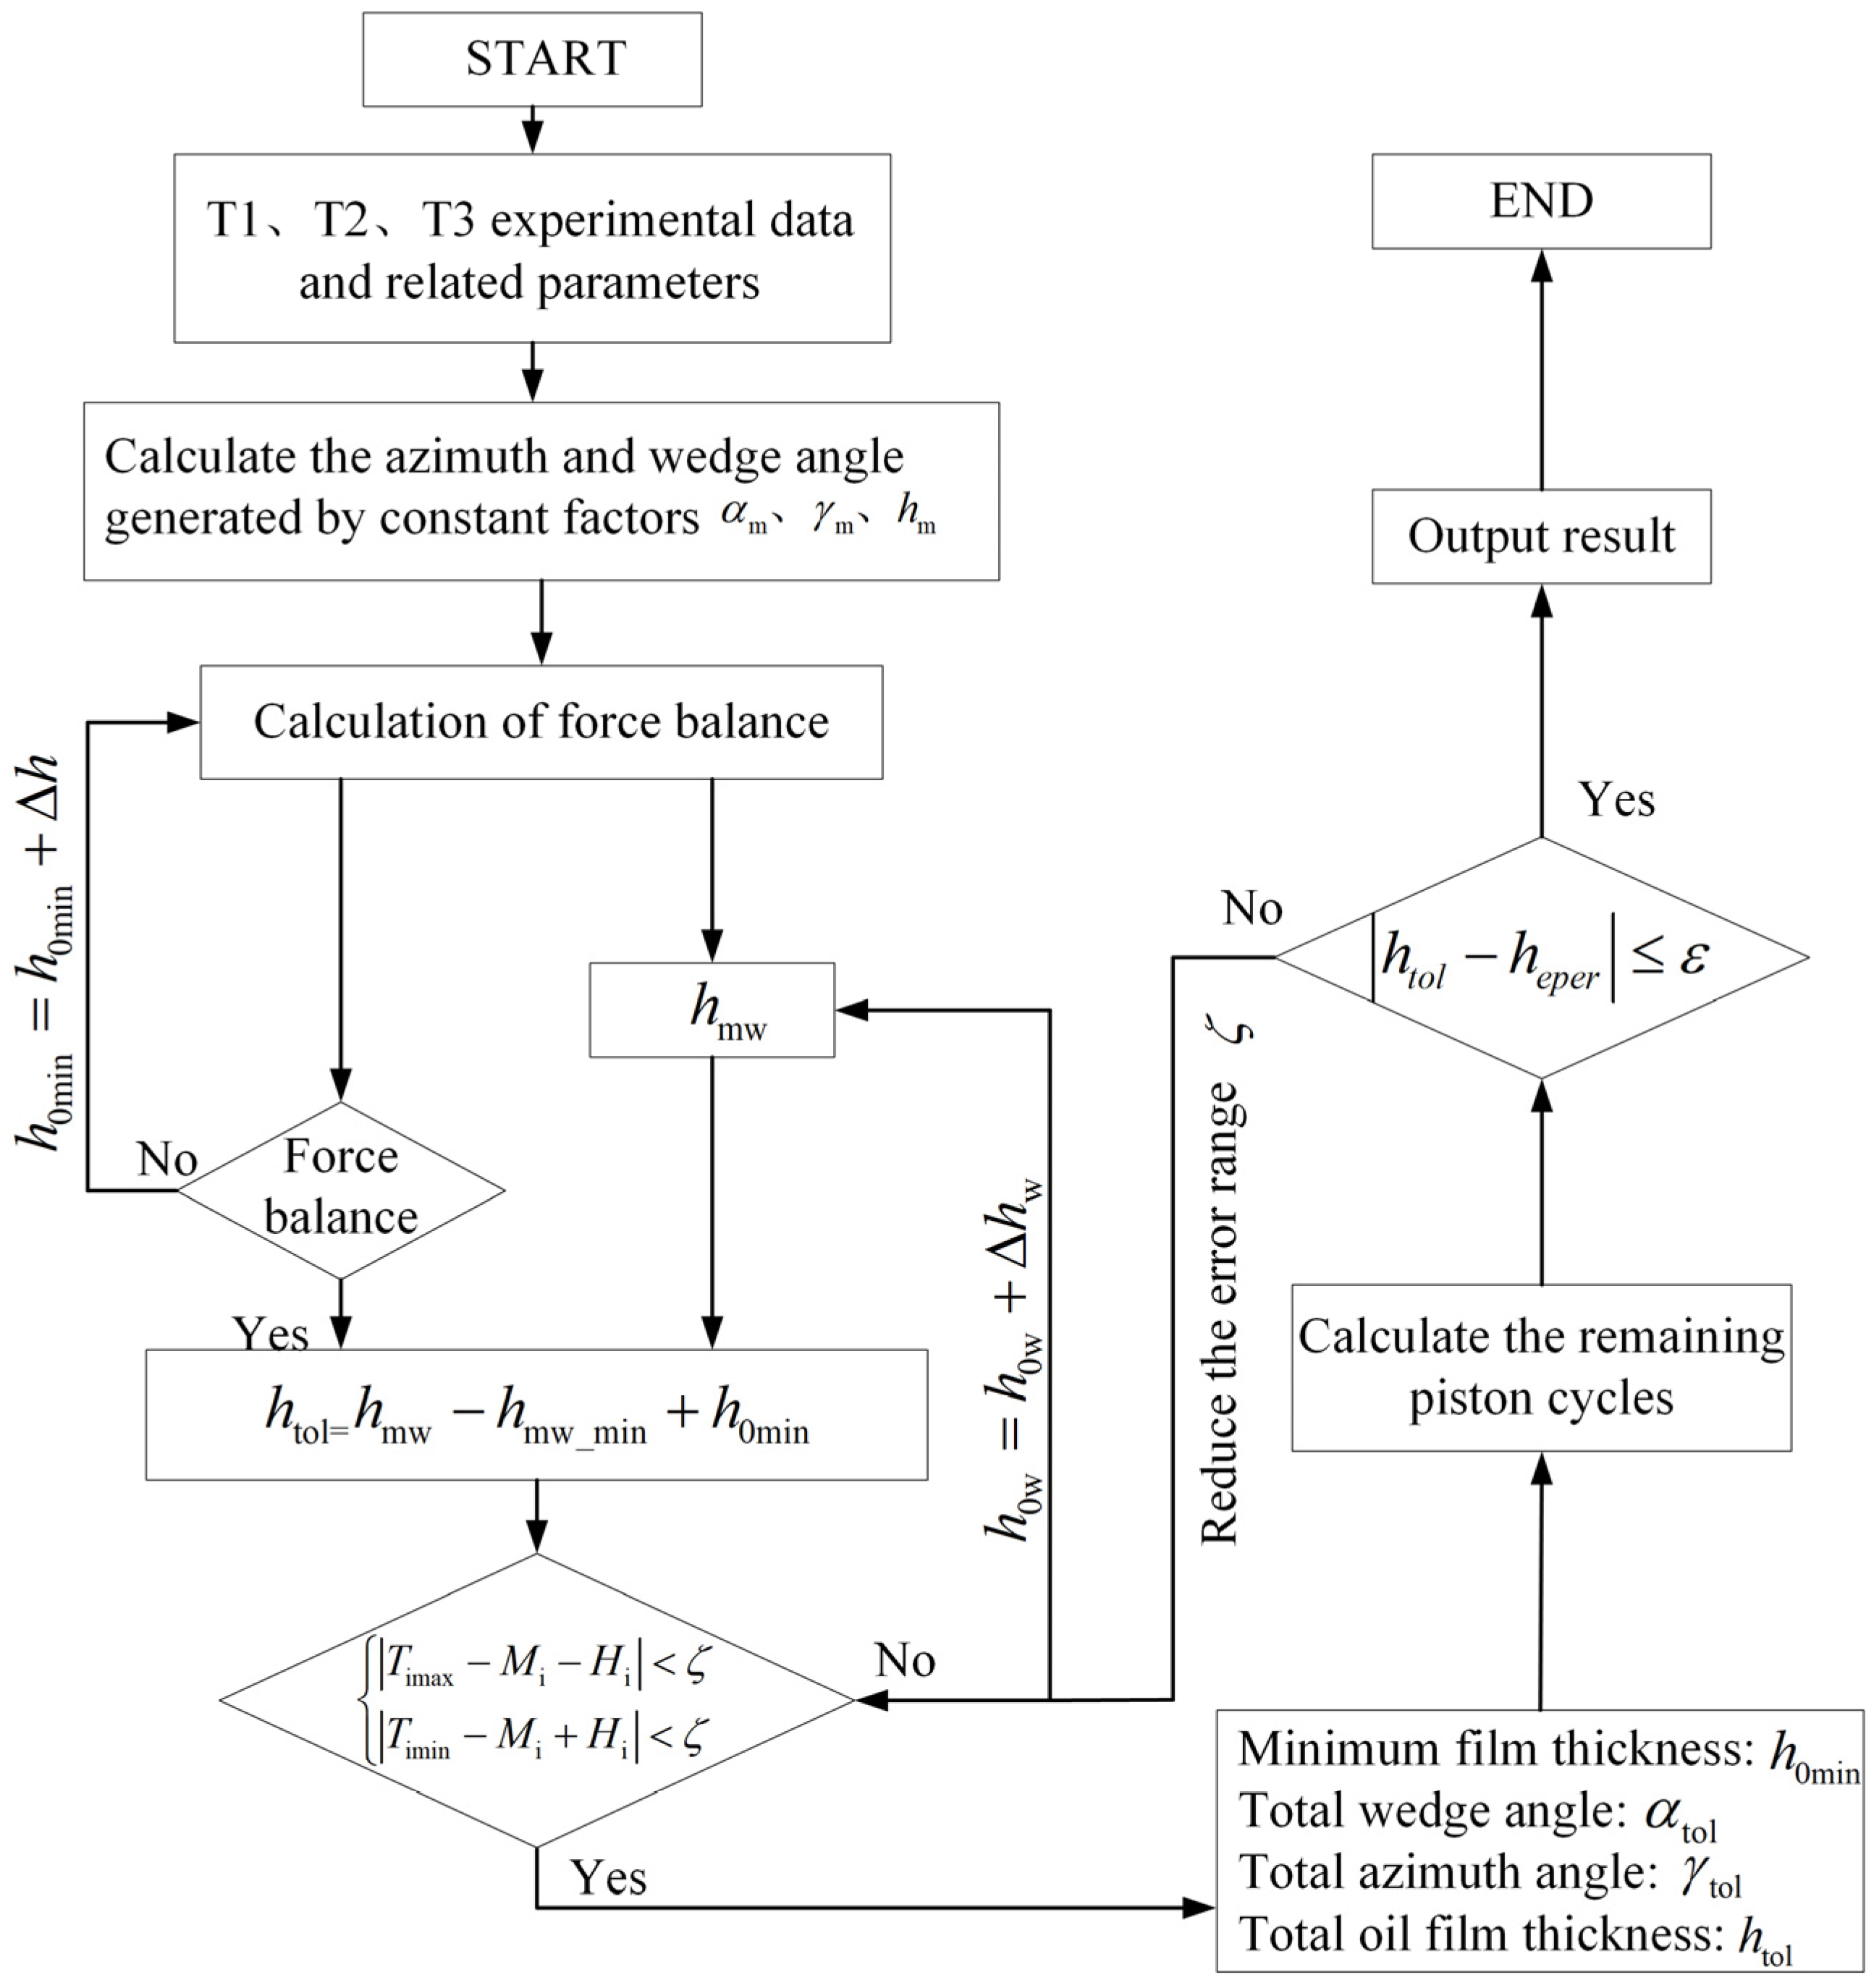
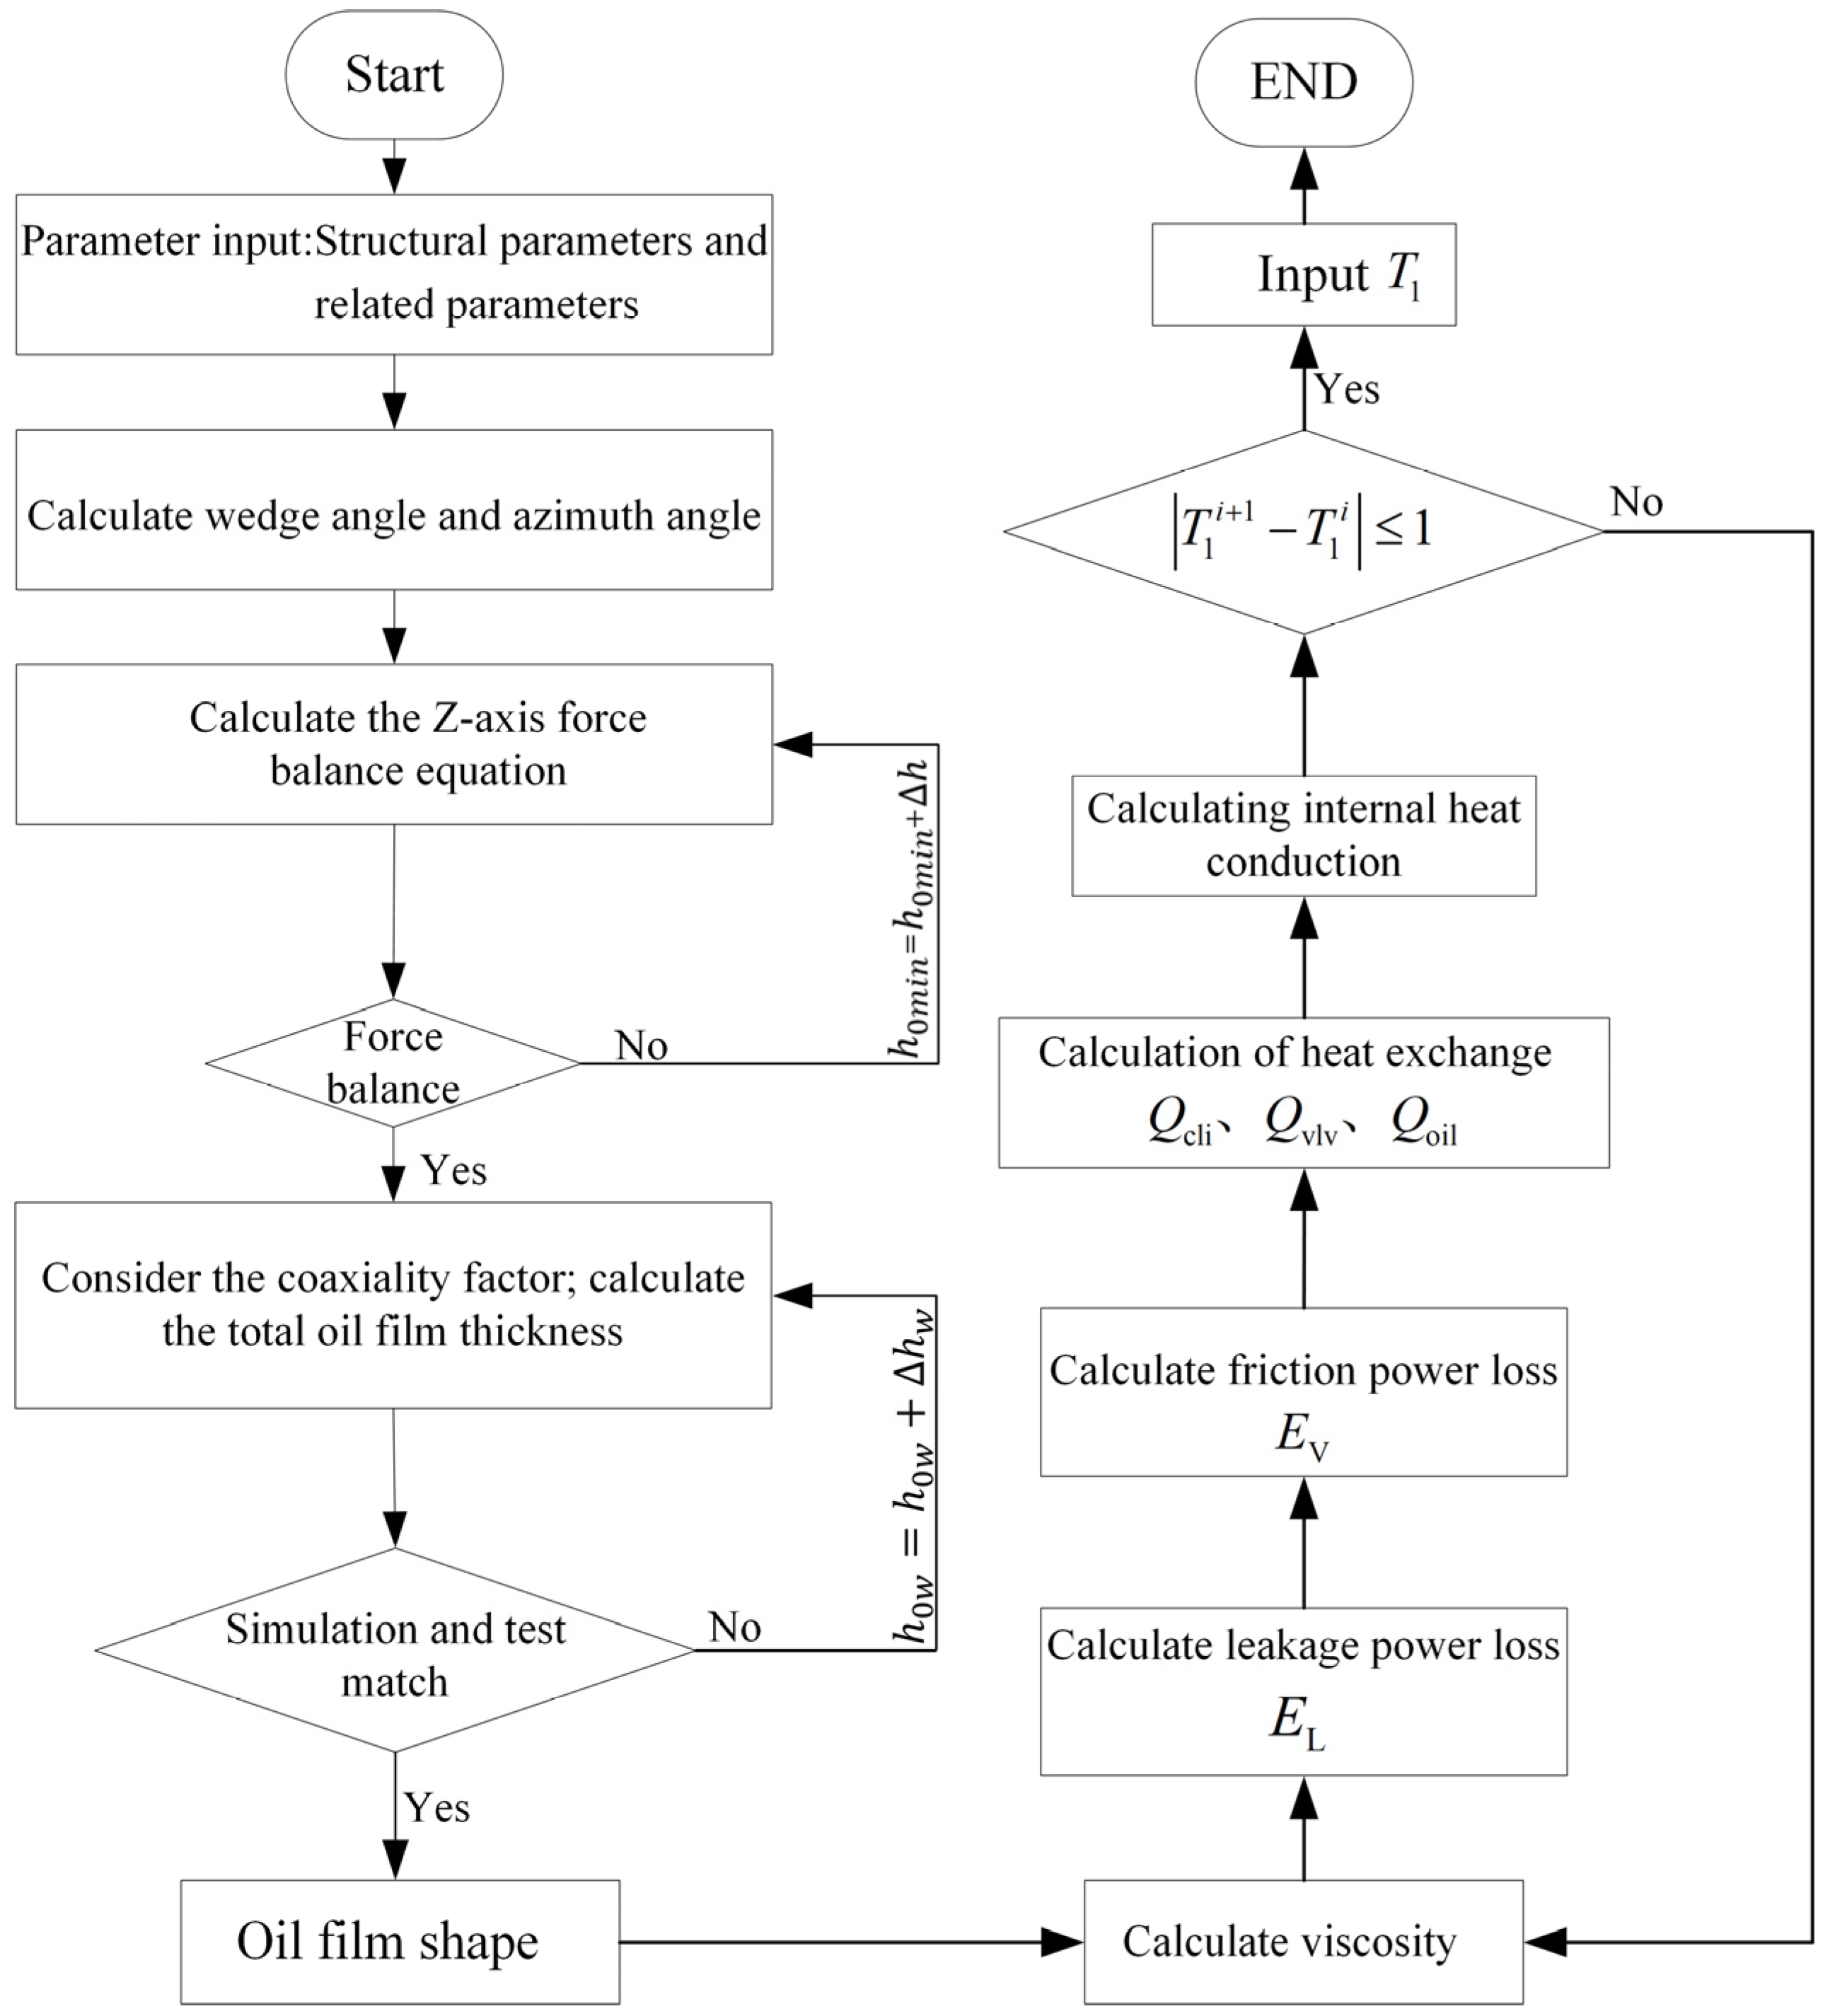
2.3. Numerical Calculation
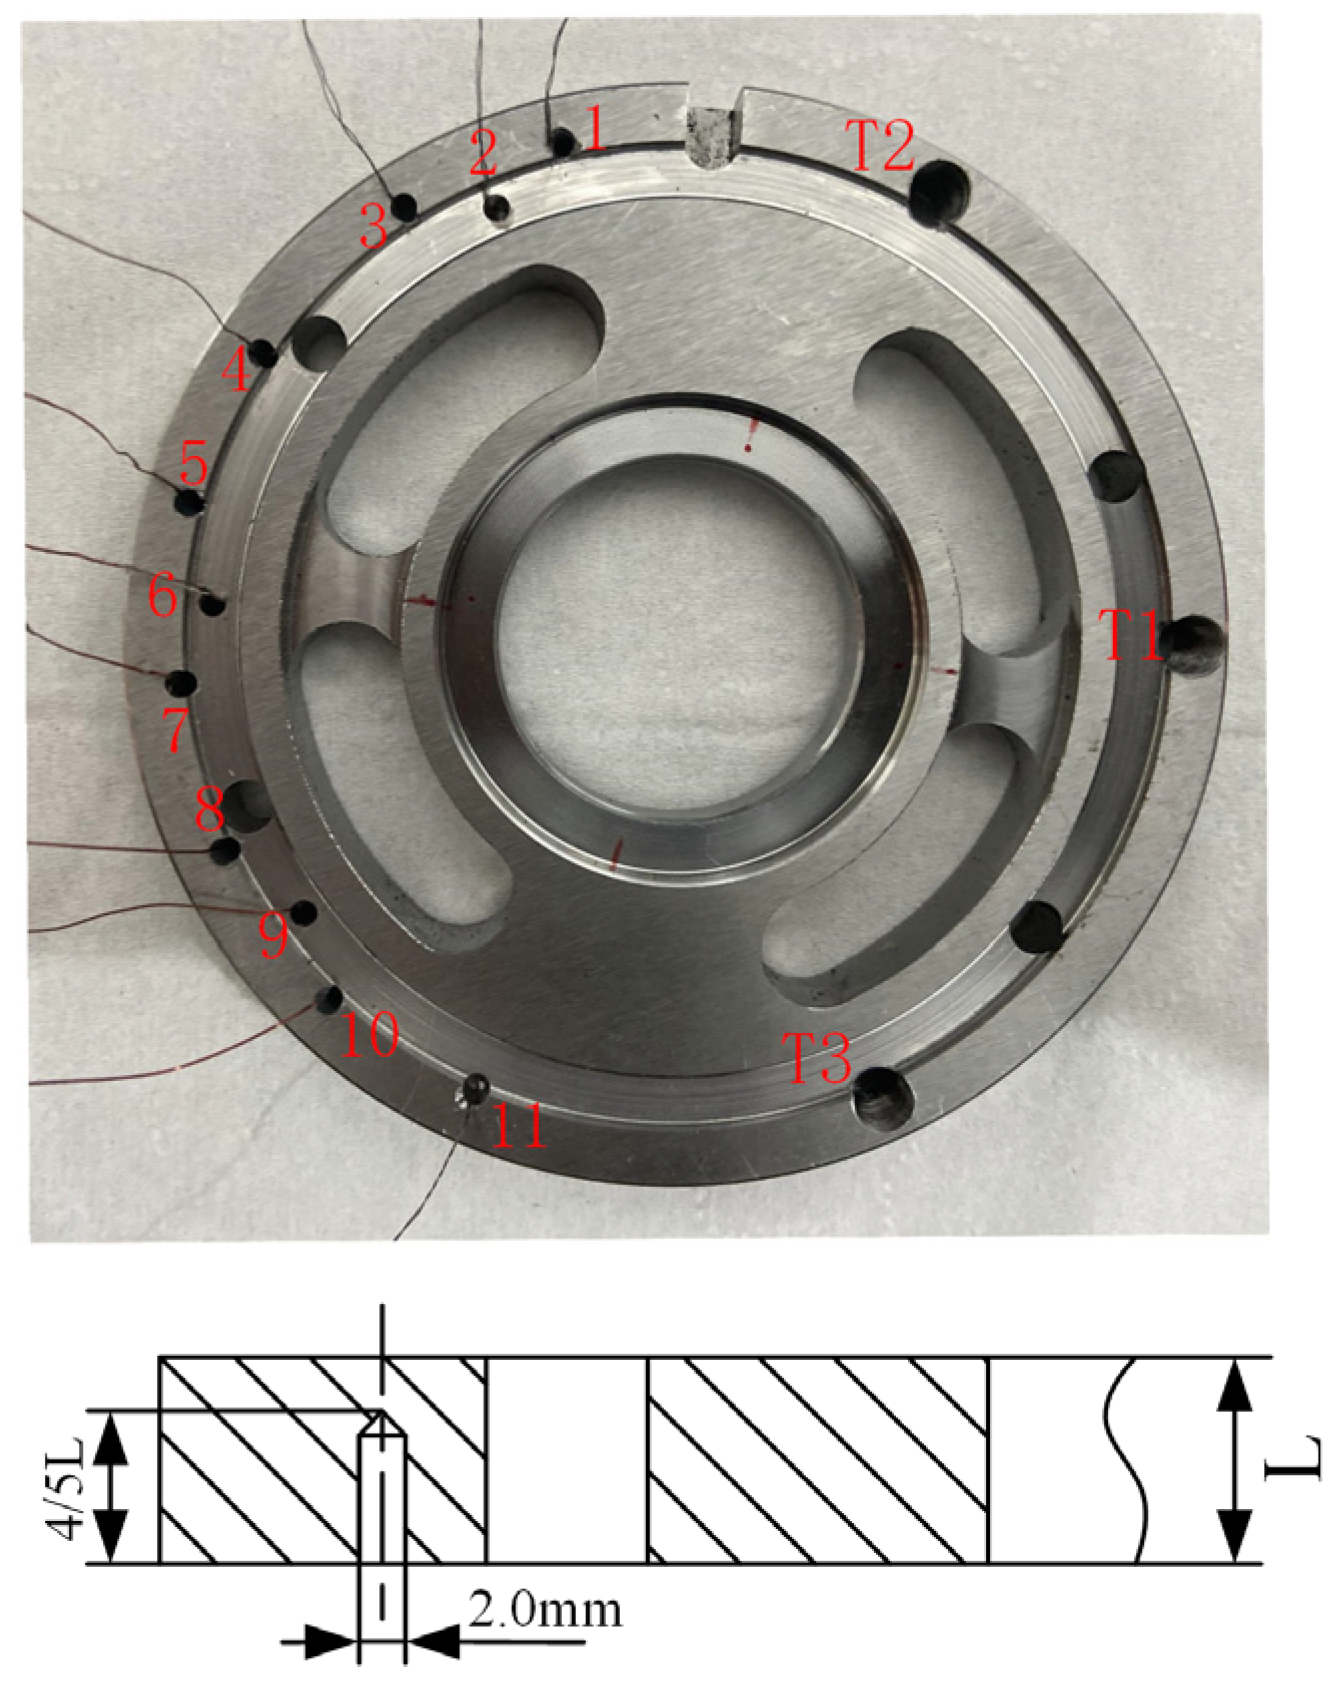
3. Experiment
4. Results and Discussion
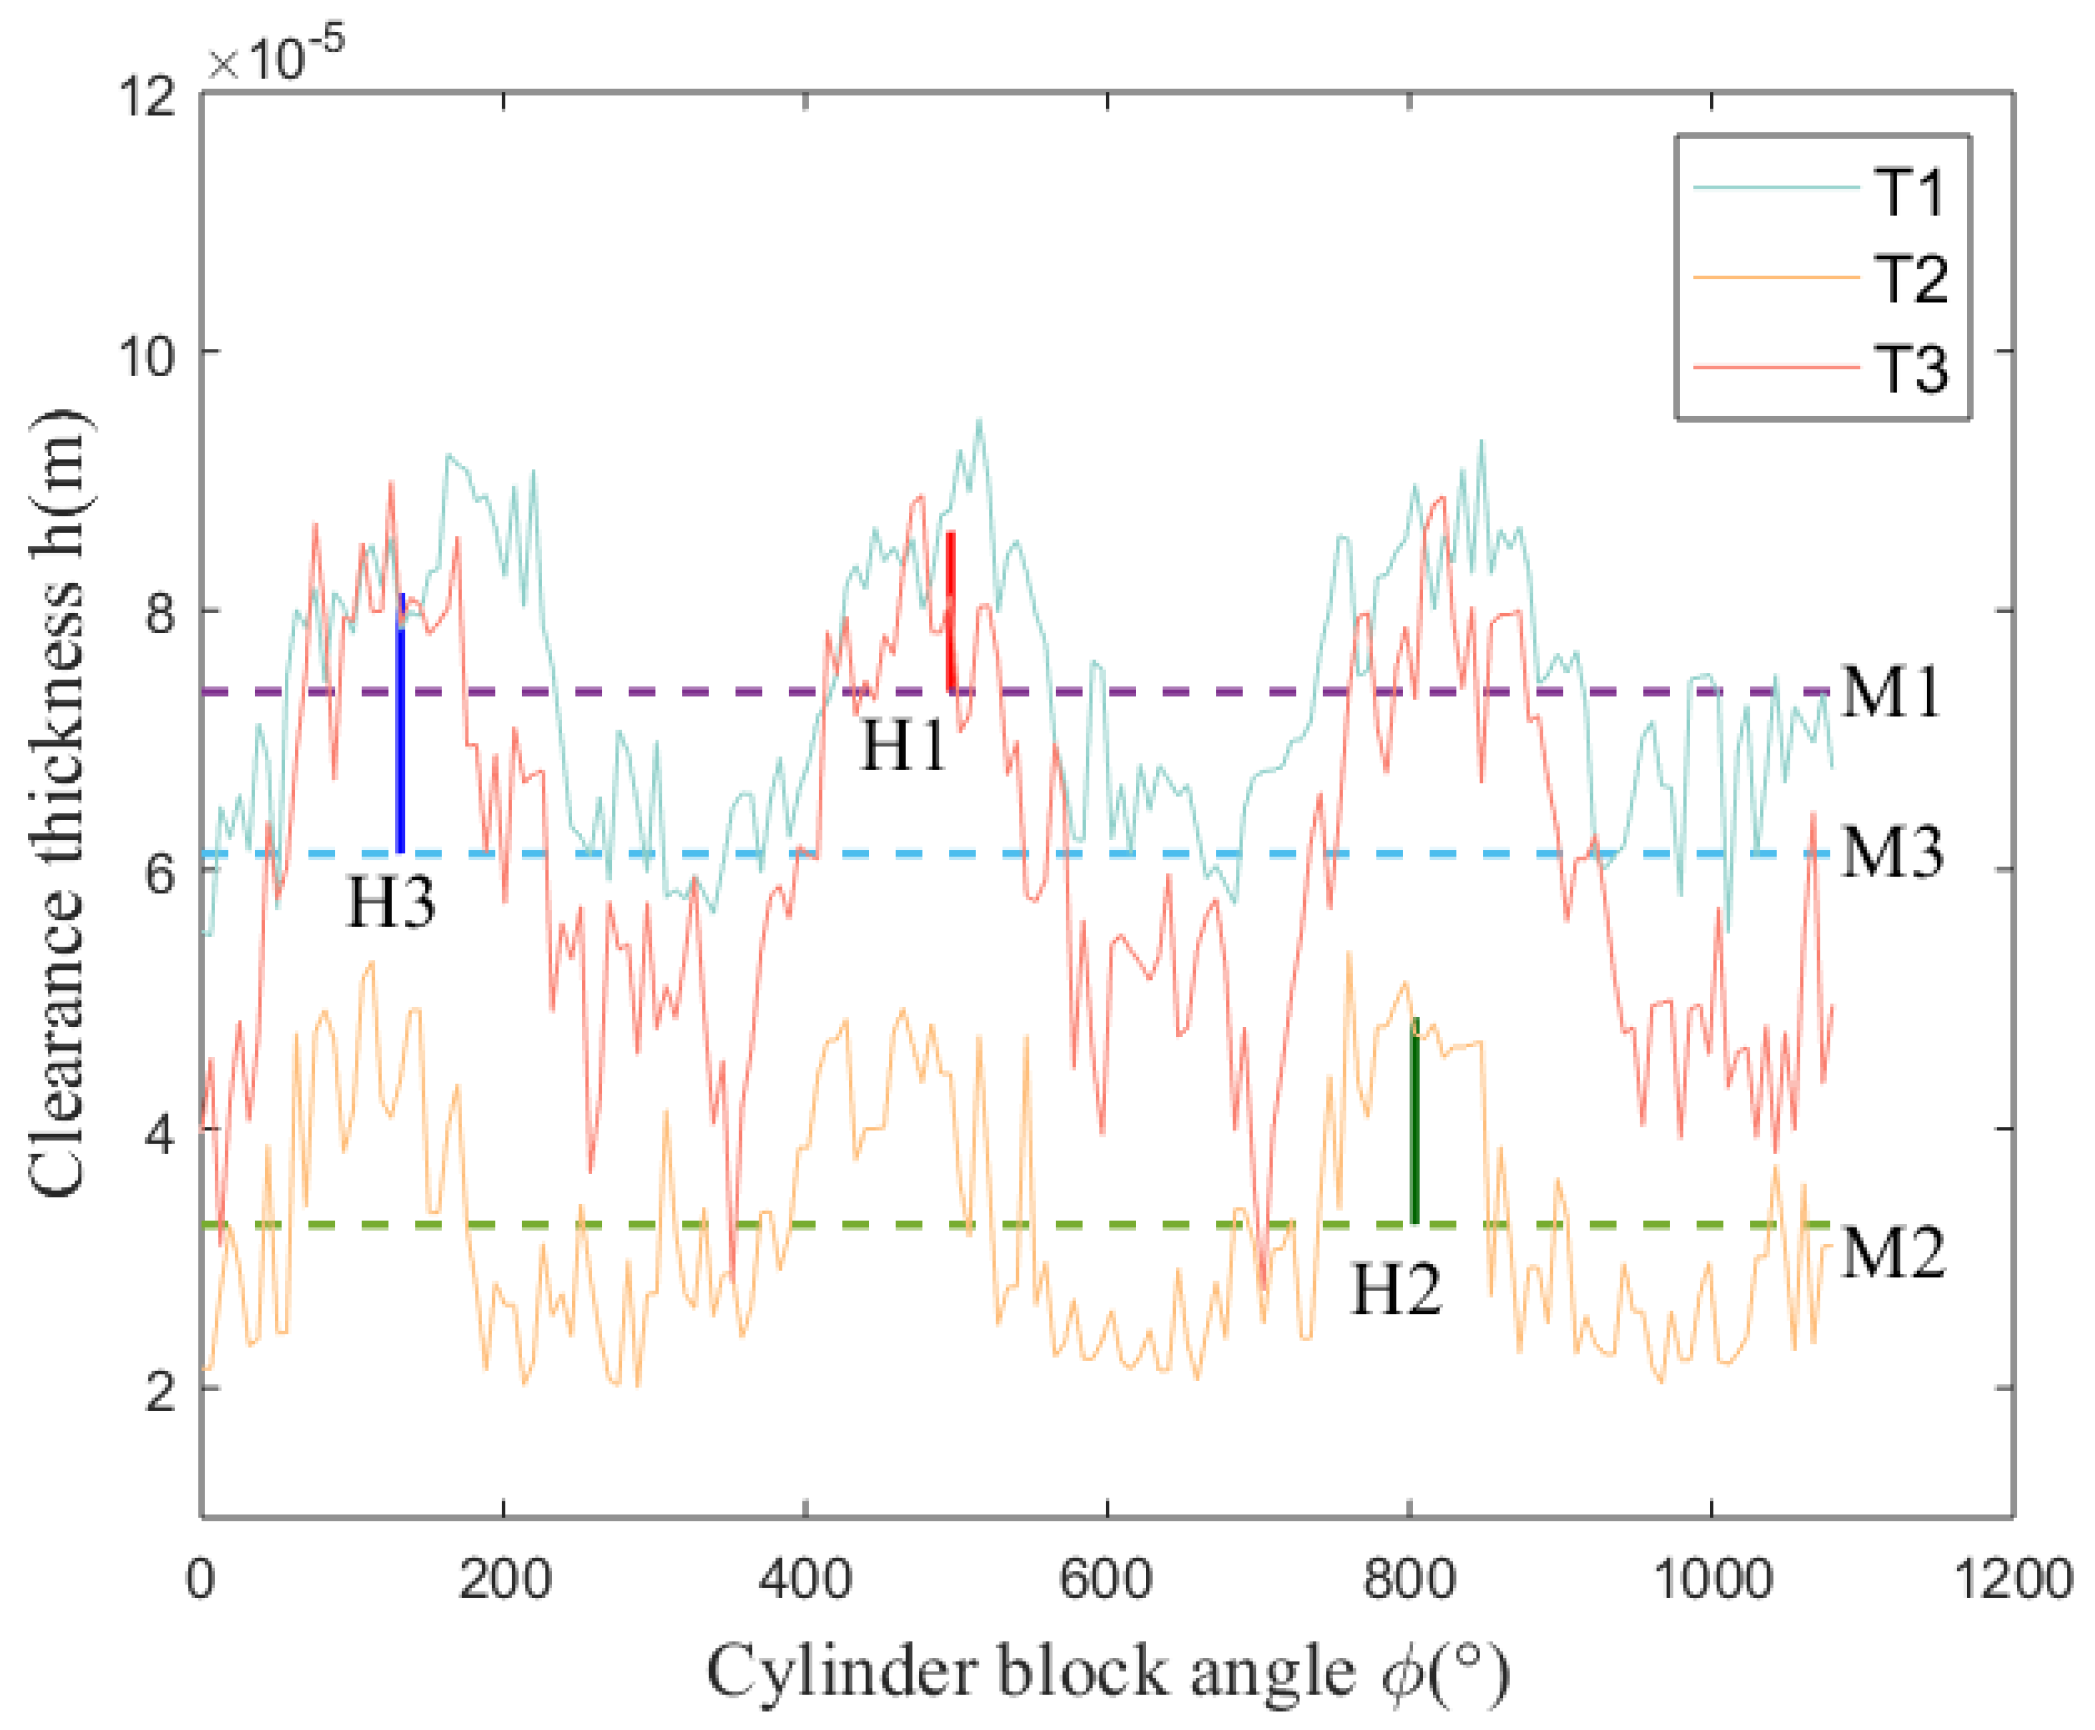
4.1. Comparison of Theoretical Curve and Experimental Curve of Three-Point Film Thickness
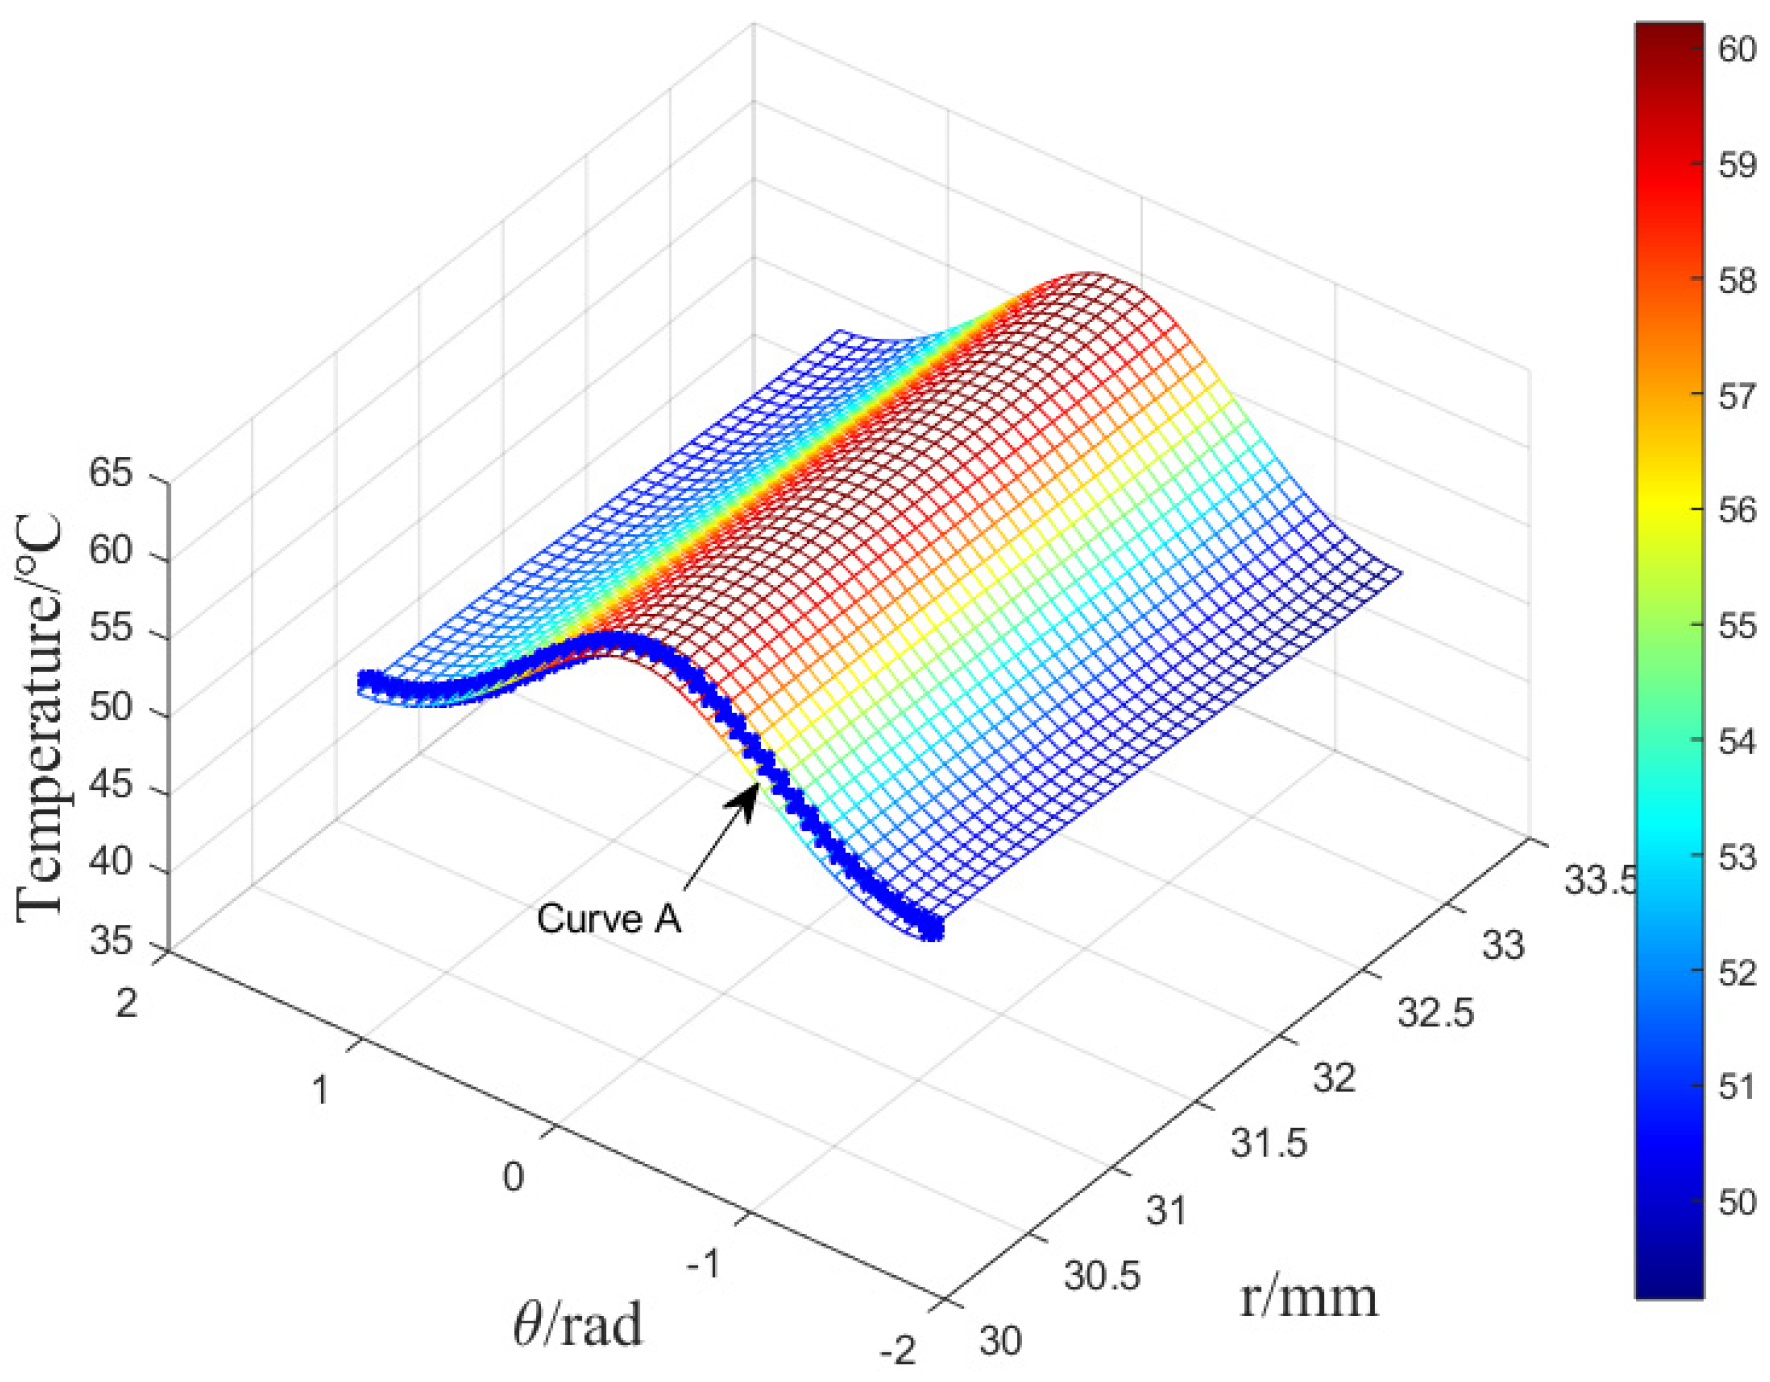
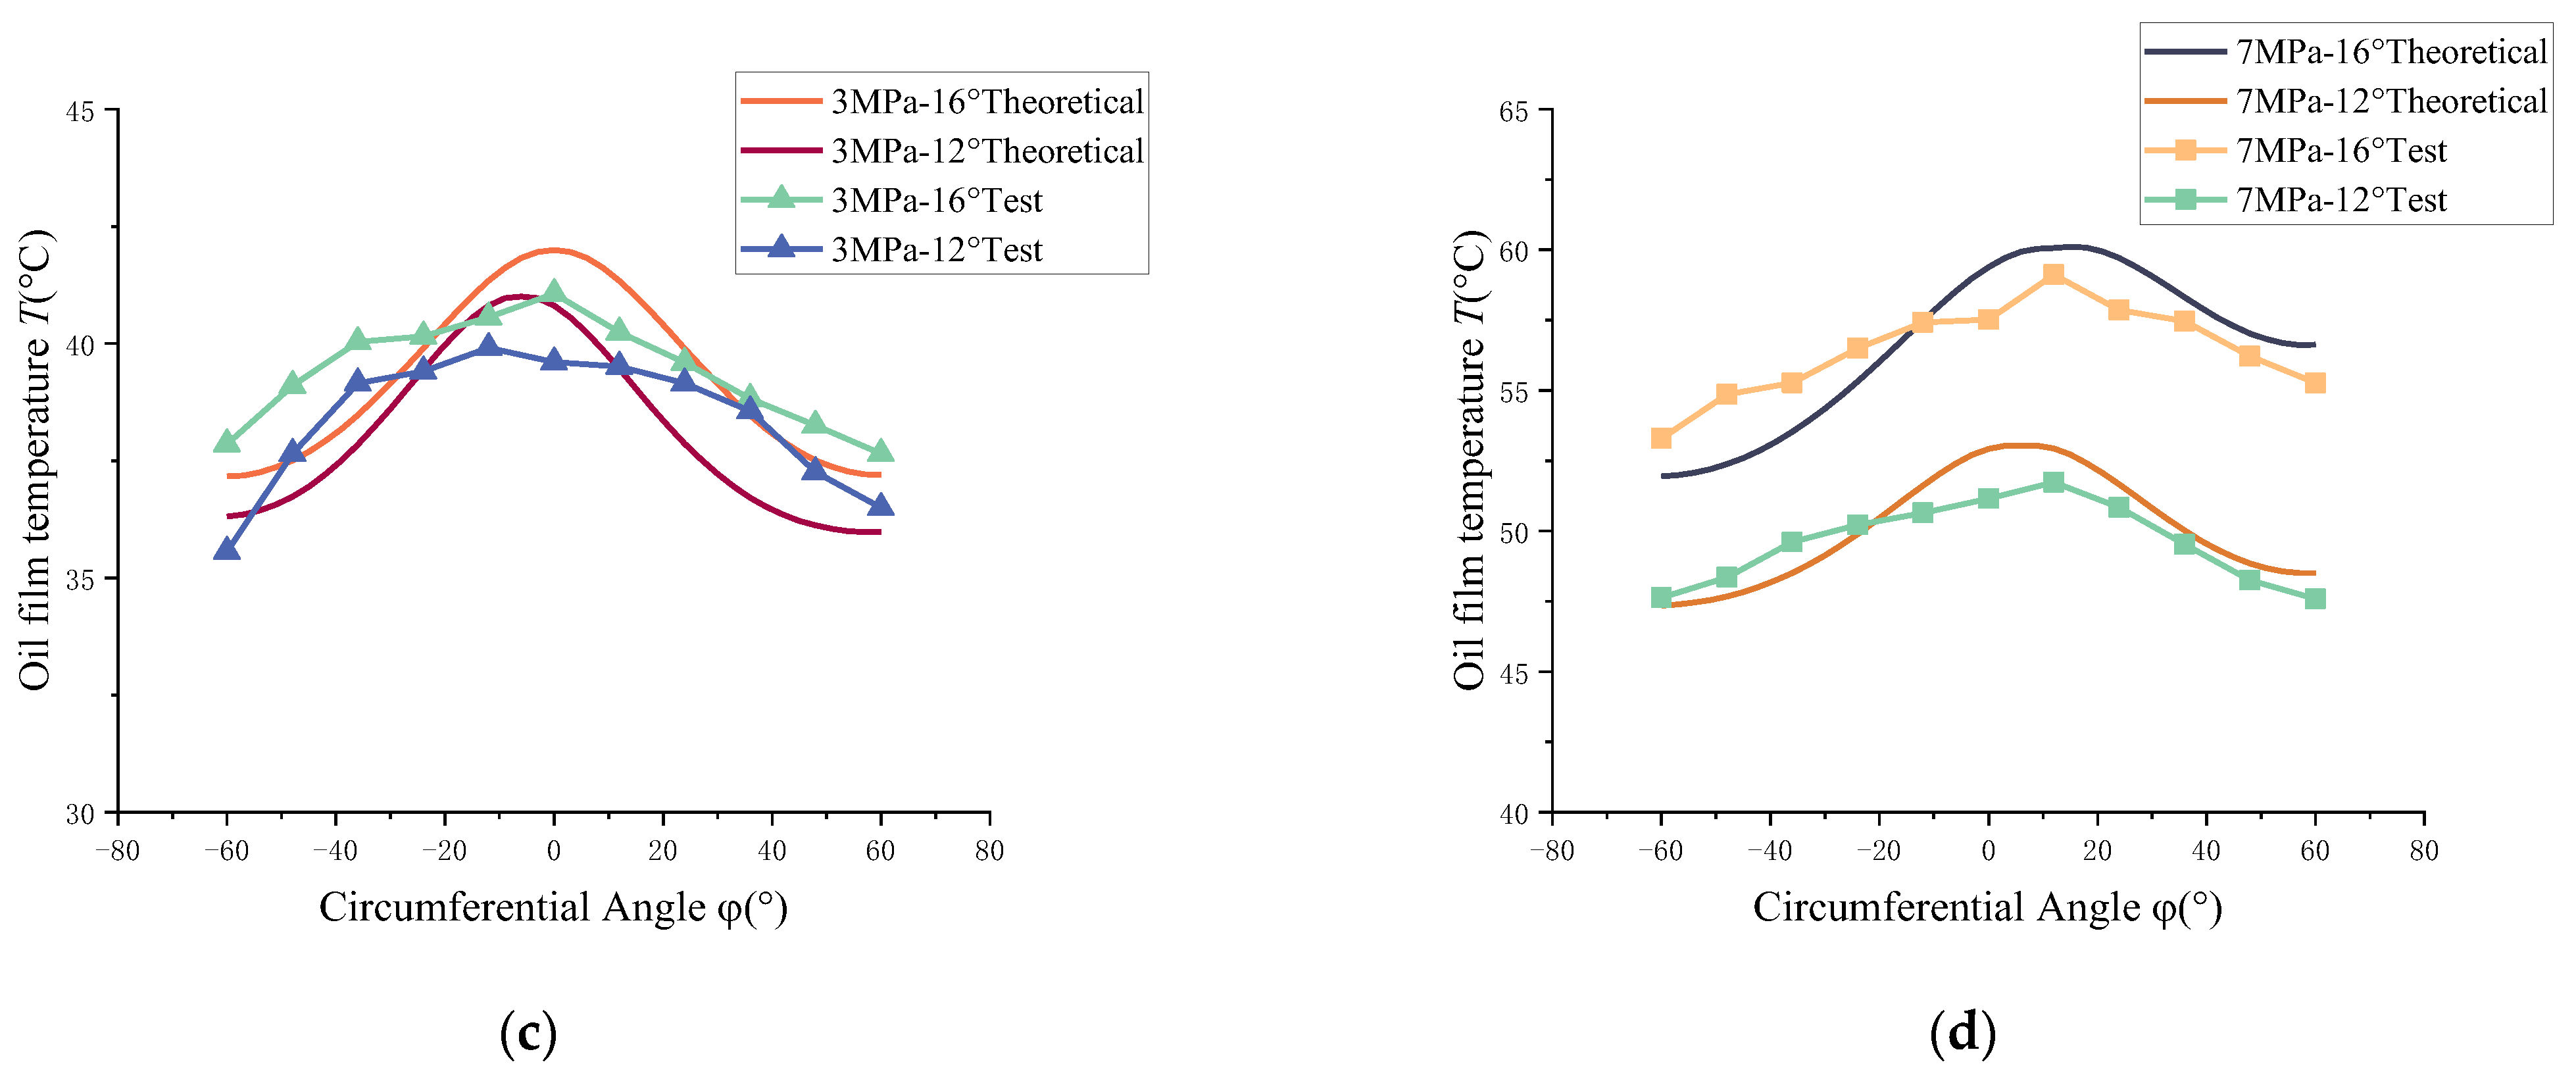
4.2. Temperature Characteristics of the Valve Plate Oil Film
5. Conclusions
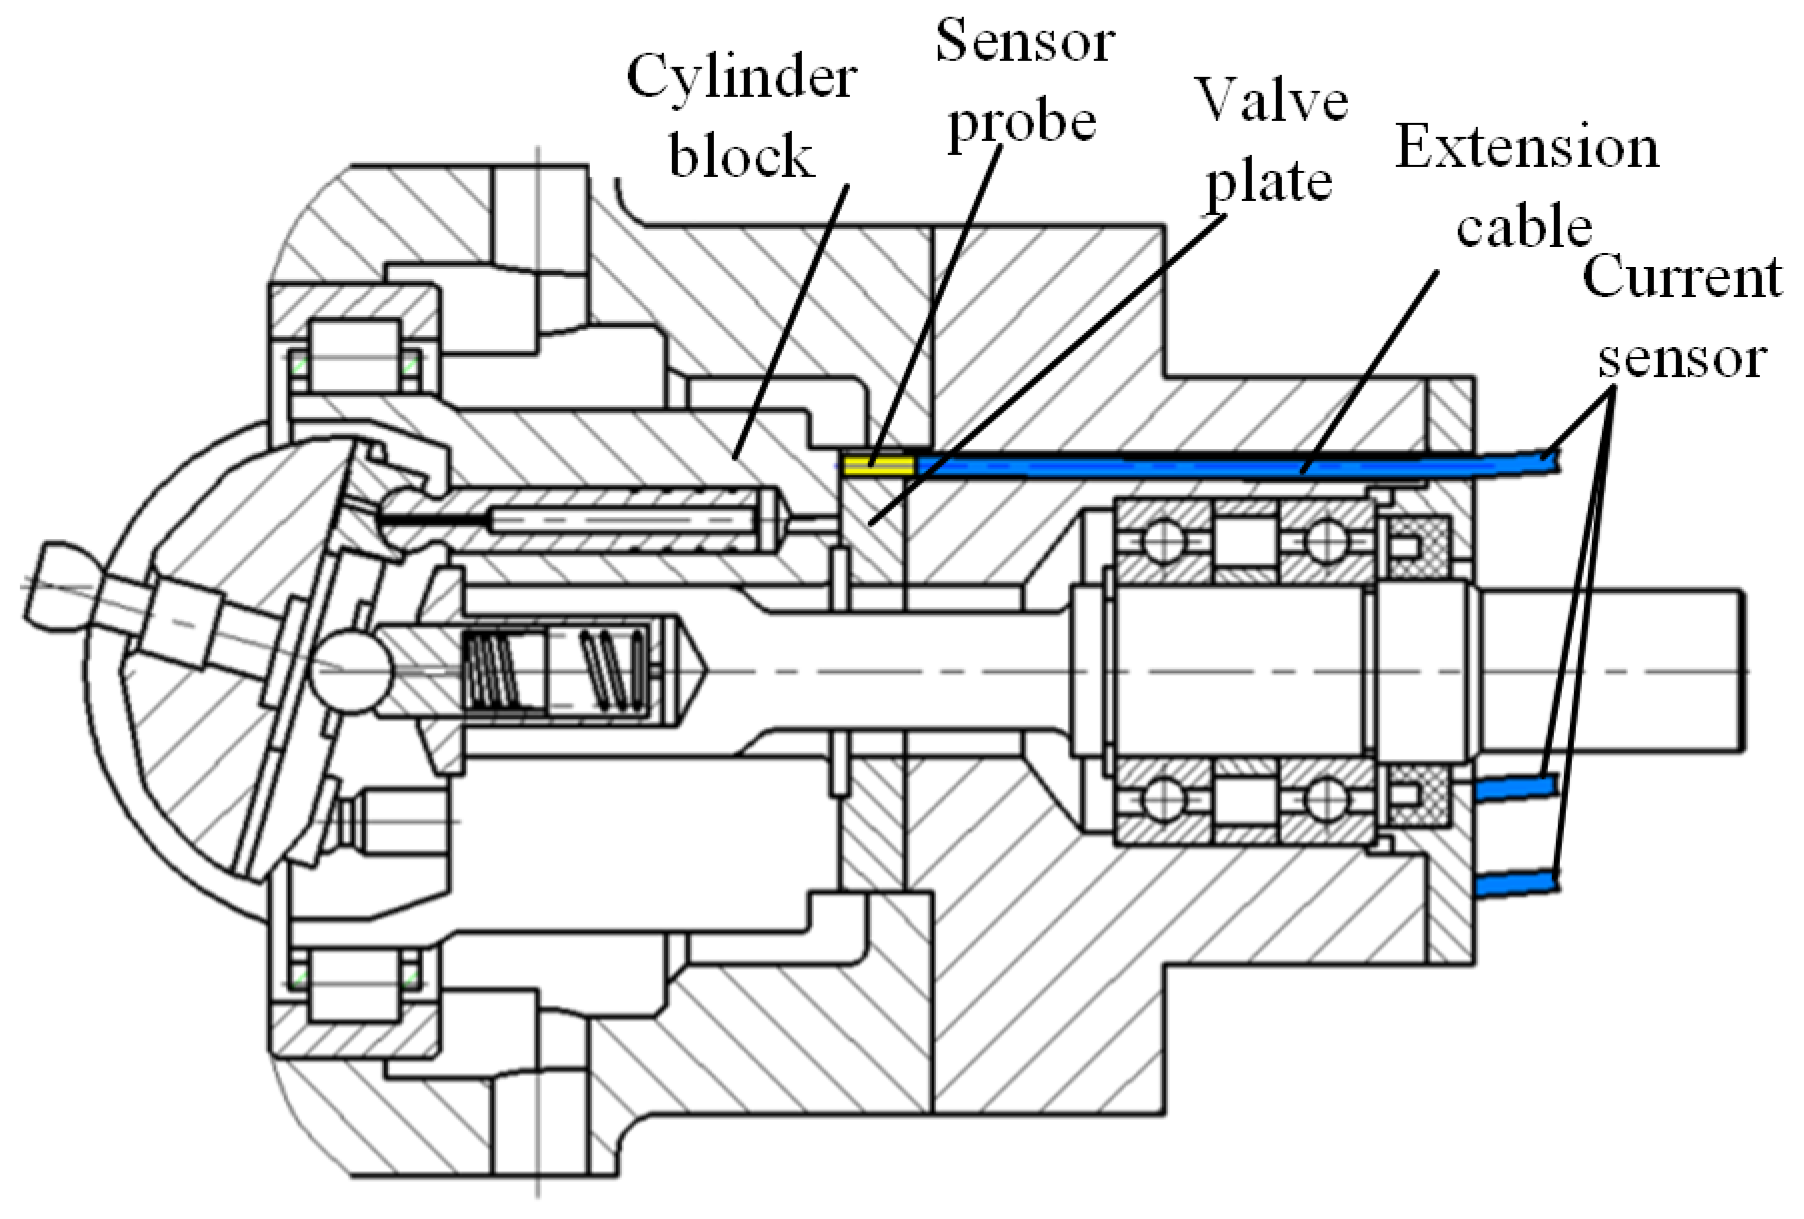
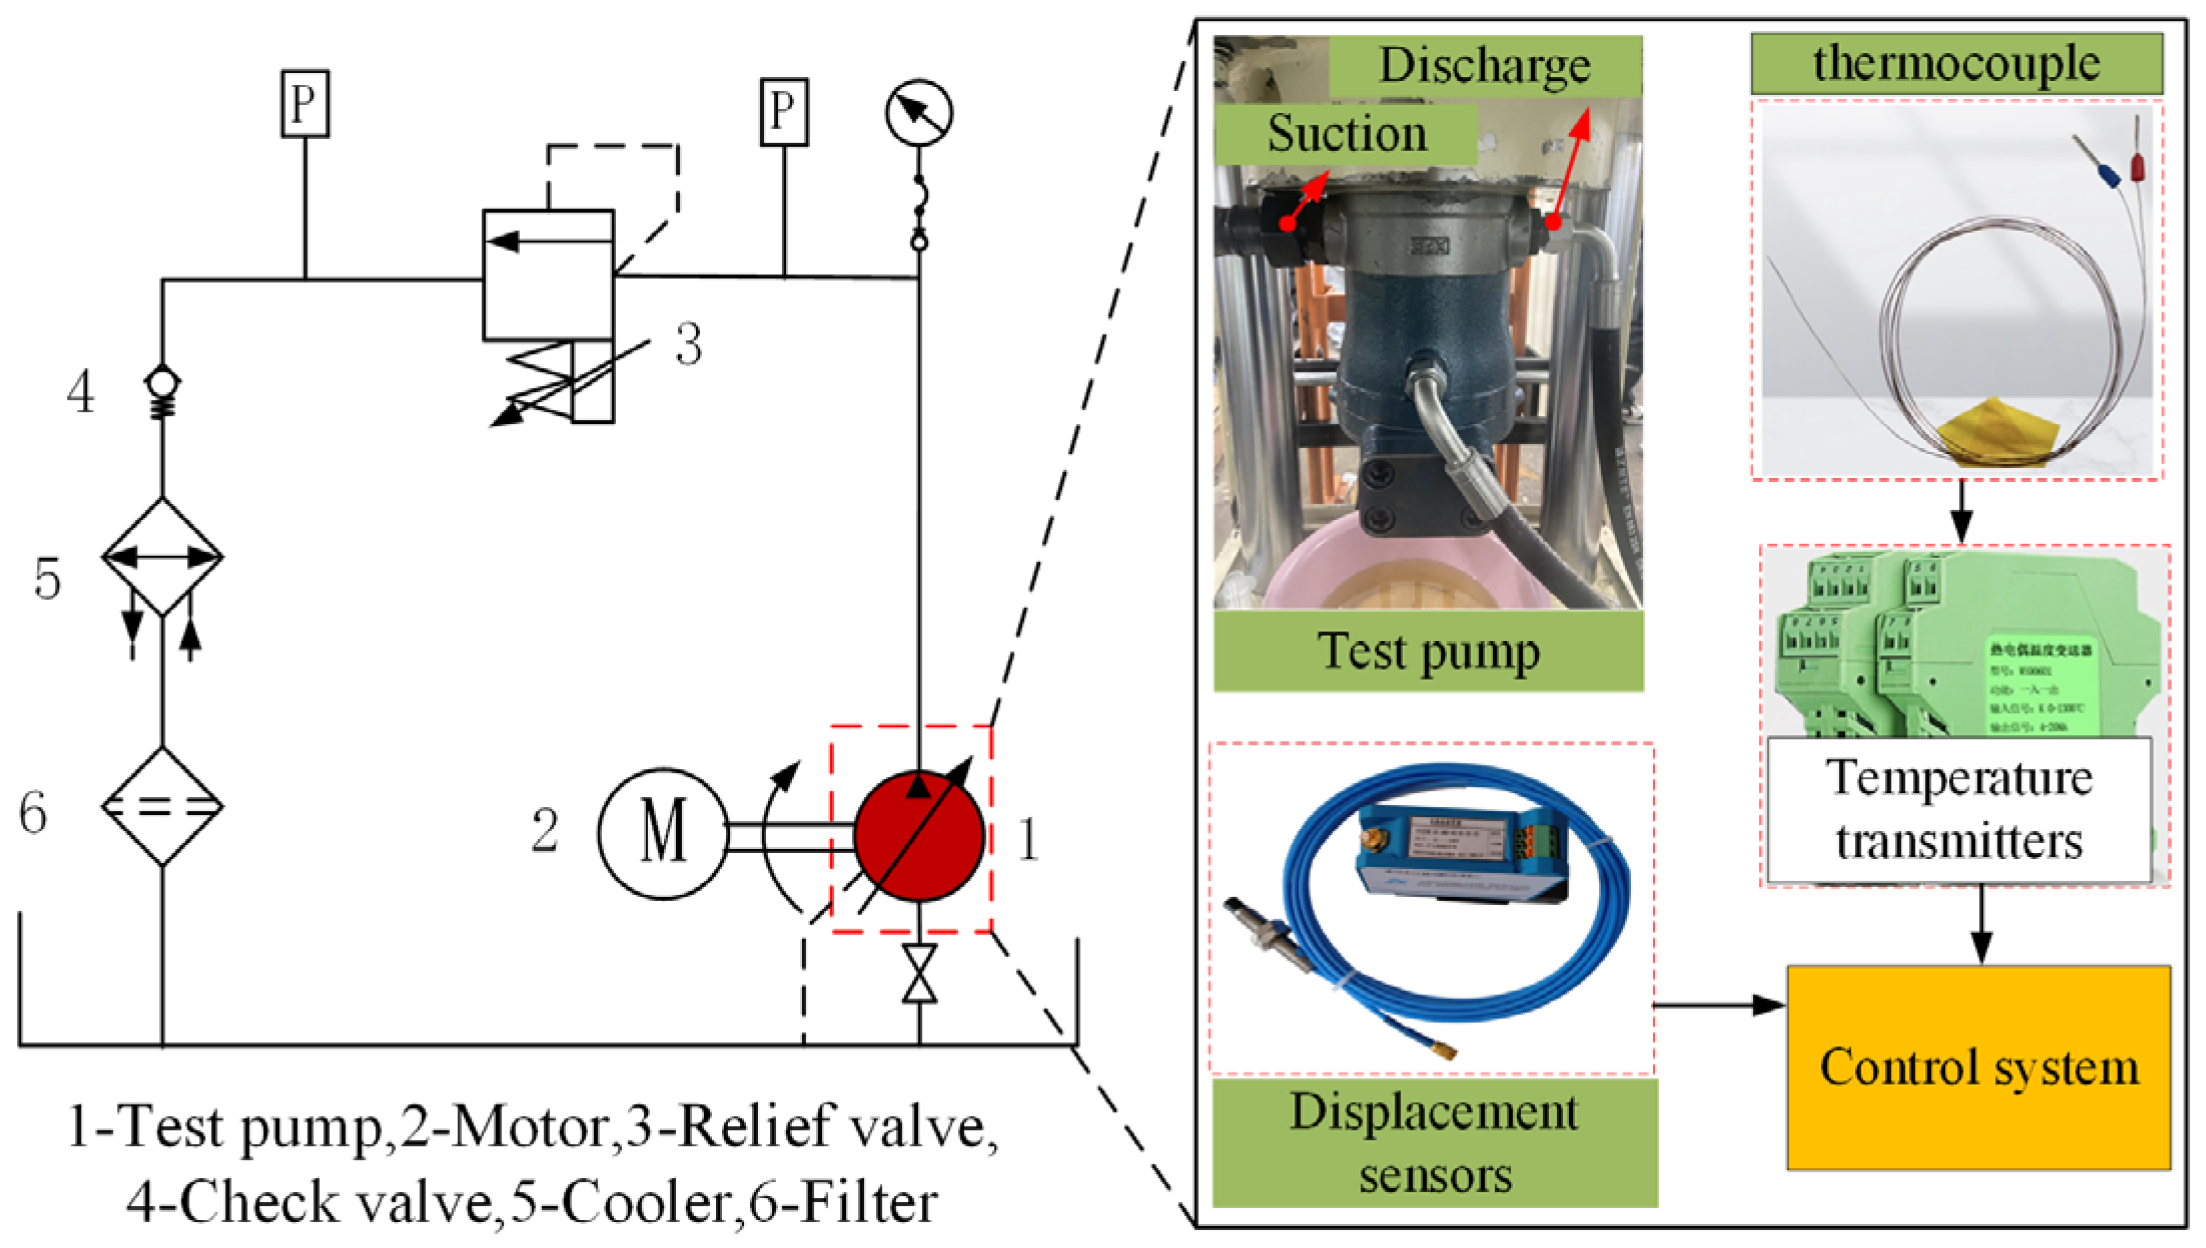
- To improve the accuracy of the film temperature model, a test platform was built, in which three displacement sensors were installed in the low-pressure side of the valve plate and eleven thermocouples were laid in the high-pressure side of the back of the valve plate. Based on the collected data from the three-point film displacement sensors, a film shape model of the valve plate pair was established, considering the effects of the fluctuation factor (coaxiality factor) and constant factors (force, moment, and off-wear factors). Then, the film temperature model was established, considering the viscosity–temperature characteristics of hydraulic oil, the energy loss caused by viscous friction and leakage, and the heat conduction among the oil, cylinder block, and valve plate. The theoretical and experimental film temperature results agree well with each other.
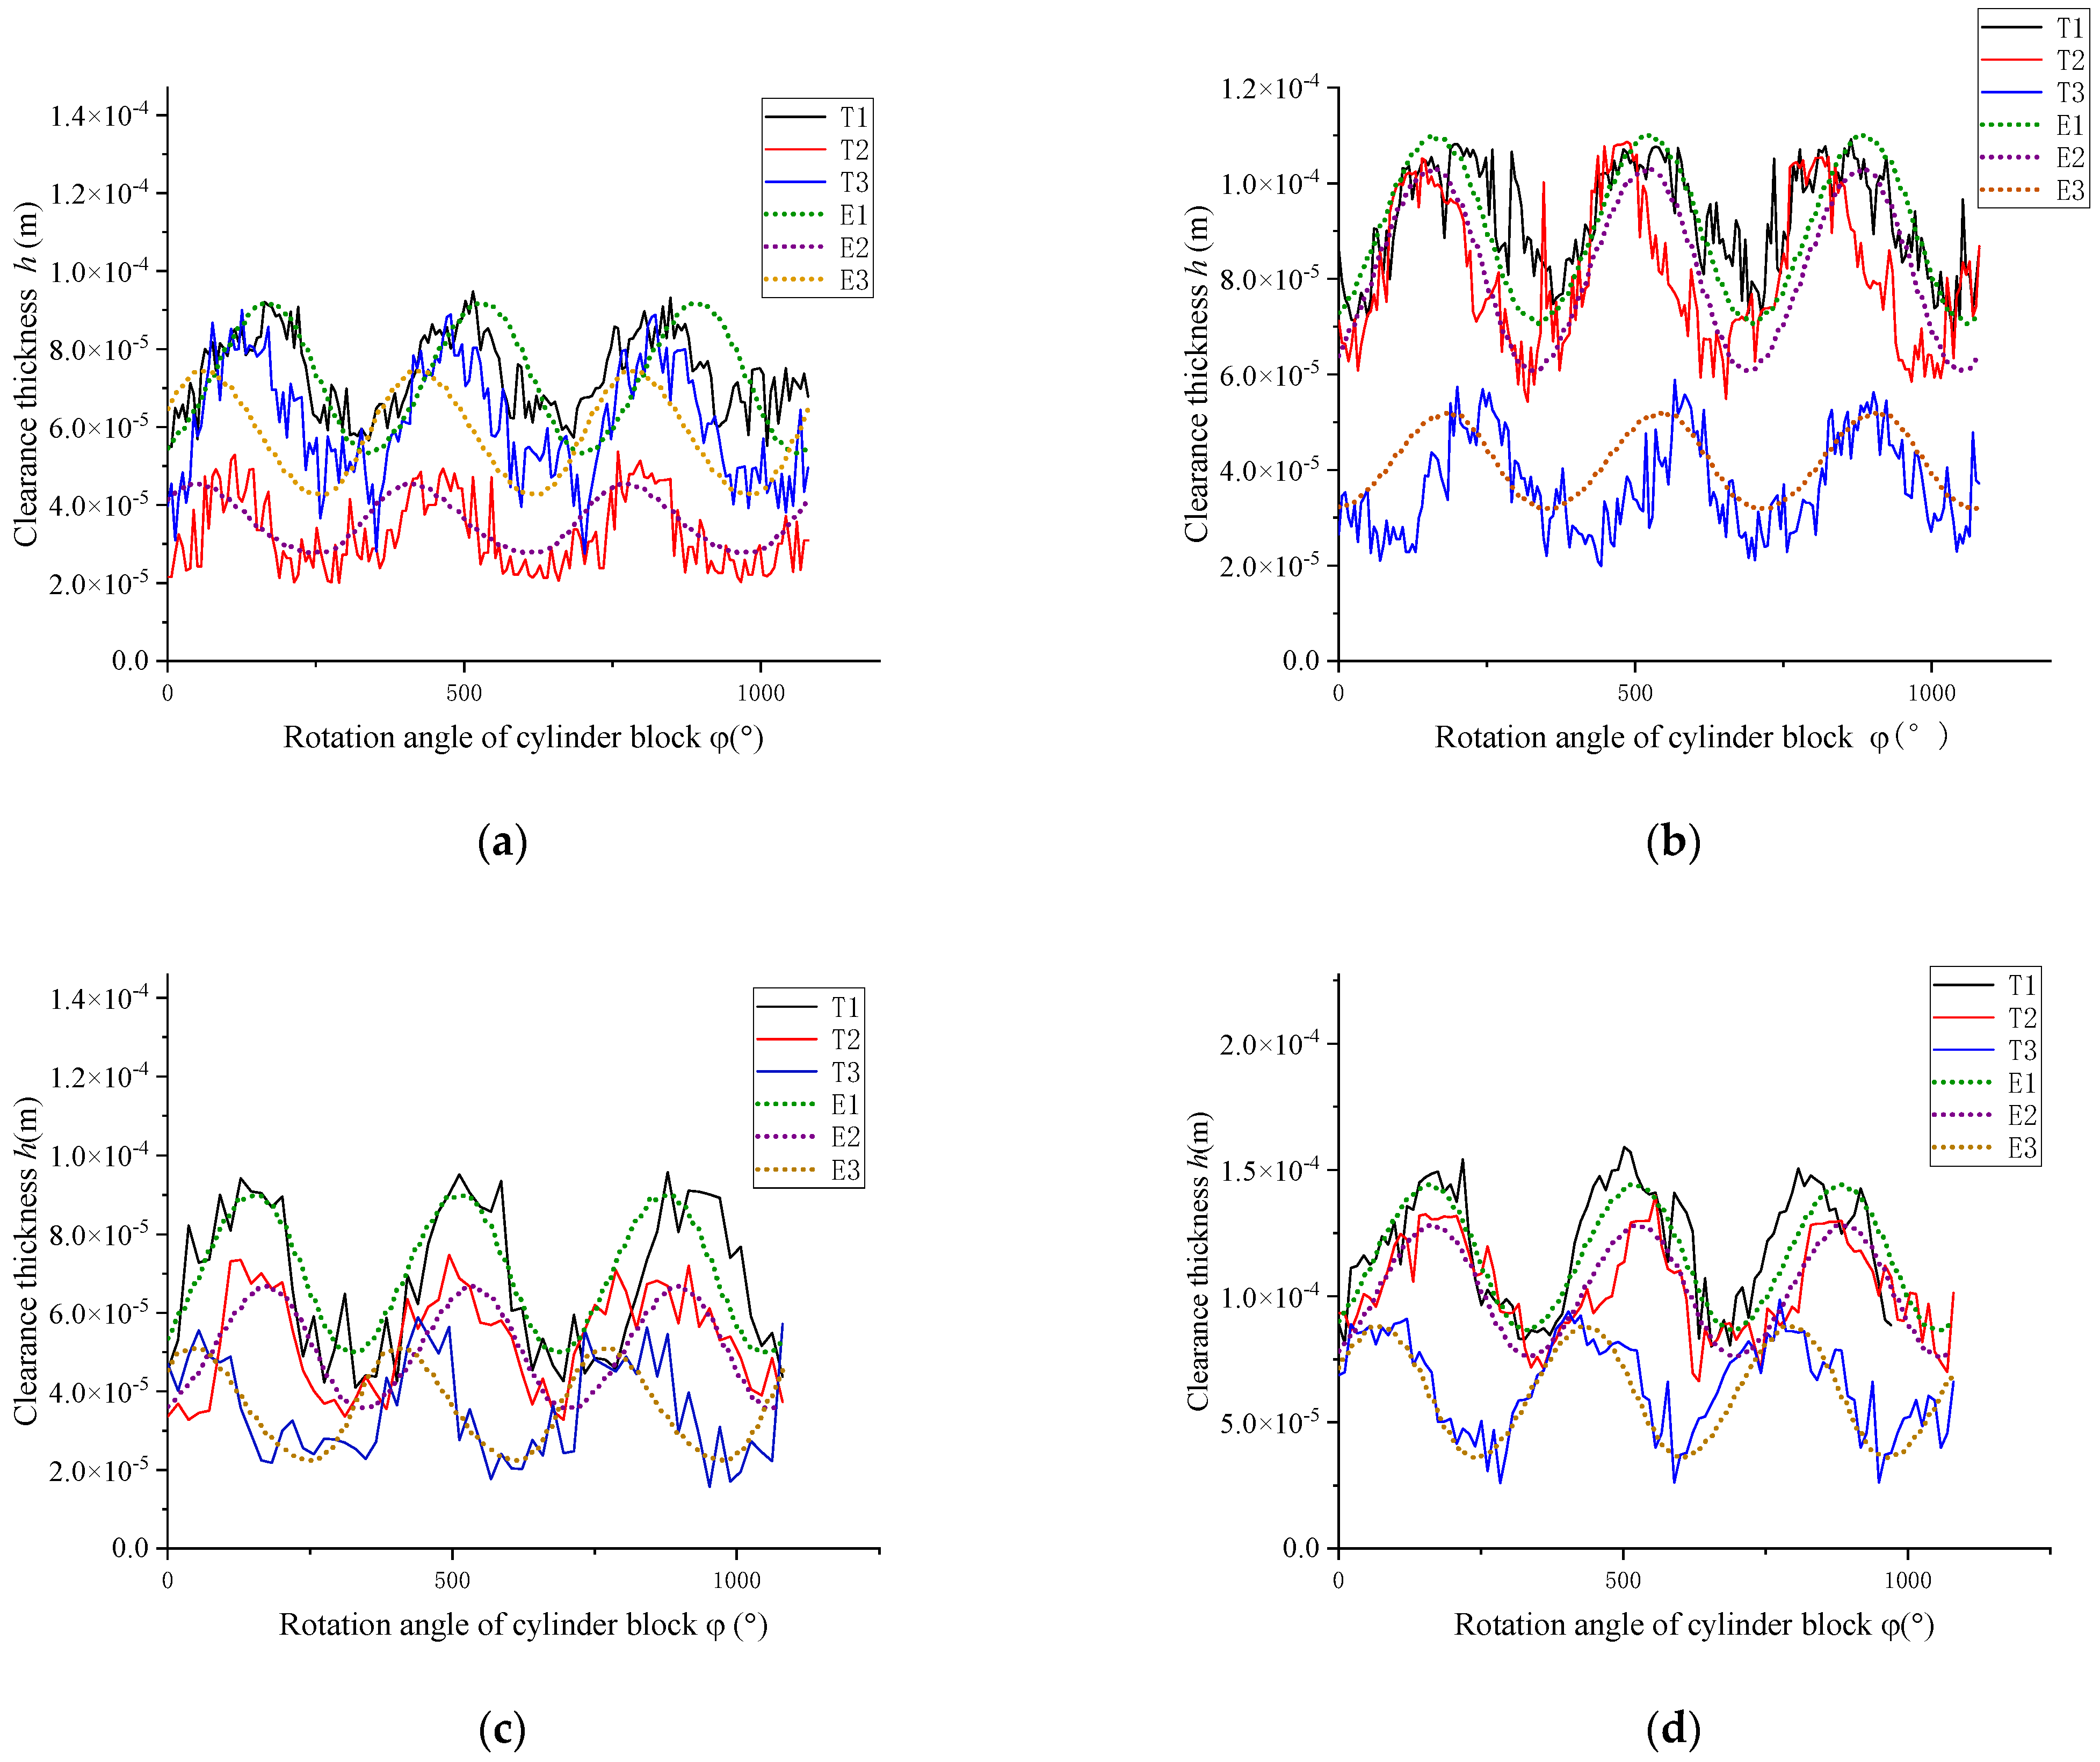
- Film thickness tests were conducted under the working pressures of 3 MPa and 7 MPa, swash plate tilt angles of 12° and 16°, and a working speed of 1000 rpm. Under working condition 1 of 3 MPa and 12°, the average value error of the film thickness test curve and the theoretical curve is less than 0.4 × 10⁻⁵ m. Under working condition 2 of 3 MPa and 16°, their average value error is less than 0.5 × 10⁻⁵ m. Under working condition 3 of 7 MPa and 12°, their average value error is less than 0.2 × 10⁻⁵ m. Under working condition 4 of 7 MPa and 16°, their average value error is less than 0.7 × 10⁻⁵ m. The theoretical film thickness curves agree well with the experimental film thickness curves.
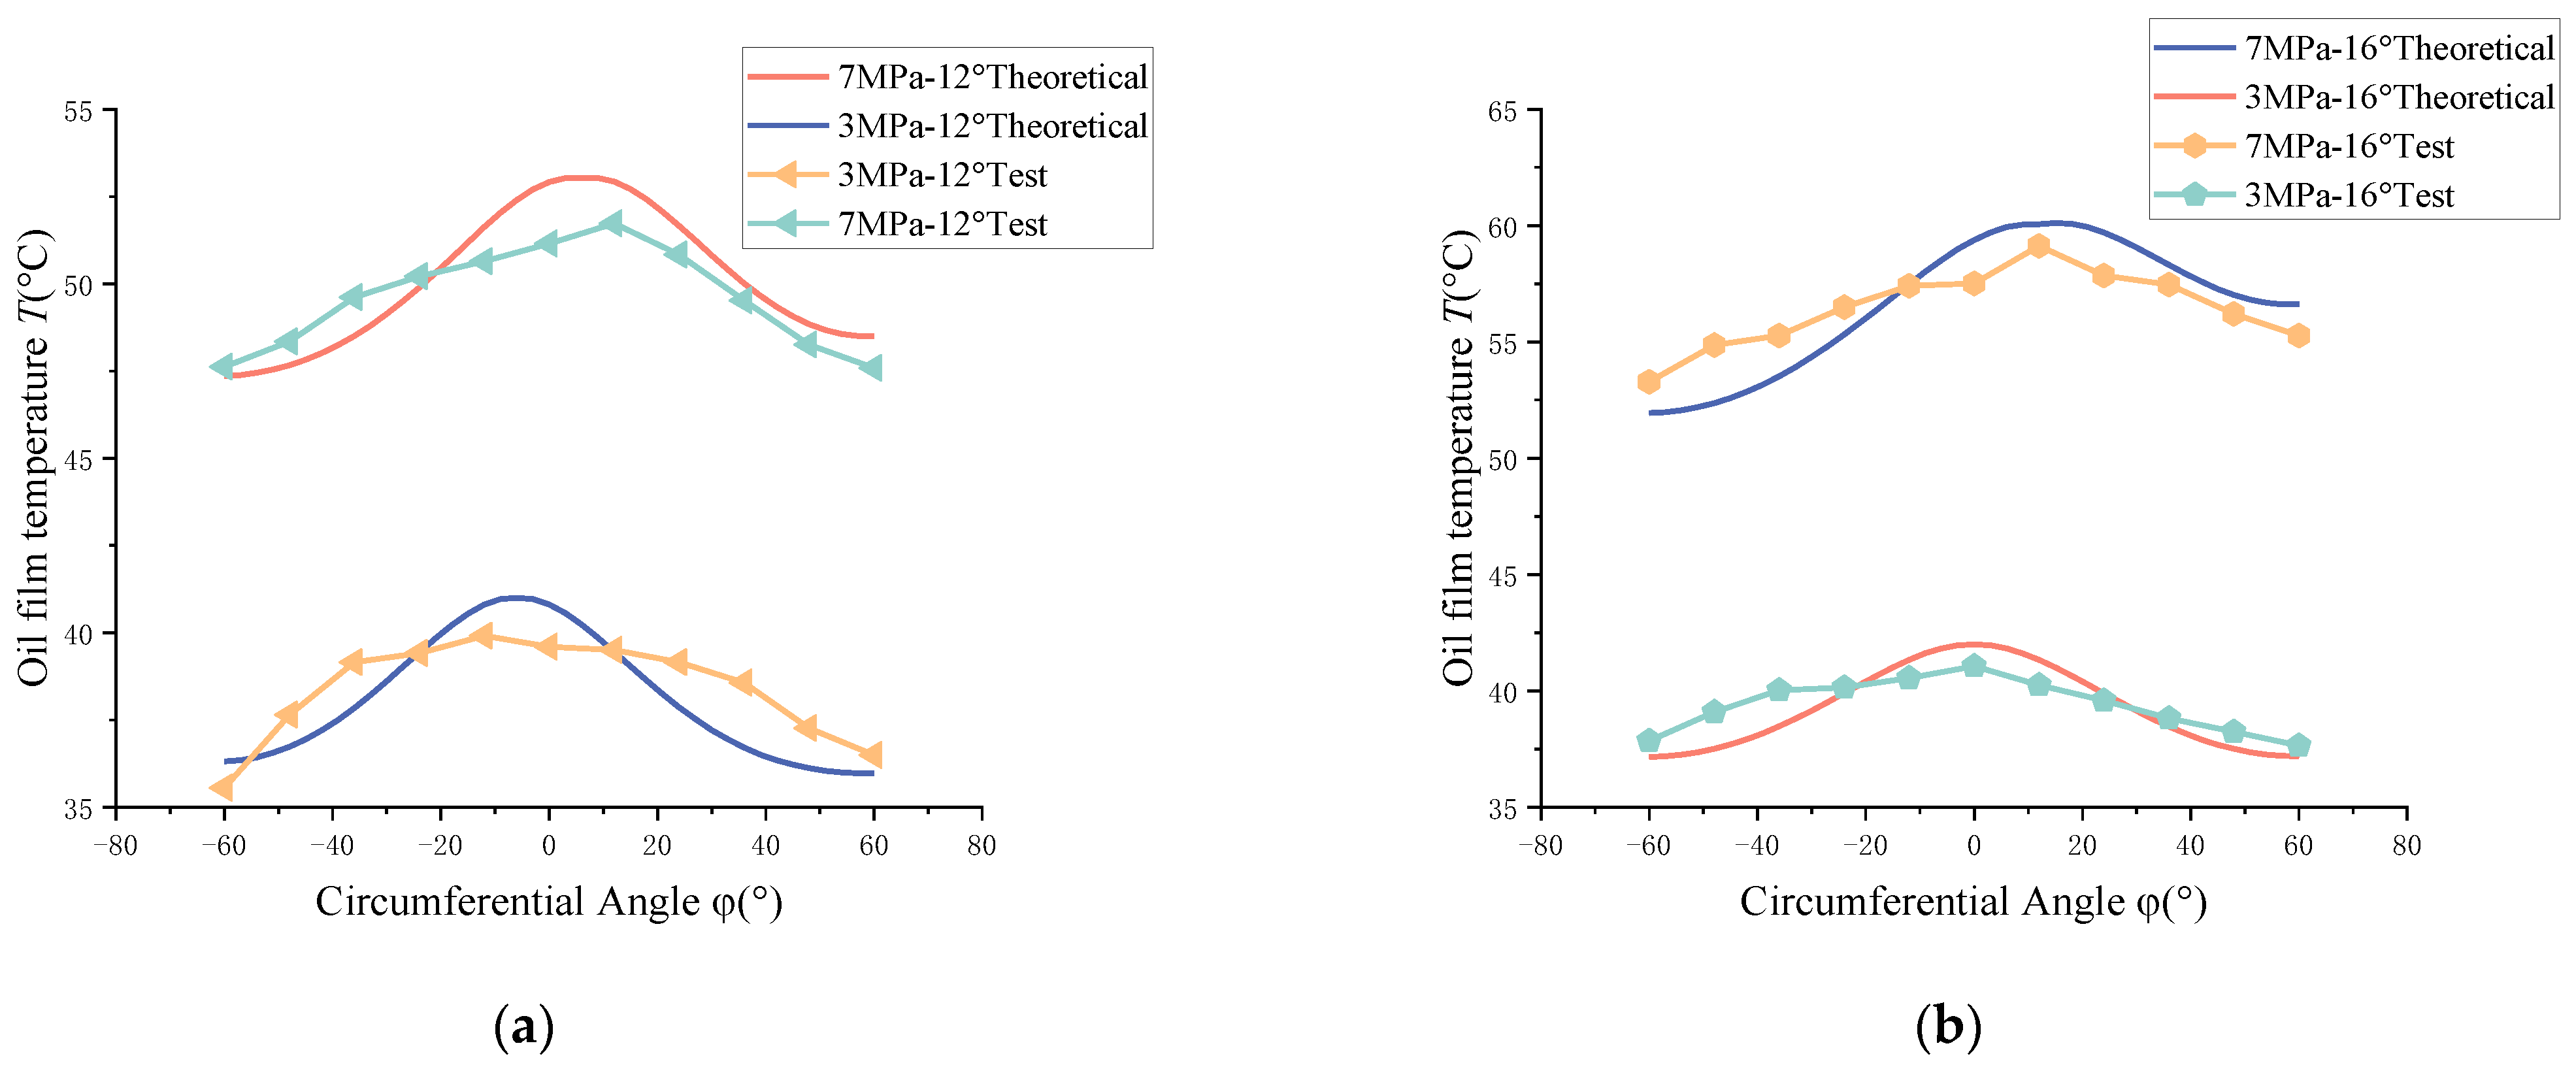
- The film temperature increases with an increase in the working pressure and swash plate tilt angle. The absolute error between the test and theoretical results of the maximum oil film temperature in the valve plate pair is less than 3.5 °C. As the working pressure increases from 3 MPa to 7 MPa and the swash plate tilt angle increases from 12° to 16°, the position of the highest-temperature point shifted from −15° to 5° in the circumferential direction of the valve plate.
- This manuscript also has some limitations. This manuscript does not take into account the effects of triangular grooving on the film of the valve plate pair and the effects of cavitation on the film forming of the valve plate pair. Theoretical modeling and testing were carried out under relatively low pressure, and no tests were carried out under relevant high-pressure and high-speed conditions.
Author Contributions
Funding
Data Availability Statement
Conflicts of Interest
References
- Zhou, J.; Li, T.; Wang, D. A Novel Approach of Studying the Fluid–Structure–Thermal Interaction of the Piston–Cylinder Interface of Axial Piston Pumps. Appl. Sci. 2021, 11, 8843. [Google Scholar] [CrossRef]
- Dašić, P.E.; Banaszek, A.; Turmanidze, E. The influence of tilt angle of the inclined plate on the gradient of the pressure increase in the piston axial pump cylinder. In Proceedings of the Fluid Power International Conference, Maribor, Slovenia, 21 September 2023. [Google Scholar]
- Shin, J.-H.; Kim, H.-E.; Kim, K.-W. A Study on Models for the Analysis of Pressure Pulsation in a Swash-Plate Type Axial Piston Pump. Tribol. Lubr. 2011, 27, 314–320. [Google Scholar]
- Azzam, I.; Pate, K.; Breidi, F.; Choi, M.; Jiang, Y.; Mousas, C. Mixed Reality: A Tool for Investigating the Complex Design and Mechanisms of a Mechanically Actuated Digital Pump. Actuators 2023, 12, 419. [Google Scholar] [CrossRef]
- Chao, Q.; Zhang, J.H.; Xu, B.; Chen, Y.; Ge, Y.Z. Spline design for the cylinder block within a high-speed electro-hydrostatic actuator pump of aircraft. Meccanica 2018, 53, 395–411. [Google Scholar] [CrossRef]
- Liu, G.; Zhou, Z.; Qian, X.; Wu, X.; Pang, W. Multidisciplinary Design Optimization of a Swash-Plate Axial Piston Pump. Appl. Sci. 2016, 6, 399. [Google Scholar] [CrossRef]
- Boldyrev, S.V.; Budarova, O.P. Experimental study of wear of model friction pairs lubricated with contaminated oil. J. Frict. Wear 2016, 37, 346–350. [Google Scholar] [CrossRef]
- Brazhenko, V. The influence of contaminated hydraulic fluid on the relative volume flow rate and the wear of rubbing parts of the aviation plunger pump. Aviation 2019, 23, 43–47. [Google Scholar] [CrossRef]
- Duensing, Y.; Richert, O.; Schmitz, K. Investigating the Condition Monitoring Potential of Oil Conductivity for Wear Identification in Electro Hydrostatic Actuators. In Proceedings of the ASME/BATH 2021 Symposium on Fluid Power and Motion Control, ASME/BATH 2021 Symposium on Fluid Power and Motion Control, Virtual, 19–21 October 2021. V001T01A033. [Google Scholar]
- Wang, Z.Q.; Hu, S.; Ji, H.; Wang, Z.; Liang, W. Study on the characteristics of oil film load capacity for axial piston pump. Aust. J. Mech. Eng. 2020, 18, 140–150. [Google Scholar] [CrossRef]
- Wang, Z.Q.; Cheng, J.; Ji, H.; Hu, S.; Chen, H. Temperature characteristics analysis of axial piston pump port plate pair. Ind. Lubr. Tribol. 2019, 71, 603–609. [Google Scholar] [CrossRef]
- Wang, Z.Q.; Hu, S.; Ji, H.; Wang, Z.; Liu, X.T. Analysis of lubricating characteristics of valve plate pair of a piston pump. Tribol. Int. 2018, 126, 49–64. [Google Scholar] [CrossRef]
- Tang, H.S.; Ren, Y.; Xiang, J.W. A novel model for predicting thermoelastohydrodynamic lubrication characteristics of slipper pair in axial piston pump. Int. J. Mech. Sci. 2017, 124, 109–121. [Google Scholar] [CrossRef]
- Tang, H.S.; Ren, Y.; Xiang, J.W. Power loss characteristics analysis of slipper pair in axial piston pump considering thermoelastohydrodynamic deformation. Lubr. Sci. 2019, 31, 381–403. [Google Scholar]
- Bergada, J.M.; Watton, J.; Kumar, S. Pressure, flow, force, and torque between the barrel and port plate in an axial piston pump. J. Dyn. Syst. Meas. Control-Trans. ASME 2008, 130, 011011. [Google Scholar] [CrossRef]
- Bergada, J.M.; Davies, D.L.; Kumar, S.; Watton, J. The effect of oil pressure and temperature on barrel film thickness and barrel dynamics of an axial piston pump. Meccanica 2012, 47, 639–654. [Google Scholar] [CrossRef]
- Xu, H.G.; Zhang, J.H.; Sun, G.M.; Huang, W.D.; Huang, X.C. The direct measurement of the cylinder block dynamic characteristics based on a non-contact method in an axial piston pump. Measurement 2021, 167, 108279. [Google Scholar] [CrossRef]
- Zhang, Z.Q.; Yuan, H.T.; Song, J.L.; Zhou, H.B. Modelling of the Micro Lubricating Gap Geometry between Valve Plate and Cylinder Block in an Axial Piston Pump. Int. J. Fluid Power 2020, 21, 211–234. [Google Scholar] [CrossRef]
- Zhang, C.; Huang, S.K.; Du, J.; Wang, X.J.; Wang, S.P.; Zhang, H.Y. A new dynamic seven-stage model for thickness prediction of the film between valve plate and cylinder block in axial piston pumps. Adv. Mech. Eng. 2016, 8, 1687814016671446. [Google Scholar] [CrossRef]
- Tang, H.S.; Yin, Y.B.; Ren, Y.; Xiang, J.W.; Chen, J. Impact of the Thermal Effect on the Load-Carrying Capacity of a Slipper Pair for an Aviation Axial-Piston Pump. Chin. J. Aeronaut. 2017, 31, 395–409. [Google Scholar] [CrossRef]
- Kazama, T.; Tsuruno, T.; Sasaki, H. Temperature measurement of tribological parts in swash-plate type axial piston pumps. Proc. JFPS Int. Symp. Fluid Power 2008, 2008, 341–346. [Google Scholar] [CrossRef]
- Zecchi, M.; Mehdizadeh, A.; Ivantysynova, M. A novel approach to predict the steady state temperature in ports and case of swash plate type axial piston machines. In Proceedings of the 13th Scandinavian International Conference on Fluid Power, Linköping, Sweden, 3–5 June 2013. [Google Scholar]
- Zecchi, M. A Novel Fluid Structure Interaction and Thermal Model to Predict the Cylinder Block/Valve Plate Interface Performance in Swash Plate Type Axial Piston Machines. Ph.D. Thesis, Purdue University, West Lafayette, IN, USA, 2013. [Google Scholar]
- Shang, L.; Ivantysynova, M. Port and case flow temperature prediction for axial piston machines. Int. J. Fluid Power 2015, 16, 35–51. [Google Scholar]
- Chacon, R.; Ivantysynova, M. Thermal Effects on the Fluid Film in the Cylinder Block/Valve Plate Interface due to Compression and Expansion of the Fluid. JFPS Int. J. Fluid Power Syst. 2019, 11, 136–142. [Google Scholar] [CrossRef]
- Petrović, R.; Banaszek, A.; Andjelković, M.; Qananah, H.R.; Alnagasa, K.A. Experimental Tests of the Piston Axial Pump with Constant Pressure and Variable Flow. Designs 2024, 8, 5. [Google Scholar] [CrossRef]
- Zhang, Z.Q.; Chen, Y.Y.; Song, J.L.; Jin, K.S.; Zhou, H.B. Multiple frequency vibration of the micro lubricating gap geometry between cylinder block and valve plate in an axial piston pump. J. Mech. Sci. Technol. 2021, 35, 4835–4848. [Google Scholar] [CrossRef]
- Deng, H.S.; Wang, Q.C.; Dai, P.; Yang, Y.K. Study on Leaking Characteristics of Port Plate Pair in Primary Three-Row Axial Piston Pump/Motor. Math. Probl. Eng. 2018, 2018, 7395727. [Google Scholar] [CrossRef]
- Zhao, C.K.; Dong, H.K.; Wei, X.F.; Wang, D.Y.; Lu, X.P. Experimental study on the pressure distribution of piston/cylinder lubricating interface based on time domain location method. Measurement 2024, 231, 114595. [Google Scholar] [CrossRef]


| Temperature (°C) | 20 | 30 | 40 | 50 | 60 | 70 | 80 | 90 | 100 |
| Viscosity (10−2 Pa·s) | 11.19 | 6.19 | 3.77 | 2.49 | 1.75 | 1.29 | 1.00 | 0.81 | 0.67 |
| Name | Parameter | Name | Parameter |
|---|---|---|---|
| (mm) | 18.44 | () | 10 |
| (mm) | 21.38 | Z | 7 |
| (mm) | 30.47 | 870 | |
| (mm) | 33.44 | q (mL/r) | 40 |
| (mm) | 37.50 | P (MPa) | 31.5 |
| (mm) | 42.50 | n (rpm) | 1000 |
| () | 0.1454 |
Disclaimer/Publisher’s Note: The statements, opinions and data contained in all publications are solely those of the individual author(s) and contributor(s) and not of MDPI and/or the editor(s). MDPI and/or the editor(s) disclaim responsibility for any injury to people or property resulting from any ideas, methods, instructions or products referred to in the content. |
© 2024 by the authors. Licensee MDPI, Basel, Switzerland. This article is an open access article distributed under the terms and conditions of the Creative Commons Attribution (CC BY) license (https://creativecommons.org/licenses/by/4.0/).
Share and Cite
Zhang, Z.; Ma, S.; Lv, P.; Chao, Q.; Li, L.; Liu, Z. Study on Temperature Characteristics of Lubrication Film of Valve Plate Pair in Axial Piston Pumps. Appl. Sci. 2024, 14, 3359. https://doi.org/10.3390/app14083359
Zhang Z, Ma S, Lv P, Chao Q, Li L, Liu Z. Study on Temperature Characteristics of Lubrication Film of Valve Plate Pair in Axial Piston Pumps. Applied Sciences. 2024; 14(8):3359. https://doi.org/10.3390/app14083359
Chicago/Turabian StyleZhang, Zhiqiang, Shaojie Ma, Pingzhu Lv, Qun Chao, Lin Li, and Zhiqi Liu. 2024. "Study on Temperature Characteristics of Lubrication Film of Valve Plate Pair in Axial Piston Pumps" Applied Sciences 14, no. 8: 3359. https://doi.org/10.3390/app14083359