1. Introduction
Additive manufacturing (AM) is a fabrication technology that significantly reduces both the time and cost of designing and manufacturing products. In this technology, parts are produced by laying many thin layers on top of each other and adding material [
1]. Nowadays, the AM method is also called three-dimensional (3D) printing [
2,
3]. The fabrication of complex parts that are difficult to obtain with traditional manufacturing technologies is possible with 3D printing [
4]. In addition, features such as material consumption and time efficiency, ease of material processing, and the absence of post-processing stages have resulted in AM attracting attention in many areas [
5,
6]. Today, 3D printing technology is preferred in many fields, such as aviation, space, architecture, robotics, mechatronic systems, and medical and biomedical applications [
7,
8,
9,
10].
There are different fabrication methods in AM technology [
11,
12]. Fused filament fabrication (FFF) is one of the most preferred among these methods. Some advantages of FFF are its wide range of materials, simple operation, compatibility with 3D printers, functional part production, and low cost [
13,
14]. The FFF works according to the principle of making the filament material viscous by passing it through a nozzle, extruding the material layer by layer, and finally depositing it on the printing table of the 3D printer [
15,
16]. Although this method is simple in terms of application, the final product is affected by many parameters, such as nozzle temperature, layer thickness, raster angle, table temperature, and infill density. This situation significantly affects the mechanical properties of the product [
17]. Among these parameters, the mechanical properties of the FFF-printed product are mainly affected by the nozzle temperature. A high nozzle temperature reduces the polymer melt viscosity. As a result, the polymer improves melt flow and deposition on the print bed. This increases the bond between the layers of the printed structure, resulting in higher mechanical properties. PLA, ABS, and PETG filaments are the most commonly used materials in 3D printers using FFF technology [
18,
19]. In addition, functional studies can be carried out with engineering filaments such as Polypropylene (PP), Polyamide (PA), TPU, TPE, and ASA. It is also possible to print end-use products from carbon-fiber-added PA, PET, glass-fiber-added PolyPropylene, and 316L steel filaments [
20,
21]. The ABS material preferred in this study has many advantages. These include high-impact resistance, low density, high-temperature resistance, chemical resistance, good surface quality, low weight, easy formability, and high strength. ABS material is also a material that can be easily processed [
22,
23]. Therefore, ABS material can be shaped using many different processing methods, such as injection molding, extrusion, vacuum forming, and laser cutting.
In the literature, the effect of printing nozzle temperature changes on parts manufactured with ABS material has not been adequately investigated [
24,
25]. In current studies, PLA-type plastic material is preferred. Freitas and Pegado aimed to examine the effect of nozzle temperature change on the dimensional and mechanical properties of the sample produced with low-density PLA material [
26]. They stated that this material can be offered as an alternative to foam and balsa, which are the main components of the structural matrix of unmanned aerial vehicles. As a result of experimental studies, they observed that temperature change affected the mechanical properties of the samples. Elhattab et al. developed and analyzed 3D-printed structures based on a well-known composite, known as Tricalcium Phosphate (TCP)-PLA [
27]. They investigated the physicochemical properties of the material they developed in house. They then investigated the effect of FFF-based nozzle temperatures of 200 °C, 210 °C, 220 °C, and 230 °C on the crystallinity and rheological and mechanical properties of the composite. Rheological studies were carried out in the same temperature range as used in the actual FFF process, and the results showed an improvement in rheological properties at higher nozzle temperatures. Overall, the results confirmed that TCP-PLA filaments can be made in house, and optimization of nozzle temperature is essential to develop 3D-printed composite parts with suitable mechanical properties. Magri et al. investigated the effect of printing temperature on the mechanical and structural properties of parts. Poly-(phenylene sulfide) (PPS) was chosen as the material because of its mechanical performance [
28]. The results showed that a printing temperature of 340 °C produced parts with the highest tensile properties, with a degree of crystallinity superior to as-received PPS. Kartal and Kaptan examined the effects of annealing temperature and time on the mechanical properties of PLA plastics produced with a 3D printer [
29]. PLA samples were annealed at 70 °C, 85 °C, and 100 °C for 30, 60, and 90 min. As a result of the study, it was shown that the annealing process had a significant effect on the mechanical properties of PLA plastics. In addition, the results provide an important method for optimizing the mechanical properties of materials produced with 3D printing technology. It is seen that the mechanical properties of the final component produced by additive manufacturing are highly affected by the nozzle temperature.
This study investigated the relationship between nozzle temperature and the dimensional and mechanical properties of samples prepared by FFF, one of the AM methods. The samples were fabricated with ABS material at nozzle temperatures of 220 °C, 230 °C, 240 °C, 250 °C, 260 °C, and 270 °C. The temperature range was determined according to the nozzle temperature recommended by the manufacturer. Tensile tests and hardness tests were applied to the samples produced according to ISO standards. ANOVA was applied to examine the effect of temperature change on the findings obtained as a result of the experimental study. The results showed that the nozzle temperature significantly affected both the mechanical strength and dimensional properties of the samples.
2. Materials and Methods
2.1. Filament Material
Additive manufacturing can be performed using thermoplastic materials in fused filament fabrication (FFF)-type 3D printers. The most commonly used filament materials are polylactic acid (PLA), acrylonitrile butadiene styrene (ABS), thermoplastic polyurethane (TPU), polyethylene terephthalate glycol (PETG), and nylon; many other special filament types are used. These vary depending on the desired quality, strength, and thermal resistance. In this study, ABS, one of the polymers commonly used in the FFF method, was used in the production of the samples. ABS filaments are preferred in many applications, with features such as high strength, low density, and good temperature resistance. The filament was fabricated by the Zaxe company (Istanbul, Türkiye). The properties of ABS filament, as given by the company, are specified in
Table 1.
2.2. Three-Dimensional Printing Process
Samples must be modeled in 3D before moving on to the fabrication process. The solid model of the tensile test specimens was designed using SolidWorks 2023 software. Next, the model was exported in standard triangle language (STL) format. The X Desktop slicing program was used to convert this format into a language the printer could understand. Here, the fixed and variable printing parameters required for the samples were determined. Layer thickness (0.15 mm), infill density (80%), infill pattern (lines), table temperature (90 °C), and wall thickness (3 mm) are the fixed parameters. The other parameter chosen as a constant in the fabrication of samples is the printing orientation. All parts are fabricated in the XY plane.
Since the effect of nozzle temperature on the samples was investigated, temperature was entered as a variable parameter. The nozzle temperature was varied between 220 and 270 °C, depending on the properties of the ABS filament. The program creates a file in G code format at the end of the slicing process. Finally, this code is transferred to the 3D printer via USB, and it is ready for printing. The most important feature of this printer is that it can produce products using many polymer materials.
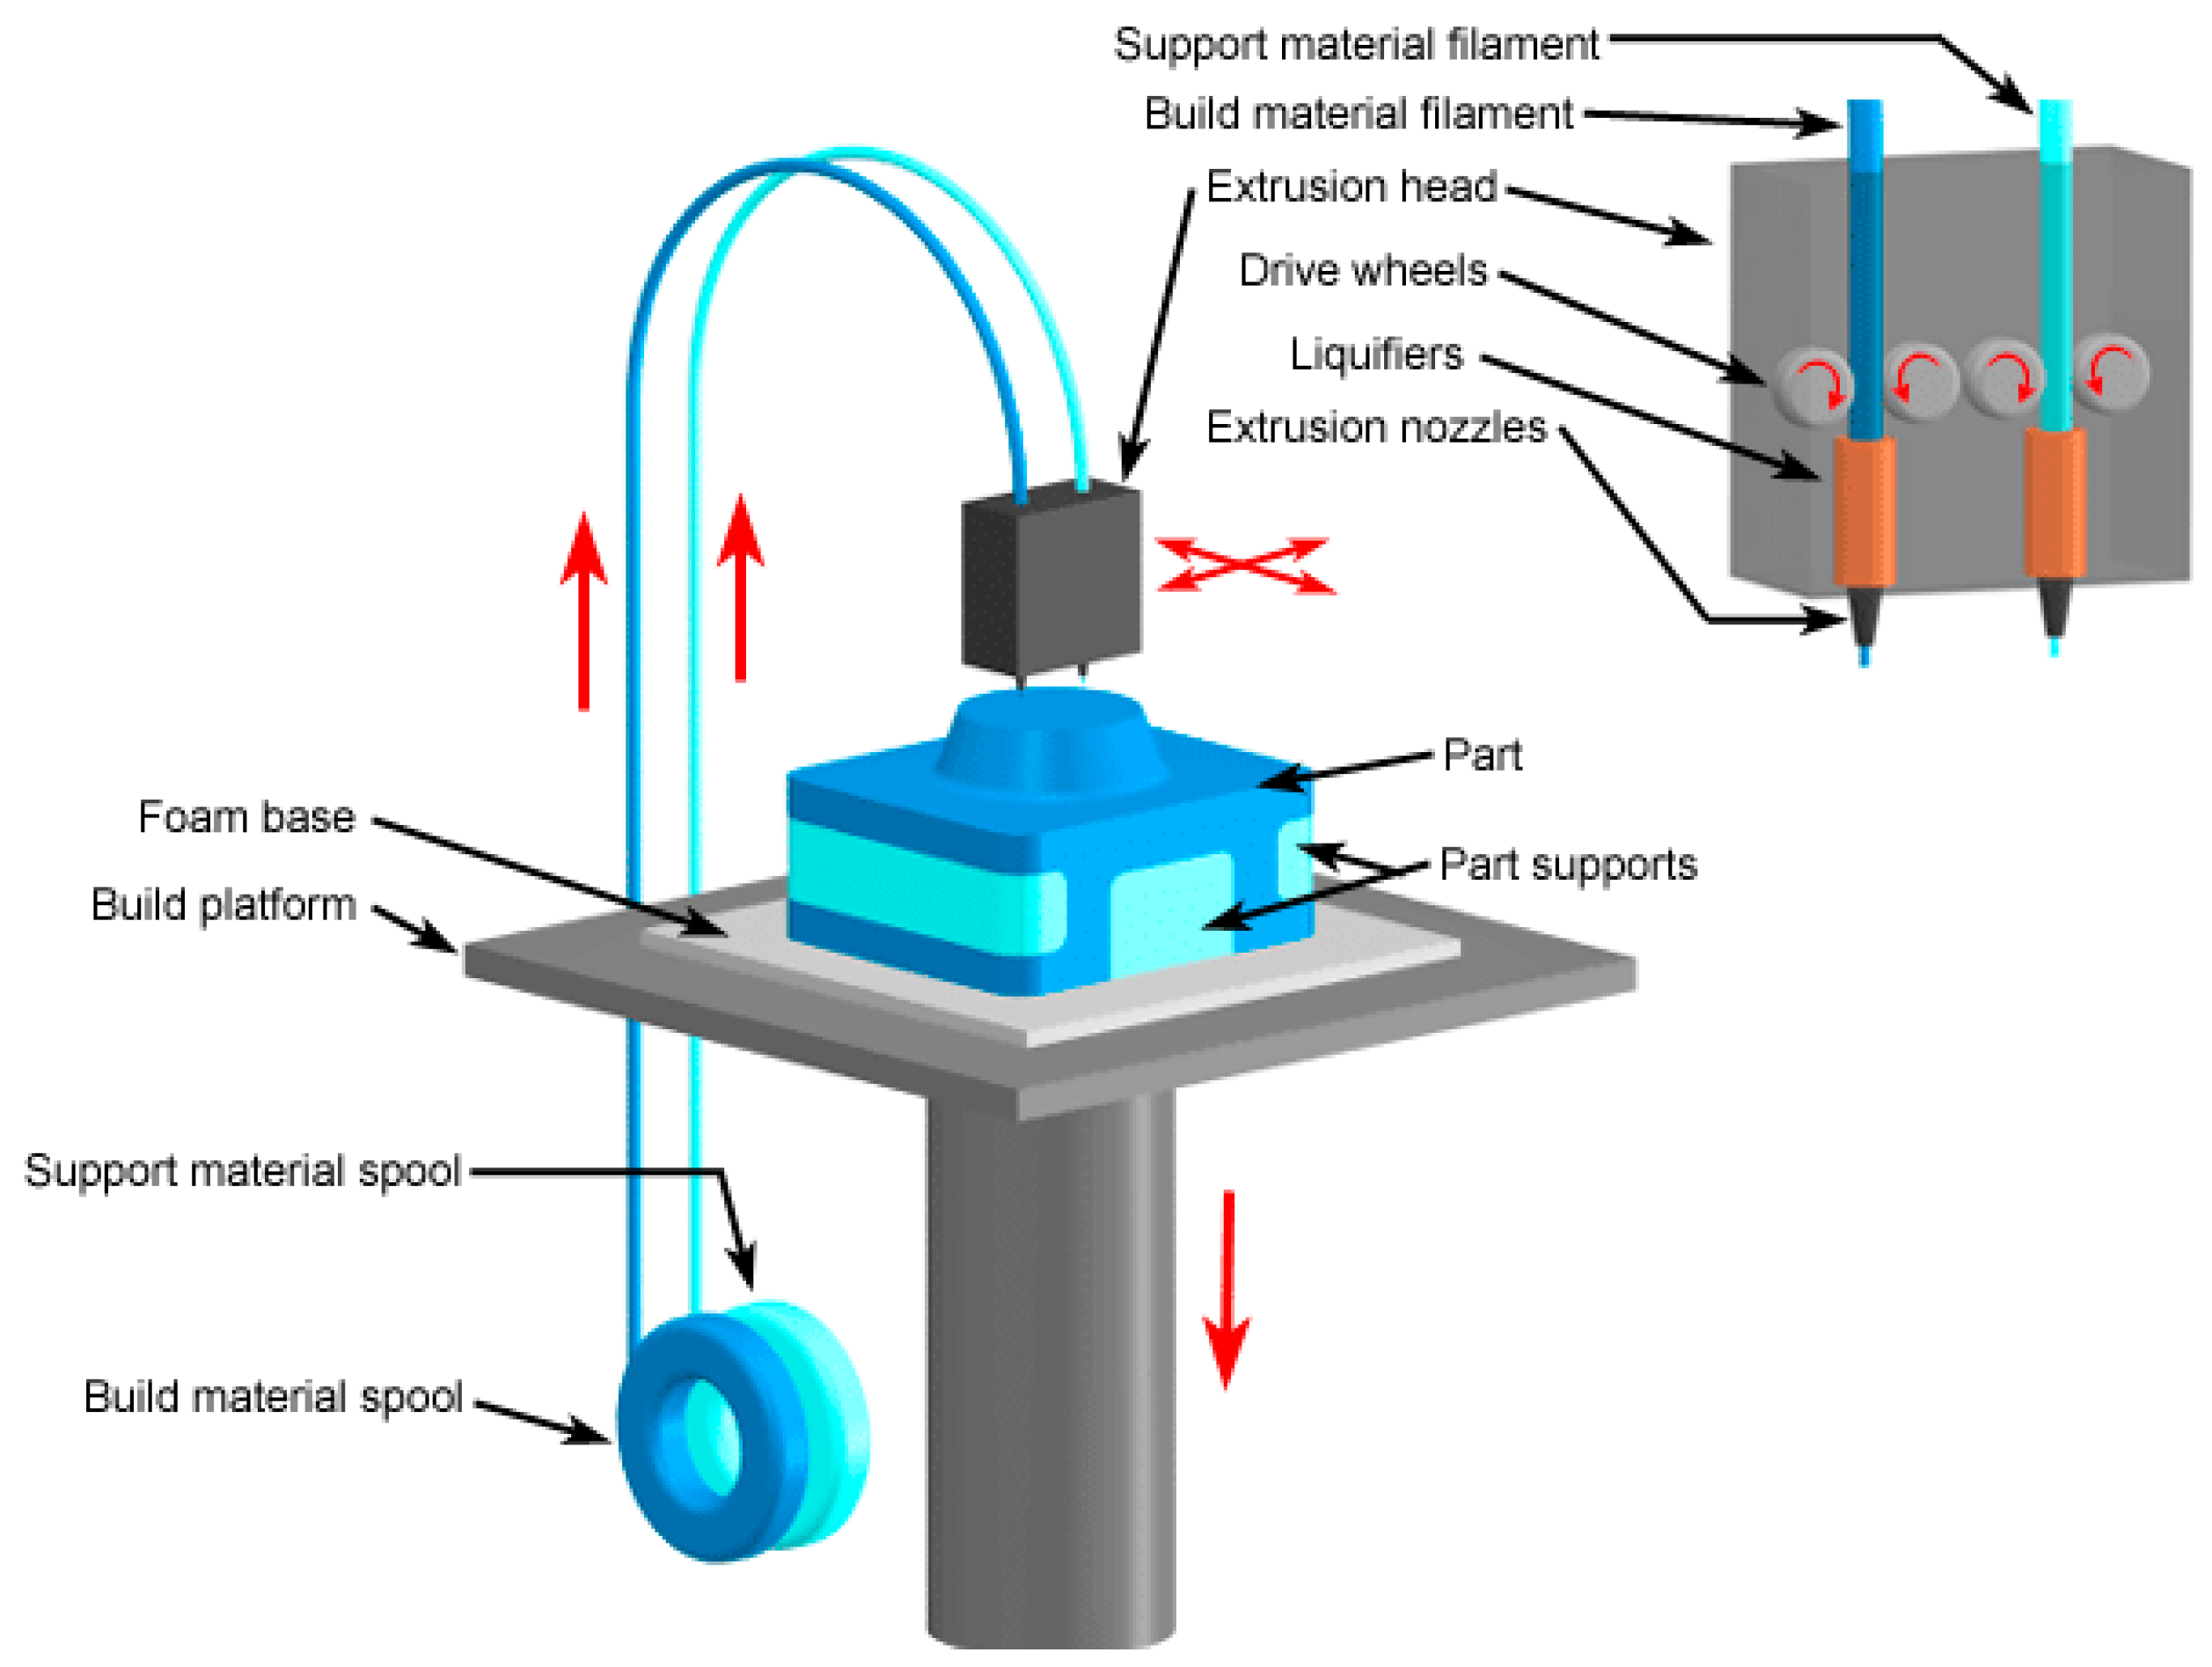
FFF is a technology frequently used in 3D printers. Machines using this technology use thermoplastic material to create three-dimensional objects. FFF is suitable for both professional and personal use. The FFF process begins by melting a filament or plastic wire in a thermal print head. This head follows a specific pattern and thus applies the melted plastic material layer by layer onto the surface. These layers stick together and harden after cooling. This process is repeated layer by layer until the entire design is created (
Figure 1).
2.3. Experimental Procedure
In this study, the factor examined among the printing parameters is nozzle temperature. A total of thirty-six tensile test samples were fabricated in groups of six according to the determined factors. The printing nozzle temperatures ranged from 220 to 270 °C. If the nozzle temperature changes in FFF fabrication, the printing speed must also change to ensure good mechanical properties. Low printing speed is desired at high nozzle temperatures [
30,
31,
32,
33]. Thus, samples were fabricated with printing speeds of 90, 80, 70, 60, 50, and 40 mm/s. The table containing the observed parameters to be used in the ANOVA is as follows (
Table 2).
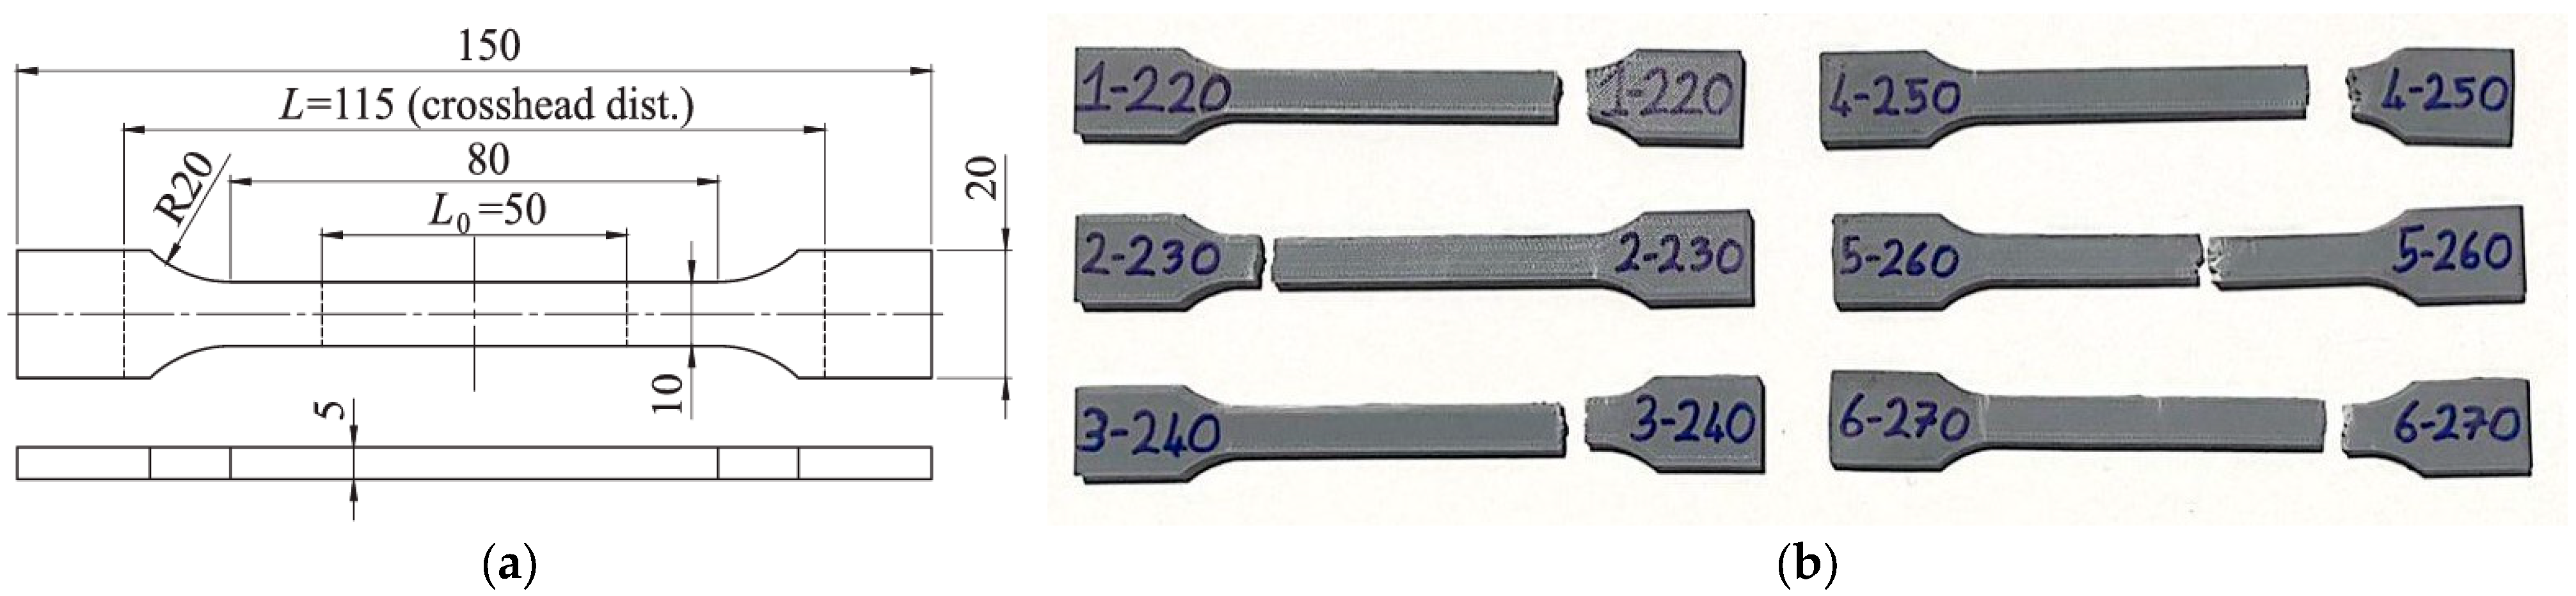
The ISO527–type1A standard [
34] was preferred for sizing tensile test samples. The technical drawing and dimensions of the samples are given in
Figure 2a. The samples prepared according to this standard have dimensions of 150 mm × 20 mm × 5 mm for length, width, and thickness. Tensile test studies were performed on a 50 kN force transducer capacity machine (AGS-X, Shimadzu, Kyoto, Japan) using the ISO527–type1A standard. The device has a reading range of ±0.1% precision between 50 kN and 50 N according to ISO 7500/1 [
35], ASTM E4 [
36], and DIN51221 [
37] standards. The test speed range is 0.0005 mm/min–1000 mm/min. Experimental studies were performed at a drawing speed of 0.8 mm/s. Ultimate tensile strength, strain, and force data measured during the experiment were recorded with the software. The image of the samples as a result of the tensile test is given in
Figure 2b.
During the tensile test, the ABS specimen was prepared in a rectangular shape and placed into the testing machine. The loading direction was determined parallel to the length of the material (i.e., parallel to the long axis of the specimen). This orientation is crucial for assessing the material’s strength and flexibility based on stress and deformation across its cross-sectional area. Throughout the test, a constant load was applied to the material at a fixed rate, while changes in elongation and force of the specimen were recorded.
The measurements necessary to observe the dimensional change of all fabricated samples were made with a caliper. Length (L), width (W), and thickness (T) parameters of the samples were measured. In addition, the mass of the samples was measured with the help of precision scales. Finally, statistical analysis was performed with the ANOVA method to examine the effect of the nozzle temperature parameter on these features.
2.4. The Analysis of Variance
The ANOVA test is a statistical analysis method used to compare means between at least three groups. In the analysis phase, there must be a categorical variable that has at least three groups and whose observations are independent. There also needs to be a quantitative variable consisting of numerical data [
38,
39]. Although there are different ANOVA tests, the one-way ANOVA test was applied, since evaluation was made on a single factor in this study. One-way ANOVA is a tool used to test whether there is a statistically significant difference between the means of independent groups.
Table 3 specifies the different factors, α, and n observations at each level for the specified factor. Levels of the factor are sometimes referred to as treatments. In this study, there are six observations or levels for each factor, as indicated in
Table 2. The runs are performed in random order. In inferential statistics, the null hypothesis is a general statement that assumes that there is nothing beyond what is expected, for example, that there is no relationship between groups or variables or that there is no difference between two measured phenomena. Therefore, changing the factor treatment does not affect the mean response if the null hypothesis is confirmed. We can describe the observations in
Table 3 with a linear statistical model, as specified in Equation (1):
Factor effects are generally defined as deviations from the overall mean. Thus, the effect of τ
i can be written as zero. Equation (1) can be expressed as follows:
The ANOVA test examines the variability of samples in two ways. These are the variance corresponding to each transaction and the overall variance. Thus, y
i is the representation of the total observations within the ith factor, and y
i is the representation of the mean of the observations within the ith factor.
Overall,
represents the total of all observations,
, and
is the average of all observations.
The sum of squares identity is specified below in Equation (5). Thus, the total sum of squares is the sum of squares of the treatments and the sum of squares of the errors:
Similarly, the total degrees of freedom are the sum of the degrees of freedom (DF) of factors and errors:
The mean square of the factors is given as follows:
Finally, the division between the mean squares results in the calculated F. The appropriate test statistic is as specified below. The critical F value is calculated to determine the significance of the results. This value is calculated from the significance function and degrees of freedom in the F tables. Since the confidence interval in this study is 95%, the significance function is 0.05. If the calculated F is greater than the critical F, the null hypothesis is rejected. This means that the results of the study are statistically significant.
We can also find a
p-value for this test statistic, as specified below. If the
p-value is small (<0.05), it indicates a piece of strong evidence against the null hypothesis. As a result, the null hypothesis is rejected. Thus, for a hypothesis with a
p-value less than 0.05, the null hypothesis is rejected, and the alternative hypothesis is accepted. This means that the results of the study are statistically significant.
The ANOVA is summarized in
Table 4. This table contains the source of variation, sum of squares (SS), degrees of freedom (DF), mean square (MS), F-value, critical F, and
p-value. In this study, there is one factor (nozzle temperature) with six levels: 220 °C, 230 °C, 240 °C, 250 °C, 260 °C, and 270 °C. Six observations were made for each level.
3. Results and Discussion
3.1. Evaluation of Mass
The findings obtained as a result of the experimental studies were evaluated using the ANOVA method in
Section 2.3. Average mass values related to nozzle temperature are given in
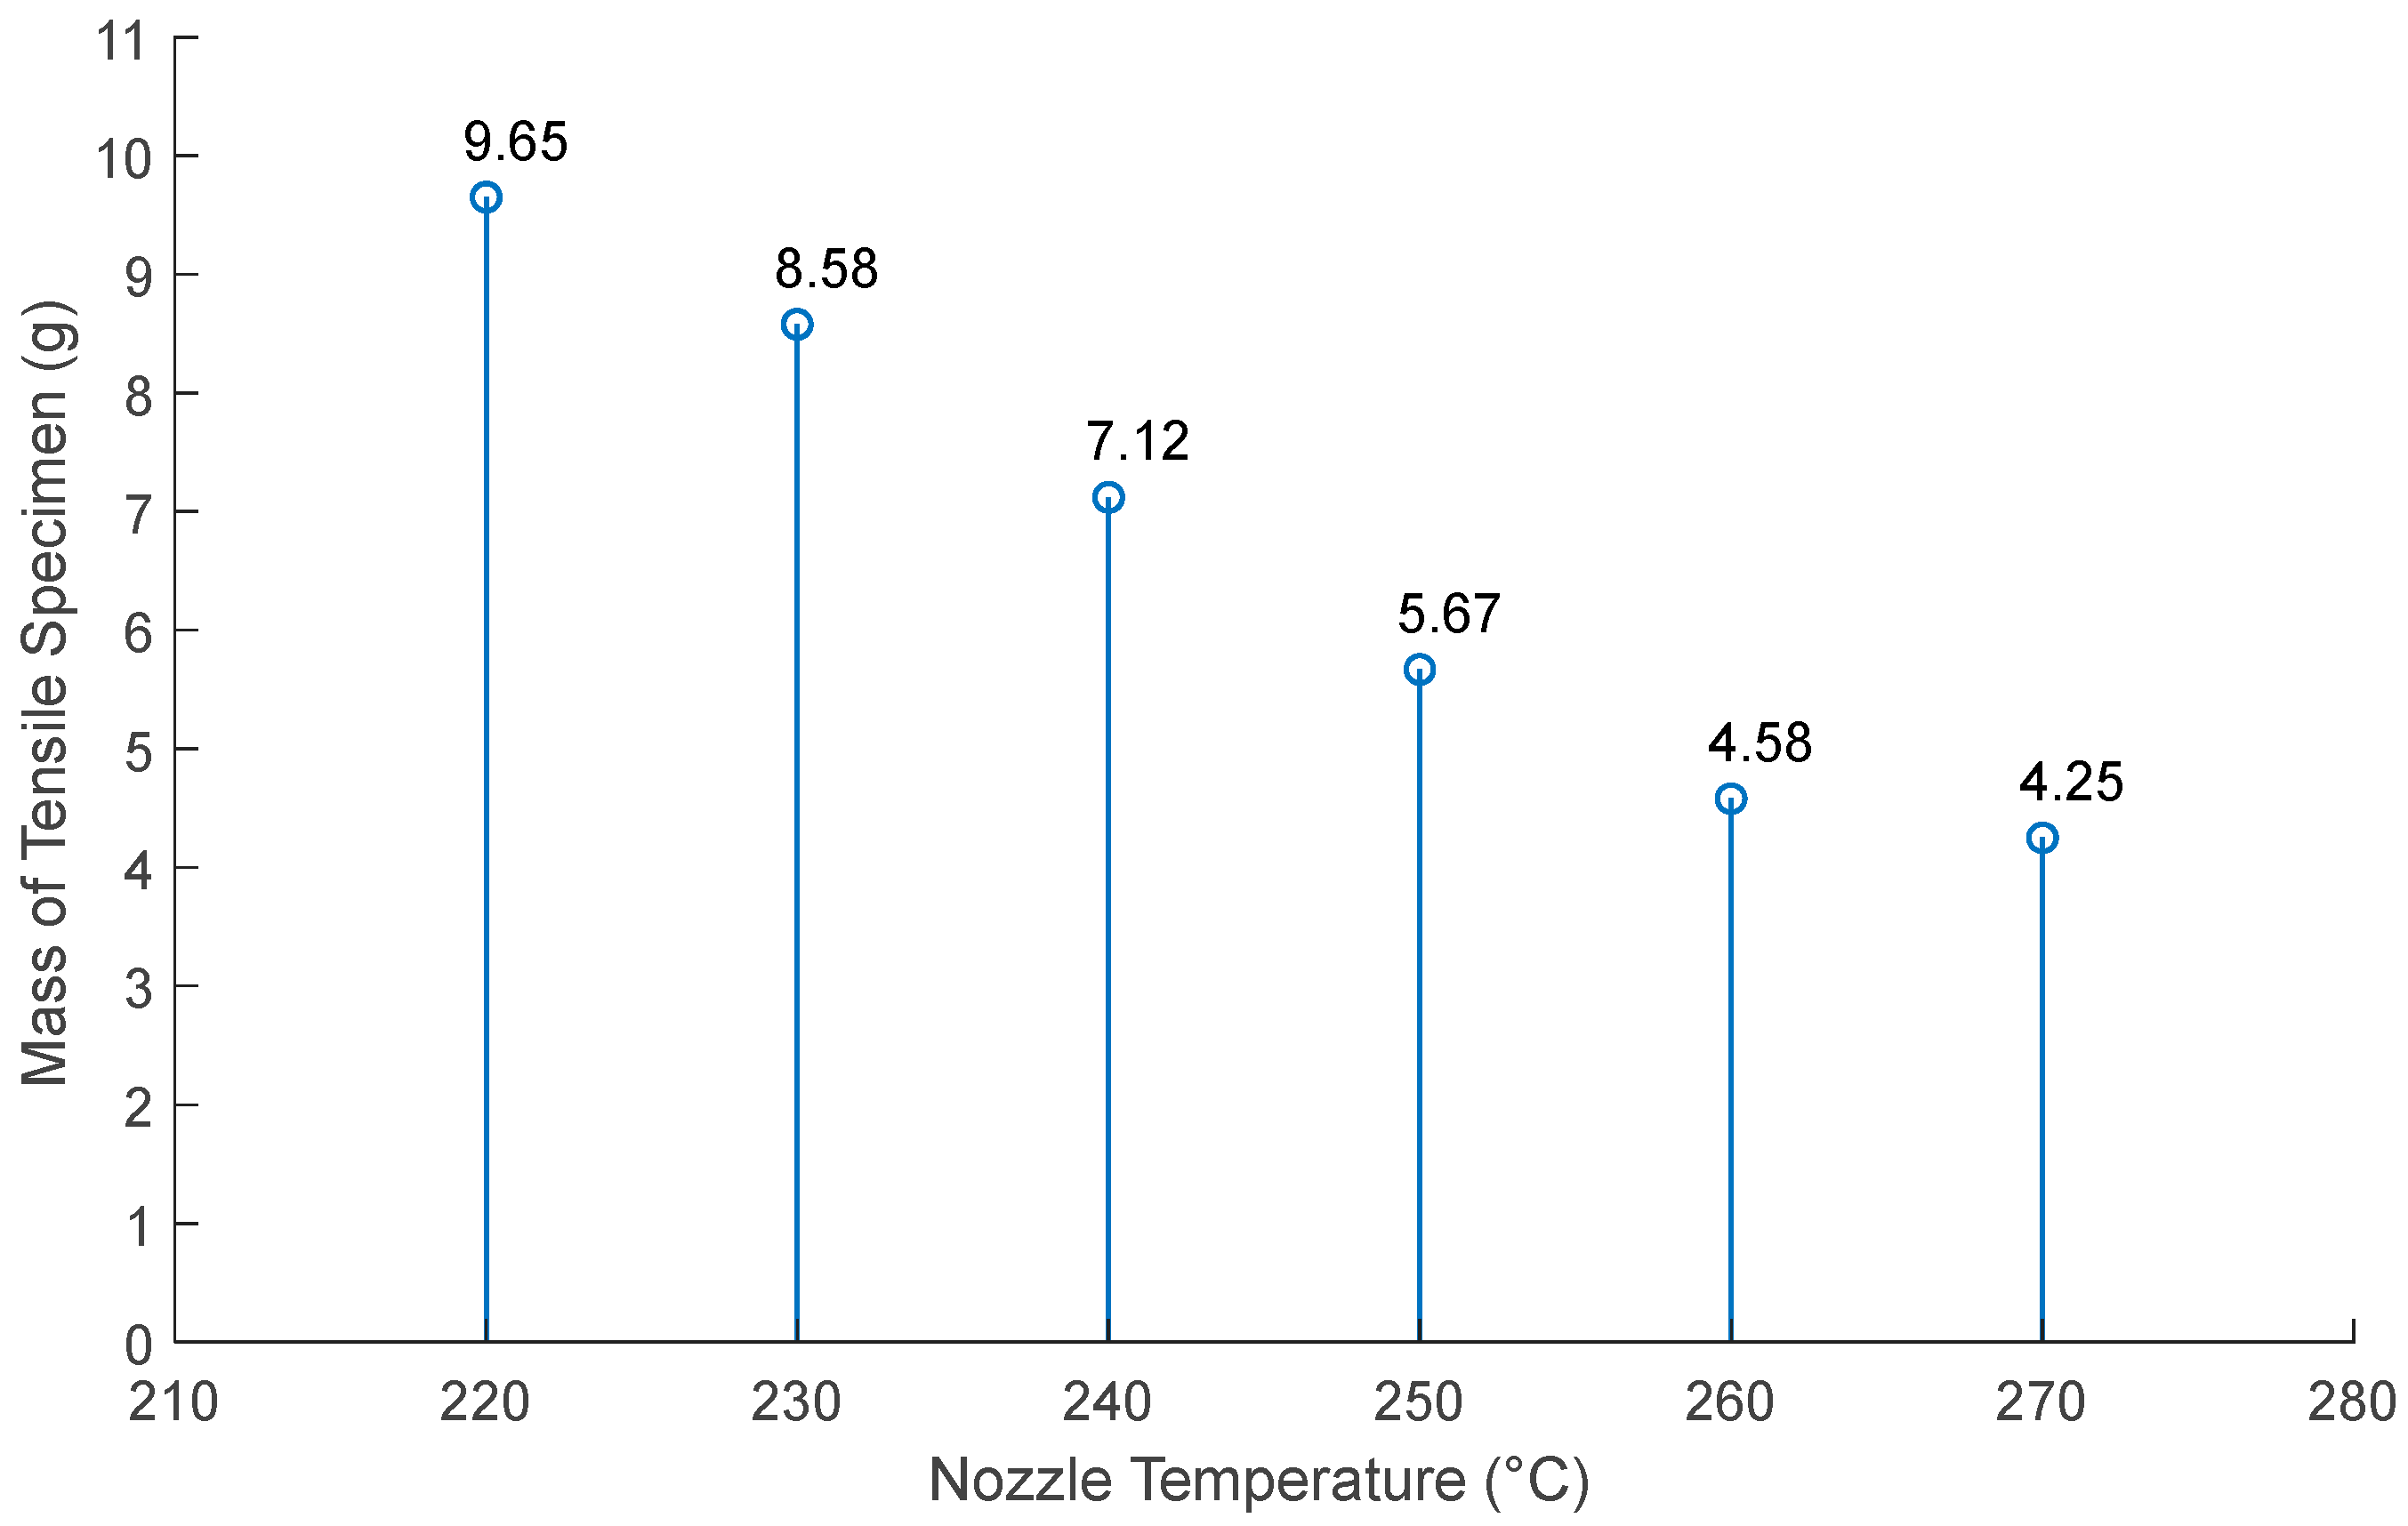
Figure 3. The mass of the tensile samples decreased with increasing temperature. The largest mass decrease appeared when the nozzle temperature increased from 240 to 250 °C. This result shows that the optimum operating temperature for the ABS sample is in this temperature range. After 240 °C, ruptures occurred on the material surface. A 55.95% decrease in the mass of the samples was observed between the lowest and highest temperature values.
The ANOVA result, which determines the mass change in the samples against the nozzle temperature, is given in
Table 5. The fact that the calculated F value (3049.628) is much higher than the critical F value (2.53) and the
p value is much smaller than 0.05 makes the results significant. We should reject the null hypothesis of equality of means.
AM is a manufacturing method used to create 3D objects layer by layer. In this process, thermoplastic or similar materials are melted and brought together in layers through a nozzle. Nozzle temperature directly affects the fluidity and adhesion properties of the material. A higher nozzle temperature can result in the material flowing more easily and providing a better bond between layers. However, increasing the nozzle temperature may cause thermal degradation of the material after a certain point. This thermal degradation can lead to changes in the chemical structures of the material and, consequently, a decrease in the mass of the parts. In particular, this effect may be more pronounced in thermally sensitive materials. Therefore, a decrease in the mass of the parts can be observed as the nozzle temperature increases in AM.
The mass change in the tensile test samples was not random; changing the nozzle temperature parameter affected the mass. Porous polymers are defined as polymer materials with closed spaces (pores or cells) filled with air or gas, or with dispersed gas inside. Increasing the temperature in this porous structure results in larger cells. The extruded thread expands with the increase of cells. As a result, the mass of the samples decreases with increasing nozzle temperature.
3.2. Evaluation of Ultimate Tensile Strength
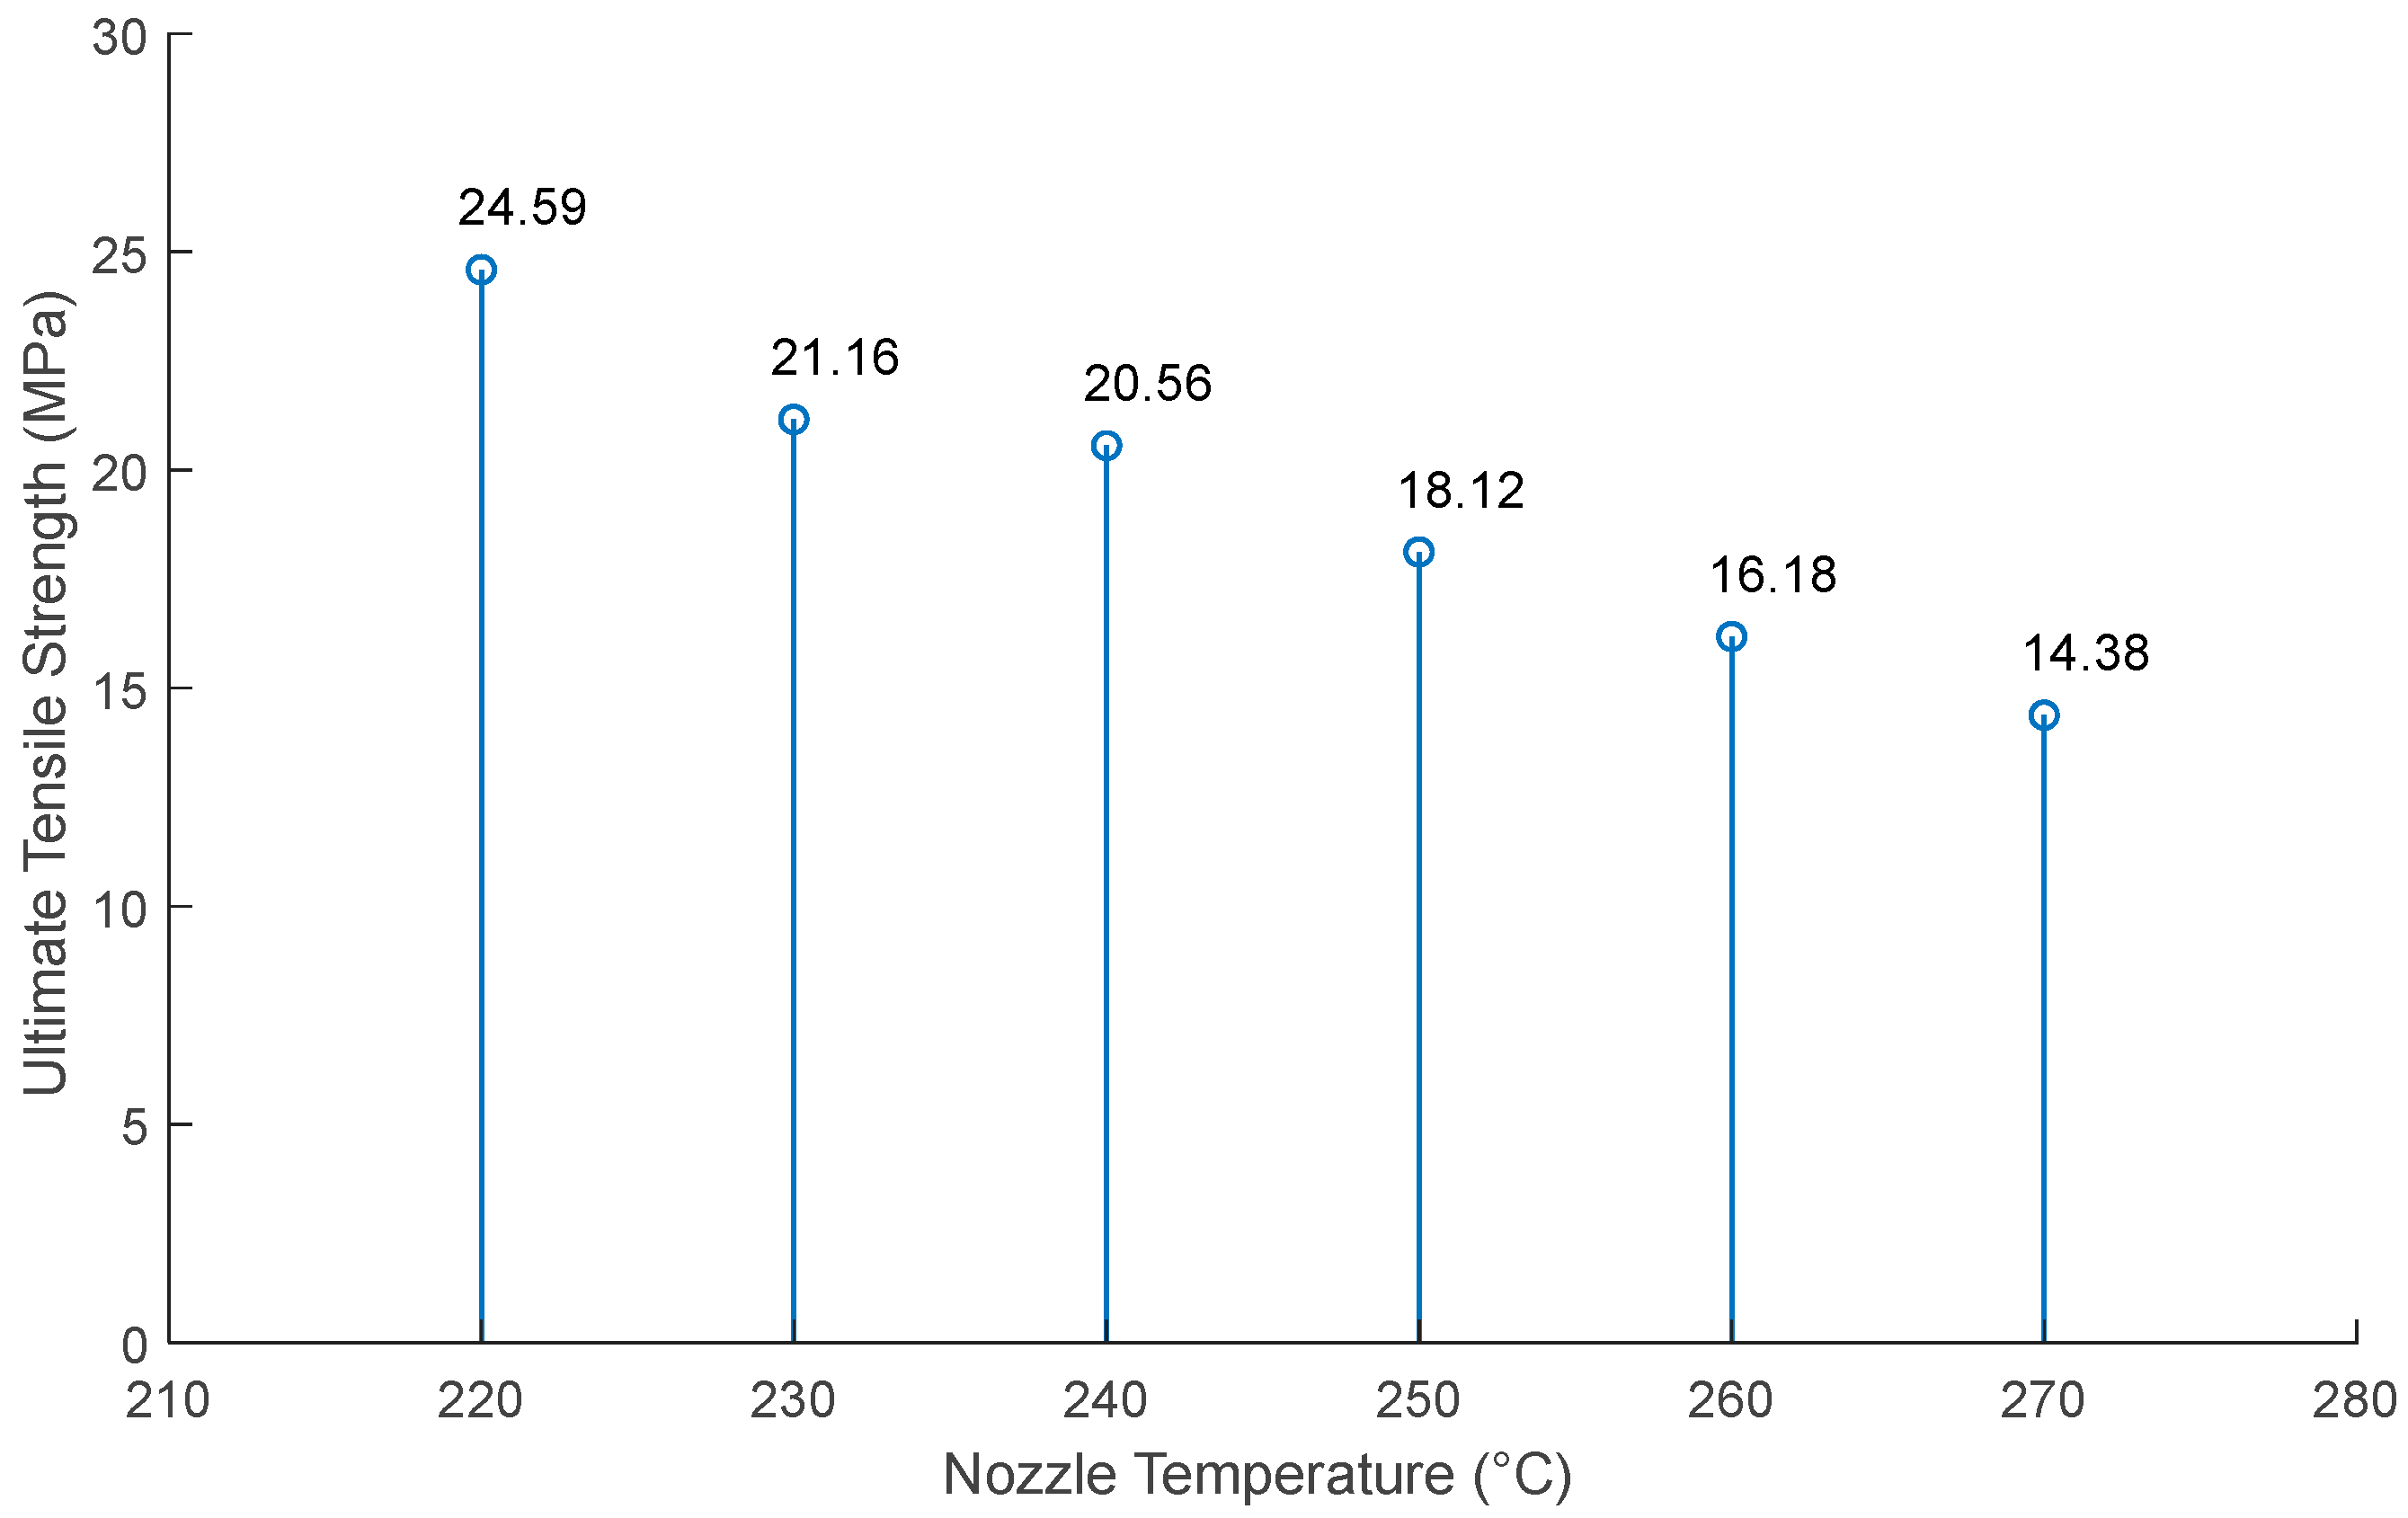
The strength values of six tensile test samples related to nozzle temperature are given in
Figure 4. Average ultimate tensile strength (UTS) values were calculated at each temperature value. A significant decrease in UTS values was detected with increasing nozzle temperature. The largest mass decrease appeared when the nozzle temperature increased from 240 to 250 °C. Although the mechanical strength values of the samples tend to decrease with increasing temperature, the rate of decrease gradually lessens after 250 °C. There was a 41.52% decrease in the UTS value between the lowest and highest nozzle temperature values.
The results of the ANOVA test in which ultimate tensile strength data were examined are given in
Table 6. It is seen that the change in nozzle temperature is a factor affecting the tensile strength data in the F and
p values. The porous structure of ABS samples increases with increasing temperature. This situation causes a decrease in tensile strength values. The decrease in density at high temperatures indicates the decrease in tensile strength at these temperatures.
3.3. Evaluation of Dimensions
Finally, the effect of nozzle temperature change on the dimensional properties of the samples was examined. After fabrication was carried out with the FFF technique, length, width, and thickness measurements of 36 samples were made. The average error amounts resulting from these measurements are given in
Figure 5.
There is a decrease in length error values after 230 °C (
Figure 5). The real value is approached at the 270 °C nozzle temperature. The largest error difference was calculated as 0.1 mm when the temperature increased from 220 °C to 230 °C. The highest error compared to the actual value was observed at 230 °C. ANOVA test results regarding length data are given in
Table 7. As a result, nozzle temperature affects the dimensional length of the sample.
When the average error amounts regarding the width of the samples are examined, it is seen that they approach the nominal value as the nozzle temperature increases (
Figure 5). The highest error amount was seen at 220 °C, while the lowest error amount was seen at 270 °C. The greatest reduction in the mean error was observed when the temperature was increased from 250 to 260 °C, with a drop of 50%. ANOVA test results regarding width data are given in
Table 8. According to these results, the nozzle temperature change significantly affects the body’s width.
When the average error amounts regarding the thickness of the samples are examined, there is a deviation from the nominal value as the nozzle temperature increases (
Figure 5). The lowest error amount was calculated as 0.04 mm at 220 °C. As the nozzle temperature increased, the error amount increased to 0.19 mm. The greatest growth occurs between the temperature increase of 230 °C and 240 °C, with an increase of 50% in the mean error. ANOVA test results regarding thickness data are given in
Table 9. Thickness is the factor with the highest F value among the dimensional parameters. Since this value is well above the critical F value, the significance of the results is high. As a result, nozzle temperature change significantly affects the thickness of the samples.
3.4. Hardness Measurement Results
In this section, hardness measurements of the fabricated tensile test samples were made. Hardness measurements of the test sample were made with the Analog Shore meter device in SHORE D. The Shore meter device is suitable for measuring hard rubber, synthetic materials, thermoplastics, vinyl sheets, cellulose acetates, and MDF. Hardness measurements were made from five different points on the top and bottom surfaces of each sample, and calculations were made by taking the average values. The measured hardness values are given in
Table 10. It is seen that the increase in nozzle temperature reduces the hardness values of the ABS samples. This is because the void structure in the sample increases as the temperature increases. This void structure reduces the hardness of the sample. There is a 14.59% decrease in the subsurface hardness value between 220 °C and 270 °C. When the top and bottom zone hardness values are examined, it is seen that the bottom surface hardness is higher than the top surface hardness. It is thought that the adhesives applied to ensure the adhesion of the sample to the glass table in manufacturing with FFF cause the hardness of the bottom surfaces of the samples to increase.
In AM processes such as FF, where objects are built layer by layer, it is commonly observed that the lower layers of the printed object exhibit a greater degree of hardness compared to the upper layers. This phenomenon can be attributed to several factors beyond the adhesive theory. One significant factor is the cooling rate during the printing process. As each layer is deposited, it comes into contact with the build platform or the previously printed layer. This contact leads to rapid cooling of the material, particularly in the lower layers closest to the build platform. The rapid cooling rate promotes crystallization and densification of the material, resulting in increased hardness. Additionally, the compaction and compression forces exerted by the weight of the newly deposited layers on the lower layers can contribute to their increased hardness. These forces can cause molecular alignment and packing, enhancing the material’s mechanical properties. Furthermore, variations in the thermal history of different layers can influence their microstructure and mechanical properties. Lower layers experience longer exposure to elevated temperatures from the build platform, leading to different material behavior compared to upper layers. It is essential to consider these factors comprehensively when explaining the greater degree of hardness in the lower layers of printed objects. While adhesive theory plays a role, the cooling rate, compaction forces, and thermal history are equally significant in understanding this phenomenon.
3.5. Viscosity Behaviour Results
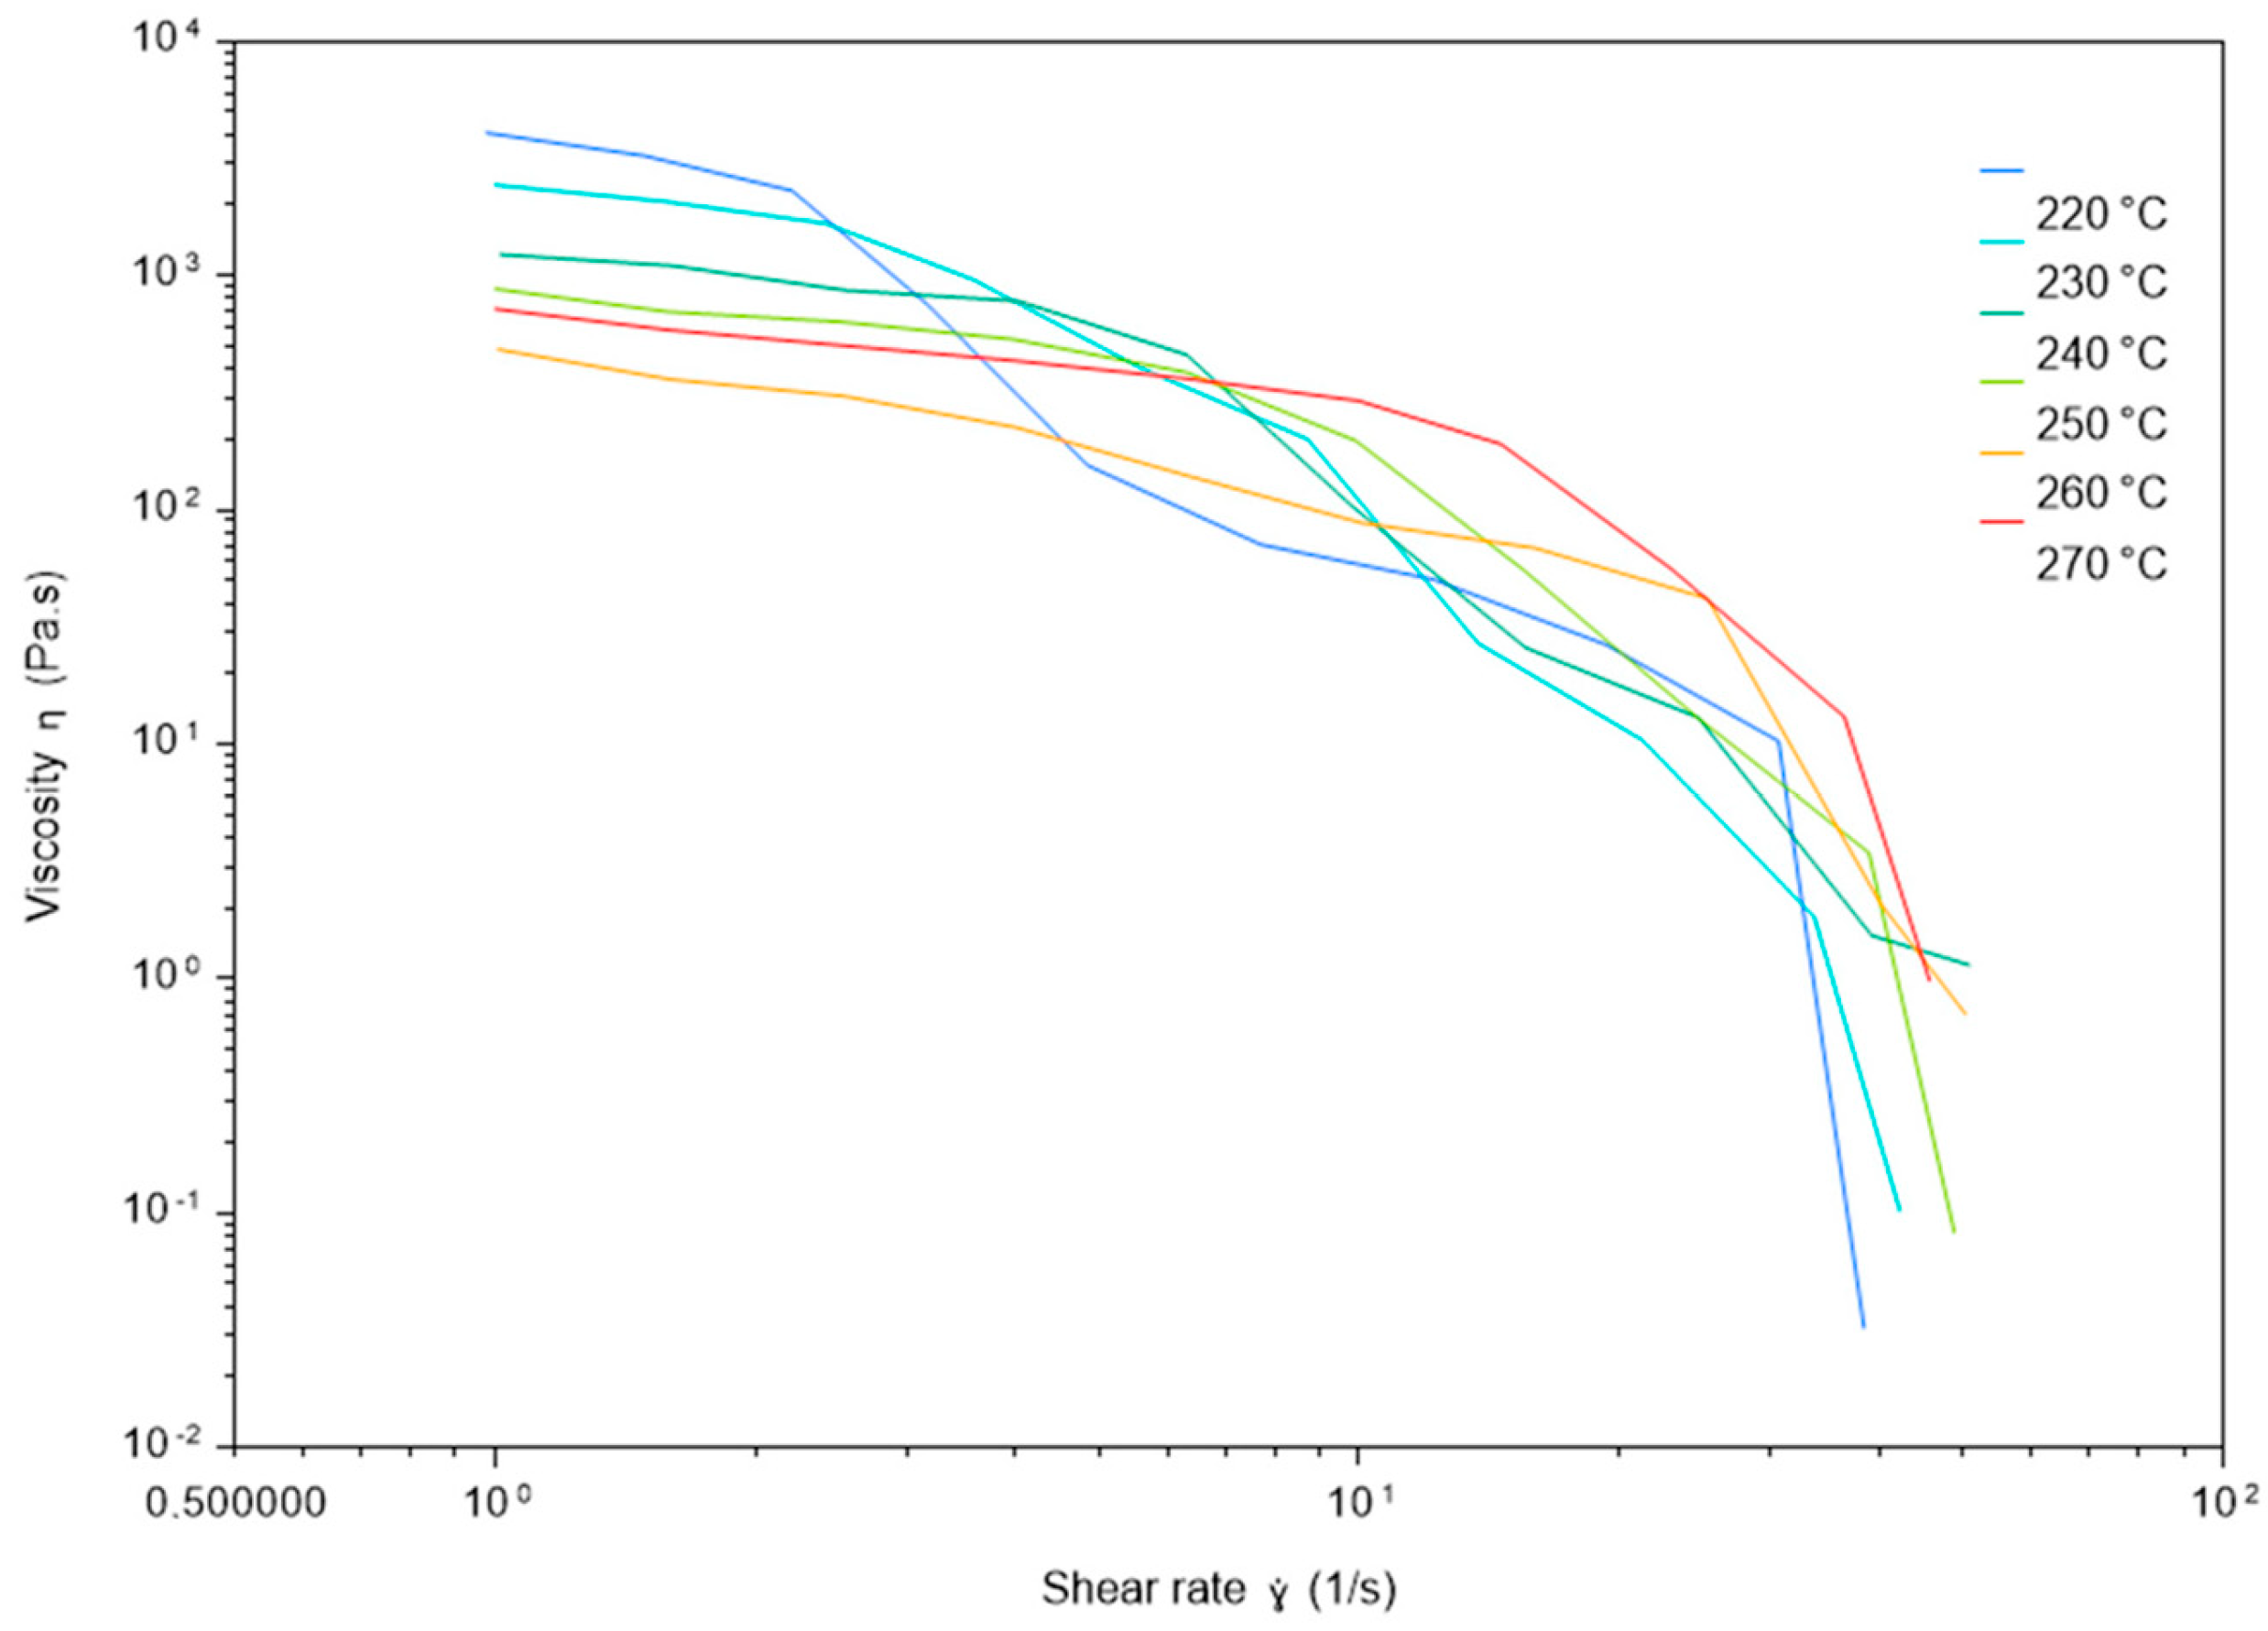
The viscosity properties of polymers are related to the behavior of the material against heat energy. Viscosity is related to temperature, pressure, flow rate, and molecular weights. However, the phase of the material is an important determinant. In our study, the thermal behavior of our material during processing at temperatures between 220 and 270 degrees was examined.
The viscosity of a fluid can be characterized by its behavior under constant shear rate and constant temperature conditions. This is particularly important in the study of rheology, which deals with the flow and deformation of materials, including liquids.
These are materials that do not comply with Newton’s law of viscosity and generally show viscosity change depending on the deformation rate or force. Especially in non-Newtonian materials such as polymers, the interaction of viscosity with heat is very important. Viscosity is determined by the constant shear rate and constant temperature parameters. Shear rate is related to how the layers in the material slide on one another. It can also provide information about the deformation of the material. Viscosity values at a constant shear rate and constant temperature are shown in
Figure 6.
The behavior of the material between 220 and 270 degrees was determined in the experimental study.
There is a linear decrease in viscosity because of the temperature increase from 220 to 260 degrees. However, an increase in viscosity is observed at 270 degrees. As the shear rate increases, the viscosity decreases. It has been determined that this decrease begins dramatically at 220 degrees and much earlier at other temperature values.
At 260 and 270 degrees, a more limited decrease in viscosity values was observed despite the increase in shear rate.
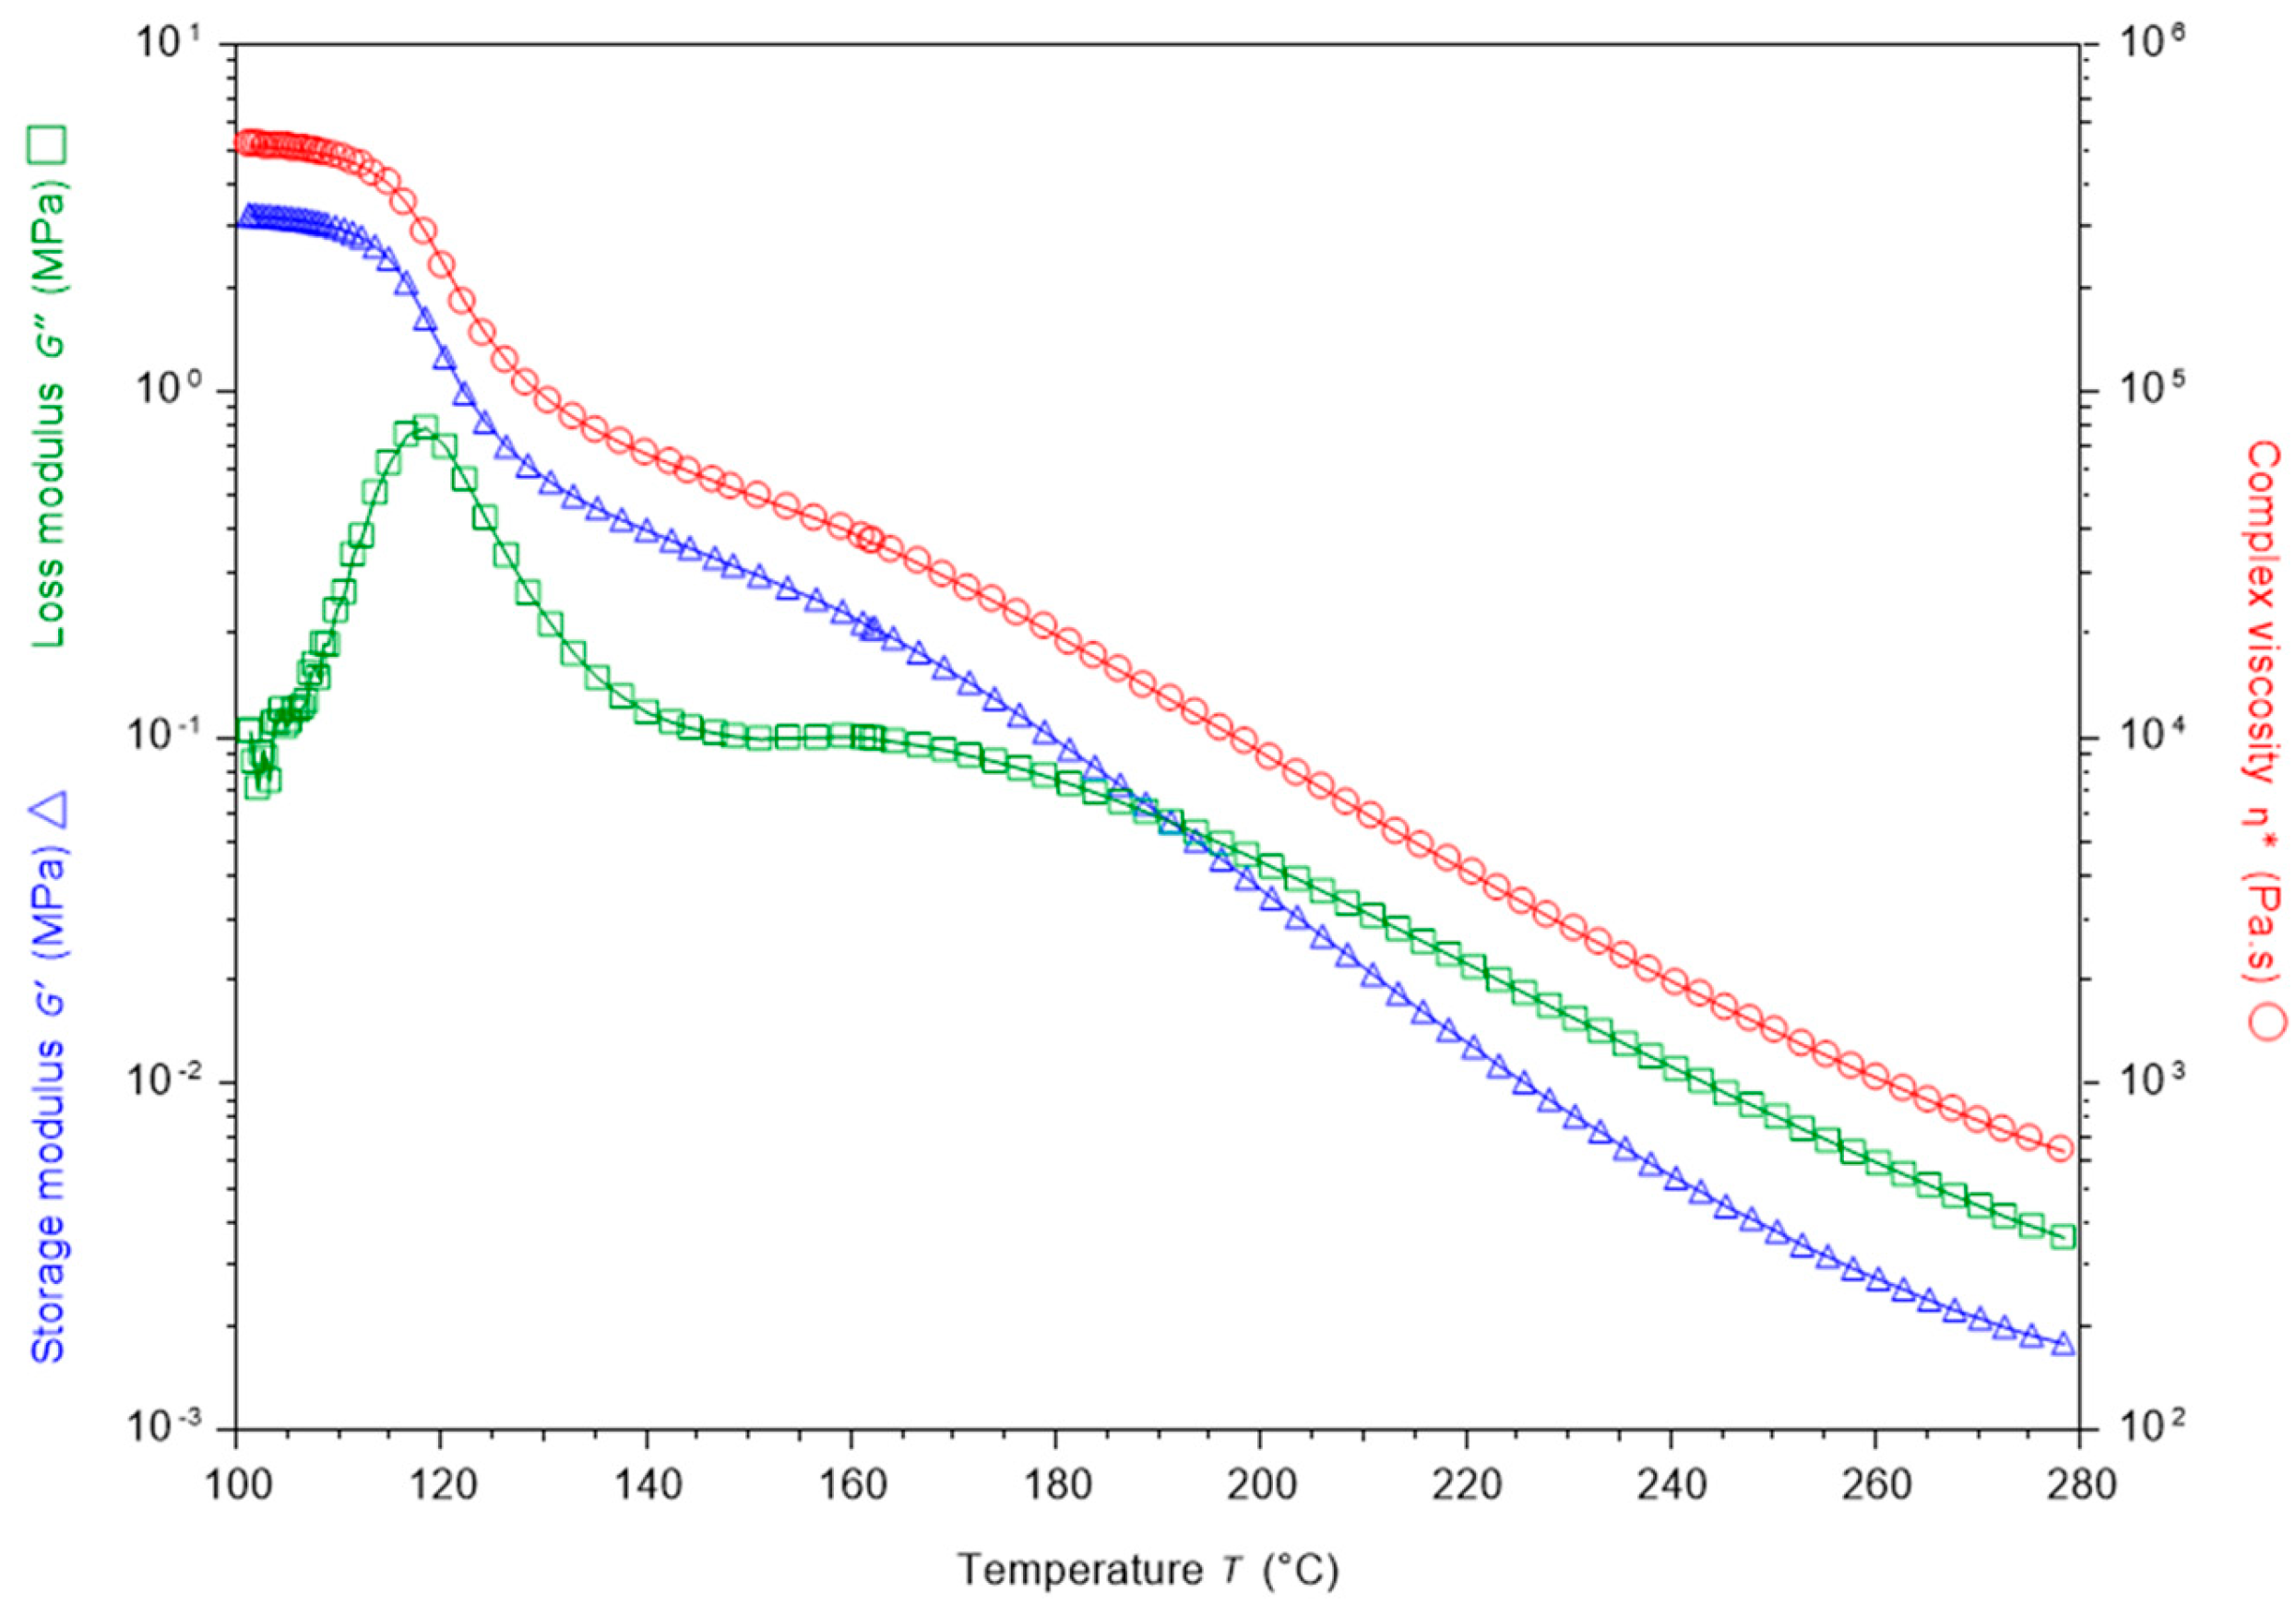
The storage modulus value provides important data in determining the relationship between the fluidity and deformation of materials.
Figure 7 shows the storage module data of the material. In the data obtained from the test results, a decrease in storage modulus values is observed due to the increase in temperature.
Loss modulus values were examined in the experiments to determine the energy lost by the material during deformation (
Figure 7). When the amount of energy lost by the material during deformation is observed, it is seen that the value increases at 100–120 degrees. Between 120 and 150 degrees, there is a dramatic decrease due to the increase in temperature. From this point onwards, a linear loss of value was detected with temperature increases up to 260 degrees.
Complex viscosity is an important parameter for evaluating the results obtained depending on the storage and loss modulus values. The complex viscosity value given in
Figure 7 decreases with increasing temperature.
3.6. Surface Analysis Results
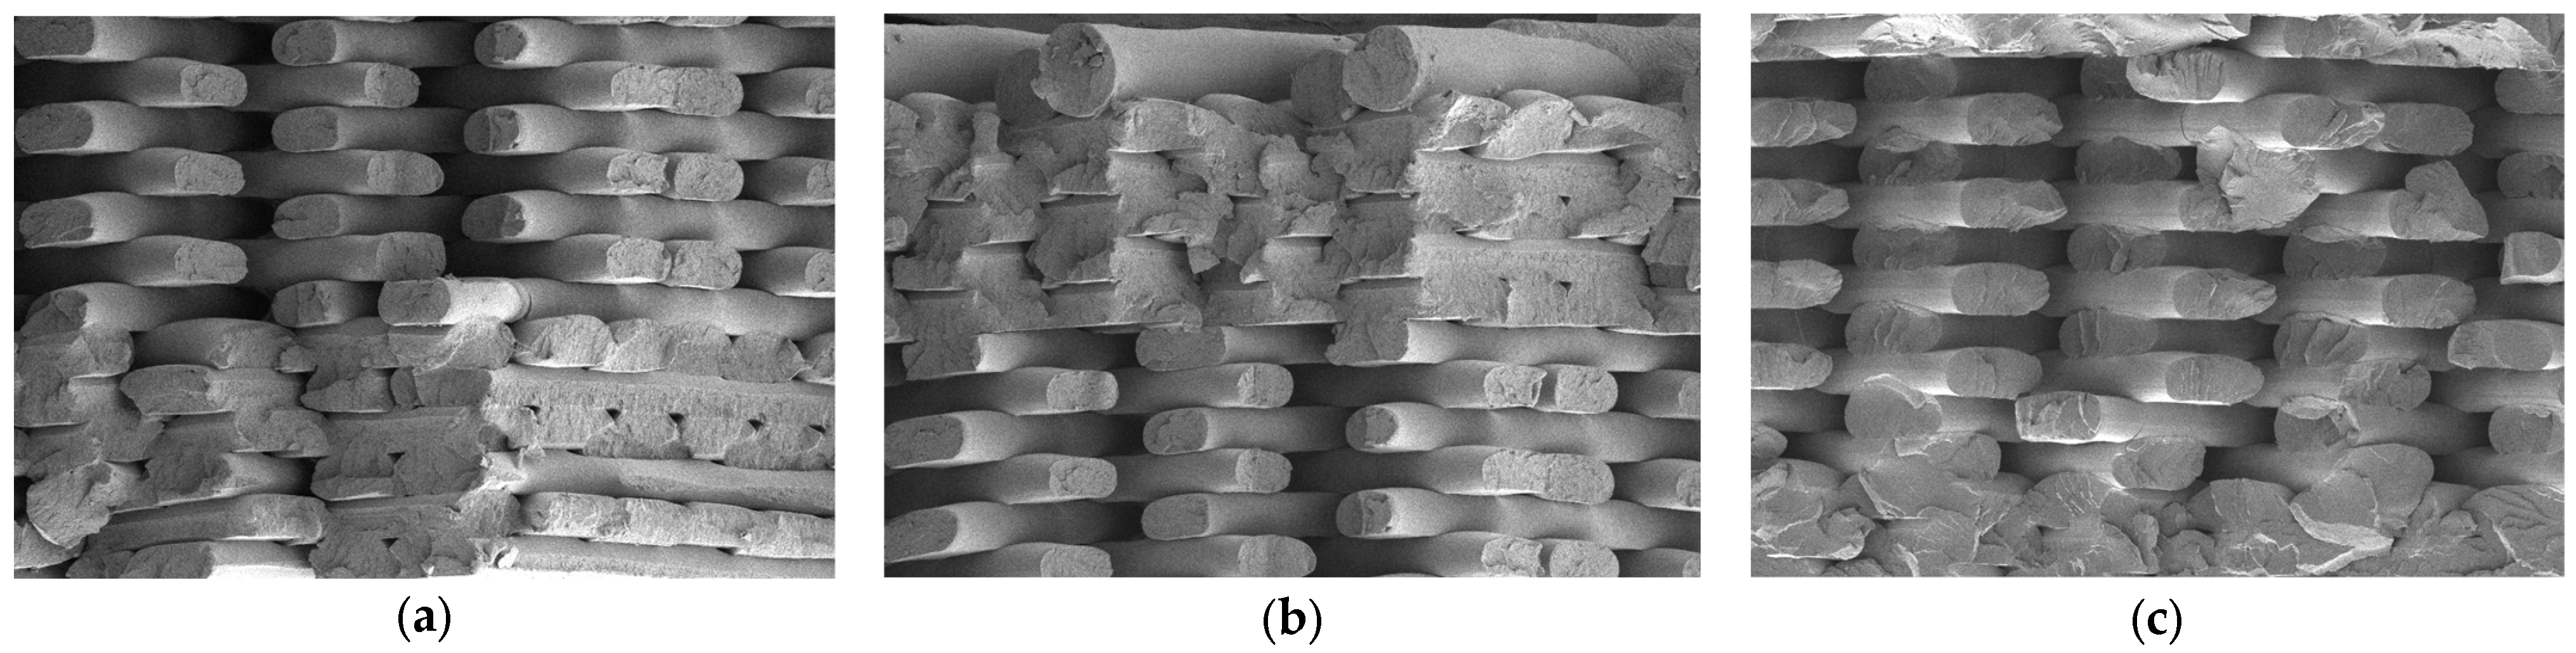
Surface image analysis was performed with a scanning electron microscope (SEM) device to examine the post-fracture surface morphology of tensile test samples fabricated with ABS materials at different temperatures. SEM is used to obtain information such as topography, structural properties, particle size, and shape of materials. After the tensile test was applied to ABS samples fabricated at temperatures of 220 °C, 240 °C, and 270 °C, images of the fractured areas of the samples were taken with the SEM device and are given in
Figure 8.
The results of the sample fabricated at low temperature (
Figure 8a) show that the material interface is better compared to the 240 °C and 270 °C samples. The number of voids is higher in each layer of sample fabricated at higher temperatures (
Figure 8c). As the sample heats up, its weight and strength decrease because of its large void structure. As a result, it is understood from the SEM images that the internal structure of the filling layer of the samples changes at high temperature. These images confirm the weight and strength loss of samples fabricated at high temperature.


