1. Introduction
The agricultural sector plays a crucial role globally, not just in terms of food production but also as a significant source of employment [
1]. Approximately one-quarter of the world’s labor force is employed in agriculture, a sector that has historically been the backbone of many economies, especially in low-to-middle-income countries, where it serves as the primary source of income for the majority of the population. This reliance on agriculture for livelihoods is a testament to its importance, even as the share of agricultural employment tends to decrease with a country’s economic development, shifting towards industry and service sectors [
1].
As of 2020, the number of people working in agriculture worldwide, including those in forestry and fishing, was estimated to be 874 million, marking a 17 percent decrease from 2000 [
2]. This decline is indicative of a global trend where agricultural employment is shifting due to various factors, including technological advancements, urbanization, and economic development. Despite this decline, agriculture remains the second largest employment sector after services. In regions such as Africa, agriculture continues to employ a significant portion of the workforce, with nearly half (49.5%) of the total employed population working in this sector as of 2020. This underscores the sector’s critical role in sustaining livelihoods, especially in regions where industrial or service sector jobs are less accessible [
2].
The utility of the agricultural sector extends beyond employment. It is fundamental in ensuring food security, managing natural resources, and supporting sustainable development. Investments in agriculture, such as the development of irrigation systems, have enabled significant increases in productivity and food production [
2,
3].
Moreover, the sector’s importance is highlighted by its role in the economies of low-income and lower-middle-income countries, where a larger share of water withdrawal is devoted to agriculture, illustrating its centrality to these countries’ sustenance and economic activities [
4].
Despite a decrease in the share of agricultural employment, particularly in more developed regions, the sector remains vital for a substantial part of the global workforce, especially in developing countries.
Technological evolution and the need to optimize economic and natural resources suggest that research is focused on a new form of sustainable agriculture.
Precision agriculture (PA) is an approach that allows farmers to precisely observe, measure, and respond to variability in soil and crop characteristics within and between fields [
5]. It is a strategy that utilizes technologies to integrate data from multiple informational layers for decision-making in the management of agricultural systems. It focuses on optimizing productive and qualitative efficiency; reducing business costs; optimizing inputs, thereby minimizing environmental impacts; and creating entrepreneurial opportunities such as consultancy firms, contract farming, and innovation brokers [
6].
A system for implementing precision agriculture is the use of prescription maps and Global Navigation Satellite Systems (GNSSs) with the aim of reducing the consumption of water, fertilizers, and pesticides by adapting them to changes in soil conditions, thus reducing environmental impact and, at the same time, increasing yield and productivity [
5,
7]. In this field, it is important to pay attention to the risks that the use of new agricultural technologies can entail to the workers. Previous studies have highlighted the prevalence of ergonomic risks that can cause musculoskeletal disorders (MSDs) in the use of agricultural tractors [
8,
9,
10,
11]. In fact, vibration exposure and incorrect postures maintained for a long time can produce stress on the musculoskeletal system with the risk of developing MSDs such as pathologies of the spine, cervical and back-lumbar areas, and shoulders [
8].
A previous study investigated the ergonomic comfort of operators driving different types of agricultural tractors: traditional, satellite-assisted, and semi-automatic [
11]. It was observed that the semi-automatic driving mode required minimal muscular effort compared to the other driving modes. In semi-automatic driving, the operator only steered during turning maneuvers at the field’s end. Meanwhile, the automatic control system, guided by the GNSS receiver atop the tractor’s cabin, autonomously directed the tractor along the predetermined field line, controlling the steering wheel and front axis [
11]. It is also important to highlight how satellite-assisted and semi-automatic systems included the presence of a display inside the cabin where the route was displayed on the map. However, this previous study did not take into account the position of the display in the tractor with respect to the driver [
11].
The aim of this study was to evaluate the comfort and muscular activation of the operators, in relation to the position of display of the driving system applied to a tractor for semi-automatic driving during the harrowing operation.
2. Materials and Methods
In order to evaluate the operator’s ergonomic risks, we investigated muscular activation and comfort during the semi-automated driving of the tractor with three different positions of the GSNN display. In particular, the tests were conducted with the display positioned at angles of 30°, 50°, and 80° relative to the driver’s frontal vision, depending on the availability of supports for installing the display (see
Figure 1).
Posture and comfort variations were analyzed through barometric body pressures on the seat, muscular activation by surface electromyography (sEMG), and thermography (IRT) of the back and shoulder muscles of each operator.
Participation in this study took place on a voluntary basis. The test was conducted on 10 healthy workers with at least 5 years of experience in the field. The exclusion criteria were musculoskeletal disorders, history of scoliosis or spine alterations, acute back pain during the previous four months, recent surgery, and a Body Mass Index (BMI) < 18.5 or >25.
The operators who underwent a preliminary medical examination had no health problems or pathologies of the column. The experimental tests were conducted using semi-automatic guidance systems to take into account the same agricultural operation: soil harrowing.
The tests were performed for 15 min at 8.56 ± 0.88 km h
−1 in June 2023 on a 3-hectare land strip, with a regular plan and shape, which was previously cultivated for the production of wheat (45°31′14″ N, 9°34′18″ E), located in Treviglio (BG, Italy) on a farm near the CREA (Council for Agricultural Research and Economics) headquarters. The steering to change direction occurred approximately every 500 m of the road with the tractor. The soil showed uniform physical characteristics [
10]: sand (68%), silt (24%), and clay (8%), with stones constituting one-third of the test field. The temperature inside the tractor cab was adjusted to 23 °C throughout the test. Median soil humidity and resistance to penetration during tests were 20% and 0.97 mPa, respectively. All procedures adhered to the 1964 Helsinki Declaration and its subsequent amendments. The participants provided signed consent, and this study received approval from the Ethics Committee of the University of Catania (code: 321/18). The experimental tests involved crop harrowing using a spring harrow (MAINARDI 400, Mainardi Machine Agricole, Cremona, Italy) attached to a 120-kW tractor (JOHN DEERE 6920s, John Deere, Moline, IL, USA) equipped with an S-Guide RTK (StarFire6000, John Deere, Moline, IL, USA) automated steering system.
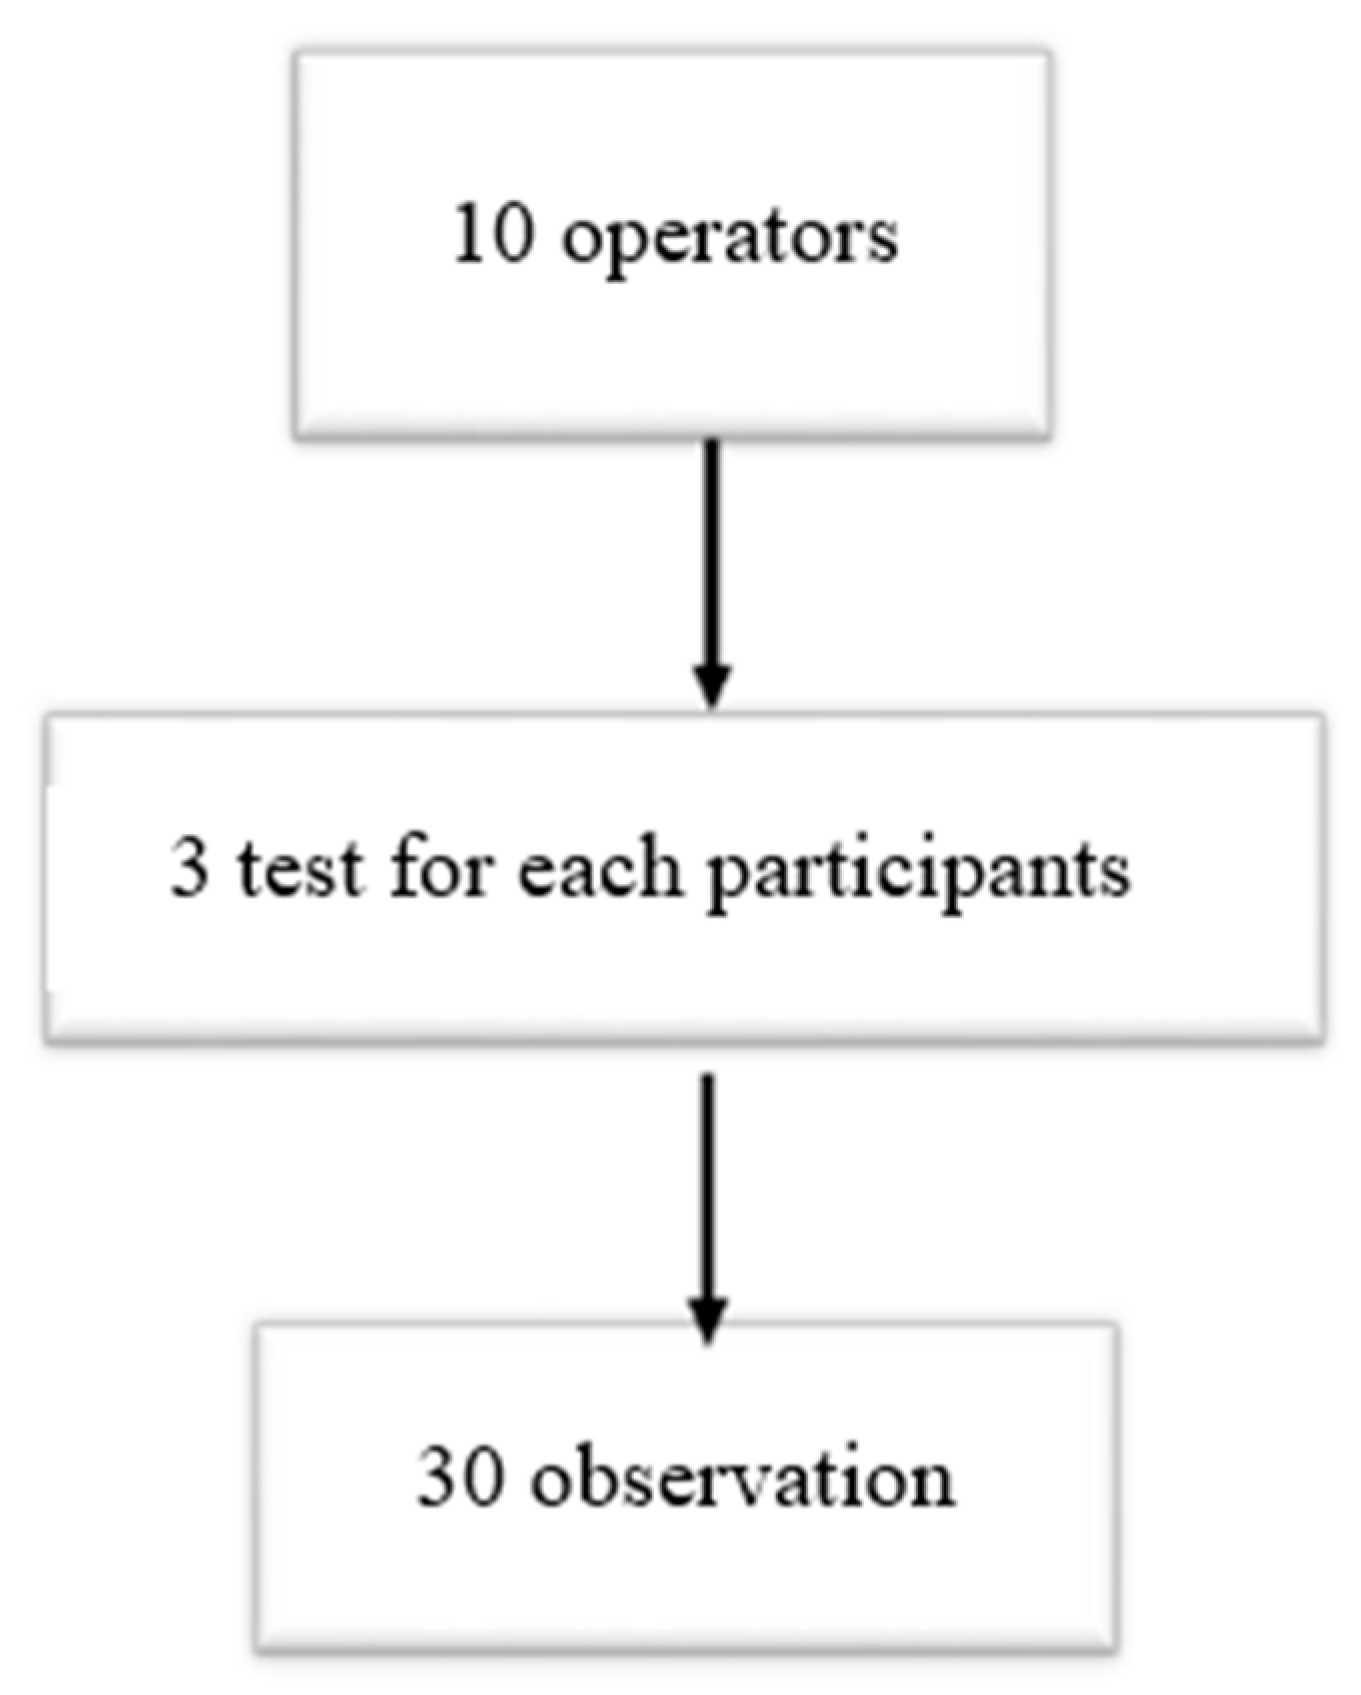
Figure 2 shows the scheme of this study: 10 operators × 3 repetitions (at 30°, 50°, and 80°), with 30 observations in total (see
Figure 2).
2.1. Satellite System
The StarFire 6000 (John Deere, Moline, IL, USA) receiver, equipped with dual frequencies and RTK (Real-Time Kinematic) correction, can precisely determine the tractor’s position, speed, and current time with centimeter-level accuracy to facilitate the effective functioning of the associated guidance systems. Additionally, these data were transmitted to and compiled by the farm information system for further analysis.
2.2. Muscular Engagement Detection System—Electromyograph
Our compact and lightweight EMG data recorders with built-in lithium-ion batteries (manufactured by OT Bioelectronics-OTB, based in Turin, Italy) were utilized. These devices were equipped with adhesive electrodes featuring a diameter of 24 mm. The sensor surface, made of Ag/AgCl, was 80 mm
2, surrounded by an adhesive area of 1808 mm
2 with a thickness of 1 mm [
10].
The experiments involved assessing muscle activity using surface EMG (sEMG) and determining the mean frequency (MNF) of the observed signals. The sEMG sensors were attached to the subject’s body throughout the experiment and captured real-time data on the MNF from specific areas: right and left shoulders (SH_RX and SH_LX, respectively) and right and left lumbar regions (BK_RX and BK_LX, respectively) (see
Figure 3). Muscle fatigue manifested through an increase in EMG signal amplitude and a shift in the power spectrum towards lower frequencies [
12]. The increase in signal amplitude may be attributed to the recruitment of additional motor units or enhanced spatial and temporal synchronization of these units [
12]. A concentration of the power spectrum at lower frequencies may suggest extended activation periods for each motor unit, potentially leading to slower nerve signal transmission.
Data analysis utilized OT BioLab 1.7 software from Bioelectronics, incorporating band-pass filtering from 10 to 450 Hz to exclude background interference below 10 Hz and unreliable frequencies above 450 Hz. The resulting signal underwent full-wave rectification to convert negative amplitudes into positive ones. This process was vital for calculating various amplitude parameters, including mean and peak values, and the root mean squared (RMS). The amplitude of the EMG signal, indicating the number of active motor neurons and the nature of their activation, could be estimated through the average value of the rectified signal (ARV, i.e., average adjusted value).
The electromyographic sensors consist of disposable electrodes affixed to cleansed skin over the pertinent muscles, i.e., the left arm, right shoulder, left shoulder, and the lumbar area of the back.
2.3. Barometric Detection System
The barometric detection system (CONFORMat Seat, Tekscan Pressure Measurement System, 1998–2012, South Boston, MA, USA) recorded the pressure exerted by the operator’s body weight on the tractor seat. This system employed a capacitance sensor, which effectively distributed and relieved the pressure while the subjects were seated. The sensors used in the tests were arranged in a regular matrix of 32 sensors by 32 sensors, forming a carpet of resistive sensors. The instrumentation included two Evolution Handle data scanners (from Tekscan Pressure Measurement System, 2015; Boston, MA, USA), capable of collecting data at a rate of 100 Hz (see
Figure 4).
The system captured data from eight pressure mapping pads, with each quadrant representing an equal division of the seating and backrest areas: four on the seat (frames Q 1–4) and four on the backrest (frames Q 5–8). The sensors, measuring 0.64 mm in thickness, were capable of detecting a pressure range from 0 to 1000 g/cm
2. Each pressure profile, referred to as a frame, allowed for the calculation of both maximum and mean pressure values [
5].
From each individual test, the carpet sensors provided the following metrics: maximum pressure peak (P
max), average pressure value (P
avg), and the average percentage of cells activated by pressure values within the range of 130–400 g/cm
2 (12.7–39.2 kPa) (NC
130–400), as outlined in a previous investigation [
10]. P
max represented the mean of maximum pressure peaks recorded in each frame throughout each test, while P
avg denoted the average of all pressure peaks recorded by each frame in each individual test.
2.4. Infrared Thermography (IRT)
The thermographic examination was conducted with infrared thermography (IRT) (FLIR E54 IR) using a camera with a detector resolution of 320 × 240 pixels and thermal sensitivity < 0.04 °C. We measured the temperature of the dorsal right (DR) and left (DL) districts and lumbar right (LR) and left (LL) districts. The districts were detected using a FLIR E54 IR thermal imaging camera before the test (T0), at a distance of 1.5 m from the operators’ body in a room with a temperature of 23 ± 6 °C and humidity of 48%, and after the test (T1), where the operators quickly reached the same room, which was at the same humidity and temperature conditions as before the test. Furthermore, in accordance with the TISEM consensus [
13], the operators were placed in the room to acclimatize for approximately 15 min [
13,
14]. Subsequently, the thermal camera was used to carry out the measurements. Infrared thermography detects the radiance of a body; then, the algorithms present in these cameras convert the radiance into temperature values, thus providing the expression of the temperature of the body surface. We used the methods that were previously described [
15,
16].
2.5. Statistical Analysis
Data analysis was conducted using the R Project for Statistical Computing (Vienna, Austria). The Shapiro–Wilk test was used to verify the normality distribution. Data were reported as average (M) ± standard deviations (SD).
Data from the electromyographic, barometric, and IRT systems were processed through descriptive, statistical, and inferential analyses. For comparison among several averages, a one-way variance analysis (ANOVA) was used. For all the tests, a significance level of p ≤ 0.05 was chosen.
3. Results
The tests were conducted by 10 operators, who were male and right-handed, with an average age of 37.1 ± 9.7 years, height of 1.78 ± 3.1 m, weight of 76 ± 7.7 kg, and BMI of 23.72 ± 2.9 kg/m
2, five years of experience in the agricultural practices of soil processing; two (20%) people played sports (see
Table 1).
The ANOVA results showed statistically significant (p < 0.01) differences in electromyographic and barometric values related to the change in the angle of the display.
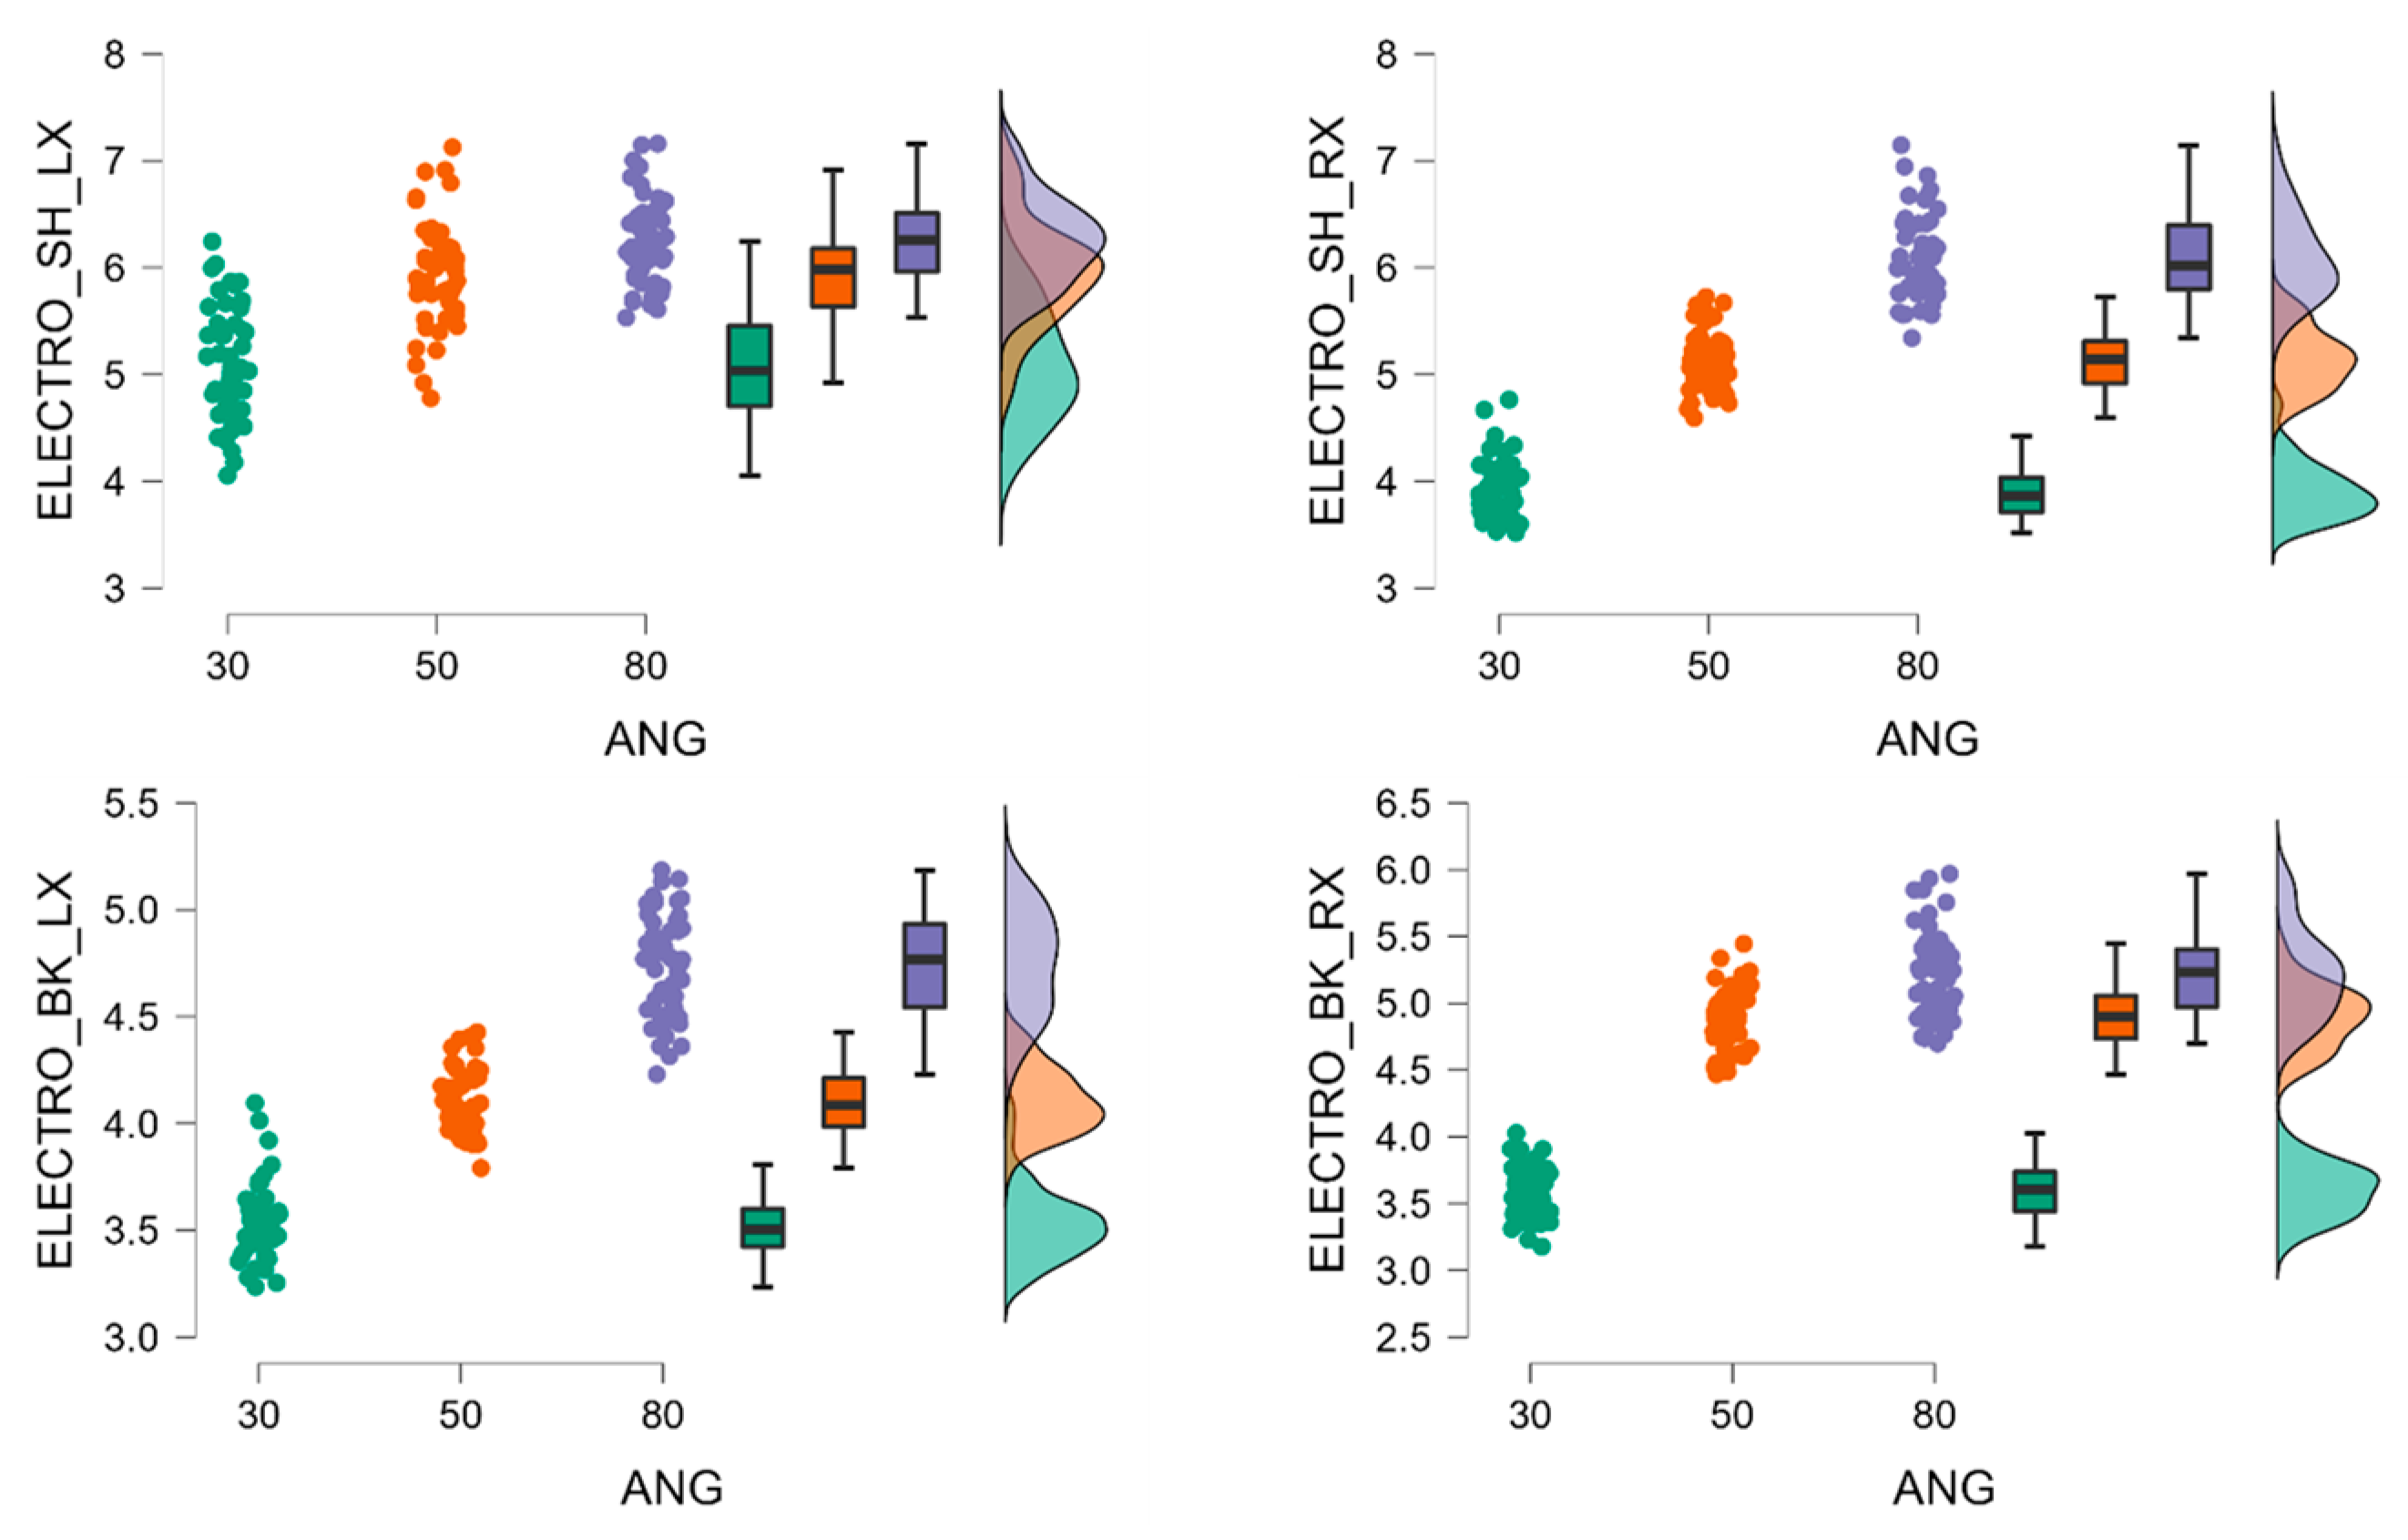
In particular, with regard to sEMG, we observed a significant increase in muscle activation for SH_LX, SH_RX, BK_LX, and BK_RX as the display positioning angle increased (30° > 50° > 80°) (see
Figure 5).
No significant difference was observed between the operators.
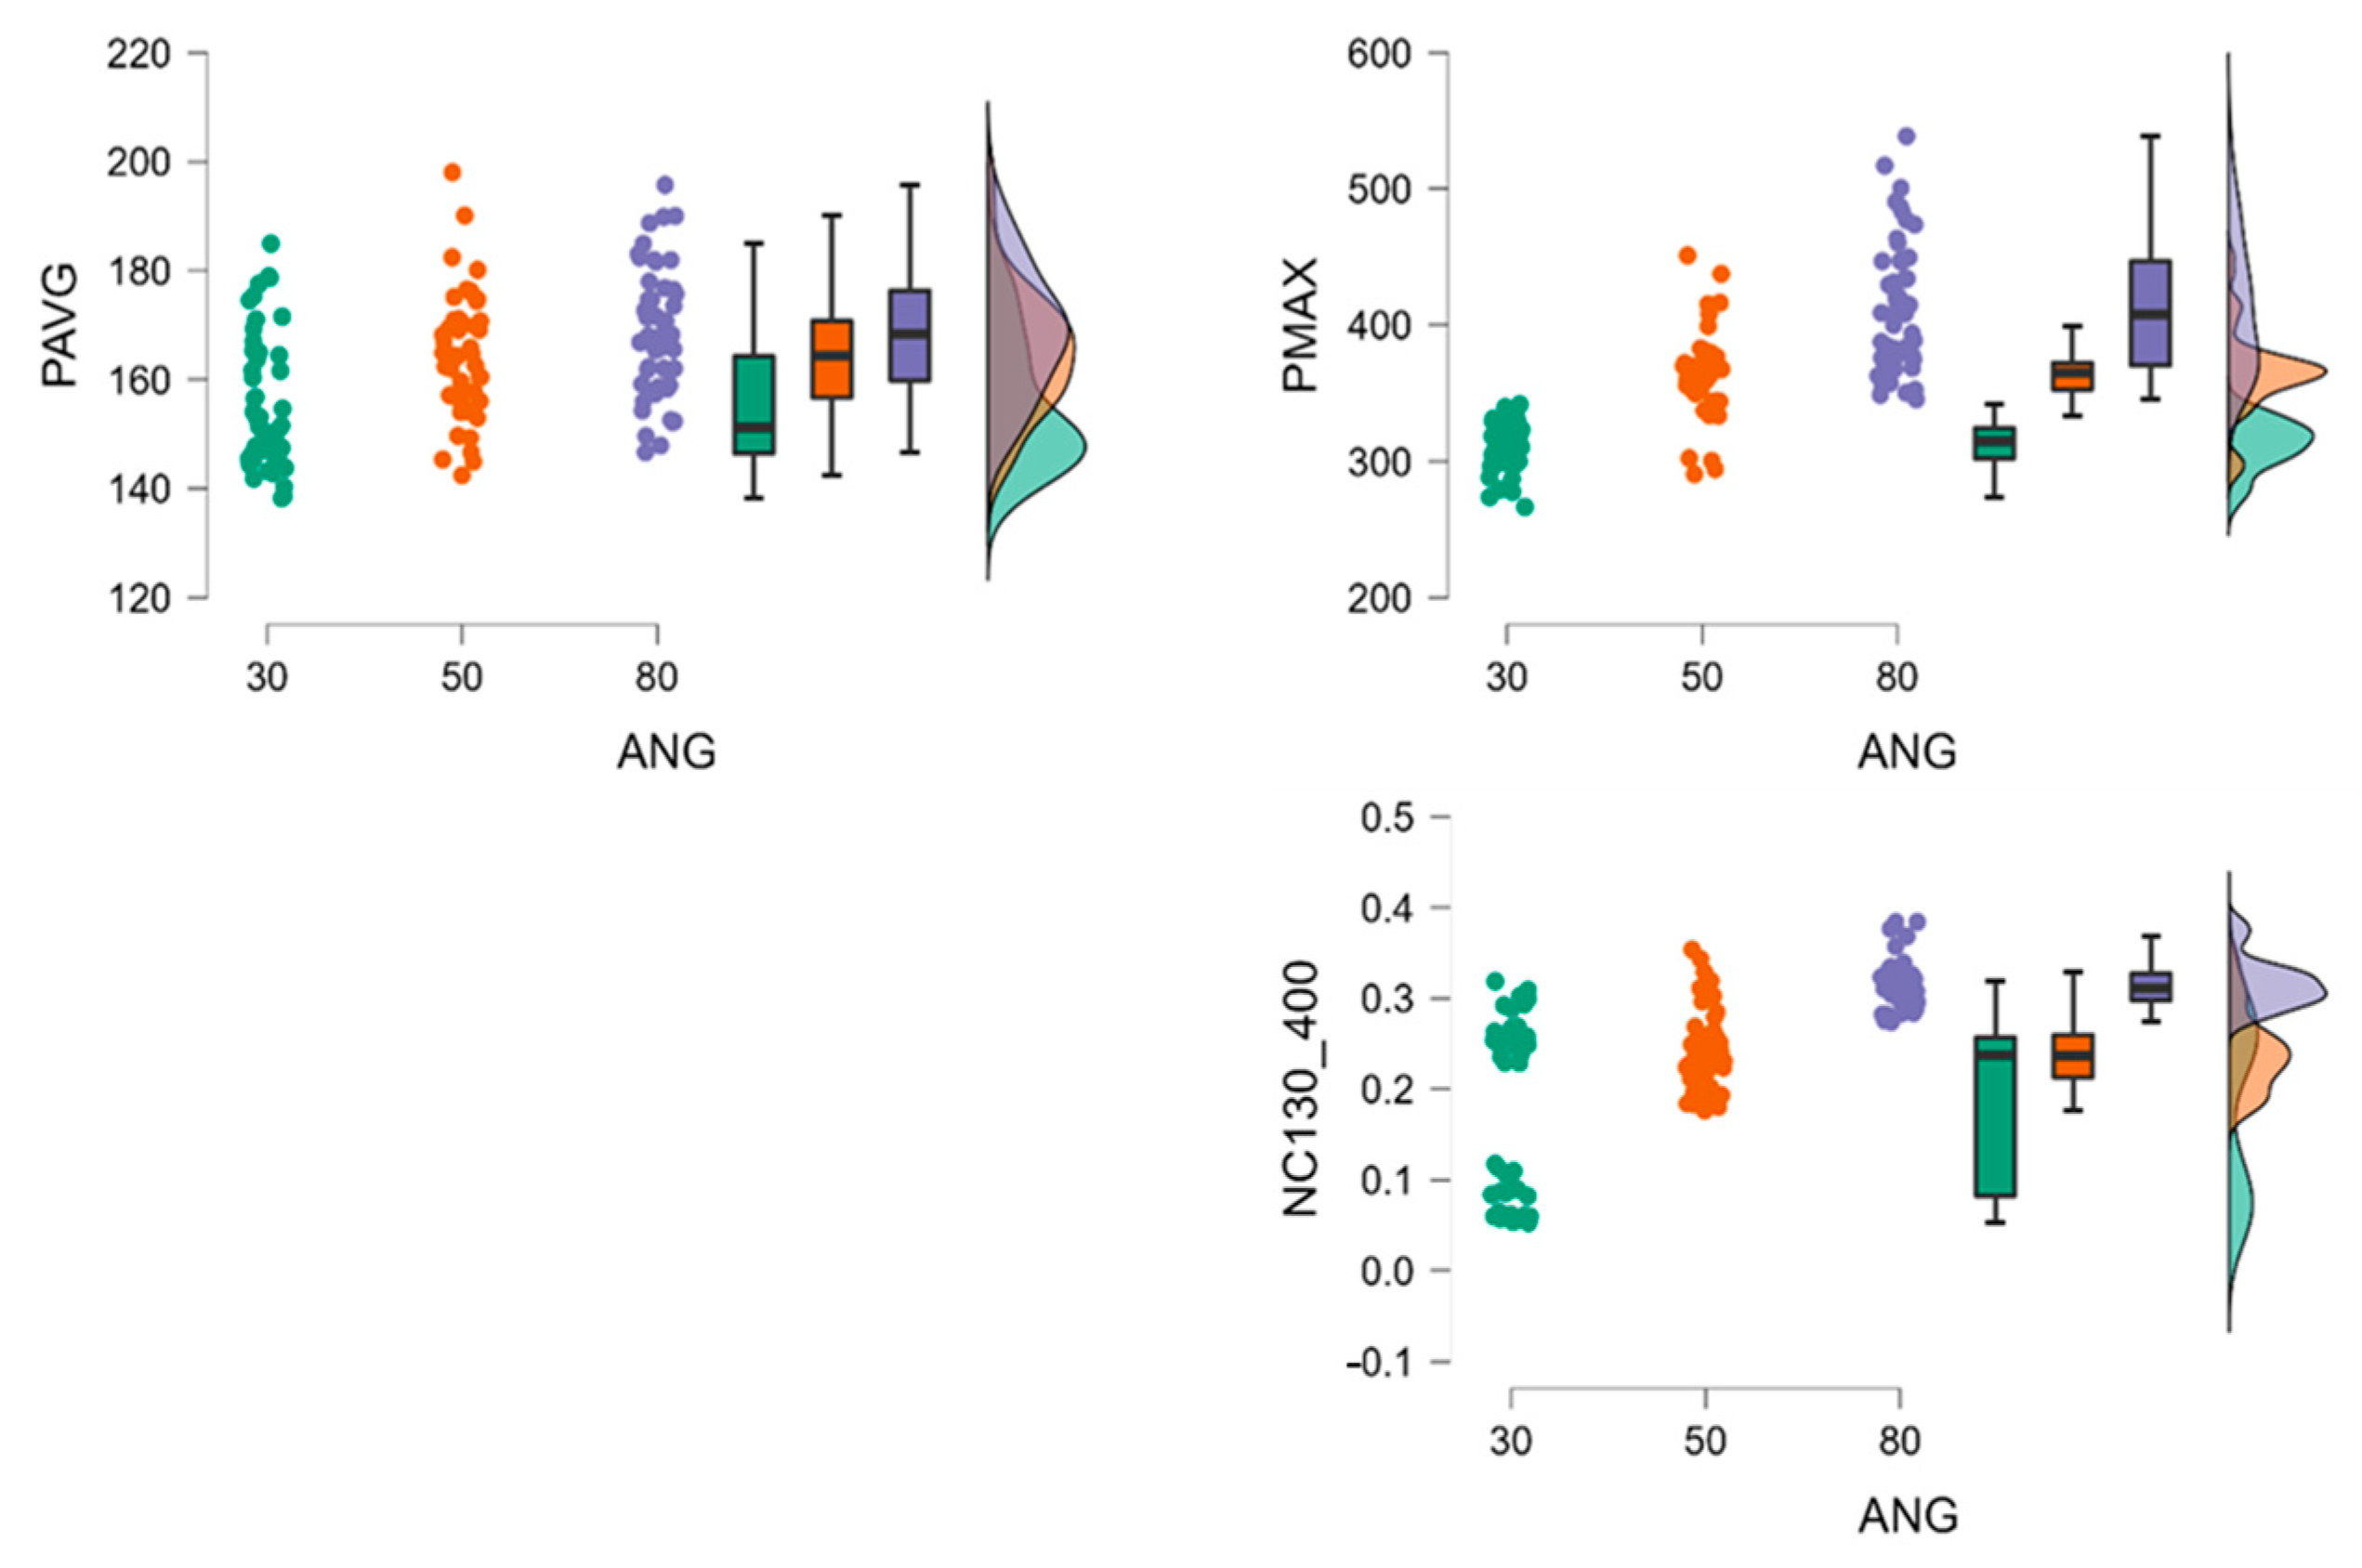
With regard to the barometric analysis, the display position at 80° generated a significantly higher increase in P
avg, P
max, and NC
130_400 than the other angles, i.e., 30° and 50°. Also, the display position at 50° generated values significantly greater in P
avg, P
max, and NC
130_400 than at 30° (see
Figure 6).
No significant difference was observed between the operators.
The IRT did not show a significant increase in the temperature at the DL and DR regions at the end of observation (T1) compared to T0. Only in the DR region measurement was an increase in temperature observed at the end of the test (T1), with the display positioned at 80°. No significant difference was observed between the operators (see
Table 2).
Regarding the lumbar region, we observed a significant increase in the temperature at the LL at 80° of the display, and there was no significant increase at the LR at 50° and 80° at the end of observation (T1) compared to T0. However, an increase in temperature was observed with an increase in the degree of display to T1 compared to T0. No significant difference was observed between the operators (see
Table 3).
4. Discussion
It has long been evident that the role of vibration and posture is fundamental in determining comfort levels, especially in work environments. Literature data show that exposure to whole-body vibration and maintaining specific postures can significantly impact an individual’s comfort, potentially leading to discomfort and long-term musculoskeletal problems [
17]. In particular, it has long been known that occupational exposure to whole-body vibration (WBV) and postural stress while driving a tractor may contribute to an increased risk for low back pain (LBP) and MSDs [
18,
19,
20]. These findings underscore the importance of ergonomic interventions and the development of acts aimed at minimizing exposure to harmful vibrations and promoting optimal postural practices. Furthermore, the introduction of new technologies in the field of PA, such as the introduction of new driving systems, has made it necessary to further evaluate the impact of these systems on health.
In this study, we evaluated the influence of the position angle of the display (30°, 50°, and 80°) during semi-automatic driving, which was related to muscle activation.
Previous studies have investigated stresses on the spine and shoulders during the use of the semi-automatically guided tractor [
11]. However, the position of the display inside the cabin had not been considered. In this study, the sEMG electromyographic examination showed a significant increase in muscle activation in SH_LX, SH_RX, BL_LX, and BK_RX as the display positioning angle increased (30° > 50° > 80°). The use of sEMG has been used in previous studies in the agricultural field to study muscle activation through a non-invasive procedure [
11,
21,
22]. In this case, the increase in the positioning angle of the display caused the rotation of the head, which led to a postural alteration. The postural variation was also ascertained by the increase in P
avg, P
max, and NC
130_400 pressures, leading to an altered distribution of pressures on the seat. Previous studies have shown that a balanced distribution of the operator’s weight on the seat is essential to prevent muscle problems [
10].
An extended imbalance in pressure distribution can cause muscle fatigue and discomfort for the operator during long periods of sitting. The main support for the body weight while seated should be on the ischial tuberosities, with the pressure gradually reducing towards the surrounding areas [
23].
Regarding the use of IRT, it can be a valid non-invasive indirect measurement system of muscle activation [
24,
25]. Previous research has indicated that the primary sources of heat generation within the body are muscle flexion and metabolism. This heat is then expelled into the environment through several processes, including thermal conduction, forced and natural convection, perspiration, and exhalation [
26]. Infrared thermal imaging captures the emitted heat through the skin, enabling the identification of asymmetrical patterns in the thermogram associated with alterations in skin temperature distribution [
27,
28]. A study conducted by Rakhra et al. (2013). showed that by varying the positions of the head, during various driving operations, the neck muscles developed an increase in the temperature detected by the thermal camera [
29].
In this study, an increase in temperature was observed as the degree of display increased at T1 compared to T0. In particular, the significantly affected area was the lumbar region. Also, we observed a significant increase in the temperature in the left lumbar (DR) region at 80° of the display angle. Some authors previously reported that the non-homogeneous activation of some muscle areas compared to others leads to long-term muscle fatigue, discomfort, and MSDs [
30,
31]. Therefore, our study appears to be useful for the positioning of the display in the tractor cab in order to avoid the onset of MSDs. In a previous survey carried out on 1155 tractor drivers, tractor vibration and/or incorrect posture while driving were found to cause low back disorders in more than 80% of the interviewed drivers [
32]. Therefore, it seems important to investigate the positioning of the display within these tractors as an extreme degree of display orientation can only interact with the factors already studied, further increasing the negative effects on health.
This study leads to understanding the health impact of the position of the display in the tractor cab. This should encourage the occupational physician and the employer to find better ergonomic solutions, avoiding, for example, the use of displays positioned at extreme angles. Previous studies carried out in different work settings have shown that it is important to focus on the risks to the musculoskeletal system. In fact, it has been highlighted that the most effective strategies for the prevention of MSDs are technical modifications of the workplace and education, combined with practical training [
33]. This can incentivize the occupational physician and the employer to find better ergonomic solutions by avoiding, for example, the use of displays positioned at extreme angles. Health promotion interventions in the workplace and company counseling initiatives have significantly contributed to enhancing the health conditions of employees. In fact, the role of occupational physicians extends far beyond merely diagnosing occupational diseases at an early stage. A primary responsibility is the prevention of work-related pathologies, accomplished through proactive health promotion interventions or by providing counseling to employers about the healthiness of machinery and workplace environments. Previous studies have consistently highlighted the pivotal and central role of the occupational physician within the dynamics of company operations, emphasizing their critical impact on maintaining and improving worker health and safety standards [
32,
34]. This has underscored the importance of integrating comprehensive occupational health strategies to ensure the well-being of all employees [
32,
34]. In particular, health promotion interventions in the workplace have been adopted to reduce smoking habits and promote healthy lifestyles, which have led to considerable results [
32,
34,
35].
The limitation of this analysis was the inability to perform clinical assessments over an extended period. The selected subjects were all young, healthy, and in good health, almost ideal conditions. In addition, the small number of included workers and the inability to measure vibration transmitted to the entire body should also be considered as limitations of our study.
Further, it was observed that the position of the display at 30° seems to reduce the operator’s frontal visibility towards the outside, increasing the risks for oneself or third parties caused by the reduction in the visual field.
The strengths of this study concern the support that is provided to tractor manufacturing companies, employers who purchase and use tractors, and occupational physicians with feedback on the ergonomic risks associated with the positioning of the display inside the cab. In particular, occupational physicians may have, in the context of the assessment of occupational risks of agricultural companies that use tractors, useful elements for monitoring workers, but above all, for preventing the adoption of non-ergonomic postures.


 ,
, 


