Article

Experimental Study on the Relationship between Time-Varying Uplift Displacement and Grout Diffusion in Sand

1
School of Geosciences and Info-Physics, Central South University, Changsha 410083, China
2
Hunan Key Laboratory of Nonferrous Resources and Geological Hazards Exploration, Changsha 410083, China
3
National Demonstration Center for Experimental Civil Engineering Education, Hunan City University, Yiyang 413002, China
4
Hunan Engineering Research Center of Structural Safety and Disaster Prevention for Urban Underground Infrastructure, Hunan City University, Yiyang 413002, China
*
Author to whom correspondence should be addressed.
Appl. Sci. 2024, 14(9), 3922; https://doi.org/10.3390/app14093922
Submission received: 6 March 2024 / Revised: 29 April 2024 / Accepted: 1 May 2024 / Published: 4 May 2024
(This article belongs to the Special Issue Recent Advances in Soft Soil Engineering)

Abstract

:
Traditional model tests for soil and rock materials face challenges in observing the slurry diffusion within the soil mass, hindering the understanding of the relationship between grouting-induced ground deformation and grout diffusion. This study conducts grouting diffusion model tests using a self-developed experimental setup on both ordinary and transparent sand. We investigate cement slurry diffusion patterns, distribution characteristics, and temporal variations in ground uplift displacement during the grouting process. By leveraging a visualization grouting model and non-intrusive displacement measurements, we directly observe and verify the changes in cement slurry diffusion and ground displacement in transparent sand. The results indicate the following: during non-steady grouting in sand, slurry diffusion progresses from low-pressure infiltration to medium-pressure compaction, culminating in high-pressure fracturing; ground uplift displacement curves exhibit a consistent “step-like” increase with grouting time, featuring accelerated growth after each step; and visualization tests reveal a strong correlation between grouting pressure, slurry diffusion, and corresponding uplift displacement. Distinct features in the grouting pressure plot align with the acceleration phases of the displacement; at a water–cement ratio (w/c) of 0.8, the stratum’s vertical deformation shows a symmetric “higher in the middle, lower on the sides” distribution. As the burial depth decreases, the stratum’s uplift displacement tends to flatten horizontally, especially at w/c = 0.8 and 1.2.

1. Introduction

Grouting technology offers several advantages, including safety, cost-effectiveness, simplicity in equipment, a short construction period, and minimal environmental impact. It demonstrates strong adaptability and significant effectiveness in complex environments, playing a crucial role in various fields such as civil engineering, water conservancy, transportation, mining, and environmental remediation [1]. Grouting involves injecting certain grouts that can effectively bond with the injected structure into the voids, pores, and micro-cracks of the structure, transforming it into a new structure with high strength, good impermeability, high stability, and good overall integrity. This process aims to improve the physical and mechanical properties of the injected structure [2]. Research on grouting mainly involves theoretical analysis, numerical simulation, and experimental studies. Grouting experiments can provide the basis for establishing grouting theoretical models and analyzing the diffusion patterns of grout [3]. Therefore, scholars have conducted a series of grouting experiments targeting different receiving structures and grouting conditions to study the transport and diffusion mechanisms of grout [4,5].
The diffusion pattern of grout in soil and rock masses is influenced by various factors [6,7], such as grout properties, grouting techniques, and soil and rock parameters. Grouting construction often encounters different soil and rock conditions. Some scholars have employed grouting model experiments to study the diffusion patterns and diffusion radii of grout in soil and rock masses. Ding et al. [8] investigated the influence of fracture characteristics on grout diffusion in rock masses by introducing fracture roughness. They conducted grouting model experiments and numerical simulation studies on single fractures in rock masses. Jiang et al. [9] developed a visualization platform for grout diffusion and a three-dimensional grouting experimental system to study the diffusion of grout in fractured rock masses. Liu et al. [10] and Li et al. [11] conducted studies on the diffusion patterns of grout in segmented grouting sections of clayey fault zones based on three-dimensional grouting diffusion model experiments. Grouting technology is also widely applied in the reinforcement of soil foundations, and thus, significant progress has been made in understanding the diffusion patterns of grout in clayey soils [12]. For weathered granite soil, Zhang et al. [13] conducted grouting model experiments to study the diffusion patterns of grout in soil with different particle size distributions. They defined permeation, compaction, fracturing, and mixed diffusion patterns and distinguished different diffusion patterns based on particle size distribution and grouting pressure. The diffusion of grout in sandy soil has also received widespread attention, with many scholars conducting numerous grouting model experiments on sand. For instance, Zhang et al. [14], based on the purpose of grouting reinforcement in sandy soil, studied the effects of clay content and initial moisture content on grout diffusion and soil reinforcement effectiveness. Bezuijen et al. [15] investigated the process of grouting in fractured sand and simplified the complex crack shapes in sand to geometric shapes. They established an analytical model for the diffusion of grout in fractured sand during grouting. Guo et al. [16] analyzed the influencing factors of permeation grouting diffusion in sand layers and evaluated various parameters affecting the grouting performance in sand layers. They proposed a new method for predicting the diffusion of permeation grouting in sand layers. Li et al. [17] evaluated the reinforcement effectiveness of permeation grouting in sandy soil under different water–cement ratios, cement grouts, and curing times. They analyzed the diffusion patterns of permeation grouting in sandy soil. Guo et al. [18] conducted in situ grouting experiments using the hole-sealing grouting method to study the diffusion characteristics of expansive polymer grouting materials in sand, gravel, and sand–gravel mixtures. Li et al. [19] investigated the diffusion patterns of grout in silt after exposure to different levels of vacuum. Wang et al. [20] conducted chemical grouting experiments in saturated sand to study the diffusion patterns of chemical grout in water-saturated loose sand layers. Yang et al. [21] investigated the diffusion patterns of grout in sand through laboratory grouting model experiments, analyzing the diffusion behavior of cement grout in sand under different water–cement ratios, grouting pressures, grouting volumes, and soil conditions. Kleinlugtenbelt et al. [22] and Hu. et al. [23,24] conducted grouting model experiments on loose sand layers to investigate the diffusion patterns of grout.
The aforementioned research and practices on grouting in sand layers are of significant importance. However, current studies mostly focus on the diffusion of grout in sand and its reinforcement effects. Moreover, previous studies have mainly relied on methods such as bulk excavation, core drilling, or cross-section cutting to investigate the grouting diffusion mechanisms and patterns. There has been a lack of attention to the temporal variations in grouting pressure, grout diffusion, and surface displacement during the grouting process. Grouting is a concealed engineering construction, making it difficult to directly observe the diffusion of grout. Achieving stable pressure grouting in engineering practice is often challenging, especially in the context of grouting lift correction projects. Due to variations in the geological conditions and the objects targeted for lifting, it is difficult to determine the exact pressure required for lift grouting to prevent secondary damage to the lifted structures [25]. Therefore, non-steady pressure grouting is employed in most practices. The actual determination of grouting pressure and the termination of grouting are based on the deformation and displacement measurements of the lifted structures. In this study, non-steady pressure grouting was utilized, with the grouting pressure gradually increasing over time. A self-developed three-dimensional grouting model test apparatus was utilized for grouting experiments. The study combined transparent sand with particle image velocimetry (PIV) technology to investigate the influence of grout diffusion on the displacement characteristics of sand particles. The diffusion patterns and distribution characteristics of cement grout in ordinary sand and transparent sand were studied. The visualization grouting model apparatus was employed to directly observe the diffusion patterns and distribution characteristics of cement grout in transparent sand during the grouting process, thereby validating the diffusion characteristics of grout in ordinary sand. Based on the visualization characteristics of transparent sand, the study analyzed the temporal variations in grouting pressure, grout diffusion, and surface uplift displacement under non-steady pressure grouting. It investigated the interactions between grouting pressure, grout diffusion, and surface displacement. Utilizing model experiments to study the diffusion patterns of grout and the temporal variations in surface displacement can provide scientific basis for grouting process design and control of grouting uplift effects.

2. Experimental Design

2.1. Experimental Materials

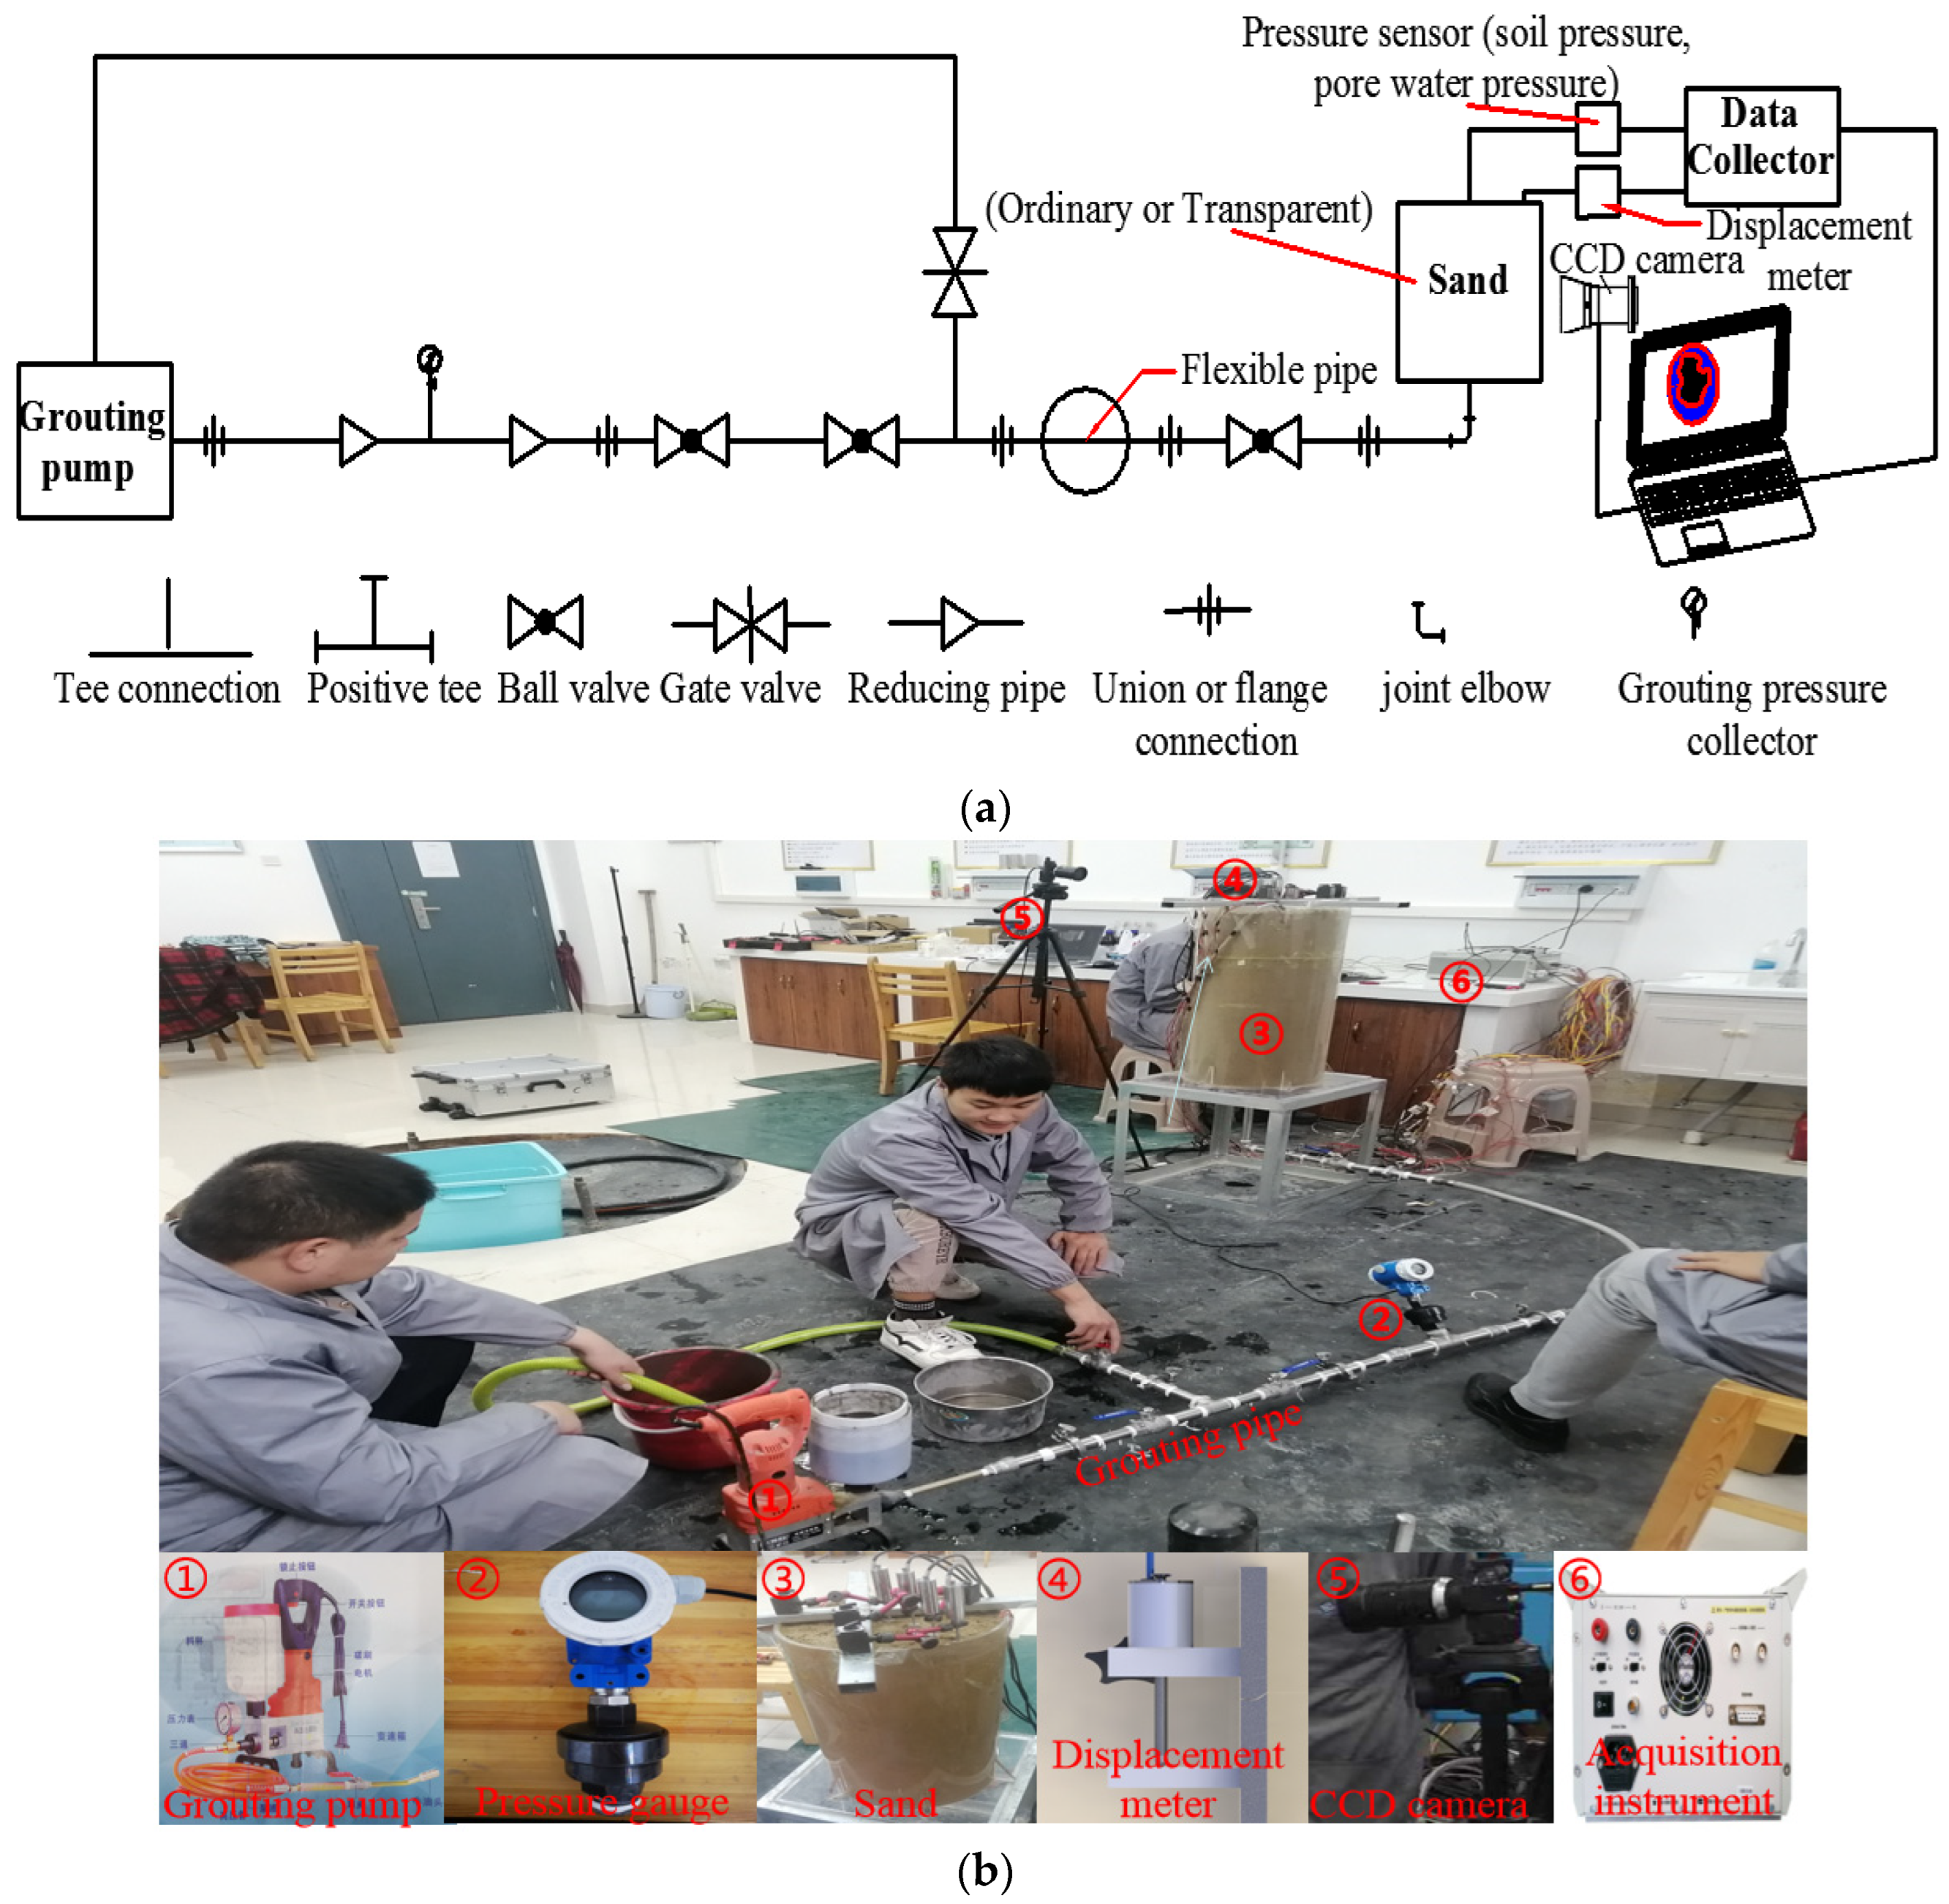
The grouting experiments were conducted using cement grout prepared with ordinary Portland cement (P·O 42.5). The specific parameters of the cement are listed in Table 1. For grouting experiments in ordinary sand, a water–cement ratio (w/c) of 0.8 was used. Cement grout with w/c ratios of 0.8, 1.0, and 1.2 were, respectively, employed in transparent soil grouting experiments. The ordinary sand is river sand, while the transparent sand consists of fused quartz particles and pore fluid (a mixture of dodecane and white oil, with a mass ratio of 1:4, prepared at a temperature of 18 °C), as illustrated in Figure 1. The particle size distribution of the sand (ordinary sand and transparent sand) is as follows: d ≤ 0.25 mm, 0.25 mm < d ≤ 0.5 mm, 0.5 mm < d ≤ 1.0 mm, and d > 1.0 mm, with a mass ratio of 1:2:2:1. Figure 1 is a transparent soil grouting model test system, in which Figure 1a is a schematic diagram of transparent soil grouting visualization, and Figure 1b is a test platform for realizing the 3D visualization of transparent soil.

2.2. Experimental Equipment

The grouting model test system, as shown in Figure 2a, mainly consists of four major components, namely the grouting equipment, test bucket, measurement system, and data image processing system. The grouting equipment mainly includes the grout pump, grout delivery pipelines, and grouting nozzle, as shown specifically in Figure 2b. The test bucket is made of organic glass and has a diameter of 350 mm (for ordinary sand) and 200 mm (for transparent sand), with a wall thickness of 10 mm and a height of 500 mm. The measurement devices include soil pressure gauges, pore water pressure gauges, displacement sensors, charge coupled device (CCD) cameras, and slab laser emitters. The data processing system includes digital image processing software and data analysis software. The arrangement of surface displacement meters is shown in Figure 2c, with four surface displacement meters positioned at different horizontal distances from the center of the grouting hole to measure the corresponding surface displacement. As shown in Figure 2d, laser speckle images of transparent particles are obtained using the CCD camera. For the purpose of elucidating the overall deformation characteristics of the overlying transparent sand during the grouting process, the following definitions are made: the analysis plane is taken as the laser section, with the bottom of the transparent sand serving as the X-axis, the grouting center as the origin, and positive towards the right (−0.1 to 0.1, unit: m); and the Y-axis is represented by the height of the transparent sand, with the positive direction upwards (0 to 0.3, unit: m). Displacement vector maps are obtained through image processing, where displacement upwards is defined as positive. The direction of the vector arrow represents the direction of sand particle movement, and the arrow size represents the movement speed. Additionally, deformation cloud maps for each component of the displacement vector can be obtained.
The specific parameters of the grouting experiments are shown in Table 2. During the grouting process, if the soil sample exhibits overall uplift failure, the grouting is immediately stopped by closing the grouting valve.

3. Results and Discussion

3.1. Consolidated Body in Two Kinds of Soil

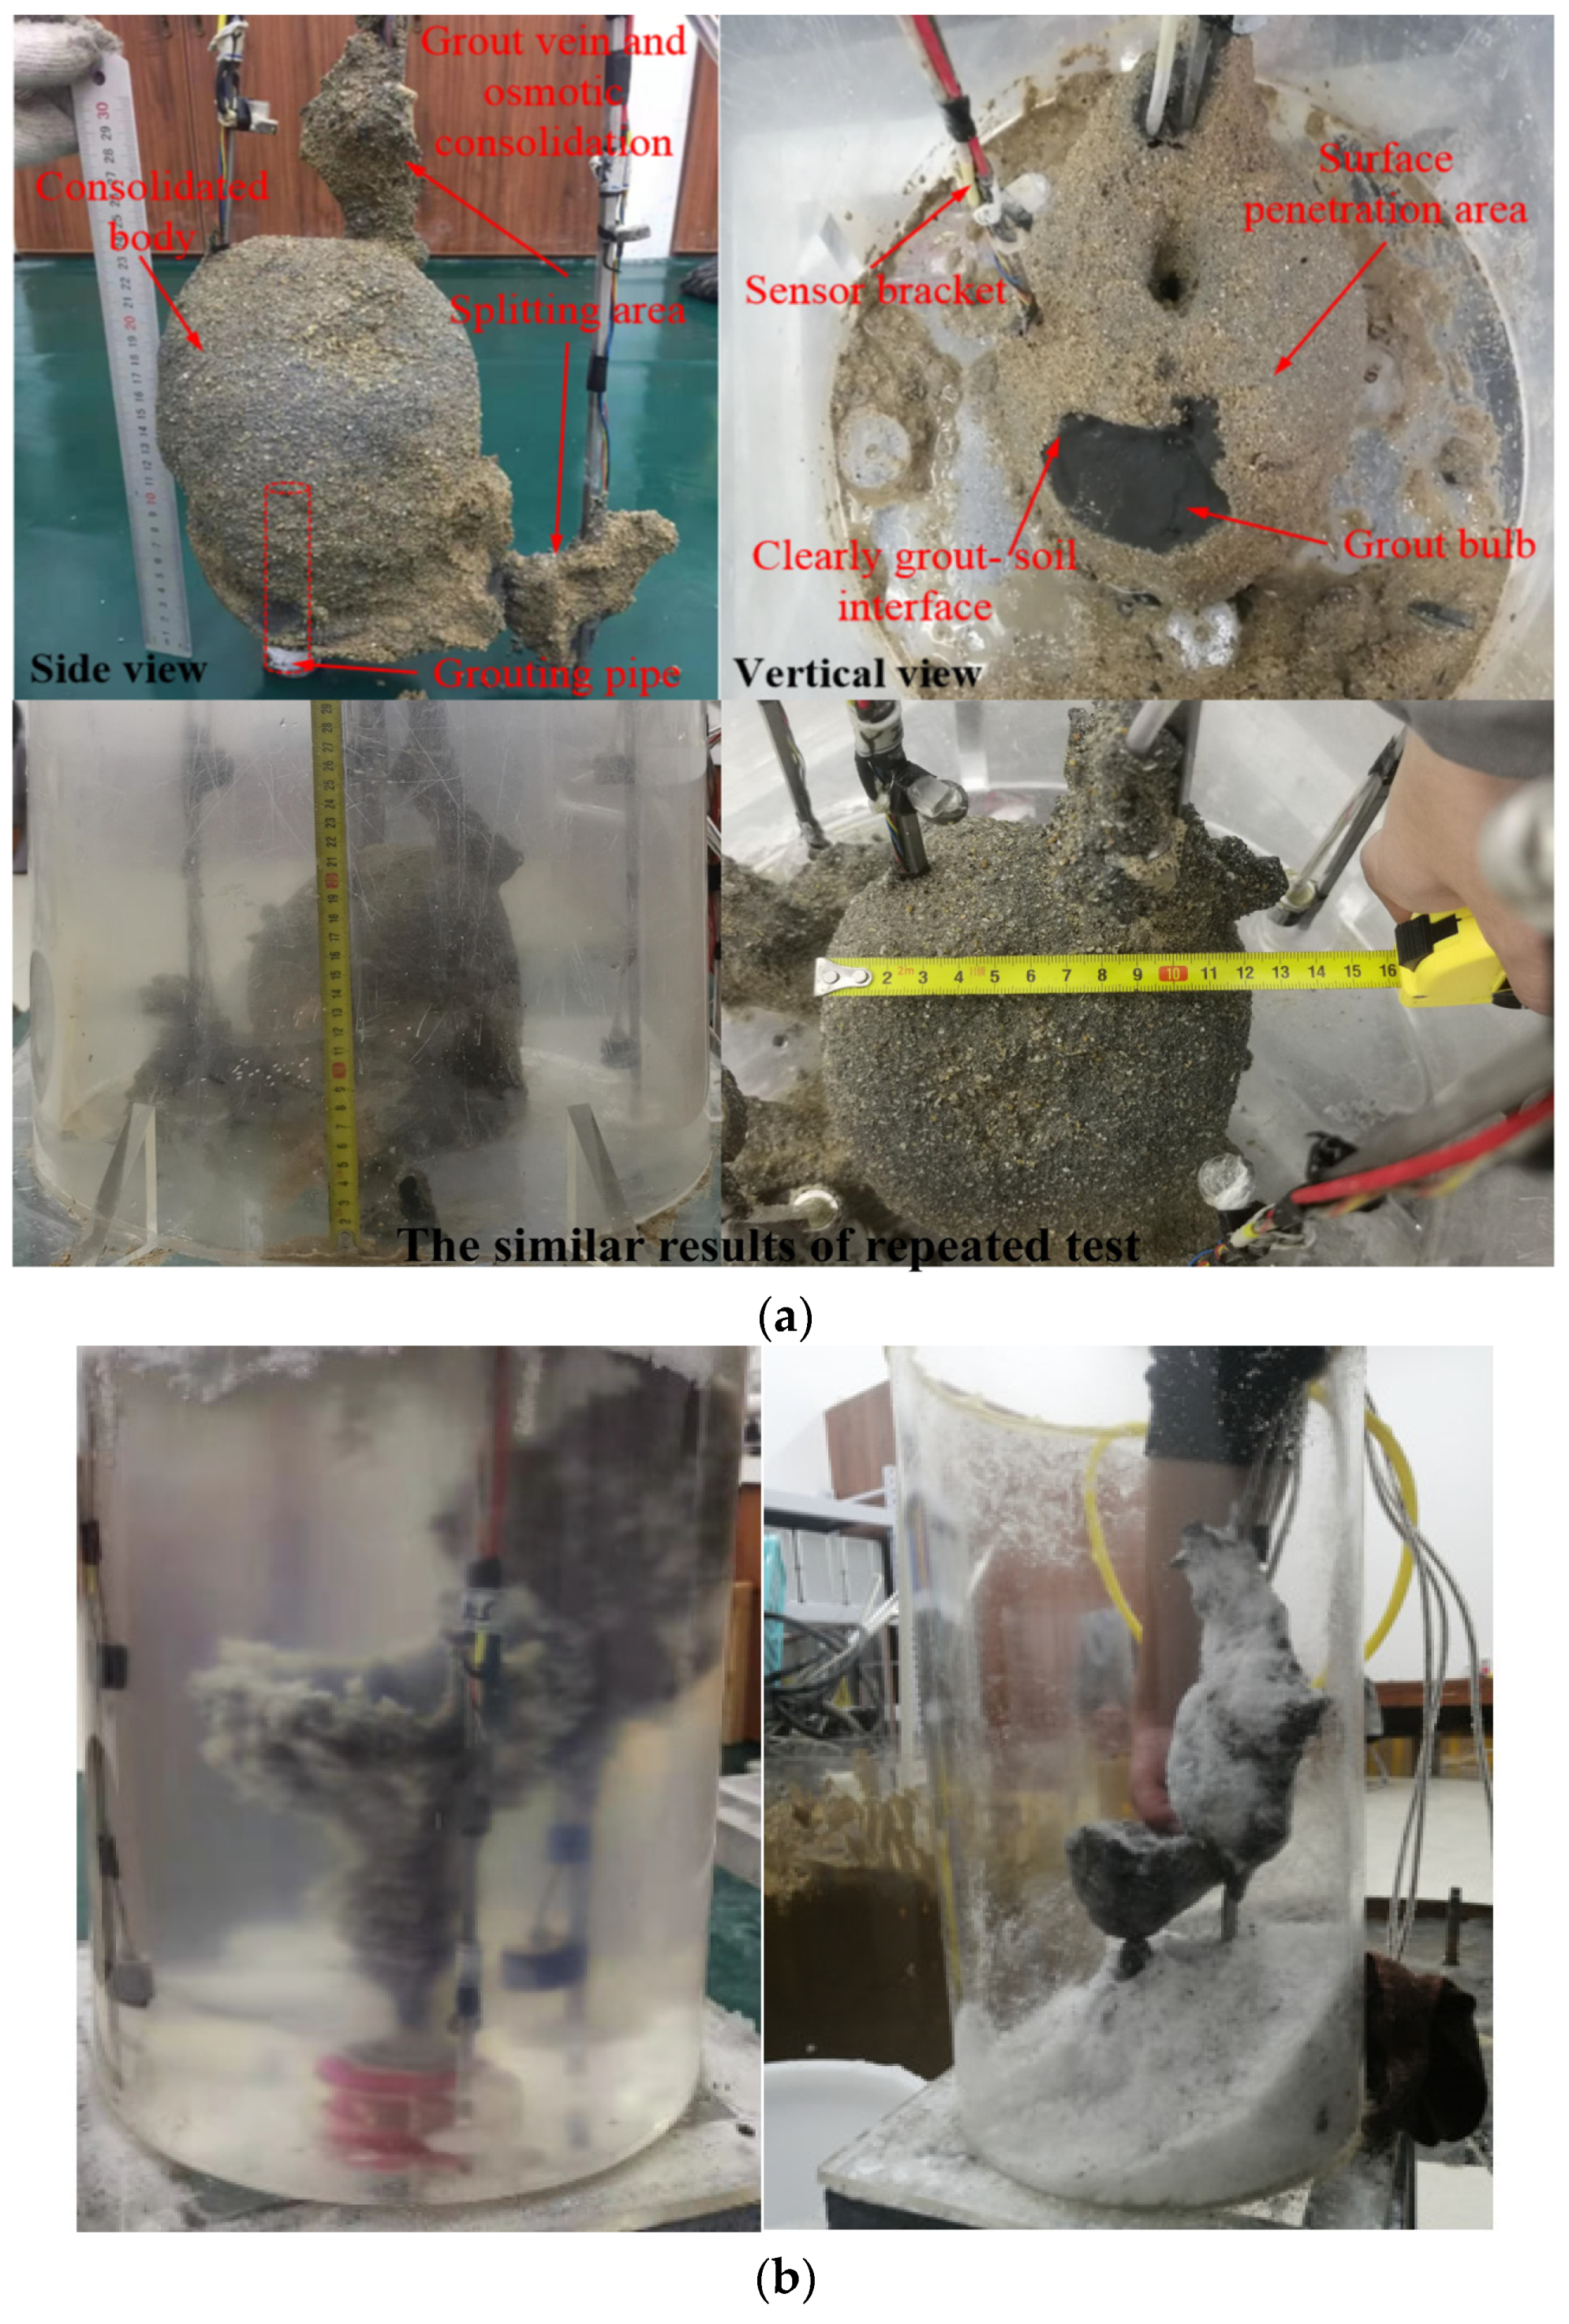
Under the aforementioned experimental conditions, multiple repeated experiments were conducted on medium–dense (void ratio e = 0.73–0.75) ordinary sand. After grouting completion, several sets of typical experimental results were obtained through excavation, as shown in Figure 3. Figure 3a indicates that, in the grouting test of ordinary sand, the grout consolidation body consists of grout stone body, mortar consolidation body, and grout vein body. Similarly, the same results can be clearly observed in the grouting test of transparent sand, as shown in Figure 3b. During the initial stages of grouting pressure, the permeation of grout into the sand dominates. For sand layers with good injectability, the grout generally diffuses through the sand particle medium in a permeation form. The grout effectively fills the pores within the particle framework and ultimately forms a relatively homogeneous grouting reinforcement body with the sand layer. Around the grouting holes in the sand, the grout permeates and expands, forming cohesive spherical stone bodies. This observation aligns with the understanding in engineering practice; as the grouting pressure increases, the compaction effect of the grout in the sand gradually becomes dominant. The grout bubbles expand gradually, exerting pressure on the surrounding soil. With the continuous increase in grouting pressure, when the grouting pressure reaches the strength of the soil at a certain contact point within the sand, cracking diffusion occurs immediately, and the grout rapidly fills the cracked fissures. Since the grouting pressure along the cracked fissures gradually decreases, permeation compaction occurs around the cracked fissures in the initial stage of cracking. As the grouting pressure continues to increase, the grouting pressure within the fissures gradually increases, causing the fissures to expand. Simultaneously, the increase in grouting pressure leads to the gradual expansion of grout bubbles and the generation of new cracks. It is worth noting that as the grouting pressure increases, when the pressure reaches a certain value, the phenomena of grout penetration, compaction, and cracking diffusion coexist. This finding is consistent with the conclusions of Yang et al. [21].

3.2. The Change in Uplift Displacement in Two Kinds of Soil

The relationship between grout diffusion and grouting pressure variation, as shown in Figure 4, was obtained by comparing the measurement of grouting pressure and observation of grout diffusion on the same time during the experiment, resulting in the curves and images depicted in Figure 4. The grouting pressure curve indicates that, when compaction diffusion predominates, the grouting pressure variation curve exhibits a smooth characteristic. However, during low-pressure infiltration, the grouting pressure curve is non-smooth. This may be due to the presence of pore water pressure in the sand soil pores (caused by the existence of excess pore water pressure during soil filling), which varies in size. Consequently, during each infiltration and crack occurrence, there is a significant drop in grouting pressure. Subsequently, the increase rate of grouting pressure after the sharp drop exceeds the increase rate before the drop, as can be directly observed from the average slope of the tangent lines of each segment of the grouting pressure curve. The starting and ending points of each segment exhibit distinct features in the graph, presenting a convex tip at the end of the pressure curve. Figure 4 further verifies the previous analysis regarding the formation of the stone structure. When the grouting pressure is relatively low, the diffusion of grout in the soil is mainly dominated by infiltration, with compaction as a secondary process. As the grouting pressure gradually increases, after the first minor fracturing, grout diffusion is primarily dominated by compaction, with infiltration as a secondary process. This continues until the occurrence of the second fracturing. Due to the compaction effect of the grout around the bubble, the permeability decreases, and, thus, infiltration mainly occurs around the fracturing grout veins at this point. After the second major fracturing, the higher grouting pressure reaches the surrounding soil’s resistance to fracturing. At this point, the grout diffusion is primarily dominated by fracturing, with compaction and infiltration around the grout veins as secondary processes. Consequently, continuous minor fracturing occurs. From the second fracturing to the third major fracturing stage, the pressure curve is no longer smooth, showing more concave endpoint characteristics. This further illustrates that grout diffusion in the soil is primarily dominated by fracturing, which is more visually observable in transparent sand, emphasizing the fracturing phenomenon.
While observing the temporal variations in the grouting pressure curve, significant characteristics are also evident in the changes in surface displacement caused by grouting, as shown in Figure 5. Both the grouting pressure and surface displacement exhibit good consistency in their temporal variations, showing a gradual increase followed by rapid growth with increasing grouting time. After the completion of grouting, the final surface displacement shows a larger displacement at the center (central measuring point) compared to the edges (fourth measuring point). In this experiment, the difference in displacement between the central point and the second and third points is relatively small, because these three points are located within the horizontal range of the grout bulb. The fourth measuring point, however, is located outside the horizontal range of the grout bulb, indicating that the grout is more effective in lifting the surface within the range of the grout bulb, while the lifting effect outside the grout bulb range is relatively smaller. The surface uplift displacement curves for the four measuring points (from the center to the fourth measuring point) exhibit similar characteristics. There is a nearly horizontal displacement–time development segment in the grouting displacement curve corresponding to the peak of grouting pressure (grouting fracture). The four displacement curves show a “stepped” growth pattern with increasing grouting time, and the speed of increase accelerates after each step, indicating a distinct stage-wise characteristic in the surface uplift displacement curves with the increase in grouting time.
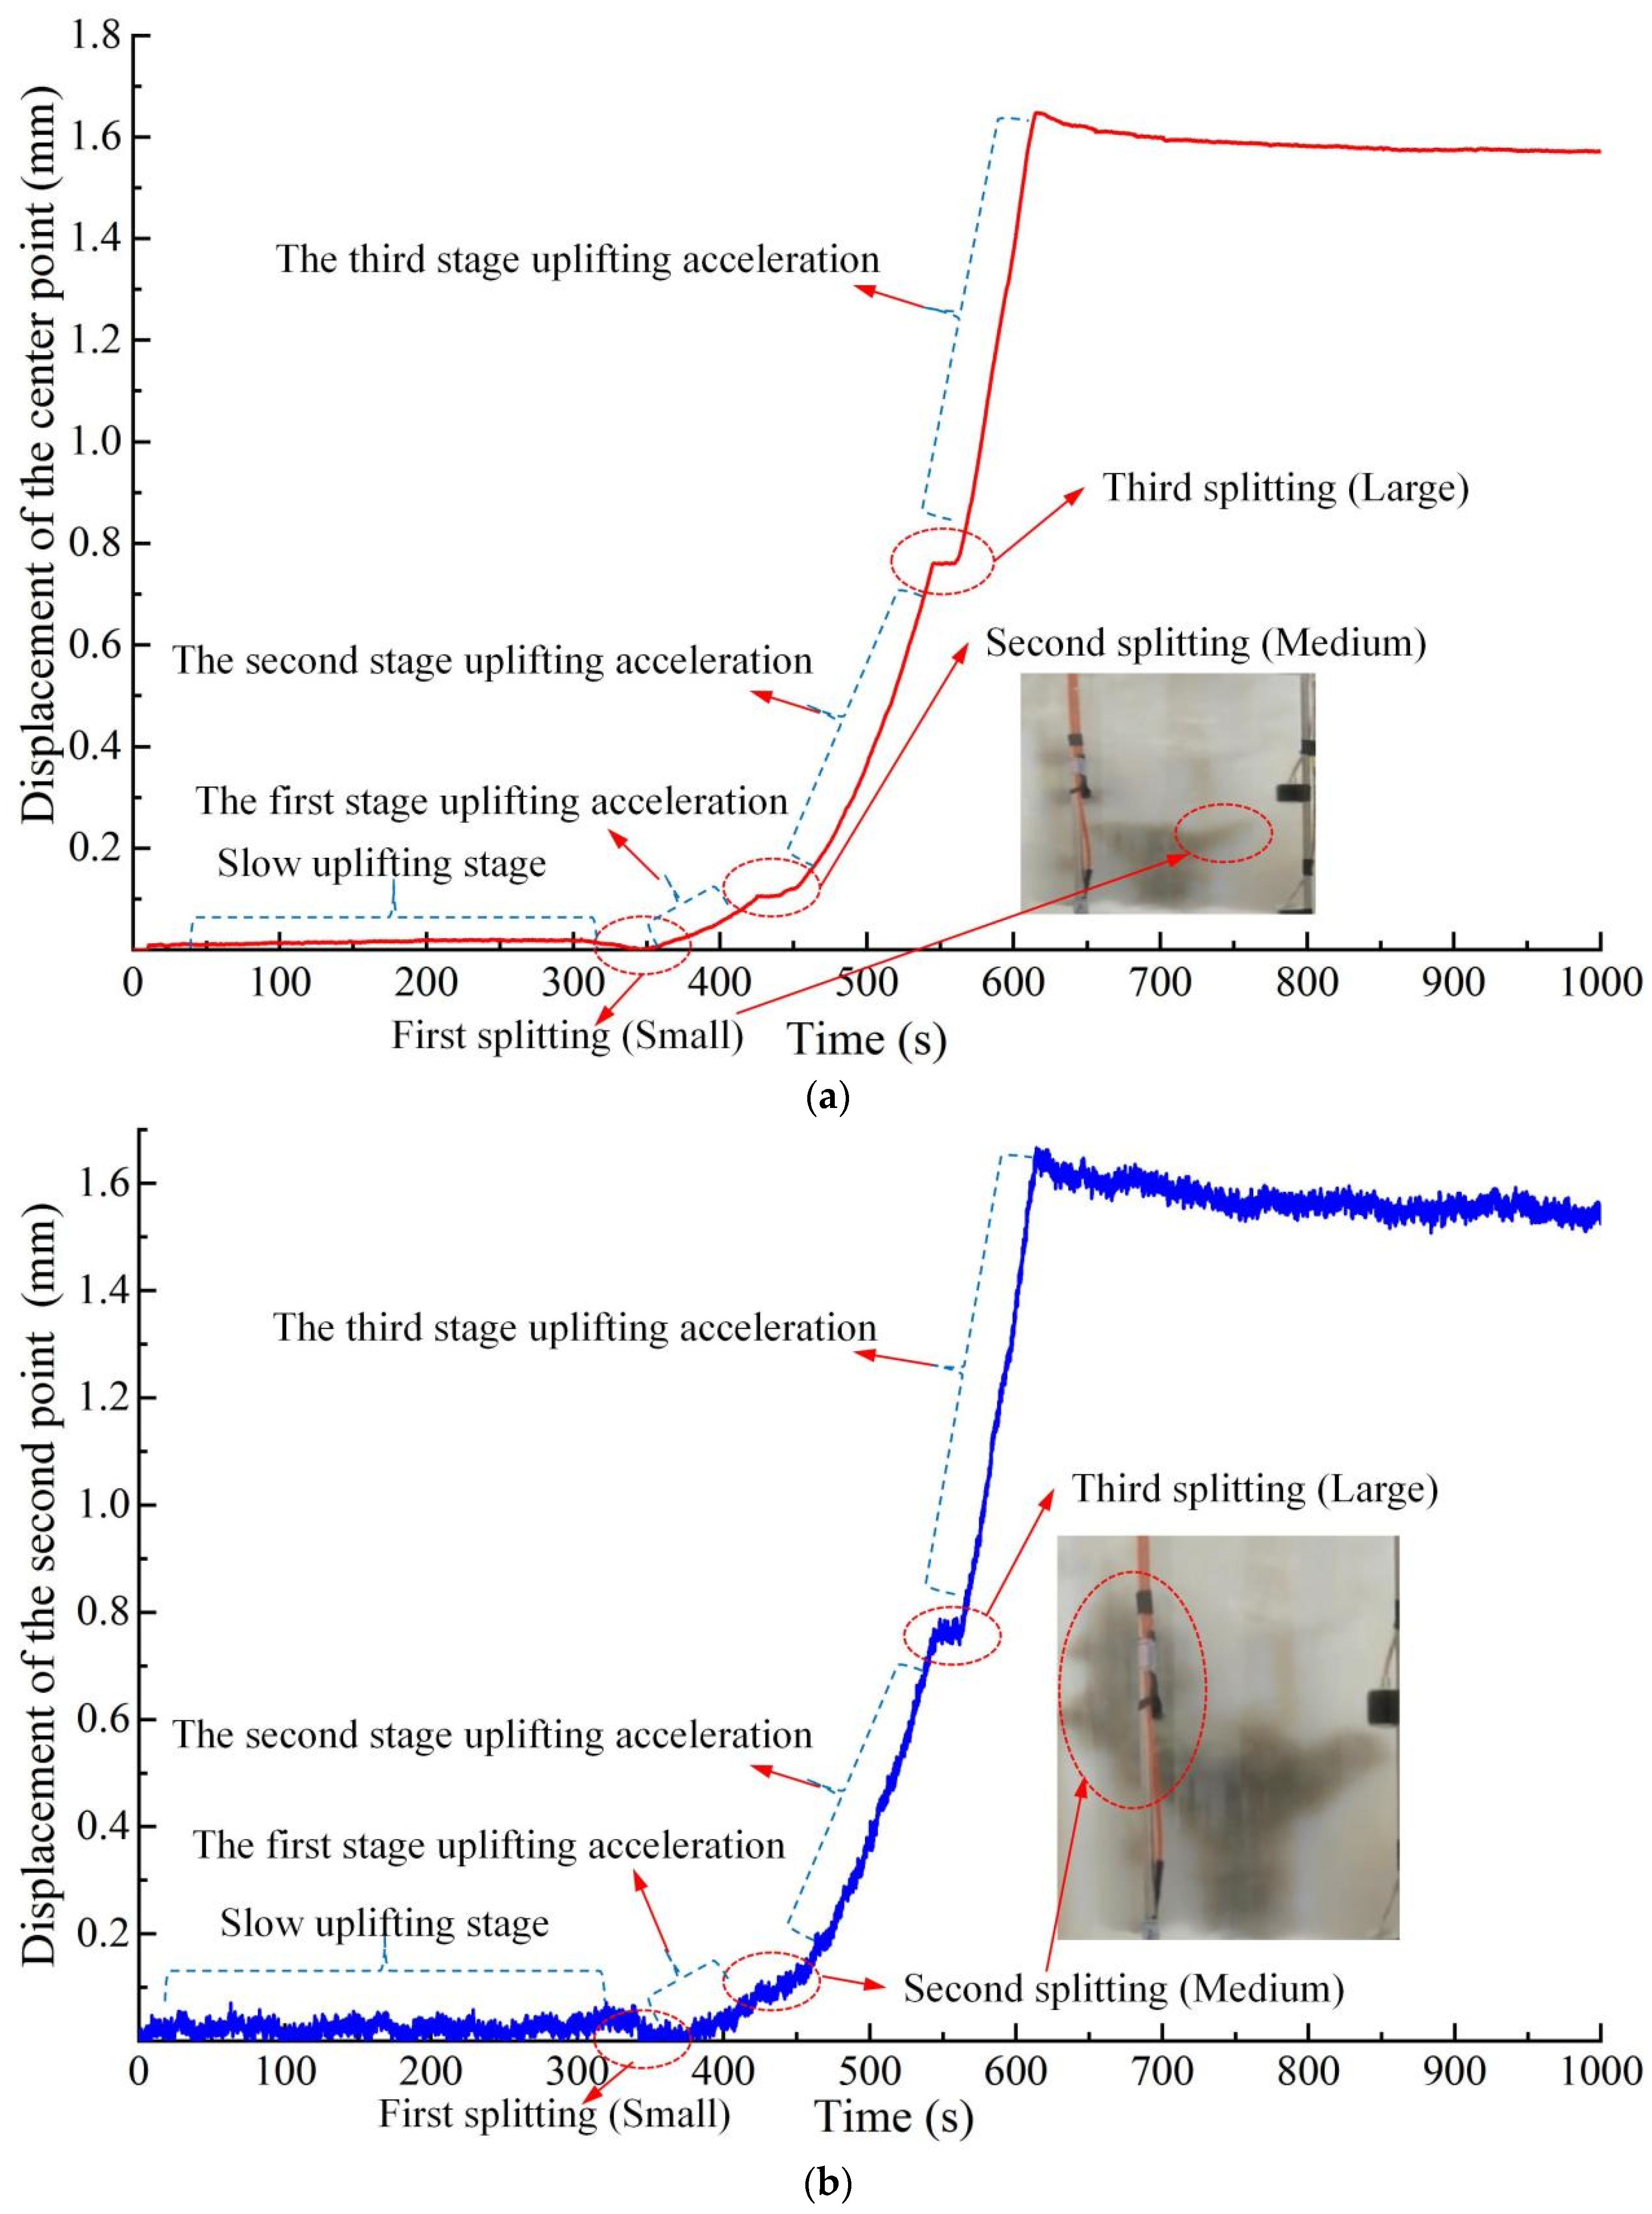
To more intuitively analyze the stage-wise characteristics of surface uplift displacement with respect to grouting time and its relationship with grout diffusion, the uplift displacement–grouting time development curves for the four measuring points are obtained based on the visualization images of grout diffusion in transparent sand, as shown in Figure 6.
Figure 6 indicates that the uplift displacement curves of the four monitoring points on the ground exhibit similar characteristics. The uplift displacement curves all undergo the following three developmental stages: a gradual increase stage, an accelerated increase stage, and a stable development stage. The first two stages represent the growth of uplift displacement during the grouting process, while the third stage occurs after the grouting has ceased. The process of increased uplift displacement is characterized by different acceleration stages, the quantity of which is primarily influenced by the fissure propagation of the grout during the grouting process. In this experiment, three significant fissures occurred, resulting in three distinct acceleration stages, namely the first uplift acceleration stage (associated with low-pressure minor splitting), the second uplift acceleration stage (related to medium-pressure moderate splitting), and the third uplift acceleration stage (involving high-pressure major splitting), as illustrated in Figure 6. Due to the utilization of non-steady-pressure grouting, the uplift displacement undergoes an initial phase of gradual increment as the grouting duration extends. Following the occurrence of the initial minor fracturing event (approximately 350 kPa), a certain level of fluctuation in displacement becomes evident. Subsequently, there emerges the first phase of accelerated uplift displacement variation. Notably, the uplift displacement vs. grouting time curves of the four monitoring points exhibit uniform characteristics during this stage. It is worth noting that during the first minor splitting, there was no significant peak observed in the grouting pressure curve, indicating a sudden drop in grouting pressure. This phenomenon could be attributed to the installation of the pressure sensor at the far end from the grouting pipe, resulting in weakened transmission of pressure loss due to the viscous effect of the grout and the frictional resistance within the pipeline during the grouting process. Additionally, due to the relatively low grouting pressure, it was not reflected on the grouting pressure curve, but notable changes were observed in the displacement curve. During the phase of accelerated uplift displacement, which corresponds to the first increase in grouting pressure with increasing grouting time, the uplift displacement continues to increase until the occurrence of the second significant splitting. At this point, a brief nearly horizontal displacement–time curve is observed in the displacement curve corresponding to the peak of the grouting pressure (splitting grouting). This phenomenon arises from the significant attenuation of grouting pressure along the length of the splitting crack after splitting [23]. Although the grouting pressure gradually increases during the initial stage of fracturing, the attenuation of grouting pressure leads to mainly permeation and compaction effects around the grout vein. However, the contribution of permeation and compaction to uplift displacement is relatively small. Therefore, in the initial stage after splitting, a brief nearly horizontal displacement–time curve appears in the uplift displacement. With the further increase in grouting pressure, the widening of the fissure reduces the attenuation effect. Additionally, the increased grouting pressure exerts greater pressure on the soil surrounding the fissure, leading to more pronounced compaction and splitting effects in the sand. This prompts another increase in uplift displacement with the increase in grouting pressure. Once the pressure reaches the initiation pressure for secondary splitting at a certain location within the sand, a second splitting occurs promptly due to the substantial grouting pressure. Moreover, a similar near-horizontal displacement–time development curve also appears in the initial uplift displacement after splitting. This splitting process continues in a cycle until grouting is stopped. After each splitting, the rate of uplift displacement increases, as evidenced by the average slope of the uplift velocity stages in the displacement curves of each monitoring point depicted in Figure 6. The aforementioned process can be visualized through images of grout diffusion obtained at corresponding time points of uplift displacement vs. grouting time curves, as shown in Figure 6a–c. These images, respectively, depict grout diffusion during the first minor splitting, the second intermediate splitting, and the third major splitting, all occurring during the grouting process. The completion of grouting and subsequent excavation provide clear evidence of the spatiotemporal development patterns of grout diffusion, as well as the corresponding variations in uplift displacement curves, as depicted in Figure 6d. Figure 6a–d demonstrate that the uplift displacement vs. grouting time curves of the four monitoring points exhibit a typical “stepwise” growth pattern, with an increase in speed after each step.

3.3. Analysis of Dynamic Deformation Characteristics of Transparent Sand Particles in Grouting Process

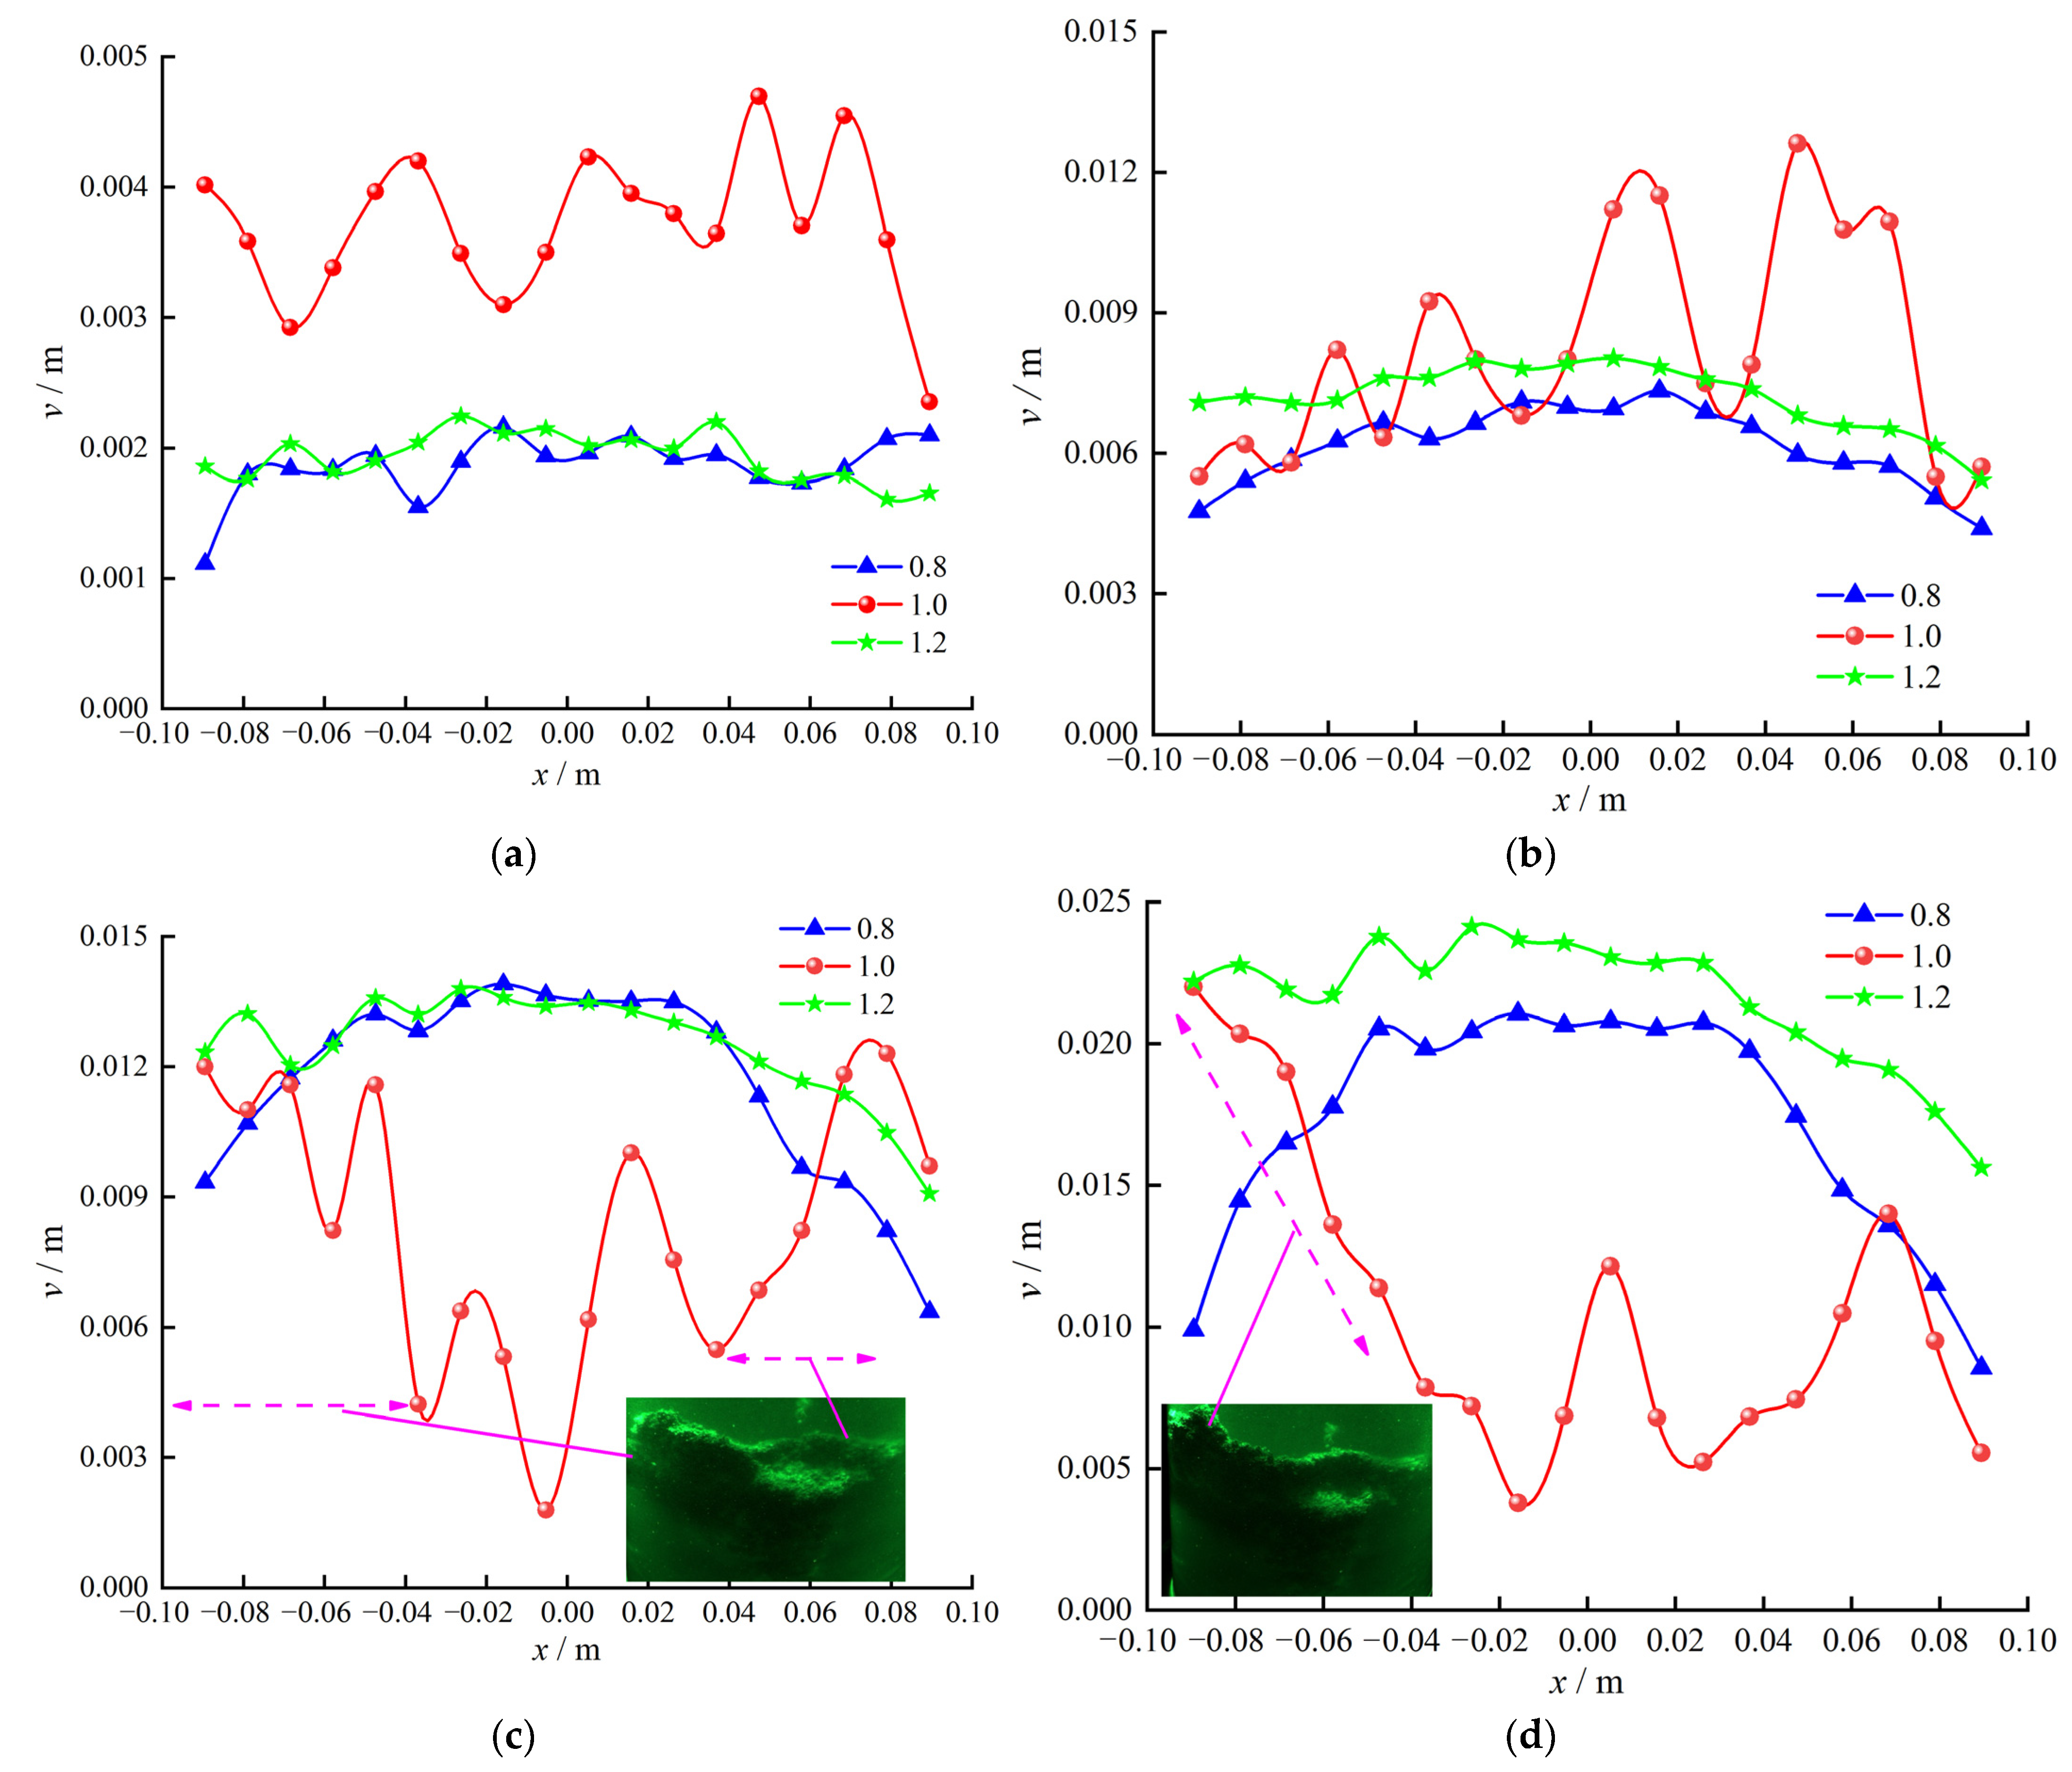
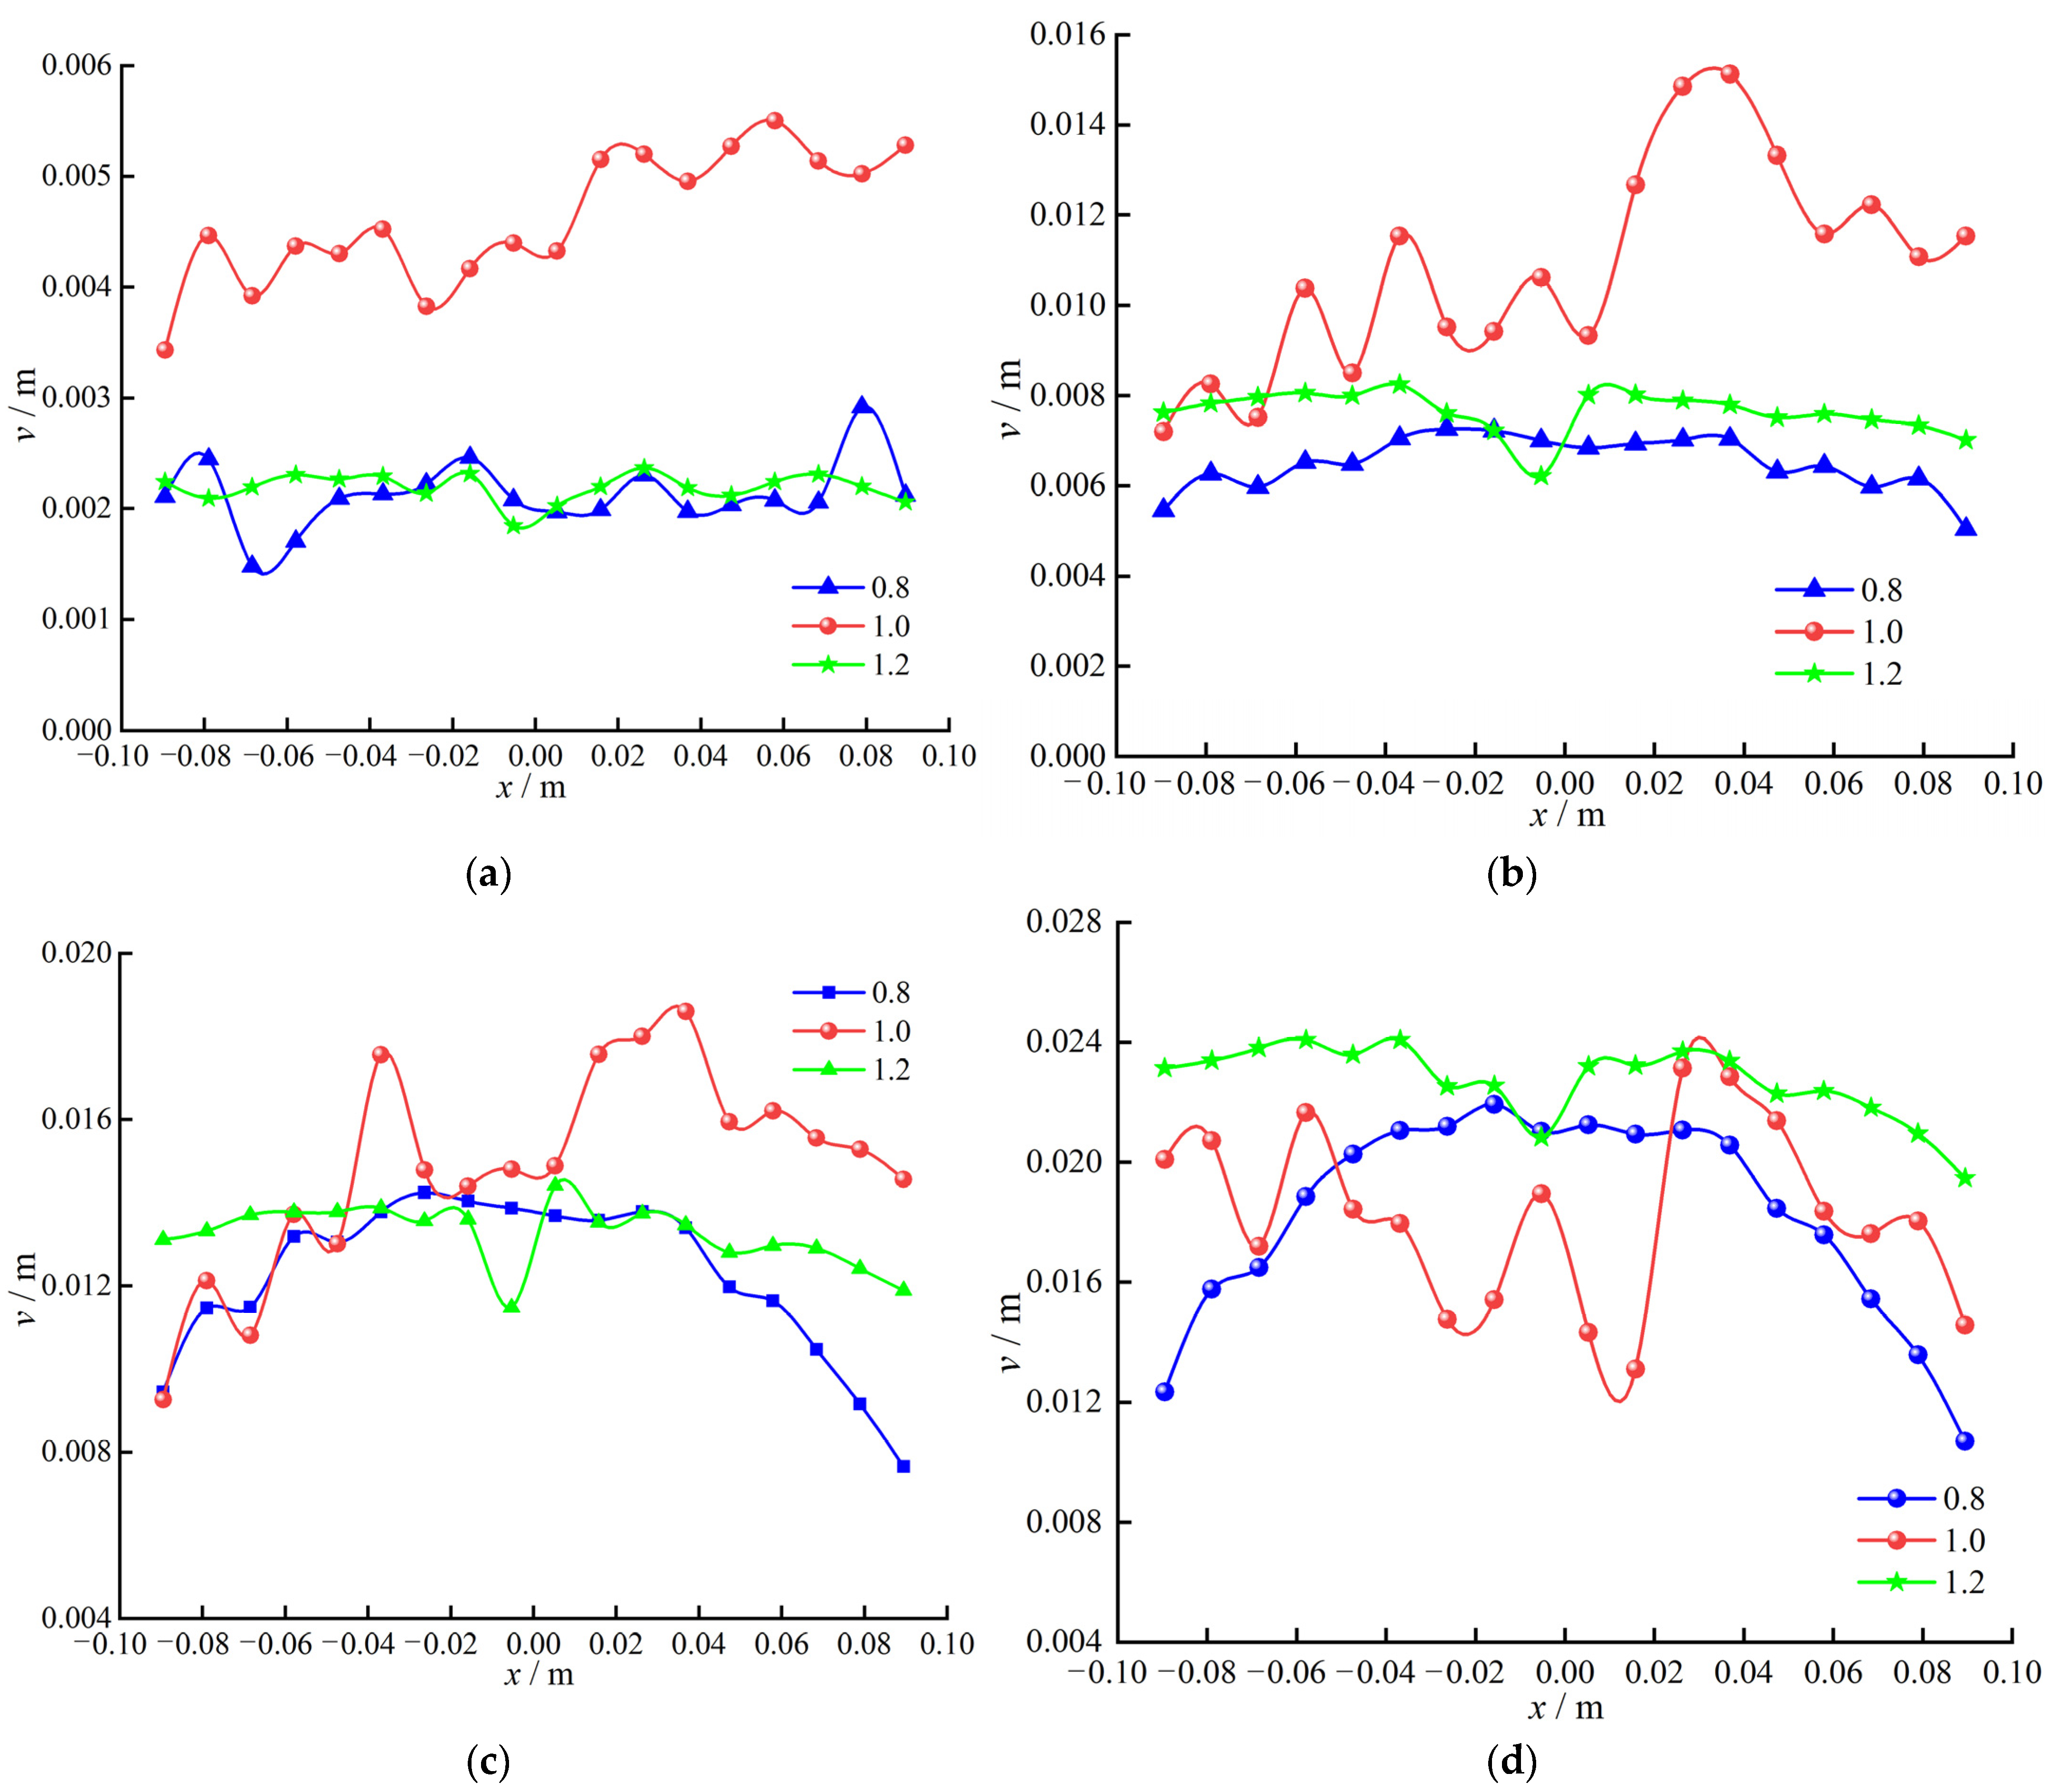
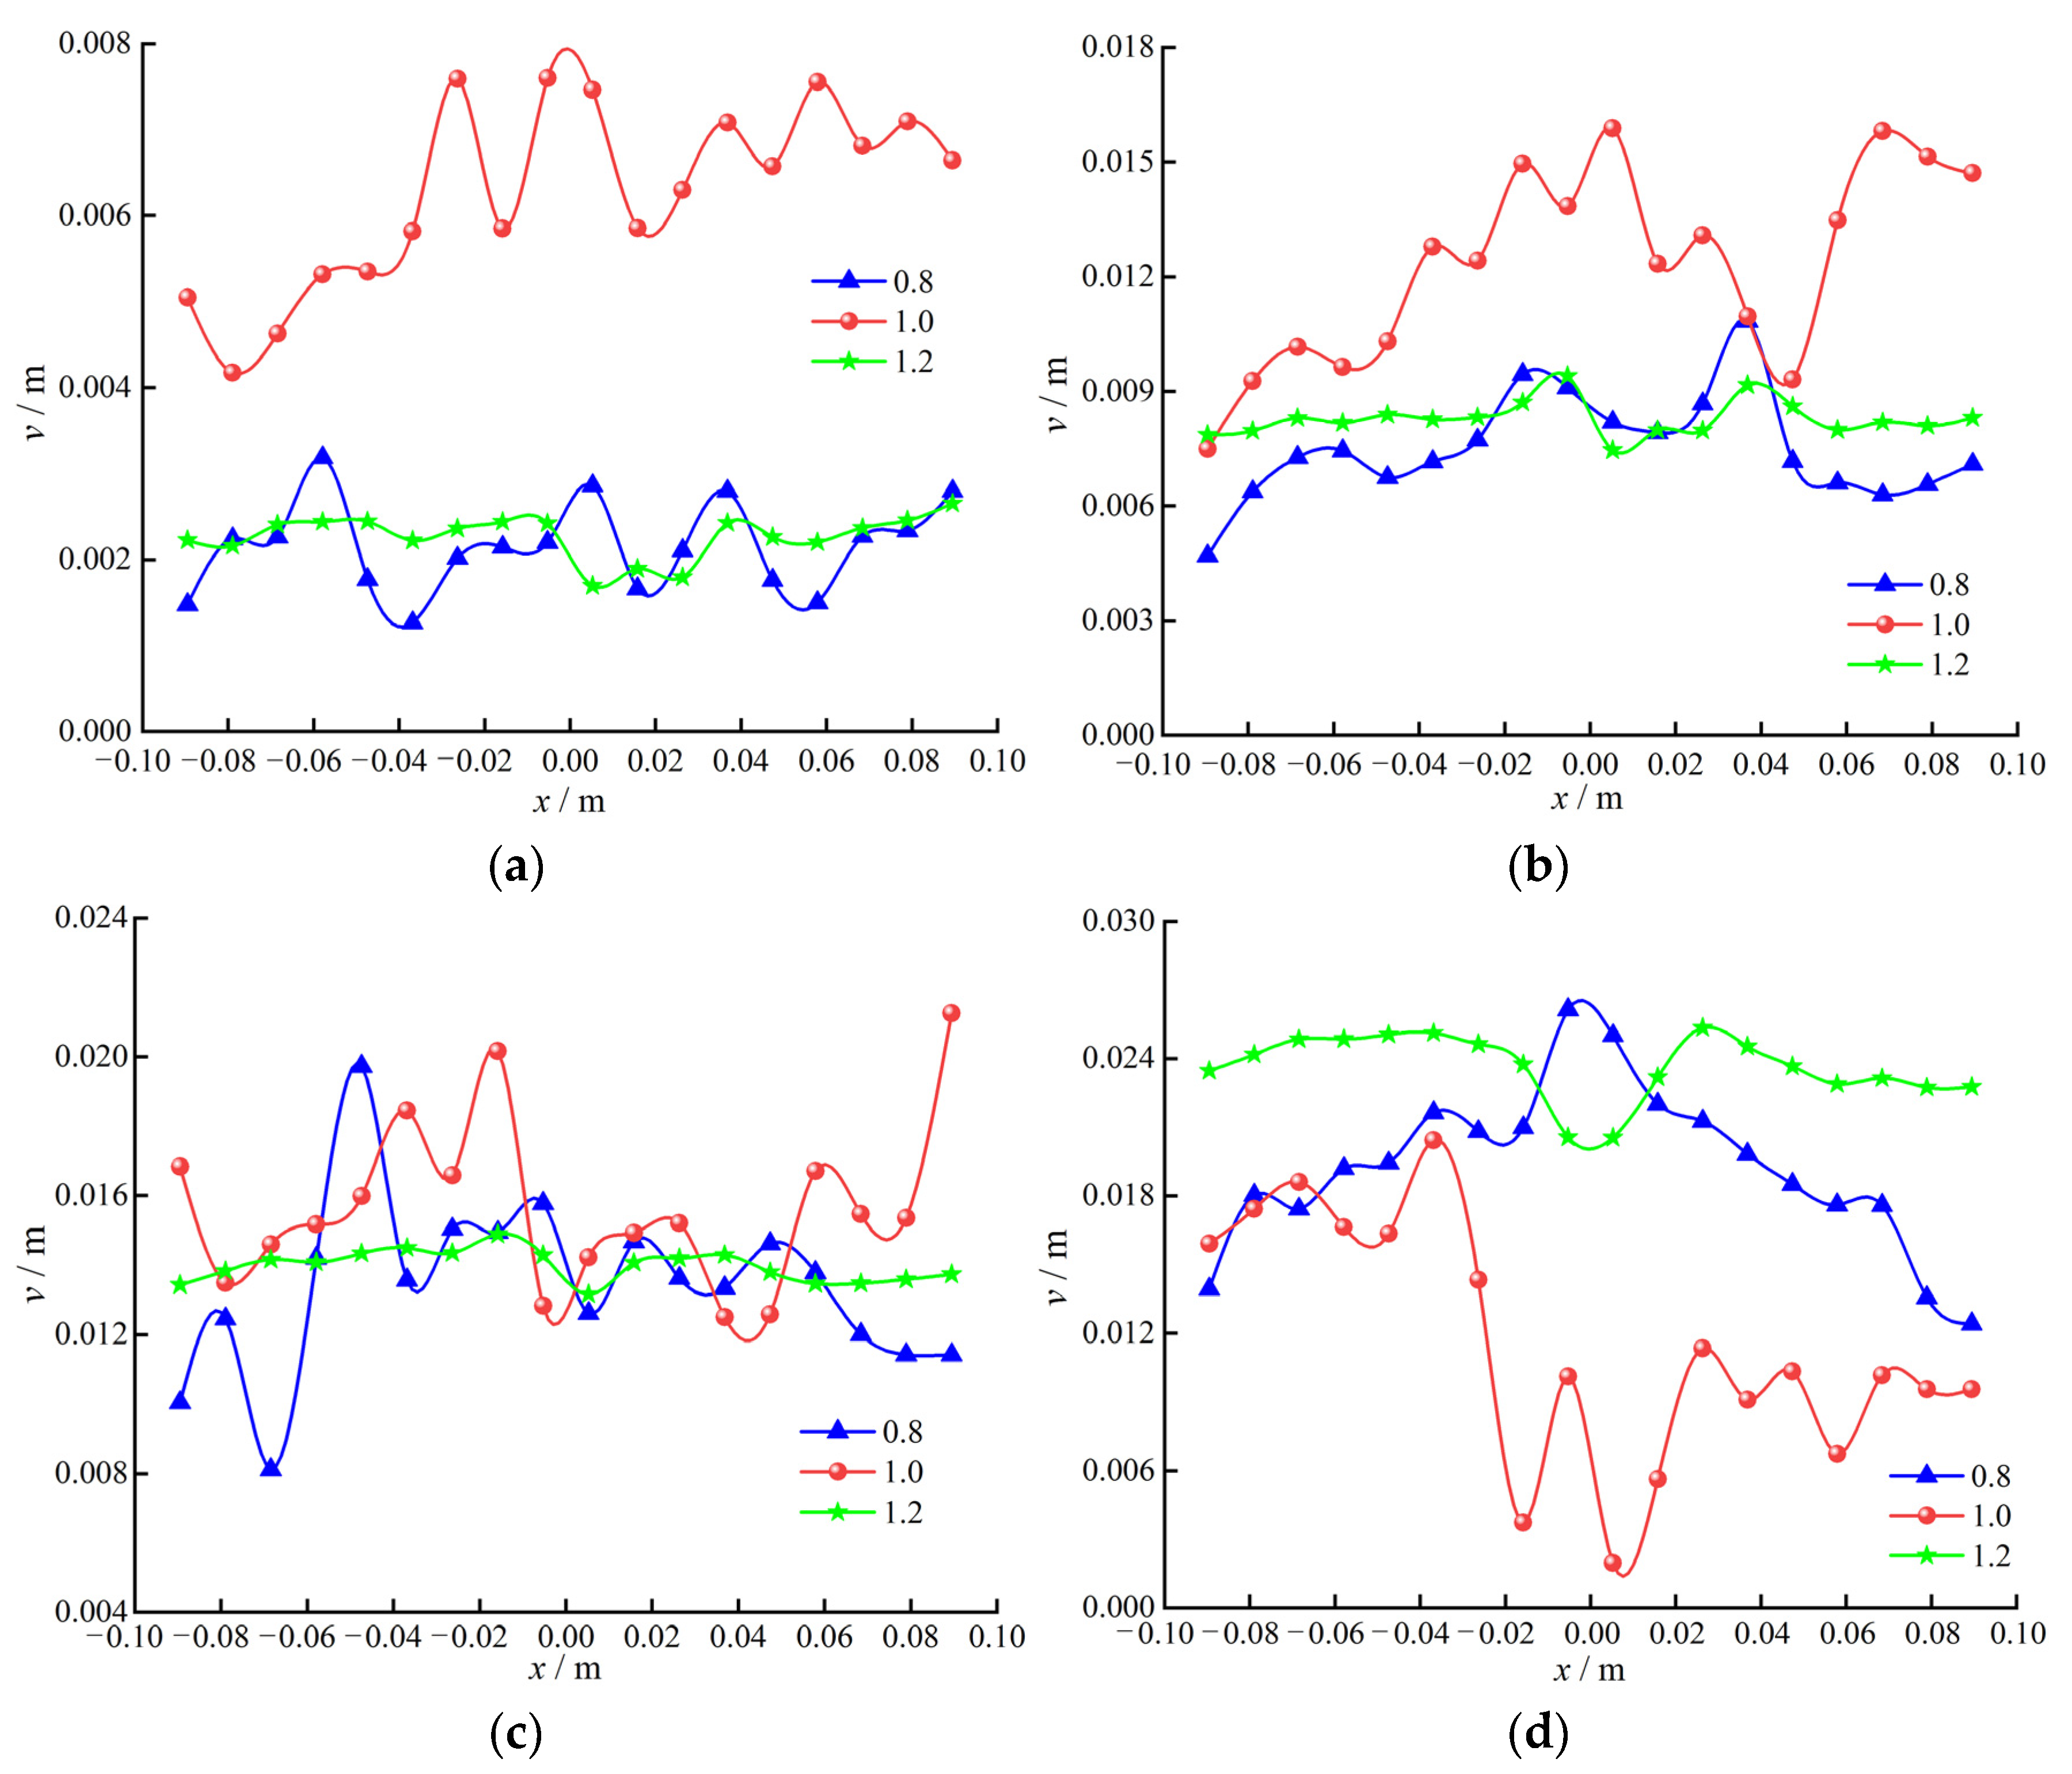
Transparent sand grouting tests were conducted with three water–cement ratios (w/c = 0.8, 1.0, 1.2). To maintain consistency in the experimental sand parameters, the sand filling height was set at 300 mm, and the natural consolidation time was standardized to 24 h. The laser was directed from top to bottom to avoid the influence of the model bucket on laser penetration and to minimize the occlusion of the laser beam by the grout, primarily focusing on monitoring the vertical displacement of the sand layer. To obtain the dynamic deformation characteristics during the grouting process in transparent sand, different w/c of grout were selected at four time points (0.25 t, 0.50 t, 0.75 t, t) based on grouting time (t), and the uplift displacements (v) of sand at three heights (burial depth h) from the ground surface (0.15 m, 0.10 m, 0.05 m) were analyzed. At each height, 18 data points were extracted along the horizontal direction at equal intervals. The dynamic deformation characteristics of transparent sand during the grouting process can be obtained, as depicted in Figure 7, Figure 8 and Figure 9.
According to the test results, the vertical displacement of transparent sand increases progressively with the grouting process. For w/c = 1.0, during the later stages of grouting (k = t), the vertical displacement of sand layers at different depths exhibits a similar distribution trend along the horizontal direction. Due to the lower concentration of grout with the w/c = 1.2, the vertical displacement values of the sand at the same height along the horizontal direction during grouting are similar, indicating an overall uplift phenomenon of the transparent sand. The grout with w/c = 1.2 exhibits an overall “inverted cone” diffusion pattern, but there are significant differences in the direction of grout diffusion during this process, resulting in a “ripple” effect on the particle displacement of the overlying transparent sand throughout the grouting process.
Further analysis reveals the impact patterns of different water–cement ratio grouts on the displacement of transparent sand at various burial depths. As illustrated in Figure 7, at a burial depth of h = 0.15 m, during the initial stages of grouting, the effect of the grout on the sand is minimal, resulting in relatively small displacement of the sand. Specifically, the uplift displacement for grouts with water–cement ratios of 0.8 and 1.2 is similar, while that for w/c = 1.0 is relatively larger (k = 0.25 t). When the grouting process reaches k = 0.50 t, the vertical displacement of the transparent sand significantly increases. All three water–cement ratio grouts exhibit a typical displacement pattern of “higher in the middle and lower on both sides”, indicating that the grout primarily uplifts the central portion of the transparent sand at this stage. At k = 0.75 t, the grout-induced uplift displacement for w/c = 0.8 and 1.2 still follows the pattern of “higher in the middle and lower on both sides” along the horizontal direction, but with increased displacement. However, for w/c = 1.0, it exhibits a “lower in the middle and higher on both sides” pattern, indicating the initiation of “sheet-like” fracturing diffusion of the grout (Figure 7b,c). At the end of grouting (Figure 7d), the grout with w/c = 1.2 does not experience significant horizontal loss, resulting in the highest uplift displacement. In contrast, the grout with w/c = 1.0 tends to develop towards the left laser plane, leading to a gradual decrease in uplift displacement within the −0.1 to −0.02 m range.
At a depth of h = 0.10 m (as shown in Figure 8), the vertical displacement characteristics of the sand induced by the grout with w/c = 0.8 and 1.2 are similar to those at h = 0.15 m, exhibiting a trend of “higher in the middle and lower on both sides” as the grouting progresses. The uplift displacement from the grouting with w/c = 1.0 shows a gradual increase from left to right across the laser plane (as shown in Figure 8a–c), indicating a more pronounced effect of the grout on the uplift displacement of the sand particles on the right side at a depth of h = 0.10 m. However, in the later stages of grouting (k = t), the trend becomes more consistent with that at h = 0.15 m.
At a depth of h = 0.05 m (as shown in Figure 9), during the initial stages of grouting (k = 0.25 t, 0.50 t), the vertical uplift displacement of the sand particles along the horizontal direction is similar, especially notable for w/c = 1.2, with the peak displacement of w/c = 0.8 shifting from the sides to the center. As the grouting progresses, there is a transition in the magnitude of the upper layer sand displacement caused by the grout with w/c = 1.0 compared to w/c = 0.8 and 1.0 (as shown in Figure 9d). Combined with the analysis of the morphology of the stone body (Figure 3), it is evident that the horizontal splitting of the grout has a more significant impact on the uplift displacement of the overlying sand, and this impact increases with the increasing grout injection volume.

4. Conclusions

Through the self-developed three-dimensional grouting model experimental device, non-constant-pressure grouting diffusion model experiments were conducted to study the spatiotemporal development characteristics of grout diffusion in both common sand and transparent sand. Based on the visualization properties of transparent sand, the time-varying characteristics and interrelationships among grouting pressure, grout diffusion, and surface uplift displacement during non-constant-pressure grouting were analyzed. The conclusions are as follows:
(1)
During non-steady-pressure grouting, at lower grouting pressures, grout primarily permeates through the sand, resulting in the formation of spherical grout bodies. As the grouting pressure increases, the compaction effect of the grout in the sand gradually becomes dominant, compacting the surrounding soil. With a continued increase in grouting pressure, the sand undergoes splitting, and the grout rapidly fills the cracks. During the initial stages of fracturing, there is permeation and compaction around the cracks. As the grouting pressure continues to increase, the pressure within the cracks gradually rises, promoting crack propagation. Additionally, as the grouting pressure increases, the grout pockets expand, leading to the formation of new cracks.
(2)
When compaction is predominant, the grouting pressure curve exhibits a smooth characteristic, whereas during low-pressure permeation, the grouting pressure curve is non-smooth. A sharp decrease in grouting pressure occurs when grouting fracturing happens, followed by an increase in grouting pressure that exceeds the rate of decrease. Each segment has distinct features in terms of its starting and ending points on the graph, showing a concave tip on the pressure curve.
(3)
The changes in surface displacement induced by grouting also exhibit noticeable characteristics. The curves of grouting pressure and surface displacement show good consistency with grouting time, displaying a gradual increase followed by rapid growth. The characteristics of surface uplift displacement curves are generally consistent, all undergoing three developmental stages: a slow increase stage, an accelerated increase stage, and a stable increase stage. The diffusion mode and direction of grout have a direct impact on the deformation characteristics of the overlying sand.
(4)
The uplift displacement curve exhibits a characteristic “step-like” growth pattern, with an increase in speed after each step, indicating distinct stage-wise features in the surface displacement curve with increasing grouting time. Visualized grouting experiments reflect good consistency in the effects of grouting pressure, grout diffusion, and their corresponding uplift displacement. For the grout with w/c = 0.8, the deformation overall shows a symmetrical distribution pattern of “higher in the middle, lower on the sides”. The distribution of vertical displacement along the horizontal direction for w/c = 0.8 and 1.2 tends to become horizontal with decreasing depth. The diffusion direction of the grout with w/c = 1.0 varies, leading to a fluctuating dynamic deformation pattern resembling “ripples” in the transparent sand.
In the future, we aim to achieve three-dimensional visualization of large-scale transparent soil and simultaneously capture multidirectional displacements. This will allow us to investigate the spatiotemporal correlation characteristics between grout diffusion and uplift deformation.

Author Contributions

Conceptualization, H.-X.H. and C.D.; methodology, W.C.; formal analysis, Y.-F.L.; writing—original draft preparation, W.C. and C.D.; writing—review and editing, W.C. and C.D.; supervision, H.-X.H. and C.D.; funding acquisition, H.-X.H. and C.D. All authors have read and agreed to the published version of the manuscript.

Funding

The present work was funded and supported by the National Natural Science Foundation of China under Grant 52078494; The Scientific Research Project of Hunan Provincial Department of Education—Outstanding Youth Project under Grant 22B0790; Yiyang City Philosophy and Social Science Project—Youth Key Project under Grant 2023YS014; the Hunan City University Students’ Innovative Training Program Project under Grant S202311527032.

Institutional Review Board Statement

Not applicable.

Informed Consent Statement

Not applicable.

Data Availability Statement

The data and analysis scripts from this study may be made available on request to the corresponding author. The data are not publicly available due to privacy concerns.

Conflicts of Interest

The authors declare no competing interests.

References

  1. Hu, H.X.; Deng, C.; Chen, W. The effect of magnetization conditions on the stability of cement grout. Case Stud. Constr. Mater. 2022, 16, e01016. [Google Scholar] [CrossRef]
  2. Hu, H.X.; Deng, C. Effect of magnetized water on the stability and consolidation compressive strength of cement grout. Materials 2021, 14, 275. [Google Scholar] [CrossRef]
  3. Marwan, A.; Zhou, M.M.; Abdelrehim, M.Z.; Meschke, G. Optimization of artificial ground freezing in tunneling in the presence of seepage flow. Comput. Geotech. 2016, 75, 112–125. [Google Scholar] [CrossRef]
  4. García Calvo, J.L.; Pedrosa, F.; Carballosa, P.; Revuelta, D. Evaluation of the sealing effectiveness of expansive cement grouts through a novel water penetration test. Constr. Build. Mater. 2020, 251, 118974. [Google Scholar] [CrossRef]
  5. Stempkowska, A.; Wójcik, Ł.; Ostrowski, K.A.; Gawenda, T. Low-energy clay-cement slurries find application as waterproofing membranes for limiting the migration of contaminants-Case studies in Poland. Energies 2023, 16, 230. [Google Scholar] [CrossRef]
  6. Boschi, K.; Prisco, C.G.D.; Grassi, D.; Modoni, G.; Salvatore, E. Nanosilica grout permeation in sand: Experimental investigation and modeling. J. Geotech. Geoenviron. Eng. 2024, 150. [Google Scholar] [CrossRef]
  7. Li, D.; Li, X.; Hu, Y.; Zhang, S.; Mei, C.; Wu, H.; Sun, X.; Fu, Y. Study on dispersion of cement grout in sand considering filtration effect through the EDTA titration test. Geofluids 2020, 2020, 6620979. [Google Scholar] [CrossRef]
  8. Ding, W.; Duan, C.; Zhang, Q. Experimental and numerical study on a grouting diffusion model of a single rough fracture in rock mass. Appl. Sci. 2020, 10, 7041. [Google Scholar] [CrossRef]
  9. Jiang, D.; Cheng, X.; Luan, H.; Wang, T.; Zhang, M.; Hao, R. Experimental investigation on the law of grout diffusion in fractured porous rock mass and its application. Processes 2018, 6, 191. [Google Scholar] [CrossRef]
  10. Liu, J.; Zhang, Q.; Zhang, L.; Peng, F.; Li, Z.; Weng, X. Model test on segmental grouting diffusion process in muddy fault of tunnel engineering. Geofluids 2020, 2020, 6698011. [Google Scholar] [CrossRef]
  11. Li, P.; Zhang, Q.; Zhang, X.; Li, S.; Li, X.; Zuo, J. Grouting diffusion characteristics in faults considering the interaction of multiple grouting. Int. J. Geomech. 2017, 17, 04016117. [Google Scholar] [CrossRef]
  12. Soga, K.; Au SK, A.; Jafari, M.R.; Bolton, M.D. Laboratory investigation of multiple grout injections into clay. Géotechnique 2004, 54, 81–90. [Google Scholar] [CrossRef]
  13. Zhang, J.; Li, S.C.; Li, Z.F.; Yang, L.; Zhang, Q.S.; Wang, K.; Qi, Y.H.; Du, J.; Li, H.T. Effect of particle size distribution on the grout diffusion pattern in completely and strongly weathered granite. Indian Geotech. J. 2019, 50, 531–539. [Google Scholar] [CrossRef]
  14. Zhang, L.; Zhang, Q.; Li, Z.; Wang, H. Test on compaction reinforcement effect of sand. Adv. Mater. Sci. Eng. 2020, 2020, 3685619. [Google Scholar] [CrossRef]
  15. Bezuijen, A.; Grotenhuis, R.T.; Tol, A.V.; Bosch, J.W.; Haasnoot, J.K. Analytical model for fracture grouting in sand. J. Geotech. Geoenviron. Eng. 2011, 137, 611–620. [Google Scholar] [CrossRef]
  16. Guo, Y.X.; Zhang, Q.S.; Zhang, L.Z.; Liu, R.T.; Chen, X.; Liu, Y.K. Experimental study on groutability of sand layer concerning permeation grouting. Adv. Mater. Sci. Eng. 2021, 2021, 6698263. [Google Scholar] [CrossRef]
  17. Li, Z.P.; Zhang, L.Z.; Chu, Y.T.; Zhang, Q. Research on influence of water-cement ratio on reinforcement effect for permeation grouting in sand layer. Adv. Mater. Sci. Eng. 2020, 2020 (Suppl. S1), 5329627. [Google Scholar] [CrossRef]
  18. Guo, C.C.; Hu, D.P.; Wang, F.M. Diffusion behavior of polymer grouting materials in sand and gravel. Soil Mech. Found. Eng. 2021, 57, 440–444. [Google Scholar] [CrossRef]
  19. Li, Z.C.; Wang, G.H.; Li, J.; Lv, Z. Experimental study on vacuum grouting in silty sand stratum. Math. Probl. Eng. 2020, 2020, 2689059. [Google Scholar] [CrossRef]
  20. Wang, D.; Sui, W. Grout diffusion characteristics during chemical grouting in a deep water-bearing sand layer. Int. J. Min. Sci. Technol. 2012, 22, 589–593. [Google Scholar] [CrossRef]
  21. Yang, J.Y.; Cheng, Y.H.; Chen, W.C. Experimental study on diffusion law of post-grouting slurry in sandy soi. Adv. Civ. Eng. 2019, 2019, 3493942. [Google Scholar]
  22. Kleinlugtenbelt, R.; Bezuijen, A.; van Tol, A.F. Model tests on compensation grouting. Tunn. Undergr. Space Technol. 2006, 21, 435–436. [Google Scholar] [CrossRef]
  23. Hu, H.X.; Gan, B.Q.; Deng, C.; Xie, Z.; Lu, Y.; Cai, Y. Experimental study on the efect of water-cement ratios on the difusion behavior of sand soil grouting. Bull. Eng. Geol. Environ. 2024, 83, 80. [Google Scholar] [CrossRef]
  24. Hu, H.X.; Lu, Y.F.; Deng, C.; Gan, B.; Xie, Z.; Cai, Y.; Chu, A. Experimental study on grout-soil interaction effects in sandy soil under different water-to-cement ratios. Buildings 2024, 14, 947. [Google Scholar] [CrossRef]
  25. Li, M.T.; Zhang, X.; Li, S.C.; Zhang, Q.; Zuo, J.; Lan, X. Grouting lifting numerical methods based on numerical simulation and model experiment. J. Harbin Inst. Technol. 2019, 51, 159. [Google Scholar] [CrossRef]
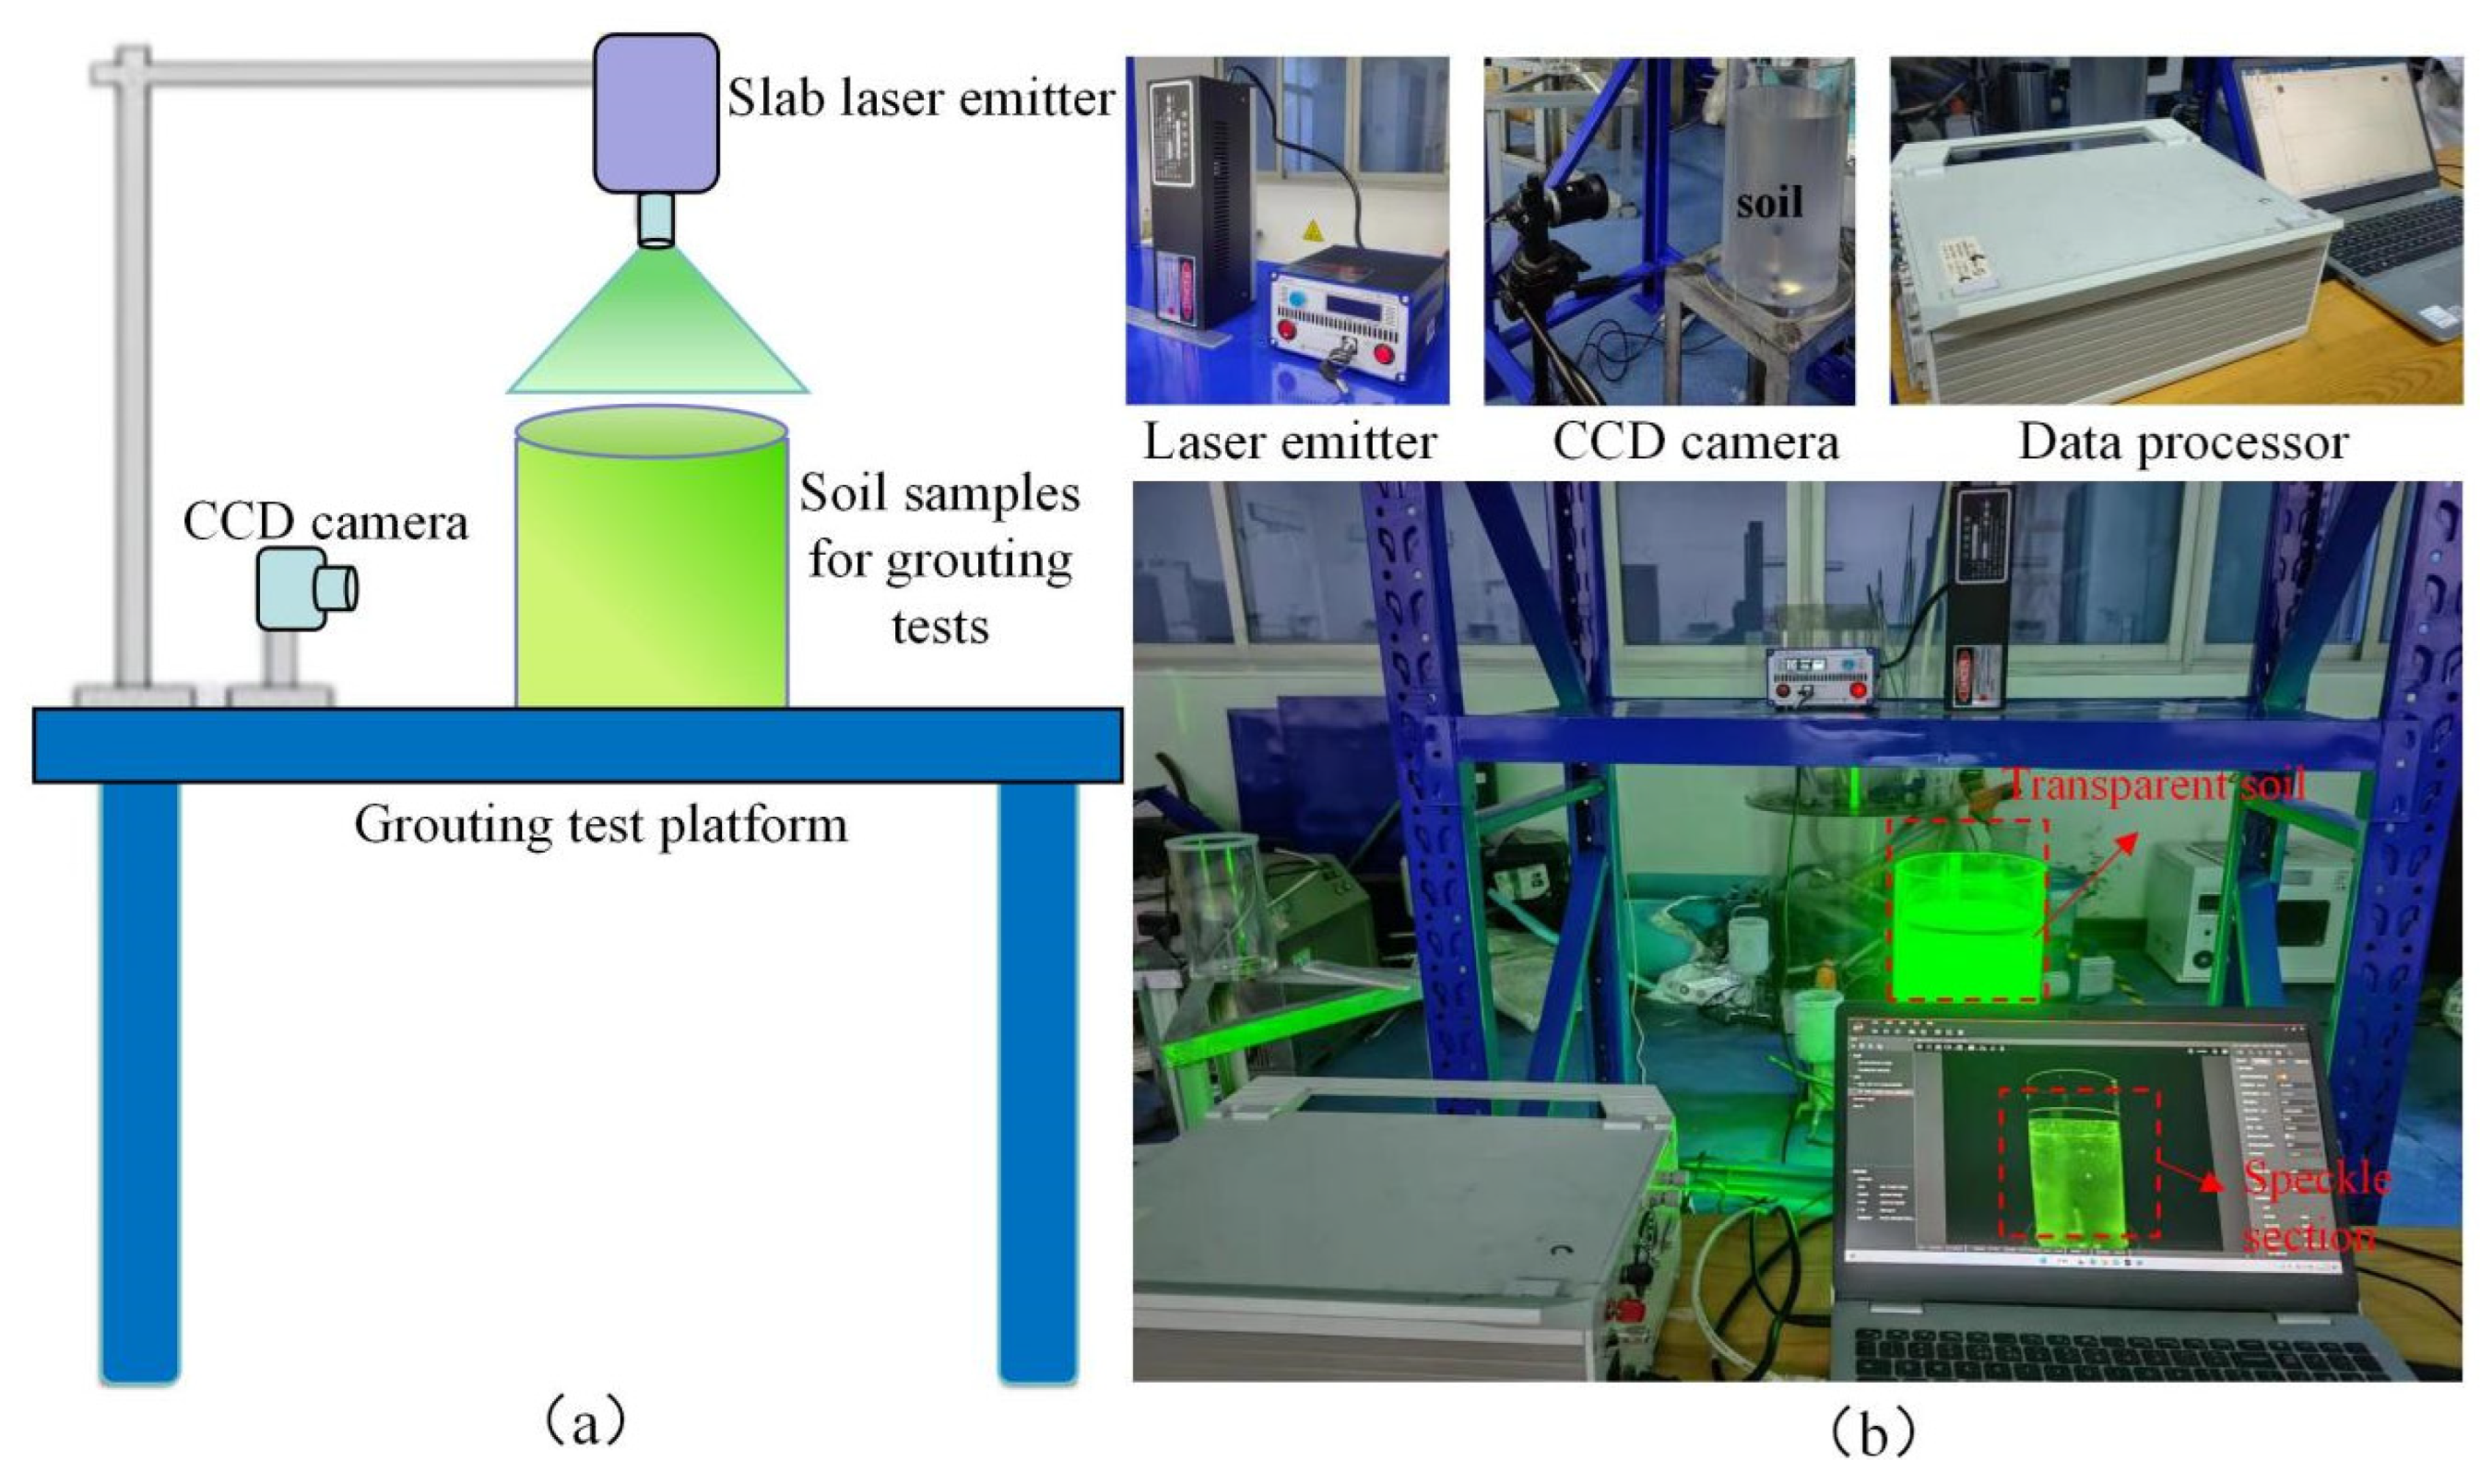
Figure 1. Transparent sand grouting testing system. ((a) a schematic diagram of transparent soil grouting visualization; (b) a test platform for realizing the 3D visualization of transparent soil).
Applsci 14 03922 g001
Figure 2. The system of grouting model test. (a) Schematic diagram of grouting test; (b) Grouting device; (c) Pressure measuring device and arrangement; (d) Non-intrusive measurement of displacement during grouting of transparent soil.
Applsci 14 03922 g002aApplsci 14 03922 g002b
Figure 3. Consolidated body after grouting test. (a) Ordinary sand; (b) Transparent sand.
Applsci 14 03922 g003
Figure 4. Relationship between grouting pressure and grout diffusion.
Applsci 14 03922 g004
Figure 5. Variation in surface displacement with grouting time.
Applsci 14 03922 g005
Figure 6. The relationship between surface uplift displacement and grouting time for each measurement point. (a) Displacement of surface center point; (b) Displacement of the surface second point; (c) Displacement of the surface third point; (d) Displacement of the surface fourth point.
Applsci 14 03922 g006aApplsci 14 03922 g006b
Figure 7. Dynamic deformation characteristics of transparent sand at h = 0.15 m. (a) k = 0.25 t; (b) k = 0.50 t; (c) k = 0.75 t; (d) k = t.
Applsci 14 03922 g007
Figure 8. Dynamic deformation characteristics of transparent sand at h = 0.10 m. (a) k = 0.25 t; (b) k = 0.50 t; (c) k = 0.75 t; (d) k = t.
Applsci 14 03922 g008
Figure 9. Dynamic deformation characteristics of transparent sand at h = 0.05 m. (a) k = 0.25 t; (b) k = 0.50 t; (c) k = 0.75 t; (d) k = t.
Applsci 14 03922 g009
Table 1. Performance parameters of P·O 42.5.
Specific Surface Area (m2/kg)3 d
Flexural Strength (MPa)
3 d
Compressive Strength (MPa)
28 d
Compressive Strength (MPa)
Initial Setting Time (min)Final Setting Time (min)
P·O 42.53565.427.849.6176232
Standard≥300≥3.5≥17.0≥42.5≥45≤600
Note: the standard is the Chinese standard.
Table 2. Grouting test parameters.
ItemGrouting ParametersSand Sample Parameters
Grouting Pressure (MPa)Grouting Volume (L)Water–
Cement Ratio
Moisture ConditionVoid Ratio Permeability Coefficient (10−4 cm/s)Internal Friction Angle
(°)
Value0~0.52.66~3.120.8/1.0/1.2Saturation0.73–0.752.01~2.0533.5
Disclaimer/Publisher’s Note: The statements, opinions and data contained in all publications are solely those of the individual author(s) and contributor(s) and not of MDPI and/or the editor(s). MDPI and/or the editor(s) disclaim responsibility for any injury to people or property resulting from any ideas, methods, instructions or products referred to in the content.