Article

Winter Wheat Mapping in Shandong Province of China with Multi-Temporal Sentinel-2 Images

1
Shandong Geographical Institute of Land Spatial Data and Remote Sensing Technology, Jinan 250002, China
2
The Fifth Prospecting Team of Shandong Coal Geology Bureau, Jinan 250100, China
3
Shandong Yuanhong Survey Planning and Design Co., Ltd., Jinan 250014, China
4
College of Geoscience and Surveying Engineering, China University of Mining and Technology (Beijing), Beijing 102206, China
5
School of Surveying and Geo-Informatics, Shandong Jianzhu University, Jinan 250101, China
6
The Key Laboratory of Digital Simulation in Spatial Design of Architecture and Urban-Rural, Shandong Provincial Education Department, Jinan 250101, China
*
Authors to whom correspondence should be addressed.
Appl. Sci. 2024, 14(9), 3940; https://doi.org/10.3390/app14093940
Submission received: 2 April 2024 / Revised: 27 April 2024 / Accepted: 29 April 2024 / Published: 5 May 2024
(This article belongs to the Special Issue Web Geoprocessing Services and GIS for Various Applications)

Abstract

:
Wheat plays an important role in China’s and the world’s food supply, and it is closely related to economy, culture and life. The spatial distribution of wheat is of great significance to the rational planning of wheat cultivation areas and the improvement of wheat yield and quality. The current rapid development of remote sensing technology has greatly improved the efficiency of traditional agricultural surveys. The extraction of crop planting structure based on remote sensing images and technology is a popular topic in many researches. In response to the shortcomings of traditional methods, this research proposed a method based on the fusion of the pixel-based and object-oriented methods to map the spatial distribution of winter wheat. This method was experimented and achieved good results within Shandong Province. The resulting spatial distribution map of winter wheat has an overall accuracy of 92.2% with a kappa coefficient of 0.84. The comparison with the actual situation shows that the accuracy of the actual recognition of winter wheat is higher and better than the traditional pixel-based classification method. On this basis, the spatial pattern of winter wheat in Shandong was analyzed, and it was found that the topographic undulations had a great influence on the spatial distribution of wheat. This study vividly demonstrates the advantages and possibilities of combining pixel-based and object-oriented approaches through experiments, and also provides a reference for the next related research. Moreover, the winter wheat map of Shandong produced in this research is important for yield assessment, crop planting structure adjustment and the rational use of land resources.

1. Introduction

Wheat is an important grain crop which plays an important role in agricultural production and has a profound impact on economic development [1]. Wheat is the grain crop with the widest distribution, the largest cultivated area and the highest production in the world [2,3]. Its global perennial planting area accounts for 32% of the world’s cereal area, and its total production accounts for about 30% of the world’s total cereal production [4,5]. As one of the world’s three major grain crops, wheat plays an important role in the dietary structure of many other countries, such as China [6]. Therefore, the study of the spatial distribution of winter wheat is very significant for ensuring food security, safeguarding people’s livelihood and even promoting economic development [7,8].
Remote sensing data are widely used in research related to wheat and other crop identification due to its wide coverage, fast update time and good spatial and temporal continuity [7,9,10]. The traditional extraction of information on cropland or crops is mainly based on the statistical method of field survey, which requires a large amount of human and material resources [11]. In contrast, agricultural information extraction based on remote sensing technology can achieve near real-time results and can be implemented on a large scale, which greatly improves efficiency and reduces costs [12]. Most of the current remote sensing-based wheat identification methods are implemented from the single pixel-based or object-oriented perspective [13,14]. Both methods have their own advantages, but crop extraction results based on a single perspective often have more obvious defects. For example, although pixel-based methods are more efficient, the classification results inevitably show “salt-and-pepper” noise [15,16], which requires post-processing, and it is not easy to smooth the results while maintaining quality. Conversely, object-oriented methods can obtain relatively smooth classification results, and better accuracy has been obtained in many previous studies [16,17]. However, it is difficult to obtain high accuracy results for crops with similar spectra, especially for some areas with a complex surface environment, such as lack-classification [18]. With the respective characteristics of the two methods, this research proposed a fusion method that combines the advantages of pixel-based and object-oriented classification methods to obtain better classification accuracy. The fusion strategy has been mentioned in some previous studies [19,20], but in related studies, the final result was to constrain the pixel-based classification with the image segmentation objects in terms of majority voting [18,21]. In this paper, finer constraint rules were used to optimize the classification results while preserving the fine features obtained from pixel-based classification. Specifically, on the basis of retaining the fine information extracted based on the pixel, the subsequent processing is changed to the image object produced by image segmentation to improve the accuracy. The fusion method not only improves the efficiency, but also obtains higher quality spatial distribution maps of winter wheat.
Shandong Province, as one of China’s major agricultural provinces, has held the first place for a long time in the added value of agricultural production [22,23]. It is also a large province for winter wheat cultivation, accounting for about 17% of the national winter wheat cultivation area, which is the second largest after Province Henan [24]. Given the importance of Shandong in winter wheat cultivation and the current status of remote sensing technology in agriculture, it is particularly important to use remote sensing technology to monitor winter wheat cultivation over a large area and multiple time periods [25,26]. The application of the proposed fusion method in Shandong, a region with complex and highly specialized terrain, helps to identify the deficiencies and limitations of the existing extraction method. This will also promote the further improvement of the method and provide research cases and data support for other related studies.
This paper is organized as follows. Section 2 describes the study areas, datasets and methods. Section 3 focuses on the evaluation and analysis of the results. Section 4 presents a further discussion of the study, and some conclusions are given in Section 5.

2. Materials and Methods

2.1. Study Area

Shandong Province is located in the eastern part of the North China Plain (Figure 1), in the lower reaches of the Yellow River, and is also an eastern coastal province bordering the Bohai and Yellow Seas [27,28]. The land area of the province is 155,800 square kilometers, accounting for about 1.6% of the total land area of the country [29,30]. The topography of Shandong is characterized by a high elevation in the center, hills and plains interspersed in the east, and plains dominating in the west, with the plains of Shandong Province accounting for 65.56% of the entire land area [31,32]. Shandong belongs to the warm temperate monsoon climate type, there is rain and heat at the same time, the precipitation is sufficient and concentrated, light resources are abundant, and the heat conditions of the province can meet the demand of the crop biannually [33]. With suitable climatic and favorable topographical conditions, Shandong is one of the major grain crops producing areas in China. Winter wheat is one of the major grain crops in the province [25]. In 2021, the sown area of winter wheat reached 23,567 thousand hectares, accounting for 16.95% of the national sown area of winter wheat, and it is the main planting area of winter wheat after Henan [26]. The growing period of winter wheat in Shandong is about 220 to 270 days, with seeding about between September and October, and stops growing in December of the same year to enter a dormant period [34]. From February to March of the following year, as temperatures rise, wheat re-enters the green growth period. It enters the jointing stage in early April, the heading stage in April and May, and the final maturity and harvest in June [35].

2.2. Data Used

2.2.1. Satellite Data

The Sentinel-2 series of Earth observation satellites is an important part of the Copernicus program promoted by the European Space Agency (ESA) and the European Commission [36]. The observation of the Earth’s surface to provide relevant telemetry services is its main operational mission. Sentinel-2 has two satellites, Sentinel-2A and Sentinel-2B, which were launched and put into operation in 2015 and 2017, respectively [37]. Each satellite in the Sentinel-2 series carries the same multi-spectral instrument (MSI), a sensor that covers reflectance data in 13 wavelength bands from the visible, near-infrared to the short-wave infrared, enabling the acquisition of multi-resolution, multi-spectral remote sensing images [38,39]. The revisit cycle is shortened to 5 days when both satellites are working simultaneously. In mid-latitude regions with better observation angles, the satellite revisit period can be reduced to 2 to 3 days, which is very favorable for constructing long-time sequence images [40,41].

2.2.2. Ground Reference Data

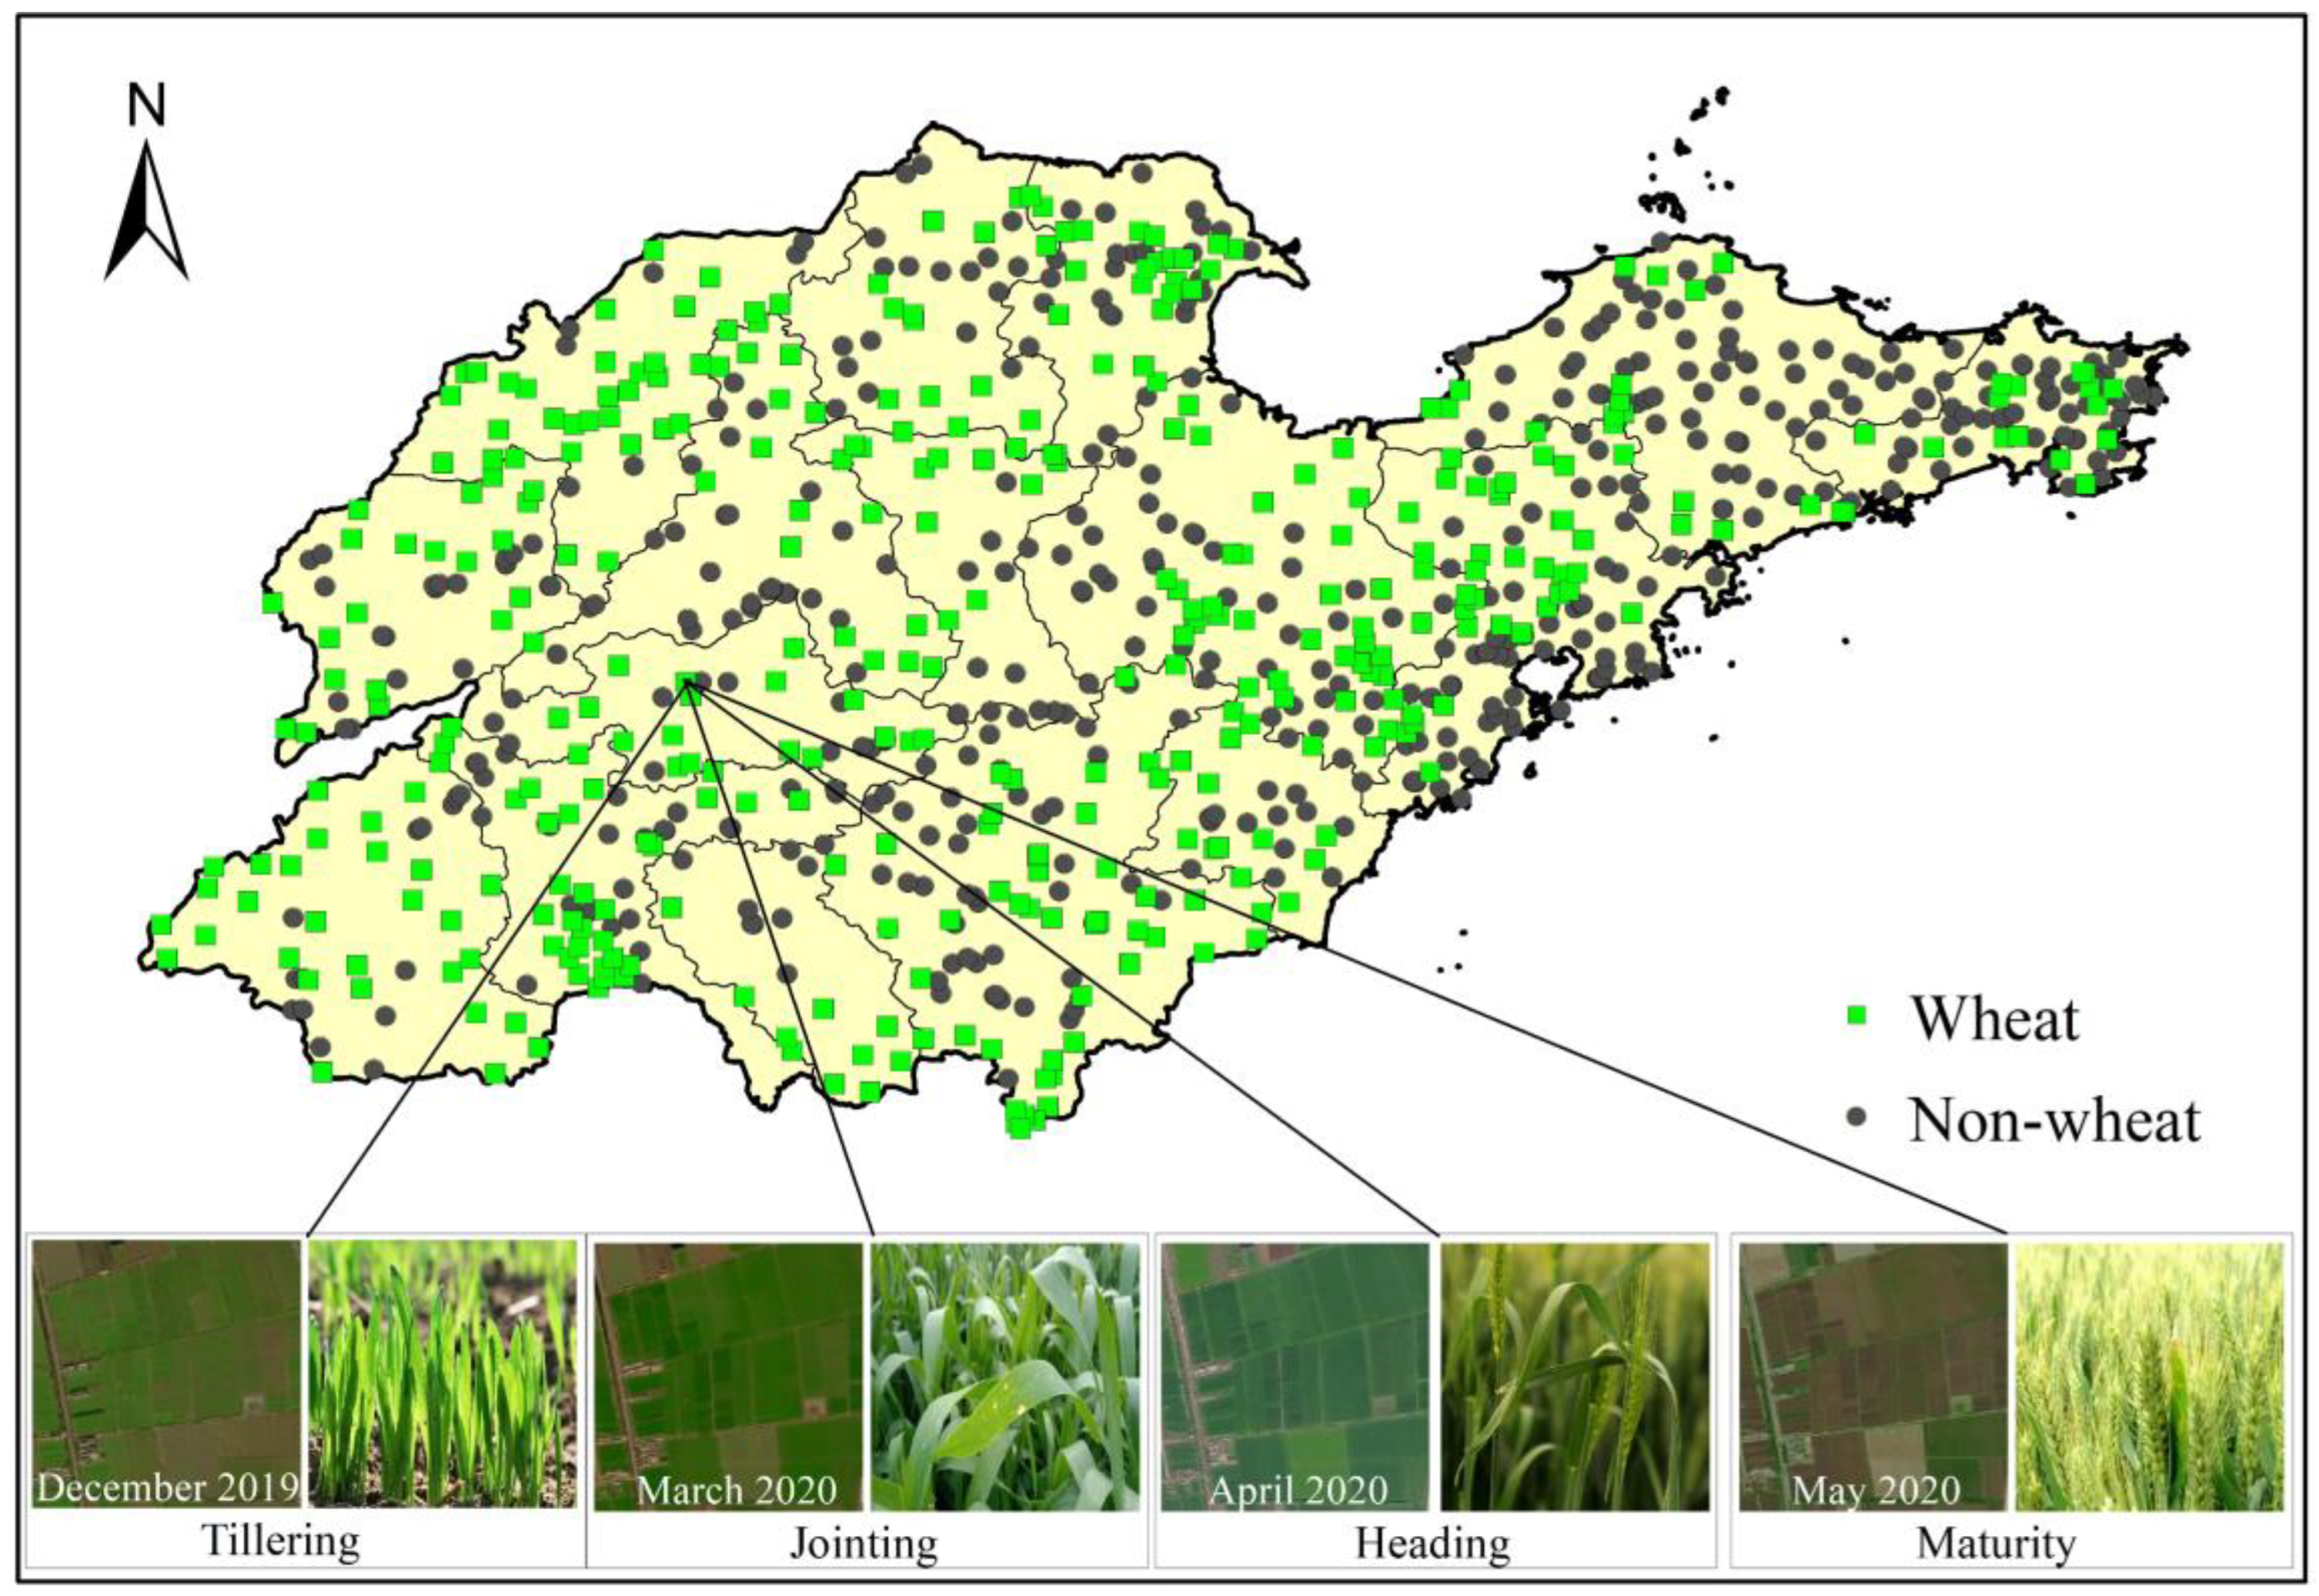
The sample data used in this research consist of two main components: the ground survey points and the portion labeled based on this visual interpretation of ultra-high resolution Google historical imagery. The sample points represent the crop attributes of the plot where the location is located. Ground sampling points are collected during various field activities to accurately record their location and attribute information. Based on the characteristics of real ground sample points, we create random points within Shandong. The random points are further interpreted by combining the existing field sample points and ultra-high-resolution images from Google Earth, resulting in a total of 938 sample point datasets, including 656 training samples and 282 validation samples (Figure 2).

2.3. Methodology

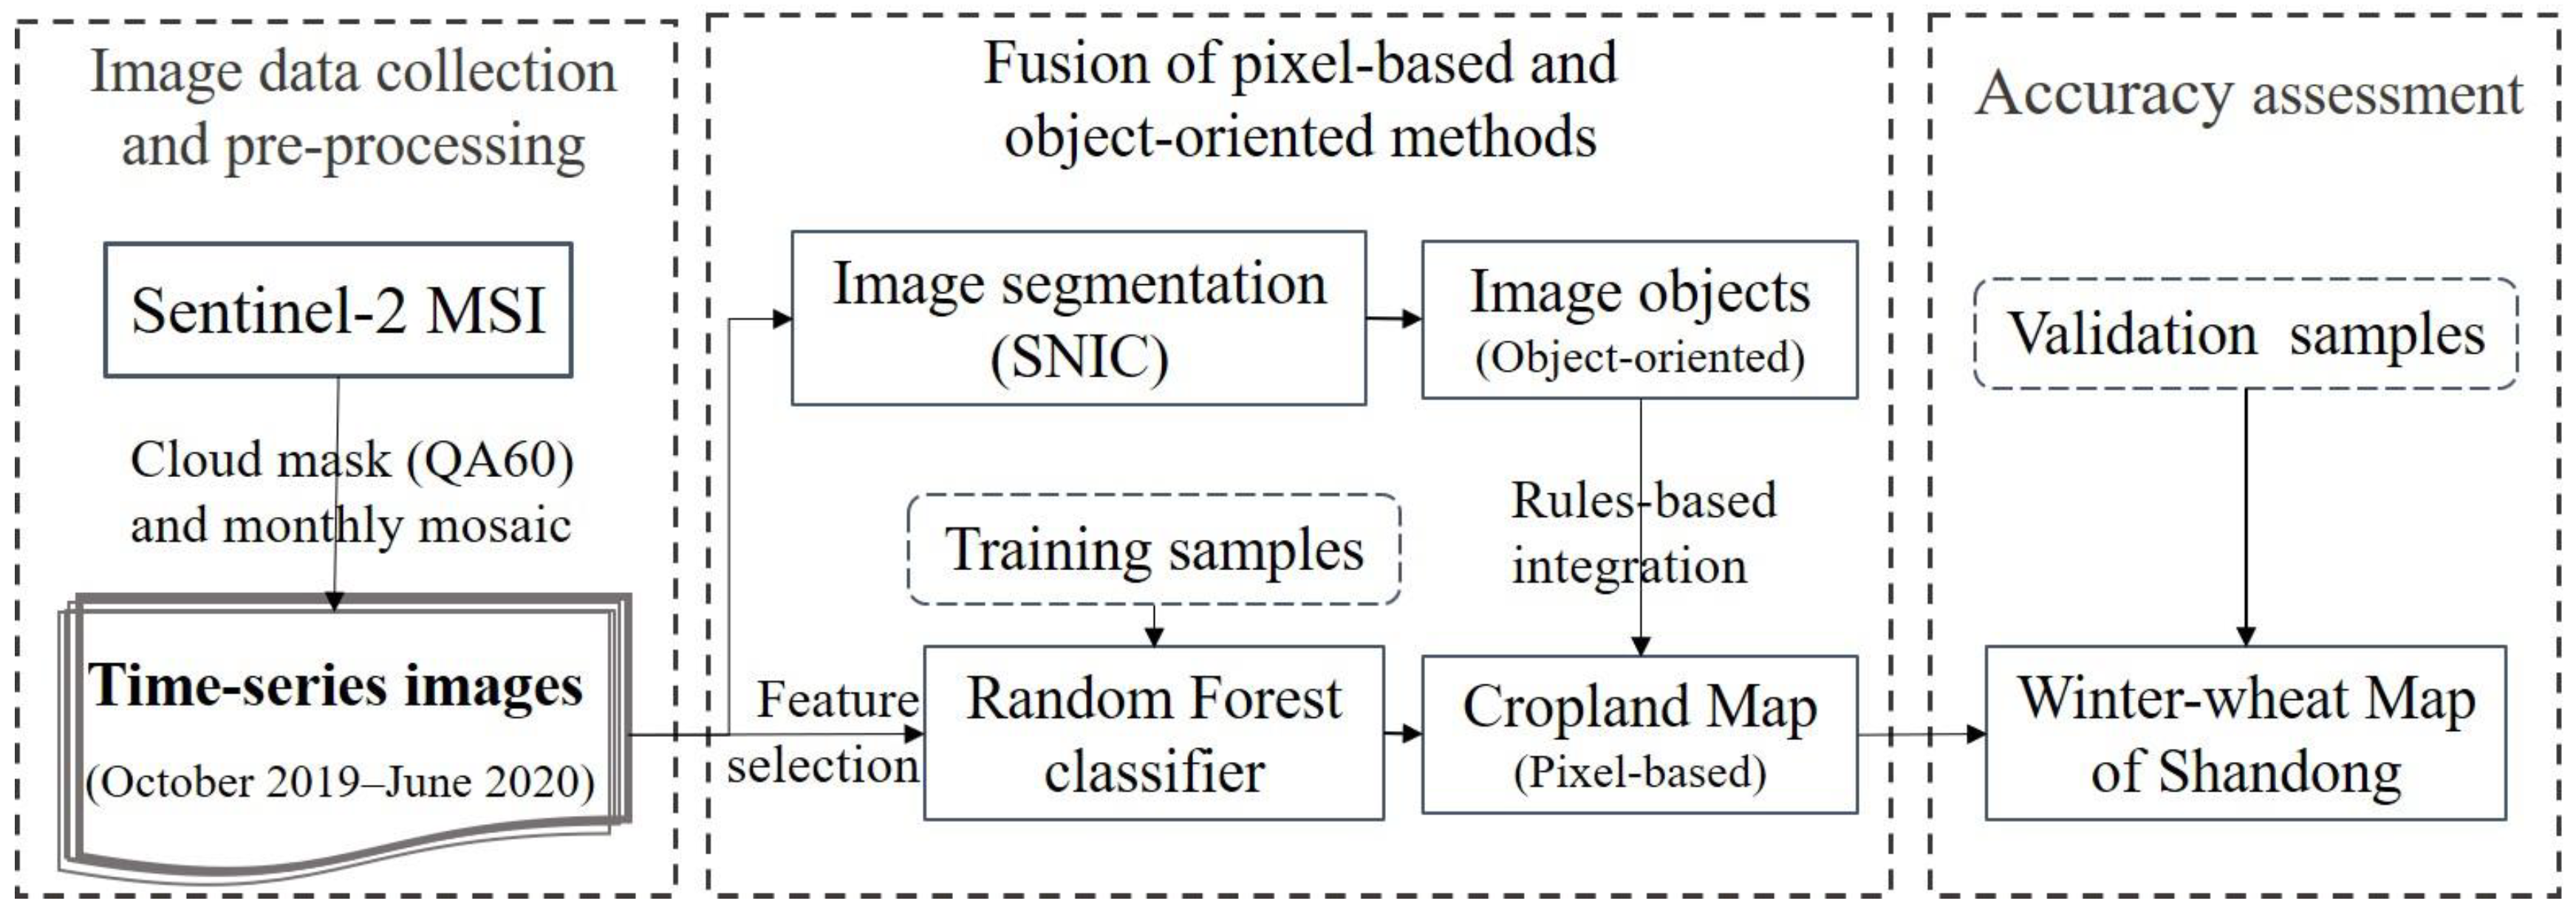
Based on the time-series Sentinel-2 imagery, this research proposed a winter wheat extraction method that combines pixel-based and object-oriented methods for the unique topography and cultivation characteristics of Shandong Province. The methodological workflow consists of the following three steps, as shown in Figure 3. At first, based on the Google Earth Engine (GEE) platform, the Sentinel-2A images from October 2019 to June 2020 are selected and pre-processed with de-cloud, clipping and fusion to form a monthly image data collection. Then, rules are formulated to integrate the results of pixel-based classification and object-oriented image segmentation to obtain the optimal classification results. Finally, the final winter wheat extraction results are evaluated by calculating the confusion matrix.

2.3.1. Image Collection and Pre-Processing

The data processing in this research is mainly based on the GEE platform because it not only provides a variety of remote sensing image data, including Sentinel-2, but also pre-processes most of the raw data in bulk [42]. The Sentinel-2 Level-2A (L2A) image provided by GEE has already completed the spatial and atmospheric corrections [43,44]. It can be used directly through the catalogue “COPERNICUS/S2_SR” for the next step of processing and analysis. This significantly reduced the amount of computation and increased the rate of data use. On the basis of Sentinel-2 L2A, only de-clouding, clipping and splicing are needed to build the corresponding time-series datasets.
It is known that winter wheat in Shandong is usually sown in October of the previous year and harvested in June of the following year. Thus, images covering the entire growth period of winter wheat in 2020 (October 2019–June 2020) were selected for winter wheat identification in this research. Firstly, a total of 1702 Sentinel-2 L2A images with less than 50% cloud cover for this period were filtered on the GEE platform. Then, the effects of clouds and other poor observations were excluded by the QA60 band, which is specially designed for storing cloud obscuration information [10,45]. On this basis, a monthly image collection (9 images in total) was composited on a monthly basis to characterize the temporal variability of the winter wheat. In this process, the monthly images that still have gaps due to the influence of clouds are complemented with the images of that month in the adjacent year [46,47]. At the same time, the nearest-neighbor resampling method was used to resample six bands with a 20 m resolution to a 10 m resolution to ensure a consistent spatial resolution. A high-quality Sentinel-2 time-series image collection with a complete coverage of Shandong was finally created.

2.3.2. Pixel-Based and Object-Oriented Fusion Methods

In this research, winter wheat was identified based on temporal-spectral information. Firstly, 10 bands of 9 monthly Sentinel-2 images, which are B2, B3, B4, B8, B5, B6, B7, B8A, B11 and B12, were selected to construct the temporal-spectral feature set. In addition, the following vegetation indices which are sensitive to crop identification in previous related experiments were added [29,48,49]: the Normalized Difference Vegetation Index (NDVI), the Land Surface Water Index (LSWI), the Soil-Adjusted Vegetation Index (SAVI) and the Normalized Differential Phenology Index (NDPI), and detailed information is shown in the Table 1.
Many previous studies have shown that the random forest is one of the most important and efficient supervised classification methods [54,55], so this algorithm was also used in this study to extract winter wheat. The random forest is a robust voting decision algorithm by integrating multiple independent decision trees trained on samples to obtain predictions [43,56]. It is well integrated on the GEE platform now, and is available through ‘ee.Classifier.smileRandomForest’. In the GEE, a total of six parameters were set for this algorithm, which are “numberOfTrees”, “variablesPerSplit”, “minLeafPopulation”, “bagFraction”, “maxNodes” and “seed”. In general, the number of decision trees in the random forest can be decided through multiple tests to achieve higher accuracy while ensuring classification efficiency [54]. In this research, the optimal number of decision trees was selected by constructing a tree determining function, setting the range and split interval to repeat the operation, cycling the operation and outputting the accuracy change in the random forest classification. The other parameters in the classifier are generally set as default values.
The identification of winter wheat in this study was based on 9 views of high-quality monthly imagery obtained from the data pre-processing in the previous section. Overall, 10 spectral bands and 4 important vegetation indices were collected in the research, resulting in a feature set of 126 spectral-temporal features. This feature set was input into the random forest classifier. After repeated experiments, the number of trees in the random forest was set to 200, and finally resulted in the initial winter wheat spatial distribution of Shandong.
The object-oriented classification method is a popular classification method for many researchers nowadays, and it is also widely used in crop information extraction [55,57]. The object-oriented approach is based on the image objects clustered by homogeneous pixels for classification, which can eliminate the “salt and pepper” effects by reducing the fragmentation of classification units [58]. Moreover, it can make full use of the spectral, spatial and textural information of the images, and improve the classification accuracy. Considering the respective advantages of pixel-based and object-oriented approaches, this research proposed to integrate pixel-based classification with object-oriented image segmentation in order to achieve a complementary effect. Specifically, this research generated image objects through the image segmentation algorithm provided by the GEE, and optimized the pixel-based classification results by the image objects.
The SNIC algorithm is a mature and efficient image segmentation algorithm on the GEE platform, which is available as ‘ee.Algorithms.Image.Segmentation.SNIC’ [16,59]. The advantage of this algorithm is that the image segmentation results can be adjusted by changing the input segmentation parameters. The main parameters are size, seedsize, compactness, connectivity and neighborhoodsize [60]. Among them, “size” refers to the pixel-based spacing of superpixel seed positions, that is, segmentation size. “Seedsize” is the superpixel seed position spacing. “Compactness” defines the shape of the clusters, meaning that the larger its value, the closer the segmentation result is to a square. “Connectivity” takes continuity into account based on the merging of neighboring clusters. And the “neighborhoodsize” is to avoid tile boundary artifacts. Based on the actual situation of cropland in Shandong and combined with several parameter adjustment experiments, the best parameters’ combination was finally obtained as “size” = 10, “seedsize” = 15, “compactness” = 0, “connectivity” = 8 and “neighborhoodsize” = 256.
Finally, the pixel-based classification and the image objects obtained from SNIC segmentation were integrated based on the following rules. The main strategy of these rules is to improve the classification accuracy by redefining the pixel values within each object. These rules have been repeatedly experimented and verified to be reasonable, and the details are as follows:
If >80% of the pixels in an object have the same attribute value, then it is final for the whole object;
If <20% of the pixels in an object have an attribute value, then the value is removed from the object and assigned to the most abundant one;
If none of the above conditions are satisfied, the pixel-based classification results will be retained, which may result in the existence of winter wheat and non-winter wheat pixels in an object.
This fusion strategy retains the advantages of the pixel-based classification method while fully considering the characteristics of object-oriented methods. As a result, it eliminates pixel-based classification noise while maintaining a spatial correlation between pixels, which greatly improves the accuracy of classification.

2.3.3. Accuracy Assessment

For the results of winter wheat extraction, this study used independent validation samples to calculate the confusion matrix for evaluation. The Overall Accuracy (OA), User’s Accuracy (UA), Producer’s Accuracy (PA), F1-score (Equation (1)) and Kappa coefficient can be obtained by calculating the confusion matrix, which can be used to evaluate the results in multiple perspectives.
F1-score = 2 × P A × U A P A + U A

3. Results and Analysis

3.1. Random Forest Feature Importance

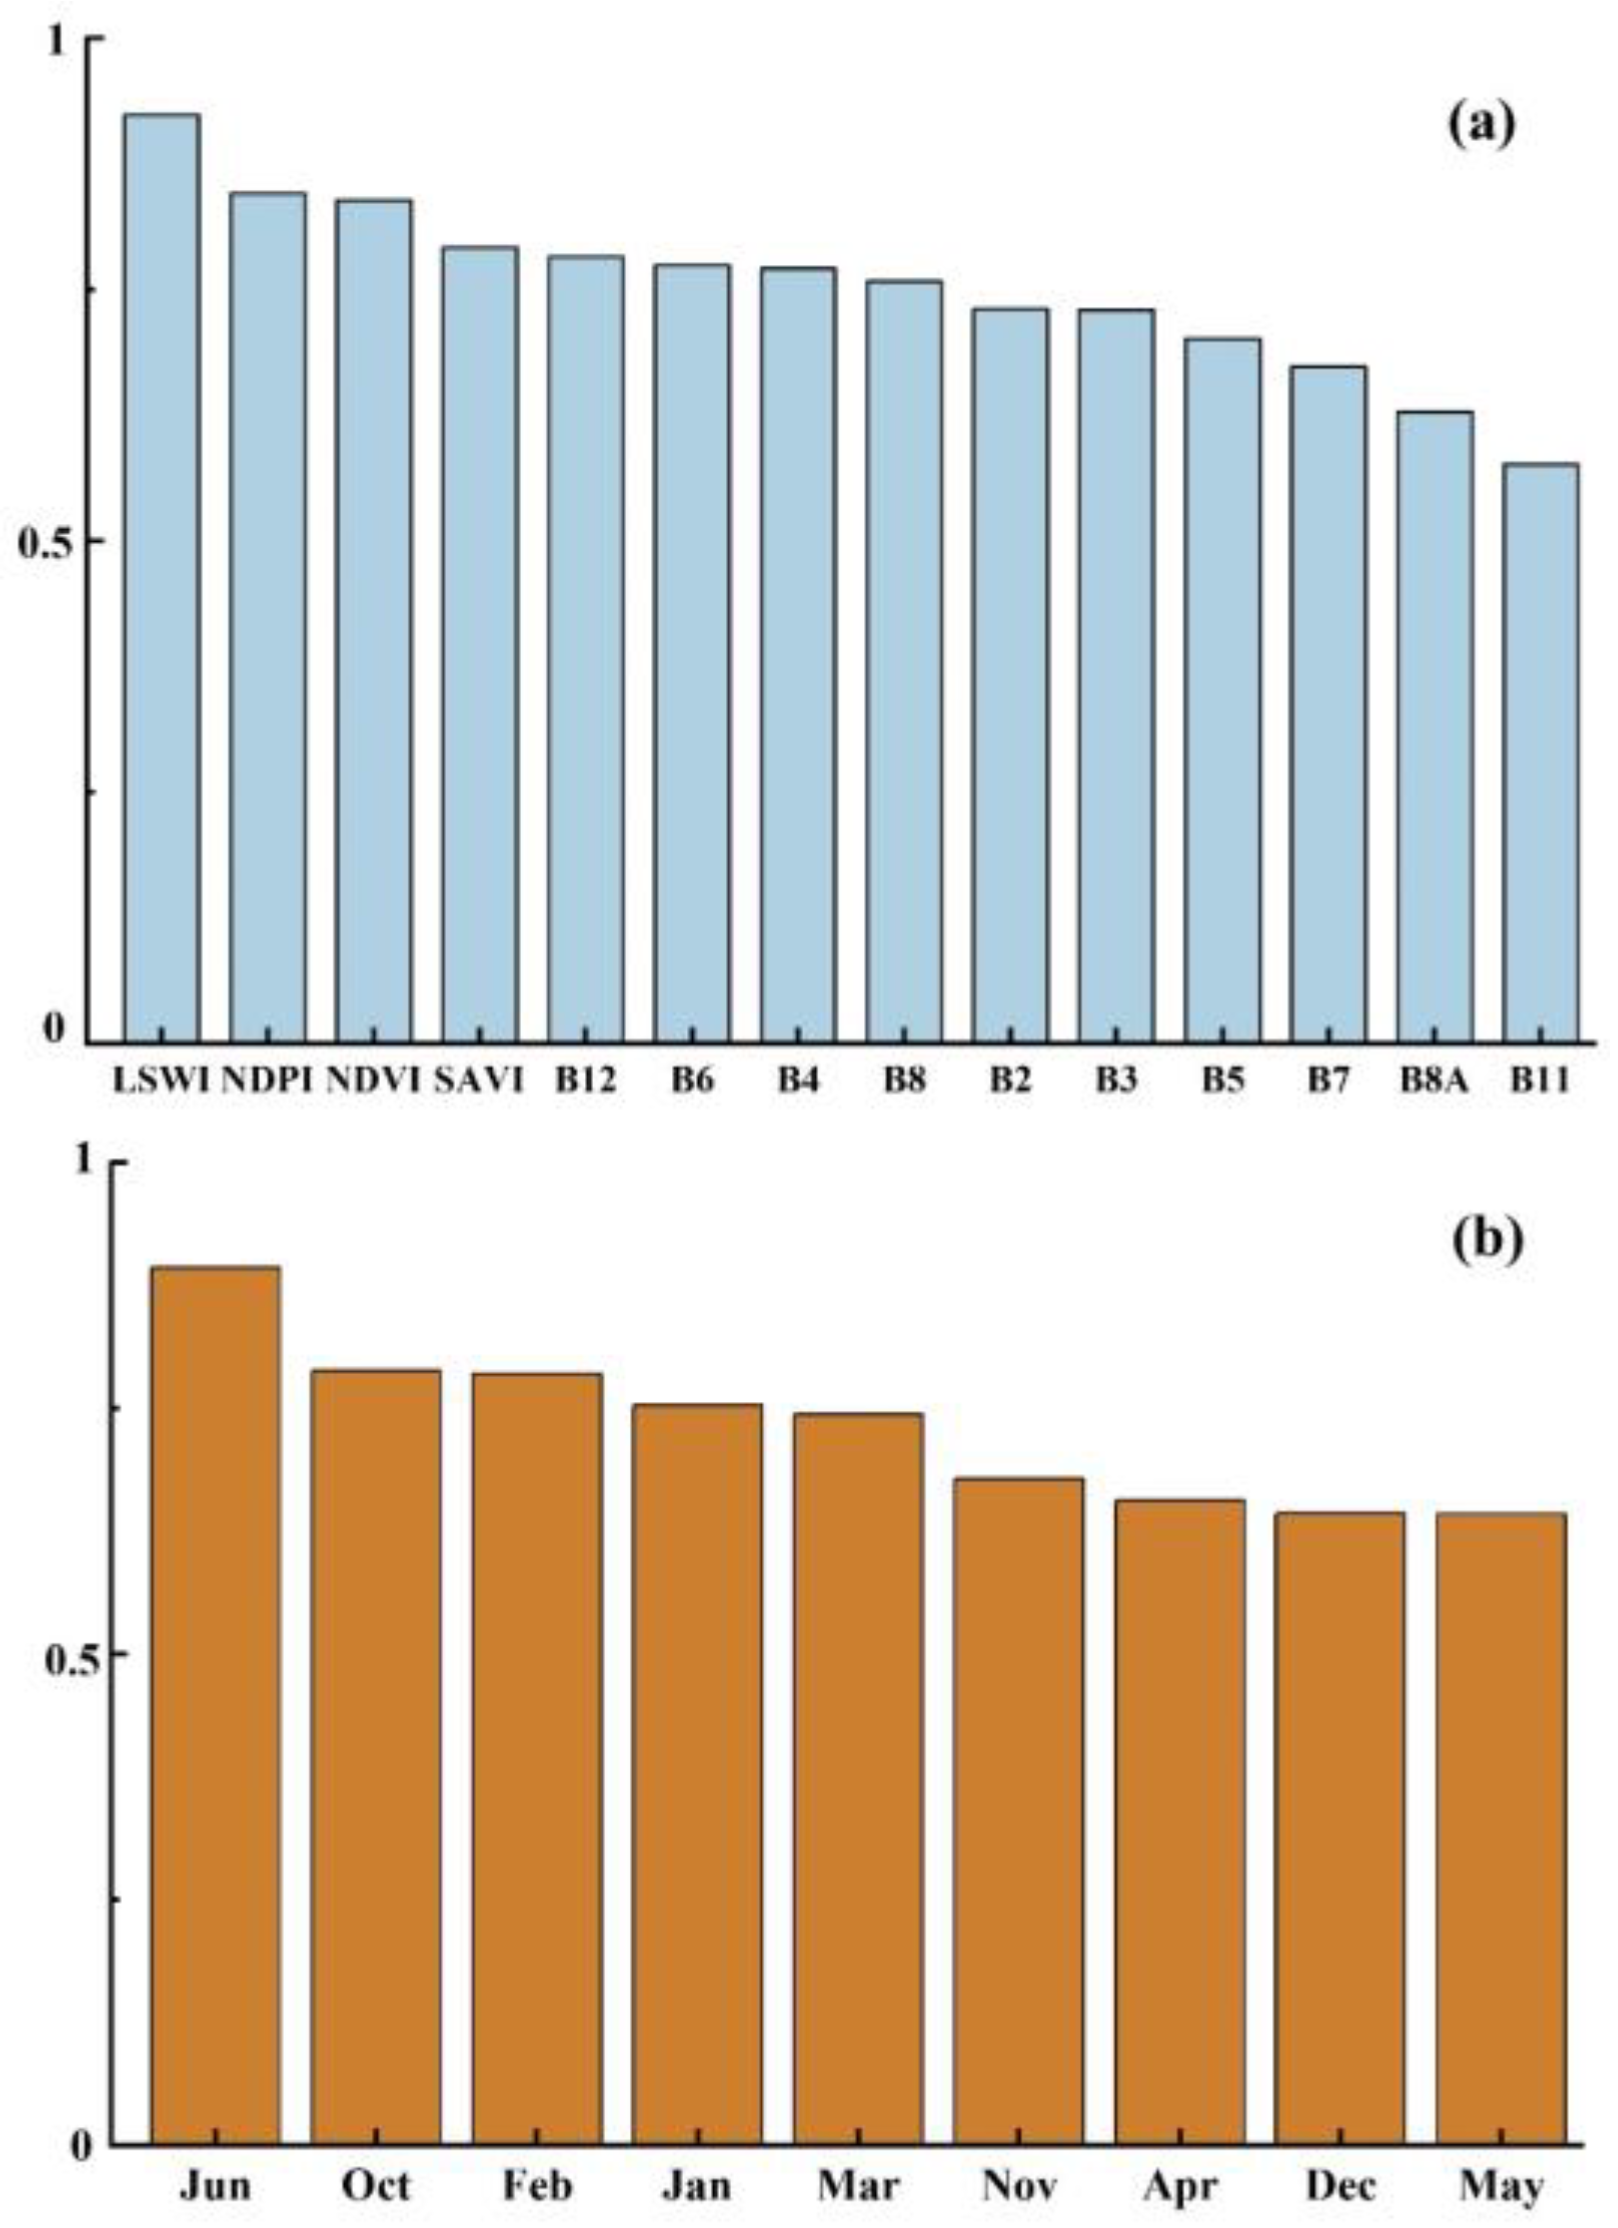
Figure 4 presents the importance of different features which were output after the successful completion of classification. It is helpful to explore which features play an important role in the classification process. As shown in Figure 4a, the top four features in terms of importance are LAWI, NDPI, NDVI and SAVI. It can be seen that the vegetation index played more positive effects during winter wheat mapping. Figure 4b shows the influenceability of all features counted on a monthly basis, which clearly demonstrates that images from June, October, February and January are more effective for winter wheat identification. October and June are during the sowing and harvesting of wheat, and the wheat plots may be in a state of no vegetation cover while other vegetation is still growing densely. The winter wheat in January and February is around the period of the green-up and jointing stage [29]. Wheat will come into growth earlier relative to other vegetation. In summary, the wheat in these four months generally has unique characteristics that differ from other plots.

3.2. Spatial Distribution of Winter Wheat in Shandong

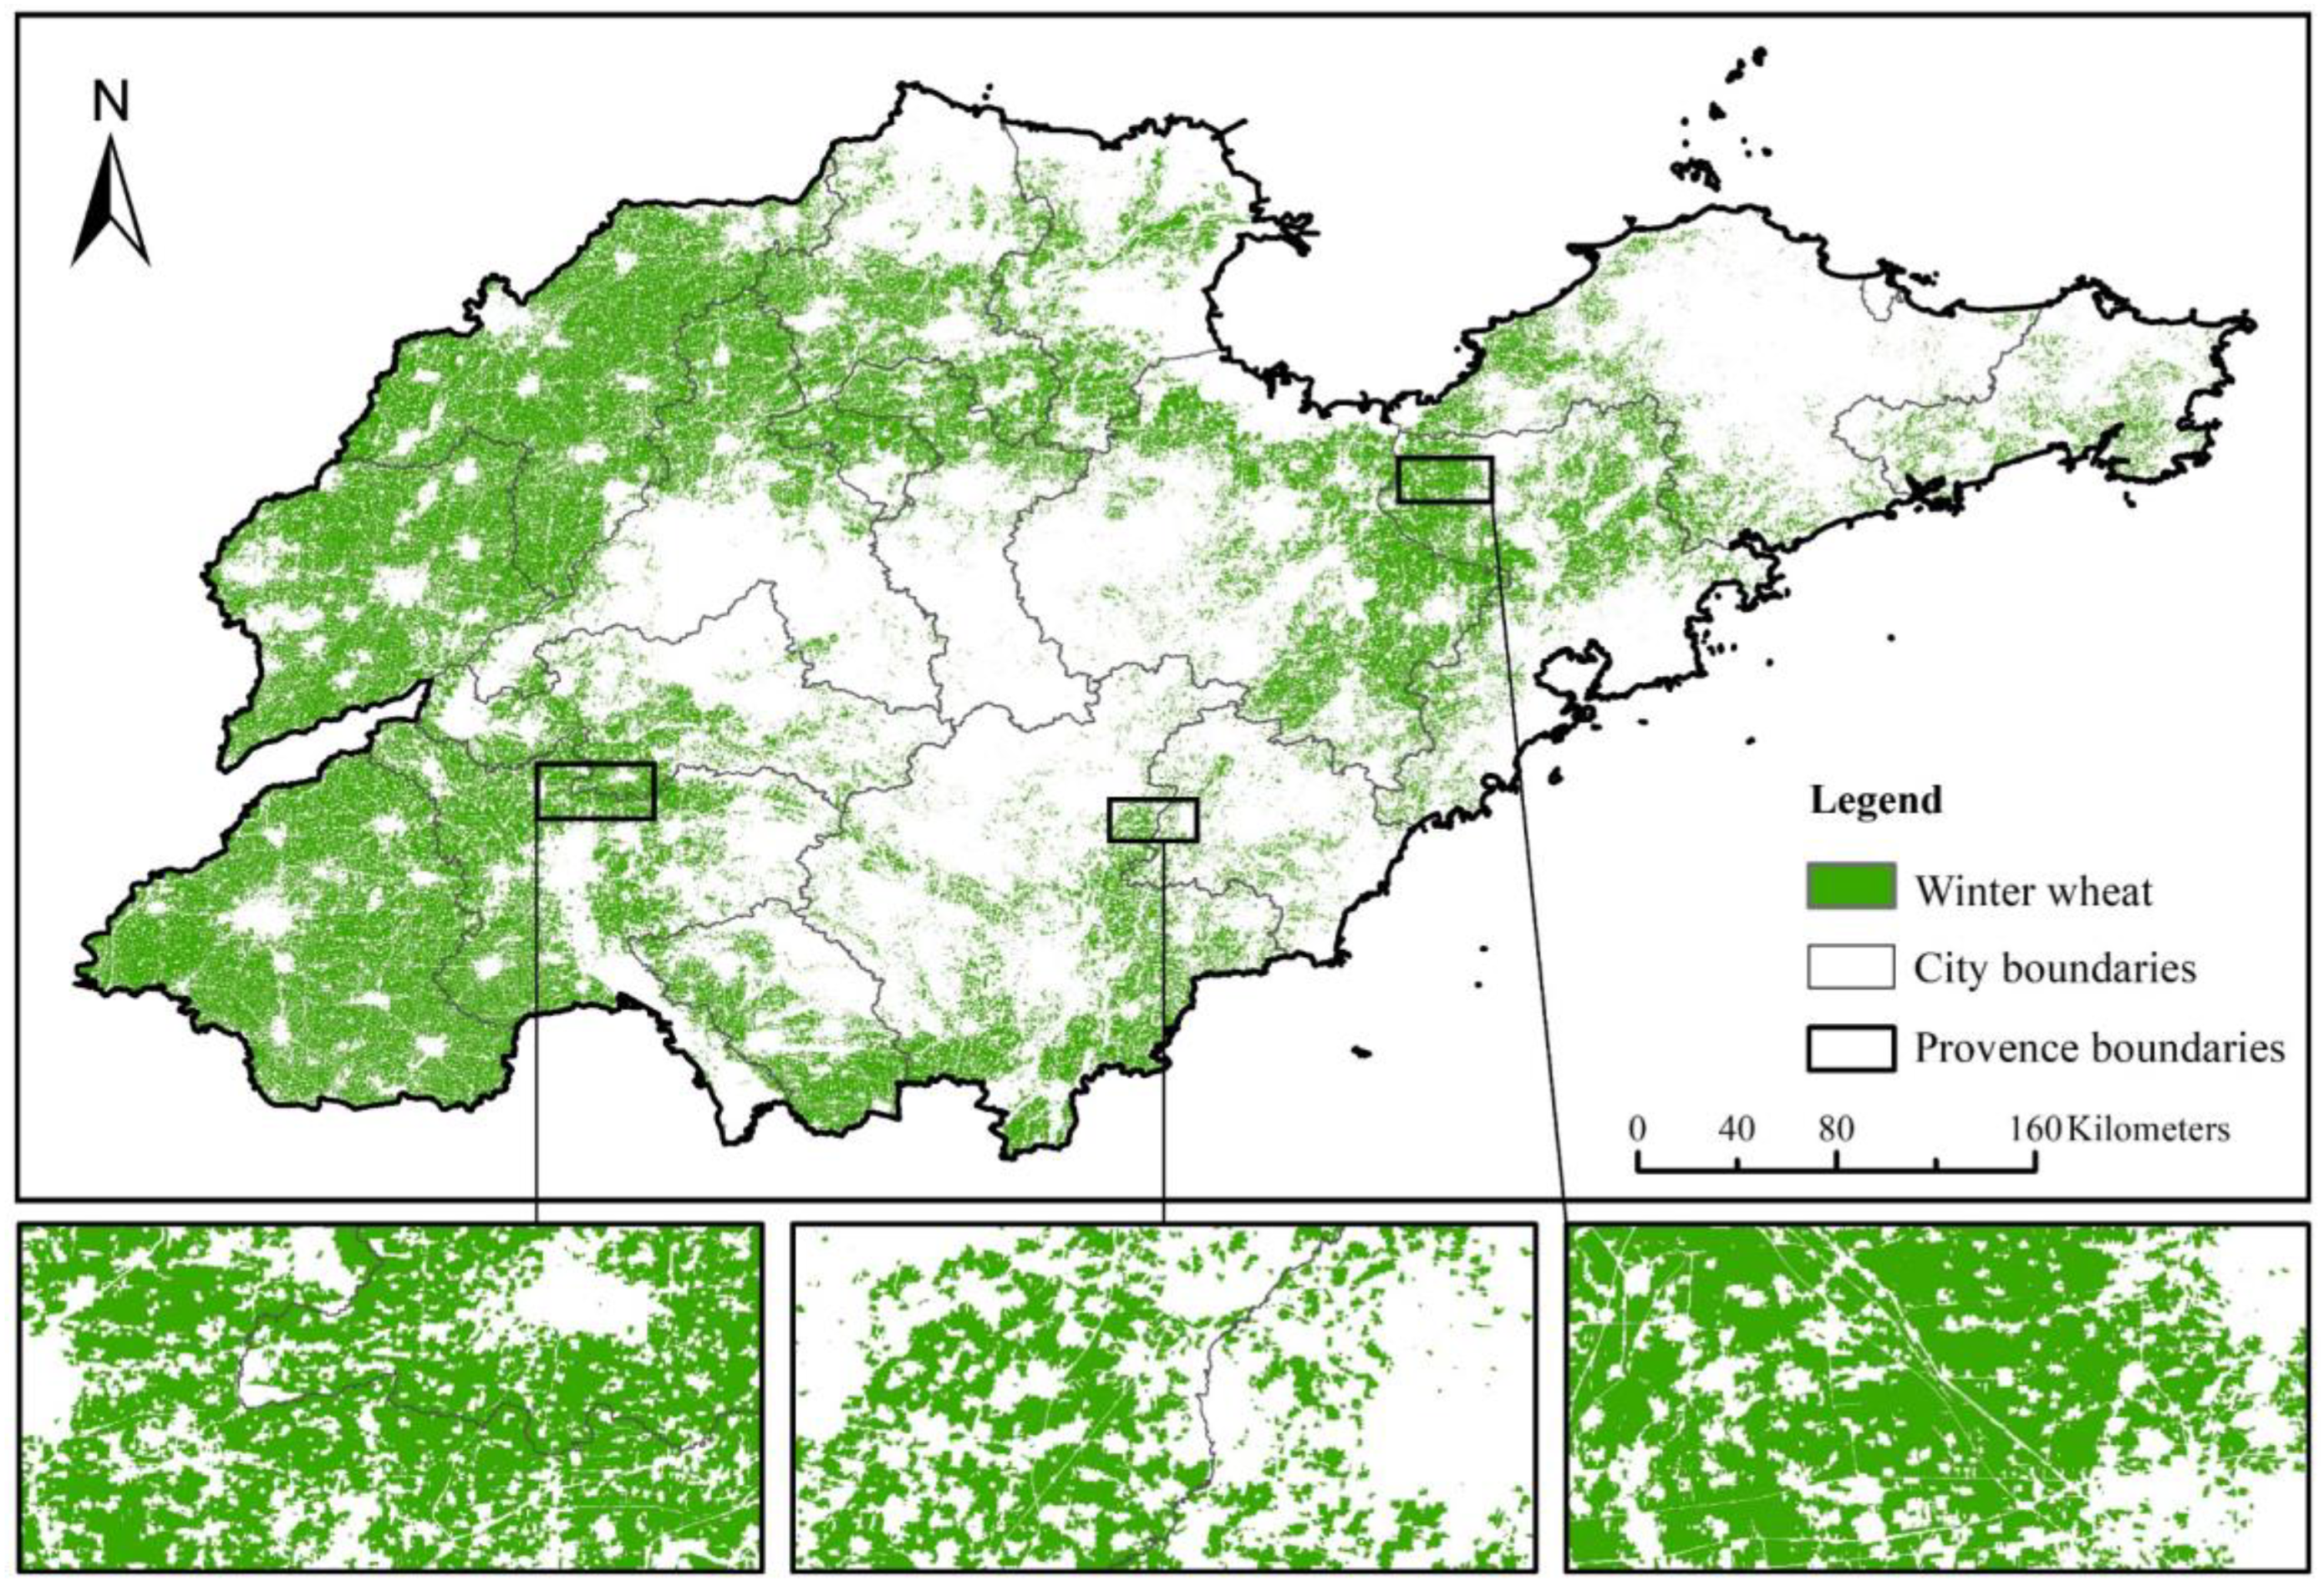
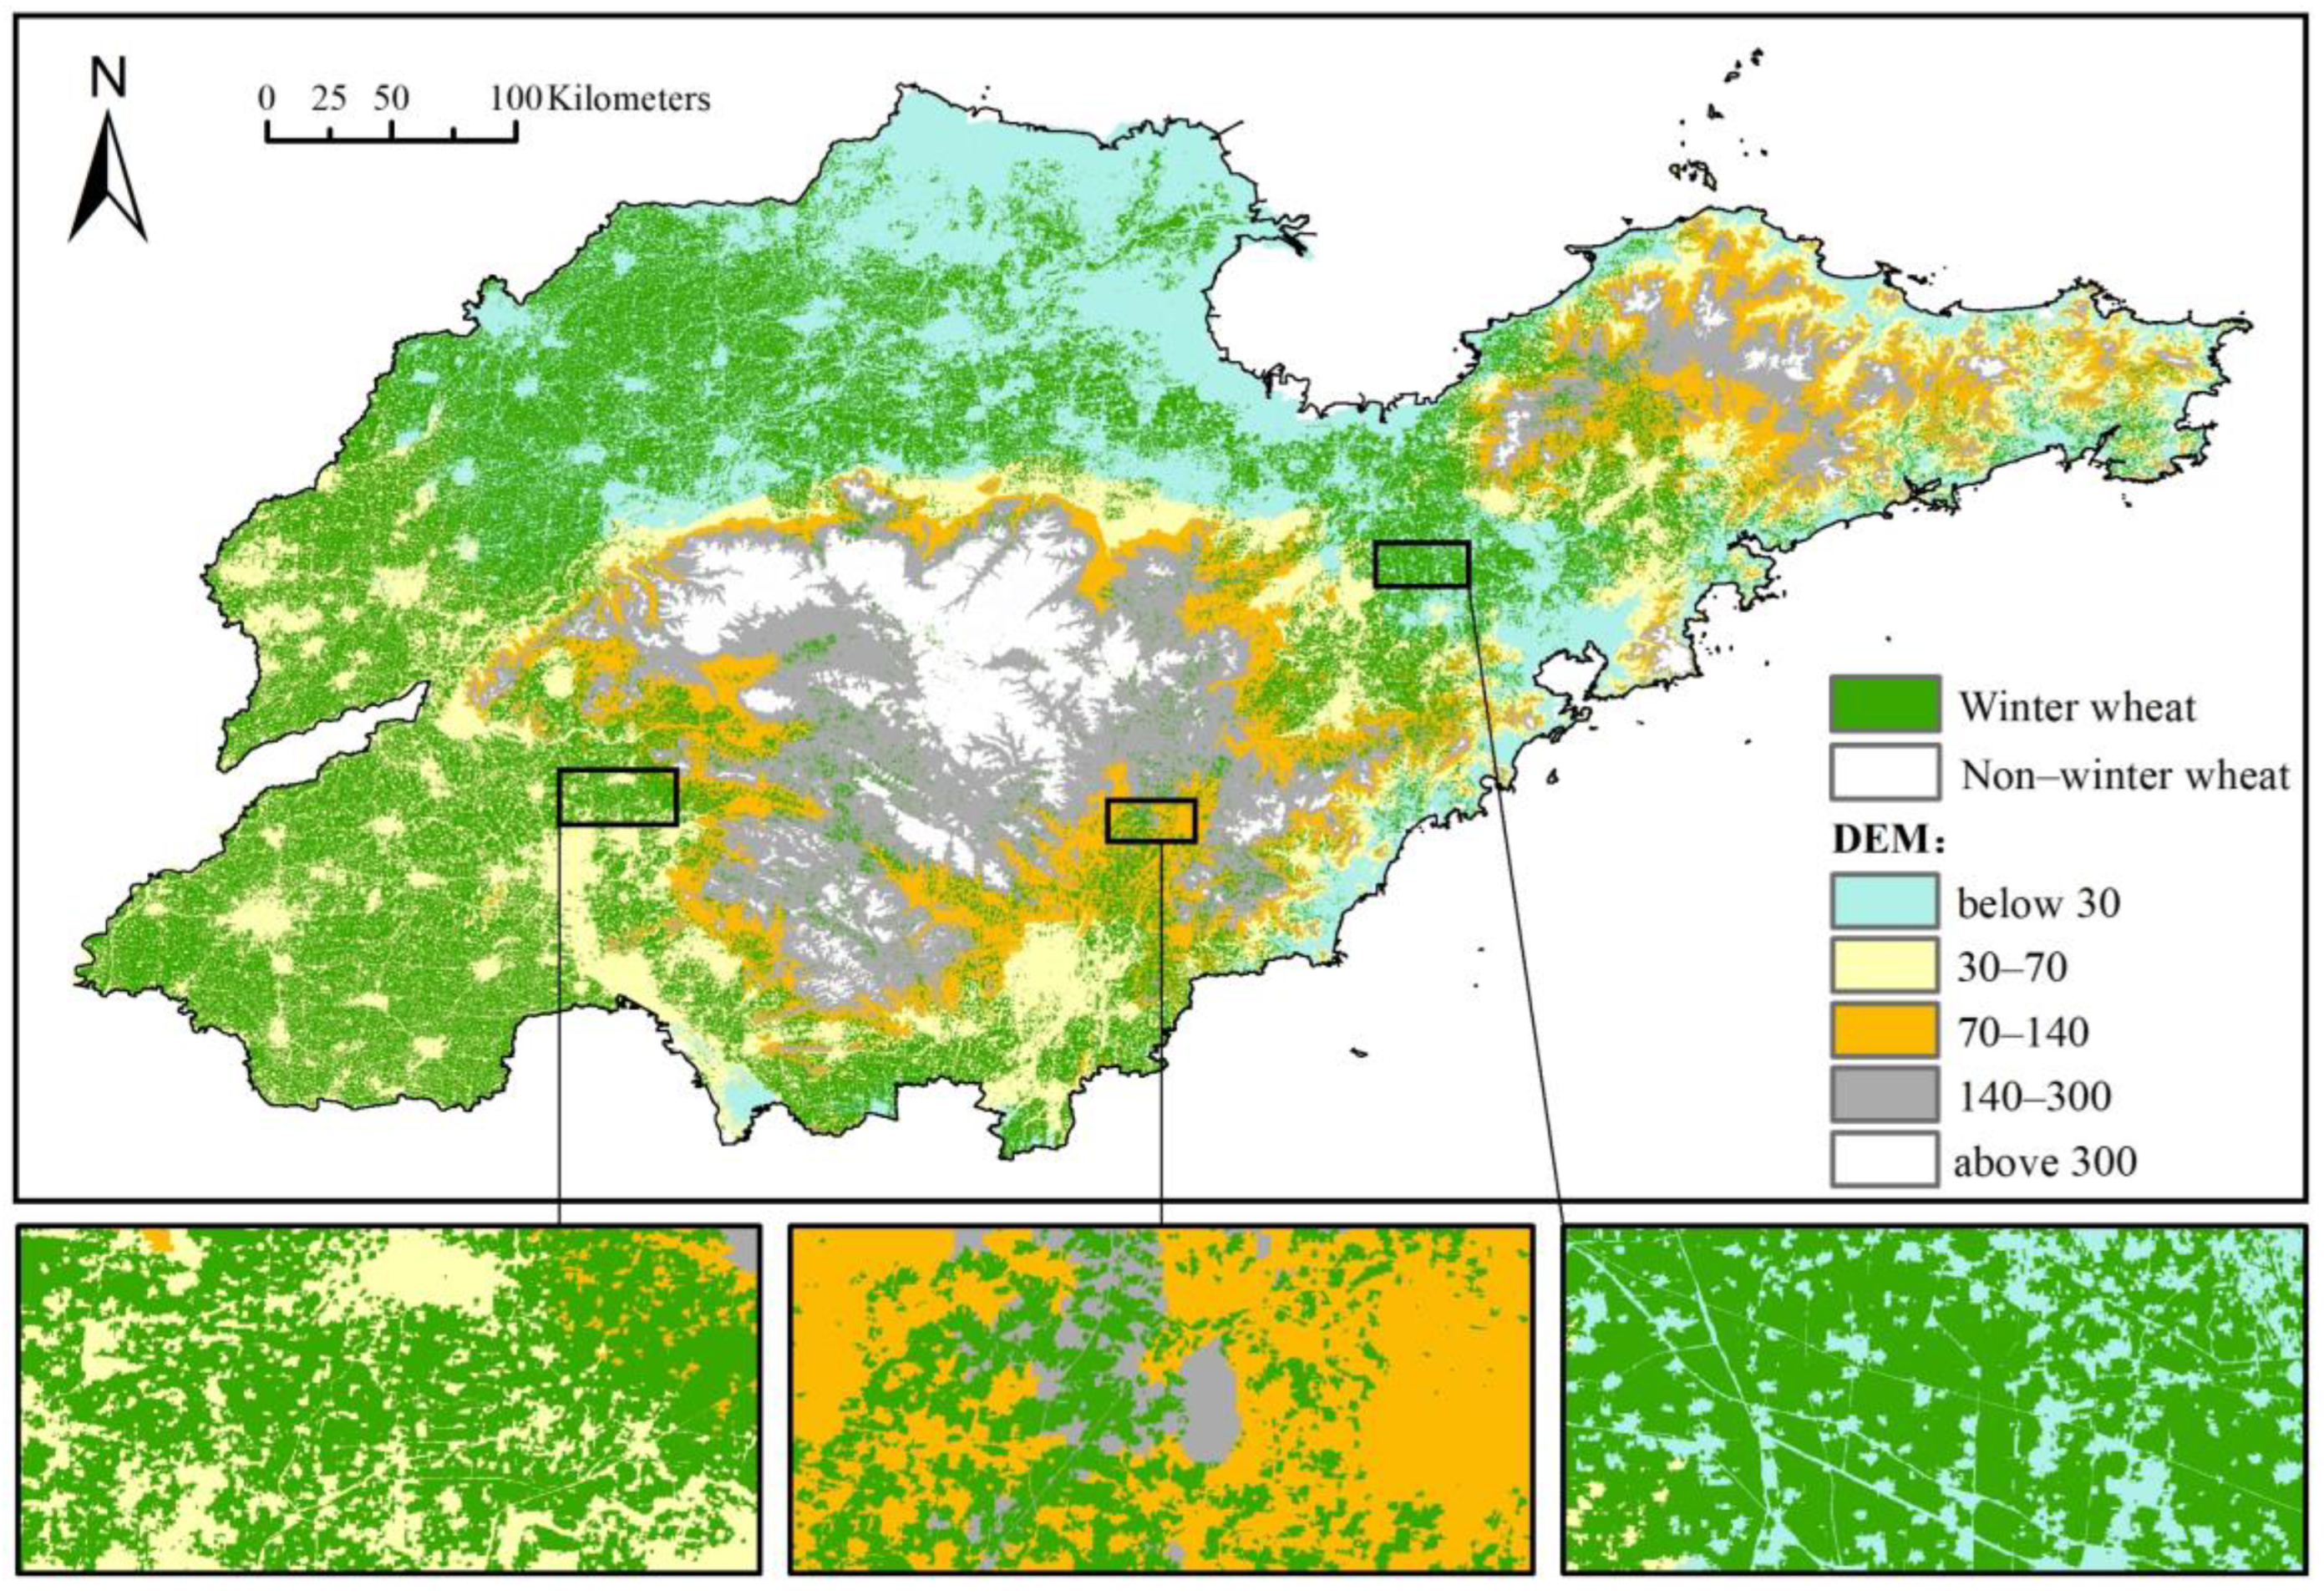
In this research, based on time-series Sentinel-2 data, a classification method combining pixel-based and object-oriented approaches was followed, and the spatial distribution map of winter wheat in Shandong with a resolution of 10 m was finally generated. As shown in Figure 5, a large area of wheat cultivation is concentrated in the northwestern plain, the southwestern plains and the JiaoLai plains of Shandong. In addition, winter wheat in Shandong is more concentrated in areas where economic development is relatively lagging behind, such as Heze, Dezhou, Liaocheng, Jining and Weifang, etc., and their winter wheat planting area accounts for about 57% of the province. As a whole, the spatial distribution of winter wheat shows more in the west and less in the east, and is uniformly dense in the west and sparsely scattered in the east. The spatial distribution pattern has obvious geographical characteristics. From the perspective of the spatial distribution of the river systems, winter wheat is concentrated in the Yellow River Basin, Huaihe River Basin and Haihe River Basin, with a small amount in the Peninsula Basin. This distribution pattern can make full use of irrigation resources.

3.3. Assessment of the Winter Wheat Map

The accuracy of winter wheat mapping was assessed using the validation samples. The confusion matrix calculation showed that the OA of the winter wheat map was 92.2% and the Kappa coefficient was 0.84 (Table 2). In addition, the F1-score for the winter wheat map was 0.96.
In addition, we compared with some of the currently available datasets of winter wheat to more objectively evaluate the accuracy of winter wheat identification. They are the 30-m winter wheat maps in China (ChinaWheat30) [61] and the first 10-m resolution maps of winter wheat over China (ChinaWheat10) in 2020 [62]. It can be seen from Figure 6 that compared to the 30 m resolution ChinaWheat30, the 10 m resolution ChinaWheat10 and the winter wheat maps produced in this research showed more details, like rivers, roads, etc. From the comparison in the first row, it can be seen that the classification results of the three maps are roughly the same, and especially the ChinaWheat10 results are the most detailed and credible. However, we can still see that in the complex landcover conditions and in the hilly areas (the second and third rows), the Shandong winter wheat map gives better results, is more consistent with the reality and allows more complete wheat cropping plots to be obtained.

4. Discussion

4.1. Key Points and Strengths of the Fusion Method

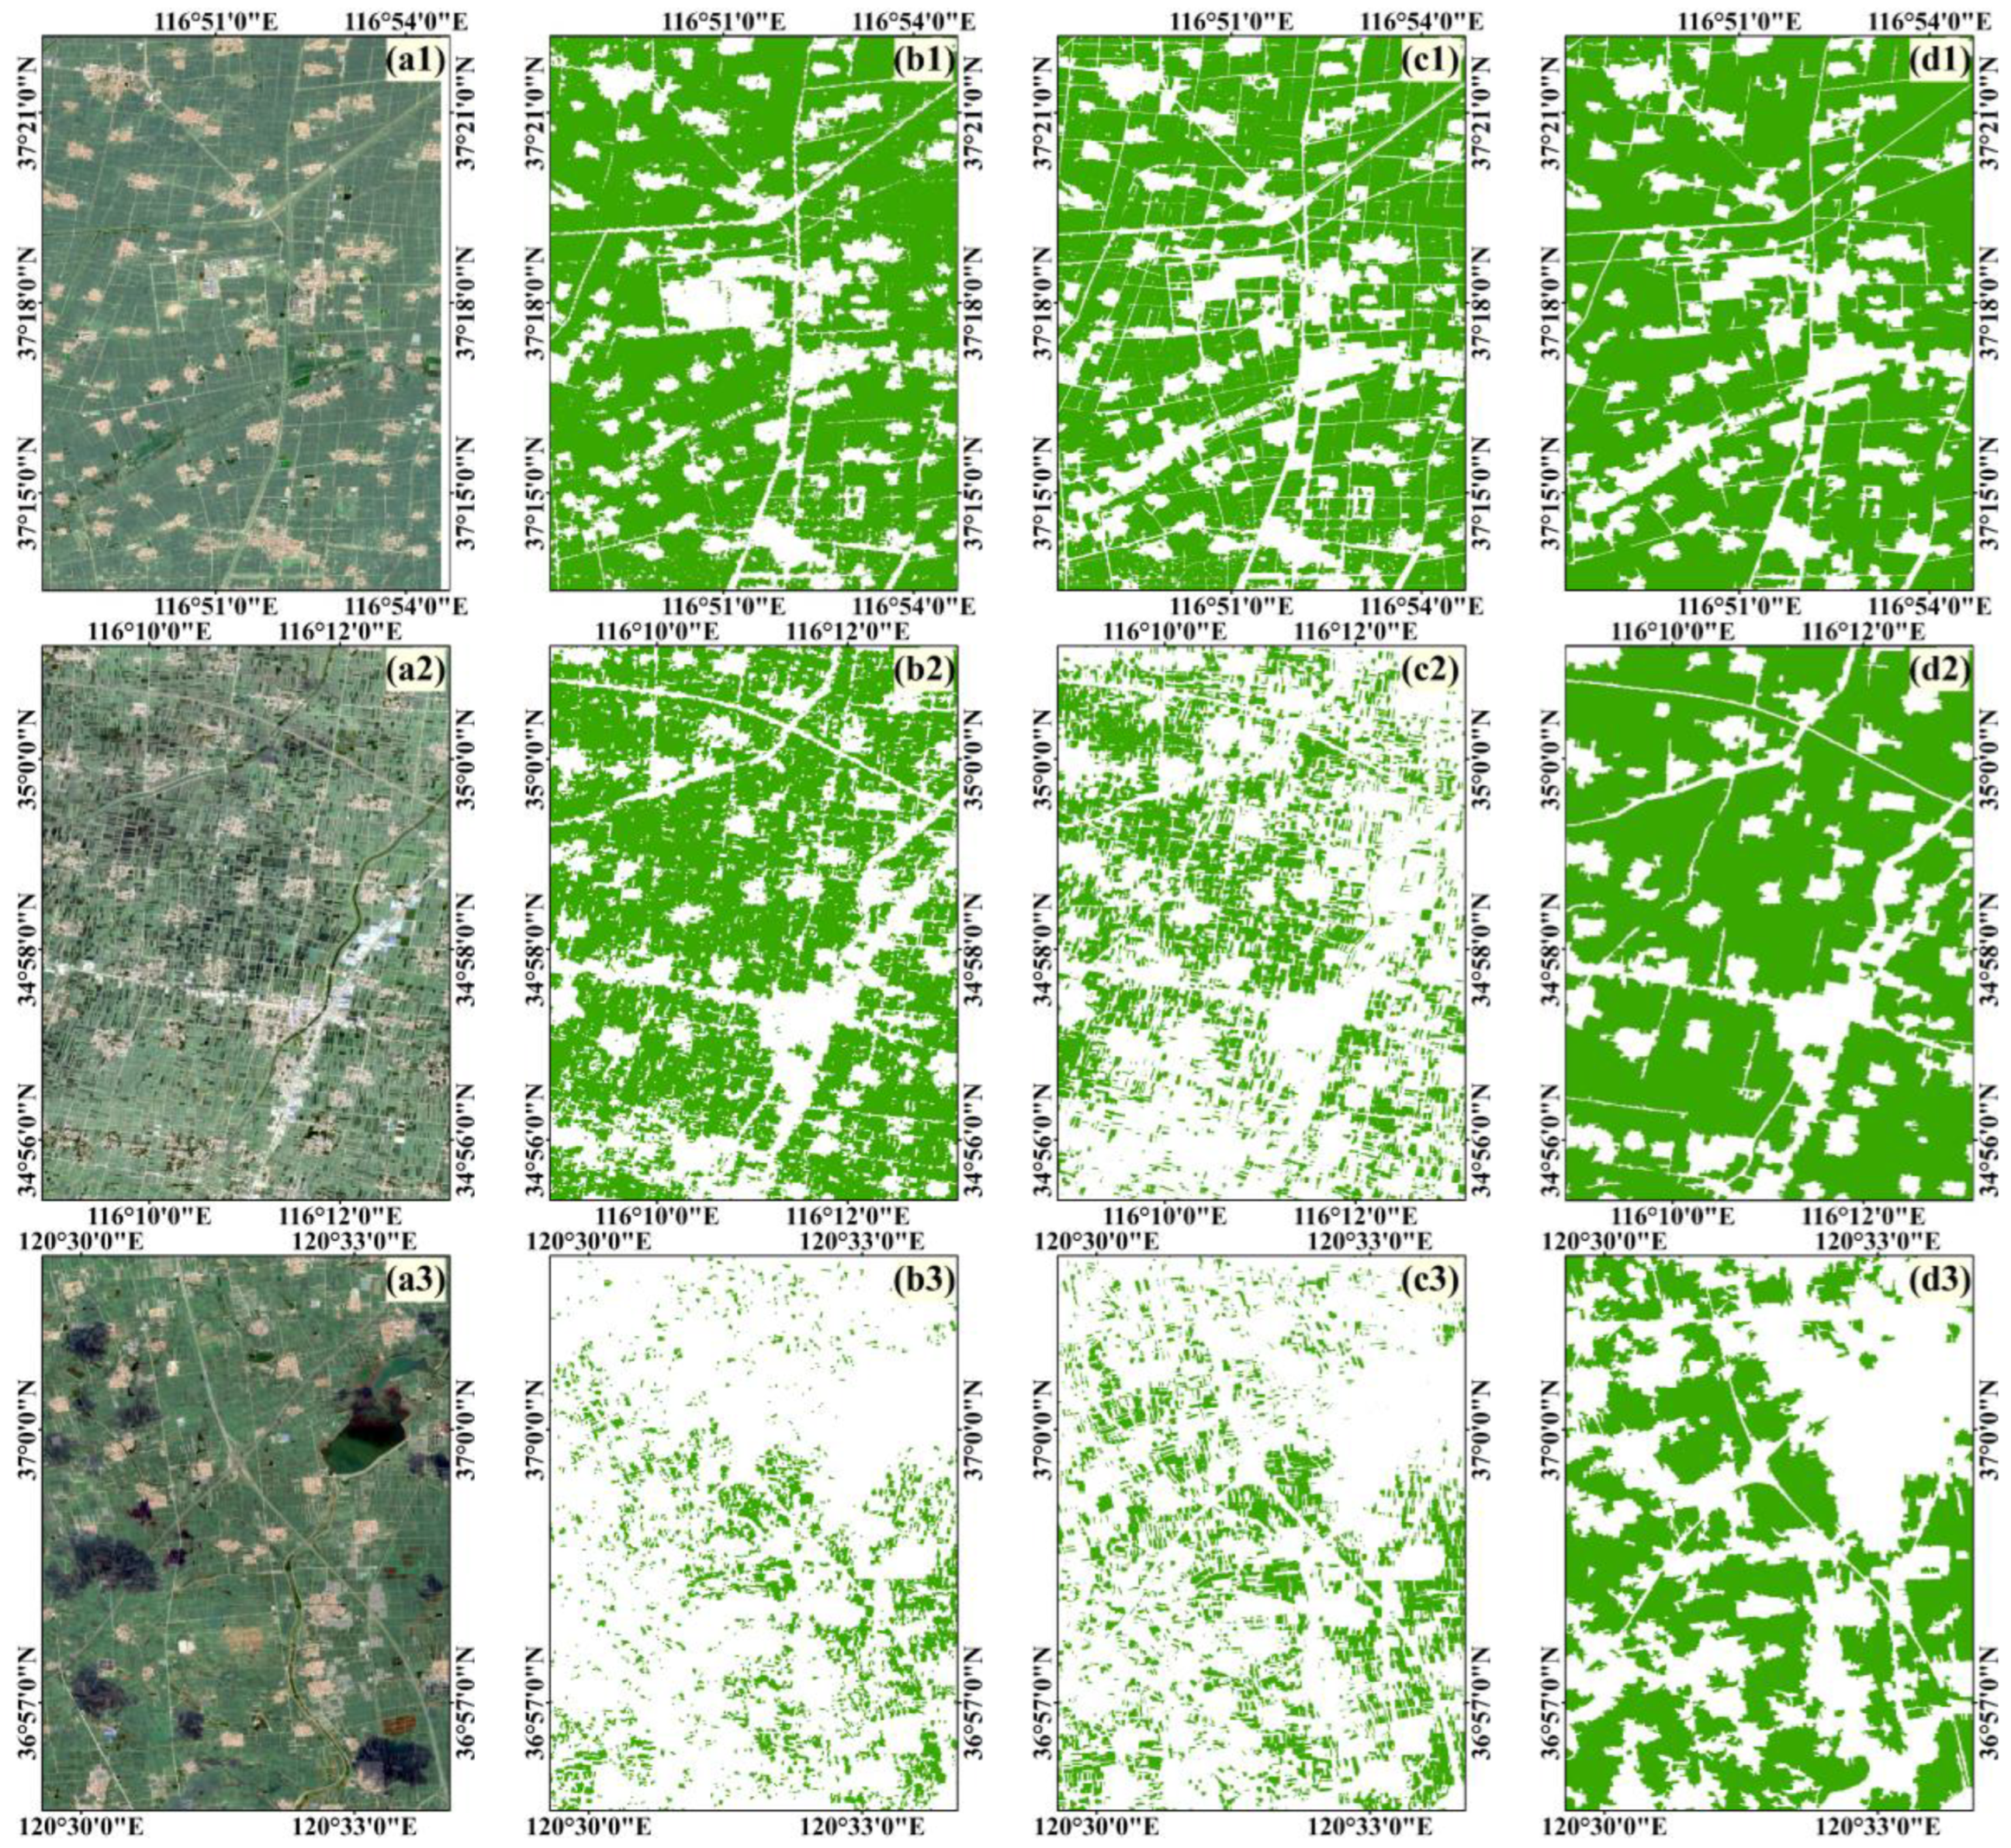
The integration method proposed in this study is mainly focused on pixel-based classification, image segmentation, and the organic combination of these two. Image segmentation is in fact the aggregation of neighboring homogeneous pixels into a computing unit to reduce the “pretzel effect” in the pixel-based classification process [63]. Then, the aggregation effect of this computational unit will directly affect the results of object-oriented classification, so the reasonableness of the image segmentation parameter settings is particularly important [60]. In this study, the setting of image segmentation parameters is optimized and adjusted in repeated experiments. As can be seen in Figure 7b, the image segmentation results under the control of this parameter combination well segmented most of the boundaries of the cultivated land. Whether it is flat farmland or irregular cropland parcels in the hills, it can be effectively separated from villages, woodlands and major roads, etc., which also provided a good basis for the next fusion method.
In Figure 7a, the ultra-high resolution RGB image from the MAPWORLD of Shandong Province is specifically employed to show the real surface situation more clearly. Figure 7b is the Sentinel-2 image during the peak growing season of winter wheat, and the image object layer is segmented based on it. Figure 7c is the pixel-based classification result. Figure 7d is the final winter wheat recognition under the implementation of the fusion method. From the accuracy assessment, the overall accuracy of the pixel-based and object-oriented classification results was 89.5% and 90.6%, while the final winter wheat map obtained by the fusion method is 92.2%, which was improved by 2.7% and 1.6%. Although the improvement is not very significant from the data, the fusion method is very advantageous by observing the actual classification results. From Figure 7c, it is obvious that the pixel-based classification result has a large number of fragmented pixels, most of which are misclassified. Meanwhile, more regular and accurate plots of cultivation were formed under the constraints of image segmentation objects. It has greatly reduced the pretzel effect produced by pixel-based classification and optimized the classification results. Especially in the hilly areas of south-central Shandong, the advantages of this method are more significant. In addition, the comparison showed that the winter wheat acreage derived from the fusion method was closer to the official statistical yearbook data, with a difference of only 3%, while the overestimation of the pixel-based method was 12%. This also indicates in another way that the fusion method gives more accurate results.

4.2. Factors Influencing the Distribution of Winter Wheat

The spatial distribution of crops is affected by various elements, such as topographic relief, temperature and precipitation, irrigation water source, soil type, etc. [64,65]. Considering the geographic location and cultivation patterns, this study found that the topographic relief and irrigation water sources have a significant effect on the winter wheat cropping structure in Shandong.
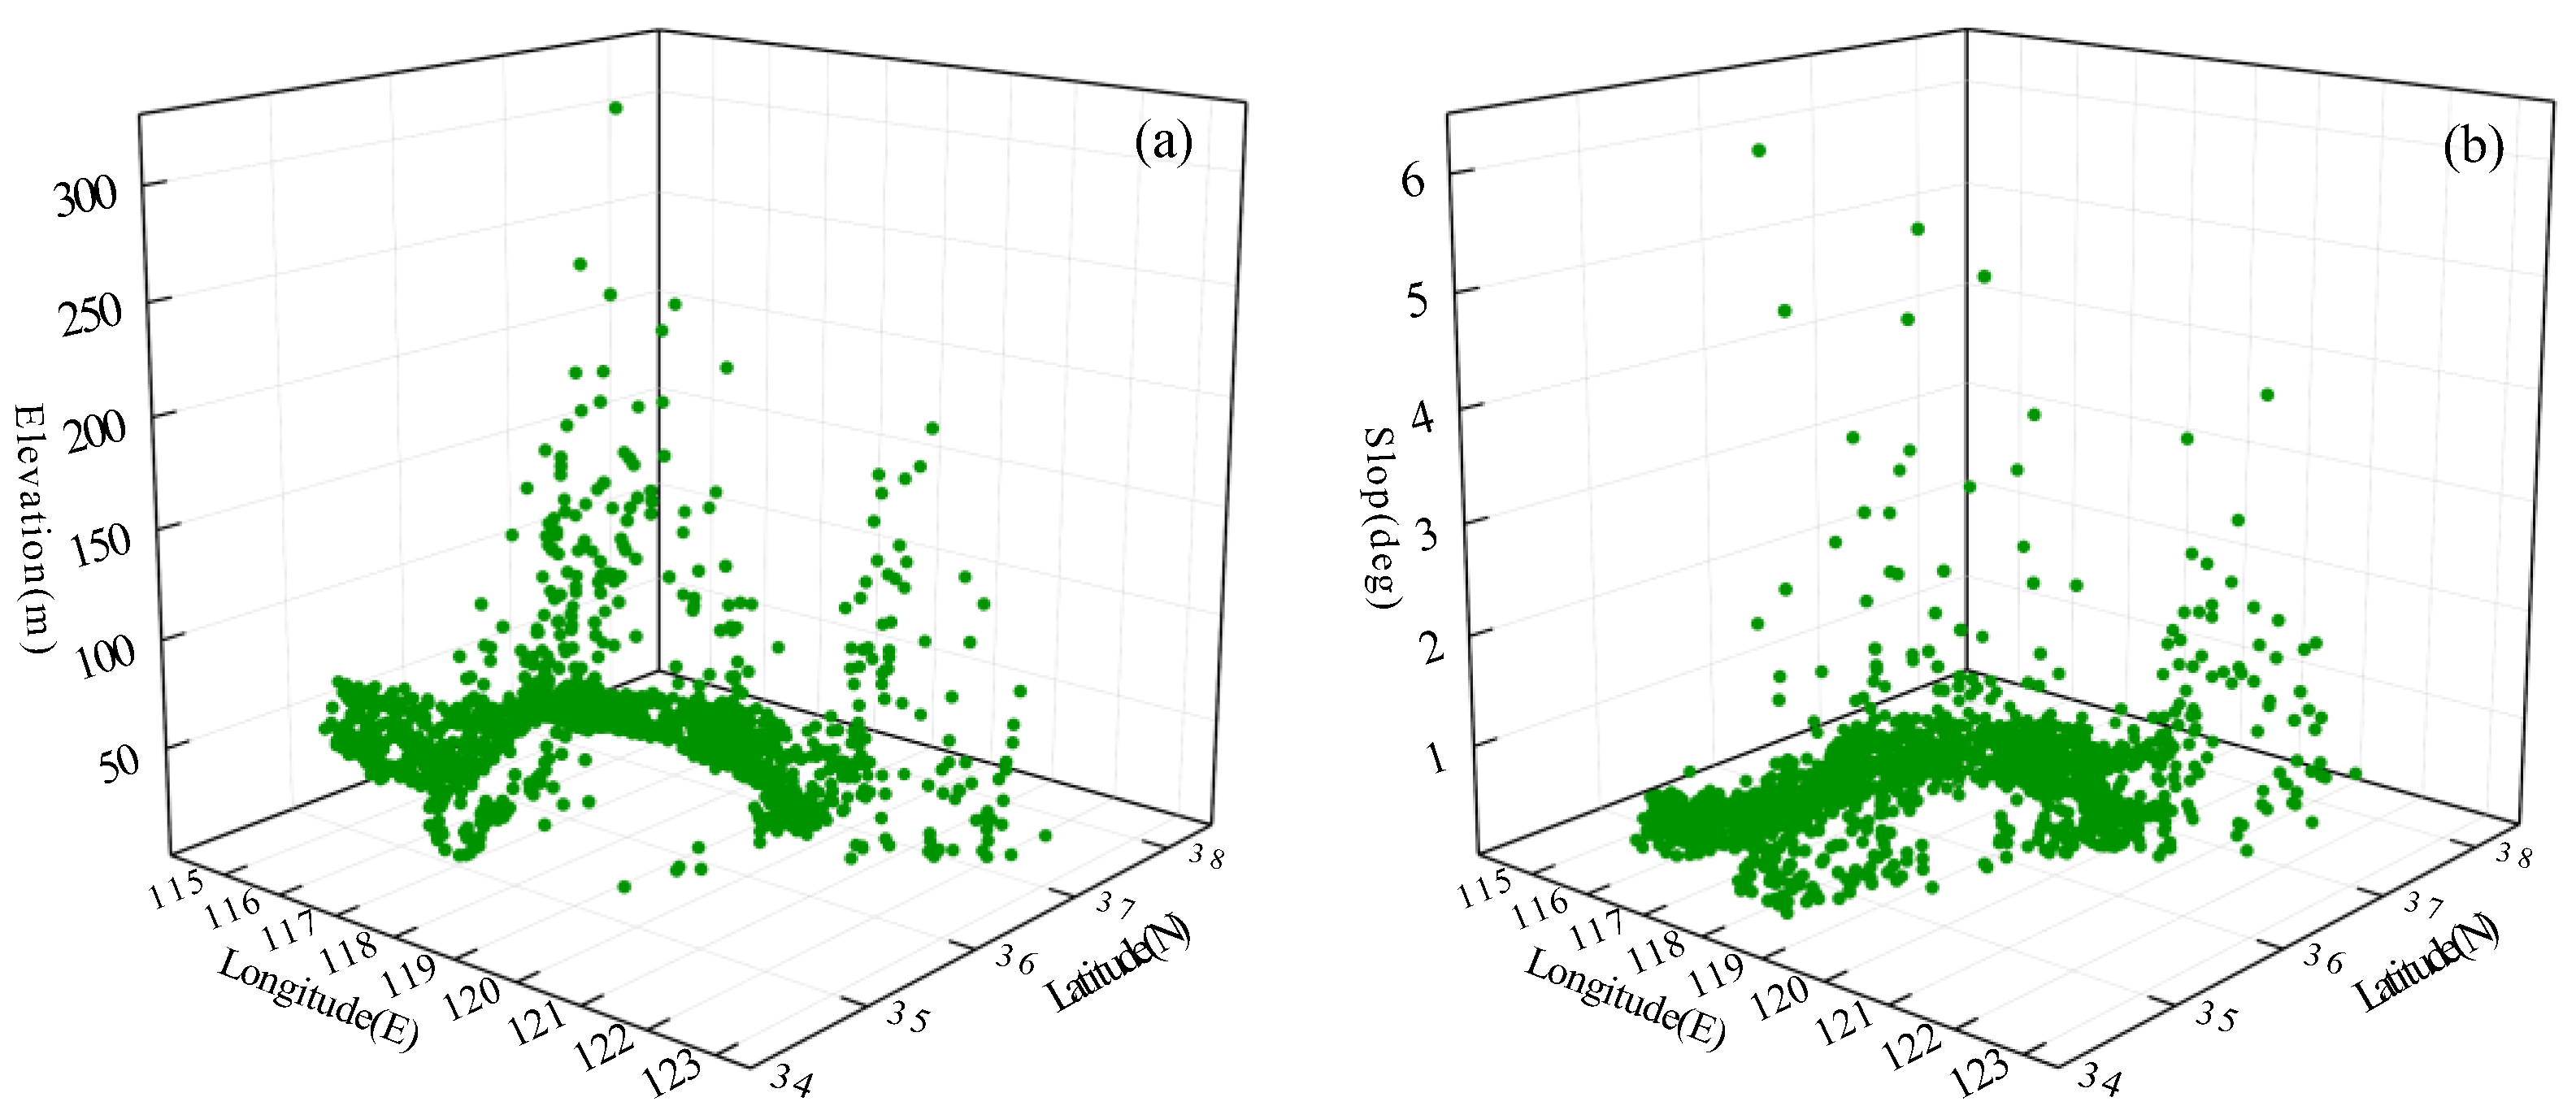
At first, topographic relief is an important restrictive element for crop cultivation, especially for provinces with a special topography like Shandong. It was found that the spatial distribution of winter wheat is closely related to the topography. As shown in Figure 8, winter wheat is mainly distributed in the plains, and it is most densely and evenly distributed in the area below 30 m in elevation. Winter wheat is also distributed in the area with an elevation range of 30 to 70 m, but it is relatively scattered. In addition, there is a small amount of them distributed in the area above 70 m in elevation, which is very fragmented. Figure 9a gives a better illustration of the three-dimensional spatial distribution of winter wheat. In addition, as shown in Figure 9b, the vast majority of wheat is distributed in areas with slopes less than 1. The main reason for this distribution is that the modern agriculture is based on mechanization from sowing, irrigation to harvesting and the monitoring of the growth process. Areas with large topographic relief not only restrict the operability of mechanization, but also are not conducive to irrigation. Therefore, altitude and topographic relief have an important influence on the distribution of winter wheat in Shandong.
Secondly, crop cultivation in Shandong Province is heavily influenced by irrigation resources as it is in the temperate monsoon zone, where precipitation is abundant but relatively concentrated. River irrigation is an important irrigation channel, and crop cultivation is often spread along rivers [66]. In different growth periods, abundant water has different yield-enhancing effects on winter wheat. As shown in Figure 10, multi-level rivers in Shandong provided abundant irrigation resources for crops. Winter wheat is more frequently distributed in the water basin areas dominated by first-order rivers in the west and north, and to a lesser extent near shorter-length rivers in the east. Therefore, winter wheat is more widely distributed and of higher farming quality in areas where water resources are abundant and the water supply is more economical and convenient.
In general, the topography of Shandong is characterized by high relief in the central, is dominated by mountainous terrain, and has hilly terrain along the eastern coast; both of these areas are unsuitable for the large-scale planting of winter wheat. The plains in the west and north are part of the three major watersheds, which are flat and wide, suitable for the large-scale cultivation and harvesting of crops, and have abundant irrigation resources, which are the main planting areas for food crops in Shandong.

4.3. Uncertainties

Shandong Province has a very wide area of cropland, but is affected by the topography, and some of the cropland is highly fragmented and spatially distributed, facing serious mixed image meta-problems even on the basis of a 10 m resolution. Furthermore, it is an agricultural area dominated by smallholder farming, which is a strong flexibility in the family-based farming practices and an orientation towards economic return [67,68]. Especially in hilly areas, intercropping is very common. The complicated cropping pattern makes crop identification more difficult [69]. This research has better completed the winter wheat extraction based on the GEE platform, but considering the special characteristics of the cropland itself, there are still parts of the study that need to be improved:
Firstly, the complex topography of Shandong leads to the fragmentation of cropland, and the scattered distribution of cropland plots creates more mixed image pixels. This, together with the combination of cropland and various vegetation cover, makes cropland parcels more difficult to be identified in the imagery, and prone to misclassification or being neglected. This research used Sentinel-2 image data with a 10 m resolution, which is higher than many other remote sensing imageries, but it is still deficient for an accurate identification of wheat.
Secondly, it is well known that high-quality training data are necessary for the supervised classification method. However, it is difficult to realize due to the high cost and time-consuming field surveys, especially for the vast area of Shandong. Therefore, the sample points in this study are mainly obtained by visual interpretation according to sample characteristics and expert knowledge based on a small amount of survey data, and the samples are not absolutely accurate.
Finally, Shandong Province covers a vast area and spans east-west and north-south. Also, there is a certain time difference between the coastal and inland agricultural climates. Generally, wheat in Shandong matures gradually from south to north and from west to east. This research has not yet taken into account the influence of the geographical span and local climate on crop phenology. In future research, a more detailed identification of winter wheat can be considered by dividing crop climatic zones.

5. Conclusions

This research proposed a fusion method to extract winter wheat in Shandong Province using the GEE as a computational platform and time-series Sentinel-2 images. The fusion method made full use of the advantages of the pixel-based and object-oriented classification methods to develop a high-quality spatial distribution map of winter wheat. The overall accuracy of the map is 92.2%, with a kappa coefficient of 0.84, which is strongly consistent with the actual situation. It was found that the fusion method was superior to the pure pixel-based or object-oriented methods for the identification of winter wheat, especially in hilly areas and at the intersection of different land cover types. In addition, the spatial distribution of winter wheat in Shandong Province has obvious geographical characteristics, which coincides with the general trend of topographic relief. The overall distribution characteristics are “more in the west and less in the east, dense and uniform in the west, and sparse and scattered in the east”. This is the result of multiple influencing factors, with topographic conditions being the main influence. This research not only demonstrated the advantages of combining pixel-based and object-oriented methods for other related studies, but also produced a spatial distribution map of winter wheat, which is very useful and contributes to the planning of cultivated land resources in Shandong Province.

Author Contributions

Conceptualization, Y.F., B.C. and L.Z.; Methodology, B.C., W.L. and L.Z.; Software, B.C. and W.L.; Validation, Y.F., W.L., X.X., T.L. and L.Z.; Formal analysis, Y.F., L.Z. and H.X.; Investigation, Y.F., X.X. and T.L.; Resources, W.L., X.X. and T.L.; Data curation, Y.F., W.L., T.L. and L.Z.; Writing—original draft, Y.F. and B.C.; Writing—review & editing, B.C. and H.X.; Visualization, B.C. and H.X.; Supervision, B.C., X.X., T.L. and H.X.; Project administration, T.L.; Funding acquisition, X.X. All authors have read and agreed to the published version of the manuscript.

Funding

This research was funded by the Shandong Provincial Natural Science Foundation (No. ZR2022YQ36); Youth Innovation Team Project of Higher School in Shandong Province (No. 2022KJ201).

Institutional Review Board Statement

Not applicable.

Informed Consent Statement

Not applicable.

Data Availability Statement

The data presented in this study are available on request from the corresponding author due to privacy.

Conflicts of Interest

Author Wei Liu was employed by the company Shandong Yuanhong Survey Planning and Design Co., Ltd. The remaining authors declare that the research was conducted in the absence of any commercial or financial relationships that could be construed as a potential conflict of interest.

References

  1. Bastos, L.M.; Carciochi, W.; Lollato, R.P.; Jaenisch, B.R.; Rezende, C.R.; Schwalbert, R.; Vara Prasad, P.V.; Zhang, G.; Fritz, A.K.; Foster, C. Winter wheat yield response to plant density as a function of yield environment and tillering potential: A review and field studies. Front. Plant Sci. 2020, 11, 54. [Google Scholar] [CrossRef]
  2. Erenstein, O.; Chamberlin, J.; Sonder, K. Estimating the global number and distribution of maize and wheat farms. Glob. Food Sec. 2021, 30, 100558. [Google Scholar] [CrossRef]
  3. Erenstein, O.; Jaleta, M.; Mottaleb, K.A.; Sonder, K.; Donovan, J.; Braun, H.-J. Global trends in wheat production, consumption and trade. In Wheat Improvement: Food Security in a Changing Climate; Springer International Publishing: Cham, Switzerland, 2022; pp. 47–66. [Google Scholar]
  4. Soto-Gómez, D.; Pérez-Rodríguez, P. Sustainable agriculture through perennial grains: Wheat, rice, maize, and other species. A review. Agric. Ecosyst. Environ. 2022, 325, 107747. [Google Scholar] [CrossRef]
  5. Rudoy, D.; Pakhomov, V.; Olshevskaya, A.; Maltseva, T.; Ugrekhelidze, N.; Zhuravleva, A.; Babajanyan, A. Review and Analysis of Perennial Cereal Crops at Different Maturity Stages. IOP Conf. Ser. Earth Environ. Sci. 2021, 937, 22111. [Google Scholar] [CrossRef]
  6. Ma, M.; Li, Y.; Xue, C.; Xiong, W.; Peng, Z.; Han, X.; Ju, H.; He, Y. Current situation and key parameters for improving wheat quality in China. Front. Plant Sci. 2021, 12, 638525. [Google Scholar] [CrossRef] [PubMed]
  7. Yu, Z.; Deng, X. Assessment of land degradation in the North China Plain driven by food security goals. Ecol. Eng. 2022, 183, 106766. [Google Scholar] [CrossRef]
  8. Wang, X. Managing land carrying capacity: Key to achieving sustainable production systems for food security. Land 2022, 11, 484. [Google Scholar] [CrossRef]
  9. Xing, H.; Chen, B.; Feng, Y.; Ni, Y.; Hou, D.; Wang, X.; Kong, Y. Mapping Irrigated, Rainfed and Paddy Croplands from Time-Series Sentinel-2 Images by Integrating Pixel-based Classification and Image Segmentation on Google Earth Engine. Geocarto Int. 2022, 37, 13291–13310. [Google Scholar] [CrossRef]
  10. Ren, T.; Xu, H.; Cai, X.; Yu, S.; Qi, J. Smallholder crop type mapping and rotation monitoring in mountainous areas with Sentinel-1/2 imagery. Remote Sens. 2022, 14, 566. [Google Scholar] [CrossRef]
  11. Li, K.; Xu, E. Cropland data fusion and correction using spatial analysis techniques and the Google Earth Engine. GIScience Remote Sens. 2020, 57, 1026–1045. [Google Scholar] [CrossRef]
  12. Liu, J.; Wang, H.; Zhang, Y.; Zhao, X.; Qu, T.; Tian, H.; Lu, Y.; Su, J.; Luo, D.; Yang, Y. A Spatial Distribution Extraction Method for Winter Wheat Based on Improved U-Net. Remote Sens. 2023, 15, 3711. [Google Scholar] [CrossRef]
  13. Gumma, M.K.; Tummala, K.; Dixit, S.; Collivignarelli, F.; Holecz, F.; Kolli, R.N.; Whitbread, A.M. Crop type identification and spatial mapping using Sentinel-2 satellite data with focus on field-level information. Geocarto Int. 2020, 37, 1833–1849. [Google Scholar] [CrossRef]
  14. Zhang, C.; Di, L.; Hao, P.; Yang, Z.; Lin, L.; Zhao, H.; Guo, L. Rapid in-season mapping of corn and soybeans using machine-learned trusted pixels from Cropland Data Layer. Int. J. Appl. Earth Obs. Geoinf. 2021, 102, 102374. [Google Scholar] [CrossRef]
  15. Liu, L.; Xiao, X.; Qin, Y.; Wang, J.; Xu, X.; Hu, Y.; Qiao, Z. Mapping cropping intensity in China using time series Landsat and Sentinel-2 images and Google Earth Engine. Remote Sens. Environ. 2020, 239, 111624. [Google Scholar] [CrossRef]
  16. Tassi, A.; Gigante, D.; Modica, G.; Di Martino, L.; Vizzari, M. Pixel-vs. Object-based landsat 8 data classification in google earth engine using random forest: The case study of maiella national park. Remote Sens. 2021, 13, 2299. [Google Scholar] [CrossRef]
  17. Su, T.; Zhang, S. Object-based crop classification in Hetao plain using random forest. Earth Sci. Inform. 2021, 14, 119–131. [Google Scholar] [CrossRef]
  18. Li, G.; Wan, Y. A new combination classification of pixel- and object-based methods. Int. J. Remote Sens. 2015, 36, 5842–5868. [Google Scholar] [CrossRef]
  19. Xiong, J.; Thenkabail, P.S.; Tilton, J.C.; Gumma, M.K.; Teluguntla, P.; Oliphant, A.; Congalton, R.G.; Yadav, K.; Gorelick, N. Nominal 30-m cropland extent map of continental Africa by integrating pixel-based and object-based algorithms using Sentinel-2 and Landsat-8 data on google earth engine. Remote Sens. 2017, 9, 1065. [Google Scholar] [CrossRef]
  20. Massey, R.; Sankey, T.T.; Yadav, K.; Congalton, R.G.; Tilton, J.C. Integrating cloud-based workflows in continental-scale cropland extent classification. Remote Sens. Environ. 2018, 219, 162–179. [Google Scholar] [CrossRef]
  21. Liu, M.; Fu, B.; Fan, D.; Zuo, P.; Xie, S.; He, H.; Liu, L.; Huang, L.; Gao, E.; Zhao, M. Study on transfer learning ability for classifying marsh vegetation with multi-sensor images using DeepLabV3+ and HRNet deep learning algorithms. Int. J. Appl. Earth Obs. Geoinf. 2021, 103, 102531. [Google Scholar] [CrossRef]
  22. Niu, S.; Lyu, X.; Gu, G.; Zhou, X.; Peng, W. Sustainable intensification of cultivated land use and its influencing factors at the farming household scale: A case study of Shandong province, China. Chin. Geogr. Sci. 2021, 31, 109–125. [Google Scholar] [CrossRef]
  23. Qu, Y.; Lyu, X.; Peng, W.; Xin, Z. How to evaluate the green utilization efficiency of cultivated land in a farming household? A case study of shandong province, China. Land 2021, 10, 789. [Google Scholar] [CrossRef]
  24. Xie, Y.; Huang, J. Integration of a crop growth model and deep learning methods to improve satellite-based yield estimation of winter wheat in Henan Province, China. Remote Sens. 2021, 13, 4372. [Google Scholar] [CrossRef]
  25. Xu, F.; Li, Z.; Zhang, S.; Huang, N.; Quan, Z.; Zhang, W.; Liu, X.; Jiang, X.; Pan, J.; Prishchepov, A. V Mapping winter wheat with combinations of temporally aggregated Sentinel-2 and Landsat-8 data in Shandong Province, China. Remote Sens. 2020, 12, 2065. [Google Scholar] [CrossRef]
  26. Zhao, Y.; Wang, X.; Guo, Y.; Hou, X.; Dong, L. Winter Wheat Phenology Variation and Its Response to Climate Change in Shandong Province, China. Remote Sens. 2022, 14, 4482. [Google Scholar] [CrossRef]
  27. Li, H.; Liu, S.; Yin, M.; Zhu, L.; Shen, E.; Sun, B.; Wang, S. Spatial and temporal variability and risk assessment of regional climate change in northern China: A case study in Shandong Province. In Natural Hazards; Springer: Berlin/Heidelberg, Germany, 2022; pp. 1–38. [Google Scholar]
  28. Yu, S.-Y.; Hou, Z.; Chen, X.; Wang, Y.; Song, Y.; Gao, M.; Pan, J.; Sun, M.; Fang, H.; Han, J. Extreme flooding of the lower Yellow River near the Northgrippian-Meghalayan boundary: Evidence from the Shilipu archaeological site in southwestern Shandong Province, China. Geomorphology 2020, 350, 106878. [Google Scholar] [CrossRef]
  29. Dong, Q.; Chen, X.; Chen, J.; Zhang, C.; Liu, L.; Cao, X.; Zang, Y.; Zhu, X.; Cui, X. Mapping winter wheat in north China using sentinel 2A/B data: A method based on phenology-timeweighted dynamic time warping. Remote Sens. 2020, 12, 1274. [Google Scholar] [CrossRef]
  30. Jin, Y.; Liu, X.; Yao, J.; Zhang, X.; Zhang, H. Mapping the annual dynamics of cultivated land in typical area of the Middle-lower Yangtze plain using long time-series of Landsat images based on Google Earth Engine. Int. J. Remote Sens. 2020, 41, 1625–1644. [Google Scholar] [CrossRef]
  31. Li, Q.; Zhang, J.; Zhang, J.; Gao, H.; Chen, W.; Huang, J.; Guo, Y.; Yue, S.; Li, G. Spatial and temporal distribution characteristics and prediction analysis of nitrogen and phosphorus surface source pollution in Shandong Province under the climate and land use changes. Front. Ecol. Evol. 2023, 11, 1231394. [Google Scholar] [CrossRef]
  32. Liu, Y.; Wang, A.; Hou, J.; Chen, X.; Xia, J. Comprehensive evaluation of rural courtyard utilization efficiency: A case study in Shandong Province, Eastern China. J. Mt. Sci. 2020, 17, 2280–2295. [Google Scholar] [CrossRef]
  33. Jin, Y.; Liu, X.; Chen, Y.; Liang, X. Land-cover mapping using Random Forest classification and incorporating NDVI time-series and texture: A case study of central Shandong. Int. J. Remote Sens. 2018, 39, 8703–8723. [Google Scholar] [CrossRef]
  34. Sun, X.; Yu, C.; Wang, J.; Wang, M. The intensity analysis of production living ecological land in Shandong Province, China. Sustainability 2020, 12, 8326. [Google Scholar] [CrossRef]
  35. Luo, Y.; Zhang, Z.; Li, Z.; Chen, Y.; Chen, Y.; Zhang, L.; Cao, J.; Tao, F.; Tao, F. Identifying the spatiotemporal changes of annual harvesting areas for three staple crops in China by integrating multi-data sources. Environ. Res. Lett. 2020, 15, 074003. [Google Scholar] [CrossRef]
  36. Griffiths, P.; Nendel, C.; Hostert, P. Intra-annual reflectance composites from Sentinel-2 and Landsat for national-scale crop and land cover mapping. Remote Sens. Environ. 2019, 220, 135–151. [Google Scholar] [CrossRef]
  37. Yang, X.; Qin, Q.; Yésou, H.; Ledauphin, T.; Koehl, M.; Grussenmeyer, P.; Zhu, Z. Monthly estimation of the surface water extent in France at a 10-m resolution using Sentinel-2 data. Remote Sens. Environ. 2020, 244, 111803. [Google Scholar] [CrossRef]
  38. Verhegghen, A.; Lemoine, G.; Kempeneers, P.; Meroni, M.; Van Der Velde, M. From parcel to continental scale—A first European crop type map based on Sentinel-1 and LUCAS Copernicus in-situ observations. Remote Sens. Environ. 2021, 266, 112708. [Google Scholar] [CrossRef]
  39. Blickensdörfer, L.; Schwieder, M.; Pflugmacher, D.; Nendel, C.; Erasmi, S.; Hostert, P. Mapping of crop types and crop sequences with combined time series of Sentinel-1, Sentinel-2 and Landsat 8 data for Germany. Remote Sens. Environ. 2022, 269, 112831. [Google Scholar] [CrossRef]
  40. Jia, M.; Wang, Z.; Mao, D.; Ren, C.; Wang, C.; Wang, Y. Rapid, robust, and automated mapping of tidal flats in China using time series Sentinel-2 images and Google Earth Engine. Remote Sens. Environ. 2021, 255, 112285. [Google Scholar] [CrossRef]
  41. Xing, H.; Zhu, L.; Niu, J.; Chen, B.; Wang, W.; Hou, D. A land cover change detection method combing spectral values and class probabilities. IEEE Access 2021, 9, 83727–83739. [Google Scholar] [CrossRef]
  42. Li, Z.; Xiang, Z.; Demiray, B.Z.; Sit, M.; Demir, I. MA-SARNet: A one-shot nowcasting framework for SAR image prediction with physical driving forces. ISPRS J. Photogramm. Remote Sens. 2023, 205, 176–190. [Google Scholar] [CrossRef]
  43. Roteta, E.; Bastarrika, A.; Franquesa, M.; Chuvieco, E. Landsat and sentinel-2 based burned area mapping tools in google earth engine. Remote Sens. 2021, 13, 816. [Google Scholar] [CrossRef]
  44. Sola, I.; García-Martín, A.; Sandonís-Pozo, L.; Álvarez-Mozos, J.; Pérez-Cabello, F.; González-Audícana, M.; Llovería, R.M. Assessment of atmospheric correction methods for Sentinel-2 images in Mediterranean landscapes. Int. J. Appl. earth Obs. Geoinf. 2018, 73, 63–76. [Google Scholar] [CrossRef]
  45. He, Y.; Dong, J.; Liao, X.; Sun, L.; Wang, Z.; You, N.; Li, Z.; Fu, P. Examining rice distribution and cropping intensity in a mixed single- and double-cropping region in South China using all available Sentinel 1/2 images. Int. J. Appl. Earth Obs. Geoinf. 2021, 101, 102351. [Google Scholar] [CrossRef]
  46. Xing, H.; Chen, B.; Lu, M. A sub-seasonal crop information identification framework for crop rotation mapping in smallholder farming areas with time series sentinel-2 imagery. Remote Sens. 2022, 14, 6280. [Google Scholar] [CrossRef]
  47. Oliphant, A.J.; Thenkabail, P.S.; Teluguntla, P.; Xiong, J.; Gumma, M.K.; Congalton, R.G.; Yadav, K. Mapping cropland extent of Southeast and Northeast Asia using multi-year time-series Landsat 30-m data using a random forest classifier on the Google Earth Engine Cloud. Int. J. Appl. Earth Obs. Geoinf. 2019, 81, 110–124. [Google Scholar] [CrossRef]
  48. Samasse, K.; Hanan, N.P.; Anchang, J.Y.; Diallo, Y. A high-resolution cropland map for the West African Sahel based on high-density training data, google earth engine, and locally optimized machine learning. Remote Sens. 2020, 12, 1436. [Google Scholar] [CrossRef]
  49. Guo, Y.; Xia, H.; Pan, L.; Zhao, X.; Li, R. Mapping the Northern Limit of Double Cropping Using a Phenology-Based Algorithm and Google Earth Engine. Remote Sens. 2022, 14, 1004. [Google Scholar] [CrossRef]
  50. Tucker, C.J. Red and photographic infrared linear combinations for monitoring vegetation. Remote Sens. Environ. 1979, 8, 127–150. [Google Scholar] [CrossRef]
  51. Xiao, X.; Boles, S.; Liu, J.; Zhuang, D.; Liu, M. Characterization of forest types in Northeastern China, using multi-temporal SPOT-4 VEGETATION sensor data. Remote Sens. Environ. 2002, 82, 335–348. [Google Scholar] [CrossRef]
  52. Huete, A.R. A soil-adjusted vegetation index (SAVI). Remote Sens. Environ. 1988, 25, 295–309. [Google Scholar] [CrossRef]
  53. Wang, C.; Chen, J.; Wu, J.; Tang, Y.; Shi, P.; Black, T.A.; Zhu, K. A snow-free vegetation index for improved monitoring of vegetation spring green-up date in deciduous ecosystems. Remote Sens. Environ. 2017, 196, 1–12. [Google Scholar] [CrossRef]
  54. Ajadi, O.A.; Barr, J.; Liang, S.Z.; Ferreira, R.; Kumpatla, S.P.; Patel, R.; Swatantran, A. Large-scale crop type and crop area mapping across Brazil using synthetic aperture radar and optical imagery. Int. J. Appl. Earth Obs. Geoinf. 2021, 97, 102294. [Google Scholar] [CrossRef]
  55. Yan, S.; Yao, X.; Zhu, D.; Liu, D.; Zhang, L.; Yu, G.; Gao, B.; Yang, J.; Yun, W. Large-scale crop mapping from multi-source optical satellite imageries using machine learning with discrete grids. Int. J. Appl. Earth Obs. Geoinf. 2021, 103, 102485. [Google Scholar] [CrossRef]
  56. Sun, Z.; Wang, G.; Li, P.; Wang, H.; Zhang, M.; Liang, X. An improved random forest based on the classification accuracy and correlation measurement of decision trees. Expert Syst. Appl. 2024, 237, 121549. [Google Scholar] [CrossRef]
  57. Zhong, L.; Hu, L.; Yu, L.; Gong, P.; Biging, G.S. Automated mapping of soybean and corn using phenology. ISPRS J. Photogramm. Remote Sens. 2016, 119, 151–164. [Google Scholar] [CrossRef]
  58. Hu, Q.; Sulla-Menashe, D.; Xu, B.; Yin, H.; Tang, H.; Yang, P.; Wu, W. A phenology-based spectral and temporal feature selection method for crop mapping from satellite time series. Int. J. Appl. Earth Obs. Geoinf. 2019, 80, 218–229. [Google Scholar] [CrossRef]
  59. Tassi, A.; Vizzari, M. Object-oriented lulc classification in google earth engine combining snic, glcm, and machine learning algorithms. Remote Sens. 2020, 12, 3776. [Google Scholar] [CrossRef]
  60. Qu, L.; Chen, Z.; Li, M.; Zhi, J.; Wang, H. Accuracy improvements to pixel-based and object-based LULC classification with auxiliary datasets from google earth engine. Remote Sens. 2021, 13, 453. [Google Scholar] [CrossRef]
  61. Dong, J.; Fu, Y.; Wang, J.; Tian, H.; Fu, S.; Niu, Z.; Han, W.; Zheng, Y.; Huang, J.; Yuan, W. Early-season mapping of winter wheat in China based on Landsat and Sentinel images. Earth Syst. Sci. Data 2020, 12, 3081–3095. [Google Scholar] [CrossRef]
  62. Yang, G.; Li, X.; Liu, P.; Yao, X.; Zhu, Y.; Cao, W.; Cheng, T. Automated in-season mapping of winter wheat in China with training data generation and model transfer. ISPRS J. Photogramm. Remote Sens. 2023, 202, 422–438. [Google Scholar] [CrossRef]
  63. Dang, G.; Mao, Z.; Zhang, T.; Liu, T.; Wang, T.; Li, L.; Gao, Y.; Tian, R.; Wang, K.; Han, L. Joint superpixel and Transformer for high resolution remote sensing image classification. Sci. Rep. 2023, 14, 5054. [Google Scholar] [CrossRef] [PubMed]
  64. Li, Q.; Gu, F.; Zhou, Y.; Xu, T.; Wang, L.; Zuo, Q.; Xiao, L.; Liu, J.; Tian, Y. Changes in the impacts of topographic factors, soil texture, and cropping systems on topsoil chemical properties in the mountainous areas of the subtropical monsoon region from 2007 to 2017: A case study in Hefeng, China. Int. J. Environ. Res. Public Health 2021, 18, 832. [Google Scholar] [CrossRef] [PubMed]
  65. Xu, L.; Du, H.; Zhang, X. Spatial distribution characteristics of soil salinity and moisture and its influence on agricultural irrigation in the Ili River Valley, China. Sustainability 2019, 11, 7142. [Google Scholar] [CrossRef]
  66. Karimba, B.M.; Duker, A.; Prasad, P.; Karimi, P.; de Fraiture, C.; van der Zaag, P. Irrigation on the move: How transient farming partnerships facilitate the expansion of smallholder irrigation along ephemeral rivers in dryland areas of Kenya. Agric. Water Manag. 2022, 265, 107526. [Google Scholar] [CrossRef]
  67. Kang, S.; Ait Sidhoum, A.; Frick, F.; Sauer, J.; Zheng, S. The impact of information and communication technology on the technical efficiency of smallholder vegetable farms in Shandong of China. Q Open 2023, 3, qoad017. [Google Scholar] [CrossRef]
  68. Wang, X.; Sarkar, A.; Wang, H.; Zhang, F. Does participation in agricultural value chain activities influence smallholder fruit grower production performance? A cross-sectional study of apple farmers in Shandong, China. Horticulturae 2021, 7, 153. [Google Scholar] [CrossRef]
  69. Xing, H.; Chen, J.; Wu, H.; Hou, D. A web service-oriented geoprocessing system for supporting intelligent land cover change detection. ISPRS Int. J. Geo.-Inf. 2019, 8, 50. [Google Scholar] [CrossRef]
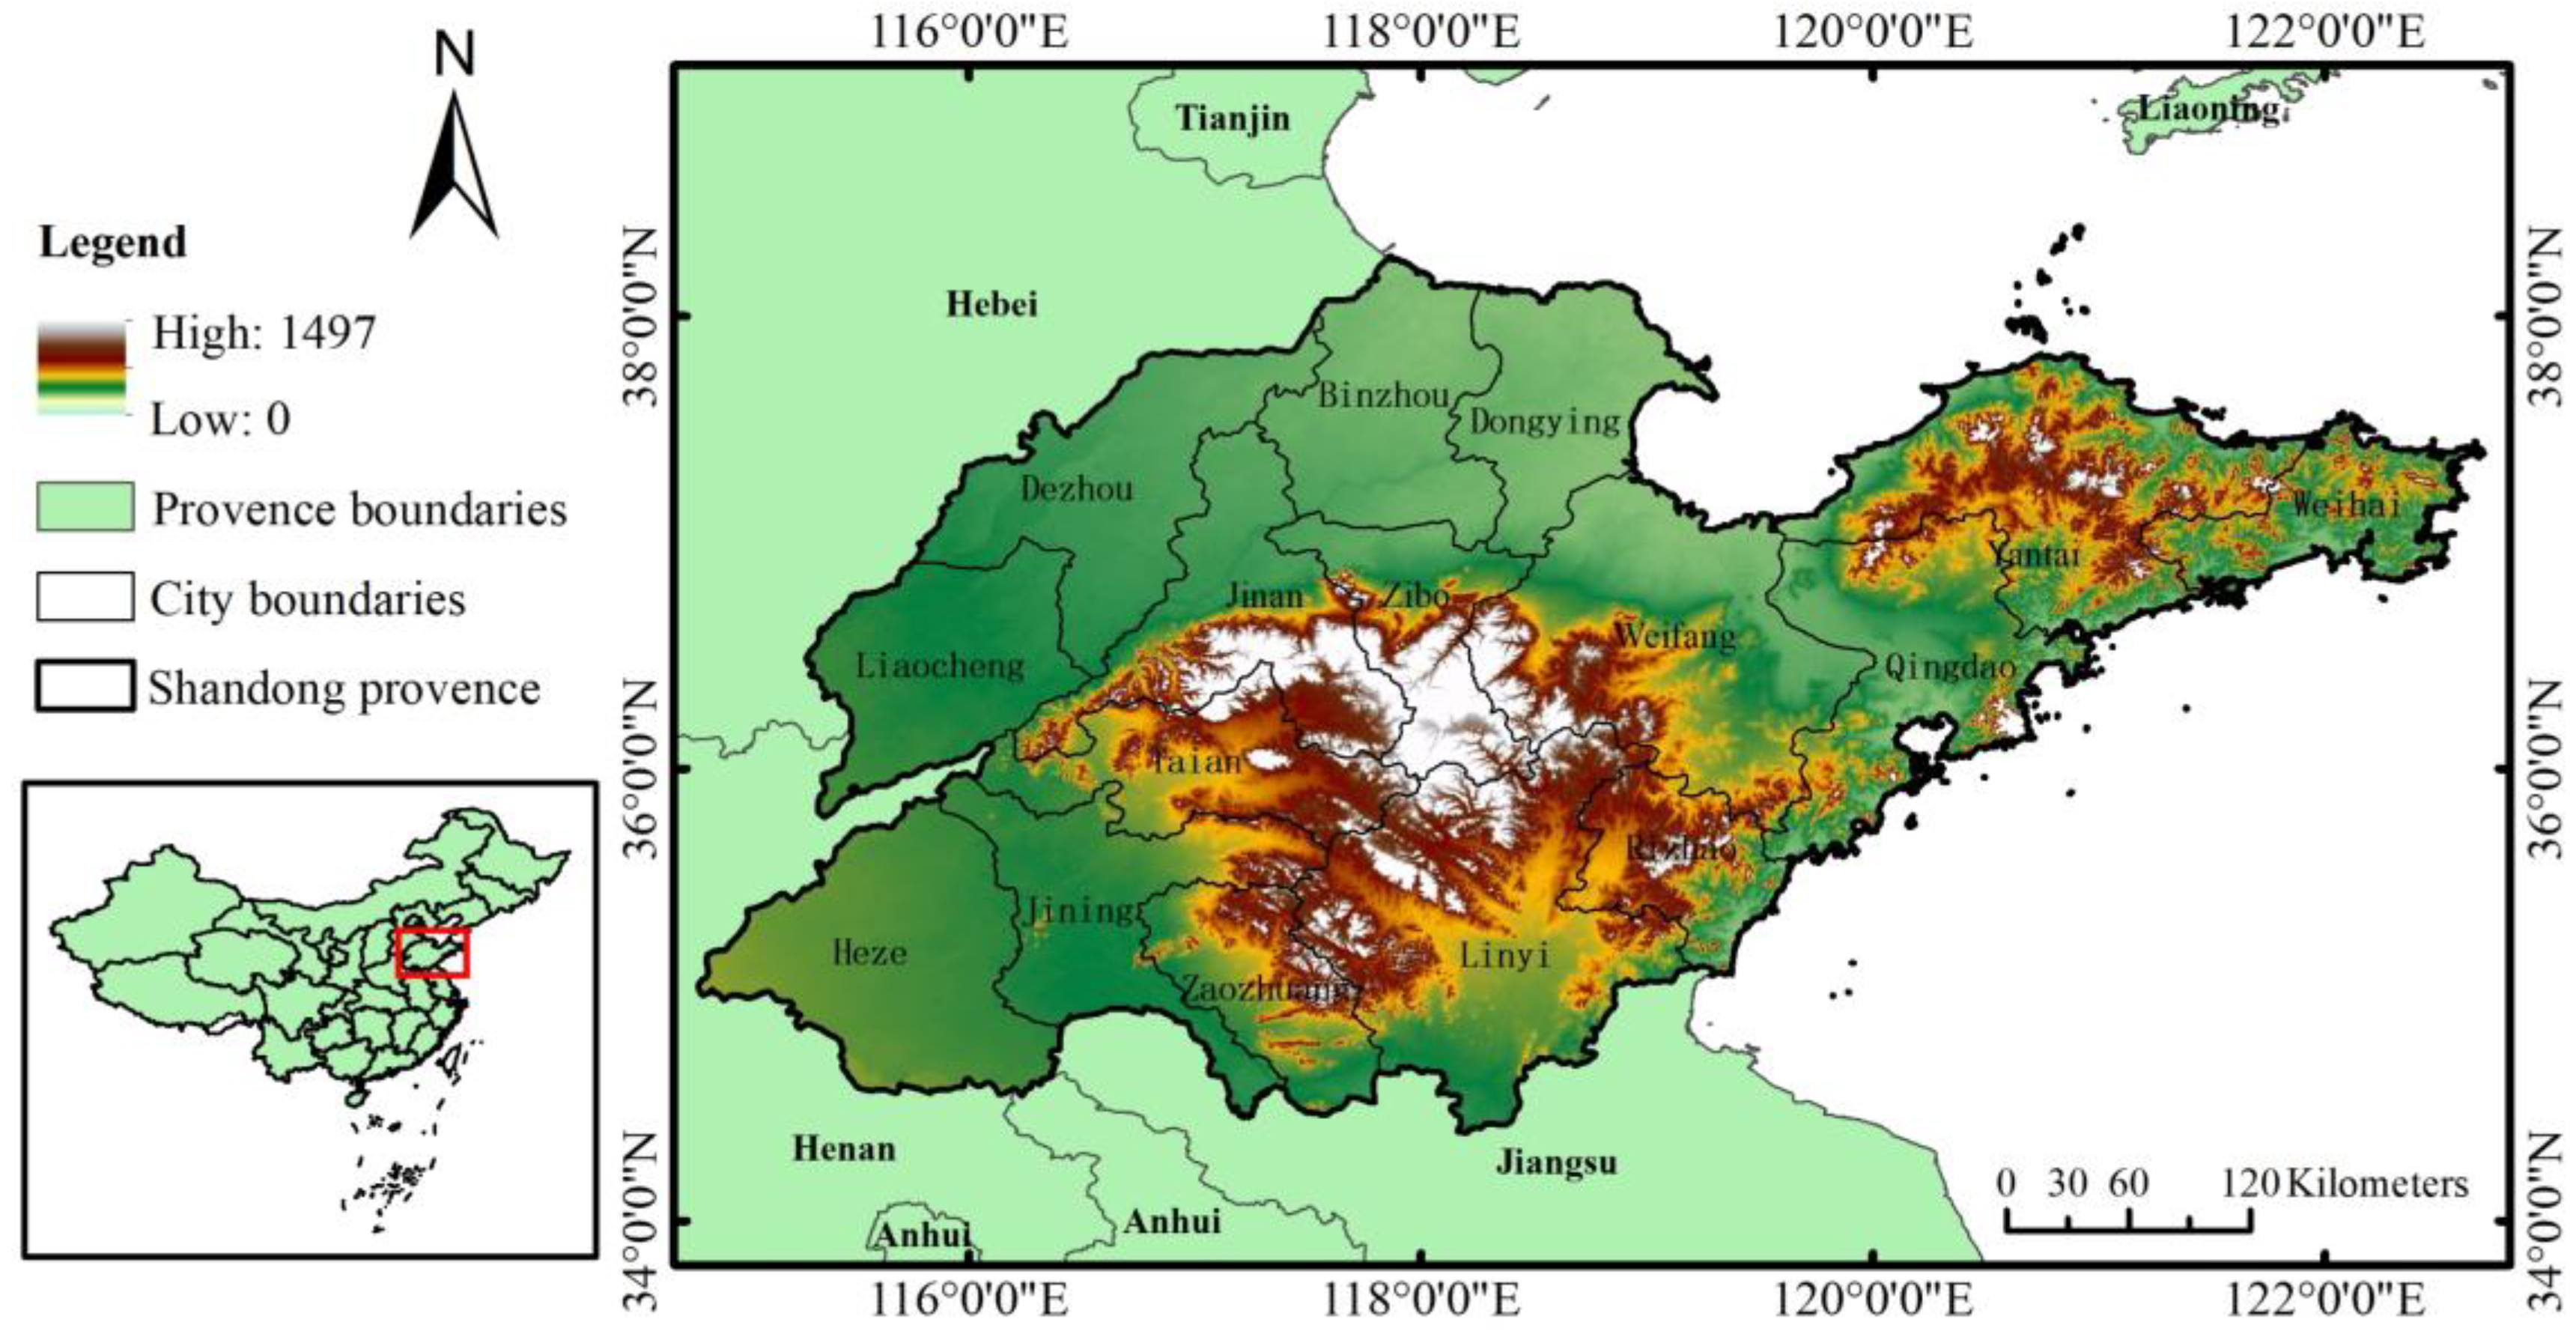
Figure 1. The geographical location, city boundaries, topography in Shandong Province.
Applsci 14 03940 g001
Figure 2. The spatial distribution of the samples and the ultra-high-resolution images with real conditions in different growth periods of winter wheat.
Applsci 14 03940 g002
Figure 3. The workflow for winter wheat mapping in this research.
Applsci 14 03940 g003
Figure 4. Feature importance of random forest. (a) refers to the importance of each type of features; (b) is the importance of various features of each month.
Applsci 14 03940 g004
Figure 5. Winter wheat map with 10 m resolution and close-up views of Shandong Province.
Applsci 14 03940 g005
Figure 6. Finer comparison of winter wheat extraction in different maps, from (ad): the Sentinel-2 images, ChinaWheat30 in 2020, ChinaWheat10 in 2020, winter wheat map of this research.
Applsci 14 03940 g006
Figure 7. Ultra-high-resolution image from MAPWORLD of Shandong in April 2020 (a1,a2,a3,a4), image object layer generated based on Sentinel-2 by SNIC (b1,b2,b3,b4), the pixel-based classification (c1,c2,c3,c4) and final result produced by the integration method (d1,d2,d3,d4).
Applsci 14 03940 g007
Figure 8. Spatial distribution of croplands in relation to its topography.
Applsci 14 03940 g008
Figure 9. Distribution of winter wheat in three-dimensional space, (a) refers to the distribution over elevation and (b) refers to the distribution over different slopes.
Applsci 14 03940 g009
Figure 10. Spatial distribution of winter wheat in relation to multi-level rivers.
Applsci 14 03940 g010
Table 1. The selected spectral indices in this research and their expressions.
IndicatorsExpressionsReferences
NDVI N D V I = ρ N I R ρ R ρ N I R + ρ R [50]
LSWI L S W I = ρ N I R ρ S W I R 2 ρ N I R + ρ S W I R 2 [51]
SAVI S A V I = ρ N I R ρ R ρ N I R + ρ R + 0.5 × 1 + 0.5 [52]
NDPI N D P I = ρ N I R 0.74 × ρ R + 0.26 × ρ S W I R 1 ρ N I R + 0.74 × ρ R + 0.26 × ρ S W I R 1 [53]
Table 2. The confusion matrix of winter wheat map.
ClassificationValidation Samples
Winter WheatOthersTotalUA (%)
Winter wheat134141480.91
Others81261340.94
Total142140282
PA (%)0.940.90
Disclaimer/Publisher’s Note: The statements, opinions and data contained in all publications are solely those of the individual author(s) and contributor(s) and not of MDPI and/or the editor(s). MDPI and/or the editor(s) disclaim responsibility for any injury to people or property resulting from any ideas, methods, instructions or products referred to in the content.