Article

Signal-Centric Framework Based on Probability of Detection for Real-Time Reliability of Concrete Damage Inspection

by
Sena Tayfur
Department of Civil Engineering, Faculty of Engineering, Ege University, Bornova, Izmir 35100, Turkey
Appl. Sci. 2025, 15(1), 18; https://doi.org/10.3390/app15010018
Submission received: 25 November 2024 / Revised: 16 December 2024 / Accepted: 19 December 2024 / Published: 24 December 2024
(This article belongs to the Section Civil Engineering)

Abstract

:
Passive nondestructive testing (NDT) methods allow one to detect damage by the energies emitted from the internal processes. While the test conditions can be controlled and repeatable, obtained data are random, and the probability of detection (PoD) is affected. However, in concrete with complex fracture behavior, factors such as signal attenuation, sensor-damage distance, and test configuration influence the reliability of the test. The conventional practice of proceeding without assessing credibility prevents the ability to determine whether a configuration modification is required, necessitating reassessment. The main objective of this study is to develop a signal-centric framework to enhance the real-time reliability of inspection by investigating the PoD of acoustic emission (AE), a widely used passive NDT method for the real-time monitoring of structures. This study’s purpose is to evaluate the mechanical processes and the passive signal responses, emphasizing the detectability of cracking in concrete with two PoD approaches, namely, amplitude- and energy-based PoDs. Additionally, critical signal signatures, namely, signal-to-noise ratio (SNR) and frequency, were pinpointed for their direct influence on the detectability of the crack. With the outcomes obtained, a novel framework, which aims to provide an adaptive evaluation of the PoD of the technique, was suggested to achieve the desired quality in the damage detection of structures.

1. Introduction

Civil infrastructural systems are exposed to a wide range of loadings during their life, such as service loads, environmental conditions, and disasters. The safety and durability of the structures continue to be the primary concern of structural engineering, particularly in terms of life safety, economy, and functionality. Concrete, the most commonly used construction material, is a composite with heterogeneous and inherent complexities, making it more difficult to determine damage presence and progression [1]. Conventional structural assessment methods generally evaluate the condition on a member-by-member basis, which lacks the ability to identify possible damage possibilities and requires subjective assessments [2]. Moreover, the member from which the core is taken is also damaged, and it is not possible to determine the damages that occur in the inner area of the structural member with the existing methods. At this point, the use of structural health monitoring systems can provide an early detection of damages in structures and help engineers make informed decisions [3].
Nondestructive testing (NDT) methods allow comprehensive damage detection in inaccessible areas without harming the structure and can identify the location, size, and type of damage. They are categorized into two subcategories: active and passive methods [4]. Active NDT methods involve assessing damage characteristics by measuring changes within the material by applying external energy. For instance, ultrasonic monitoring uses mechanical sound waves, radiography utilizes radioactive radiation sources, and radar employs electromagnetic waves. Thus, this initiated energy transmission results in the measurement being controlled. Conversely, passive NDT methods utilize natural energy emitted within the material itself without requiring an external input. Acoustic emission (AE), which analyzes sound waves emitted due to energy release from the damage, and thermography, which assesses surface heat changes, are commonly used passive NDT methods for structural damage detection. The AE method, on the other hand, is the most effective technique for identifying potential active damage formation, particularly in nuclear power plants and bridges under dynamic loadings. By AE, significant information about damage can be provided, such as the type, location, and orientation of a crack, delamination, or dislocation [5,6,7]. This feature of the method allows one to monitor the structures in real-time and the ability to detect micro-fractures earlier, which will enable taking precautions by giving an alarm. Moreover, the AE method’s usability with artificial intelligence technology, feasibility, and effectiveness on concrete damage inspection are proved in numerous studies found in the literature [8,9,10,11].
In the AE phenomenon, energy release resulting from mechanisms (such as crack formation or propagation, reinforcement corrosion, etc.) propagates through the material as elastic waves, which are detected by sensitive sensors and converted into analyzable signals [12]. AE signals include typical parameters, such as amplitude (the peak voltage), duration (elapsed time between the first and last pulses exceeding the threshold), rise time (elapsed time between the first and peak pulses), and energy (area under the threshold-crossing envelope of the signal). Existing studies show the efficiency of using these parameters in the identification of critical information about damage in structures. The severity and orientation of the damage can be obtained by evaluating the amplitude and energy of the signal [13,14,15,16]. These factors are crucial in AE detectability since they measure the damage size and intensity to which the signal originates. On the other hand, the type of damage is provided by analyzing rise time and frequency (i.e., average frequency, peak frequency, and frequency centroid) [17,18]. Moreover, the location and time of the occurrence of the damage are determined using the signal arrival time [19,20,21,22]. The accuracy of the information that the AE method provides depends on the AE parameters and, thus, on factors such as the test setup, sensor, and material features. Unlike active NDT methods, energy sources cannot be controlled during the inspection of structural defects in AE and other passive NDT methods. Even though test conditions may be specified and repeatable, AE signals are random and can be influenced by unpredictable stochastic factors [23]. These factors can lead to variability in the AE dataset even when testing similar members and damages, especially damage source variables that affect the method’s probability of detection (PoD). The POD approach is the cornerstone of the reliability evaluations of NDT methods, primarily because of its capacity to incorporate the criticality of defects [24,25]. PoD is based on a binary method, i.e., true or false. Moreover, a statistical prediction is required for a large number of unknown flaws to evaluate the relevant factors of detectability [26,27]. Generally, flaw size is used as a characteristic quantity. However, it is not possible to identify the flaw size in passive NDT methods.
To utilize the PoD analysis on passive NDT outputs for infrastructure damage monitoring, the concept of curve generation for PoD, which investigates the inspection ability to detect defects in different industrial sectors, is a useful solution [28,29,30]. This curve typically relates the probability of damage detection to a characteristic parameter of the flaw, frequently its size [31]. While the PoD value defines the detection rate for a certain number of inputs, statistical distributions are utilized in real scenarios where the extent of damage is unknown, and signal response is evaluated for the AE dataset.
The theory of PoD in AE was first introduced by Pollock in 2007 [32], in which he developed a PoD curve to analyze the attenuation effects in a pressure vessel subjected to fatigue. Pollock’s study revealed that the PoD value decreases as the attenuation increases, particularly as the distance increases between the sensor and the damage. Building upon Pollock’s work, subsequent studies have further explored the application of PoD in various contexts. Diakhate et al. [33] investigated the PoD associated with source localization of pencil lead breakages acting as artificial AE sources in wood, whereas similarly, Sause et al. [34] examined the reduction in PoD in fiber composite plates in relation to sensor-to-damage distance.
Since another significant factor influencing the detection probability of the AE method is the noise [35], Niri et al. [36] observed a decrease in the PoD on the aluminum plate with increasing noise levels. Subsequently, Barat et al. [37] extended this understanding by analyzing AE monitoring of steel fatigue under cyclic loading. They found that increasing the threshold to filter noise resulted in decreased detection probability, with variations in PoD depending on the material type. However, it is crucial to note the caution raised concerning the threshold setting by Ozevin and Zhang [38]. They highlighted that excessively reducing the threshold may lead to the detection of noise−related signals, such as secondary emissions, friction emissions, and signal reflections, which ultimately diminishes the PoD of AE. In summary, these studies collectively demonstrate the interplay between attenuation, sensor-to-damage distance, noise levels, threshold settings, and material properties in determining the PoD in AE applications. Nevertheless, while there are a limited number of studies in the literature investigating the PoD of damage detection using the AE technique in steel, wood, and fiber composites, there is still a huge gap to reveal how the detectability of AE signals is affected in concrete, a material that constitutes a significant part of the building stock.
Being a heterogeneous material containing different components like aggregates and fibers, concrete causes attenuation of AE signals more prominently compared to the aforementioned materials, thus altering the accuracy of damage detection results [39,40,41] and expected to affect PoD more. Therefore, the motivation behind this study is to fill this gap and to develop a new framework for the real-time probability of detection of damage inspection by investigating the detectability of concrete cracking damage to sustain the reliability of passive nondestructive inspection for infrastructure monitoring. In this context, the study examines the relationships between the mechanical processes of concrete and the detectability of damage while also comparing the amplitude and energy-based PoD approaches, as these signal features are related to defect size. Additionally, correlations between critical signal signatures, such as noise and frequency contents, with PoD have been investigated, and a signal-centric framework has been proposed to determine whether configuration changes are necessary during the monitoring of the critical importance structures. In this context, after explaining the methodologies of the AE technique and its PoD calculation in Section 2, the experimental procedure is detailed in Section 3. Subsequently, Section 4 presents and discusses the results of the signal signatures to be used for constructing the framework to identify their correlations with the technique’s PoD and compatibilities. Finally, based on the obtained results, the stages of a signal-centric framework based on real-time calculation of PoD using compatible signal signatures have been proposed in Section 5.

2. Methodology

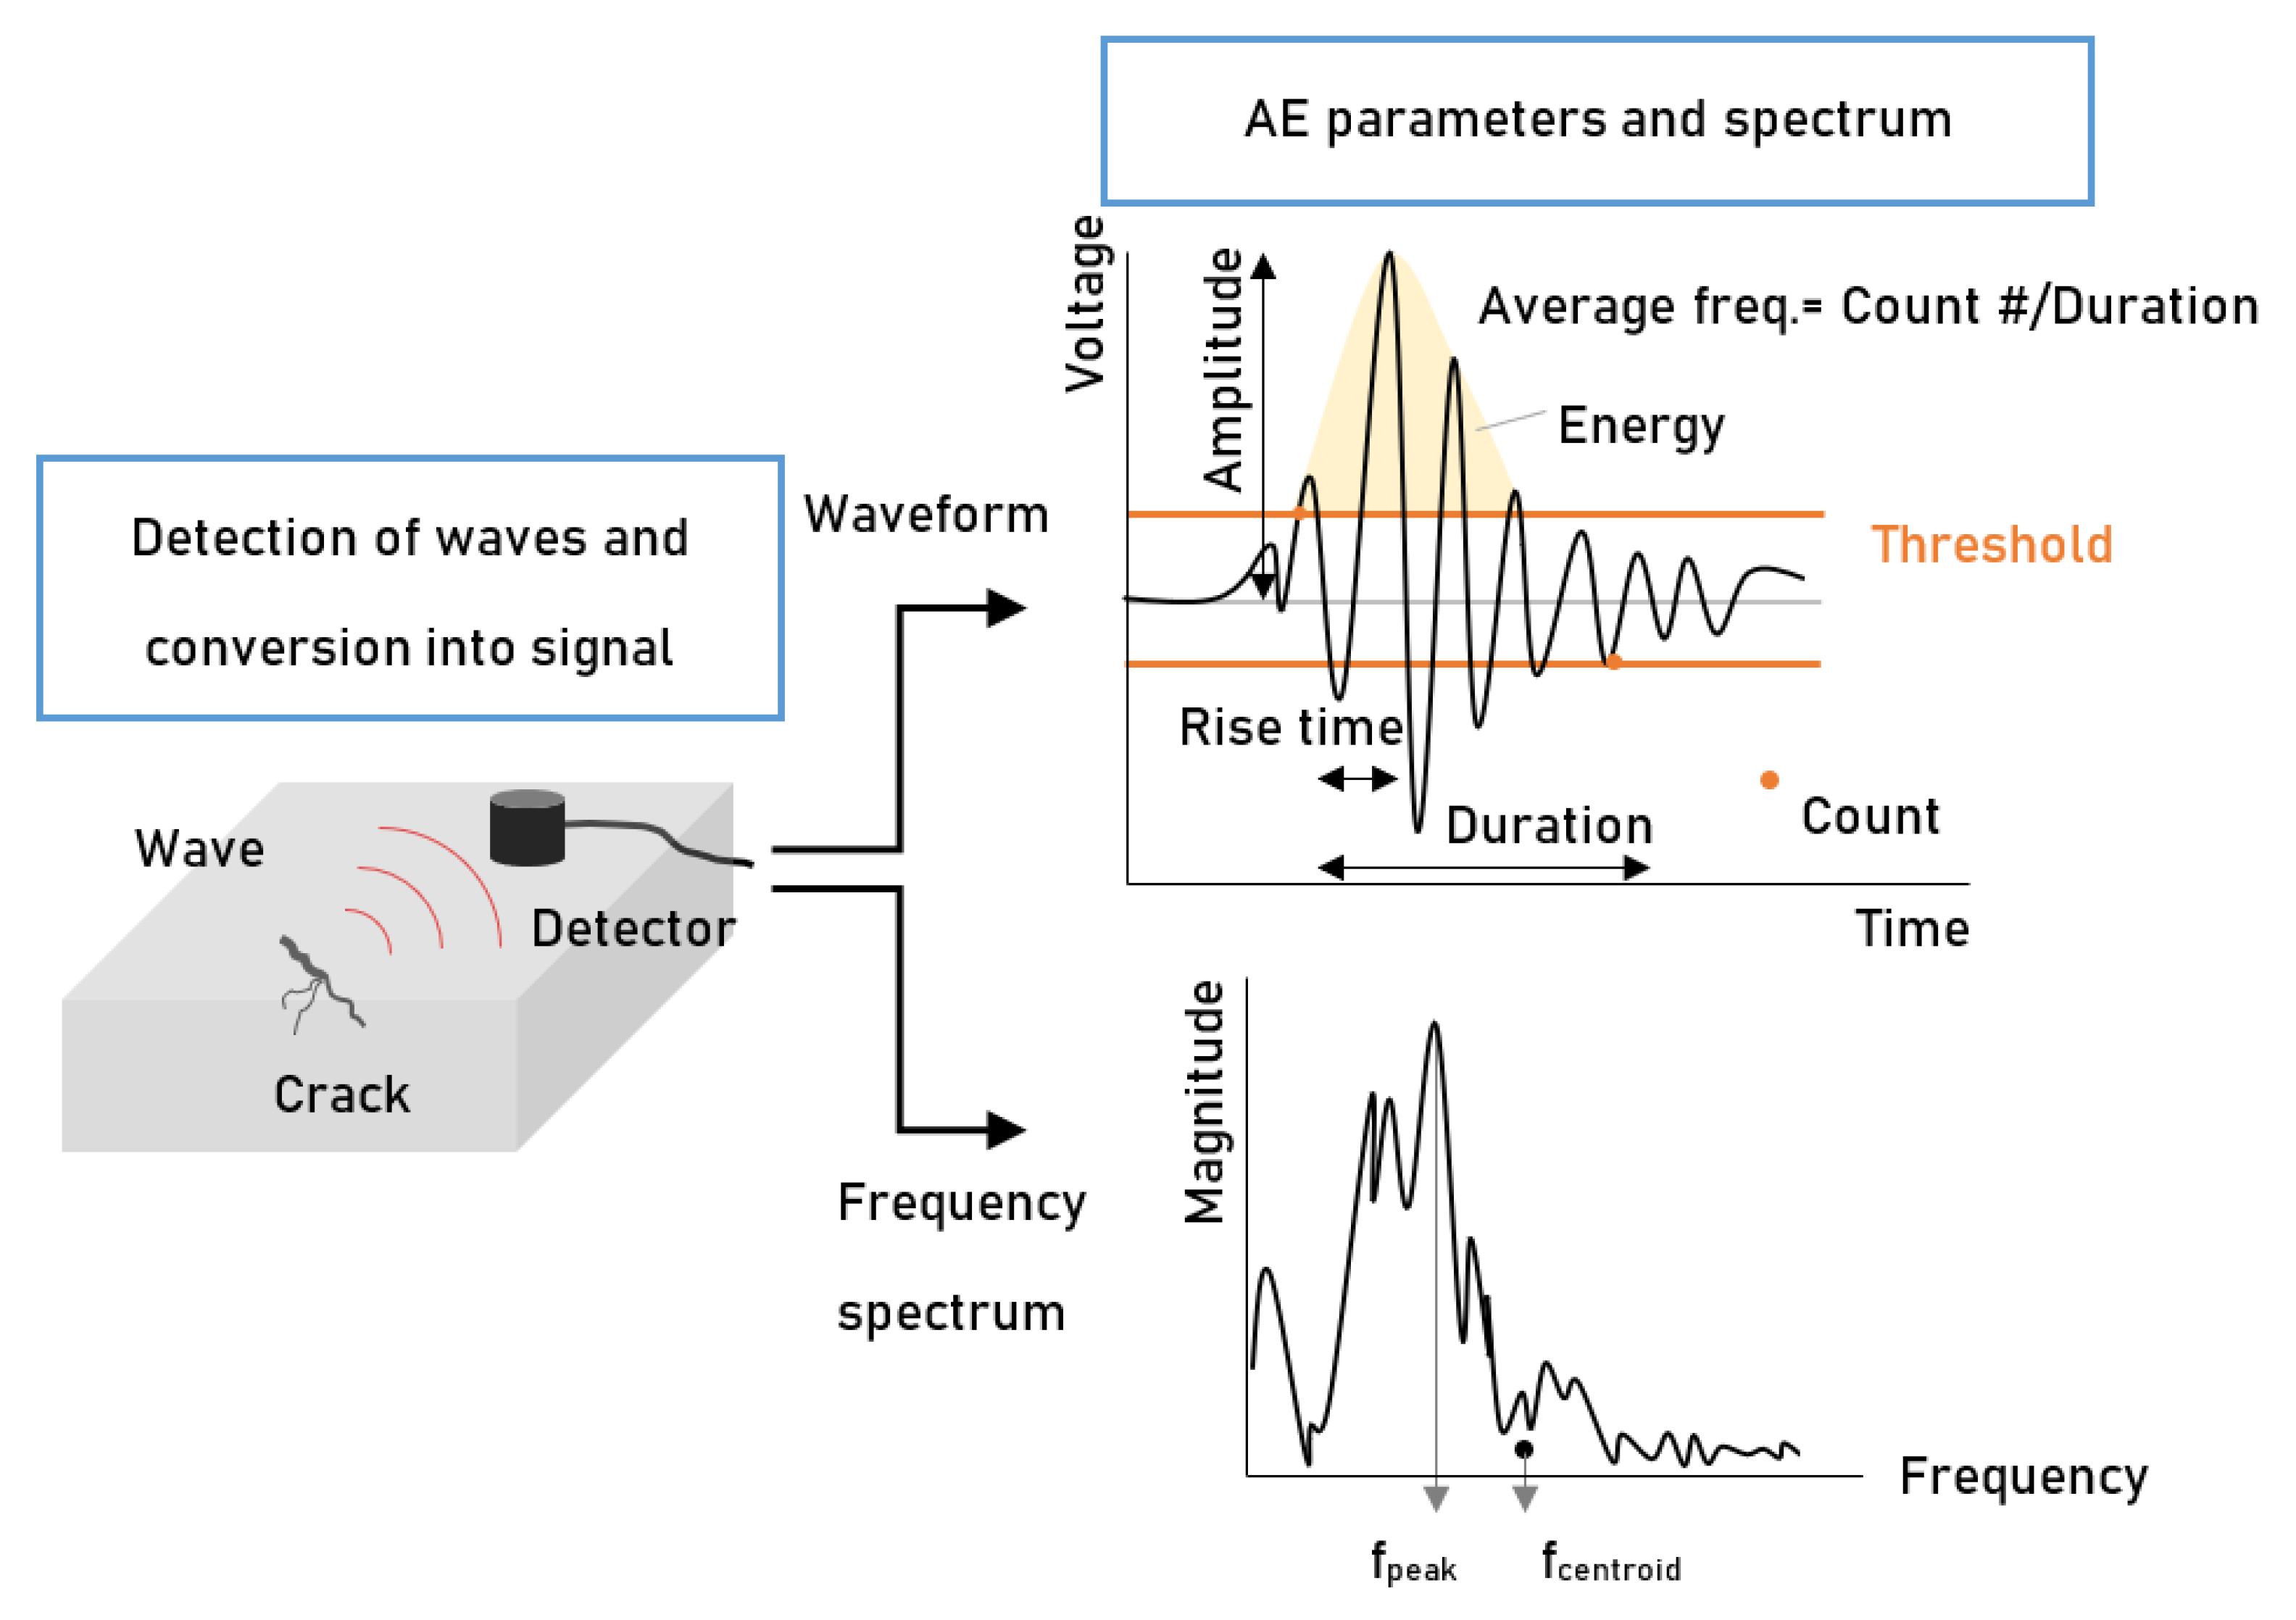
2.1. AE Technique as a Passive NDT

Detecting elastic waves due to the release of sudden energy from the damage and converting them into electrical signals is a phenomenon known as acoustic emission [12]. These feature signals are used to characterize the damage properties (Figure 1) [42,43]. While amplitude and energy are used to identify the severity and scale of the damage, rise time and average frequency provide information about the type. On the other hand, the frequency spectrum of the signal can also be useful to reveal other characteristics, such as peak frequency and frequency centroid [44,45].
To investigate the effectiveness of different AE features on the calculation of detection probability of concrete cracking events, amplitude- and energy-based PoDs were compared with respect to a mechanical process, and the signal-to-noise ratio and frequency signatures of the signals were examined to determine whether they can be related to the technique’s PoD.

2.2. PoD Concept for Passive Signals

The PoD, a function of the damage size, assesses the smallest damage size and combines its quantitative and qualitative parameters [46]. The PoD concept used for the passive NDT methods addresses the construction of a curve based on the related parameters of the damage. Two approaches can be employed to generate PoD curves for determining the detection probability. The detectability of damage with known size, location, or quantity is determined by assessing the accuracy of the simulation results. In this regard, the identification of defects is established by evaluating the ratio of hits to misses or the total number of hits, as given by Gagar et al. [47]. The hit/miss approach does not concern itself with signal values but instead predicts the PoD curve based on binary outcomes. In other words, pit defines the ratio of identified defects, as expressed in Equation (1) [47,48].
P o D H M n = M A n H ( n )   T ,   f o r   A A T
where n is the sequence of the simulated defect event; A is the amplitude, which should be equal to or higher than the threshold AT; M is the missed detections; H is the number of the detected hits, and T is the total amount of the missed and detected hits.
Since this bonded and discrete binary hit/miss model has only two possible values, 0 (miss) or 1 (hit), it cannot bridge the detectability of the in-between flaw sizes [49].
On the other hand, the second approach involves linking the probability of the signal response with a function by constructing a PoD curve based on a parameter distribution associated with the size of the actual damage data. In this case, when the recorded signal response of the damage is correlated with the characteristic damage size, the initial hypothesis is that the detectability of damage progression, e.g., crack growth, increases with the rise in signal amplitude and energy. Amplitude and energy are related to the release of energy during the source event. Therefore, since the size of the damage is unknown, amplitude and/or energy are defined as independent variables to formulate the PoD model instead of the defect size as the measured variable. In the signal response approach, the PoD function is defined as shown in Equation (2) [45,50]:
P o D S R p = Φ ln p μ σ
where p is the signal parameter, Φ is the standard normal cumulative distribution function, μ is the mean, and σ is the standard deviation of the p distribution.
Another hypothesis is that the cumulative AE energy is linearly proportional to the total crack length [38]. The classical Berens framework for signal response defines a linear regression between a ^ (cumulative AE energy) and a (crack length) by using the Maximum Likelihood Estimation (MLE). PoD function used in this study, as defined by the Berens framework, is given in Equation (3):
ln a ^ = β 0 + β 1 ln a + δ
where β 0 and β 1 are parameters of linear response on cumulative AE energy and δ is the random error. The PoD of this approach is defined by Equation (4):
P o D S R a = Φ ln a l n a ^ t h r β 0 β 1 μ σ δ β 1
where athr is the minimum response threshold and σδ is the standard deviation of δ.

2.3. Basis Algorithm for the Framework

The hypothesis behind the idea of developing a new framework for real-time PoD of concrete damage inspection is to define the relationships between the mechanical processes of concrete and the detectability of damage. In this context, first the framework will be based on one of the PoD approaches (amplitude- or energy-based) that are determined to be more effective in the next sections. In this study, the PoD of the AE technique for concrete is investigated using the second approach. Since the length of the cracks could not be measured, the strain of concrete was used as the flaw size to correlate PoD with AE signal response. Specifically, the performance of AE amplitudes and energies was compared to explore which signal parameter is more effective for detectability. Then, it will correlate the PoD of the inspection with critical signal signatures such as noise and frequency contents to determine whether configuration changes are necessary (Figure 2). After analyzing experimental and analytical results, details of the proposed framework and selected approaches are defined in Section 5.

3. Experimental Procedure

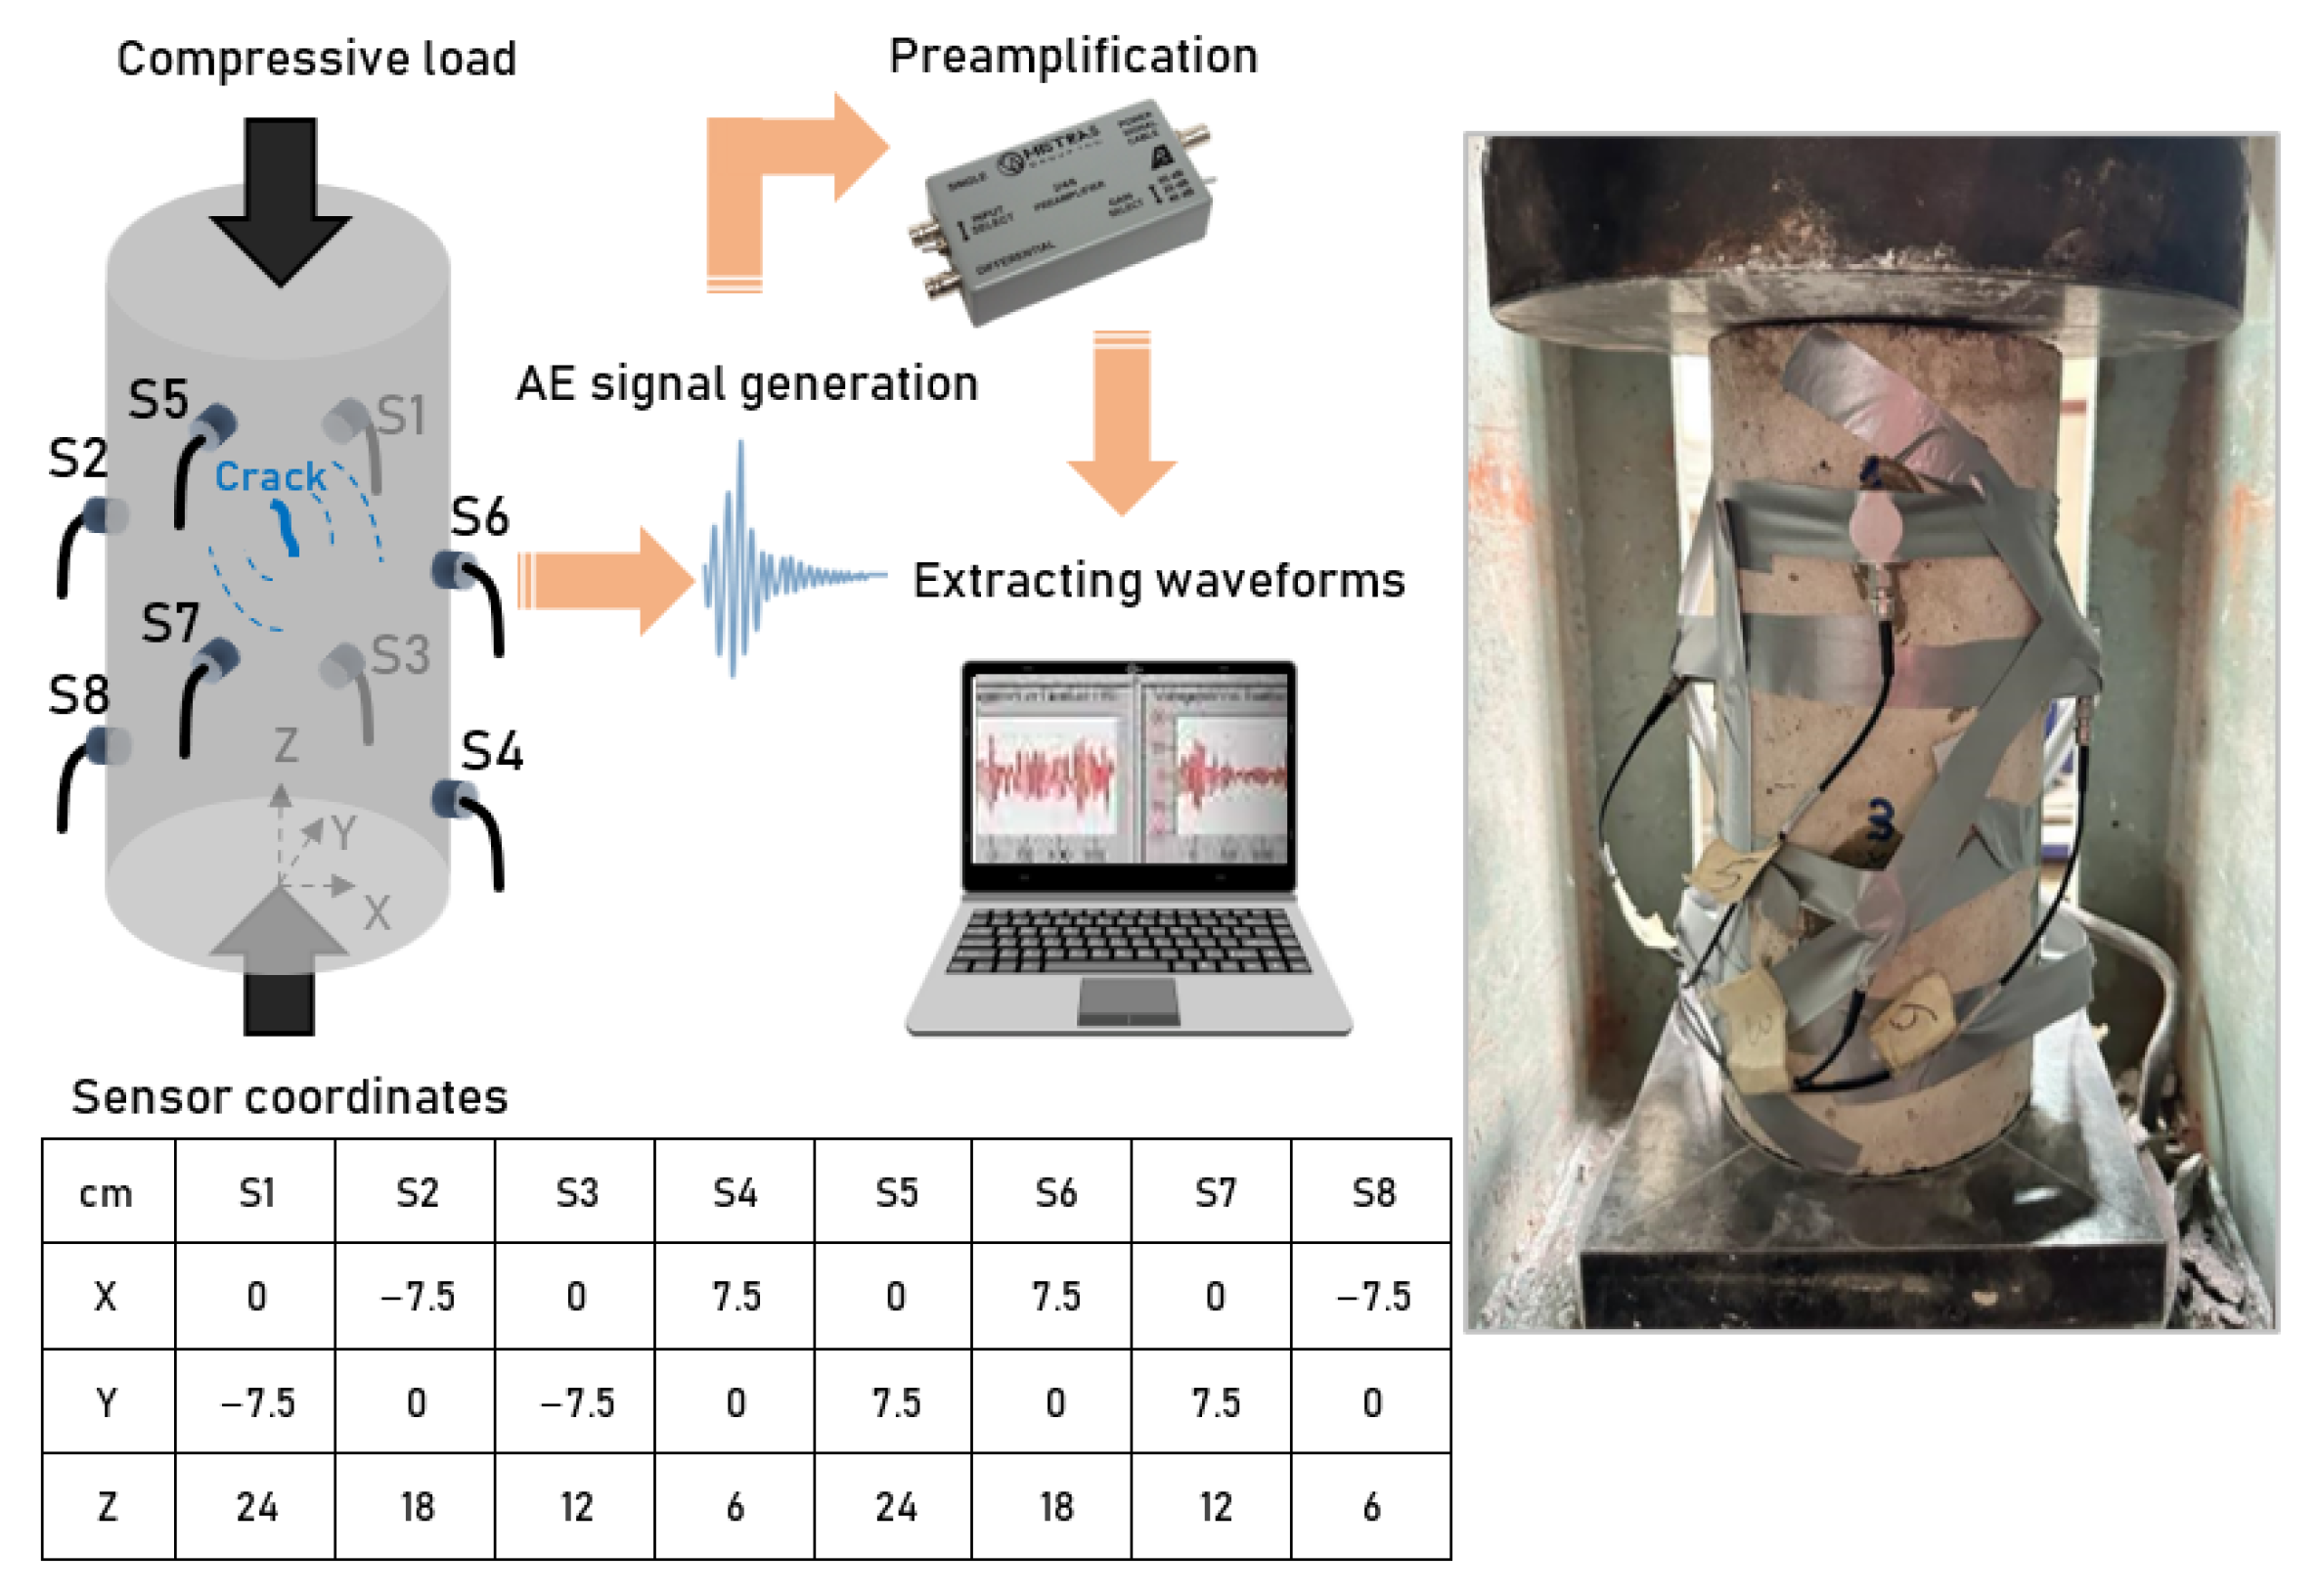
3.1. Materials and Test Setup

The dataset used in the analyses was obtained from the fracture processes of a standard ASTM C39/C39M−2 [51] concrete cylinder with a diameter of 150 mm and height of 300 mm under uniaxial compression loading. The specimen was produced from a concrete mixture with the composition of 357 kg/m3 cement, 147 kg/m3 water, 1127 kg/m3 coarse aggregate, 763 kg/m3 fine aggregate, and 4.5 kg/m3 superplasticizer. Cracking activities were monitored using eight AE sensors (Mistras Group, Junction, NJ, USA) with a resonant frequency of 150 kHz. The sensors were connected to preamplifiers with a gain of 40 dB and an eight−channel AE data acquisition system. The threshold, sampling rate, and filter were set to 40 dB, 1 MHz, and 1 kHz−400 kHz, respectively. The sensors were attached to the concrete surface with silicon grease, considering the crack propagation zone to enhance the transfer of the signals and provide a better coupling. After the sensors were calibrated with the Hsu Nielsen Calibration Method by breaking the pencil leads in accordance with ASTM E 976 [52], the specimen was subjected to uniaxial compression loading using a BESMAK compression machine (Ankara, Turkey) with a rate of 0.275 MPa/s until failure (Figure 3).

3.2. Processing of AE Data

Collected AE signals with their recorded times were extracted, and their waveforms, frequency spectra, and signal parameters (amount of hit, amplitude, energy, and frequency characteristics) were obtained to correlate them with mechanical responses and PoD results from AEWin for SAMOS E4.75 software. The number of AE hits represents the number of AE hits recorded by all sensors, amplitude (dB) is the maximum magnitude the signal reaches, and energy (µsV) is the area under the rectified signal envelope. The frequency centroid and peak frequency are taken from the Fast Fourier Transform (FFT) spectrum. The frequency centroid represents the mass centroid of the FFT spectrum, whereas peak frequency is the frequency value of the peak magnitude encountered in the FFT spectrum. In addition, the Swansong II filter [53] was applied to AE data before analysis, which eliminates the signals based on duration/amplitude relations to enhance the quality of the dataset and ensure that only damage-related AE signals are provided.
To jointly evaluate the signal response and concrete behavior, the stress vs. strain behavior of the concrete specimen under compression was used, as described in the Section 4. Moreover, regression analysis, a statistical method that examines a relationship between two or more variables, was also utilized to comprehend the relationship between the PoD results and mechanical response and to generalize the behaviors. In the following figures, rate trend lines and regression curves were created using regression analysis.

4. Results and Discussion

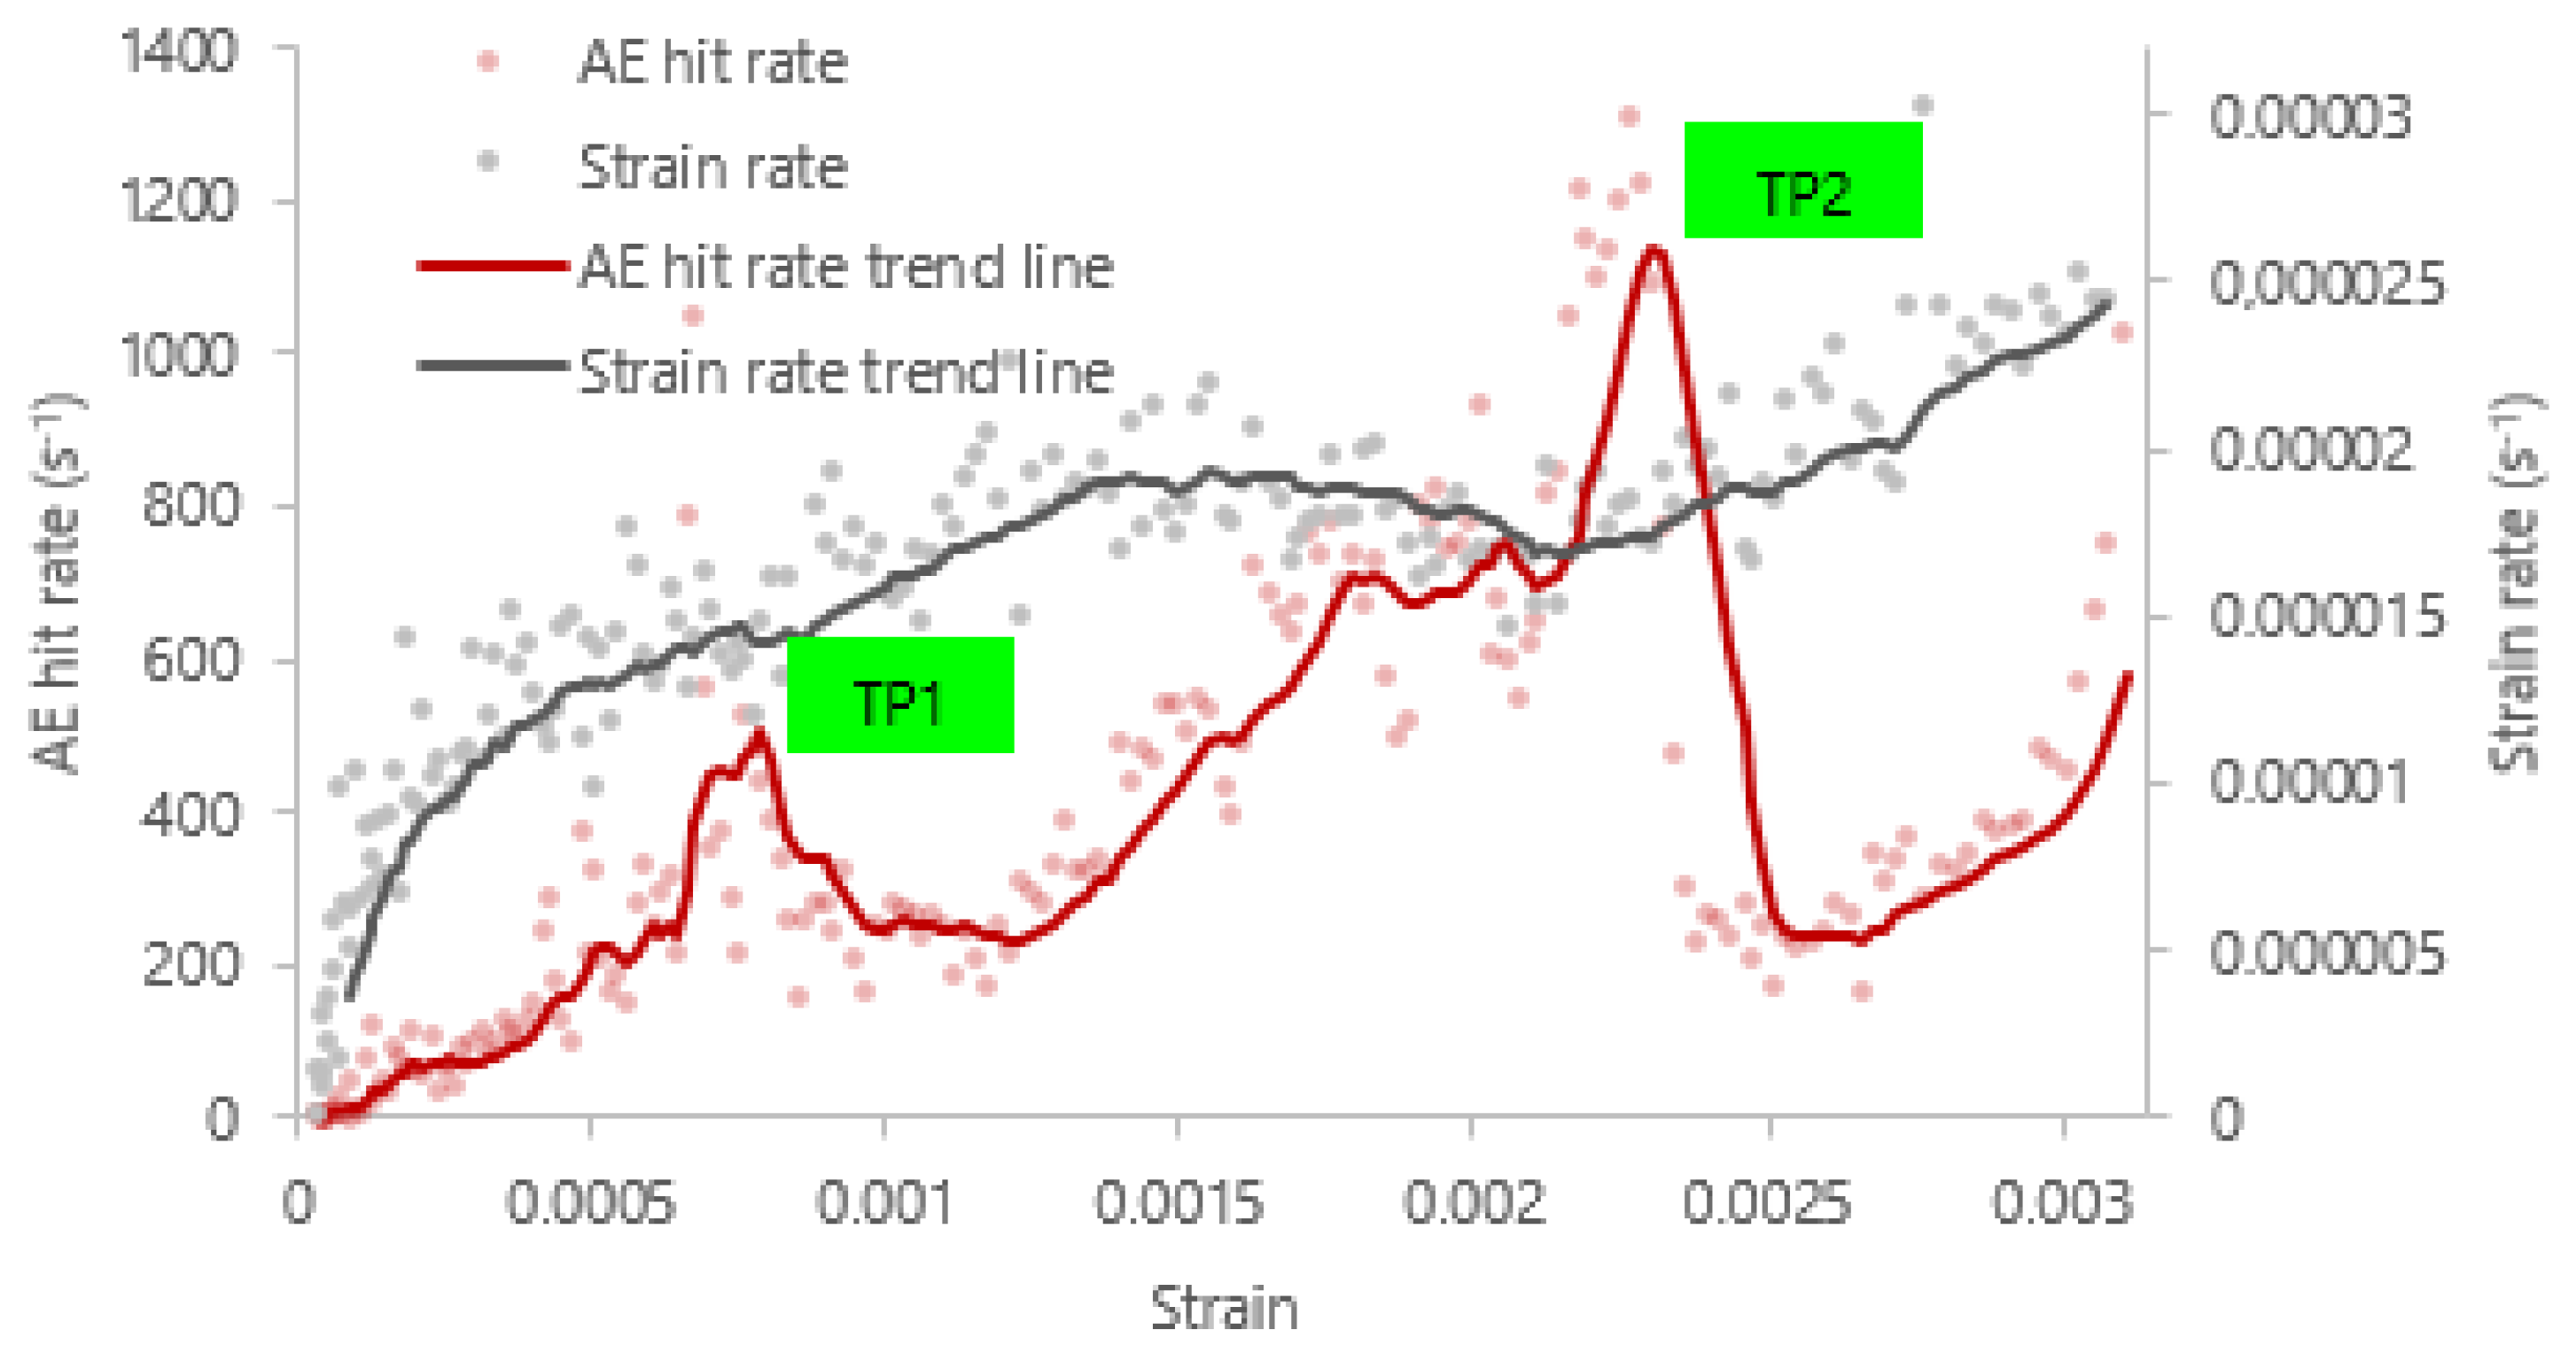
4.1. Joint Evaluation of the Signal Response and Concrete Behavior

The strain vs. stress behavior of the concrete specimen under compression is presented in Figure 4a. The strain rate was also calculated to correlate the detectability of the cracking events with mechanical findings. As seen, decreases in strain rate were observed at strain values of 0.0008 and 0.0021, indicating a slowing down of the deformation process at these strain values. These reductions in strain rate suggest that the material may undergo internal adjustments to accommodate the applied load. However, beyond 24 MPa of stress, the strain rate continued to increase continuously, and these strain values resulted in the fracture of the specimen, as shown in Figure 4b. Throughout the loading process of the specimen, 72,219 hits were detected and converted into electrical signals by eight AE sensors.
In this study, the concrete strain was used as an observed damage factor associated with PoD since it directly influences the size and extent of the damage. Thus, to determine the detectability of cracks in concrete using AE, it was necessary to have the measured strain values at the moment when each AE signal was recorded. Consequently, stress vs. strain vs. time values were paired with recorded times of the AE signals. The matrix comprising all recorded AE hits, stress and strain values, and AE parameters formed the dataset for this research. Hence, PoD values based on amplitude- and energy-based approaches were correlated with mechanical observations.
Figure 5 presents the amplitude and energy distributions of the AE activities, which were used to calculate amplitude-based PoDAs and energy-based PoDEs with respect to concrete strain values during the loading of the concrete specimen. Here, red markers and blue lines indicate the related AE signal parameter and cumulative AE hit origin, respectively. Moving average trends of the AE parameters are also shown with black lines.
It was noted that there were increments in moving averages of amplitude and energy at the first (TP1) and the second (TP2) turning points for both parameters. These also correspond to changes in the slope of the hit formation curve, indicating accelerated cracking formations. Since these two points are evidently critical moments in the fracture behavior of the specimen, the TP1 and TP2 points were specifically scrutinized to evaluate the performances of PoDA and PoDE. Furthermore, considering the alterations at these strain values in the hit formation curve, the influence of strain-dependent AE hit rate on PoD was also investigated in Figure 5.
As seen from Figure 6, TP1 and TP2, which were marked in the above assessment, are the two most noticeable change points in the AE hit rate trend line, and they are not evident in the stress–strain curve. This demonstrates the importance of highlighting these critical points when evaluating the technique’s PoD. This emphasizes the necessity of paying attention to these points.

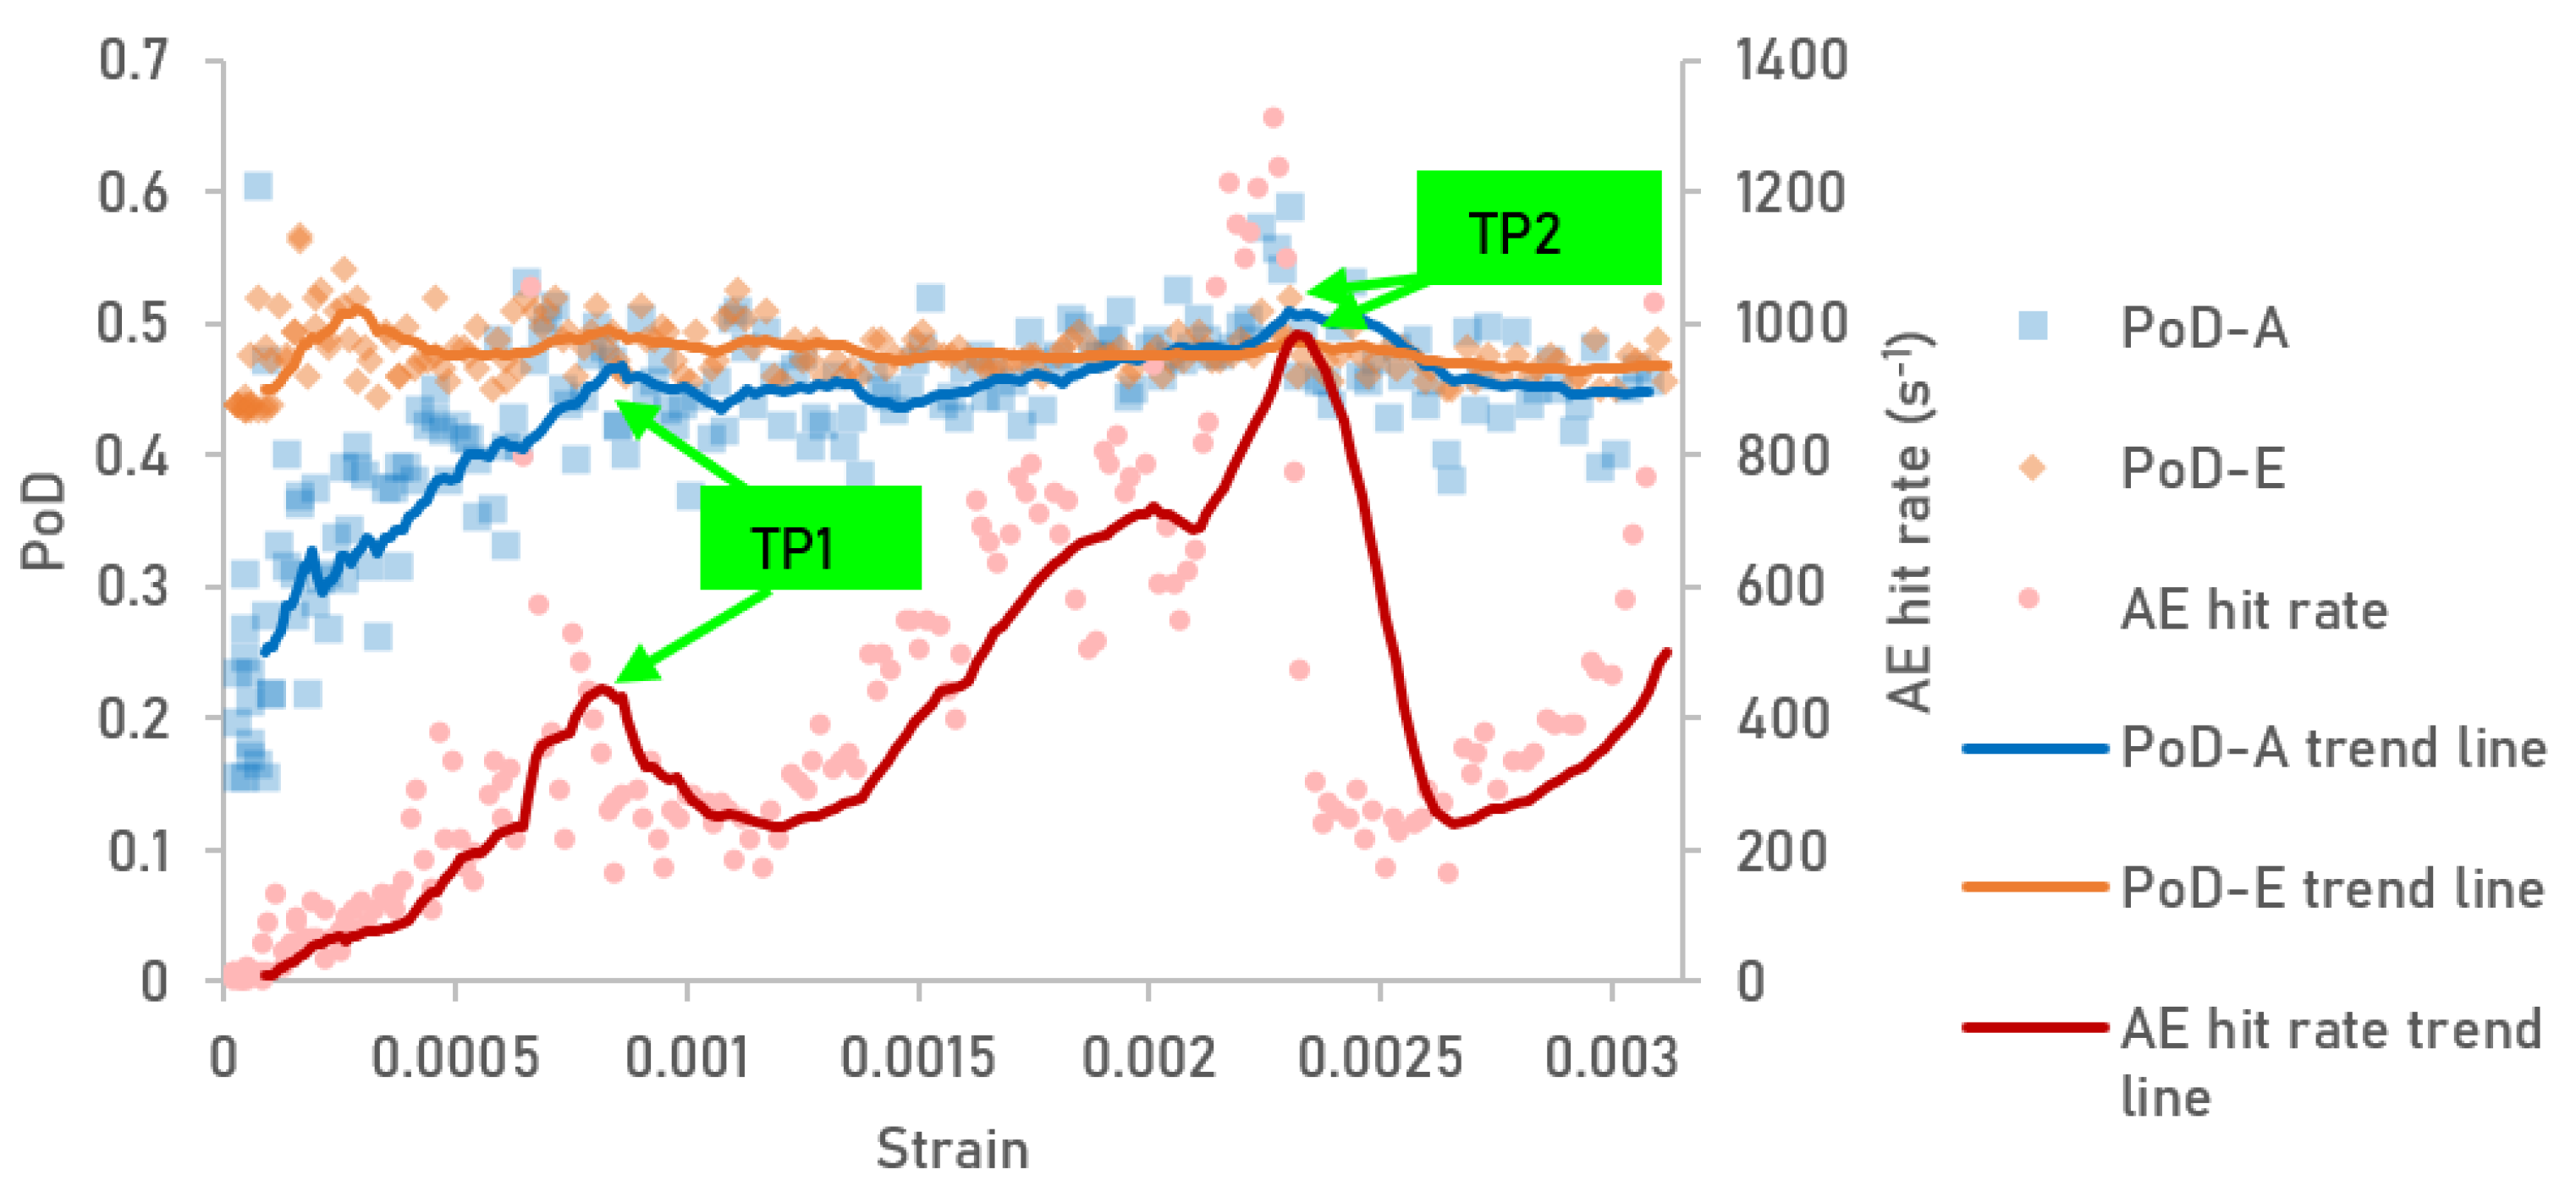
4.2. Strain-Driven Comparison of PoDA and PoDE

Detectability of the cracking activities in the concrete specimen was determined by calculating PoD values. Here, PoDs were calculated based on the second signal response PoD approach using two AE parameters, amplitude and energy distributions associated with the magnitude of damage. Figure 7 presents the PoDs of all AE activities based on both amplitudes and energies. The PoD curve typically represents the detectability and usually denotes the intensity or power. As seen from the amplitude-based PoDA variation with respect to signal amplitude, detectability of the activities starts from 15% at 40 dB of threshold and reaches 85% at 59 dB, becoming 100% from 73 dB onwards. Using this trend, it is possible to plot the PoDs of activities less than the threshold. Even though there might be mathematical PoD values before the threshold level, there is no actual detectability.
Considering energy-based PoD calculation of PoDE, on the other hand, since the energy scale is considerably broader compared to the amplitude scale (Figure 5), PoDE values calculated based on energy started the detectability of the activities at more than 40% even at the lowest energy levels and swiftly ascended to 100%. This phenomenon can be explained by the calculation method of the AE energy. As the energy measures the area under the rectified envelope and is dependent upon both signal amplitude and duration, it is conceivable that two signals with identical amplitudes may exhibit different AE energies. In this context, the attenuation factor also influences both the duration and energy of the signal. Therefore, even weak signals close to the threshold are susceptible to yielding a detectability of approximately 40% by the energy-based PoD approach. For this reason, it is also necessary to evaluate PoDE with respect to the signal amplitude effect. Since multiple energy values could be measured for different signals having the same amplitude, average PoDE values were calculated for each signal using the PoD curves, and Figure 8 was then constructed based on these calculations. The situation mentioned above, as the energy-based detectability approach, is more clearly observed by examining PoDE with respect to signal amplitude. In this matching seen in Figure 8a, even for amplitude values below 40 dB, PoDE gives a seemingly unrealistic high detection rate of more than 40%.
Figure 8b represents the relationship between PoDA and PoDE values of the same activities. As seen, between signals whose amplitude ranges from 40 dB to 57 dB, PoDA provides a wide range of detection probabilities, from 20% to 80%, while PoDE offers an average detection probability ranging between approximately 44% and 49% within this range. This suggests that PoDE may be more reliable in detecting low and closely similar amplitude AE signals, or micro-damages, consistently during early threats. On the other hand, for instance, to achieve a 75% successful detection rate, PoDA requires a signal as low as 55 dB, whereas PoDE requires signals up to 72 dB to reach the same level of detection. Accordingly, it may be considered that PoDE could be more reliable. However, it should be noted that the remarkably high PoDE values for low amplitudes resulted from misconceptions arising from energy calculations.
To evaluate the performances of PoDA and PoDE at critical turning points of TP1 and TP2 that were observed in both amplitude and energy distributions and the AE hit rate curve, their trend lines were also investigated. Figure 9 indicates the trend lines of the average PoDA and PoDE values of AE activities based on the concrete strain. As seen, PoDE exhibits a low variation ranging from 45% to 60% in both low and high strain values and shows insensitivity to detectability at turning points TP1 and TP2. Conversely, in the PoDA curve, PoD values start from around 15% at lower strain values, increase with the increase in strain in accordance with mechanical behavior expectations, and show inflection points, particularly where detectability rises at TP1 and TP2. This circumstance renders PoDA more meaningful, as it aligns more closely with concrete strain values and AE hit rates, which are directly related to the formation of damage.
As the increase in the AE hit rate signifies mechanisms such as crack growth and propagation, an increase in detection probability is expected. By examining the trends of PoD values based on both strain rate and AE hit rate, as shown in Figure 10, it is observed that PoDA demonstrates the expected increasing behavior in both cases. Regressively fitted curves also reveal a consistent exponential function change, particularly in alignment with the AE hit rate, where PoDE remains constant in contrast. Therefore, throughout the monitoring of strain or hit rate, amplitude-based PoD calculation provides reasonable detectability levels.

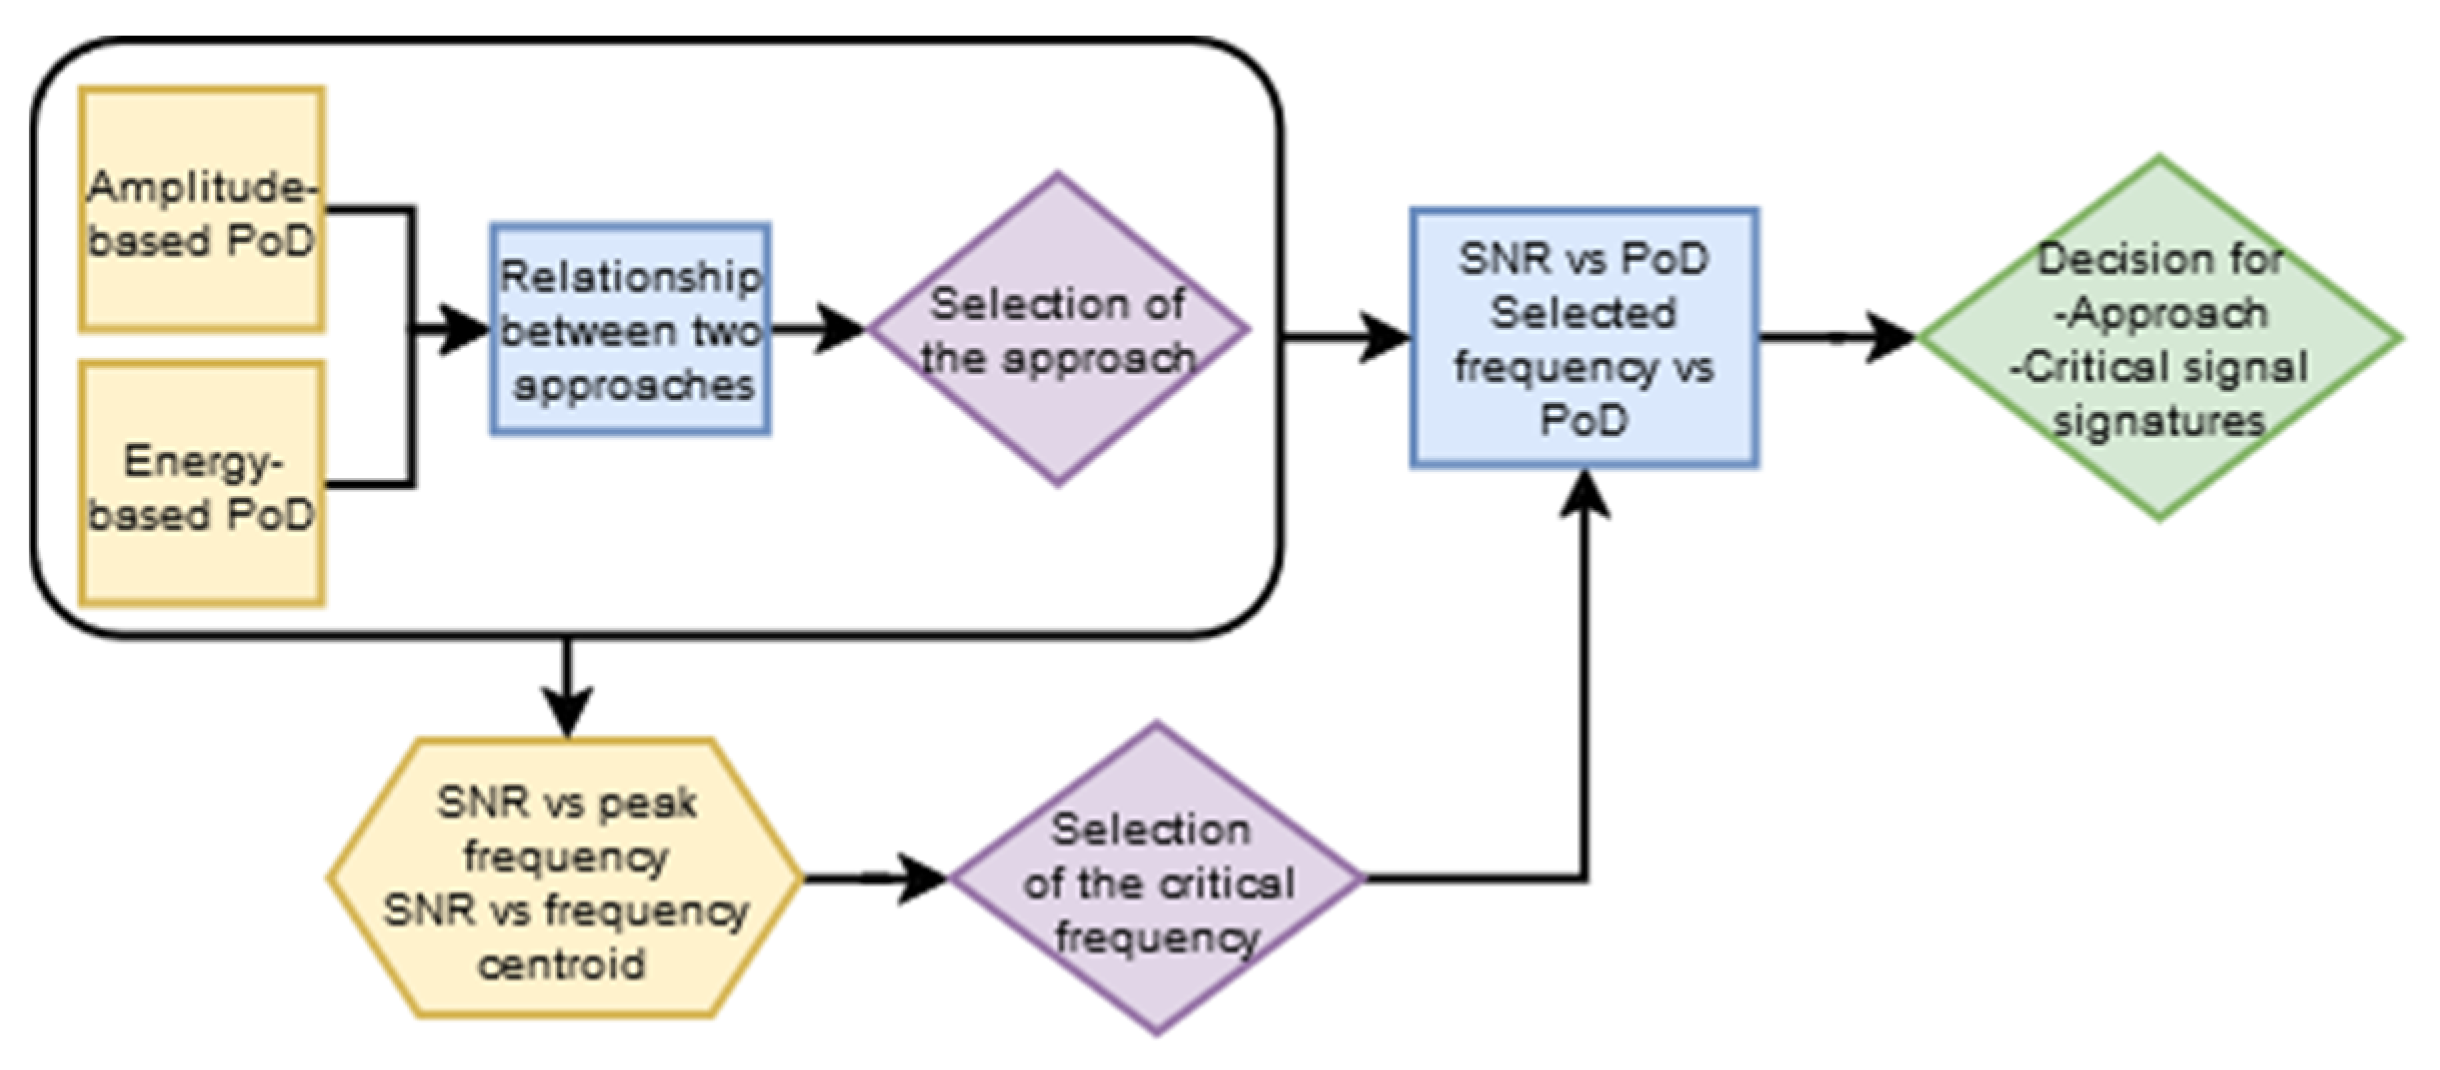
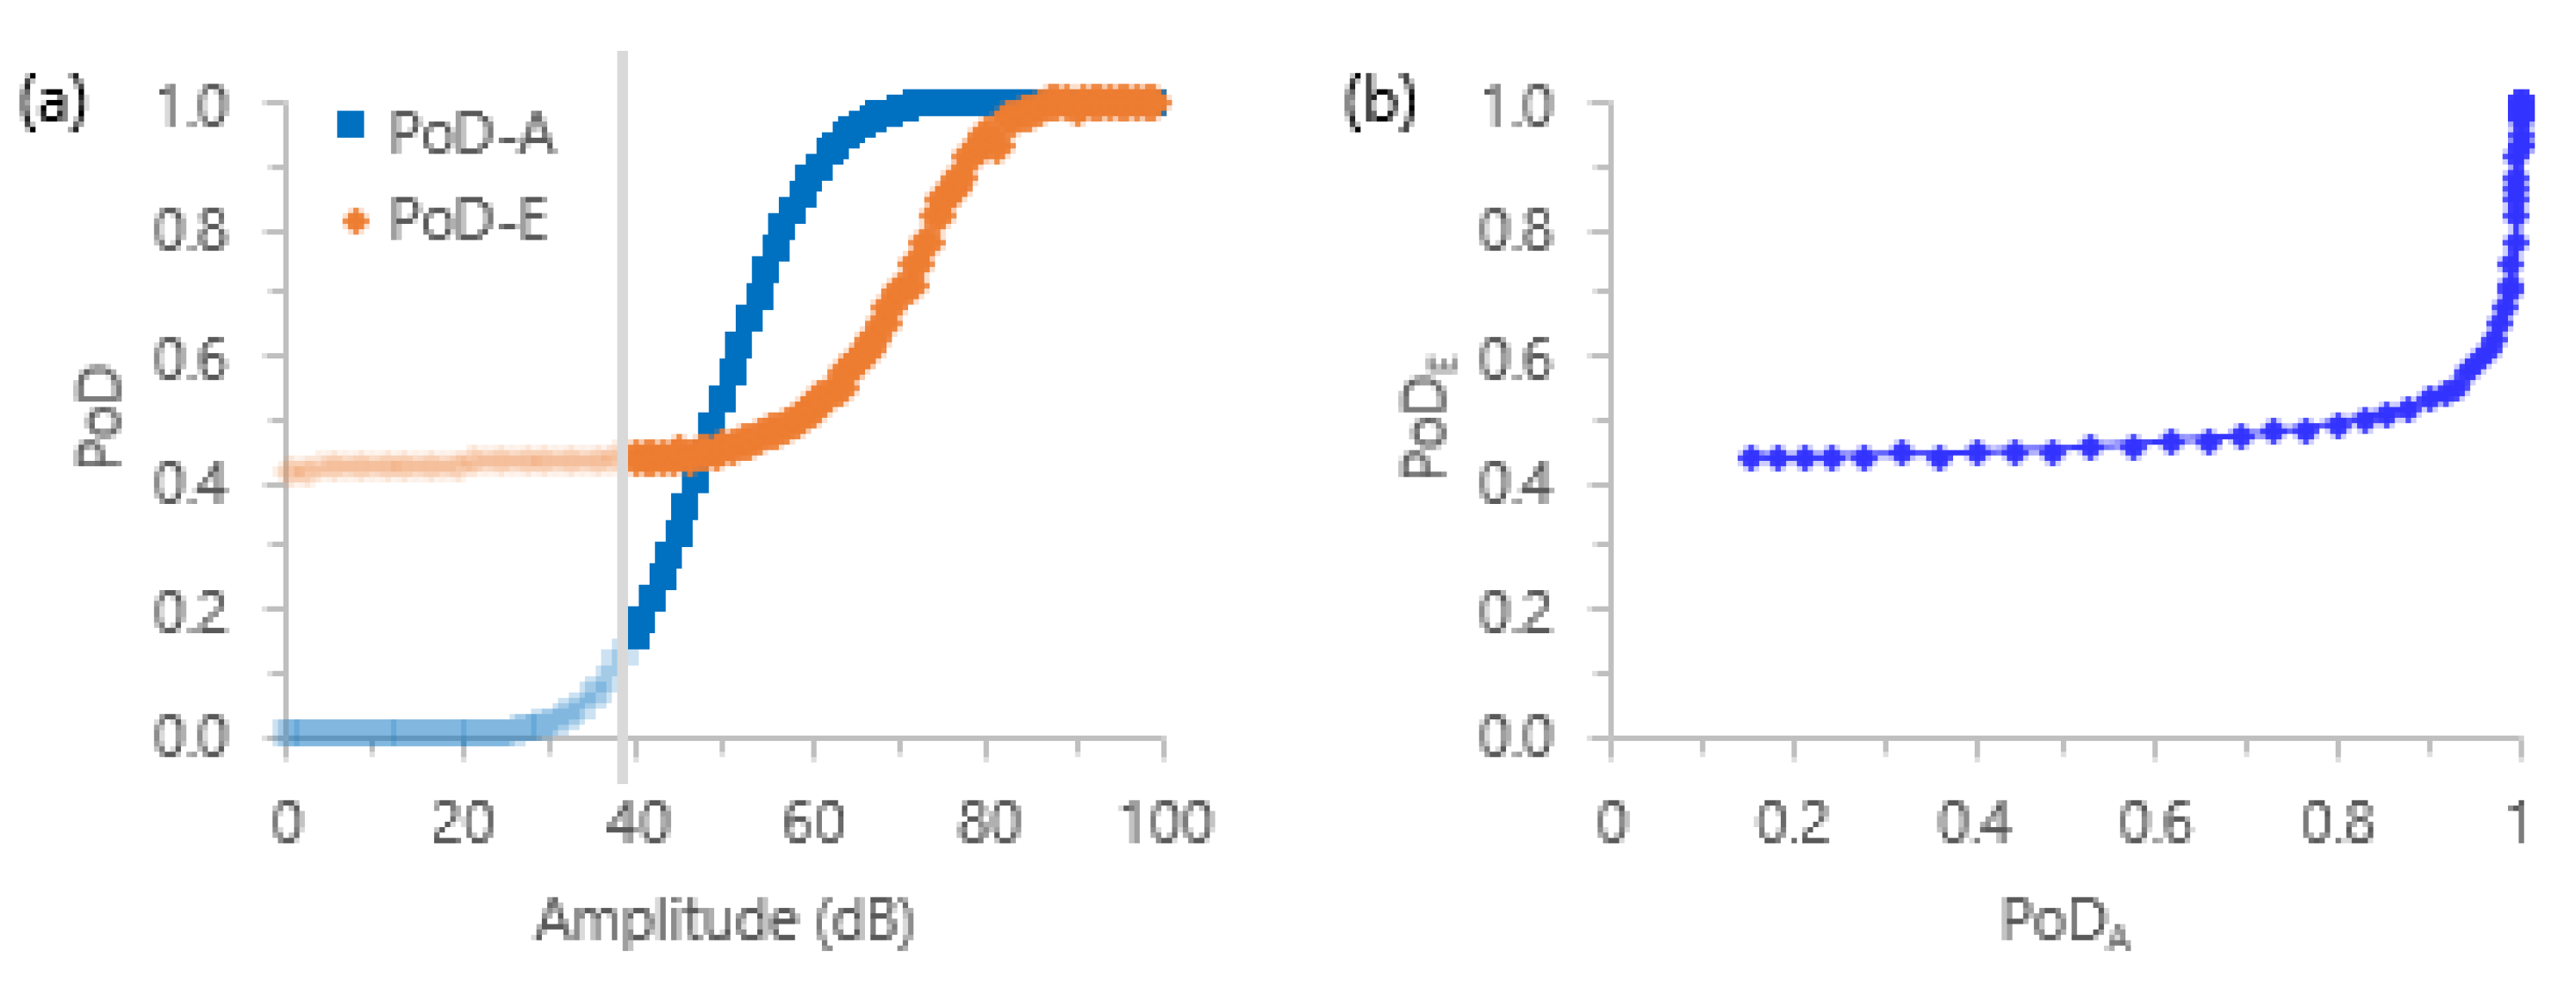
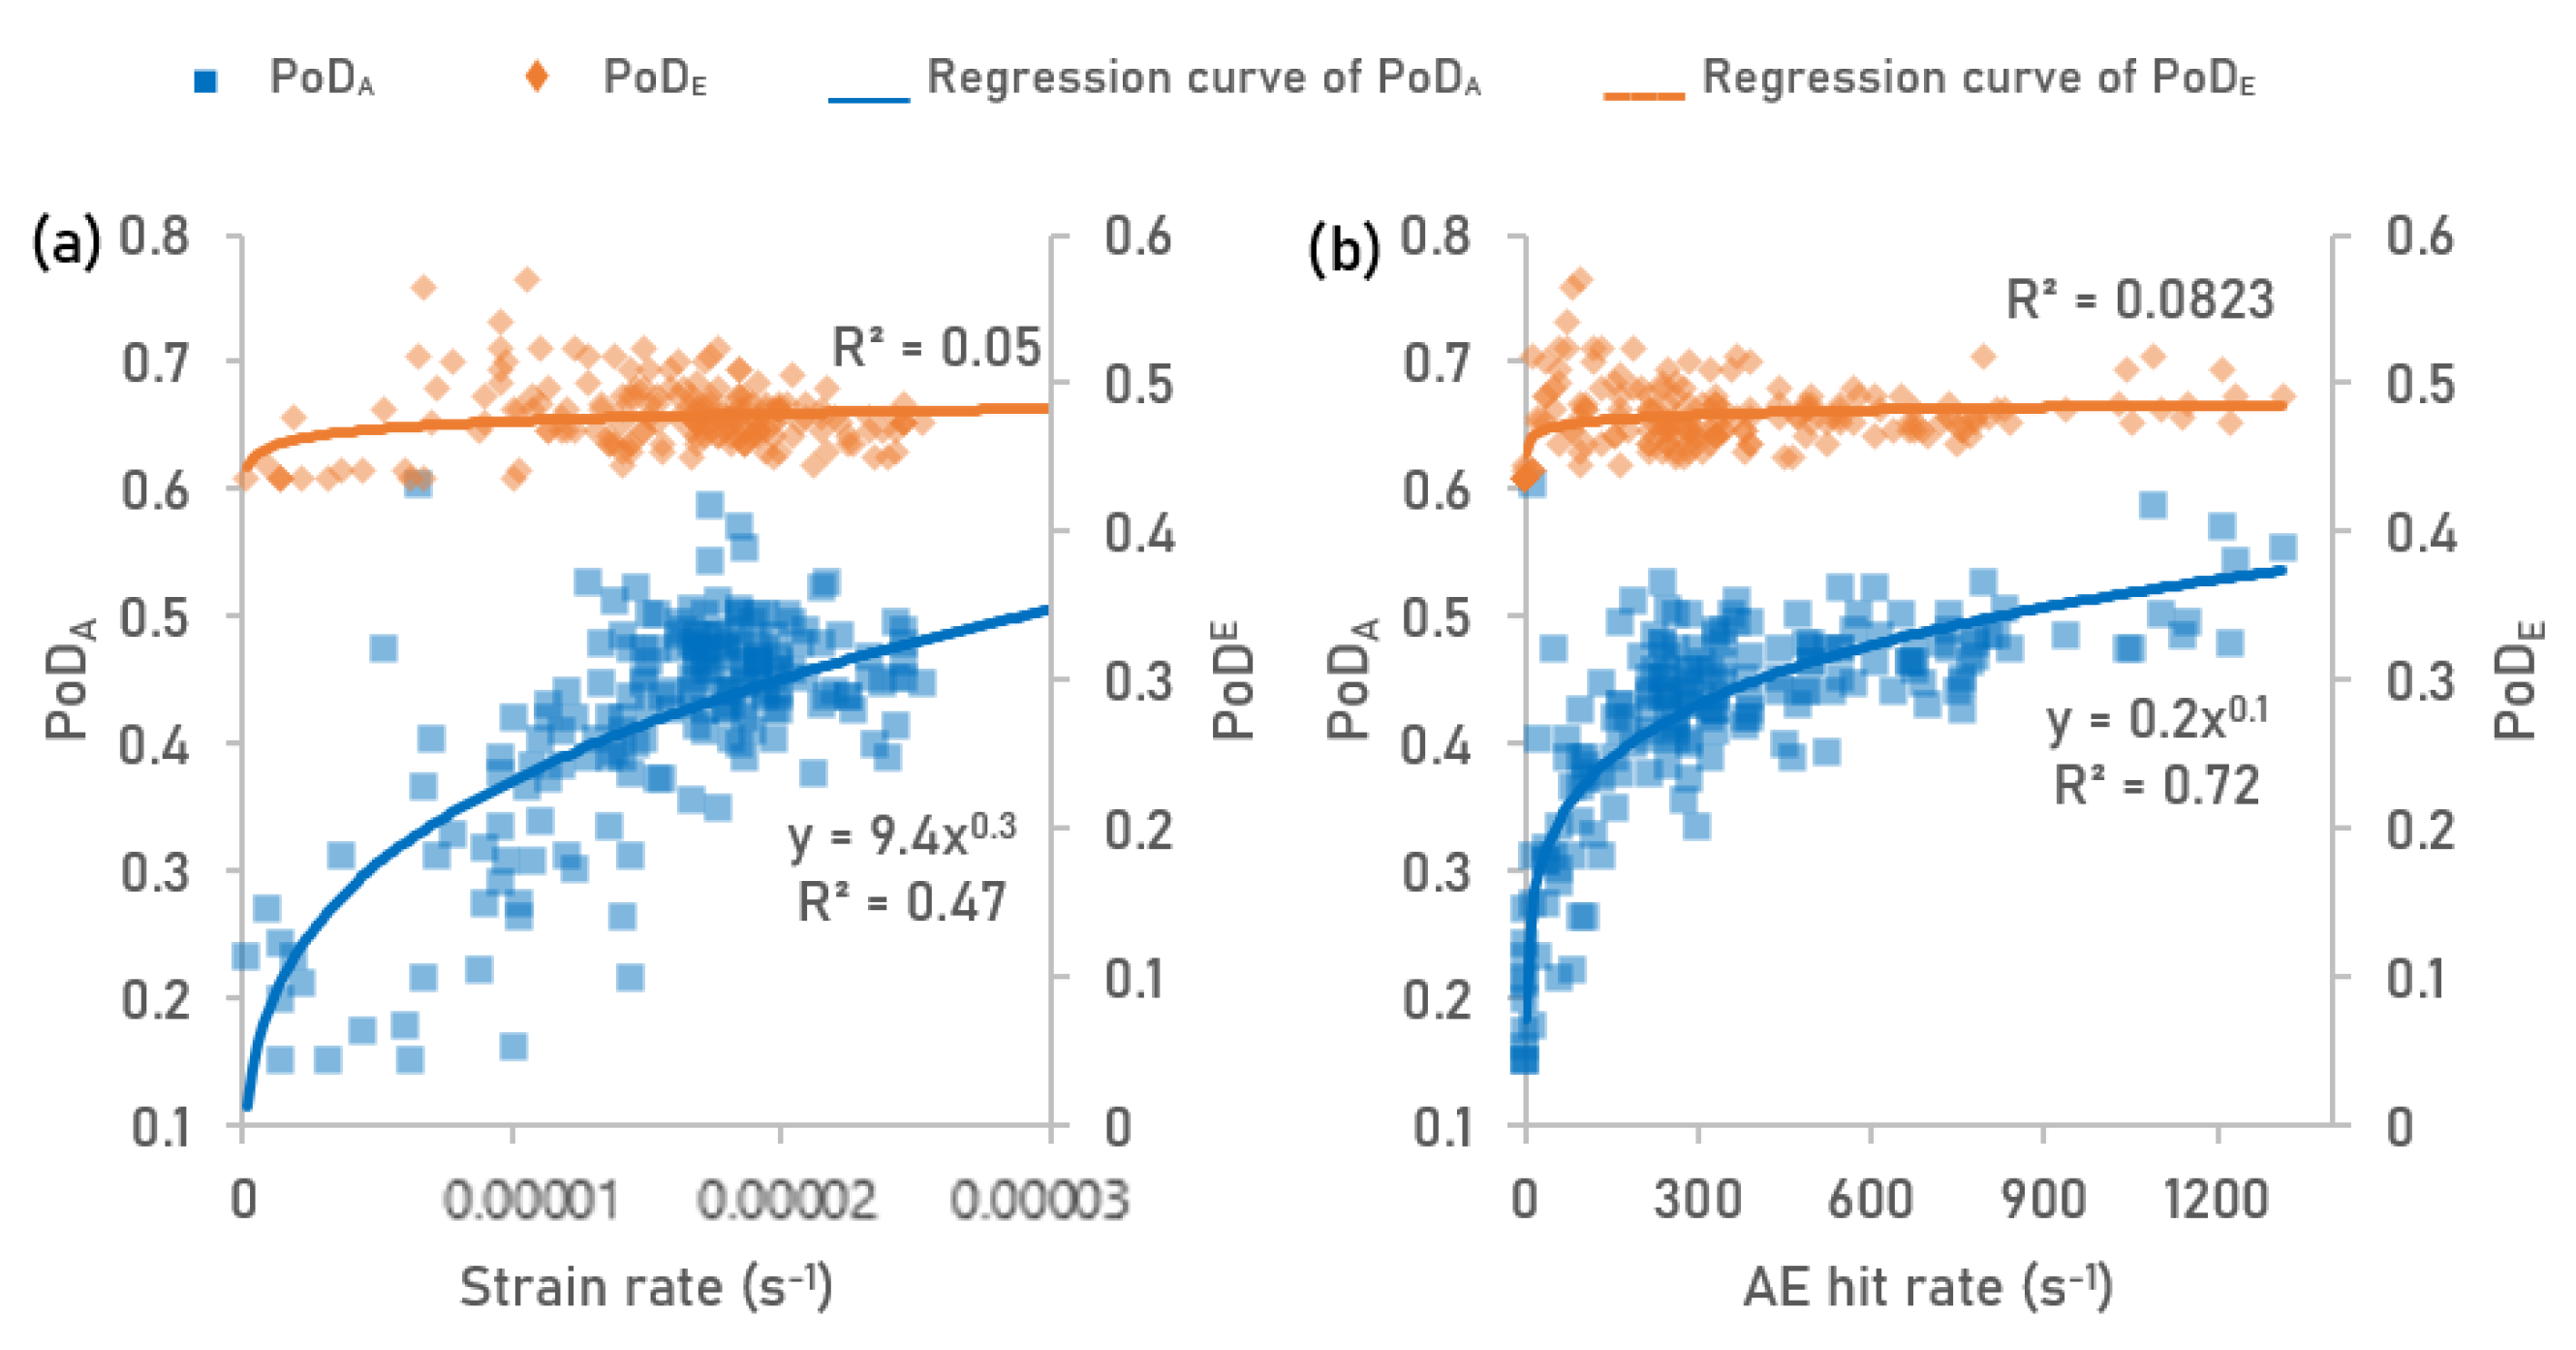
4.3. Correlations of Signal Signatures with PODA and PODE

Finally, regarding the question of whether instantaneous PoD can be determined based on the signal characteristics during inspection, the correlations between the signal signatures and the detectability of the source damage were investigated. For this, PoD variations with signal-to-noise ratio (SNR) [35] and frequency content were evaluated since these parameters are related to signal power, the distinguishability of the signal from the noise, and the type of damage.
To identify which frequency characteristic exhibits a stronger correlation with the signal’s SNR, the frequency centroid and peak frequency were initially analyzed, as shown in Figure 11a. Here, the decrease in both frequency characteristics as SNR increases is clear. As it is known from the literature that low-frequency signals are less attenuated than high-frequency signals [39,54], a similar situation can be associated with SNR. For this reason, the increase in detectability as the SNR value increases is a reasonable suggestion.
Accordingly, Figure 11b, in which SNR vs. PoD relations were plotted, also clarified this phenomenon for both approaches, particularly the higher regression with PoDA. The reason for this could be that the SNR value is calculated based on the signal amplitude. Therefore, it is recommended to investigate compatibility with energy-based attenuation values as well. However, since the signals analyzed here were obtained through a passive method and thus the source energies are unknown, attenuation factors could not be calculated.
As for variation in PoD with the frequency, the centroid frequency was used, which showed higher consistency with SNR in Figure 11a. In these results, higher PoD values were obtained at low-frequency activities. Here, it was also observed that the regression of energy-based PoDE is as high as PoDA based on amplitude. However, it should be noted that because the trend of the PoDE stabilizes after a certain frequency value, PoDE calculation based on energy might indeed lead to a higher detectability bias, as discussed in previous analyses.

5. Signal-Centric Framework for Real-Time Inspection Reliability

Based on the relationships identified among the mechanical processes of cracking damage in concrete, AE signal characteristics (AE hit rate, SNR, and frequency centroid), and the PoD of the technique outlined in Section 4, a signal-based framework was proposed. This framework aims to determine the detectability of the technique during concurrent damage assessment and to assess the necessity of configuration modifications. Considering these evaluations, it is anticipated that the method depicted in the flowchart provided in Figure 12 will assess the reliability of monitoring active damage formation in structures exposed to dynamic loads, such as nuclear power plants, bridges, or dams. The framework comprises five stages:
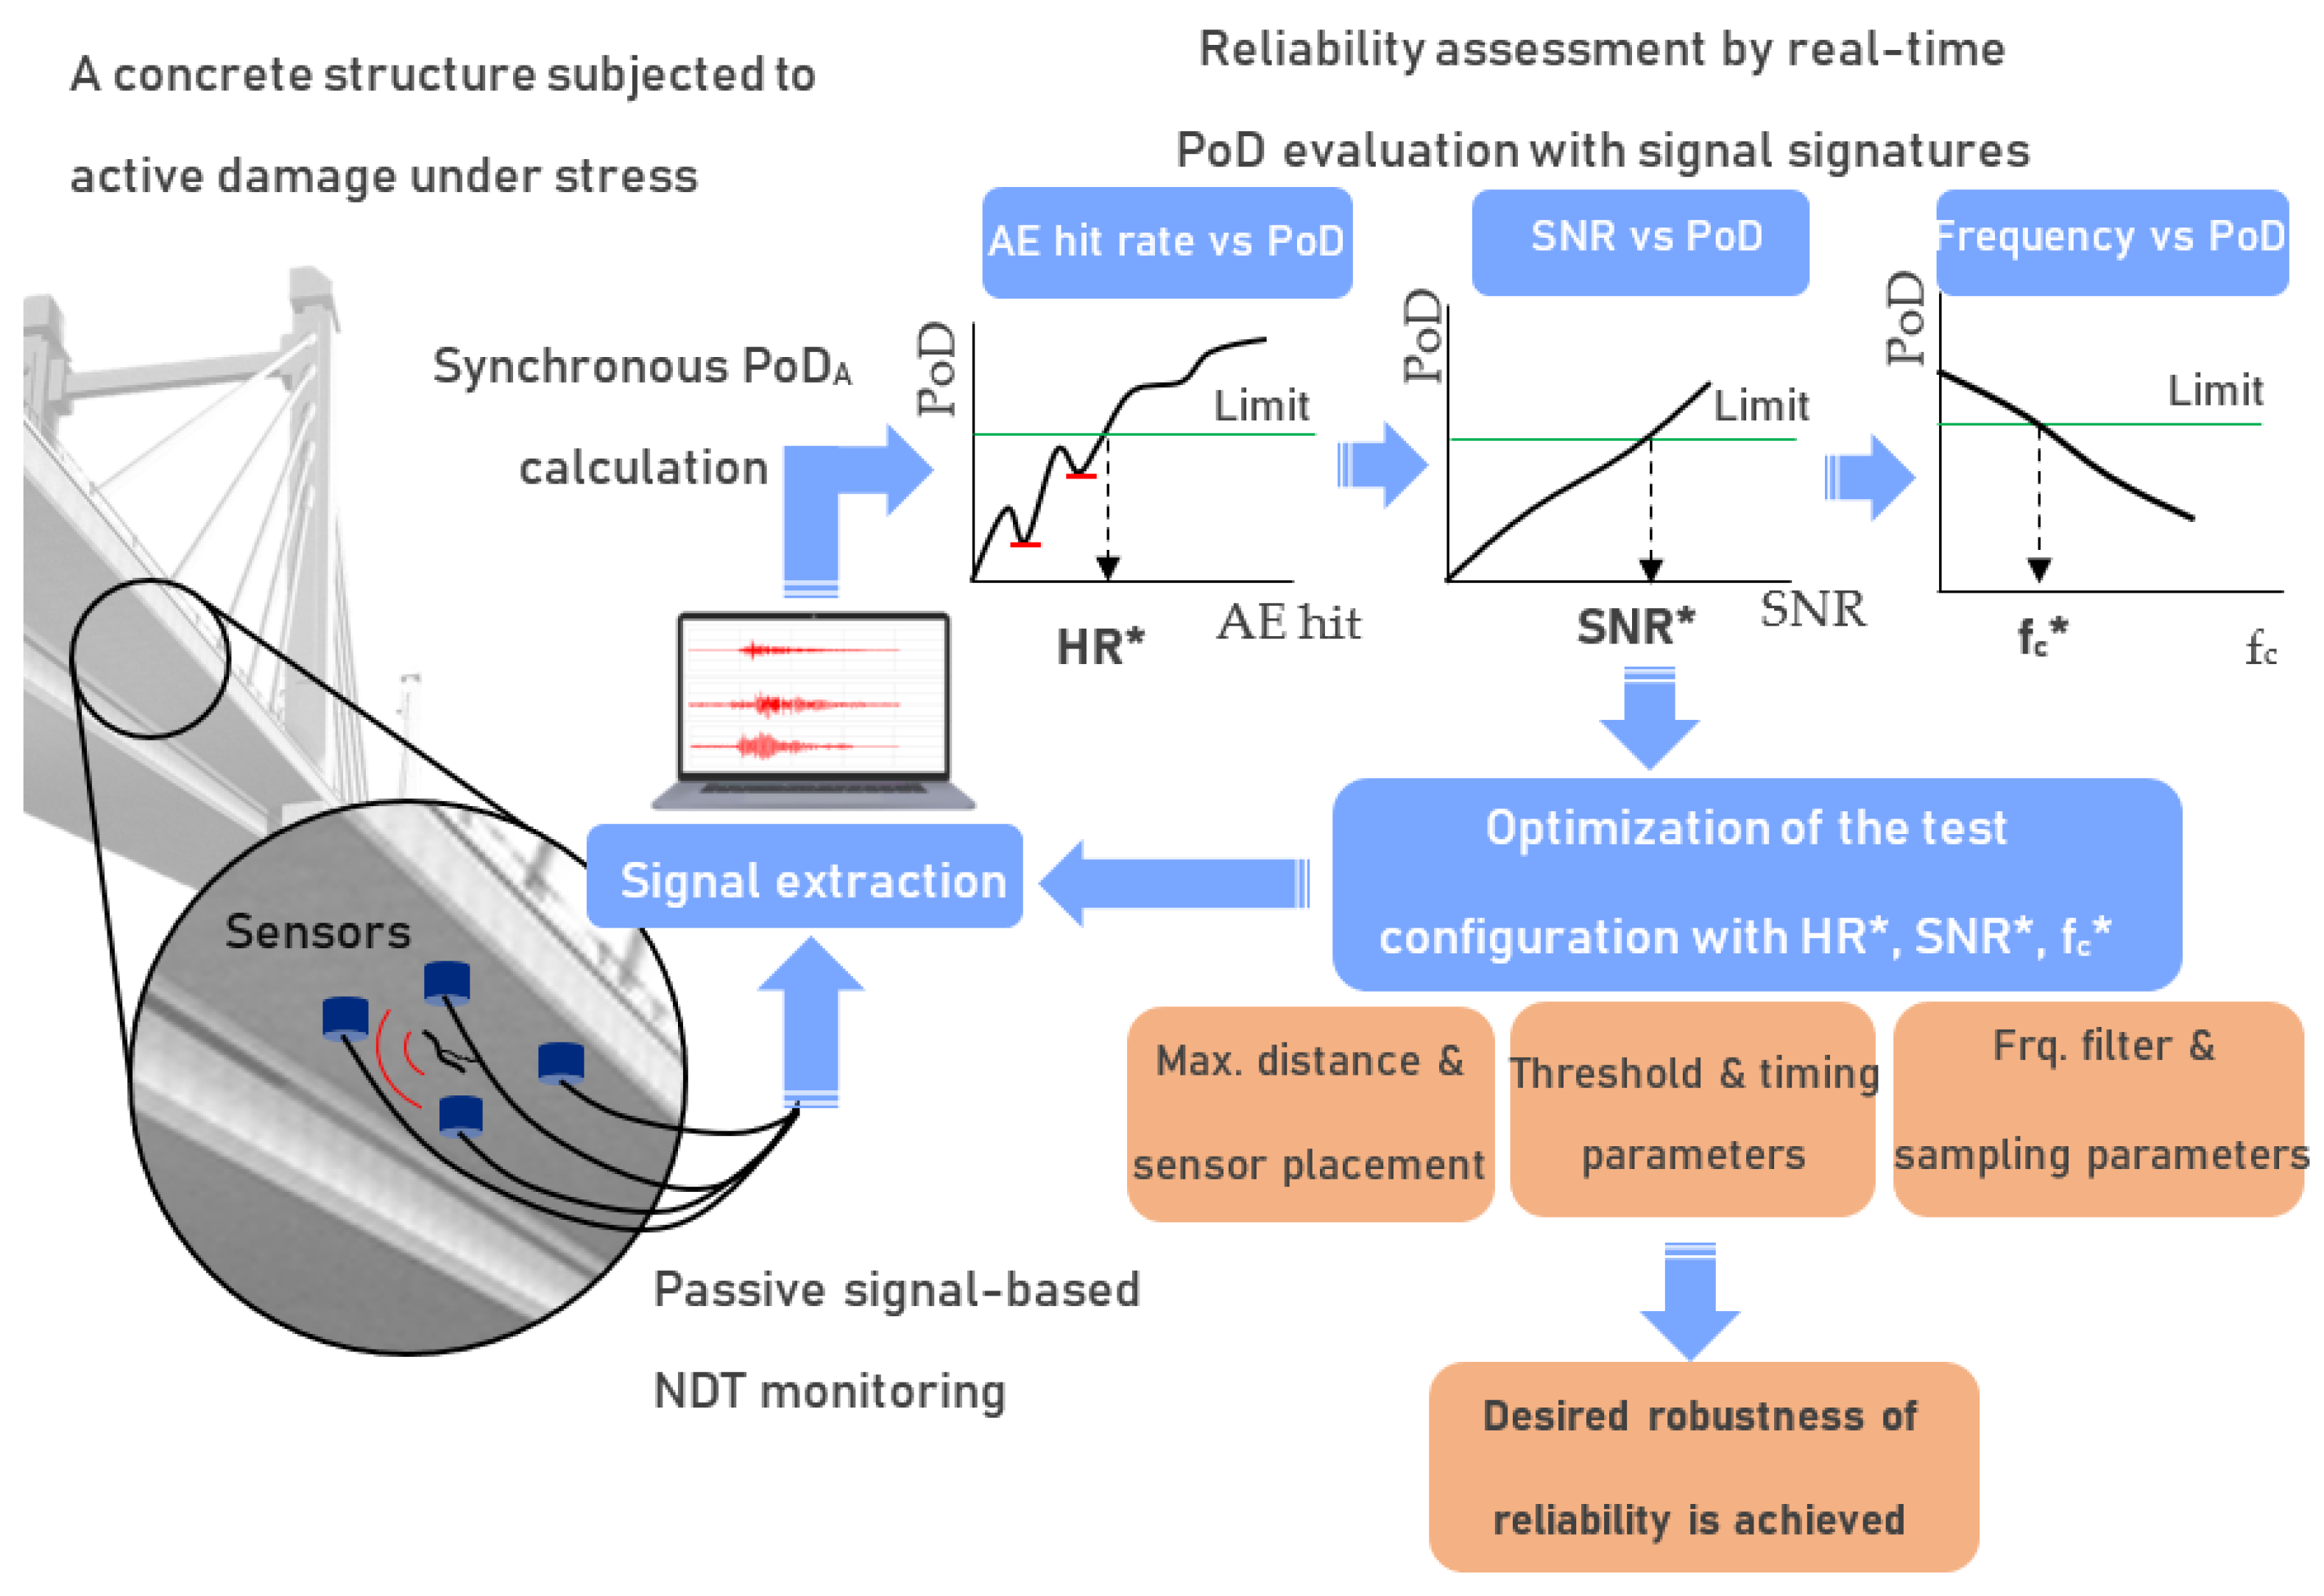
  • The acquisition system is configured with a sensor placement scheme considering the maximum distance between sensors due to attenuation, an amplitude threshold level to eliminate noise-related signals, digital and analog filters based on frequency, timing parameters (peak definition time, hit definition time, and hit lockout time), and data logging features (pre-trigger and sampling frequency). It is important to note that all these parameters are also related to the AE hit rate, in addition to the mechanical processes of concrete, and they need to be reconfigured to enhance the detectability of the technique and, thus, the reliability of the inspection.
  • During the real-time monitoring of damages using this test setup on the structure, waveforms and FFT spectra of the signals captured by the sensors and their features are acquired.
  • The synchronous amplitude-based PoD approach is applied to the amplitude distribution of the accumulated activities, and the instantaneous PoDA is calculated due to its effectiveness, as discussed in previous sections.
  • The AE hit rate of the same accumulated AE activities is calculated and correlated with PoDA values. The dip point of the AE hit rate vs. PoD curve is considered a warning, indicating a decrease in detectability. This curve indicates to the user the AE hit rate (HR*) that needs to be achieved to reach the desired PoD limit. SNR and frequency centroid of the signals are calculated and correlated with PoDA values, and their trend also indicates the required minimum SNR (SNR*) and maximum frequency centroid (fc*).
  • To provide the required AE hit rate, SNR, and frequency centroid for the minimum desired PoD of the technique, the test configuration is optimized by changing the sensor placement or type (broadband or different resonance frequency), threshold level, frequency filter, timing, and sampling parameters.
  • By continuing real-time PoD calculation with monitoring PoD variations with respect to the suggested signal signatures, this methodology is adaptable to the need for reorganization until the desired robustness of reliability is achieved.
Figure 12. PoD-based signal-centric evaluation to enhance the reliability of the inspection during real-time monitoring by passive NDT.
Applsci 15 00018 g012
In this context, it is clear that the real-time PoD calculations foreseen to be provided by the proposed framework are especially critical for structures subjected to dynamic loads, and the instantaneous determination of decreases in detectability will allow operators to intervene quickly. In addition, this will guide operators on what changes they need to make to optimize the sensor placement and key signal parameters, which will reduce inspection errors. Thus, the proposed methodology will increase the robustness and long-term reliability of the structures by allowing a certain quality standard, thanks to continuous monitoring and adaptability. In addition, since the framework offers relationships directly with the material and damage without needing to know the structural geometry and loading conditions, its applicability to different structures is wide.

6. Conclusions

This study proposes a signal−centric framework to enhance the real-time reliability of nondestructive inspection of structures by correlatively investigating the probability of detection (PoD) of crack formations with the mechanical processes and the passive signal responses. To construct the framework, the detectability of cracking damage in concrete was investigated by two approaches, namely amplitude- and energy-based PoDs. Additionally, critical signal signatures, such as signal-to-noise ratio (SNR) and frequency content, are expected to be pinpointed for their direct influence on the detectability of the crack source. Based on the outcomes obtained, effective parameters were suggested to be used in the framework to determine whether it demonstrates sufficient robustness to achieve the desired quality in inspection technique. Both approaches demonstrated increased detectability with decreasing signal-to-noise ratio and centroid frequency with high regression values. However, the stabilization trend of the energy-based approach after a certain frequency value suggests the use of the amplitude-based approach. In conclusion, a framework was proposed that allows simultaneous reliability assessment during damage detection by amplitude-based PoD calculation, providing the capability to track AE hit rate, SNR, and frequency centroid variations in relation to the technique’s reliability, which exhibits clear correlations with these parameters to identify the required configuration for the desired detectability.
For future works, inspection of the damage processes of a real structure subjected to loading or the samples simulating the structural members in the laboratory environment can be preliminary studies to verify the accuracy of the proposed framework.

Funding

This research received no external funding.

Institutional Review Board Statement

Not applicable.

Informed Consent Statement

Not applicable.

Data Availability Statement

The raw data supporting the conclusions of this article will be made available by the authors on request.

Conflicts of Interest

The author declares no conflicts of interest.

References

  1. Basu, S.; Thirumalaiselvi, A.; Sasmal, S.; Kundu, T. Nonlinear ultrasonics-based technique for monitoring damage progression in reinforced concrete structures. Ultrasonics 2024, 115, 106472. [Google Scholar] [CrossRef] [PubMed]
  2. Di Mucci, V.M.; Cardellicchio, A.; Ruggieri, S.; Nettis, A.; Renò, V.; Uva, G. Artificial intelligence in structural health management of existing bridges. Autom. Constr. 2024, 167, 105719. [Google Scholar] [CrossRef]
  3. Berrocal, C.G.; Fernandez, I.; Rempling, R. Crack monitoring in reinforced concrete beams by distributed optical fiber sensors. Struct. Infrastruct. Eng. 2020, 17, 124–139. [Google Scholar] [CrossRef]
  4. Grosse, C.U.; Ohtsu, M. Acoustic Emission Testing, Basics for Research—Applications in Civil Engineering, 2nd ed.; Springer: Berlin/Heidelberg, Germany, 2008. [Google Scholar]
  5. Verstrynge, E.; Van Steen, C.; Vandecruys, E.; Wevers, M. Steel corrosion damage monitoring in reinforced concrete structures with the acoustic emission technique: A review. Constr. Build. Mater. 2022, 349, 128732. [Google Scholar] [CrossRef]
  6. Li, D.; Nie, J.-H.; Wang, H.; Yan, J.-B.; Hu, C.-X.; Shen, P. Damage location, quantification and characterization of steel-concrete composite beams using acoustic emission. Eng. Struct. 2023, 283, 115866. [Google Scholar] [CrossRef]
  7. Barile, C.; Casavola, C.; Pappalettera, G.; Vimalathithan, P.K. Damage characterization in composite materials using acoustic emission signal-based and parameter-based data. Compos. Part. B Eng. 2019, 178, 107469. [Google Scholar] [CrossRef]
  8. Ohtsu, M.; Mori, K.; Kawasaki, Y. Corrosion process and mechanisms of corrosion-induced cracks in reinforced concrete identified by AE analysis. Strain 2011, 47, 179–186. [Google Scholar] [CrossRef]
  9. Rather, A.I.; Mirgal, P.; Banerjee, S.; Laskar, A. Application of acoustic emission as damage assessment technique for performance evaluation of concrete structures: A review. Pract. Period. Struct. Des. 2023, 28, 03123003. [Google Scholar] [CrossRef]
  10. Van Steen, C.; Pahlavan, L.; Verstrynge, E. Smart aggregates for acoustic emission monitoring of concrete cracking and reinforcement corrosion. Constr. Build. Mater. 2024, 443, 137644. [Google Scholar] [CrossRef]
  11. Thirumalaiselvi, A.; Sasmal, S. Machine learning-based acoustic emission technique for corrosion-induced damage monitoring in reinforced concrete structures. Eng. Appl. Artif. Intel. 2024, 137, 109121. [Google Scholar] [CrossRef]
  12. ASTM E1316; Standard Terminology for NDT. ASTM International: West Conshohocken, PA, USA, 2002.
  13. Burud, N.B.; Kishen, J.M.C. Response based damage assessment using acoustic emission energy for plain concrete. Constr. Build. Mater. 2021, 269, 121241. [Google Scholar] [CrossRef]
  14. Liu, K.; Wulan, T.; Yao, Y.; Bian, M.; Bao, Y. Assessment of damage evolution of concrete beams strengthened with BFRP sheets with acoustic emission and unsupervised machine learning. Eng. Struct. 2024, 300, 117228. [Google Scholar] [CrossRef]
  15. Tayfur, S.; Alver, N.; Türk, E.; Menteşoğlu, M.; Ercan, E. Failure Behavior of CFRP-Strengthened Reinforced Concrete Beam–Column Joints under Reversed-Cyclic Lateral Loading: Mechanical and Acoustic Emission Observations. Struct. Eng. Int. 2024, 34, 141–152. [Google Scholar] [CrossRef]
  16. Tayfur, S.; Alver, N. A 3D parameter correction technique for damage assessment of structural reinforced concrete beams by acoustic emission. Constr. Build. Mater. 2019, 215, 148–161. [Google Scholar] [CrossRef]
  17. Aggelis, D.G.; Shiotani, T. Effect of size of inhomogeneity on the surface wave attenuation in cementitious media. J. Mater. Civ. Eng. 2012, 24, 1097–1102. [Google Scholar] [CrossRef]
  18. Livitsanos, G.; Shetty, N.; Hündgen, D.; Verstrynge, E.; Wevers, M.; Hemelrijck, V.; Aggelis, D.G. Acoustic emission characteristics of fracture modes in masonry materials. Constr. Build. Mater. 2018, 162, 914–922. [Google Scholar] [CrossRef]
  19. Boniface, A.; Saliba, J.; Sbartaï, Z.M.; Ranaivomanana, N.; Balayssac, J.P. Evaluation of the acoustic emission 3D localisation accuracy for the mechanical damage monitoring in concrete. Eng. Frac. Mech. 2020, 223, 106742. [Google Scholar] [CrossRef]
  20. Mirgal, P.; Pal, J.; Banerjee, S. Online acoustic emission source localization in concrete structures using iterative and evolutionary algorithms. Ultrasonics 2020, 108, 106211. [Google Scholar] [CrossRef]
  21. Tayfur, S.; Alver, N. Consideration of Heterogeneity in Three Dimensional Source Localization Algorithm in AE; Acoustic Emission Working Group, AEWG-62: Chicago, IL, USA, 2020. [Google Scholar]
  22. Tayfur, S.; Zhang, T.; Mahdi, M.; Issa, M.; Ozevin, D. Cluster-based sensor selection framework for acoustic emission source localization in concrete. Measurement 2023, 219, 113293. [Google Scholar] [CrossRef]
  23. Ono, K. Current understanding of mechanisms of acoustic emission. J. Strain Anal. Eng. Des. 2005, 40, 1–15. [Google Scholar] [CrossRef]
  24. Agletdinov, E.; Pomponi, E.; Merson, D.; Vinogradov, A. A novel Bayesian approach to acoustic emission data analysis. Ultrasonics 2016, 72, 89–94. [Google Scholar] [CrossRef] [PubMed]
  25. Rentala, V.K.; Kanzler, D.; Fuchs, P. POD Evaluation: The Key Performance Indicator for NDE 4.0. J. Nondestruct. Eval. 2022, 41, 20. [Google Scholar] [CrossRef]
  26. Georgiou, G.A. Probability of Detection (PoD) Curves Derivation, applications and limitations. Insight Non-Destruct Test. Cond. Monit. 2006, 49, 409–414. [Google Scholar] [CrossRef]
  27. NASA-STD-5009; Mike Suits. Nondestructive Evaluation Requirements for Fracture Critical Metallic Components. NASA: Washington, DC, USA, 2008.
  28. Rummel, W.D.; Matzkanin, G.A. Nondestructive Evaluation (NDE) Capabilities Data Book; Nondestructive Testing Information Analysis Center: Austin, TX, USA, 1997. [Google Scholar]
  29. Lee, D.; Kwon, K. Dynamic Bayesian network model for comprehensive risk analysis of fatigue-critical structural details. Reliab. Eng. Syst. Saf. 2023, 229, 108834. [Google Scholar] [CrossRef]
  30. Schmid, S.; Reinhardt, J.; Grosse, C.U. Spatial and temporal deep learning for defect detection with lock-in thermography. NDT E Int. 2024, 143, 03063. [Google Scholar] [CrossRef]
  31. Ali, M.S.S.A.; Rajagopal, P. Probability of Detection (PoD) Curves Based on Weibull Statistics. J. Nondestruct. Eval. 2018, 37, 1–13. [Google Scholar]
  32. Pollock, A. Probability of detection for acoustic emission. J. Acous Emis. 2017, 25, 231–237. [Google Scholar]
  33. Diakhate, M.; Bastidas-Arteaga, E.; Pitti, R.M.; Schoefs, F. Cluster analysis of acoustic emission activity within wood material: Towards a real-time monitoring of crack tip propagation. Eng. Fract. Mech. 2017, 180, 254–267. [Google Scholar] [CrossRef]
  34. Sause, M.G.R.; Linscheid, F.F.; Wiehler, M. An experimentally accessible probability of detection model for acoustic emission measurements. J. Nondestruct. Eval. 2018, 37, 17. [Google Scholar] [CrossRef]
  35. Rastegaev, I.A.; Yasnikov, I.S.; Rastegaeva, I.I.; Agletdinov, E.A.; Merson, D.L. Evaluating the Probability of Detecting Acoustic Emission Signals Using the Amplitude Discrimination Method with a Low Signal-to-Noise Ratio. Russ. J. Nondestruct. Test. 2022, 58, 157–166. [Google Scholar] [CrossRef]
  36. Niri, E.D.; Farhidzadeh, A.; Salamone, S. Adaptive multisensor data fusion for acoustic emission source localization in noisy environment. Struct. Health Monit. 2013, 12, 59–77. [Google Scholar] [CrossRef]
  37. Barat, V.; Marchenkov, A.; Ivanov, V.; Bardakov, V.; Elizarov, S.; Machikhin, A. Empirical Approach to Defect Detection Probability by Acoustic Emission Testing. Appl. Sci. 2021, 11, 9429. [Google Scholar] [CrossRef]
  38. Ozevin, D.; Zhang, L. The probability of detection for acoustic emission to assess the crack growth in steel structures. In Proceedings of the International Conference on Structural Health Monitoring of Intelligent Infrastructure, Porto, Portugal, 30 June–2 July 2021. ISSN 2564-3738. [Google Scholar]
  39. Oh, T.M.; Kim, M.K.; Lee, J.W.; Kim, H.; Kim, M.J. Experimental Investigation on Effective Distances of Acoustic Emission in Concrete Structures. Appl. Sci. 2020, 10, 6051. [Google Scholar] [CrossRef]
  40. Wu, X.; Yan, Q.; Hedayat, A.; Wang, X. The influence law of concrete aggregate particle size on acoustic emission wave attenuation. Sci. Rep. 2021, 11, 22685. [Google Scholar] [CrossRef]
  41. Sun, X.; Fan, S.; Liu, C. Attenuation characteristics of concrete using smart aggregate transducers: Experiments and numerical simulations of P-wave propagation. J. Intell. Mater. Syst. Struct. 2024, 35, 556–572. [Google Scholar] [CrossRef]
  42. Li, S.-L.; Hou, S.-T.; Wu, G.-M.; Sun, W.-C.; Jiang, N. Damage pattern recognition of concrete hollow slab with analysis of different AE monitoring positions. Appl. Acous. 2024, 219, 109916. [Google Scholar] [CrossRef]
  43. Dai, J.; Liu, J.; Zhou, L.; He, X. Crack Pattern Recognition Based on Acoustic Emission Waveform Features. Rock. Mech. Rock. Eng. 2023, 56, 1063–1076. [Google Scholar] [CrossRef]
  44. Tayfur, S.; Alver, N. Attenuation and frequency characteristics of acoustic waves in steel and synthetic fiber-reinforced concrete: 3D-pct and unsupervised pattern recognition. Appl. Sci. 2022, 12, 12976. [Google Scholar] [CrossRef]
  45. Deresse, N.E.; Van Steen, C.; Soete, J.; Sarem, M.; Vanhulst, J.; Wevers, M.; François, S.; Verstrynge, E. Fracture mode analysis of cementitious mortars by simultaneous application of 4D-XCT and acoustic emission technique. Constr. Build. Mater. 2024, 419, 135486. [Google Scholar] [CrossRef]
  46. Silva, R.R.d.; Padu, G.X.d. Nondestructive inspection reliability: State of the art. In Nondestructive Testing Methods and New Applications; InTech: Hong Kong, 2012; pp. 1–22. [Google Scholar]
  47. Gagar, D.; Foote, P.; Irving, P.E. Effects of loading and sample geometry on acoustic emission generation during fatigue crack growth: Implications for structural health monitoring. Int. J. Fatigue 2015, 81, 117–127. [Google Scholar] [CrossRef]
  48. Prakash, N.; Nieberl, D.; Mayer, M.; Schuster, A. Learning defects from aircraft NDT data. NDT E Int. 2023, 138, 102885. [Google Scholar] [CrossRef]
  49. Mazzatura, I.; Casas, J.R.; Salvatore, W.; Caprili, S. Reliability of ultrasonic tomography in detecting grouting defects in post-tensioned structures by PoD curves. Eng. Struct. 2024, 302, 117352. [Google Scholar] [CrossRef]
  50. Kwon, K.; Frangopol, D.M. Bridge fatigue assessment and management using reliability-based crack growth and probability of detection models. Probabilistic Eng. Mech. 2011, 26, 471–480. [Google Scholar] [CrossRef]
  51. ASTM C39/C39M-21; Standard Test Method for Compressive Strength of Cylindrical Concrete Specimens. ASTM International: West Conshohocken, PA, USA, 2016.
  52. ASTM E 976; Standard Guide for Determining the Reproducibility of Acoustic Emission Sensor Response. ASTM International: West Conshohocken, PA, USA, 2015.
  53. Tinkey, B.V.; Fowler, T.J.; Klingner, R.E. Nondestructive Testing of Prestressed Bridge Girders with Distributed Damage; Research Report 1857-2; Center for Transportation Research, The University of Texas at Austin: Austin, TX, USA, 2020. [Google Scholar]
  54. Aggelis, D.G. Classification of cracking mode in concrete by acoustic emission parameters. Mech. Res. Comm. 2011, 38, 153–157. [Google Scholar] [CrossRef]
Figure 1. Waveform and spectrum characteristics of an AE signal.
Applsci 15 00018 g001
Figure 2. Flowchart for the algorithm of the framework to be constructed.
Applsci 15 00018 g002
Figure 3. Collecting dataset of a concrete cylinder under uniaxial compressive loading.
Applsci 15 00018 g003
Figure 4. (a) Stress vs. strain curve and strain trend line, (b) failure state of the concrete specimen after compression test.
Applsci 15 00018 g004
Figure 5. AE hit formation curve and distributions of amplitude (a) and energy (b) with respect to concrete strain.
Applsci 15 00018 g005
Figure 6. AE hit rate and strain rate with respect to concrete strain.
Applsci 15 00018 g006
Figure 7. Amplitude- and energy-based detectability of concrete cracking activities: (a) PoDA and (b) PoDE curves.
Applsci 15 00018 g007
Figure 8. Comparison of amplitude- and energy-based detectability approaches: (a) PoDs vs. amplitude, (b) PoDA and PoDE.
Applsci 15 00018 g008
Figure 9. Variation in PoDA and PoDE with concrete strain.
Applsci 15 00018 g009
Figure 10. Variations in PoDA and PoDE with (a) strain rate, (b) AE hit rate.
Applsci 15 00018 g010
Figure 11. (a) Relations of frequency centroid and peak frequency with SNR, variations of PoDA and PoDE with (b) SNR and (c) frequency centroid.
Applsci 15 00018 g011
Disclaimer/Publisher’s Note: The statements, opinions and data contained in all publications are solely those of the individual author(s) and contributor(s) and not of MDPI and/or the editor(s). MDPI and/or the editor(s) disclaim responsibility for any injury to people or property resulting from any ideas, methods, instructions or products referred to in the content.

