Abstract
Buckling-Restrained Braces (BRBs) are widely utilized in structures as an anti-seismic system to enhance performance against lateral excitations. While BRBs are designed to yield symmetrically under both tension and compression without significant buckling, their effectiveness is often limited to moderate seismic events. During high-intensity earthquakes, repetitive yielding can lead to core failure, resulting in the loss of BRB functionality and potentially causing structural collapse. This study proposes an innovative design for BRBs to improve energy dissipation capacity under severe seismic activity. The new design incorporates Ultra-High-Performance Fiber-Reinforced Concrete (UHPFRC) filler and hyper-elastic rubber components as primary load-bearing elements. Through extensive testing and simulation, the proposed Rubber Buckling-Restrained Brace (RBRB) was developed and manufactured by integrating hyper-elastic rubber between the concrete and core to enhance the device’s strength. Additionally, a prototype of the conventional BRB device was fabricated to serve as a benchmark for evaluating the performance of the RBRB. Experimental testing of both the conventional BRB and the proposed RBRB prototypes was conducted using a heavy-duty dynamic actuator to assess the RBRB’s performance under applied loads. Based on the experimental results, an analytical model of the proposed RBRB was formulated for use in finite element modeling and analysis. Furthermore, a specialized seismic design procedure for structures equipped with the RBRB was developed, according to the performance-based design method. This procedure was applied to the design of a seven-story steel structure, and the impact of the RBRB on the seismic response of the structure was investigated through finite element simulations. The analysis results demonstrated that the RBRB significantly improves the loading capacity and energy dissipation capabilities of structures, thereby enhancing their overall performance against earthquake excitations.
1. Introduction
Recently, construction methods have tended to use lateral bracing systems in the form of tension only or rigid tension–compression steel bracing to increase the stiffness of structures. While conventional cross-bracing can be used for both lateral loading, the cyclic compressive force applied to steel braces in a seismic event occurrence has resulted in the recent development of the Buckling-Restrained Bracing (BRB) system to enhance seismic performance by addressing buckling and low energy dissipation in traditional braces by providing stable, symmetric yielding under tension and compression.
However, previous studies on BRBs showed that during a severe vibration, by failure of the main core, braces are not able to perform further in load bearing and are required to be changed or repaired, which causes difficulty for maintenance and retrofitting in the structure. Despite structures being furnished with other vibration dissipation systems such as viscous dampers [1,2] or variable stiffness bracing [3], BRBFs exhibit very favorable energy-dissipating characteristics. However, low post-yield stiffness of the braces leaves this system vulnerable to unfavorable behavioral characteristics such as maximum story drift and residual story drift. Furthermore, in order to increase the strength of high-rise buildings against earthquakes, it is required to enlarge the BRB cross-sectional area, which leads to an increase in the total weight and occupied area of the building. For a larger BRB, the steel must have a lower yield stress to maximize the equivalent damping. Given the limited available variance in steel strength, the only practical solution for a designer is to affect the stiffness of the brace by varying the cross-sectional areas of the brace.
The concept of Buckling-Restrained Braces (BRBs) originated in Japan during the early 1980s, initially referred to as buckling-inhibited or unbonded braces [4]. These types of braces received initial approval in the United States a few years after the Northridge earthquake occurred in 1994 [5].
Although BRBs could be diverse in design and configuration, the main concept among the BRBs remains identical. The brace consists of one ductile steel core, which is supposed to yield under tension and compression. To prevent global buckling in the core, it is placed inside a steel case’s mainly hollow section, which is named the hollow steel section (HSS), and then this hollow gap between the core and restrainer case can be filled with various mortars such as concrete or just remain as a void cavity. Before this mortar is cast, an un-bonding material or an air gap should be provided so the core segment becomes able to move easily through the system and the axial load can be transferred between the core and hollow steel section (HSS) [6].
One investigation focused on how to assemble the BRB elements by modifying the size, configuration, and material. We also performed an extensive analysis of the BRBs’ stability and analyzed a range of factors that may affect the BRBs’ performance. The authors proposed a simplified seismic calculation method to design this kind of bracing system and developed new methods for using existing steel sections [7].
Based on several benefits of steel plate-assembled BRBs, for instance, performance stability and simple fabrication, the number of studies conducted on them have been increasing. To address the issue of the problems of local buckling of end connection and random failure locations of steel core components in plate BRBs, Hongmin, et al. (2009) produced perforated steel plate Buckling-Restrained Braces (or PBRBs). They investigated PBRB energy absorption and its parameters. Their results proved the excellent performance of PBRBs, such as energy consumption mechanisms, by fixing failure location, having stable energy consumption capacity, and showing good hysteresis curve performance, which enhanced the seismic performance of the conventional BRB [8].
Dongbin et al. (2016) developed a bamboo-shaped BRB, and the behavior of this BRB was studied by conducting experimental testing. The results demonstrated its good performance in dissipating energy. Also, it was concluded that the low-fatigue performance of the device depends on the length [9].
Various cross-sections have been proposed by KC Tsai et al. (2008) [10] for core energy dissipation. Tsai used BRBs with concrete fillers and square steel tubes [11].
They found out that while BRB is implemented in frames and structural members subjected to the bending moment, global buckling would not occur if the Euler load of the steel tube is greater than the yield strength of the core.
Buckling-Restrained Braces have been studied widely as (1) independent members, (2) members placed in sub-assemblages, and (3) as an anti-seismic brace in structures.
As singular members, BRBs illustrated high energy dissipation ability in the case of hysteretic behavior with full, stable loops [12,13]. Various core section configurations, restrainers, and materials have been tested [14,15]. The results showed that when mortar was chosen as a restrainer filler in BRB and the core element shape was rectangular or cruciform, mild or low-yield steel was formed. Also, common failure modes have been investigated, such as global buckling of the brace [16,17]; core local buckling, which happens as a result of higher modes of failure [18,19]; and buckling in un-bound zones of BRB like both ends of a device, where the core is not efficiently restrained [20]. Some other failure origins are cumulative plastic ductility [21,22], connections, and joints [10,23,24]. If it is not possible to control these failures, they may have a significant effect on the structure of global response [24].
The sub-assemblage testing procedure was conducted on BRBs to assess their lateral resistance capability, particularly their connection ends while subjected to rotations [6,25]. Acceptable responses should be within the levels of drift design based on standards. However, for demands outside these limits, failures have been identified in the connections and joints due to gusset plate out-of-plane deformation. Chou et al. (2012) developed a dual gusset plate to improve the stability of the BRB connection. As a result, connections required specific studies that are beyond the scope of this research [26].
Experimental research on structures furnished by BRB is limited. Mainly, shaking table experiments are valuable due to reliable results in evaluating the structure’s response under dynamic loading [26,27,28,29,30,31,32,33,34]. Vargas and Bruneau (2009) conducted an experimental test on a scaled model on a shaking table in the US for a single-bay three-story steel structure furnished by BRB and a bare frame. The experimental results showed a 70% decrease in lateral displacements and inter-story drifts, but the accelerations remained unchanged. Also, they recorded an increase in the damping ratio, from 2% in the bare frame to about 5% in BRBFs [35].
A joint study was operated by the National Center for Research on Earthquake Engineering at the University of Michigan, USA (2004) [36], and the main aim of the study was to present a suitable method to find the base shear. H Choi et al. (2006) developed a design process for the BRBFs by means of energy spectrum hysteresis. In this method, it is assumed that structural main elements (beams and columns) are under gravity load and remain in an elastic stage, and the energy is dissipated by BRBs. Therefore, it is required and necessary for new proposed technology to have experimental and numerical studies [37]. Fahnestock, Sause, and Ricles (2007) [38] conducted comprehensive research on BRBs and illustrated some of the advantages and limitations of the lateral bracing system, as follows.
- Advantages. Lateral bracing systems, such as Buckling-Restrained Braces (BRBs), provide several key benefits in seismic regions:
- ○
- Enhanced Energy Dissipation: these systems effectively absorb and dissipate seismic energy, reducing the overall impact on the structure.
- ○
- Improved Stability: bracing systems help maintain the structural integrity of buildings during lateral seismic forces, preventing excessive deformation or collapse.
- ○
- Minimized Residual Displacements: systems like BRBs ensure minimal residual displacements, allowing for quicker recovery post-event and reducing the need for extensive repairs.
- Limitations. Despite their advantages, lateral bracing systems also have certain limitations:
- ○
- Space and Aesthetic Impact: bracing systems, especially traditional ones, can require significant space, which may be a challenge in buildings with limited room for structural elements.
- ○
- Cost: the installation of advanced bracing systems, such as BRBs or other modern dampers, can increase construction costs.
- ○
- Maintenance: components like rubber in RBRBs or the steel core in BRBs may require periodic inspection and maintenance to ensure long-term performance.
- Contribution to Safety.
- ○
- According to studies, lateral bracing systems significantly enhance the seismic resilience of buildings. For example, research by Fahnestock et al. (2007) found that BRBs can reduce inter-story drift by up to 70% compared to traditional bracing systems, enhancing the building’s overall safety during seismic events. Additionally, it is revealed that implementing bracing systems can increase building resilience by reducing base shear forces by up to 50%. These improvements are critical in high seismic hazard areas, where building safety is paramount [38].
Asgarian, Shokrgozar, and Abitorabi (2008) investigated the effect of design loads in BRBFs’ performance. In their study, different variables such as resistance, ductility, and the effect of design loads on BRBFs were assessed. For this purpose, various buildings in a range of stories and BRB configurations were evaluated [39].
Nonlinear incremental dynamic, static pushover, and linear dynamic analyses have been conducted using FEA OpenSees software (version 3.7.0). The effects of some factors such as structure height and bracing on response have been investigated and the responses for correction variables for all bracing systems were independently calculated in their study (Asgarian et al., 2008). López-Almansa et al. (2012) modeled the cyclical behavior of a BRB bracing system to check the ductility and connection resistance based on FEMA-450 [40]. Furthermore, Mazzolani, Della Corte, and D’aniello (2009) tested the effect of special types of eccentric braces to improve the seismic performance of an existing RC building [41].
Black et al. (2004) conducted a two-phase experimental test to show that un-bonded BRB had a proper performance under the implementing loads based on OSHPD and SAC. It was concluded that BRB is a better option in comparison to conventional bracing systems to improve the performance of building (both new and existing) and its performance completely satisfied the drift limitation [12].
C. Uang and Kiggins (2003) conducted a study to investigate the potential benefit of using Buckling-Restrained Braces in a dual system to decrease permanent deformations to reduce residual story drifts. This study suggested that one choice could be designing the BRBs as a dual system; the addition of special moment-resisting frames (SMRFs), which show large deformability in the elastic range, can serve as a restoring force mechanism to partially re-center the building after a significant seismic event [42].
Through the presentation of several derivations and definitions, including an expression for equivalent damping of the system, the authors reported an expression for optimizing the yield stress of the BRB. The parametric study concerning equivalent damping aided in several conclusions for optimal brace behavior. First, a larger brace sectional area results in higher equivalent damping. Likewise, a larger brace cross-sectional area results in higher damping under small lateral displacements, while a brace having a smaller cross-sectional area sees higher damping under large lateral displacements. Finally, if a larger BRB is to be employed, the steel must have a lower yield stress to maximize the equivalent damping. Given the limited available variance in steel strength, a designer can only practically affect the stiffness of the braces by varying the cross-sectional areas.
Di Sarno and Elnashai (2009) investigated the seismic performance of steel moment-resisting frames (MRFs) retrofitted with various bracing systems. The main MRF was designed with a lateral stiffness that did not accompany drift limitations in severe seismic regions. The bracing systems were special concentrically braced frames (SCBFs), mega-braces (MBFs), and BRBFs. Their combination led to eight retrofitted models [43].
It was found that the maximum story drifts in MBFs is 70%, 50% lower than MRFs and SCBFs. Although BRBFs have a slightly higher reduction in maximum story drifts than MBFs, their total weights are greater than those of MBFs (18.45 vs. 13.5). They concluded that MBFs are the most cost-effective bracing systems.
Moradi, Alam, and Asgardian (2014) compared the seismic performance of BRBFs and shape memory alloy-braced frames (SMA BFs). Four different bracing configurations (including diagonal, split-X, chevron-V, and inverted-V) were tested using incremental dynamic analysis (IDA) under twenty various ground motion records. In the SMA BFs, the beams and columns were the same as BRBFs, while the BRBs were replaced by super-elastic SMA bar segments that were connected to rigid links. The SMA BFs were designed to have the same natural period as the BRBFs [44].
Moradi et al. drew the following conclusions from the study:
- The responses of BRBFs are only slightly sensitive to higher modes.
- The SMA braces are effective in reducing maximum inter-story drifts.
- Both SMA BFs and BRBFs satisfy design drift limits
- The inelastic responses of SMA BFs are distributed more evenly than BRBFs, which mitigate structural damages.
- SMA BFs experience negligible residual drifts due to the re-centering capacity of shape memory alloy braces.
- SMA BFs are more sensitive to the frequency content of earthquakes. Under severe earthquakes, SMA braces undergo complete phase transformation, which allows them to dissipate more energy [44].
Jinkoo Kim and Choi (2004) modeled five-story and ten-story structures furnished by BRB to investigate the effect of BRBs on the seismic responses of buildings. Nonlinear time-history analyses were performed using scaled El Centro and Mexico City earthquakes. The same number of BRBs with yield stresses of 14.5 and 35 ksi (100 and 240 MPa) were distributed throughout the structures using four different methods: (a) distribution proportionally to story stiffness, (b) same-sized BRB in every story, (c) distribution proportional to inter-story drift resulting from pushover analysis, and (d) distributed proportional to story shear. The results proved that BRBs produced better structural performance. They also proposed a design procedure based on the hypothesis of equivalent damping by plastic deformation of the BRBs. A model structure designed in accordance with the proposed method exhibited maximum displacements that corresponded well with target displacements [45].
In similar research, J Kim et al. (2004) studied a performance-based seismic design procedure for SDOF and MDOF model structures furnished by BRBs. Both three- and five-story model structures were built according to the direct displacement design method under nonlinear time history analysis. The models displayed that the maximum displacements of the structure were within the target displacements, and BRBs dissipated energy inelastically while the rest of the structural members remained elastic [46].
An alternate application of BRBs was approached by Carden, Itani, and Buckl (2006). They report on the seismic performance of single-angle X braces [47]. The study comprised the cyclic testing of single-angle braces, experimental static loading, and shake tables on a large scale. The results indicated that the single angle with sufficient connection details performed well, with cyclic deformations of more than 6% axial strain before failure. The experimental testing was subjected to the scaled-up 1940 El Centro earthquake. The experimental results in brace axial strains indicated 1.6% less than the calculated displacement capacity of the X-braced cross frames (which is 6%), the system also displayed no strength degradation and had a comparatively low post-yield stiffness, effectively behaving as a structural fuse. Ultimately, the X brace system reduced the elastic base shear seen up to 50%.
Based on FEMA, the performance-based method (PBD) is a technical concept. It is made up of a series of exercises employed in order to construct a system with a given probability of not accomplishing such damage levels, considering a possible spectrum of theoretical earthquakes that might impact it (FEMA–P58, 2012). Under PBD, developers are able to recognize a risk standard for any of the multiple types of earthquake hazards listed. As seismic risk is a probabilistic theory, it must be measured by quantifiable values to be understandable.
Due to the superb hysteretic behavior of BRBs, they have become more accepted than ever to be implemented as an earthquake-resistant system in structures [48]. They have been verified to be a functional technique to employ BRBs in structures for seismic retrofitting. For steel structures with BRBFs, the seismic demand can be considerably decreased by mitigating any damage to BRBs [49].
In order to decrease the damage to structures during earthquake events, a suitable structural design method is required to be adapted to use BRB energy dissipation capacity. The conventional strength-based seismic design (SBSD) method is unable to estimate BRBFs’ inelastic behavior. For this purpose, performance-based seismic design (PBSD) methods have been widely applied. Also, the direct displacement-based seismic design (DBSD) method is becoming accepted in the engineering community as an efficient method to design BRBFs [45,50]. However, earthquake damage is closely related to the hysteretic energy of the structural cumulative, which is not measured in the DBSD method [51]. Recently, some researchers also utilized energy methods to anticipate the damage state of structures [52,53,54]. Accordingly, as a substitute, these types of design methods such as SBSD, DBSD, and energy-based seismic design (EBSD) have increasingly been used in BRBF design procedures [55,56,57,58,59].
Freddi et al. (2020) analyzed the seismic performance of dual systems combining Buckling-Restrained Braced Frames (BRBFs) with moment-resisting frames (MRFs). These systems enhance energy dissipation, stiffness, and reparability. The results showed that high base shear ratios (α > 3) reduce cumulative ductility demands but increase residual displacements, potentially exceeding reparability limits. Residual displacement variability was significant, emphasizing its importance in post-earthquake assessments. While higher α values control accelerations and ductility demands, they also amplify residual drifts [60]. The study validated the SEI/ASCE 7–10 limit of α = 3 and provided practical recommendations for balancing acceleration control and residual capacity in system design [61].
Upadhyay and Pantelides (2024) analyzed a two-span bridge with a post-tensioned concrete pier and a Buckling-Restrained Brace (BRB) using a validated 3D nonlinear numerical model. The study defined three damage limit states: the activation of post-tensioning bars, maximum base shear or spalling, and near-collapse, developing fragility curves for seismic assessment. Key findings include: (1) BRBs dissipated up to 70% of seismic energy, with significant performance under far-field motions; (2) increased BRB force ratios improved base shear capacity but had minimal impact on drift ratio capacity; (3) a residual drift ratio of 0.5% ensured operational performance post-earthquake. The methodology offers enhanced seismic resilience and functional recovery [62].
Murphy et al. (2021) developed a novel timber Buckling-Restrained Brace (T-BRB) combining a low-yield steel core with a mass timber casing for lateral force resistance in mass timber-braced frames. Six full-scale T-BRBs were tested under cyclic loading, achieving stable hysteresis curves, excellent energy dissipation, and cumulative inelastic deformation exceeding AISC 341 standards. The timber casing showed minimal damage, enabling inspection and potential reuse post-earthquake. Compared to composite steel/concrete BRBs, T-BRBs demonstrated superior strain performance (up to 3.9%) and sustainability. Further research is proposed on cyclic tests and analytical modeling for seismic applications in mass timber buildings [63].
MacRae and Lee (2023) discussed critical design issues for Buckling-Restrained Braced Frames (BRBFs), including BRB system capacity under axial compression and out-of-plane deformations, brace inertial effects, gusset plate weld strength, frame element demands, and quality control. They proposed solutions to address these issues, emphasizing the importance of balancing flexibility and stiffness in brace and gusset plate regions to prevent instability or unintended yielding. A simple design method is introduced to ensure BRB stability and proper performance under combined deformation effects, using familiar engineering equations to maintain core yielding within the BRB restrainer/casing [64].
Rubio and colleagues (2024) evaluate a seismic-resistant hybrid timber (SRHT) building, combining Laminated Veneer Lumber (LVL) frames with Buckling-Restrained Braces (BRBs) or shape memory alloy (SMA) braces. The 12-story structure balances flexibility and seismic performance, meeting code requirements under nonlinear dynamic analysis (NLDA). BRBs provided superior energy dissipation, while SMA braces minimized residual displacements but increased floor accelerations. Both systems are viable, but BRBs may be oversized, suggesting potential optimization in future studies. The study concludes that the proposed wood-based hybrid system exhibits robust seismic behavior and warrants further experimental validation [65].
In addition to the application of Buckling-Restrained Braces (BRBs), various other vibration dissipation systems have been extensively developed and implemented in structural engineering. These systems include elastomeric isolators, friction dampers, and smart damping technologies.
Dutkiewicz et al. (2022) introduced a novel shell-type dry friction damper with an elastomeric filler, optimizing its strength, rigidity, and energy dissipation capacity [66]. Similarly, Ouyang and Cao (2023) proposed a dual-rotor-bearing system incorporating active elastic support dry friction dampers, achieving a remarkable 60% reduction in vibration-induced damage [67]. Tan et al. (2022) designed an innovative elastomeric bearing combining silica sand and shape memory polymer, which significantly enhanced shear stiffness and energy dissipation performance [68]. Altalabani et al. (2024) developed rubber isolators reinforced with Carbon Fiber-Reinforced Polymer (CFRP) and steel layers for tunnel-form buildings, effectively improving the damping characteristics during seismic events [69]. Furthermore, Tan and Hejazi (2022) introduced elastomeric bearings with sand or epoxy fillers, achieving improved damping and stiffness, particularly for base isolation applications [70].
Despite the advantages of elastomeric isolators, extensive research has also been conducted on friction-based damping systems. Deubel, Schneider, and Prokop (2024) investigated the effects of suspension friction on ride comfort, revealing that increased friction exacerbates body vibration and discomfort on smooth roads [71]. Landara, Velychkovych, and Mykhailiuk (2024) proposed a novel shock absorber design for deep drilling with Polycrystalline Diamond Compact (PDC) bits, addressing challenges such as stick-slip and whirling vibrations and demonstrating its effectiveness in mitigating these issues [72]. Shatskyi and Velychkovych (2023) developed a dry friction shell shock absorber with an elastic filler, demonstrating its efficacy in structural damping under cyclic loading, with potential applications in industries such as mining and construction [73].
Building on the development of friction-based damping systems, advancements in smart controllers for vibration management have also emerged as a significant area of innovation. These controllers integrate with traditional damping mechanisms to enhance their adaptability and efficiency in mitigating structural vibrations under varying conditions. Landar et al. (2024) tested a smart controller for monitoring drill string vibrations during deep well drilling, demonstrating its ability to assess vibration impacts and optimize drilling modes. Its low power consumption and memory efficiency render it suitable for long-term field applications [74]. Farahpour and Hejazi (2023) introduced a Semi-Active Adaptive Vibration Control System (SABFD) for bridges, integrating fluid dampers with fuzzy-logic Programmable Logic Controllers (PLCs) for real-time vibration control. This system effectively reduced displacement under traffic loads [75]. Additionally, they developed an Adjustable Bypass Fluid Damper (ABFD) for bridges, which adjusts damping through flow control valves based on displacement. A case study demonstrated a 35% reduction in peak displacement, highlighting the effectiveness of this system [76].
Although the aforementioned vibration dissipation systems demonstrate considerable effectiveness, their practical application in structures is often limited by significant challenges. These systems typically involve heavy mass and weight, and their functionality is heavily reliant on structural movement, which can induce deformation in the primary structural members.
Therefore, a high-performance lightweight system without such a dependency on the core element deformation for structural retrofitting and maintenance should be developed. The main idea of this study is to propose a Rubber Buckling-Restrained Brace (RBRB) to increase the load-bearing capacity by increasing the absorbed energy. This paper provides the design procedure for RBRB. The device performance was also assessed experimentally with a dynamic actuator. The macro numerical simulation was developed in order to evaluate the seismic performance of an assumed building as a bare frame furnished by BRB and RBRB.
2. Development of Rubber Buckling-Restrained Brace (RBRB)
The Buckling-Restrained Brace (BRB) system relies on the performance of its core under both compression and tension. Consequently, the steel core is crucial for the load-bearing capacity and overall effectiveness of the device. This study aims to enhance the vibration dissipation capacity and increase energy absorption during severe seismic events. This is achieved by incorporating specially designed hyper-elastic rubber as a key component in the load-bearing mechanism.
For this purpose, experimental tests were conducted on both conventional BRBs and the proposed RBRB. The performance of both devices was then compared using finite element simulation to evaluate the impact of the bracing systems on building behavior through the performance-based design (PBD) method.
Given the identified limitations of conventional BRBs, it was determined that a high-performance, lightweight BRB system is needed. Such a system should not rely heavily on core element manipulation or extensive calculations to enhance performance and mitigate existing issues. The incorporation of rubber in the BRB design is due to its high bulk modulus of elasticity (K) and low shear modulus (G). Rubber’s high resistance to volume change under load ensures sufficient load-bearing capacity due to its high stiffness characteristics. As an incompressible material, rubber has a Poisson’s ratio of exactly 0.5. For applications where rubber is not highly confined, assuming incompressibility is reasonable and is a critical component of many mathematical models developed for rubber [77,78,79]. Rubber in RBRB enhances the vibration dissipation capacity and absorbed energy of the system.
In the fabrication process of conventional BRBs, the core components are divided into two sections: 40% for the plastic section and 60% for the elastic section [80]. Next, the core is placed inside a hollow steel tube restrainer, which serves to confine the device. After this step, concrete is cast inside the hollow steel section, surrounding the core while maintaining a gap to allow for local buckling of the core element.
The procedure of fabricating the RBRB is shown in Figure 1a. It consists of elastic and plastic sections (1). Section one is the core of the system and consists of the steel plate, which is assumed to have plastic behavior, and two steel hollow sections as the elastic parts, which should have more resistance and remain elastically during loading. The elastic part has been chosen as the hollow section, which is welded to the steel support head plates to have more resistance against forces.
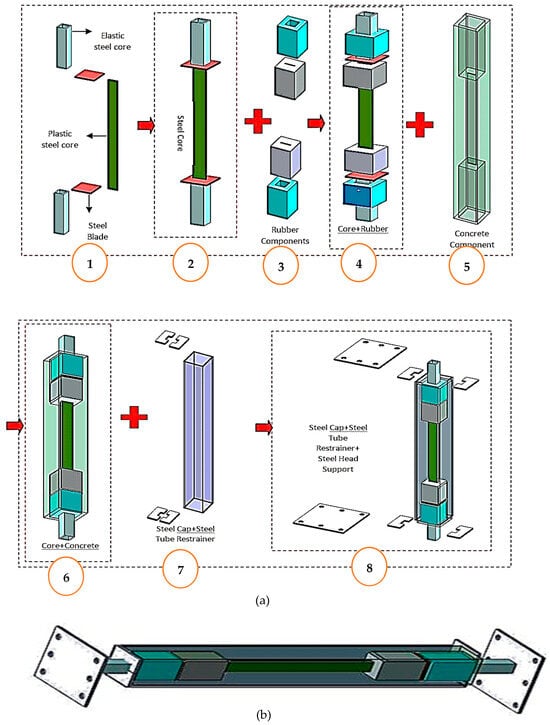
Figure 1.
(a) Procedure of fabrication of the RBRB. (b) Proposed RBRB after assembling. (a) Assembly steps. (b) Proposed RBRB.
The steel core was assembled by connecting the plastic and elastic sections (1), then dividers (1) (which are steel plates) were placed through the core between the elastic and plastic sections (1). By finalizing the steel core (2), it was inserted inside the steel tube restrainer. Then, the concrete (5) was casted inside the steel tube restrainer by considering the gap for rubber cubes (3,4).
Further, the rubber components were fitted carefully in the considered gap between the steel divider and concrete (6). The difference between the rubber shapes is due to the main core dimensions. Since it has a steel plate as the main core (plastic part) and two hollow sections (as elastic parts) on both sides, one set of rubber components has the dimension of the main core (plastic part), and the other set is based on the steel hollow section core (elastic part).
The steel hollow section (7) has the role of restraining the whole device. Steel caps (7) were added to both ends of the steel tube restrainer to take the imposed transferred force and not pull out the core during testing. In the last step, steel support heads (8) were situated at both ends of the device to fix the device to the actuator head and support. The final figure of the proposed RBRB after assembling all steps is presented in Figure 1b.
Figure 2 shows the RBRB behavior under compression. The force is transferred from the end joints to the core, which responds to this force by undergoing local buckling as it is restrained and bonded within the concrete, dissipating some of the energy. Concurrently, the applied force causes the dividers attached to the core to move, compressing the inner rubber components situated between the dividers and the concrete. This results in the compression of the inner rubbers. The inner hyper-elastic rubber acts under compression, generating a resistant force and providing additional resistance to the local buckling of the steel core.
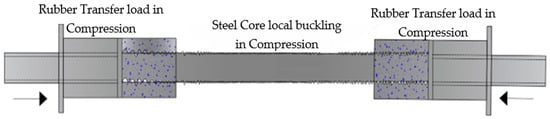
Figure 2.
RBRB performance under compression.
Figure 3 indicates RBRB performance under tension. During tension, the incoming force is transferred from the end joints to the core, leading to energy absorption through the elongation of the core. This elongation decreases the cross-sectional area of the steel core. Simultaneously, the load is transmitted to the dividers, which push the two outer rubber components, compacting them between the dividers and the concrete. The outer hyper-elastic rubber components, now under compression, generate additional force resistance, supplementing the tensile resistance of the core.
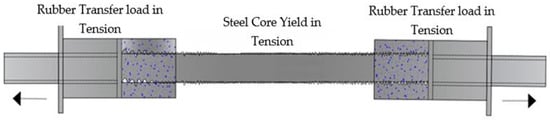
Figure 3.
RBRB performance under tension.
After the core fails due to rupture from repeated loading, the RBRB continues to function by transferring the load from the end joints to the ruptured core, and then to the dividers. The dividers compress the rubber components situated between the concrete and dividers under both tension and compression. Consequently, the RBRB transitions to act as a rubber restrainer, with its rubber components continuing to resist the incoming forces.
3. Details of Material Implemented in the Design of RBRB
To determine the optimal dimensions for the functionality of both BRB and RBRB components within the defined parameters, three sets of experimental tests were conducted. These tests focused on the concrete, steel core, and rubber components.
3.1. Steel Design
The maximum elongation of the core is essential for estimating the dimensions of the rubber cubes to be placed in the gap between the concrete and dividers. This ensures that the rubber components function in unison with the core displacement, generating resistance. It is important to note that, based on the actuator setup framework in the laboratory, the distance between the actuator head and the fixed support was 1500 mm. Therefore, the initial length of the BRB and RBRB prototypes was set to this value.
The range of the cross-section area of the core has been calculated based on the formulation of Hook’s law in Equation (1) [81,82]. It should be mentioned that based on actuator setup safety regulation, the maximum employed force has to be less than 300 kN, based on the following formulation:
where P is the maximum yielding force, which is considered 300 kN; L is the length of the sample, which is 1500 mm; is yielding deformation of the core, which is 15%; A is the core cross-section area; and E represents Young’s modulus of steel 200 MPa.
Three different thicknesses of steel sections of 5 mm, 6 mm, and 8 mm (Figure 4) were chosen based on the aforementioned calculation. To evaluate their tensile capacity, the cross-section area can be between 30 mm2 and 50 mm2. The steel components were certified based on A36 [83]; also, all the coupon tests result for the steel samples were provided by the same supplier.
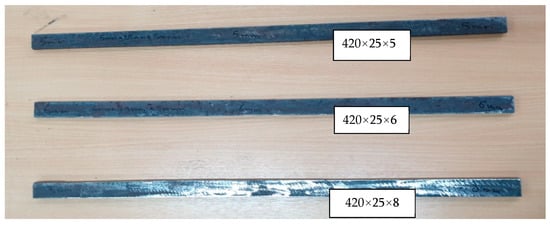
Figure 4.
Steel plate sample cores.
These three samples were fixed in the UTM machine and pulled up to their ultimate capacity, as indicated in Figure 5.
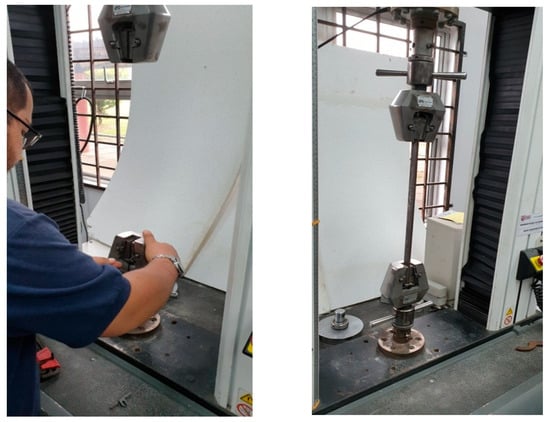
Figure 5.
UTM testing device.
Based on the test results, as shown in Figure 6, all samples exhibited a similar pattern up to the yield strength of the steel. However, due to their different cross-sectional areas, they displayed varying strain hardening behaviors to reach ultimate strength. The 5 mm and 6 mm samples achieved maximum displacements of 43 mm and 73 mm, respectively. For the 8 mm steel sample, the maximum load reached 95 kN at a displacement of 14 mm. The test was then stopped due to the tensile testing machine’s (UTM) limitation of a maximum tensile strength of 100 kN.
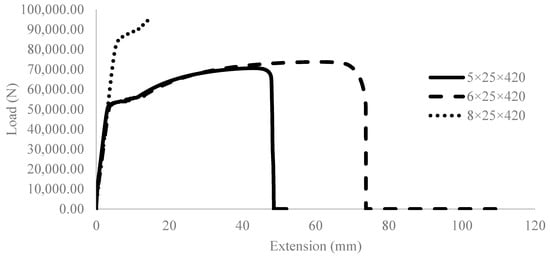
Figure 6.
Steel samples result.
As can be seen in Table 1, the maximum strain for the 5 mm and 6 mm steel samples at their peak load measured 10.93% and 13.90%, respectively. For the 8 mm sample, due to the test being stopped before reaching the maximum load, the strain measured 3.68%. Additionally, the tensile test results indicate that the maximum tensile stress for the 5 mm sample is 564 MPa, while it is 491 MPa and 475 MPa for the 6 mm and 8 mm samples, respectively.

Table 1.
Steel sample tensile test result.
Due to the dynamic actuator’s limitations, the maximum elongation considered for prototype testing had to be within 150 mm. Therefore, it was necessary to determine the steel core elongation value within this range (with an ultimate force capacity of 300 kN). Based on the aforementioned values, the sample with dimensions of 6 × 25 × 420 mm was selected due to its compatibility with the dynamic actuator’s maximum displacement limitations. The 6 mm sample reached a displacement of 73 mm. Considering the UTM limitation, all samples were cut in half, necessitating doubling the deformation value in calculations. Consequently, a maximum sample displacement of 150 mm was determined to be appropriate, ensuring that the device would fail before reaching the actuator’s maximum displacement.
3.2. Rubber Design Compression Test
The dimensions of the rubber blocks are 91 × 91 × 150 mm and 98 × 98 × 150 mm for Rubber1 and Rubber2, respectively. Figure 7 illustrates the configuration of these rubber blocks. The differing dimensions of these rubber blocks and their molds are due to the variations in the cross-sectional area of the elastic and plastic core sections. The stiffness of the high damping rubber used was set to 70 kN/mm, which is typical for normal rubber material stiffness. In the RBRB system, two steel molds were manufactured to house the rubber blocks, as shown in Figure 8.
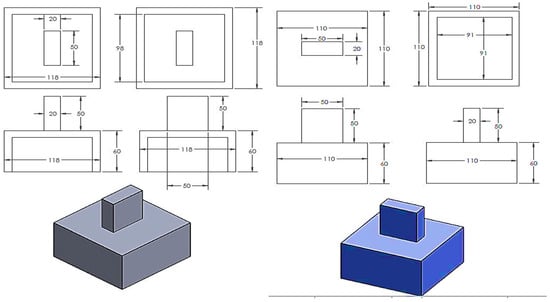
Figure 7.
Rubber1 and Rubber2 testing molds.
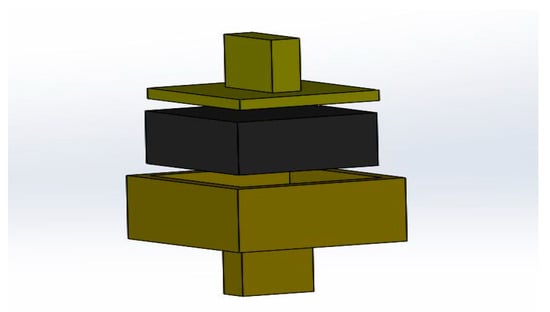
Figure 8.
Rubber testing setup.
After the rubber samples were prepared, they were subjected to the volumetric compression test, as can be seen in Figure 9. The test was conducted using a UTM machine with 100 kN capacity. The load was applied at various speeds of 1, 2, 4, and 6 (mm/s) in order to check the effect of the testing speed on the samples. The collected results from the tests are critical for assessing the performance of the RBRB system.
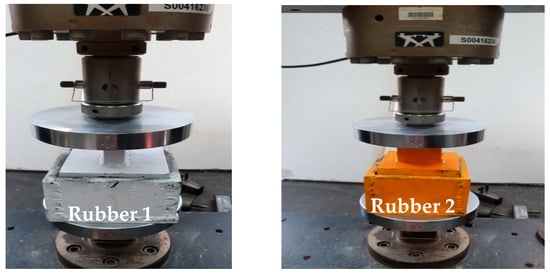
Figure 9.
Rubber testing setup under a compression testing device.
As shown Figure 10, the load did not change significantly up to displacements of 13 mm for the 91 mm sample and 15 mm for the 98 mm sample. This was followed by a considerable linear increase in load, reaching 98 kN at 3 mm displacement. At this point, the test had to be stopped due to the UTM machine’s load limitation of 100 kN.
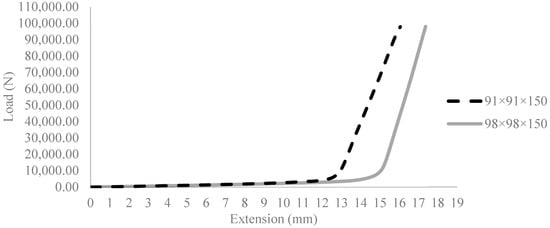
Figure 10.
Rubber samples’ load displacement curves.
The results in Table 2 indicate that the rubber length only affected the deformation, while the stiffness of the device remained unaffected by the length of the rubber. Young’s modulus of the rubber was calculated to be 100 N/mm2, with maximum compressive strength values of 11.8 MPa and 10.2 MPa for the 91 mm and 98 mm samples, respectively.
Table 2.
Rubber samples’ compression test result.
In the RBRB system, the displacement and stiffness of the device depend on the volume and hardness of the rubber blocks. The rubber test results specify the exact behavior of the selected rubbers, confirming the assumption that using rubber is an effective material to enhance BRB performance. The rubber compression test results demonstrated its strength under compression, which complemented the steel’s resistance force during tension and compression when they work in parallel. Figure 10 shows the rubber samples’ load displacement curves.
3.3. Concrete Component Design
As previously mentioned, this study proposes a new design for the BRB system to enhance its vibration dissipation capacity under severe vibrations by incorporating concrete filler as a primary load-bearing component. Ultra-High-Performance Fiber-Reinforced Concrete (UHPFRC) was selected as the construction material for the RBRB due to its superior strength and flexibility. Numerous analytical and experimental research works have been conducted, and various design equations have been proposed since the early stages of development [84].
UHPFRC Mix Design and Material Properties
The mix design used in this research was UHPFRC premix as a dry concrete. This advanced Ultra-High-Performance Concrete material is suitable for use as precast elements. Notably, UHPFRC does not contain coarse aggregates, allowing it to achieve compressive strengths beyond 150 MPa (Figure 11). Its unique blend of steel fibers and cementitious binders, combined with low water content, provides exceptional characteristics, including high compressive and flexural strengths, ductility, and durability.
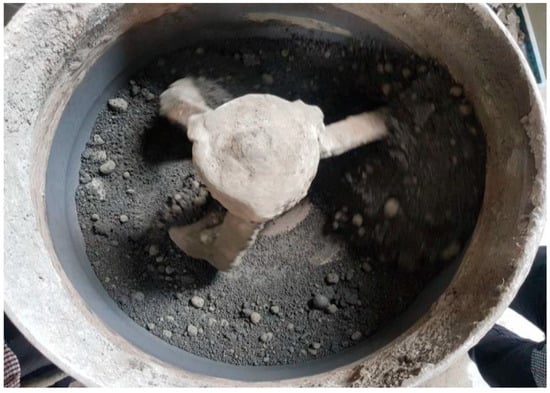
Figure 11.
Dried concrete in the mixer.
The UHPFRC mixture is a homogeneous cementitious composite that primarily contains fine aggregates, enabling it to achieve compressive strengths exceeding 150 MPa. The proportions of the materials used in the mix are shown in Table 3.
Table 3.
Material properties of UHPFRC.
In this study, copper-coated micro straight steel fibers were used as a composite material in UHPFRC at a volume of 1.0%. The copper-coated hooked-end steel fibers have a tensile strength of more than 2500 MPa, with a diameter of 0.3 ± 0.05 mm and a length of 25 ± 1 mm. Figure 12 shows the fiber material used in the UHPFRC matrix.
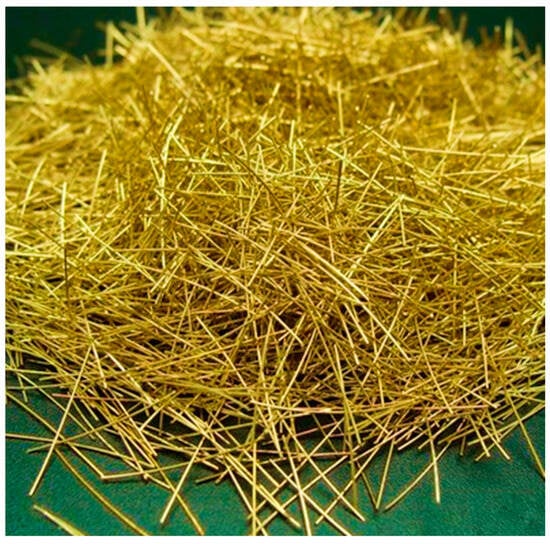
Figure 12.
Fiber material used in the UHPFRC matrix.
Each cubic meter of UHPFRC contains at least 120 kg of steel fibers, which is equivalent to 480 km of steel wire and 24 million pieces of discrete fibers.
Compressive strength tests were conducted on cubes in accordance with BS EN 12390 Part 3 (British Standards Institute, 2009 c) [85]. The curing periods of 7, 14, 21, and 28 days were considered for the UHPFRC specimens to evaluate their compressive strength. Figure 13 shows the compressive stress testing setup and results for cube specimens. The compressive strength of UHPFRC was significantly higher compared to grade-40 concrete, reaching a maximum strength of 167 MPa in 28 days. The average strength of the samples at 28 days was 151 MPa, confirming the design strength of the UHPFRC concrete used. Throughout the curing periods, the UHPFRC specimens exhibited elastic behavior up to 90–95% of their compressive strength, followed by strain hardening to the peak strength.
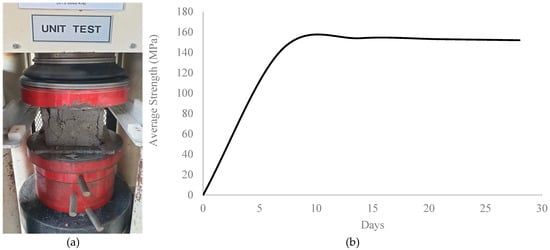
Figure 13.
UHPFRC testing setup and result. (a) Compressive strength cube test. (b) Average strength of UHPFRC.
4. Fabrication of RBRB
Based on the pre-designed experimental results of material, a RBRB prototype has been fabricated. The fabrication of the RBRB prototype involves 11 steps, as shown in Figure 14: (1) providing steel material such as steel plates and hollow section, (2) cutting the assumed steel core dimensions and supports for steel core sections, (3) preparing a steel tube restrainer from the steel hollow section, (4) welding the core element to support plates, (5) covering the steel core with cardboard, (6) cutting the rubber components, (7) casting the UHPFRC inside the half steel tube restrainer, (8) grinding and leveling the concrete surface after 28 days, (9) inserting rubber components, (10) fastening the BRB device by putting the core element inside the steel tube restrainers, and (11) assembling and attaching the RBRB in a dynamic actuator setup frame.
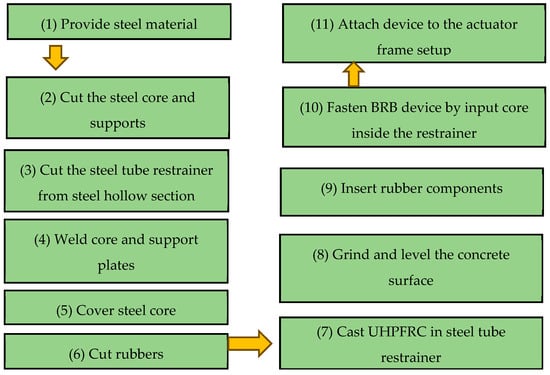
Figure 14.
RBRB fabrication steps.
Table 4 represents the details and specifications of the RBRB model. It consists of a 300 mm2 core with a total length of 1500 mm. The RBRB dimensions can be seen in Figure 15.
Table 4.
RBRB dimensions.
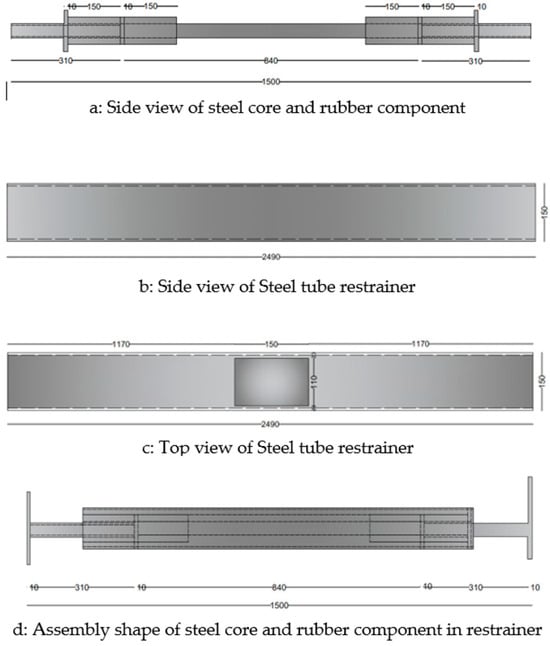
Figure 15.
RBRB dimensions and model. (a) Side view of steel core and rubber component. (b) Side view of steel tube restrainer. (c) Top view of steel tube restrainer. (d) Assembly shape of steel core and rubber component in restrainer.
All steel components of RBRB have been manufactured based on the initial design details. As shown in Figure 16, the steel core segment was covered with 2 mm-thick cardboard to create a sufficient gap, allowing the steel core to slide smoothly inside the concrete during testing. Additionally, plastic foam was used to create gaps within the concrete for the insertion of rubber blocks after casting.
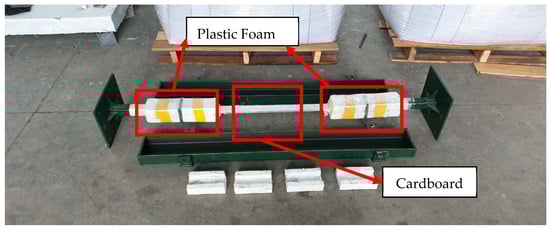
Figure 16.
RBRB steel components and covers.
The UHPFRC concrete, as specified in Table 4, was utilized for molding in the RBRB. The procedure started by pouring the concrete into one-half of the steel tube restrainer, followed by positioning the steel core, wrapped in cardboard, within the fresh concrete to create the intended gap for the core element. The same process was repeated for the other half section. Figure 17 and Figure 18 depict the molded concrete prior to surface grinding and leveling. To ensure maximum strength, the molded concrete was covered with a plastic sheet, as UHPFRC requires a 28-day curing period.
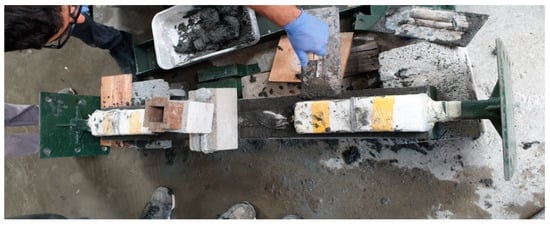
Figure 17.
RBRB steel tube restrainer gap forming.
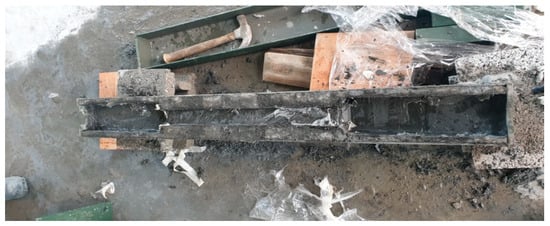
Figure 18.
RBRB steel tube restrained cast concrete.
After a 28-day curing period, the concrete surface was ground and leveled to facilitate the insertion of the core, as shown in Figure 19. A grinding machine was used to smooth the concrete surface, ensuring seamless sliding of the steel core within the concrete during the device’s operation.
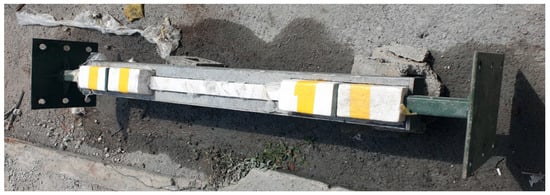
Figure 19.
RBRB-leveled concrete in steel tube restrainer.
After preparing the concrete surface, the steel core was reinserted into the steel tube restrainer. The two half sections were then aligned and stacked together, followed by assembling the device to evaluate the assembly’s efficiency and the steel core’s movement, as illustrated in Figure 20.
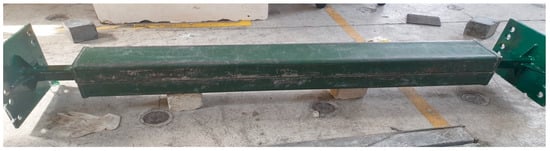
Figure 20.
Prepared RBRB prototype.
Following the successful testing of the core’s smooth movement, the prototype was dismantled and moved to the testing actuator frame setup. To achieve this, one-half of the steel restrainer, along with the steel core, was mounted in the frame setup by bolting the steel core’s support heads to the supports, forming a fixed joint. The opposite end was attached to the dynamic actuator head to transmit the actuator’s motion to the steel core and the RBRB device, as shown in Figure 21.
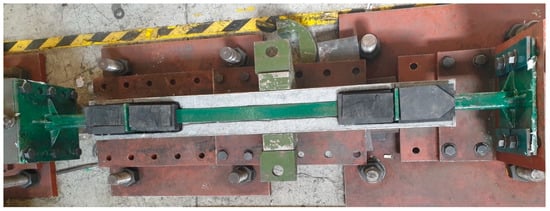
Figure 21.
RBRB installation in test setup.
Strain gauges were subsequently installed on the surface of the steel core and the concrete component at the center, as well as both ends, to monitor the strains of these components during testing. The positions of the strain gauges are illustrated in Figure 22.
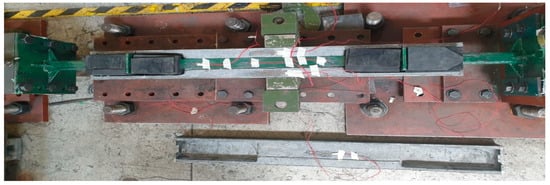
Figure 22.
RBRB strain gauge location.
Once the strain gauges were installed, the prototype was assembled by aligning both halves of the steel tube restrainer and fastening them with two steel belts. To minimize and restrict any out-of-plane movement during compression, an extra belt was added at the center of the device. The RBRB prototype was then positioned in a horizontal alignment with the support and actuator head, as depicted in Figure 23, completing the RBRB testing setup.
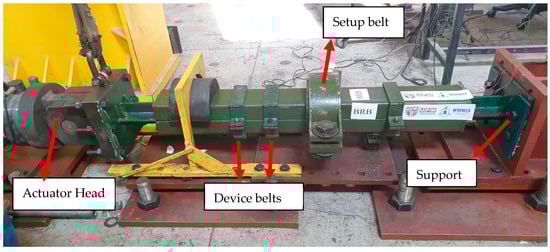
Figure 23.
Full setup of RBRB.
The absolute linear displacement of the RBRB prototype during testing was measured using Linear Voltage Displacement Transducers (LVDTs) connected to a data logger (model: UCAM 60 Kyowa) for data recording. To monitor the displacement, two LVDTs were positioned on either side of the actuator head connector, as illustrated in Figure 24. The outer LVDT measured the compression displacement, while the inner LVDT recorded the tension displacement throughout the testing process.
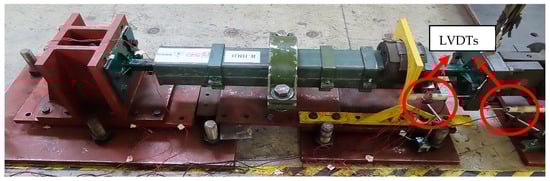
Figure 24.
RBRB LVDTs’ position.
5. Fabrication of BRB
The fabrication of the BRB followed the same steps as the RBRB assembly process, with the steel core length ratio of the plastic and elastic sections being similar. Table 5 presents the details and specifications of the BRB prototype, which consists of a 300 mm2 core with a total length of 1500 mm. The dimensions of the BRB are provided in Figure 25.
Table 5.
BRB dimension specifications.
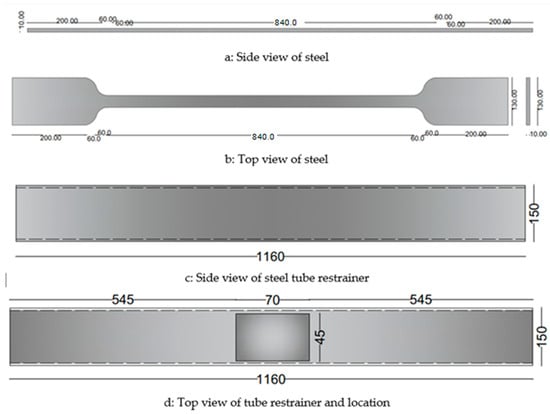
Figure 25.
BRB size and dimensions. (a) Side view of steel core. (b) Top view of steel core. (c) Side view of steel tube restrainer. (d) Top view of tube restrainer and location hole for pouring concrete.
The procedures for casting, curing, and assembling the RBRB in the testing setup frame followed the same steps as those for the BRB. The complete testing setup and dimensions for the RBRB are shown in Figure 26.
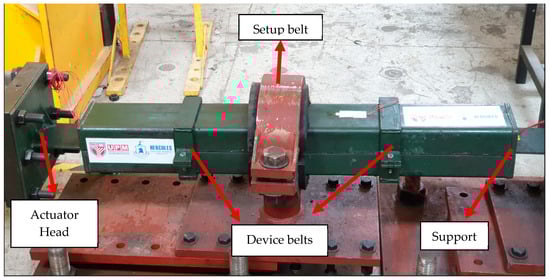
Figure 26.
Completed setup of BRB.
6. BRB and RBRB Experimental and Hysteresis Response Results
To evaluate the behavior of BRB and RBRB under cyclic loading, a displacement control method was used by applying displacement at an amplitude of 1 mm. The displacement was increased gradually by one repetitive loading according to ATC (1996) [86], as illustrated in Figure 27. Force–displacement results, which represent the behavior of the devices, were obtained.
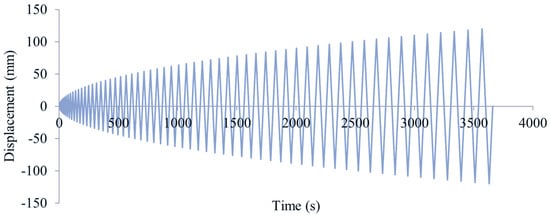
Figure 27.
Cyclic time-displacement amplitude used in the experiment.
6.1. BRB Experimental Results
Data gathered from the testing were analyzed and tabulated. The results of the experimental testing were distributed based on the selected amplitude described in the previous section. The failure stage of the BRB began when the maximum strength reached the strain hardening regime.
Localization of failure in the specimen was observed at its weakest point, where multiple instances of local buckling within the core were combined. This led to significant frequent yielding in the weakest part of the core, ultimately causing the steel core to fail by severing under excessive compression loading.
Figure 28 shows the complete local buckling that occurred during the BRB testing procedure. Figure 29 illustrates the failure stage of the core, which occurred at its weakest point due to reaching the core’s maximum strength capacity.
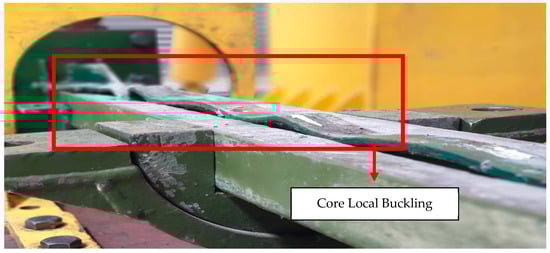
Figure 28.
Local buckling of BRB core.
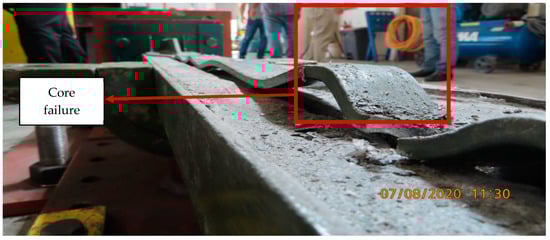
Figure 29.
Failure of BRB core after testing.
The obtained force–displacement relation hysteresis curve for the conventional BRB is shown in Figure 30. As depicted in the graph, the maximum force capacity of the BRB reached 124.93 kN, with 16 mm deformation under tension and 129 kN with 12 mm under compression. Furthermore, the backbone curve was plotted, and polynomial formulations were extracted and are presented in Figure 31.
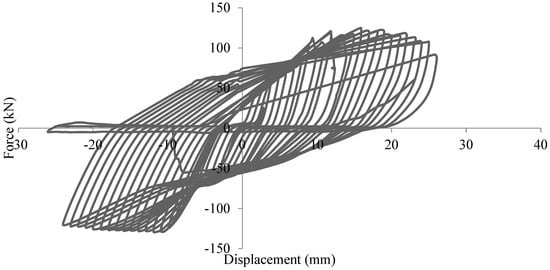
Figure 30.
Hysteresis curve of experimental BRB.
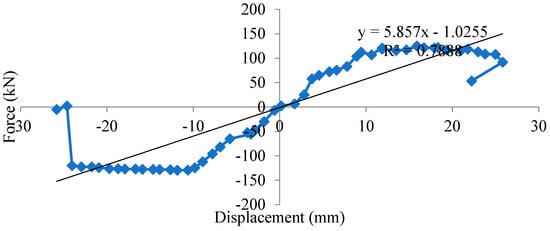
Figure 31.
Backbone curve of experimental BRB.
6.2. RBRB Experimental Results
The failure mode of RBRB was comparable to that of BRB. However, the failure in RBRB occurred within the core with less displacement, attributed to the excessive stiffness and resistance of the rubber components, in contrast to BRB, wherein the test was finished due to failure of the core. RBRB exhibited sustained stability as its rubber blocks continued to resist the applied load. Figure 32 indicates the local buckling in the RBRB core. Figure 33 illustrates the failure stage in the weakest point of the core due to the core reaching maximum strength capacity.
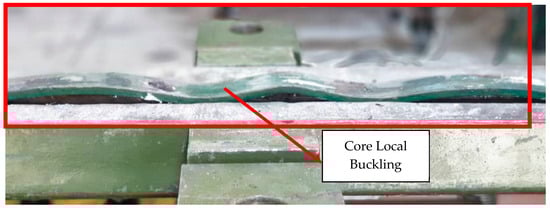
Figure 32.
Local buckling of RBRB core.
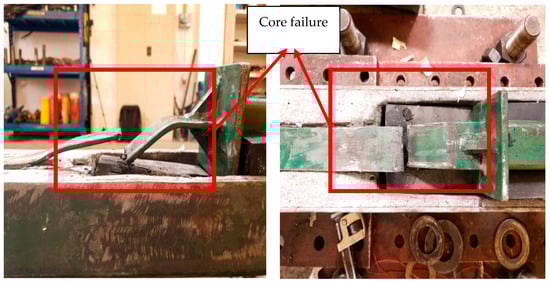
Figure 33.
Core failure of RBRB.
Based on the results shown in Figure 34, the rubber in the test remained completely elastic during and after the testing process, indicating no signs of damage that could compromise its functionality. This characteristic represents a significant advantage compared to BRB systems, where all systems collapsed following core failure.
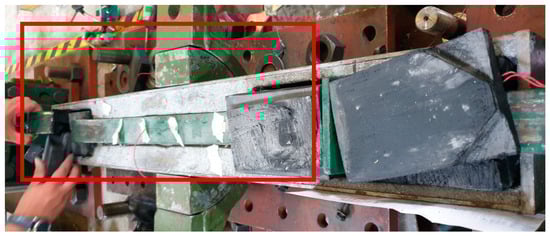
Figure 34.
Core failure and rubber components of RBRB.
The obtained force–displacement relation hysteresis curve for conventional RBRB is shown in Figure 35. The graph shows that the maximum force reached by the BRB was 177 kN (at 8 mm displacement) under tension and 224 kN (at 17 mm displacement) under compression. Additionally, the backbone curve was plotted, and polynomial formulations were derived and are presented in Figure 36. Also, the RBRB results before the failure follow the same BRB kinematic hardening behavior [87] with better performance in terms of increased strength due to the rubber resistance.
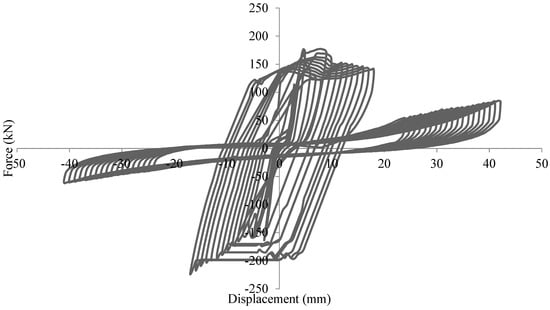
Figure 35.
Hysteresis curve of experimental RBRB.
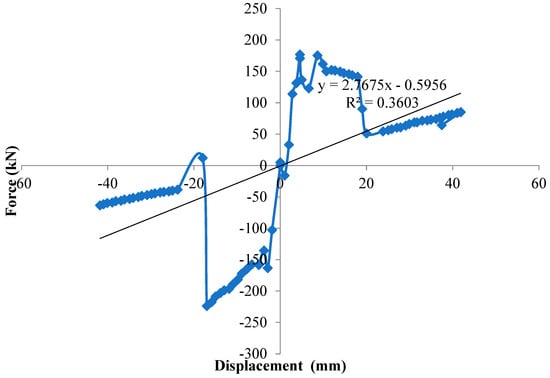
Figure 36.
Full backbone curve of experimental RBRB.
The behavior of the proposed RBRB is discussed in two main phases. Phase 1 shows the behavior of RBRB before failure in the main core, and phase 2 indicates the behavior of the device after core failure. In phase 1, the steel core, rubber components, and concrete were performed in parallel and shared the duty to carry the load. In phase 2, after the plastic core failed by being ruptured, the load-bearing duty was on the rubber components. The load was transferred from the core to steel dividers, then to the rubber components, and finally to the concrete. This process proves the claimed hybrid behavior of the RBRB system.
The phase 1 load–displacement curves are shown in Figure 37. The maximum load and displacement under tension are 177 kN (in 8 mm) and 18 mm, respectively. Under compression, the maximum load was 224 kN, and the maximum displacement reached 17 mm. This behavior was anticipated based on the rubber material test result under volumetric compression, whose strength aids in increasing the steel resistance in load-bearing.
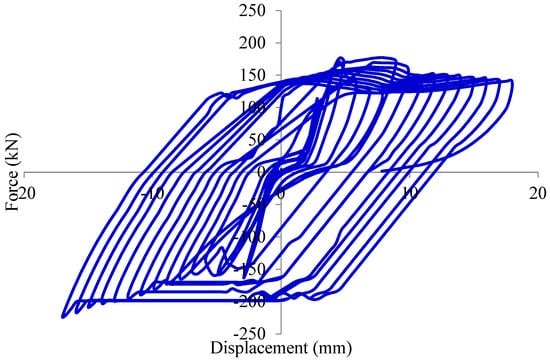
Figure 37.
Hysteresis curve in phase 1 of experimental RBRB.
As shown in Figure 38, on the other hand, in phase 2, the performance is similar to an independent rubber damper and had a perfect linear behavior curve in the load-bearing under cyclic loading, which follows the same behavior of rubber material. It reached a maximum load of 85 kN (42 mm displacement) under tension and 63.5 kN (42 mm displacement) under compression.
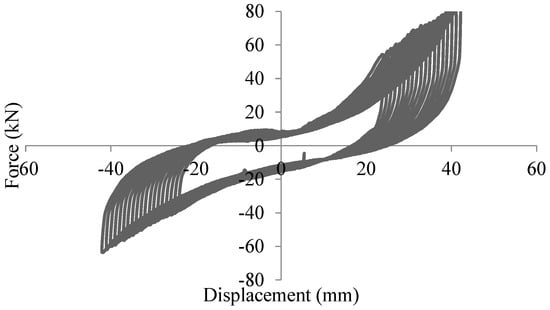
Figure 38.
Hysteresis curve in phase 2 of experimental RBRB.
7. Comparison of BRB and BRBR
In Figure 39, both prototypes’ full performance is shown. RBRBs’ maximum capacity under tension was 177 kN (with 8 mm displacement), and their maximum displacement was 42 mm due to the aforementioned rubber components functioning after the failure of the RBRB core. Under compression, the maximum load was 224 kN (by 17 mm displacement), which had a maximum displacement of 42 mm as well, while the maximum BRB force reached 125 kN (by 16 mm displacement) and its maximum displacement was 26 mm. The comparison results for BRB and RBRB are shown in detail in Table 6 and Figure 40.
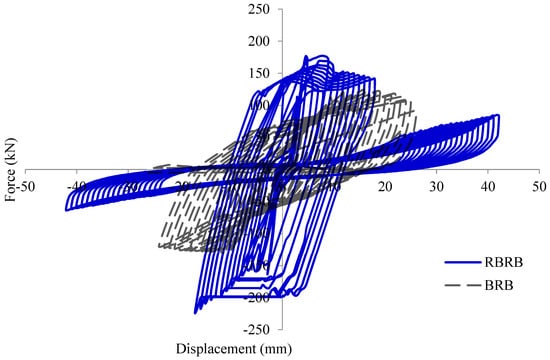
Figure 39.
Comparison of experimental results for full BRB and full RBRB behavior.
Table 6.
Comparison of experimental results for BRB and RBRB.
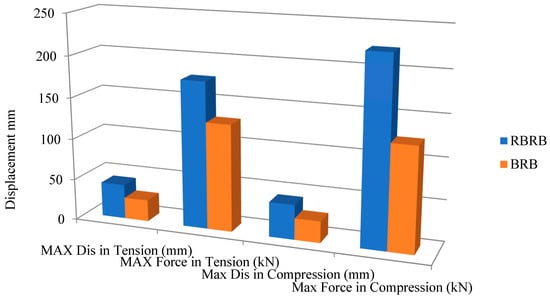
Figure 40.
Comparison of experimental results for BRB and RBRB.
The higher compressive resistance of the RBRB, due to the rubber components, enhances stability by preventing global buckling during high seismic events. While this may slightly affect the dynamic behavior of the structure, the overall performance improvement outweighs these effects. Engineers should consider this behavior during design to ensure optimal load distribution and energy dissipation.
This section presents the calculations for effective damping (Keffb), effective stiffness (φ), and dissipated energy (W) for both BRB and RBRB. The capacity of a structure to withstand earthquakes relies on its ability to dissipate the energy produced by ground motion. Due to the complexity involved in evaluating energy generated from ground motion, it is essential to adopt a structural design approach that ensures that the structure’s energy dissipation exceeds the expected demand.
The amount of energy dissipated by a structural system during seismic overloading is of paramount importance. The energy dissipated in a single hysteresis loop (Wi) is estimated by considering the area enclosed by the hysteresis loop using Equation (2). In Figure 41, Fl(u) and Ful(u) are forces at displacement ‘u’ throughout the loading and unloading process. The summation of the total area enclosed by the hysteresis loop gives the cumulative energy dissipated in the specimen. The damping ratio was also calculated based on BS EN 15129:2009 [88] in Equation (3). The effective stiffness was calculated based on Equation (4), where VEbd is the force corresponding to dbd, obtained at the third load cycle.
Φ = W (dbd)/(2π VEbddbd)
Keffb = VEbd/dbd
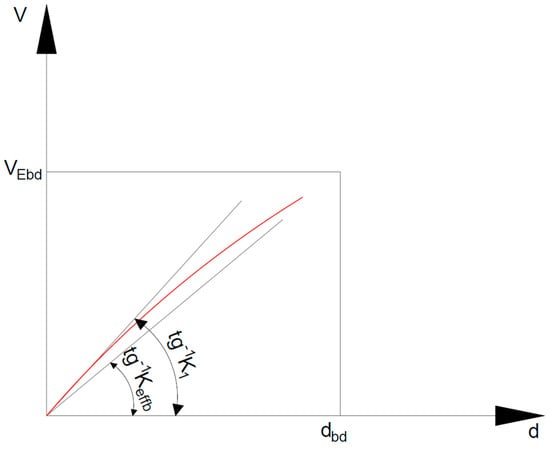
Figure 41.
Effective stiffness equation parameters.
Based on the aforementioned experimental result, it can be seen in the performance of both devices that there was an energy dissipation (the area of hysteresis loop) of 13,416 kN·mm for BRB and 22,459 Kn·mm for full RBRB behavior. The RBRB-dissipated energy was calculated as 13,416 kN·mm before the core failure (in phase 1) and 12,432 kN·mm after the core failure (in phase 2). It is concluded that the energy dissipated by RBRB increased by 41% due to the rubber’s added resistance in comparison to BRB. The damping ratio also was based on BS EN 15129:2009 as shown in Equation (3) [88], and the BRB damped 60.3% of the income force while RBRBs’ damping ratio was 64.8% and 52.1% in phases 1 and 2, respectively. The effective stiffness of both devices has been computed based on Equation (4), where VEbd is the force corresponding to dbd, obtained at the third load cycle. The effective stiffness of BRBR was 14.5 kN/mm and 34 kN/mm for RBRB in phase 1 and 2.2 kN/mm in phase 2. All the calculated values are shown in Figure 42, Figure 43 and Figure 44 and Table 7.
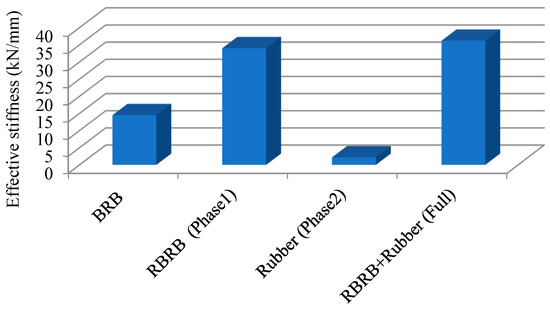
Figure 42.
BRB and RBRB effective stiffness.
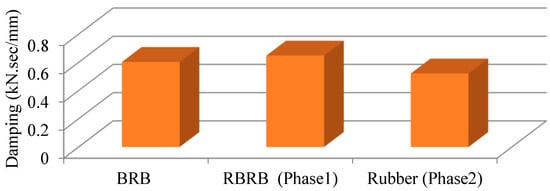
Figure 43.
BRB and RBRB effective damping.
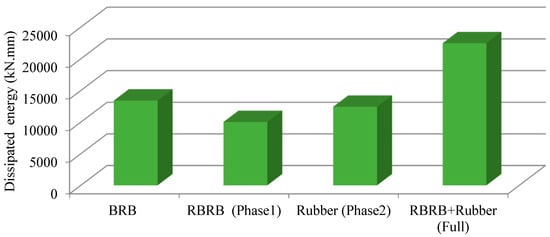
Figure 44.
BRB and RBRB energy dissipation.
Table 7.
Experimental comparison values for BRB and RBRB in effective stiffness, effective damping, and dissipated energy.
Weight Comparison of BRB and RBRB
Comparison between the prototypes’ weights proved that replacing the concrete volume with rubber reduced the weight by 30%, from 80 kg in RBRB to 56 kg in BRB. This weight reduction offers several valuable advantages for structures. This weight reduction can improve the seismic behavior of the structure by decreasing the size of structural elements and also ease the transportation and installation process.
In phase 1, the RBRB operates with both the steel core and rubber components working together to resist lateral forces, which results in higher effective damping (0.648). This phase optimizes energy dissipation and load-bearing capacity. However, as the core begins to fail due to excessive deformation, phase 2 becomes active, where the rubber components take over and continue to resist forces. The effective damping in phase 2 (0.521) is lower because the rubber components, while providing continued resistance, are not as effective at dissipating energy compared to the combined action of the steel core and rubber in phase 1.
- It decreases the total seismic weight of the structure, thereby enhancing its performance level.
- It improves the structure’s performance under P-Delta effects.
- It reduces the weight of the bracing system, leading to smaller structural elements and greater economic efficiency.
- It simplifies transportation and installation procedures.
8. Development of Performance-Based Design Method for Structure Furnished with BRB and RBRB
A prototype building in New York was selected for this study. A site-specific seismic hazard spectrum representing the MCE and DBE shaking intensity was obtained from the seismic guidelines of ASCE 7-16 [89] and adopted in this research (Figure 45).
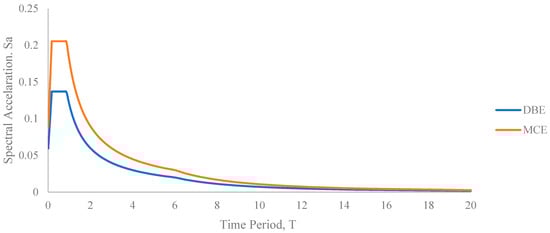
Figure 45.
Design response spectra.
Ground motions were selected from the PEER NGA database and amplitude-scaled as shown in Figure 46 to match the target spectrum. The selected ground motions in Figure 47 had a magnitude between 6.2 and 7.28, the closest distance to the fault was within 30 km (20 mi) (to represent a short-distance earthquake), and the soil shear wave velocity (Vs30) was between 366 and 762 m/s (1200 and 2500 ft/s) in order to obtain various suitable ground motions.
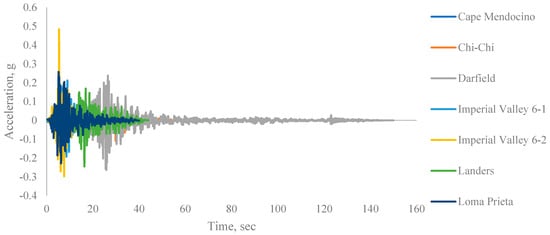
Figure 46.
Scaled seismic records.
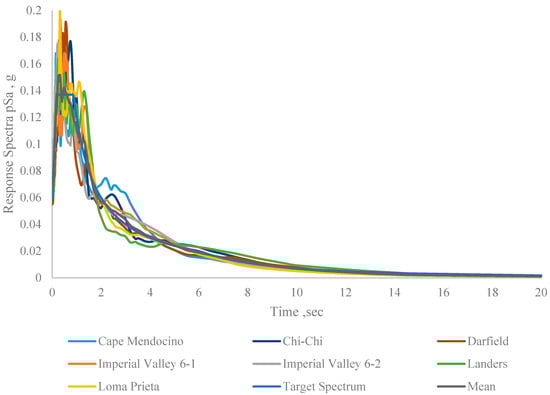
Figure 47.
Scaled response spectra of seven selected accelerations.
The ground motions were then amplitude-scaled using the procedure outlined in ASCE 7 Section 16.1.3.1 [89], where the mean spectrum of the set (seven ground motions) did not fall below the target spectrum by 10% within the period ranging from 0.2 T (0.2 s) to 1.5 T (1.5 s) (T = 1.0 s), which was selected to encompass the higher mode responses, while the longer period was selected to allow for period elongation due to yielding in the system. The earthquake excitation of the two horizontal effects was considered in this Non-Linear Time History (NLTH) study. Scale factors were limited to between 1 and 4 to avoid over-scaling. Table 8 provides a summary of the ground motions selected.
Table 8.
Time history records based on response spectrum.
8.1. Details of Finite Element Model in Macro Numerical Simulation
A well-defined model building was chosen prior to exploring design concepts for both Buckling-Restrained Braces and Rubber Buckling-Restrained Braces. The selected building model was equipped with a BRB and RBRB seismic lateral force-resisting system in each orthogonal direction. The purpose of the model building was to provide sufficient context for the RBRB component for the primary goal of determining brace seismic demand (i.e., axial forces and displacement) and comparing the performance of BRB, RBRB, and a bare frame. In addition, geometric properties are determined, including brace length, brace angle, and a general idea of brace end connections to the BRBF.
8.2. Considered Cases for Modeling
Figure 48 and Figure 49 indicate the schematic of how RBRB is implemented in the structure and its function under tension and compression loading.
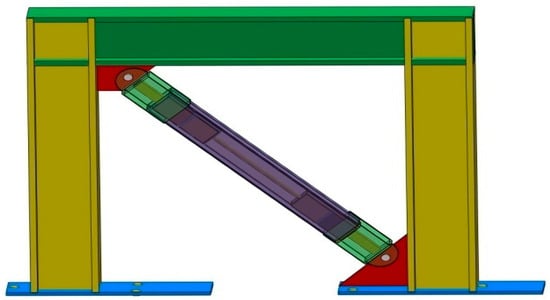
Figure 48.
Schematic of implemented RBRB in the structure.
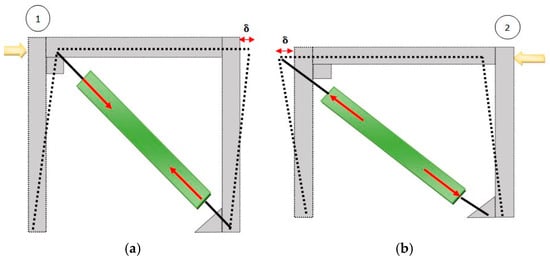
Figure 49.
(a) RBRBF under compression; (b) RBRBF under tension.
The steel structural plan was used to investigate the seismic response with the conventional BRB and proposed RBRB. The plan, which is symmetrical, was employed to observe the varying story drift and displacement. The number of bays in the X and Y-directions is not the same in the building; it has three bays in the X-direction and five bays in the Y-direction. All column sizes and beam sizes are assumed to be the same throughout all stories of the building, and the supports are pinned. The model was generated in commercial software ETABS v18.0.0. Pushover and time history analyses were performed for the buildings. Three different cases have been considered for this study to make a comprehensive comparison between the models in order to check the effect of bracing systems on the behavior of the building under seismic loads. Models have been made with a bare frame (without implementing any type of brace), BRBFs, and RBRBFs. The bracing system has been implemented on all sides of the building, as shown in Figure 50. In the X-direction, the bracing system was implanted as a diagonal mega brace with a length of 7.1589 m inside span, and in the Y-direction, it was implemented as an inverted chevron with a length of 4.1725 m in mid spans.
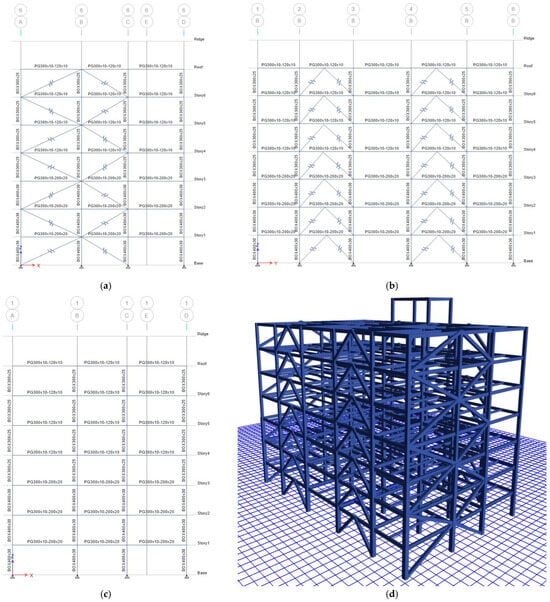
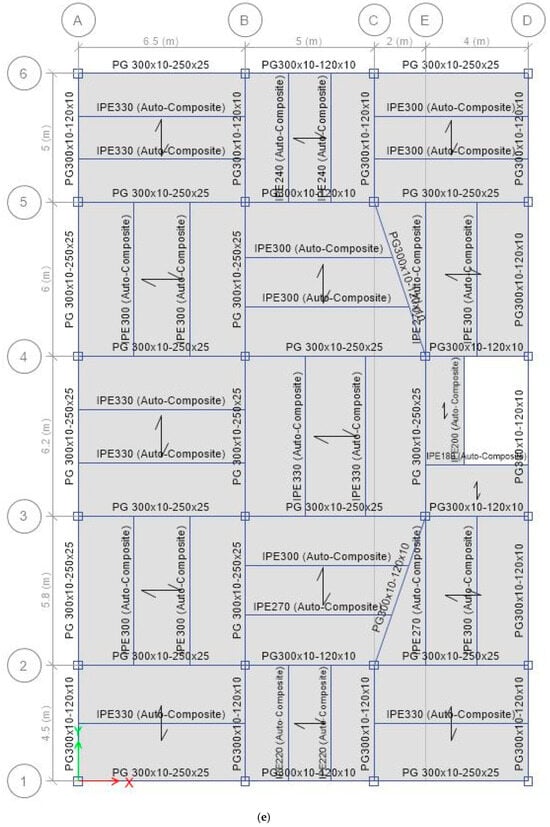
Figure 50.
(a–d) Bracing implementation in the building. (e) Bracing implementation in the building. (a) X-direction. (b) Y-direction. (c) Section sizes, elevation view. (d) Three-dimensional view. (e) Section sizes, plan view.
Seismicity is an essential factor in determining the performance of the building under earthquake loading. For the seven-story steel structure used as a case study, the seismic hazard was evaluated using the following parameters.
Seismic Zone and Location: The building is located in an area with a high seismic risk, as defined by the USGS seismic hazard maps. The region is subject to frequent moderate-to-large-magnitude earthquakes, which require structures to be designed for significant lateral loads.
Seismic Ground Motion: The ground motions were selected from the PEER NGA database, representing various earthquake types and magnitudes. The design utilized both DBE (Design Basis Earthquake) and MCE (Maximum Considered Earthquake) ground motions to simulate a range of seismic conditions. The peak ground accelerations (PGA) for these events were scaled to match the site-specific hazard spectrum defined by the building code.
Soil Type: The site is characterized by medium soil conditions (Site Class C) as per the NEHRP classification. The soil properties were taken into account in the dynamic analysis, affecting the building’s response to seismic waves, particularly for higher frequencies.
Seismic Hazard Parameters: The seismic design incorporated the ASCE 7-16 guidelines, which define the seismic hazard through probabilistic seismic hazard analysis (PSHA). The study considered different return periods for the earthquake events: a 2475-year event for the MCE and a 475-year event for the DBE.
Seismic Design Procedure: The building was designed according to the performance-based seismic design (PBSD) methodology, which aims to ensure that the structure performs well under both moderate and extreme earthquake events, while minimizing the risk of collapse or significant damage.
Table 9 shows the details of the considered building for investigation in this study.
Table 9.
Considered case details.
8.3. Considered Loading for Modeling
Table 10 presents the loads considered for designing the frames. The loads are considered using material properties as well as the dimensions of the elements.
Table 10.
Load types.
The seismic design data assumed for a bare frame (IMRF) and braced frame (SMF) are shown in Table 11.
Table 11.
Bare and BRB frame design parameters.
BRB and RBRB were designed as link elements by considering the non-linear behavior of the extracted result. The exact behavior of the device was defined as link property data by selecting the link type as multi-linear combined kinematic isotropic plastic with non-linear axial properties. The non-linear mechanics of this link element are driven by hysteresis backbone data derived from qualification testing and respective material testing.
By constructing the model and generating time histories, a non-linear analysis was run. A conservative modal load case was defined using 40 Ritz vectors to capture the appropriate degrees of freedom. This modal load case accounted for acceleration in the X-direction and Y-direction as well as dead load in the Z-direction.
The mass used in the analysis was generated by the individual elements. Seven selected ground motion accelerations determined in the previous section were applied as an input acceleration in the X and Y-directions by using the modal Ritz case damped at 5%, which is a typical damping value for the first natural frequency. In Figure 51 and Table 12, the BRB sections, material, inelastic properties, and backbone curve are shown.
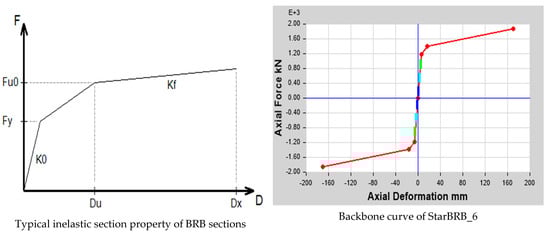
Figure 51.
BRB-6 properties.
Table 12.
Material and inelastic section properties parameters of BRBs.
8.4. Story Displacement Response
Story displacement is described as the story’s total displacement toward ground level. The maximum story displacement value was obtained at the top story, which is highlighted in the table, as well as for all three models under unique DBE and MCE level TH records in the X and Y-directions, which are within the maximum permissible limit drift and deformation per the ASCE/SEI 7-10 (2010) provision.
9. Results and Performance Evaluation
The seismic behavior of the aforementioned building with a bare frame and furnished by BRB and RBRB was studied by time-history and pushover analysis. It should be mentioned that the Ridge level displacement is included in the table for more accurate information; however, based on the ASCE code, if the Ridge does not have 20% of the last level weight, it should not be included in the calculations.
The lateral response of each TH record based on the DBE and MCE hazardous level in both the X and Y-directions shows that a structure furnished with both BRB and RBRB performed well under TH records. As shown in Table 13 and Figure 52A, the maximum story lateral displacement, implemented at the BRB and DBE levels, was reduced by 82.89% and reached 88.75% by using RBRB in the Cape Medocino TH record. The results show the advantage of RBRB due to hyper-elastic rubber behavior, which increases energy absorption and results in 41.28% more reduction in the structure compared to the BRB system. Similarly, implementing BRB and RBRB, the lateral displacement of stories was reduced between 75.47% and 84.11% in a MCE hazardous level, respectively, as illustrated in Table 14 and Figure 52B. The same trend with DBE shows that implementing RBRB enhanced the structure performance by 42.71% more than BRB.
Table 13.
Maximum story displacement based on DBE in X-direction.
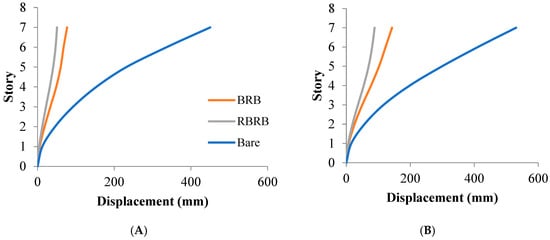
Figure 52.
Maximum story displacement. (A) DBE TH Cape Mendocino in X-direction. (B) MCE TH Cape Mendocino in Y-direction.
Table 14.
Maximum story displacement based on MCE in X-direction.
9.1. Inter-Story Drift Response
The drift ratio between the stories is calculated as the proportion of the inter-story displacement at a certain point in the study frame to the respective story height. Table 15 and Table 16 represent the variation and comparison of story drift responses of the study frames in bare, BRB, and RBRB models through DBE and MCE TH records in the X and Y-directions. The maximum story drift is found in the intermediate fifth story for braced frames, which is lower than the permissible drift limit of 2% as given in ASCE/SEI 7-10 (2010). It is also observed that the bare frame has almost 70.18% and 85.31% more drift compared to BRB and RBRB in the abovementioned story (in Darfield TH record), as shown in Figure 53, respectively, which is unacceptable based on ASCE code. Hence, all BRBFs and RBRBFs exhibited acceptable overall performance under DBE and MCE-level ground motions.
Table 15.
Maximum inter-story drift ratio based on DBE in X-direction.
Table 16.
Maximum inter-story drift ratio based on DBE in X-direction.
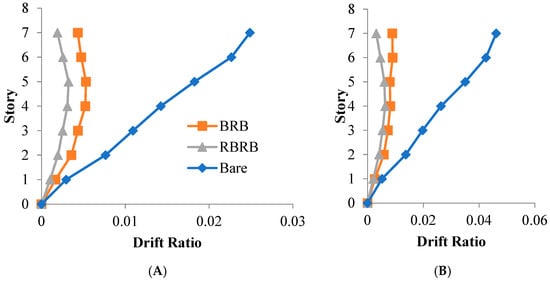
Figure 53.
Maximum inter-story drift. (A) DBE TH Darfield in X-direction. (B) MCE TH Darfield in X-direction.
It has to be mentioned that implementing RBRBs causes the structure performance to have 67.9% less drift compared to BRB due to the aforementioned added resistance of high-performance rubber.
9.2. Base Shear Response
The base shear factor measures an estimation of the maximum possible lateral force related to seismic activity on the foundation. Base shear value is calculated by a combination of various physical factors such as site condition, geological faults, probability of seismic ground motion, ductility level, etc. Base shear directly depends on the input of seismic acceleration. In order to study the effects of RBRB on the base shear of buildings, the base shear with respect to time was investigated through DBE and MCE-level TH records in the X and Y-directions. Table 17 demonstrates the contrast of base shear responses through analysis frames for all time histories. The maximum base shear response observed in the bare frame was 1460 kN (by 7.07 s), whereas the consistent value for the BRBFs reported 2335 kN (by 7.405 s) and 3046 kN (by 7.265 s) in RBRBFs in Imperial Valley1 under a MCE hazard level in Y-direction (Figure 54). Similarly, under other ground motions, it was found that the overall response of having RBRBFs is resistance to maximum base shear, and that it reached its peak.
Table 17.
Maximum base shear force in MCE level in Y-direction.
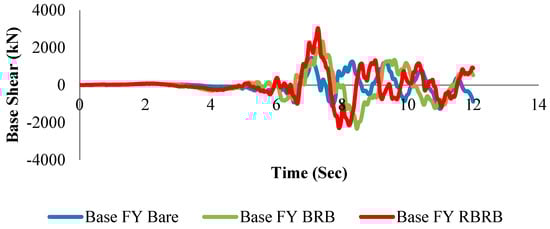
Figure 54.
Maximum base shear of MCE TH Imperial Valley1 in Y-direction.
9.3. Top-Story Displacement
Seismic damage has a straight relationship to displacement or deformation. The results for top-story displacements were obtained from the maximum values for each corresponding ground motion’s time history.
The results of top-story displacements emphasized the effectiveness of applying the seven selected unique ground motions to obtain an overall representative dynamic structural response. For the RBRBFs models, the average displacement value was 72.46% less than the greatest dynamic value of a bare frame; however, the amplitude cycle of reduction was dramatically changed having RBRBFs, which was doubled. The average reduction of roof displacement for the BRBFs was about 80.6%, which is much lower than the peak response reduction range of bare frames. This shows an improvement of 34.68% in top-story displacement by implementing RBRB instead of BRB.
The absolute greatest dynamic value of the top-story displacement response was generated by TH Chi-Chi and Cape Mendocino under a MCE seismic level in the X-direction. The displacement was 568.66 mm, which decreased to 139.482 mm and 90.383 mm for BRBFs and RBRBFs, respectively (Figure 55). This variation was due to the decreased building period as a result of the installation of BRB and RBRB devices. Meanwhile, the fundamental period was determined 6.323 s for the existing bare frame, whereas for the BRB and RBRB frames was 2.146 s and 1.07 s. It was presented that RBRBF configuration took the maximum lateral load with less peak displacement and fundamental period among all models.
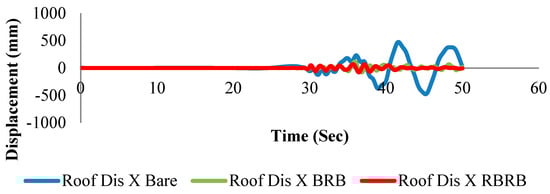
Figure 55.
Top-story displacement of MCE TH Chi-Chi in X-direction.
Table 18 indicates the comparison of maximum differences through bare frame, BRBF, and RBRBF configurations for TH motions. However, other earthquake records also provided similar trends of percentages to present an overall scenario. Mostly, the results indicate that RBRBFs provide better safety for the structure in comparison to BRBFs due to the added resistance to the system by its rubber components.
Table 18.
Maximum result differences for bare, BRBF, and RBRBF configurations.
9.4. Performance Evaluation
Hysteresis energy dissipation and the state of hinge formation with a level of acceptance are measured to perform performance evaluations subjected to earthquakes through a finite element simulation.
9.4.1. Hysteresis Energy Dissipation
Seismic energy is one of the important factors for the performance evaluation of a structure. With the assessment of the seismic response of the frames, the seismic energy content is affected by structural period and high amplitude pulse period for vibrations over a duration of 0.005 s to 0.02 s, and the vibration amplitude declines with time for a damping ratio of 0.05.
By comparing all TH energy that was dissipated, it can be observed that the structural frame was elastically deformed at first, and there was no hysteresis energy generated by any bare and braced frames. After the first few steps, the structure started to dissipate the incoming energy gradually. In all TH records, the energy dissipated by RBRBFs was higher than bare frame and BRBF models. This demonstrates that RBRBFs’ higher ductility caused the structure to consume incoming energy earlier than others. RBRBs as hysteretic dampers dissipated a significant portion of input energy with the aid of their rubber components. Therefore, the beams and columns were not damaged significantly.
In order to make a comprehensive comparison, the Chi-Chi TH record under a MCE hazard level was selected to investigate the results. It can be clearly seen from Figure 56 that no hysteresis energy was governed until 0–29.2 s in the BRBF, RBRBF, and bare frame models. Subsequently, the energy started to dissipate between 29.2 and 32.525 s, which reached 59.01, 81.85, and 198.36 kN-m for the bare, BRB, and RBRB frames, respectively. This indicates a four times increase in the energy dissipated by the RBRB system. The maximum energy dissipated by the bare frame model was 347.43 kN-m, while BRBF reached 367.55 kN·mm. The RBRB system dissipated 505.14 kN-m, which is 37.43% more than the BRBF. It should be mentioned that this trend has been repeated for other records, similarly.
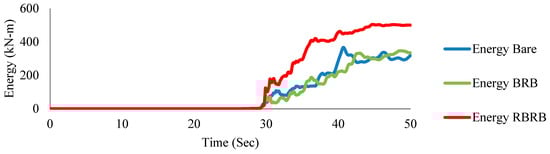
Figure 56.
Dissipated energy under MCE in Chi-Chi TH.
9.4.2. Hinge Formation Results in Structural Pushover Analysis
A plastic hinge zone is where the accumulation of inelastic deformation occurs. Most external input energy usually dissipates through continuous deformation of the plastic hinges in BRBs, RBRBs, and steel members. Therefore, the plastic hinge zone is critical, influencing the steel members of load-carrying, inelastic deformation, and energy dissipation capacity. Individually, plastic hinges are designed as a hinge with a discrete point. All deformation of materials, whether it is displacement or rotation, happens within the point of the hinge.
For DBE and MCE hazard levels in the X and Y-directions, the plastic hinging in various members is observed to be formed first in braces, beams, and columns. Table 19 summarizes the plastic hinges formed under DBE and MCE-level earthquakes of bare, BRBF, and RBRBF configurations. As illustrated in the table, implementing a bracing system reduces the target displacement sufficiently and increases base shear slightly. For instance, in a DBE hazard level in the Y-direction, the target displacement decreases by 10.76 percent for BRBRF and 33.73 percent for RBRBF, and the same trend has happened in the other three cases.
Table 19.
Pushover analysis results for DBE and MCE hazard level in X and Y-directions.
By comparison of the data collected from the results, it appears that the maximum number for BRB bracing failure under a MCE hazard level due to excessive loading was 37 out of 84 (44%). This number for RBRBs was only 9 out of 84 (10%), which improved its resistance and perfect behavior in load-bearing during various earthquake records. It shows the advantage of implementing RBRBs in the structure, which increases the capacity of the structure and mitigates the need for repairing or changing the braces after a severe earthquake simultaneously.
Based on the ASCE code, the overall building response and the structural components should fulfill the “Life Safety” performance level at the DBE level and “Collapse Prevention” performance level at the MCE level. Figure 57 indicates the overall process of plastic hinges formed in bare frames, BRBFs, and RBRBFs.
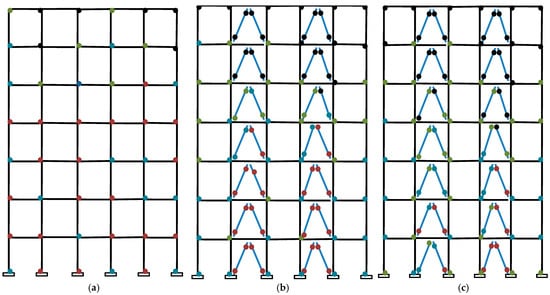
Figure 57.
Plastic hinge formation. (a) Bare frame, (b) BRB frame, and (c) RBRB frame (MCE). Gray (A-IO), Green (IO-LS), Blue (LS-CP), Red CP.
Table 20 and Table 21, as well as Figure 58 and Figure 59, indicate that about 45% of the hinges in a bare frame are more than life safety and are not able to fulfill the performance level. By implementing the BRB system, this amount is reduced by about 30% and reaches roughly 10%. The RBRB system illustrates a superior improvement among all; it decreases the percentage of unacceptable hinges to less than 1%. Similarly, Table 22 and Table 23 and Figure 60 and Figure 61 indicate the advantage of using a bracing system by making an enormous difference in reducing unacceptable plastic hinges under a MCE hazard level. BRBs reduce the number of plastic hinges for collapse prevention to less than 2%, and RBRBs declined it to less than 1%.
Table 20.
Plastic hinge status in DBE-hazard-level X-direction.
Table 21.
Plastic hinge status in DBE-hazard-level Y-direction.
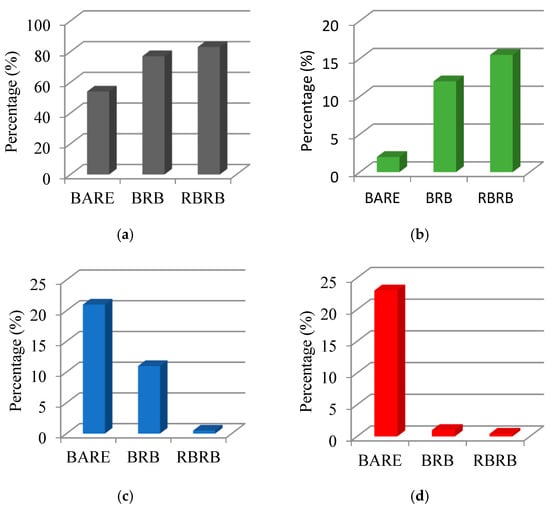
Figure 58.
Plastic hinge status in DBE-hazard-level X-direction. (a) Percentage of plastic hinges formed in A-IO. (b) Percentage of plastic hinges formed in IO-LS. (c) Percentage of plastic hinges formed in LS-CP. (d) Percentage of plastic hinges formed in >CP.
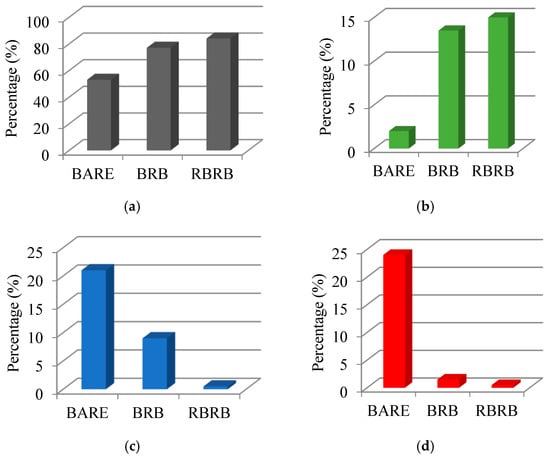
Figure 59.
Plastic hinge status in DBE-hazard-level Y-direction. (a) Percentage of plastic hinges formed in A-IO. (b) Percentage of plastic hinges formed in IO-LS. (c) Percentage of plastic hinges formed in LS-CP. (d) Percentage of plastic hinges formed in >CP.
Table 22.
Plastic hinge status in MCE-hazard-level X-direction.
Table 23.
Plastic hinge status in MCE-hazard-level Y-direction.
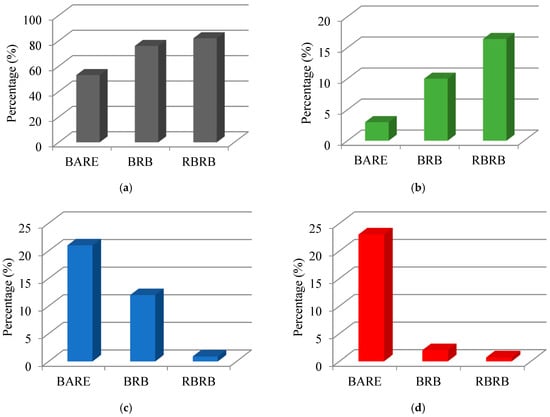
Figure 60.
Plastic hinge status in MCE-hazard-level X-direction. (a) Percentage of plastic hinges formed in A-IO. (b) Percentage of plastic hinges formed in IO-LS. (c) Percentage of plastic hinges formed in LS-CP. (d) Percentage of plastic hinges formed in >CP.
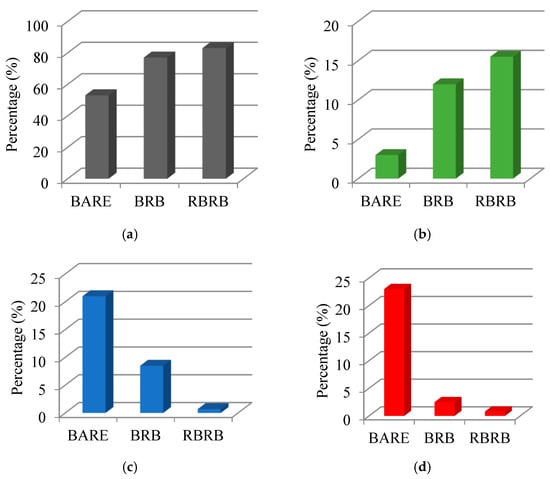
Figure 61.
Plastic hinge status in MCE-hazard-level Y-direction. (a) Percentage of plastic hinges formed in A-IO. (b) Percentage of plastic hinges formed in IO-LS. (c) Percentage of plastic hinges formed in LS-CP. (d) Percentage of plastic hinges formed in >CP.
10. Cumulative Plastic Deformation (CPD)
Cumulative Plastic Deformation (CPD) capacity is a critical parameter for Buckling-Restrained Braces (BRBs), indicating the total plastic deformation a BRB can endure before fracturing. Accurately predicting CPD capacity is essential for ensuring the reliability and safety of structures employing BRBs. Factors affecting Cumulative Plastic Deformation include material properties (e.g., elastic modulus, yield strength), structural geometry (e.g., slenderness ratio, cross-sectional shape), loading conditions (e.g., intensity, frequency, and type of loading), and environmental factors (e.g., temperature, corrosion conditions), all of which can either amplify or limit the accumulation of plastic deformation.
To determine the Cumulative Plastic Deformation (CPD), the hysteretic response of the considered Buckling-Restrained Brace (BRB) (or RBRB in this study) can be used. The CPD is then calculated as the cumulative sum of the plastic deformations across all load cycles.
Plastic deformation is defined as the residual deformation that remains unrecovered after the load is removed. In Equation (5) For the i(Pull) half-load cycle, the plastic deformation (Δp) is calculated as the difference in deformation at zero force at the start (Δi(Push)) and end (Δi(Pull)) of the half cycle:
Δp = ∣Δi(Pull) − Δi(Push)∣
Equation (6) shows that the total CPD is the summation of plastic deformations across all half cycles:
To facilitate comparisons with seismic code requirements, Equation (7) shows that the CPD is normalized by the yield deformation of the BRB (Δy,BRB) to obtain the CPD ratio (CPDR):
The plastic deformation of BRB is shown in Figure 62, wherein Δt is tension displacement, Δc is compression displacement, and Δi is iteration displacement.
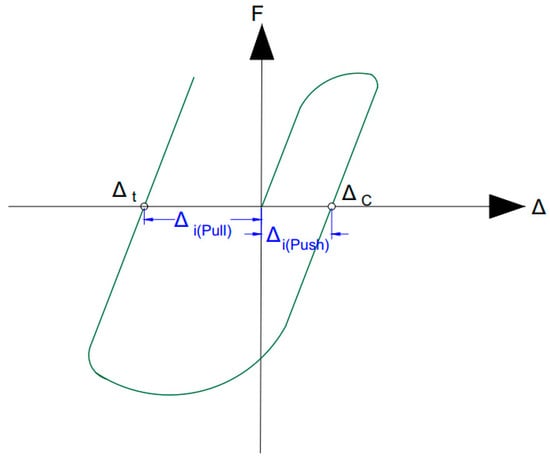
Figure 62.
Plastic deformation of BRB.
The CPDR calculated for the considered BRBs and RBRBs in this study was 470 and 780, respectively, and we compared these results with previous research available in the literature, as reported in Table 24.
Table 24.
CPDR results compared with previous research.
The CPDR results in this study (470 for BRB and 780 for RBRB) indicate a significant plastic deformation capacity for both brace configurations, with the RBRB demonstrating a substantially higher ability to withstand cumulative inelastic deformations compared to the standard BRB. This superior performance suggests that the RBRB is better suited for applications requiring enhanced energy dissipation and higher deformation tolerance under cyclic loading, such as in seismic conditions. Compared to other studies, the CPDR values for the BRB and RBRB exceed those reported by Xie et al. (2019) (~600), Rahai et al. (2007) (17.64), and Tong et al. (2020) (16.6), while aligning with Gao et al. (2024) (200–600). The displacement range in this study (−25 to +25 mm for BRB and −40 to +40 mm for RBRB) surpasses those in prior research, such as Xie et al. and Gao et al. (−10 to +10 mm), Rahai et al. (−6 to +6 mm), and Tong et al. (−3 to +3 mm), reflecting the higher deformation capacity of the tested braces. Furthermore, despite having a smaller cross-sectional area (2000 mm2) compared to Xie et al. (3731 mm2) and Rahai et al. (6361 mm2), the BRB and RBRB configurations in this study demonstrate superior CPDR performance, emphasizing their efficiency and potential for improved structural resilience and durability in extreme loading scenarios.
11. Conclusions
In this study, a prototype of the Rubber Buckling-Restrained Brace (RBRB) was designed, developed, and manufactured for structures subjected to vibrations. The RBRB employs hyper-elastic rubber between the concrete and core to enhance the generated device’s resistance force under both compression and tension. To evaluate its performance, the RBRB prototype was fabricated and tested experimentally using a dynamic actuator. Additionally, a prototype of a conventional Buckling-Restrained Brace (BRB) was fabricated and tested to serve as a benchmark for assessing the RBRB’s performance.
Based on the test results, analytical models for Buckling-Restrained Braced Frames (BRBF) and Rubber Buckling-Restrained Braced Frames (RBRBF) were developed for use in finite element simulations. A performance-based seismic design method tailored for frames equipped with RBRB devices was then developed and applied to the design of a seven-story steel building furnished with both BRB and RBRB devices. The following specific conclusions are drawn based on the results achieved:
- The experimental dynamic cyclic tests showed that the maximum resistance of RBRB was 224 kN with 42 mm displacement.
- Implementing rubber in designing the RBRB system reduced the weight of the brace by 30% in comparison to BRB.
- Numerical simulation indicated the advantages of furnishing the structure by RBRB over BRB and bare frame by applying the PBD method in nonlinear time history analysis and pushover.
- Implementing RBRB decreased the maximum story displacement by up to 80.6% in comparison to a bare frame, which is about 34.68% more than BRB performance, in TH analysis.
- RBRB also reduced the maximum drift ratio by about 85–90% and 48% on average, compared to the bare frame and BRBFs, respectively.
- Base shear response was increased by furnishing the steel structure by RBRB. The maximum base shear response observed in the bare frame was 1460 kN, whereas the consistent value reported for BRBFs was 2335 kN, and it was 3046 kN in RBRBFs, which showed a 108.63% improvement in comparison with the bare frame and 30.45% more than BRBF.
- Top-story displacement in the non-braced structure decreased by 80.6% using RBRB as a bracing system, which is around 35% more than BRBFs.
- The performance evaluation of the structure also demonstrated an increase in the amount of dissipated energy by RBRBFs over 505 kN-m, which was 37.43% more than the bare frame and BRBFs.
- A pushover analysis indicated the superior behavior of RBRBFs over BRBFs and the bare frame in the case of plastic hinge reduction. The results showed that about 45% of the hinges in bare frames are not acceptable and are not able to fulfill the performance level. By implementing a BRB bracing system, this amount was reduced by about 30%; however, RBRB decreased this value to less than 2%.
- Also, by analyzing the pushover results, it can be seen that the failure number of BRBs was 37 out of 84; this value was only 9 for RBRBs, which is 75% less than BRBs.
- By providing additional resistance, RBRBs help improve the overall stability of the structure, preventing excessive deformation in the event of large seismic forces. This stability reduces the likelihood of second-order moments that can amplify displacements and increase the potential for structural damage.
Hence, the results showed that the RBRBF has the ability to effectively enhance the performance of the building in intense seismic hazards in comparison to BRBF and is able to protect a structure during a severe earthquake by its hybrid performance.
Author Contributions
Conceptualization, N.O. and F.H.; Methodology, N.O. and F.H.; Software, N.O.; Formal analysis, N.O.; Investigation, N.O.; Resources, F.H.; Data curation, N.O.; Writing—original draft, N.O.; Writing—review and editing, F.H.; Visualization, N.O.; Supervision, F.H.; Project administration, F.H.; Funding acquisition, F.H. All authors have read and agreed to the published version of the manuscript.
Funding
There is no funding for this research work.
Institutional Review Board Statement
Not applicable.
Informed Consent Statement
Not applicable.
Data Availability Statement
All data generated or analyzed during this study are included in this published article.
Conflicts of Interest
The authors declare no conflicts of interest.
References
- Abdi, H.; Hejazi, F.; Jaafar, M.S.; Karim, I.A. Evaluation of Response Modification Factor for Steel Structures with Soft Story Retrofitted by Viscous Damper Device. Adv. Struct. Eng. 2016, 19, 1275–1288. [Google Scholar] [CrossRef]
- Hejazi, F.; Noorzaei, J.; Jaafar, M.S.; Abang Abdullah, A.A. Earthquake Analysis of Reinforced Concrete Framed Structures with Added Viscous Dampers. Int. J. Appl. Sci. Eng. Technol. 2009, 5, 205–210. [Google Scholar]
- Fateh, A.; Hejazi, F.; Jaafar, M.S.; Abd. Karim, I.; Adnan, A.B. Design of a Variable Stiffness Bracing System: Mathematical Modeling, Fabrication, and Dynamic Analysis. Soil Dyn. Earthq. Eng. 2016, 80, 87–101. [Google Scholar] [CrossRef][Green Version]
- Sabelli, R.; Mahin, S.; Chang, C. Seismic demands on steel braced frame buildings with buckling-restrained braces. Eng. Struct. 2003, 25, 655–666. [Google Scholar] [CrossRef]
- Clark, P.; Aiken, I.; Ko, E. Design procedures for buildings incorporating hysteretic damping devices. In Proceedings of the International Post-SMiRT Conference Seminar on Seismic Isolation, Passive Energy Dissipation and Active Control of Vibrations of Structures, Cheju, Republic of Korea, 23–25 August 1999. [Google Scholar]
- Tremblay, R.; Bolduc, P.; Neville, R.; DeVall, R. Seismic testing and performance of buckling-restrained bracing systems. Can. J. Civ. Eng. 2006, 33, 183–198. [Google Scholar] [CrossRef]
- Guo, Y.L.; Fu, P.P.; Zhou, P.; Tong, J.Z. Elastic buckling and load resistance of a single cross-arm pre-tensioned cable stayed buckling-restrained brace. Eng. Struct. 2016, 126, 516–530. [Google Scholar] [CrossRef]
- Zhou, Y.; Qian, H.; Chu, H. A study on the design principle and performance of a new type of buckling-resistant brace. China Civ. Eng. J. 2009, 42, 64–71. [Google Scholar]
- Zhang, D.; Nie, X.; Pan, P.; Wang, M.; Deng, K.; Chen, Y. Experimental Study and Finite Element Analysis of a Buckling-Restrained Brace Consisting of Three Steel Tubes with Slotted Holes in the Middle Tube. J. Constr. Steel Res. 2016, 124, 1–11. [Google Scholar] [CrossRef]
- Tsai, K.C.; Hsiao, P.C. Pseudo-dynamic test of a full-scale CFT/BRB frame—Part II: Seismic performance of buckling-restrained braces and connections. Earthq. Eng. Struct. Dyn. 2008, 37, 1099–1115. [Google Scholar] [CrossRef]
- Tsai, K.; Lai, J.; Hwang, Y.; Lin, S.L.; Weng, C.H. Research and application of double-core buckling-restrained braces in Taiwan. In Proceedings of the 13th World Conference on Earthquake Engineering, Vancouver, BC, Canada, 1–6 August 2004; Available online: https://www.researchgate.net/publication/291731447_Research_and_application_of_double-core_buckling_restrained_braces_in_Taiwan (accessed on 7 August 2024).
- Black, C.J.; Makris, N.; Aiken, I.D. Component testing, seismic evaluation, and characterization of buckling-restrained braces. J. Struct. Eng. 2004, 130, 880–894. [Google Scholar] [CrossRef]
- Newell, J.; Uang, C.M.; Benzoni, G. Subassemblage Testing of Core Brace Buckling-Restrained Braces (G Series); Report No. TR-2006/01; University of California: San Diego, VA, USA, 2006. [Google Scholar]
- Atlayan, O.; Charney, F.A. Hybrid Buckling-Restrained Braced Frames. J. Constr. Steel Res. 2014, 96, 95–105. [Google Scholar] [CrossRef]
- Ju, Y.K.; Kim, M.H.; Kim, J.; Kim, S.D. Component Tests of Buckling-Restrained Braces with Unconstrained Length. Eng. Struct. 2009, 31, 507–516. [Google Scholar] [CrossRef]
- Chou, C.C.; Chen, S.Y. Subassemblage Tests and Finite Element Analyses of Sandwiched Buckling-Restrained Braces. Eng. Struct. 2010, 32, 2108–2121. [Google Scholar] [CrossRef]
- Zhao, J.; Wu, B.; Li, W. Local buckling behavior of steel angle core members in buckling-restrained braces: Cyclic tests, theoretical analysis, and design recommendations. Eng. Struct. 2014, 80, 107–116. [Google Scholar] [CrossRef]
- Takeuchi, T.; Hajjar, J.F.; Matsui, R.; Nishimoto, K.; Aiken, I.D. Local buckling restraint condition for core plates in buckling restrained braces. J. Constr. Steel Res. 2010, 66, 139–149. [Google Scholar] [CrossRef]
- Zhao, J.; Wu, B. Effect of brace end rotation on the global buckling behavior of pin-connected buckling-restrained braces with end collars. Eng. Struct. 2012, 41, 246–259. [Google Scholar] [CrossRef]
- Kim, J.; Park, J.; Shin, S.W.; Min, K.W. Seismic performance of tubular structures with buckling-restrained braces. Struct. Des. Tall Spec. Build. 2009, 18, 351–370. [Google Scholar] [CrossRef]
- Andrews, B.M.; Fahnestock, L.; Song, J. Performance-Based Engineering Framework and Ductility Capacity Models for Buckling-Restrained Braces; Newmark Structural Engineering Laboratory Report Series No. 012; University of Illinois at Urbana-Champaign: Urbana, IL, USA, 2008; Available online: https://www.ideals.illinois.edu/items/8792 (accessed on 28 November 2024).
- Andrews, B.M.; Fahnestock, L.A.; Song, J. Ductility Capacity Models for Buckling-Restrained Braces. J. Constr. Steel Res. 2009, 65, 1712–1720. [Google Scholar] [CrossRef]
- Tsai, K.; Hsiao, P.; Wang, K.; Weng, Y.; Lin, M.; Lin, K.; Chen, C.; Lai, J.; Lin, S. Pseudo-dynamic tests of a full-scale CFT/BRB frame—Part I: Specimen design, experiment, and analysis. Earthq. Eng. Struct. Dyn. 2008, 37, 1081–1098. [Google Scholar] [CrossRef]
- Wigle, V.; Fahnestock, L.A. Buckling-restrained braced frame connection performance. J. Constr. Steel Res. 2010, 66, 1156–1167. [Google Scholar] [CrossRef]
- Jia, M.; Lu, D.; Guo, L.; Sun, L. Experimental Research and Cyclic Behavior of Buckling-Restrained Braced Composite Frame. J. Constr. Steel Res. 2014, 95, 90–105. [Google Scholar] [CrossRef]
- Chou, C.; Liou, G. Compressive behavior of dual-gusset-plate connections for buckling-restrained braced frames. J. Constr. Steel Res. 2012, 76, 54–67. [Google Scholar] [CrossRef]
- Benavent-Climent, A. Shaking table tests of structures with hysteretic dampers: Experimental results versus prediction using non-linear static methods. Bull. Earthq. Eng. 2012, 10, 1857–1883. [Google Scholar] [CrossRef]
- Dong, H.; Du, X.; Han, Q.; Bi, K.; Hao, H. Hysteretic performance of RC double-column bridge piers with self-centering buckling-restrained braces. Bull. Earthq. Eng. 2019, 17, 3255–3281. [Google Scholar] [CrossRef]
- Dong, W.; Li, M.; Lee, C.-L.; MacRae, G.; Abu, A. Experimental Testing of Full-Scale Glulam Frames with Buckling-Restrained Braces. Eng. Struct. 2020, 222, 111081. [Google Scholar] [CrossRef]
- Ge, M.; Hao, J.; Yu, J.; Yan, P.; Xu, S. Shaking Table Test of Buckling-Restrained Steel Plate Shear Walls. J. Constr. Steel Res. 2017, 137, 254–261. [Google Scholar] [CrossRef]
- Guerrero, H.; Escobar, J.A.; Teran-Gilmore, A. Experimental Damping on Frame Structures Equipped with Buckling-Restrained Braces (BRBs) Working Within Their Linear-Elastic Response. Soil Dyn. Earthq. Eng. 2018, 106, 196–203. [Google Scholar] [CrossRef]
- Guerrero, H.; Ji, T.; Escobar, J.A.; Teran-Gilmore, A. Effects of Buckling-Restrained Braces on Reinforced Concrete Precast Models Subjected to Shaking Table Excitation. Eng. Struct. 2018, 163, 294–310. [Google Scholar] [CrossRef]
- Li, L.; Li, G. Experimental study on the seismic behavior of a steel-concrete hybrid structure with buckling-restrained braces. Adv. Civ. Eng. 2020, 2020, 9232138. [Google Scholar] [CrossRef]
- Tan, Q.; Wu, B.; Shi, P.; Xu, G.; Wang, Z.; Sun, J.; Lehman, D.E. Experimental performance of a full-scale spatial RC frame with buckling-restrained braces subjected to bidirectional loading. J. Struct. Eng. 2021, 147, 04020352. [Google Scholar] [CrossRef]
- Vargas, R.; Bruneau, M. Experimental response of buildings designed with metallic structural fuses. II. J. Struct. Eng. 2009, 135, 394–403. [Google Scholar] [CrossRef]
- Makris, N. Plastic torsional buckling of cruciform compression members. J. Eng. Mech. 2003, 129, 689–696. [Google Scholar] [CrossRef]
- Choi, H.; Kim, J. Energy-Based Seismic Design of Buckling-Restrained Braced Frames Using Hysteretic Energy Spectrum. Eng. Struct. 2006, 28, 304–311. [Google Scholar] [CrossRef]
- Fahnestock, L.A.; Sause, R.; Ricles, J.M. Seismic response and performance of buckling-restrained braced frames. J. Struct. Eng. 2007, 133, 1195–1204. [Google Scholar] [CrossRef]
- Asgarian, B.; Shokrgozar, H.R.; Abitorabi, M. Effect of Design Loads in Buckling-Restrained Braced Frames Performance. In Proceedings of the 14th World Conference on Earthquake Engineering, Beijing, China, 12–17 October 2008. [Google Scholar]
- López-Almansa, F.; Castro-Medina, J.C.; Oller, S. A Numerical Model of the Structural Behavior of Buckling-Restrained Braces. Eng. Struct. 2012, 41, 108–117. [Google Scholar] [CrossRef]
- Mazzolani, F.M.; Della Corte, G.; D’Aniello, M. Experimental analysis of steel dissipative bracing systems for seismic upgrading. J. Civ. Eng. Manag. 2009, 15, 7–19. [Google Scholar] [CrossRef]
- Kiggins, S.; Uang, C.-M. Reducing Residual Drift of Buckling-Restrained Braced Frames as a Dual System. Eng. Struct. 2006, 28, 1525–1532. [Google Scholar] [CrossRef]
- Di Sarno, L.; Elnashai, A.S. Bracing systems for seismic retrofitting of steel frames. J. Constr. Steel Res. 2009, 65, 452–465. [Google Scholar] [CrossRef]
- Moradi, S.; Alam, M.S.; Asgarian, B. Incremental dynamic analysis of steel frames equipped with NiTi shape memory alloy braces. Struct. Des. Tall Spec. Build. 2014, 23, 1406–1425. [Google Scholar] [CrossRef]
- Kim, J.; Choi, H. Behavior and design of structures with buckling-restrained braces. Eng. Struct. 2004, 26, 693–706. [Google Scholar] [CrossRef]
- Kim, J.; Seo, Y. Seismic Design of Low-Rise Steel Frames with Buckling-Restrained Braces. Eng. Struct. 2004, 26, 543–551. [Google Scholar] [CrossRef]
- Carden, L.P.; Itani, A.M.; Buckle, I.G. Seismic performance of steel girder bridges with ductile cross frames using single angle X braces. J. Struct. Eng. 2006, 132, 329–337. [Google Scholar] [CrossRef]
- Uang, C.-M.; Nakashima, M. Steel buckling-restrained braced frames. In Earthquake Engineering; Bozorgnia, Y., Bertero, V.V., Eds.; CRC Press: Boca Raton, FL, USA, 2004; pp. 16-1–16-24. [Google Scholar] [CrossRef]
- Li, B.; Wang, J.; Wang, Y.; Baniotopoulos, C.C. New Performance-Based Plastic Design and Evaluation of Blind Bolted End-Plate CFT Composite Frames with BRBs. Eng. Struct. 2021, 232, 111806. [Google Scholar] [CrossRef]
- Teran-Gilmore, A.; Virto-Cambray, N. Preliminary design of low-rise buildings stiffened with buckling-restrained braces by a displacement-based approach. Earthq. Spectra 2009, 25, 185–211. [Google Scholar] [CrossRef]
- Bojorquez, E.; Teran-Gilmore, A.; Ruiz, S.E.; Reyes-Salazar, A. Evaluation of structural reliability of steel frames: Interstory drift versus plastic hysteretic energy. Earthq. Eng. Struct. Dyn. 2011, 27, 661–682. [Google Scholar] [CrossRef]
- Bojorquez, E.; Reyes-Salazar, A.; Teran-Gilmore, A.; Ruiz, S.E. Energy-based damage index for steel structures. Steel Compos. Struct. 2010, 10, 343–360. [Google Scholar] [CrossRef]
- Huang, C.S.; Lin, H.L. Modal identification of structures from ambient vibration, free vibration, and seismic response data via a subspace approach. Earthq. Eng. Struct. Dyn. 2001, 30, 1857–1878. [Google Scholar] [CrossRef]
- Wong, K.; Yang, R.Y. Effectiveness of structural control based on control energy perspectives. Earthq. Eng. Struct. Dyn. 2001, 30, 1747–1768. [Google Scholar] [CrossRef]
- Aliakbari, F.; Garivani, S.; Aghakouchak, A.A. An Energy-Based Method for Seismic Design of Frame Structures Equipped with Metallic Yielding Dampers Considering Uniform Inter-Story Drift Concept. Eng. Struct. 2020, 205, 110114. [Google Scholar] [CrossRef]
- Khampanit, A.; Leelataviwat, S.; Kochanin, J.; Warnitchai, P. Energy-Based Seismic Strengthening Design of Non-Ductile Reinforced Concrete Frames Using Buckling-Restrained Braces. Eng. Struct. 2014, 81, 110–122. [Google Scholar] [CrossRef]
- Choi, H.; Kim, J.; Chung, L. Seismic design of buckling-restrained braced frames based on a modified energy-balance concept. Can. J. Civ. Eng. 2006, 33, 1251–1260. [Google Scholar] [CrossRef]
- Rezazadeh, F.; Talatahari, S. Seismic energy-based design of BRB frames using multi-objective vibrating particles system optimization. Structures 2020, 24, 227–239. [Google Scholar] [CrossRef]
- Sahoo, D.R.; Chao, S.-H. Performance-based plastic design method for buckling-restrained braced frames. Eng. Struct. 2010, 32, 2950–2958. [Google Scholar] [CrossRef]
- Freddi, F.; Tubaldi, E.; Zona, A.; Dall’Asta, A. Seismic performance of dual systems coupling moment-resisting and buckling-restrained braced frames. Earthq. Eng. Struct. Dyn. 2020, 49, 1350–1375. [Google Scholar] [CrossRef]
- American Society of Civil Engineers. ASCE/SEI 7-10; Minimum Design Loads for Buildings and Other Structures. 2010. Available online: https://ascelibrary.org/doi/book/10.1061/9780784412916 (accessed on 28 November 2024).
- Upadhyay, A.; Pantelides, C.P. Seismic Analysis of Bridge with Buckling-Restrained Brace Posttensioned Concrete Pier. Earthq. Eng. 2025, 54, 227–245. [Google Scholar] [CrossRef]
- Murphy, C.; Pantelides, C.P.; Blomgren, H.-E.; Rammer, D. Development of Timber Buckling Restrained Brace for Mass Timber-Braced Frames. J. Struct. Eng. 2021, 147, 04021050. [Google Scholar] [CrossRef]
- MacRae, G.A.; Lee, C.-L. Buckling Restrained Braces—Issues and Solutions. In Celebrating Structural Engineering SOC Conference; Civil Engineering, University of Canterbury: Christchurch, New Zealand, 2023. [Google Scholar]
- Rubio, R.; Quintana Gallo, P.; Carradine, D.M. Seismic design and nonlinear response comparison of a hybrid timber building configured with BRB- and SMA-braced LVL frames. Bull. Earthq. Eng. 2024, 22, 461–486. [Google Scholar] [CrossRef]
- Dutkiewicz, M.; Velychkovych, A.; Shatskyi, I.; Shopa, V. Efficient model of the interaction of elastomeric filler with an open shell and a chrome-plated shaft in a dry friction damper. Materials 2022, 15, 4671. [Google Scholar] [CrossRef]
- Ouyang, X.; Cao, S.; Li, G. Nonlinear dynamics of a dual-rotor-bearing system with active elastic support dry friction dampers. Nonlinear Dyn. 2024, 112, 7875–7907. [Google Scholar] [CrossRef]
- Tan, K.C.; Hejazi, F.; Esfahani, H.M.; Chong, T. Development of elastomeric rubber bearing utilizing core-and-filler system. Structures 2022, 37, 125–139. [Google Scholar] [CrossRef]
- Altalabani, D.; Hejazi, F.; Rashid, R.S.B.M.; Aziz, F.N.A.A. Development of new rectangular rubber isolators for a tunnel-form structure subjected to seismic excitations. Structures 2021, 32, 1522–1542. [Google Scholar] [CrossRef]
- Tan, K.C.; Hejazi, F. Rubber bearing isolator with granular and polymer filler core and application on a building. Structures 2022, 42, 309–332. [Google Scholar] [CrossRef]
- Shatskyi, I.; Velychkovych, A. Analytical model of structural damping in friction module of shell shock absorber connected to spring. J. Vib. Acoust. 2023, 2023, 4140583. [Google Scholar] [CrossRef]
- Deubel, C.; Schneider, S.J.; Prokop, G. Effect of shock absorber friction on vehicle vertical dynamics. SAE Int. J. Veh. Dyn. Stab. NVH 2024, 8, 155–177. [Google Scholar] [CrossRef]
- Landara, S.; Velychkovych, A.; Mykhailiuk, V. Numerical and analytical models of the mechanism of torque and axial load transmission in a shock absorber for drilling oil, gas and geothermal wells. Eng. Solid Mech. 2024, 12, 207–220. [Google Scholar] [CrossRef]
- Landar, S.; Velychkovych, A.; Ropyak, L.; Andrusyak, A. A method for applying the use of a smart 4 controller for the assessment of drill string bottom-part vibrations and shock loads. Vibration 2024, 7, 802–828. [Google Scholar] [CrossRef]
- Farahpour, H.; Hejazi, F. Development of integrated semi-active adaptive vibration control system for bridges subjected to traffic loads. Structures 2023, 51, 1773–1794. [Google Scholar] [CrossRef]
- Farahpour, H.; Hejazi, F. Development of adjustable fluid damper device for the bridges subjected to traffic loads. Structures 2023, 47, 1295–1322. [Google Scholar] [CrossRef]
- Gent, A.N.; Zhang, L.Q. Strain-induced crystallization and strength of rubber. Rubber Chem. Technol. 2002, 75, 923–934. [Google Scholar] [CrossRef]
- Raghavan Vijayaram, T. A technical review on rubber. Int. J. Des. Manuf. Technol. 2009, 3, 25–37. [Google Scholar] [CrossRef]
- Yoshida, J.; Abe, M.; Fujino, Y. Constitutive model of high-damping rubber materials. J. Eng. Mech. 2004, 130, 129–141. [Google Scholar] [CrossRef]
- Sitler, B.; Takeuchi, T.; Matsui, R.; Terashima, M.; Terazawa, Y. Experimental investigation of a multistage buckling-restrained brace. Eng. Struct. 2020, 213, 110482. [Google Scholar] [CrossRef]
- Ferdinand, N.; Jianchang, Z.; Qiangqiang, Y.; Wang, G.; Junjie, X. Research on application of buckling-restrained braces in strengthening of concrete frame structures. Civ. Eng. J. 2020, 6, 344–362. [Google Scholar] [CrossRef]
- Piedrafita, D.; Cahis, X.; Simon, E.; Comas, J. A new perforated core buckling restrained brace. Eng. Struct. 2015, 85, 118–126. [Google Scholar] [CrossRef]
- ASTM E8. Metal Tensile Testing. 2013. Available online: https://www.astm.org (accessed on 20 November 2024).
- Lubliner, J.; Oliver, J.; Oller, S.; Oñate, E. A Plastic-Damage Model for Concrete. Int. J. Solids Struct. 1989, 25, 299–326. [Google Scholar] [CrossRef]
- British Standards Institute. BS EN 12390-3:2009; Testing Hardened Concrete: Part 3: Compressive Strength of Test Specimens. British Standards Institute: London, UK, 2009. [Google Scholar]
- Commision, S.S. ATC-40. Seismic Evaluation and Retrofit of Concrete Buildings; Seismic Safety Commission: West Sacramento, CA, USA, 1996.
- Iwata, M.; Kato, T.; Wada, A. Performance evaluation of buckling-restrained braces in damage-controlled structures. In STESSA 2003—Behaviour of Steel Structures in Seismic Areas; Routledge: London, UK, 2003; pp. 37–43. [Google Scholar]
- British Standards Institution. BS EN 15129:2009; Anti-Seismic Devices. British Standards Institution: London, UK, 2009. [Google Scholar]
- American Society of Civil Engineers. Minimum Design Loads for Buildings and Other Structures (ASCE 7-16). 2016. Available online: https://ascelibrary.org/doi/book/10.1061/9780784414248 (accessed on 28 November 2024).
- Xie, L.; Wu, J.; Huang, Q.; Tong, C. Analysis of the seismic demand of high-performance buckling-restrained braces under a strong earthquake and its aftershocks. Adv. Civ. Eng. 2019, 2019, 1482736. [Google Scholar] [CrossRef]
- Rahai, A.R.; Alinia, M.M.; Salehi, S.M.F. Cyclic performance of buckling restrained composite braces composed of selected materials. Int. J. Civ. Eng. 2009, 7, 1. [Google Scholar]
- Tong, C.; Wu, J.; Hua, K.; Xie, L. Low-cycle fatigue life estimation curve for buckling-restrained braces based on cumulative plastic deformation. J. Earthq. Eng. 2022, 26, 2773–2801. [Google Scholar] [CrossRef]
- Gao, F.; Liu, H.; Qu, Z. The cumulative plastic deformation demand for buckling restrained braces imposed by the strong motions in the 2023 Türkiye earthquake sequence. Earthq. Res. Adv. 2024, 4, 100313. [Google Scholar] [CrossRef]


Disclaimer/Publisher’s Note: The statements, opinions and data contained in all publications are solely those of the individual author(s) and contributor(s) and not of MDPI and/or the editor(s). MDPI and/or the editor(s) disclaim responsibility for any injury to people or property resulting from any ideas, methods, instructions or products referred to in the content. |
© 2024 by the authors. Licensee MDPI, Basel, Switzerland. This article is an open access article distributed under the terms and conditions of the Creative Commons Attribution (CC BY) license (https://creativecommons.org/licenses/by/4.0/).