Review

Vibroarthrography as a Noninvasive Screening Method for Early Diagnosis of Knee Osteoarthritis: A Review of Current Research

1
Department of Machine Design and Mechatronics, Faculty of Mechanical Engineering, Lublin University of Technology, 20-618 Lublin, Poland
2
Department of Technical Computer Science, Faculty of Mathematics and Information Technology, Lublin University of Technology, 20-618 Lublin, Poland
3
Department of Trauma Surgery and Emergency Medicine, Medical University, 20-059 Lublin, Poland
4
Orthopaedic and Sports Traumatology Department, Carolina Medical Center, 78 Pory St., 02-757 Warsaw, Poland
*
Author to whom correspondence should be addressed.
Appl. Sci. 2025, 15(1), 279; https://doi.org/10.3390/app15010279
Submission received: 13 November 2024 / Revised: 24 December 2024 / Accepted: 27 December 2024 / Published: 31 December 2024
(This article belongs to the Special Issue Vibroacoustic Monitoring: Theory, Methods and Applications)

Abstract

:
The ageing population and the resulting number of physical and health problems are now a major social and economic challenge around the world. Osteoarthritis is a common disease among older people. It can affect any joint, but it most often affects the knee, hip, and hand joints. Osteoarthritis of the knee joint significantly affects everyday life, limiting daily activities. Patients affected by this disease face many ailments, such as pain, stiffness, and a reduced of range of joint motion. In order to implement quick and effective treatment and prevent the development of the disease, accurate and early diagnosis is important. This will contribute to prolonging the health of the joints. Available methods for diagnosing osteoarthritis include conventional radiography, MRI, and ultrasound, but these methods are not suitable for screening. Over the years, there have been proposals to use vibroarthrography as a new, cheap, and noninvasive screening method for cartilage damage. The paper reviews recent studies on vibroarthrography as a diagnostic method for knee osteoarthritis. The aim of the study is to organise the current knowledge regarding the diagnosis of osteoarthritis of the knee joint and vibroarthrography as a proposal for a new diagnostic method.

1. Introduction

Vibroacoustic diagnostics was first employed to evaluate the technical condition of machines and equipment [1]. Assessing the dynamic state of the machine is possible using the vibroacoustic processes generated by it. For this purpose, measurements of relative and absolute vibrations, noise and pressure pulsations are used. The use of vibration signals in machine diagnostics provides a lot of necessary information about their technical condition and, also, allows for earlier diagnosis of irregularities, which leads to an extension of the life cycle of technical equipment. Sound can be defined as a mechanical wave of pressure and displacement that propagates in a medium. The medium may be air, a solid, water, or any other medium capable of transmitting vibrations [2]. The particles of the medium alternately move along and against the propagating sound wave. These vibrations can be caused by friction between two surfaces moving relative to each other. Surfaces moving smoothly relative to each other create less friction, thus generating less noise. High levels of friction are produced by rough surfaces and will produce a higher sound output. Using bearings as an example, key indicators of their performance include vibration, temperature, bearing noise, and the lubricant condition. The bearing itself does not generate noise, but bearing noise can be defined as the sound effect of vibrations that are generated directly or indirectly by the bearing in the surrounding structure. As the bearing wears out, the level of vibroacoustic signals increases. Vibroacoustics, as a method for examining the condition of bearing nodes, provides information about the technical condition of the machine.
Vibroacoustics can also be used as a diagnostic method in medicine. Vibroarthrography of the knee joint involves measuring the sounds and vibrations produced by the joint during movement [3]. The first study on the use of sound diagnostics generated by the knee joint was conducted by Blodgett over 100 years ago. This method involves auscultation of the knee joint, focusing on the sounds made by normal joints, as well as their changes during repetitive movements, in which a relationship has been noted between age and increased sound activity [4,5].
One of the largest and most heavily loaded joints in the human body is the knee joint, and it is also one of the most complex structures in the musculoskeletal system. It consists of structures whose relative movements influence the creation of the VAG signal [6]. From a mechanical perspective, its main function is to allow for the movement of the bones that connect. It has the ability to carry loads equal to several times the body weight. During the movement of knee extension and flexion, three types of movements occur. The first is the rotation of the lower leg around its long axis, the next type of movement is the rotational, hinge-like movement, and the third type is the anteroposterior sliding movement [6,7]. Cartilage covers most of the mating surfaces of the knee joint, which provides movement with minimal friction [8]. The human knee joint is a biobearing whose friction surfaces are covered with an elastic material (joint cartilage), and a joint capsule filled with a lubricating substance, i.e., synovial fluid, surrounds the joint. The anatomical location of the knee joint, its complex structure, and its ability to withstand significant loads make it highly sensitive to damage and injury. This may lead to damage to its anatomical structures, which may cause irreversible changes in the joint structure and the development of degenerative changes [9,10]. The disappearance of the synovial fluid leads to an increase in the coefficient of friction and, consequently, to the generation of more vibrations and sounds that can be measured using vibroarthrography. The stimulated synovial membrane increases the production of synovial fluid, which contains pro-inflammatory cytokines, which further damage the joint cartilage. Osteoarthritis can be a factor in increasing the coefficient of friction, which leads to increased wear on the knee joint. As cartilage damage increases, cracks develop. Degenerative changes also result in an increase in the frictional moment, which has a direct impact on additional load on the joint and may lead to its further degradation. Damage to joint cartilage is also associated with uneven distribution of tangential stresses, which leads to an increased risk of further damage and pain.
Osteoarthritis (OA) is a severe and progressive joint disease that usually affects middle-aged and elderly people. OA involves the progressive degeneration of joint cartilage, which can affect the entire joint, the synovial membrane, and the underlying bone [11,12]. The basis for the development of the knee joint OA is damage to the articular cartilage [13,14]. Changes that occur in both the articular cartilage and the subchondral layer of bone and the synovial membrane may lead to failure of the musculoskeletal system [14,15,16]. With the development of knee joint OA, the mechanical parameters of the cartilage covering the joint surfaces change. As a result of cartilage damage, joint surfaces become rougher, and in extreme cases, bone-on-bone friction occurs. The pressure with which the surfaces press against each other affects the value of the friction force. As the pressure increases, the friction force increases. Risk factors leading to the development of this degenerative disease include increased BMI, sex, age, genetics, obesity injuries, excessive joint stress, and factors resulting from physical activity [17,18,19]. In the final phase of OA, the articular cartilage is completely destroyed. The global prevalence of knee OA is estimated at 16%, and the incidence rate is 203 per 10,000 person-years [20,21]. There is no doubt that the number of people affected by this disease will increase in the coming decades, given factors such as high rates of obesity and an ageing population [22]. Methods and techniques for treating changes resulting from knee osteoarthritis include weight loss, activity modification, pharmacological treatment, and surgical treatment in the final phase of the disease [23,24]. Early detection of cartilage lesions is therefore important for preventing the development of OA and minimizing the negative effects experienced by the patient [25,26,27,28]. Determining the group of patients with increased risk factors for osteoarthritis is also important in early diagnosis. These factors include previous knee injuries, obesity, and working in a long-term sitting or standing position [29].
The aim of this paper is to summarise the existing knowledge on the use of vibroarthrography in the diagnosis of knee joint OA. The methods of acquisition and processing of VAG signals are presented to determine their effectiveness in diagnostic applications. The limitations resulting from the use of vibroarthrography signals to detect knee osteoarthritis are also analysed, with proposals for future directions in the development of this technology.

2. Methods of Diagnosing Cartilage Lesions

To understand the need for research on the use of vibroarthrography in the diagnosis of knee osteoarthritis, it is necessary to analyse the diagnostic methods currently used for this purpose. These methods include physical examination, computed tomography (CT), radiography (X-ray), magnetic resonance imaging (MRI), and ultrasonic testing (UT) [30,31,32]. However, their reliability and accuracy in the assessment of cartilage damage is questionable. In addition, each of them has its own limitations, such as the high cost of the equipment.
Radiography is the basis for the diagnosis of degenerative changes according to the Kellgren–Lawrence scale [33]. Factors that indirectly assess the quality of articular cartilage are assessed: the presence of osteophytes, as well as joint space narrowing, deformations of the joint surface, and subchondral bone hypertrophy [34]. The biggest disadvantage of this imaging modality is that it does not show cartilage, and only the bony changes that form after cartilage lesions occur can be appreciated. Moreover, no information about surrounding soft tissues can be acquired from conventional radiography [11,33,35,36]. However, the advantages include low cost, high availability, and low patient exposure to ionising radiation.
A more effective method is computed tomography (CT), which provides a more detailed image of the knee joint [37,38]. This allows for a more precise assessment of the joint structure and degenerative changes. Unfortunately, as in the case of radiography, this method does not provide the best results in diagnosing the early stages of OA because it is not possible to obtain a direct image of the cartilage; it only allows for estimating signs of its damage based on bone changes. Additionally, the cost of computed tomography is much higher than radiography, and the patient is exposed to a dose of ionising radiation that is several to a dozen times higher than in radiography [39,40]. In order to improve the visibility of the imaged elements, contrast-enhanced tomography of the knee joint is used. However, this requires prior preparation of the patient for the medical examination. The use of contrast during the examination also has an impact on the increased cost compared to regular computed tomography. It is also possible for the patient to experience a dangerous allergic reaction.
Another method used in the early diagnosis of OA is ultrasound [41,42,43]. Its advantages are low cost, high availability, lack of radiation, and ability to perform a dynamic examination [39,44]. Comprehensive assessment systems, i.e., standardised classification systems used in ultrasound, have been developed and validated to systematically describe and evaluate different organs and pathologies with an emphasis on the patient’s inflammatory state. The use of ultrasound makes it possible to visualise the structure of the knee joint and detect cartilage and articular changes by obtaining an image in real time. Ultrasonography uses the Doppler imaging technique to assess blood flow in vessels. Power Doppler (PD), in particular, allows for the assessment of hyperaemia and inflammation occurring in the examined patient, which is a significant advantage of ultrasonography over other diagnostic methods. However, the use of ultrasound does not provide a high-quality image of the articular cartilage and soft tissues surrounding the knee joint, and the examination itself depends on the experience of the person performing it.
The diagnostic method that is currently the most advanced and most effective in cases of articular cartilage damage is magnetic resonance imaging (MRI) [34,42,45,46]. Using the MRI method, a very detailed image of the structure of the knee joint is obtained, which allows for the detection of damage in its initial phase of development. The obtained three-dimensional image of the knee joint allows doctors to more thoroughly assess the advancement of the disease. MRI uses specialised scales for assessing joints, in particular their damage, cartilage regeneration, and other intra-articular structures. The first of these is the whole-organ magnetic resonance imaging score (WORMS), which allows for the assessment of all joint structures, including, among others, joint cartilage, subchondral bone, menisci, ligaments, loose bodies in joints, and synovial fluid, and the presence of synovial fluid. Each of the elements is assessed on a scale from 0 to 4 where 0 means no changes and 4 means advanced changes. The particular importance of the WORMS scale is noticeable in the assessment of OA [47]. Another scale is the magnetic resonance observation of cartilage repair tissue (MOCART), which is used after cartilage surgery to assess the quality and effectiveness of its repair. The following elements are assessed: the thickness of the cartilage repair layer, structure of the repaired cartilage, surface of the cartilage repair, integration with adjacent cartilage, changes at the interface of the repaired cartilage with the subchondral bone, and the presence of cysts or fibrosis. The maximum score on the MOCART scale is 100, which indicates ideal cartilage repair [48]. MRI has its limitations, which include the high cost of the examination, availability, its time-consuming nature, and qualified personnel. Another important aspect worth mentioning in the context of MRI is gadolinium, which is used as a component of contrast administered intravenously to patients during the examination. The purpose of using gadolinium is to improve the quality of MRI images, which is particularly important during the assessment of pathological changes, such as inflammation and infections, tumours, and the diagnosis of vascular changes. However, the use of gadolinium can also generate side effects, which include allergic reactions, gadolinium retention in the body after repeated administration to the patient, and the occurrence of a rare disease nephrogenic systemic fibrosis (NSF) [49,50,51]. Table 1 presents a summary of the methods of diagnosing osteoarthritis.
In 1987, McCoy et al. [66] proposed ‘vibration arthrography’ (VAG) as a noninvasive, sensitive, and inexpensive method for the early diagnosis of OA, which is based on the detection and recording of knee vibration emissions. During movements of the knee joint, elements moving relative to each other emit oscillations and vibrations caused by friction processes [30]. The knee joint during movements such as extension and flexion emits a signal that is called the VAG signal [30,67]. The vibroacoustic signal during knee joint movement is influenced by changes in the mechanical properties, especially nodules, cracks, and cartilage defects, in subsequent stages of degenerative changes [30,68]. Mechanical vibrations arise as a result of a change in the distribution of forces in the contact zones caused by cyclically changing loads on the joint elements.
VAG enables early detection of cartilage micro-damage before it becomes visible on MRI. This noninvasive and cost-effective method can be used repeatedly, making it ideal for monitoring disease progression, such as osteoarthritis (OA), or assessing therapy effectiveness. The analysis of vibratory signals can also reveal biomechanical issues that may cause pain, even when no changes are visible on MRI or CT. Due to its affordability, noninvasive nature, and lack of radiation exposure, VAG is suitable for screening, helping to reduce the need for redundant and costly imaging studies. As a complementary tool, VAG provides a functional perspective on joint health, enhancing diagnosis, treatment planning, and long-term patient monitoring, while offering a more comprehensive evaluation alongside conventional imaging techniques.
Over the years, the possibility of using acoustic emission recording and vibroarthrography to detect and monitor the condition of the knee at various stages of knee degenerative disease has been tested. Piezoelectric sensors, accelerometers, and stethoscopes are used to record acoustic emissions (AE) and VAG signals. It was found that knees with OA emit more acoustic events with higher amplitude and longer duration compared to healthy knees [69,70]. As the cartilage in the knee joint atrophies, an increasing number of acoustic signals are emitted [71]. The change in stress distribution generates acoustic signals that are recorded from the surface of the knee joint [72]. Over the last century, the use of VAG in preclinical evaluation has been reported to be more than 90% accurate in determining cartilage loss [6]. The advantages of using vibroarthrography to diagnose knee osteoarthritis are its low cost, repeatability, speed, and lack of radiation [30,73]. Vibroarthrography is a method based on recording and further analysing the sounds or vibrations of a joint during movement, providing information about its biomechanics and cartilage quality. Unlike typical medical imaging methods (MRI and CT), which are static techniques, VAG allows real-time assessment of the dynamic functioning of a joint, which can reveal even subtle abnormalities not visible in static images. However, there are no research or acquisition protocols that are accepted broadly enough to implement this method in clinical diagnostics [19]. Imaging and physical examinations were used as a reference point for the results, which may pose a risk of bias in the tests performed [19]. In recent years, to accurately assess the type, grade (according to ICRS), and location of cartilage lesions, alongside physical examination and imaging findings, intraoperative evaluation has also been performed for patients scheduled for surgery. This approach enhances accuracy and enables the precise attribution of signals to specific lesion types. Moreover, efforts have been focused on optimizing examination protocols using machine learning methods, considering factors such as the kinetic chain, range of motion, and sensor placement, to personalise the examination and adapt it to the patient’s capabilities [68,74,75].
VAG has shown in the literature high diagnostic accuracy [76,77], exceeding published results of US or MRI in the detection of cartilage lesions. During US, a radiologist is unable to visualise the whole cartilage area, which can explain lower sensitivity. This is not applicable to MRI where full cartilage area can be and is visualised during imaging. Nevertheless, the literature shows gross discrepancy in sensitivity ranging from 45% to 94% [78,79]. Compared to that, sensitivity exceeding 90% found in VAG seems appealing to introduce this tool into clinical practice. However, one must remember that research is conducted mostly in preclinical settings, by experts in their fields, which is in contrast to other imaging methods. MRI, US, or radiography due to prevalence and availability are commonly used and evaluated by multiple radiologists and orthopaedic surgeons. This issue can affect the results of the proposed methods. Therefore, wider population studies, as well as testing of VAG in clinical settings is necessary to fully appreciate this diagnostic modality.

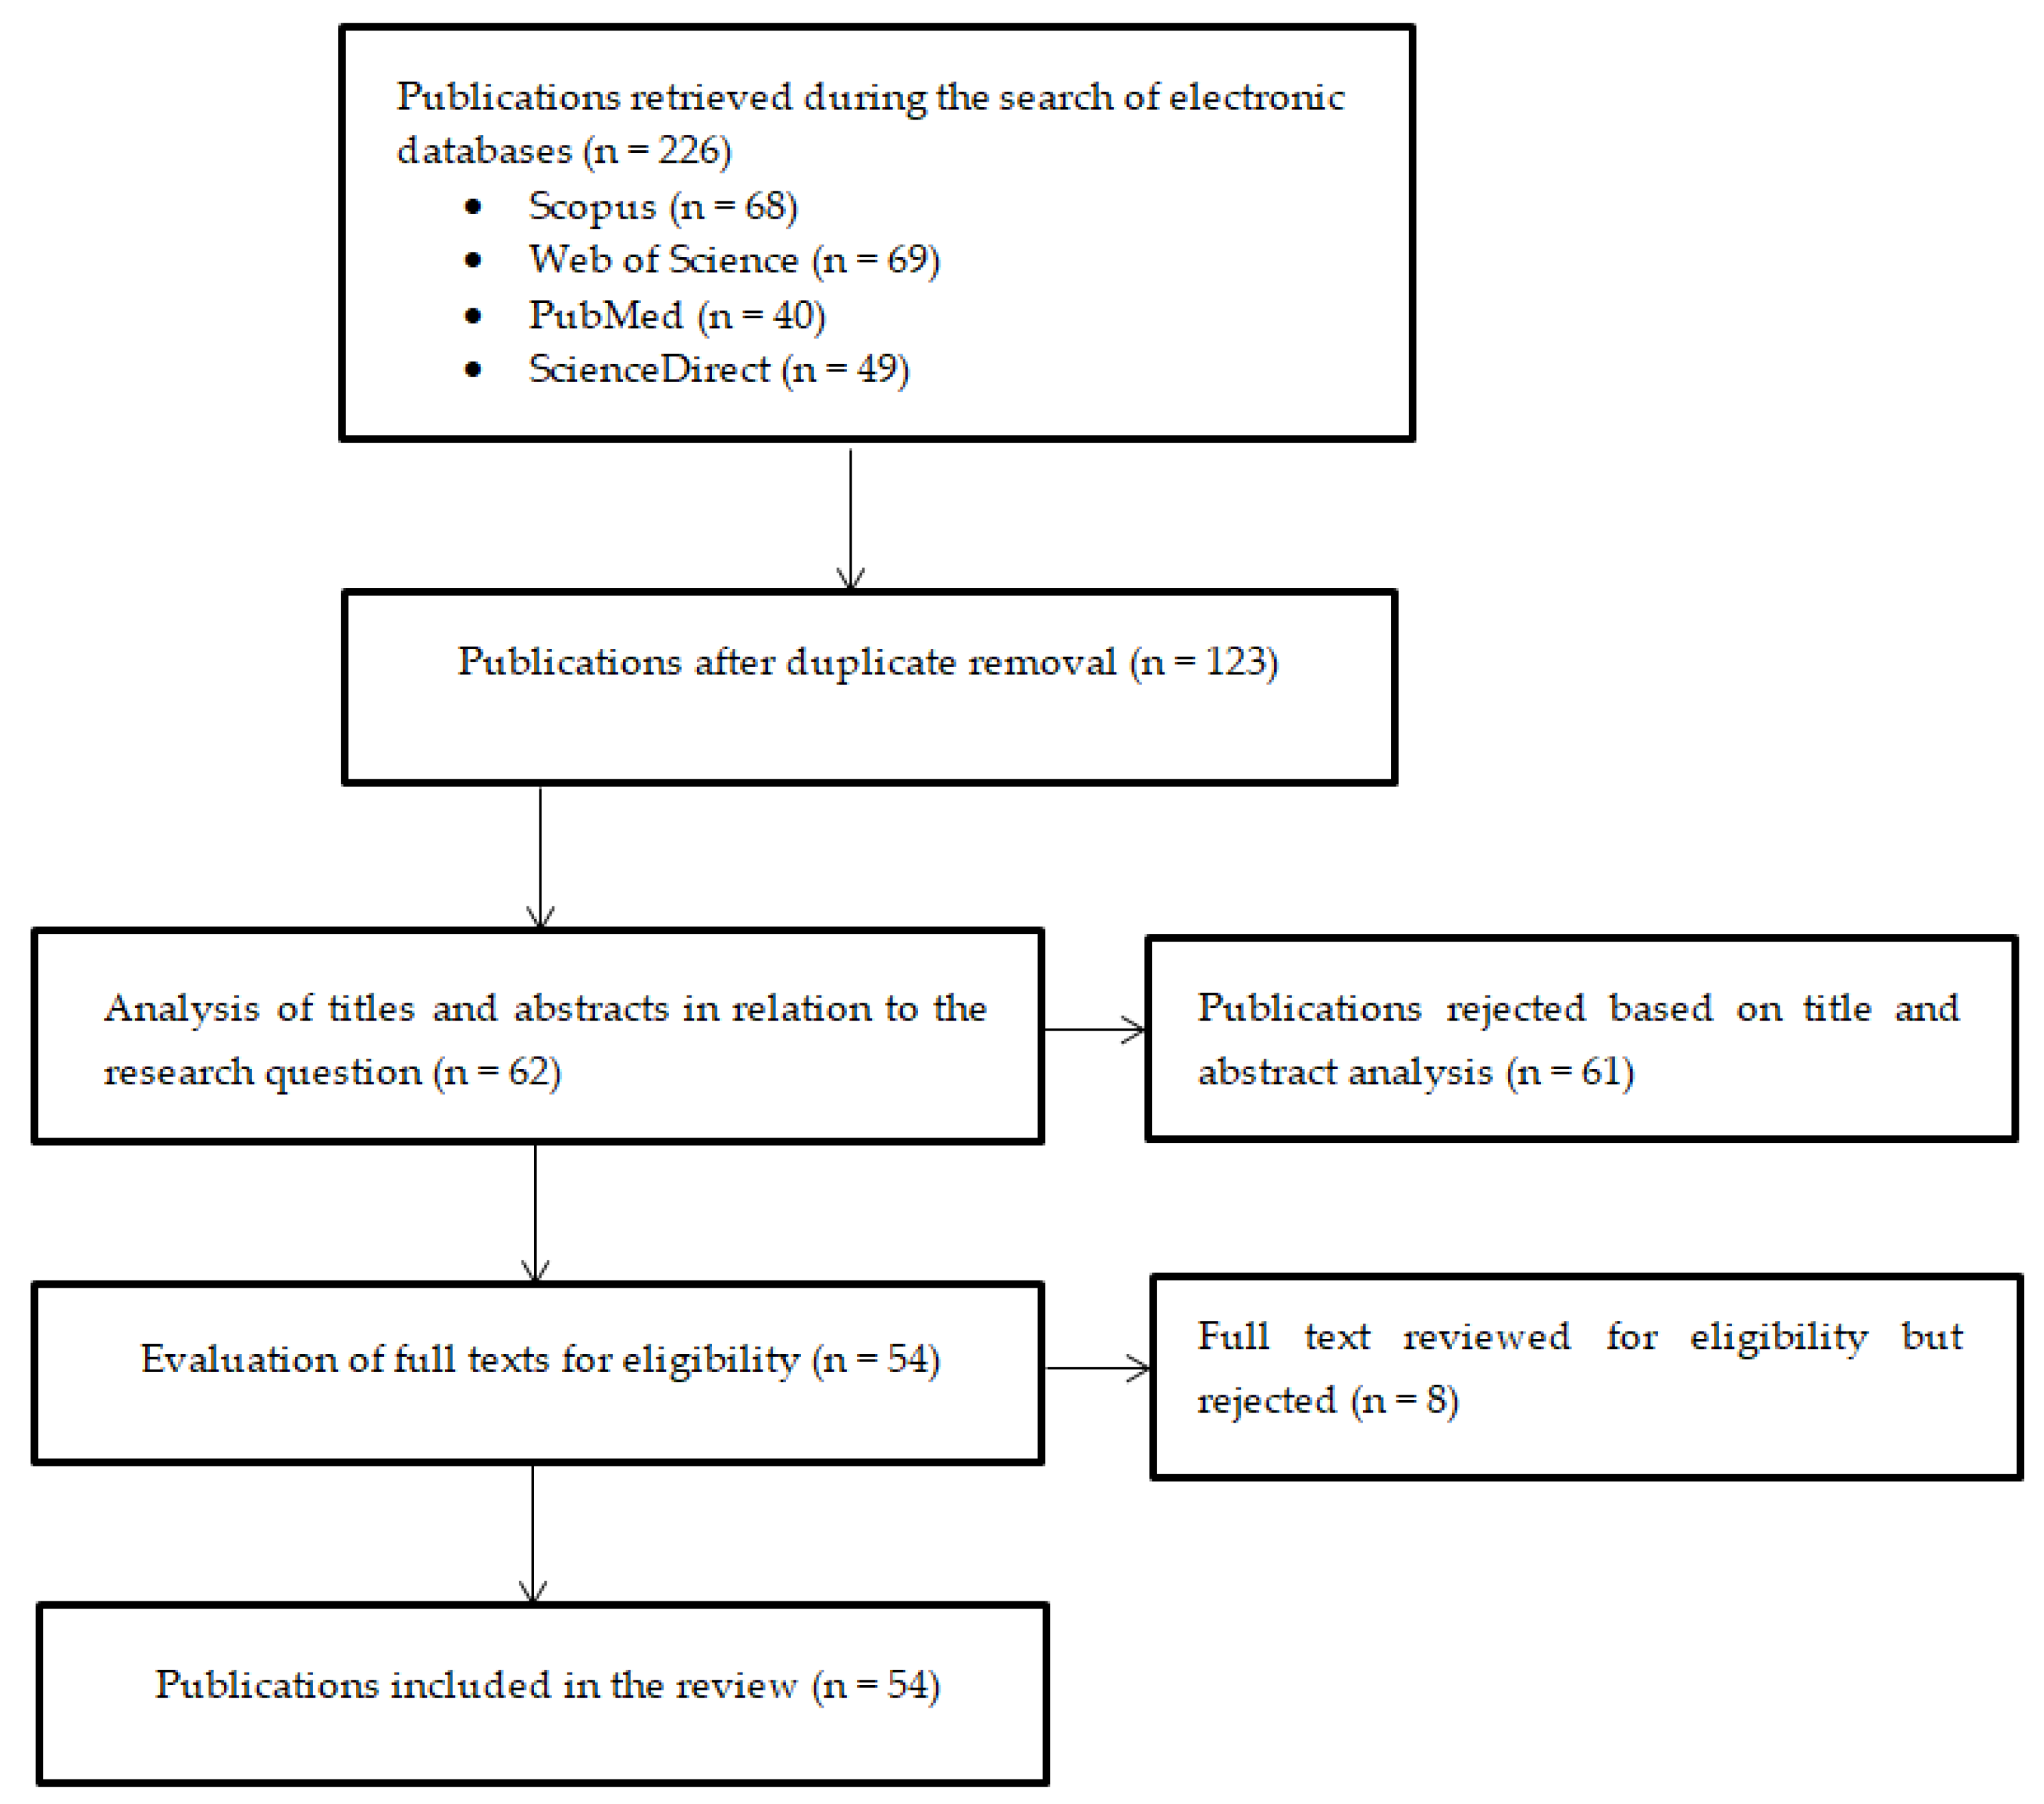
3. Review Methodology

In order to conduct a literature review on the use of vibroarthrography as a method for the early diagnosis of OA, a structured review was conducted in the following databases: Scopus, Web of Science, PubMed, and ScienceDirect. For each database, the inclusion criterion was adopted in the form of the following keywords corresponding to the thematic area: vibroarthrography of the knee joint, acoustic emission. The following exclusion criteria were adopted:
  • Publication date older than 2014;
  • Lack of availability of full texts;
  • Type of publication (review articles);
  • Duplicates;
  • Lack of empirical data.
The next stage was the selection of initially selected literature, excluding duplicate publications, which reduced the number of items from 226 to 123. An initial content analysis was conducted based on titles and abstracts in relation to the research question, reducing the number of search results to 62. The next stage involved analysing the selected articles in terms of their methodology and relevance to addressing the research questions, which allowed for the exclusion of 8 publications due to the absence of complete research results, lack of relevant data, or low methodological quality. After the search and selection process, 54 scientific publications were included in this literature review. The flow diagram of the search and selection process for the reviewed literature is presented in Figure 1.

4. Vibroarthrography of the Knee Joint

The use of vibroarthrography for a knee osteoarthritis diagnosis is a complex process. The nonlinearity and nonstationarity of vibration signals from the knee joint arise from its complex biomechanics, fluctuating dynamic loads, and the diverse material properties of its tissues. The viscoelastic nature of articular cartilage contributes to nonlinear damping and vibration propagation. Furthermore, the varying mechanical characteristics of tissues like cartilage, bone, and menisci add to the complexity of the signals. Friction and wear within the joint, modulated by synovial fluid lubrication and the condition of joint surfaces, introduce additional nonlinear dynamics into the system’s response [80,81]. Comorbidities such as osteoporosis significantly influence the recording of VAG signals. Osteoporosis, marked by reduced bone density and structural weakness, can alter joint biomechanics and vibratory signal transmission, complicating the interpretation of VAG results. Reduced stiffness of the subchondral bone may dampen or distort signals generated during joint movement, while changes in joint mechanics and signal noise can lead to diagnostic inaccuracies.
Research highlights that osteoporosis-related subchondral bone changes contribute to osteoarthritis progression [82,83] and may accelerate joint degeneration, further obscuring signals linked to cartilage damage.
To improve diagnostic precision, VAG should be combined with other modalities, such as MRI, to assess both cartilage and bone. A diagnostic algorithm should incorporate bone density measurement via densitometry (DXA) and leverage machine learning models adapted for patients with osteoporosis. Future studies should focus on algorithms that address the biomechanical impact of osteoporosis on the knee joint. All the factors presented significantly complicate vibroacoustic diagnostics of creatures both in terms of recording and signal processing.
The first stage is the recording of vibrations generated by the knee joint using sensors placed in different areas of the knee joint during specific movements. The data acquisition system is described in Section 4.1. The next step is to process and filter the VAG signal data. Its purpose is to extract information from the mechanical signal and remove noise. The mechanical signal is converted into digital form through sampling. Signal processing occurs in the time and frequency domains. Time analysis is used to assess characteristic peaks and momentary deviations through signal changes that appear with time. Frequency analysis involves examining components at different frequencies, which helps identify characteristic frequencies associated with various pathologies in the knee joint. VAG signal filtration involves removing interference and noise that affect the interpretation of the recorded signal. This stage is described in more detail in Section 4.2. The processed and filtered features of the VAG signal allow for feature extraction, which is one of the key elements of data analysis. Feature extraction involves identifying and extracting the VAG signal parameters that best describe its properties and are related to the physiological processes occurring in the knee joint. The processed and filtered VAG signal features allow for feature extraction, which is one of the key elements of data analysis. Feature extraction involves identifying and extracting the VAG signal parameters that best describe its properties and are related to the physiological processes occurring in the knee joint. Using feature extraction, the VAG signal is transformed into numerical indicators, which facilitates their comparison and analysis. The final stage is the classification of the VAG signal, which is based on artificial intelligence methods. It is used to assign collected features to specific categories. The feature extraction and classification process is described in Section 4.3.

4.1. Data Acquisition

The first step in diagnostics using VAG signals is the data acquisition method. For this purpose, the test group is determined, the type and placement of the sensors are selected, the type of knee movement is tested during the examination, and the experimental configuration is set up. Table 2 provides an overview of the acquisition methods in the selected literature.
In recording VAG signals, the most commonly used sensors are accelerometers and microphones. Their selection depends on the type of signal being analysed, as well as the specifics of the study. Accelerometers are sensors that have been shown to be accurate for recording vibrations across wide frequency ranges. This is particularly important in recording VAG signals, which are variable. Another advantageous aspect of using accelerometers is their resistance to mechanical interference, which may result from the environment or the movement of the patient’s body. Contact microphones are widely used to record VAG signals. They are characterised by the ability to record low-frequency sounds, which makes it possible to detect even micro-damages in the knee joint. Another advantage is their lower cost compared to accelerometers. However, they are much less resistant to movement and more susceptible to ambient noise, which can lead to signal distortion. The types of sensors used in the analysed publications included accelerometers, contact microphones, AE sensors, and stethoscopes. The most commonly used type of sensors were accelerometers, which appeared in 17 studies [11,64,65,66,67,68,69,70,71,72,73,74,75,76,77]. In 10 studies [19,30,70,72,76,77,84,85,86,87], microphones were used to record VAG signals. AE sensors were used in nine of the analysed studies [21,31,69,88,89,90,91,92,93], and a stethoscope was used in one [94]. Figure 2 shows the locations of the sensors in the analysed literature. The attachment of sensors to the skin also has a significant impact on the VAG signal recording process. Their stable attachment affects the precision of the measurements of vibrations and sounds generated by the knee joint. For this purpose, hypoallergenic medical tapes, elastic tapes, contact gels, mounting patches and electrodes are mainly used.
Another important aspect in the process of recording VAG signals is the location of the sensors. Sensors placed closer to the knee joint result in higher accuracy of vibration recording because the signal is less likely to be distorted or attenuated [95]. The amplitude and accuracy of the VAG signal depend on the location over muscles and soft tissues. The thickness of the soft tissue affects the attenuation of the VAG signal. A stable sensor location will minimise interference caused by skin and muscle movements. Another positive solution is to use several sensors to record different types of vibrations resulting from the activity of individual structures of the knee joint. In 29 of 37 studies, sensors were placed around the patella. Vibroarthrographic signals are recorded during specific movements, including flexion and extension, sit-stand-sit movements, squat movements, and going up and down stairs.
Table 2. Review of acquisition methods in the selected literature.
Authors of Research StudyPopulationSensor Type and ModelSensor PlacementKnee Movement During the ExaminationData Acquisition
Wu et al., 2014 [96]45 normal, 20 abnormalAccelerometer (3115A, Dytran Instruments, Chatsworth, CA, USA)Mid-patellaFlexion/extensionUniversal amplifier, LabVIEW software, electro-stethoscope, Matlab R2011b software
Sarille et al., 2014 [88]8 normal, 9 abnormalAE sensorsPatellaSit-stand-sit, swing the leg Integrated AE system and data translation, preamplifier, interface module, GSL transformer, 24 bits A/D converter, MATLAB software, nominal centre frequency 190 kHz, sampling rate: 1000 Hz
Bączkowicz et al., 2014 [97]32 normal, 73 abnormalAccelerometer (4513B-002, Brüel and Kjær, Nærum, Denmark) Above the apex of the patellaFlexion/extensionMultichannel Nexus conditioning amplifier, MATLAB software, periodicity between 0.7 and 1000 Hz, frequency: 10 kHz, filtered: fourth-order zero-phase Butterworth band-pass digital filter with cutoff frequencies at 50 Hz and 1000 Hz
Bączkowicz et al., 2015 [98]220 normalAccelerometer (4513B-002, Brüel and Kjær, Nærum, Denmark)Above the apex of the patellaFlexion/extensionElectrogoniometer, transducer, low-noise measuring amplified series Nexus, computer equipped with a measuring card, AcquiFlex software, periodicity between 0.7 and 1000 Hz, frequency: 10 kHz, filtered: fourth-order zero-phase Butterworth band-pass digital filter with cutoff frequencies at 50 Hz and 1000 Hz
Ota et al., 2016 [94]16 normal, 17 abnormalGeneral stethoscope, nursing scope double (No. 120, Kenzmedico Co., Saitama, Japan) Medial and lateral epicondyle, patella, tibiaSit-stand-sitOperational amplifier, electrodynamic shaker, MATLAB R2013a software, sampling rate: 50 kHz, band-pass filter: 100 Hz–2 kHz
Wu et al., 2016 [99]55 normal, 18 abnormalAccelerometers (xyzPlux, PLUX Wireless Biosignals S.A., Lisbon, Portugal)Mid-patella, proximal patellaFlexion/extensionSignal acquisition hub, sampling rate: 1 kHz, OpenSignals software platform
Kręcisz et al., 2018 [100]72 abnormal, 33 normalAccelerometer, (4513B-002, Brüel and Kjær, Nærum, Denmark)Above the apex of the patellaFlexion/extensionElectrogoniometer, transducer, low-noise measuring amplified series Nexus, computer equipped with a measuring card, AcquiFlex software, periodicity between 0.7 and 1000 Hz, frequency 10 Khz, filtered: fourth-order zero-phase Butterworth band-pass digital filter with cutoff frequencies at 50 Hz and 1000 Hz
Khan et al., 2018 [89]38 normal, 11 abnormalFrequency acoustic emission sensor (R6α, Physical Acoustics Corporation, Princeton Jct, NJ, USA)Femur, tibiaSit-stand-sitDual-channel goniometer (SG150, Biometrics Ltd., Caerphilly, Wales), software: no data
Befrui et al., 2018 [11]30 normal, 39 abnormalAccelerometers (352A24, Piezotronics, Inc., Depew, NY, USA) piezoelectric disk (EPZ-27MS44F, Elektrotechnik Karl-Heinz Mauz GmbH, Ostfildern, Germany)Patella, medial tibial and lateral tibial
plateau
Flexion/extensionPotentiometer,
four single-ended simultaneous channels with 24-bit resolution, support for IEPE inputs, MATLAB software
Choi et al., 2018 [69]20 normal, 14 abnormalpiezoelectric sensors, custom-madeMedial and lateral epicondyle of the tibia, patellaFlexion/extension, sit-stand-sitSampling rate of 50 kHz, software: no data
Andersen et al., 2018 [101]11 normalAccelerometers (LIS344ALH, ST microelectronics, Geneva, Switzerland)Quadriceps tendon, lateral and medial side of the knee, patella, tibial tuberosityFlexion/extensionCustom-made device based on the Trentadue wireless multichannel surface electromyography (SEMG) recorder, custom adaptor, accelerometer probes made using micro-machined accelerometers, MATLAB 2016a software, amplification and filtering: recording device, low pass third-order sync filter 250 Hz, high-pass filter 10 Hz, sampling at 1000 Hz
Sharma et al., 2018 [102]51 normal, 38 abnormalAccelerometer (3115a, Dytran, Chatsworth, CA, USA)Mid-patellaFlexion/extensionSignal prefiltration range: 10–10,000 Hz, sampling rate: 2 kHz, software: no data
Kiselev et al., 2019 [90]29 abnormalPiezoelectric sensorLateral and medial part of the knee, except for the patellar cartilageSquatsBand-pass filters that pass frequencies in the range of 70–85 kHz, software: no data
Bączkowicz et al., 2019 [103]62 normal, 38 abnormalAccelerometer (4513B-002, Brüel and Kjær, Nærum, Denmark) Above the apex of the patella Sit-stand-sit, flexion/extension 10 kHz sampling rate, data filtering: fourth-order zero-phase Butterworth band-pass filter with cutoff frequencies 50–1000 Hz, software: no data
Kalo et al., 2020 [84]12 normalMicrophone (SPU0414HR5H-SB, Knowles Electronics, Itasca, IL, USA)Medial tibial plateau, patellaSit-to-stand, downstairs, flexion/extensionA/D converter, MATLAB R2018b, signal filtering using Butterworth hand-pass digital filter with cutoff frequencies of 100 Hz and 300 Hz
Gong et al., 2020 [104]26 normal, 25 with OAAccelerometer (BW21SG2, Fuji Ceramics, Fujinomiya, Japan)Mid-patellaSit-stand-sitConversion connector, preamplifier, sampling rate 25 kHz, PC oscilloscope, PicoScope 6 Software
Kalo et al., 2020 [91]19 normalAcoustic sensors (SPU0414HR5H-SB, Knowles Electronics, Itasca, IL, USA)Medial tibial plateau, patellaSit-stand-sitA/D converter with a sampling rate of 16,000 Hz, 8 AI (14-bit, 48 kS/s), 2 AO (150 Hz), 13 DIO USB multifunction I/O device, MATLAB R2018b
Madeleine et al., 2020 [105]20 normal, 20 abnormalAccelerometers (LIS344ALH, ST microelectronics, Geneva, Switzerland)Patella, tibial tuberosity, above the knee, next to the lateral and medial epicondyle of femur Sit-to-stand, stairs descent, stairs ascentCustom-made Trentadue wireless multichannel recorder, custom 16-channel accelerometer adaptor, MATLAB 2016a, sensitivity: 600 mV/g, linear transmission: 0–1800 Hz, band-pass filter: 10–500 Hz, sampling rate: 2000 Hz
Befrui et al., 2020 [106]30 normal, 39 abnormalAccelerometer (352A24, PCB Piezotronics Inc., Depew, NY, USA)Patella, medial and lateral tibial plateauFlexion/extensionFrequency range 1–8000 Hz, sensitivity 10.09 mV/m/s2, Measurement range 50 m/s, resonant frequency 38,300 Hz, constant current excitation 2–20 mA, piezoelectric disk with resonant frequency 4400 Hz, impedance 300 Ω, potentiometer, dynamic signal analyser, software: no data
Khan et al., 2021 [31]41 normal, 23 abnormalPiezoelectric sensors (R6α, Physical Acoustics Corporation, Princeton Jct, NJ, USA)Medial and lateral condyle of the tibia, medial and lateral epicondyle of the femurSit-stand-sitFour preamplifiers, AE main amplifier, AE acquisition device, electrogoniometer, amplification unit, software: no data
Ozmen et al., 2021 [107]10 normalAccelerometer (3225F7, Dytran Instruments, Chatsworth, CA, USA)Mid-patellaFlexion/extensionSensitivity 100 mV/g in the 50 Hz–10 kHz frequency band, USB-4431 data acquisition unit, power amplifier 2781, electrodynamic mini shaker, impedance head with sensitivity 30 pC/g, charge to constant current live drive converter, MATLAB software
Gong et al., 2021 [92]36 normalPiezoelectric sensors (7BB-20-6L0, Murata, Kyoto, Japan)TibiaSit-stand-sitAccelerometer, tri-axis accelerometer, analogue-to-digital converter, sampling rate: 2000 Hz, software: no data
Shidore et al., 2021 [108]51 normal, 39 abnormalAccelerometer (3115A, Dytran Instruments, Chatsworth, CA, USA)Mid-patellaFlexion/extensionLabVIEW software, sampling rate: 2 kHz, frequency range: 10 Hz–1 kHz
Karpiński et al., 2021 [30]10 normal, 10 abnormalPiezoelectric contact microphone (CM-01B, TE Connectivity, Schaffhausen, Switzerland)PatellaFlexion/extensionMeasurement system based on Arduino Mega2560 board: bandwidth spans from 8 Hz to 2.2 kHz, sampling frequency 1400 Hz with 10-bit resolution, digital encoder, 11.1 V lithium-ion battery. Data logging using RealTerm software in ASCII format
Nevalainen et al., 2021 [72]55 normal, 54 abnormalAir microphone (Audio-Technica AT899, Stow, OH, USA), IMU Sensors (SparkFun 6 DOF IMU Digital Combo Board-ITG3200/ADXL345Medial and lateral sides of the bone, thigh, and shinFlexion/extension, sit-to-stand, one-leg standSampling frequency 44.1 kHz, soundcard, frequency 100 Hz, software: no data
Karpiński 2022 [85]25 normal, 25 abnormalPiezoelectric contact microphone (CM-01B, TE Connectivity, Schaffhausen, Switzerland)PatellaSit-stand-sitBandwidth from 10 Hz to 2 kHz, software: no data
Karpiński et al., 2022 [76]33 normal, 34 abnormalPiezoelectric contact microphone (CM-01B, TE Connectivity, Schaffhausen, Switzerland)PatellaFlexion/extension, sit-stand-sitBandwidth from 10 Hz to 2 kHz, orthosis with vibration transducers, 10-bit Bourns magnetic digital encoder, 8-bit Atmega2560 microcontroller with 10-bit ADC, ADuM4160 USB 2.0 isolator, software: no data
Karpiński et al., 2022 [77]33 normal, 34 abnormalPiezoelectric contact microphone (CM-01B, TE Connectivity, Schaffhausen, Switzerland)PatellaFlexion/extension, sit-stand-sitBandwidth from 10 Hz to 2 kHz, orthosis with vibration transducers, 10-bit Bourns magnetic digital encoder, 8-bit Atmega2560 microcontroller with 10-bit ADC, ADuM4160 USB 2.0 isolator, software: no data
Jeong et al., 2022 [109]16 normal Accelerometers (3225, Dytran Instruments, Chatsworth, CA, USA)PatellaSquatsSensitivity: 100 mV/g, broad bandwidth: up to 10 kHz, low noise floor: 700 ugrms, sampling rate: 25 kHz, device: NI USB-4432, National Instruments Corporation, MATLAB software
Vatolik et al., 2022 [70]15 normalMicrophone (MR-28406-000, Knowles Electronics, Itasca, IL, USA)Lateral soft part of the knee below the patellofemoral jointSit-stand-sitFrequency range 100 Hz–4.7 kHz, Laryngograph DSP Unit, Speech Filing System software
Khokhlova et al., 2022 [93]8 normalPK151 AE sensorRight medial tibial condyle area CyclingUSB AE node monitoring system, acoustic sensor with frequency range of 100–450 kHz, integrated preamplifier, software: no data
Kręcisz et al., 2022 [110] 220 normalAccelerometer with a multichannel NEXUS conditioning amplifier (413B-002, Brüel and Kjær Sound and Vibration Measurement A/S, Nærum, Denmark)Above the patella apexFlexion/extensionFrequency range: 0.7–1000 Hz, sampling rate 10 kHz, signal filtering: fourth-order zero-phase Butterworth band-pass digital filter with cutoff frequencies 50–1000 Hz, software: no data
Khoklova et al., 2023 [21]51 normalPK3I—30 kHz AE sensor with low-power, integral preamp, Physical Acoustics;
PK15I—150 kHz sensor with low-power, integral preamp, Physical Acoustic
Right medial tibial condyle areaCyclingMATLAB software
Karpiński et al., 2023 [19]40 normal, 44 abnormalPiezoelectric contact microphone (CM-01B, TE Connectivity, Schaffhausen, Switzerland)PatellaFlexion/extensionBandwidth from 10 Hz to 2 kHz, Bourns digital encoder, RealTerm software, in ASCII format
Borzucka et al., 2024 [111]38 normalAccelerometer with a multichannel NEXUS conditioning amplifier (413B-002, Brüel and Kjær Sound and Vibration Measurement A/S, Nærum, Denmark)PatellaSquatsFrequency range: 0.7–1000 Hz, sampling rate 10 kHz, signal filtering: fourth-order zero-phase Butterworth band-pass digital filter with cutoff frequencies 50–1000 Hz, software: no data
Machrowska et al., 2024 [86]63 normal, 49 abnormalPiezoelectric contact microphones (CM-01B, TE Connectivity, Schaffhausen, Switzerland)Condyle of the femur on the lateral and medial sides, patellaFlexion/extensionArduino Mega2560 R3 module, Bourns encoder, software: no data
Machrowska et al., 2024 [87]51 normal, 47 abnormalPiezoelectric contact microphones (CM-01B, TE Connectivity, Schaffhausen, Switzerland)PatellaFlexion/extensionArduino Mega2560 R3 module, Bourns encoder, software: no data
The data acquisition method is the first step in the analysis of the knee joint VAG signal. In the presented literature, the most commonly used type of sensor was accelerometers. One important factor in signal recording is the location of the sensor because the VAG signal received is based on the recording site. Accurate assessment of the knee joint condition is closely related to the location of the sensors. In the literature, the medial compartment below the midline of the patella is indicated as the optimal location due to the proximity of the contact area between the moving surfaces of the knee joint, which increases sensitivity [8]. This sensor placement is also advantageous due to the fact that actual knee joint movement and muscle contraction interference do not affect positional stability [8,96,112,113,114]. The most common knee movement is from flexion to full extension where in the full knee extension position the angle between the femur and the tibia is 0°, and in the flexion position the knee forms a 90° angle [114]. The selection of an accelerometer is significantly influenced by its parameters, such as sensitivity and frequency response. The typical bandwidth used is 10 kHz, while the sensitivity ranges from 100 to 600 mV/g [11,65,105,113,115]. Sensors were usually placed on the skin using double-sided tape. Inappropriate placement of sensors can affect the formation of artifacts. Various types of knee movements were also observed during the study, the most common of which were flexion and extension. Their angular velocity is also related to the movement, which affects the recorded signals.
In order to use vibroarthrography as an early diagnostic method for OA, the signal would need to be recorded in a group of people affected by this disease and in a control group to have a comparison between normal and abnormal signals. However, in the following studies [21,70,84,91,92,93,98,101,107,109,110,111], the VAG signal was recorded only in healthy individuals. This makes it possible to draw conclusions about the characteristics of a normal signal, but there is no reference point. A similar situation occurs when limiting oneself to recording signals only from the group affected by OA [90]. Also, obtaining signals from small groups of examined patients, as in the case of the studies [30,69,88,89,94,104,105], seems to be unreliable. Such results can be considered preliminary and need to be replicated in larger groups to make them credible and prove their repeatability. This may also affect the possibility of missing important relationships due to insufficient data. It would also be necessary to select people for the control group whose good condition of the knee joint has been previously confirmed by appropriate diagnostics. This would exclude the possibility of possible signal recording from people who may not be aware of the early stages of OA. The data acquisition method would need to be standardised if it was to be used in clinical trials.
The raw VAG signal seems to be insufficient for accurate analysis. For this purpose, it should be processed and filtered.

4.2. VAG Signal Preprocessing and Filtration

Signal processing and filtering is another key step in VAG signal analysis. Its purpose is to prepare data for further analysis by eliminating interference and improving the signal quality. The signal is preprocessed to minimise measurement artifacts that can negatively affect the accuracy of signal analysis. The most common artifacts are random noise, muscle contraction interference (MCI), baseline wander, and low-frequency motion artifacts [42,116,117]. Thermal effects of electronic components in the measuring system and semiconductor defects in medical instruments can also generate random noise [118]. MCI is a disturbance resulting from muscle activity or, more precisely, mechanical vibrations of muscles near the knee joint. The resulting acoustic waves interfere with the signal from the joint movement, making it difficult to distinguish the muscle signal from the joint signal. Baseline wander is caused by the patient’s body movements resulting from pain during the movement. Low-frequency motion artifacts are caused by improperly attached sensors, a lack of stability during measurement, and external body movements.
VAG signal filtration is based on two main types of filters, which include fixed and adaptive filtering. Fixed filtering includes band-pass filters and low- and high-pass filters. Band-pass filters are used to pass signals in a specific frequency range. The VAG signal removes higher and lower frequency components that are important for signal analysis. The frequency of the vibroarthrographic signal is usually in the range of 10 Hz to 2 kHz, which corresponds to the natural vibrations of the knee joint. A fourth-order digital Butterworth band-pass filter with cut-off frequencies between 50 Hz and 1000 Hz was used in the work of Kręcisz et al. [100]. Low-pass filtering attenuates higher frequencies than a set threshold and is used to remove interference that may come from external sources. An example of a low-pass filter is the 20th-order cascade moving average filter, which is used to remove the baseline wander artifact in the work of Yang et al. [119]. This is a type of digital filter that performs multistage filtering based on a moving average. Its purpose is to smooth the signal while suppressing higher frequencies. The filter structure consists of stages (cascades), each of which increases the accuracy and improves the filtering efficiency. Cascading the filter allows for more effective smoothing of the signal while maintaining its key features [120]. Low-pass filtering was also used in the work of Ma et al. [121]. A finite impulse response (FIR) moving average filter was used to locally smooth the signal and thereby remove its noise [122]. Another filter belonging to this type of filtration is the Butterworth filter used by Sarille et al. [88]. It removed frequencies above 100 Hz, after which a notch filter was used to remove power line interference (PLI) at 50 Hz. Befrui et al. [11] used semi-automatic segmentation using a relative angular signal to extract the extension and flexion cycles from the VAG signals. The analogue signal was then low-pass filtered using an RC filter with a cutoff frequency of 4.5 Hz. The aim of the filtering was to suppress signals originating from small muscle movements or tremors. Cycles with a variance exceeding twice the variance of the entire segment were excluded. Cycles shorter than one second were also excluded as they did not comply with the measurement protocol. Cycles with values at the border of the analogue-to-digital converter saturation were also rejected because the cycles of the VAG signals without artifacts were below this limit. Shidore et al. [108] implemented the cascaded moving average filter (CMA) to evaluate and remove baseline wander from the raw VAG signal. The principle of its operation is based on cascading several moving average filters, which allows for better smoothing of signals. High-pass filtering is used to eliminate lower frequencies than a set threshold that may be allied to the patient’s body or muscle movement. Adaptive filtration is more complex; it adapts to changing characteristics by changing the filter parameters over time [65]. In 2014, Wu et al. [96] introduced a new method incorporating ensemble empirical mode decomposition (EEMD) and detrended fluctuation analysis (DFA) to improve the quality of the VAG signal with large SNR improvements compared to the raw signal. The purpose of EEMD is to decompose the raw VAG signal into a set of intrinsic mode functions (IMFs) with fast and slow oscillations. For each IMF, a fractal scale index parameter is calculated using DFA to identify long-range correlations and anticorrelation components. The obtained results compared better to those obtained using wavelet transform decomposition and time-delay neural filters. In the analysed literature, this filtration method was also used by Karpiński et al. in their works [76,77]. However, the signal was previously prepared by cutting the signal in the limb movement cycle regime. The raw signal was reduced in irrelevant time series. For this purpose, automatic slope detection was used, which made it possible to detect the beginning and end of working cycles in the encoder signal. Machrowska et al. [87] used the combined EEMD-DFA method to extract frequency ranges relevant to the progression of knee OA. This combination is considered advantageous due to the complexity and nonstationary nature of the VAG signals originating from the knee joint. A reduced noise figure was achieved, which had a positive impact on the results. Gong et al. [104] used a combined EMD and CWT analysis method, which allowed for monitoring pathological changes in the knee joint.
Filtration of vibroarthrographic signals is one of the key stages of their analysis. Removing artifacts is one of the essential factors that influences the quality of the VAG signal. Clinical application requires the use of high-quality signals. Both fixed and adaptive filtration are used in the analysed literature. The purpose of a properly selected filtration method is to improve the classification process. After processing and filtering the vibroarthrographic signal, feature extraction should be performed to remove the resulting artifacts.

4.3. Feature Extraction and Classification

In signal analysis, one should not focus on every instantaneous change in value as this is impractical and unachievable as the dynamics of changes usually exceed human perceptual capabilities. Instead, it is crucial to identify those signal values that define the most characteristic and significant points for the entire course of the signal.
In vibroacoustic diagnostics, many features (parameters) of the signal, known as state indicators, are utilised. Over the past years, researchers have approached preprocessing and parameter extraction in vibroacoustic signals in various ways [73]. This subsection discusses the key concepts and characterises the ranges of features used in further analyses.

4.3.1. Feature Extraction and Selection

Feature extraction is an extremely important process in the analysis of the vibroarthrographic signal following the removal of artifacts. Further processing of the filtered signal is necessary because some pathological events occur at a specific time. It involves extracting interesting features through the frequency, time, and time–frequency domains.
Time domain features are characterised by their ease of acquisition and use for the description and characterisation of raw vibroarthrographic signal contents. Kurtosis, skewness, and entropy may be discriminant features [123]. Kurtosis is used to measure the tendency of the probability density function (PDF) to have peaks, and skewness is used to measure the asymmetry of the PDF. Entropy is used as a representation of the nature and distribution of the PDF and to measure the inherent randomness that is observed in the probability distribution. In their work, Rangayyan et al. [123] indicate features such as the form factor (FF), which is defined by parameters of mobility, activity, and complexity. Its purpose is to provide information about signal variability. Turns count (TC) is also used to characterise VAG signals [124] and can be used to detect changes in amplitude, fluctuations, and the number of peaks [115].
Yang et al. [119] identified two new features—the fractal scaling index (FSI) and averaged envelope amplitude (AEA)—to characterise the fluctuations in VAG signals. FSI was calculated using a detrended fluctuation analysis (DFA) algorithm. Measuring internal correlations and signal irregularities makes it possible to indicate pathological features in the knee joint. AEA provides information on the intensity of signal fluctuations. It is also used to measure the difference between the upper and lower envelopes of the signal over time. The Kolmogorov–Smirnov two-sampled test was used to check the statistical significance of the extracted features between the groups of pathological and normal signals. The study demonstrated a significantly increased averaged envelope amplitude of pathological signals (0.434 ± 0.154) compared to normal signals (0.267 ± 0.179). The fractal scaling index has an average value for the group of normal signals (0.533, StDev 0.096), while the group of pathological signals shows a significantly different distribution of fractal scaling index features (mean ± StDev 0.635–0.092). The combination of these features allows us to distinguish healthy joints from those with pathological changes.
Befrui et al. [11] used segmentation to isolate flexion and extension segments. Different amplitudes of acoustic emissions produced by the ascending and descending phases were recorded. The features that were extracted from the ascending phase show a difference between knees with osteoarthritis and healthy knees.
Features related to the time domain were extracted by Nalband et al. [125] and include recurrence quantification analysis (RQA), approximate entropy (ApEn), and sample entropy (SampEn). Recurrence quantification analysis (RQA) is used to analyse complex, nonlinear dynamic systems. The key parameters used are the recurrence rate, determinism, and Shannon entropy. Approximate entropy is used to determine the levels of complexity in a time series. Sample entropy is used to reduce the bias that is caused by self-matching. SampEn is independent of the data length and has comparable consistency. Then, the wavelet energy of the suband signals was calculated based on the three features described above. Feature selection was performed to remove significant and unnecessary features, which increases the accuracy performance of the classifier. Both the genetic algorithm and the apriori algorithm were used for feature selection techniques.
In their study, Shidore et al. [108] extracted features such as shape factor (SF), impulse factor (IF), margin factor (MF), and crest factor (CF) in addition to the previously described skewness (S) and kurtosis (K) for time domain feature extraction. The shape factor (SF) can be defined as a dimensionless function that is based on the form and distribution of signal attributes, which include peaks and troughs in the time domain [126]. The coefficient value is higher for signals of people with knee joint pathologies compared to regular VAG signals. The impulse factor (IF) is useful in understanding the occurrence of abnormal peak levels in vibration signals [127]. The use of IF can provide information on the occurrence of abnormal friction between the knee joint surfaces in the VAG signals. Margin factor (MF) shows higher values for abnormal VAG signals compared to normal signals. The crest factor (CF) is considered appropriate for signals characterising pathological behaviour of the knee joint. Despite this, in that work, the crest factor showed a correlation of <10% with the categorisation of VAG signals. In addition to the time domain features, spectral domain features were also extracted, such as the spectral mean and spectral peak, spectral flux, spectral slope, spectral skewness, and spectral kurtosis. The measure of the quantitative change in spectral shape is the spectral flux. Its output range is dependent on the frequency transformation as well as normalisation of the vibration signal. Low spectral flux is observed when there is no abrasion of moving parts causing vibrations, as well as spikes at the vibration peaks. Another important feature is the spectral slope, which concerns the distribution of energy at different frequencies. Spectral slope can be defined as the difference in amplitude between low and high frequencies. It is used to assess the knee joint condition where lower signal frequencies indicate smooth joint movements, while higher frequencies indicate pathological changes in the knee joint. The selection of extracted features in the time domain and spectral domain was performed using the mutual information test, Chi-square test, and ANOVA F-test. The obtained results indicated lower values of the features of healthy people compared to people with knee joint problems.
Karpiński et al. [59] also distinguished such features as the crest factor, impact factor, shape factor, and kurtosis described above, as well as the straightened average value (SA), root-mean-square (RMS), peak value (PV), peak-to-peak value (PPV), and variance (VAR). Straightened average value (SA) is used to assess the signal level regardless of its change in direction. It is especially useful in the analysis of oscillatory signals. Root-mean-square (RMS) is a measure of the energy of a signal. It is a key tool in evaluating signals with variable amplitude. Peak value (PV) is defined as the maximum value of the signal amplitude during its duration. It is used to assess the amount of fluctuation that may occur in the signal. Peak-to-peak value (PPV) can be defined as the difference between the highest positive and negative values in a signal. It is important in evaluating signals with variable amplitude. The last-mentioned determinant is variance (VAR), which can be described as a measure of the dispersion of the signal. High variance is directly related to the occurrence of large changes in signal amplitude, which, in turn, may result from the presence of interference. Statistical analysis was performed to determine the occurrence of statistically significant differences between the signal features for the recorded signals in the healthy group and in the group of people with knee OA. For this purpose, the Kolmogorov–Smirnov, Lilliefors, and Shapiro–Wilk tests were performed to determine whether the discriminant values of the acoustic signals were normally distributed in both groups [128,129]. The Fisher’s, Levene’s, and Brown and Forsyth tests were used for the analysis of equality of variances. The Student’s t-test was used to test the equality of variances and normality of the distribution; for results with a normal distribution but a lack of equality of variances, the Cochran–Cox test was used [130]. The Mann–Whitney U test was used with a continuity correction for discriminants without a normal distribution. On this basis, seven discriminants with significant statistical differences between the analysed groups were selected and used as input data in the subsequent classification. These included SA, RMS, VAR, PV, PPC, CF, and K.
Similar features were also included by Ma et al. in their work [121]. In addition to PPV, AE, VAR, MF, K, S, and FF, they also included the impulse index (II), the purpose of which is to detect statistical parameters of the presence of shocks in the VAG signal.
Further time domain features, such as M6A and M8A, were included in the works of Karpiński et al. [76,77]. The M6A parameter can be described as the sixth central moment. Higher central moments may indicate skewness and kurtosis of the signal. In turn, the M8A parameter is the eighth central moment whose higher values enable a more accurate description of the signal nonlinearity and its extreme values.
The frequency domain is more complex than the time domain. Its purpose is to explore the frequency content of the VAG signal. Fourier transform (FT) is widely used to convert a signal from the time domain to the frequency domain [123,124]. However, this method seems to be insufficient due to the nonstationary nature of VAG signals.
Machrowska et al. [87] included the FM4 parameter in the frequency domain. FM4 can be described as the kurtosis of the differential signal. It is used in the analysis of complex dynamic phenomena. FM4 characterises the amplitude of the differential signal.
Time–frequency domain analysis uses techniques such as short-time Fourier transform (STFT), wavelet transform (WT), and Wigner Ville distribution. STFT extends the classical Fourier transform to analyse nonstandard signals whose characteristics change over time. Its purpose is to divide the signal into short time segments for which a standard Fourier transform is performed [131]. Wavelet transform is a signal analysis technique that offers variable time–frequency resolution, in contrast to STFT. Functions called wavelets are scaled and shifted in time, making it possible to analyse signals with different scales and frequencies [132].
Sarille et al. [88] used wavelet packet transform (WPT) for feature extraction. WPT is an extension of wavelet transform (WT) whose task is to decompose the signal into sub-bands of different frequency and time resolutions. Feature extraction was performed for each distributed wavelet coefficient. Statistical parameters such as skewness and kurtosis were used as features. The use of WPT generates a multidimensional feature vector, which makes it possible to obtain more information about the signal. Unfortunately, this is associated with an increase in the values of the pattern classifier learning parameters and computational complexity. For this reason, the principal component analysis (PCA) method was used to reduce the features. From the total number of 60 features extracted from the decomposed signal, their number was reduced to 26 for SW movement and 27 for SSS movement using PCA.
For feature extraction in the time–frequency domain, Gong et al. [92,104] used continuous wavelet transform (CWT). At high frequencies CWT analysis is performed to observe the frequency response of the reconstructed signal. CWT tends to provide good time resolution and relatively poor frequency resolution, while at low frequencies, it provides good frequency resolution and relatively poor time resolution [133]. Continuous wavelet transform peak values were obtained in all flexion and extension frequency ranges. In healthy individuals, a higher value of the coefficient was noted in the low-frequency band, while in individuals diagnosed with knee osteoarthritis, the value was higher in the high-frequency band.
In their work, Kręcisz et al. [100] performed feature extraction divided into time domain features (VMS, signal amplitude), frequency domain features, complexity features (FF, SHE, TC, DFA, MSE), and nonlinear features (RR, DET, LAM, ENT, TT, LMAX). STFT analysis was used to examine the frequency characteristics of the VAG signal. The discrete Fourier transform was calculated to obtain the short-term spectrum (150 samples each), Hanning window, and 100 overlap samples of each segment. The spectral activity was analysed by summing the spectral power of the VAG signal in two bands of 50–250 Hz (P1) and 250–450 Hz (P2). Calculation of the spectral density at 470 Hz (F470) and 780 Hz (F780) from the fast Fourier transform derived two additional parameters from the fast Fourier transform of the VAG signal. A genetic algorithm was used to select the most important features for classification. During the study, it was noted that abnormal signals generate higher values of time domain parameters (VMS, amplitude signal) and frequency domain parameters (F470, F780, P1, P2), with lower RQA parameters (RR, DET, LAM, ENT, TT, LMAX) and FF, TC, DFA, and MSE (complexity features).

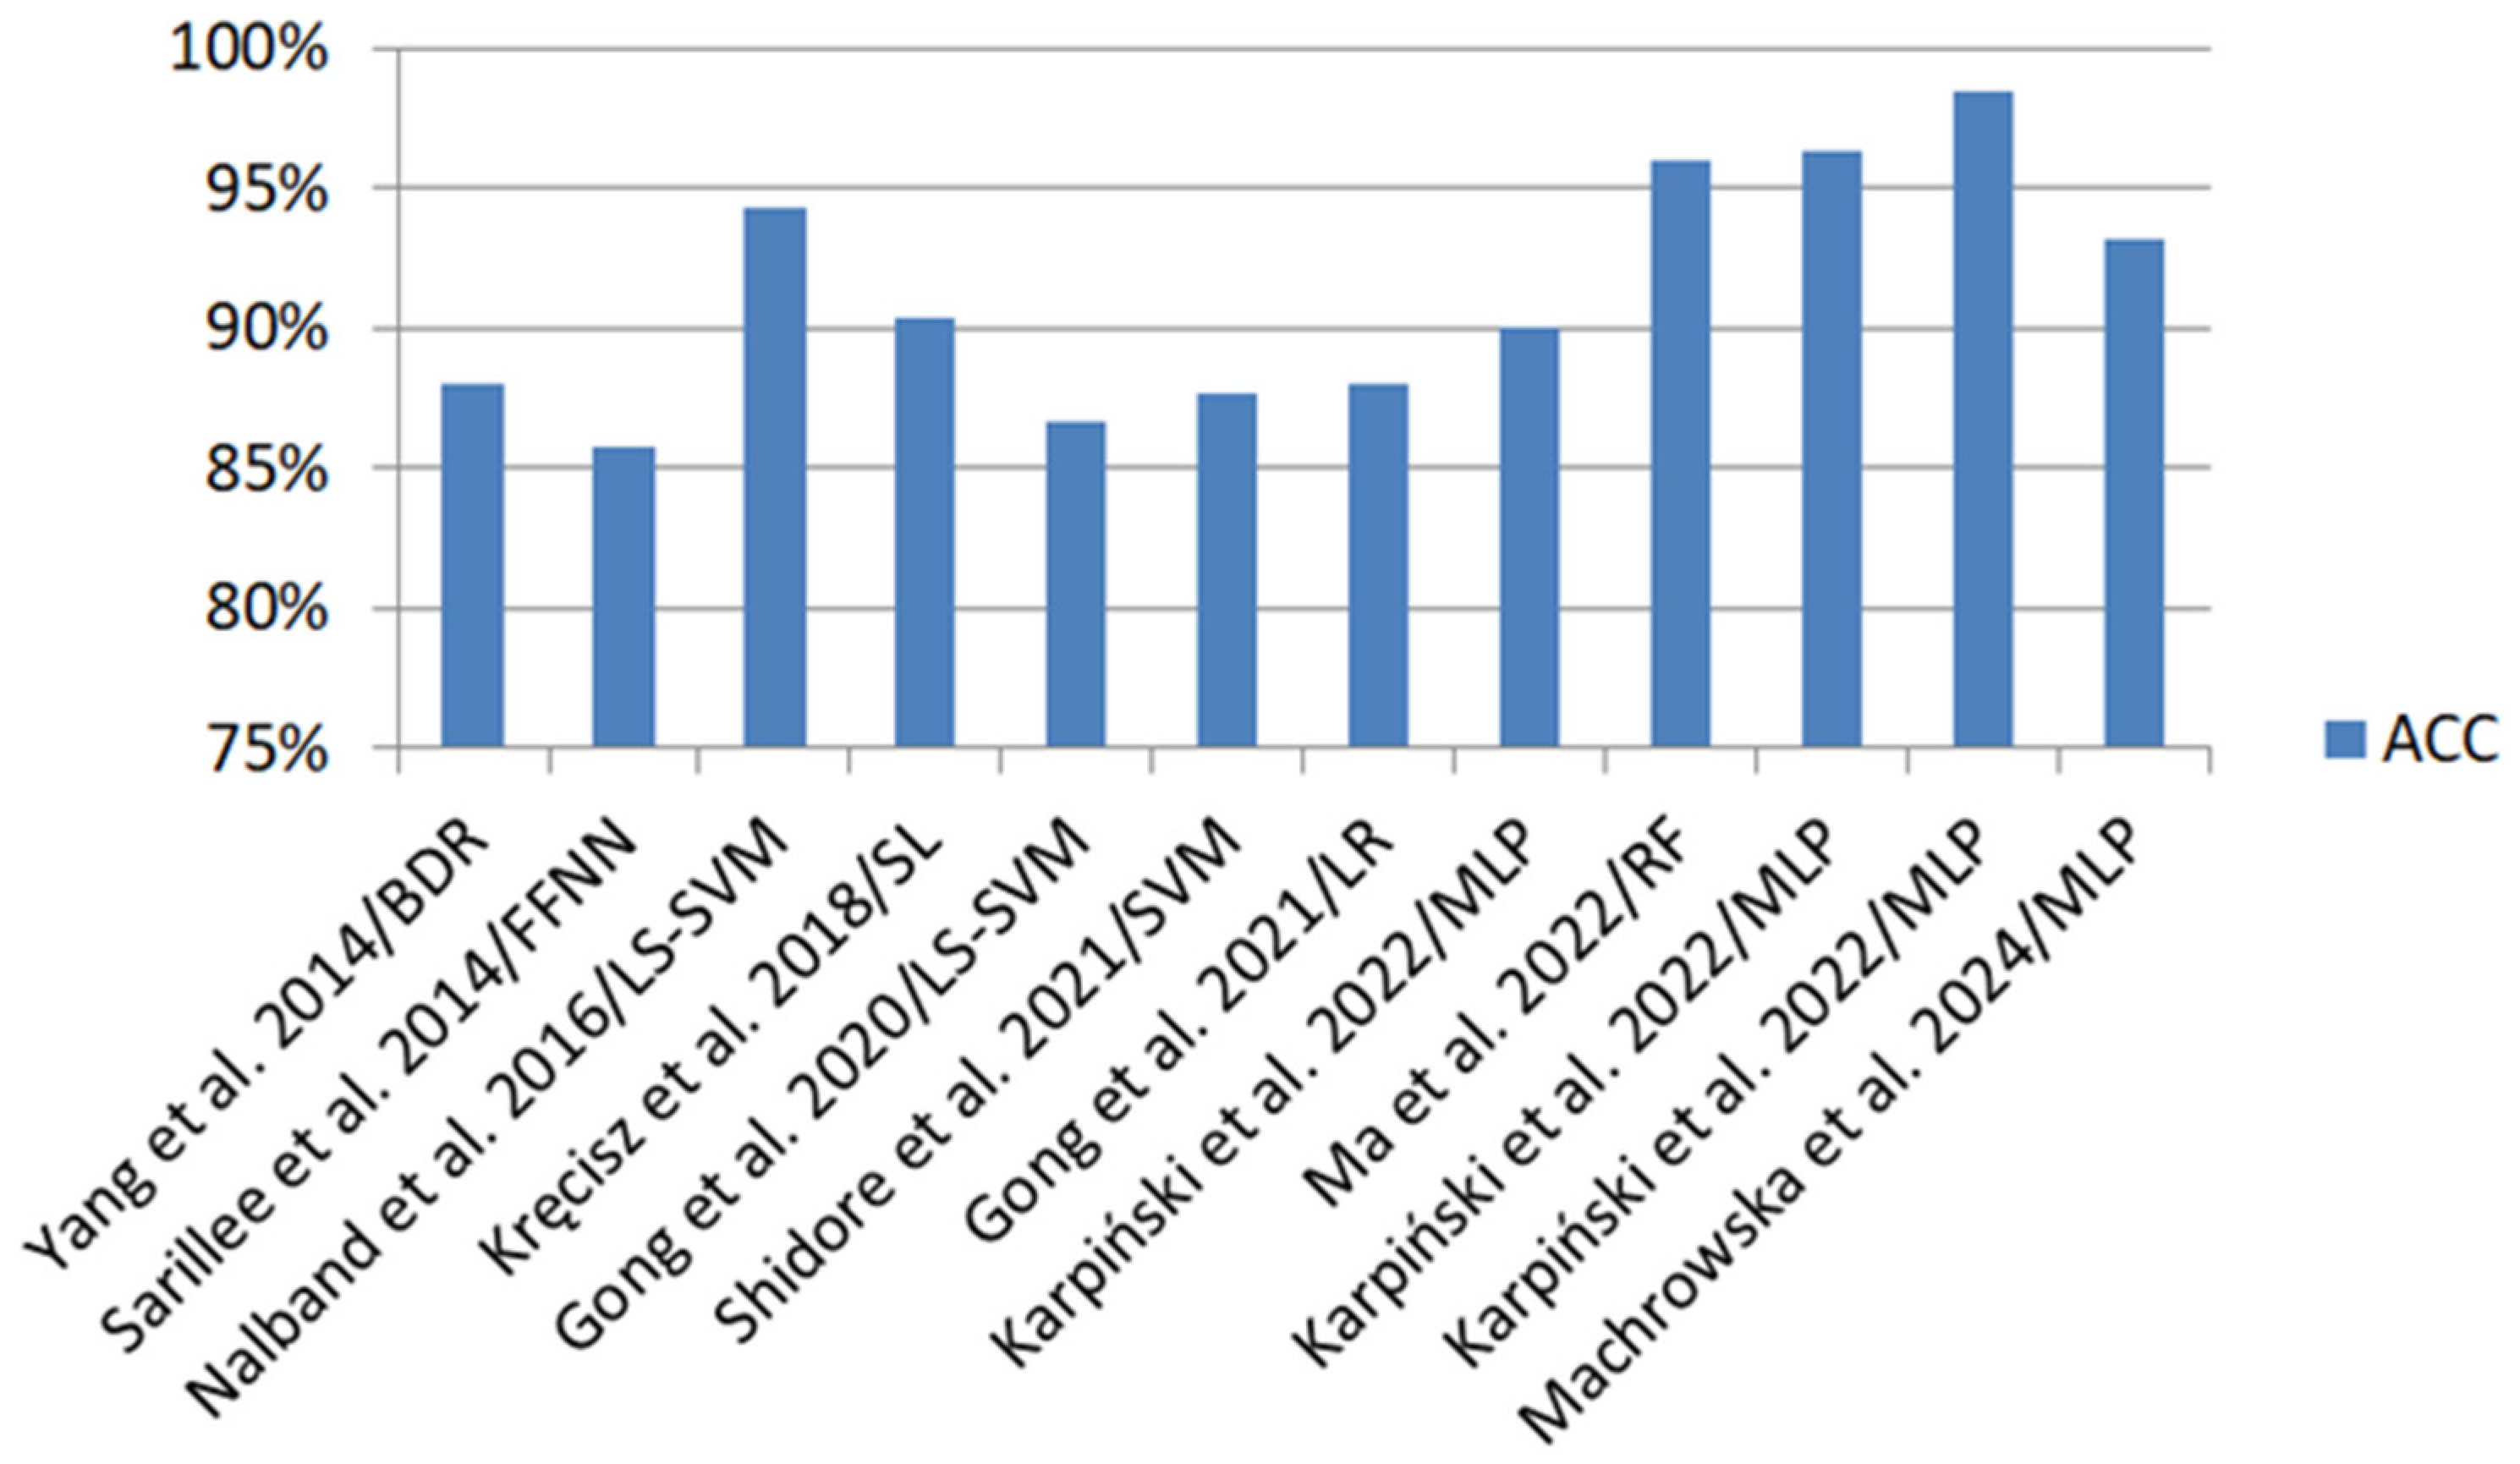
4.3.2. Classification

The final step of VAG signal analysis is classification, the aim of which is to predict knee joint pathology by extracting important information from the dataset depending on its similarity to previously used examples. The classification process uses previously described parameters and statistical methods. An important aspect is their appropriate selection in order to maximise the accuracy of prediction.
Befrui et al. [11] used the support vector machine (SVM) classification method to distinguish healthy knees from knees with OA. SVM is a single-layer and highly nonlinear model that is characterised by a higher generalisation ability in accurately classifying unknown data [134,135]. They achieved a specificity of 0.75 and a sensitivity of 0.80. Sarille et al. [88] also used an SVM classifier and achieved a classification accuracy of 83.37% for the sit-stand-sit (SSS) movement and 85.74% for the swing-the-leg (SW) movement. They achieved comparable accuracy using the feedforward neural network (FFNN) classifier, which achieved results of 83.27% and 85.74% for SSS and SW movements, respectively. Yang et al. [119] used an extension of the classic version of SVM, which is the least squares support vector machine (LS-SVM) and Bayesian decision rule (BDR). The overall accuracy (ACC) of the LS-SVM method was 82.67%. Significantly better results were observed when using the BDR VAG signal classification method, which uses information on feature density to distinguish normal VAG signals from those with pathological changes; an ACC of 88% was achieved. Gong et al. [104] also used the LS-SVM classifier in their work. The classification was performed for five different feature sets. The lowest ACC of 74.19% was achieved for the following features: K, S, CWT 100–200 Hz, and CWT 200–500 Hz; whereas, the highest ACC of 86.77% was achieved for the feature set consisting of K, S, CWT 100–200 Hz, CWT 200–500 Hz, CWT 500–1000 Hz, and CWT 1000–2500 Hz. A higher classification result using the LS-SVM method was achieved by Nalband et al. [125]. An ACC of 91.01% was obtained using the genetic algorithm (four features), the use of all 24 features produced an ACC of 93.13%, while the use of the a priori algorithm resulted in an increase in ACC to 94.31%. In their study, they also used random forest (RF) as a classification method. This classification method is based on building multiple decision trees [136]. The classification accuracy using this classifier produced an ACC of 86.52% for all 24 features and the use of the a priori algorithm increased the ACC to 89.77%, while the genetic algorithm influenced the achievement of an ACC of 91.01%. The accuracy using the RF classifier achieved by the team of Ma et al. [121] is definitely worth noting. The ACC achieved was in the range of 93–96%. For comparison, the accuracy result using SVM in their study was 79–95%. They also used the K-nearest neighbor (KNN) classification method, which is based on the neighbourhood of points in the feature space. The KNN classifier calculates a distance metric between the unlabelled and labelled feature vector data, then identifies the k-nearest objects [137,138]. The accuracy of this classifier reached > 90%. Gong et al. [92] also used this method in their work and achieved an ACC of 87.25%. In addition, in their work, they used a logistic regression (LR) classifier whose ACC of 88% was similar to that achieved by KNN. Another classification method considered by Shidore et al. [108] is Naïve Bayes (NB), which is based on Bayes’ theorem. It assumes that features are not dependent on each other. In the presented work, the accuracy of this classification method reached > 80%. In the analysed literature [76,77,85,87], classification methods such as a multi-layer perceptron (MLP) and radial basis function network (RBF) were also used. MLP is one of the most popular types of artificial neural networks, which is characterised by data flowing from input to output without feedback [139,140]. In turn, RBF is also a type of artificial neural network, but it is distinguished from MLP by the type of activation function and the method of processing data. It is a unidirectional three-layer network, which includes input, hidden, and output layers [141]. A noteworthy accuracy result using the MLP classifier is the ACC of 93.37–96.32% achieved by Karpiński et al. [76]. In another work by this team [77], an ACC of 98.53% was achieved for this classifier, while the RBF classifier achieved a classification accuracy of 97.06–98.53%. In the work of Machrowska et al. [87], an impressive ACC of 91.89–93.24% was also achieved using MLP.
The selected works, along with the feature extraction, classification methods, and classification evaluation, are included in Table 3.
Figure 3 shows the results of the achieved accuracy of the classification methods used in the selected works. In the case of using several classification methods by the research team, the methods that were characterised by a higher accuracy result were distinguished.
Studies on the use of vibroarthrography as a diagnostic method in clinical practice involve testing new classification models. This is due to the constant pursuit of the highest possible level of classification accuracy. Most of the studies that were included in this review showed promising classification results at an accuracy level above 80%. An impressive classification result (ACC 97.06–98.53%) using the RBF classifier was obtained in the study of Karpiński et al. [77]. An equally promising ACC result of 93–96% using the RF classifier and was achieved in the work of Ma et al. [121]. In the same study, the KNN classifier was used whose ACC was 91–95%. Also, the use of the MLP classifier achieved an accuracy of over 90% [76,77,86]. Despite such successful classification results, there is no single, specific, effective algorithm. The authors who analysed the same classification methods relied on different data, so it is difficult to clearly assess the comparability of the results. The fact that subsequent methods are being tested also indicates the importance of further work in this respect. Future work should focus on two issues. The first is to use new classification methods on exactly the same datasets, which provide sufficient comparability of the methods. The second approach should be to test the same algorithm with different feature sets to find the best approach.

5. Discussion, Limitations, and Future Perspectives

Vibroarthrography (VAG) is a promising diagnostic method for assessing the condition of the knee joint, especially in the context of pathologies such as osteoarthrosis. The recording of vibroartrographic (VAG) signals is a key element in the effective diagnosis of knee joint disorders. The main recommendations for recording VAG signals emphasise the importance of precise placement of sensors, such as piezoelectric and MEMS accelerometers, which have high sensitivity and wide bandwidth. The placement of sensors in strategic locations, such as the tibia, patella, or femoral and tibial condyles, has a significant impact on the quality of the signals obtained. Despite technological advances, anatomical variability and the lack of clear guidelines for sensor placement remain a challenge, requiring further research in this area.
Processing VAG signals requires advanced noise reduction techniques such as wavelet transforms, principal component analysis (PCA), or ensemble empirical mode decomposition (EEMD). Time–frequency analyses, such as short-time Fourier transform (STFT) or Hilbert–Huang analysis, enable accurate representation of signal variability relevant to diagnostics. The cleaned data are then analysed using parameters such as sample entropy, autoregression coefficients, kurtosis, or asymmetry coefficient. The extracted features form the basis for effective signal classification, which, using machine learning algorithms such as neural networks, SVM, or logistic regression, achieves classification accuracy of more than 95%. Recent studies indicate the potential of techniques such as LS-SVM or k-NN in differentiating between healthy and ageing joints. The use of multichannel measurement systems and the selection of highly discriminating features increases classification accuracy, opening up new possibilities for the diagnosis of advanced pathologies as well as the detection of degenerative changes at an early stage of their development.
The main limitations of the VAG method are the variability of results between patients and the lack of standardisation of measurement procedures. Research is also required on mechanisms for generating vibration signals and more intuitive sensor attachment systems, such as gloves with integrated accelerometers. The standardisation of sensor placement and the development of less invasive recording methods can increase the reproducibility and acceptance of the technique in clinical practice.
Future research should focus on integrated diagnostic systems involving biomechanical modelling of the joint, expansion of sample sizes, and testing under realistic environmental conditions. Further development of measurement technologies, such as laser vibrometers and multichannel MEMS systems, could significantly increase the diagnostic value of VAG, enabling its wider application in medicine.

6. Conclusions

The aim of this review was to present the current knowledge on the use of vibroarthrography for the early diagnosis and monitoring of the progression of knee osteoarthritis. The literature review showed scientific and technical progress in the study of sounds and vibrations emitted by knee joints, which include new methods of recording and analysing the VAG signal. This paper discusses the possibility of extracting parameters from the recorded signal in the time and frequency domains. The time–frequency domain makes it possible to examine the frequency in time while maintaining information about the signal in time, which affects its best usability considering the characteristics of the vibroarthrographic signal.
The analysed literature has proven that vibroarthrography is an effective diagnostic tool for diagnosing knee osteoarthritis. It is able to discern healthy knees from knees with various types of pathologies within the knee joint. Vibroarthrography is an inexpensive, noninvasive method that does not expose patients to radiation, but it has some limitations. The accuracy and reliability of the tests performed are influenced by, among other things, the placement of the sensors on the skin and generated artifacts. When assessing vibroacoustic signals, it is important to remember to standardise the results, especially in the case of people suffering from joint degeneration. Each patient diagnosed with degenerative joint disease will present an individually variable nature, as well as the level of pain and functionality of the joint.
Unfortunately, despite numerous and promising research results, no specific methodology has been developed so far regarding the equipment used, the number and type of sensors, the study protocol, processing methods, or classification. This indicates the necessity and justification for conducting further studies focused on the possibility of using vibroarthrography as a method for diagnosing damage to knee joint structures in clinical practice as an alternative method to those currently used. Further research on this method may contribute to the use of vibroarthrography as a method for diagnosing loosening of knee joint endoprostheses.

Author Contributions

Conceptualization, R.K.; methodology, R.K. and A.P.; validation, R.K., P.K. and K.J.; formal analysis, R.K., P.K. and K.J.; resources, R.K. and A.P.; data curation, R.K. and A.P.; writing—original draft preparation, R.K. and A.P.; writing—review and editing, R.K. and P.K.; visualization, R.K., P.K. and A.P.; supervision, R.K., P.K. and K.J. All authors have read and agreed to the published version of the manuscript.

Funding

This research received no external funding.

Conflicts of Interest

The authors declare no conflicts of interest.

Abbreviations

OA osteoarthritis, VAG vibroarthrography, CT computed tomography, MRI magnetic resonance imaging, UT ultrasonic testing, MCI muscle contraction interference, EEMD ensemble empirical mode decomposition, DFA detrended fluctuation analysis, IMF intrinsic mode function, PDF probability density function, FF form factor, TC turn count, FT Fourier transform, TD time domain, FD frequency domain, TFD time–frequency domain, STFT short-time Fourier transform, WT wavelet transform, ESP energy spread parameter, EP energy parameter, FP frequency parameter, FSP frequency spread parameter, FFNN feedforward neural network, SVM support vector machine, LS-SVM least squares support vector machine, RF random forest, MLP multi-layer perceptron, SL simple logistic, XGBoost extreme gradient boosting, LR logistic regression, KNN K-nearest neighbours, NB Gaussian Naïve Bayes, GRNN general regression neural network, ANN artificial neural networks, BDR Bayesian decision rule, ACC accuracy, SEN sensitivity, SPE specificity, K kurtosis, H entropy, S skewness, SF statistical features, FSI fractal scaling index, AEA averaged envelope amplitude, TDF time domain features, FDF frequency domain features, CF complexity features, SHE Shannon entropy, MSE multiscale sample entropy, RQA recurrence quantification analysis, RR recurrence rate, DET determinism, LAM laminarity, TT trapping time, LMAX maxline, STF spatiotemporal features, CWT continuous wavelet transform, SF shape factor, II impulse index, MF margin factor, CF crest factor, SDF spectral domain features, SA straightened average, RMS root-mean-square, PV peak value, PPV peak-to-peak value, IF impact factor, VAR variance, VMS mean squared value, M6A sixth central moment normalised by the variance raised to the third power, M8A eighth central moment, normalised by the variance to the fourth power, M mean, SM straightened mean, StDev standard deviation, FM4 difference signal kurtosis, ApEn approximate entropy, SampEn sample entropy, R4 signal amplitude.

References

  1. Cempel, C. Diagnostyka Wibroakustyczna Maszyn; PWN: Warszawa, Poland, 1989; ISBN 978-83-01-09696-0. [Google Scholar]
  2. Fletcher, N.H. Acoustic Systems in Biology; Oxford University Press: Oxford, UK, 1992; ISBN 978-0-19-506940-2. [Google Scholar]
  3. Kernohan, W.G.; Beverland, D.E.; McCoy, G.F.; Hamilton, A.; Watson, P.; Mollan, R. Vibration Arthrometry. Acta Orthop. Scand. 1990, 61, 70–79. [Google Scholar] [CrossRef] [PubMed]
  4. Blodgett, W.E. Auscultation of the Knee Joint. Boston Med. Surg. J. 1902, 146, 63–66. [Google Scholar] [CrossRef]
  5. Yiallourides, C.; Naylor, P.A. Time-Frequency Analysis and Parameterisation of Knee Sounds for Non-Invasive Detection of Osteoarthritis. IEEE Trans. Biomed. Eng. 2021, 68, 1250–1261. [Google Scholar] [CrossRef]
  6. Andersen, R.E.; Arendt-Nielsen, L.; Madeleine, P. A Review of Engineering Aspects of Vibroarthography of the Knee Joint. Crit. Rev. Phys. Rehabil. Med. 2016, 28, 13–32. [Google Scholar] [CrossRef]
  7. Lafortune, M.A.; Cavanagh, P.R.; Sommer, H.J.; Kalenak, A. Three-Dimensional Kinematics of the Human Knee during Walking. J. Biomech. 1992, 25, 347–357. [Google Scholar] [CrossRef] [PubMed]
  8. Shark, L.-K.; Chen, H.; Goodacre, J. Knee Acoustic Emission: A Potential Biomarker for Quantitative Assessment of Joint Ageing and Degeneration. Med. Eng. Phys. 2011, 33, 534–545. [Google Scholar] [CrossRef] [PubMed]
  9. Cibere, J.; Sayre, E.C.; Guermazi, A.; Nicolaou, S.; Kopec, J.A.; Esdaile, J.M.; Thorne, A.; Singer, J.; Wong, H. Natural History of Cartilage Damage and Osteoarthritis Progression on Magnetic Resonance Imaging in a Population-Based Cohort with Knee Pain. Osteoarthr. Cartil. 2011, 19, 683–688. [Google Scholar] [CrossRef] [PubMed]
  10. Jones, M.H.; Spindler, K.P. Risk Factors for Radiographic Joint Space Narrowing and Patient Reported Outcomes of Post-Traumatic Osteoarthritis after ACL Reconstruction: Data from the MOON Cohort: PTOA after ACL reconstruction in MOON. J. Orthop. Res. 2017, 35, 1366–1374. [Google Scholar] [CrossRef] [PubMed]
  11. Befrui, N.; Elsner, J.; Flesser, A.; Huvanandana, J.; Jarrousse, O.; Le, T.N.; Müller, M.; Schulze, W.H.W.; Taing, S.; Weidert, S. Vibroarthrography for Early Detection of Knee Osteoarthritis Using Normalized Frequency Features. Med. Biol. Eng. Comput. 2018, 56, 1499–1514. [Google Scholar] [CrossRef]
  12. Krakowski, P.; Rejniak, A.; Sobczyk, J.; Karpiński, R. Cartilage Integrity: A Review of Mechanical and Frictional Properties and Repair Approaches in Osteoarthritis. Healthcare 2024, 12, 1648. [Google Scholar] [CrossRef] [PubMed]
  13. Loeser, R.F.; Goldring, S.R.; Scanzello, C.R.; Goldring, M.B. Osteoarthritis: A Disease of the Joint as an Organ. Arthritis Rheum. 2012, 64, 1697–1707. [Google Scholar] [CrossRef] [PubMed]
  14. Krakowski, P.; Karpiński, R.; Maciejewski, R.; Jonak, J.; Jurkiewicz, A. Short-Term Effects of Arthroscopic Microfracturation of Knee Chondral Defects in Osteoarthritis. Appl. Sci. 2020, 10, 8312. [Google Scholar] [CrossRef]
  15. Conconi, M.; Halilaj, E.; Parenti Castelli, V.; Crisco, J.J. Is Early Osteoarthritis Associated with Differences in Joint Congruence? J. Biomech. 2014, 47, 3787–3793. [Google Scholar] [CrossRef] [PubMed]
  16. Glyn-Jones, S.; Palmer, A.J.R.; Agricola, R.; Price, A.J.; Vincent, T.L.; Weinans, H.; Carr, A.J. Osteoarthritis. Lancet 2015, 386, 376–387. [Google Scholar] [CrossRef]
  17. Silverwood, V.; Blagojevic-Bucknall, M.; Jinks, C.; Jordan, J.L.; Protheroe, J.; Jordan, K.P. Current Evidence on Risk Factors for Knee Osteoarthritis in Older Adults: A Systematic Review and Meta-Analysis. Osteoarthr. Cartil. 2015, 23, 507–515. [Google Scholar] [CrossRef]
  18. Williams, J.; Pierre-Louis, K. Osteoarthritis of the Knee. Physician Assist. Clin. 2024, 9, 59–69. [Google Scholar] [CrossRef]
  19. Karpiński, R.; Krakowski, P.; Jonak, J.; Machrowska, A.; Maciejewski, M. Comparison of selected classification methods based on machine learning as a diagnostic tool for knee joint cartilage damage based on generated vibroacoustic processes. Appl. Comput. Sci. 2023, 19, 136–150. [Google Scholar] [CrossRef]
  20. Cui, A.; Li, H.; Wang, D.; Zhong, J.; Chen, Y.; Lu, H. Global, Regional Prevalence, Incidence and Risk Factors of Knee Osteoarthritis in Population-Based Studies. EClinicalMedicine 2020, 29, 100587. [Google Scholar] [CrossRef]
  21. Khokhlova, L.; Komaris, D.-S.; O’Flynn, B.; Tedesco, S. Acoustic Emissions and Age-Related Changes of the Knee. In Proceedings of the 2023 45th Annual International Conference of the IEEE Engineering in Medicine & Biology Society (EMBC), Sydney, Australia, 24–27 July 2023; IEEE: Sydney, Australia, 2023; pp. 1–4. [Google Scholar]
  22. Kulkarni, K.; Karssiens, T.; Kumar, V.; Pandit, H. Obesity and Osteoarthritis. Maturitas 2016, 89, 22–28. [Google Scholar] [CrossRef]
  23. McAlindon, T.E.; Bannuru, R.R.; Sullivan, M.C.; Arden, N.K.; Berenbaum, F.; Bierma-Zeinstra, S.M.; Hawker, G.A.; Henrotin, Y.; Hunter, D.J.; Kawaguchi, H.; et al. OARSI Guidelines for the Non-Surgical Management of Knee Osteoarthritis. Osteoarthr. Cartil. 2014, 22, 363–388. [Google Scholar] [CrossRef] [PubMed]
  24. Felson, D.T. Osteoarthritis: New Insights. Part 1: The Disease and Its Risk Factors. Ann. Intern. Med. 2000, 133, 635. [Google Scholar] [CrossRef]
  25. Brahim, A.; Jennane, R.; Riad, R.; Janvier, T.; Khedher, L.; Toumi, H.; Lespessailles, E. A Decision Support Tool for Early Detection of Knee OsteoArthritis Using X-Ray Imaging and Machine Learning: Data from the OsteoArthritis Initiative. Comput. Med. Imaging Graph. 2019, 73, 11–18. [Google Scholar] [CrossRef] [PubMed]
  26. Lim, J.; Kim, J.; Cheon, S. A Deep Neural Network-Based Method for Early Detection of Osteoarthritis Using Statistical Data. IJERPH 2019, 16, 1281. [Google Scholar] [CrossRef]
  27. Ota, S.; Sasaki, E.; Sasaki, S.; Chiba, D.; Kimura, Y.; Yamamoto, Y.; Kumagai, M.; Ando, M.; Tsuda, E.; Ishibashi, Y. Relationship between Abnormalities Detected by Magnetic Resonance Imaging and Knee Symptoms in Early Knee Osteoarthritis. Sci. Rep. 2021, 11, 15179. [Google Scholar] [CrossRef] [PubMed]
  28. Gądek, A.; Liszka, H.; Zając, M. The Effect of Pre-Operative High Doses of Methylprednisolone on Pain Management and Convalescence after Total Hip Replacement in Elderly: A Double-Blind Randomized Study. Int. Orthop. (SICOT) 2021, 45, 857–863. [Google Scholar] [CrossRef] [PubMed]
  29. Favero, M.; Ramonda, R.; Goldring, M.B.; Goldring, S.R.; Punzi, L. Early Knee Osteoarthritis. RMD Open 2015, 1, e000062. [Google Scholar] [CrossRef]
  30. Karpiński, R.; Krakowski, P.; Jonak, J.; Machrowska, A.; Maciejewski, M.; Nogalski, A. Estimation of Differences in Selected Indices of Vibroacoustic Signals between Healthy and Osteoarthritic Patellofemoral Joints as a Potential Non-Invasive Diagnostic Tool. J. Phys. Conf. Ser. 2021, 2130, 012009. [Google Scholar] [CrossRef]
  31. Khan, T.I.; Hassan, M.M.; Kurihara, M.; Ide, S. Research on Diagnosis of Knee Osteoarthritis Using Acoustic Emission Technique. Acoust. Sci. Tech. 2021, 42, 241–251. [Google Scholar] [CrossRef]
  32. Peat, G. Clinical Classification Criteria for Knee Osteoarthritis: Performance in the General Population and Primary Care. Ann. Rheum. Dis. 2006, 65, 1363–1367. [Google Scholar] [CrossRef]
  33. Kellgren, J.H.; Lawrence, J.S. Radiological Assessment of Osteo-Arthrosis. Ann. Rheum. Dis. 1957, 16, 494–502. [Google Scholar] [CrossRef] [PubMed]
  34. Bonnin, M.; Chambat, P. (Eds.) Osteoartritis of the Knee; Approche pratique en orthopédie—traumatologie; Springer: Paris, France; Berlin, Germany, 2008; ISBN 978-2-287-74174-6. [Google Scholar]
  35. Hayashi, D.; Roemer, F.W.; Guermazi, A. Imaging of Osteoarthritis by Conventional Radiography, MR Imaging, PET–Computed Tomography, and PET–MR Imaging. PET Clin. 2019, 14, 17–29. [Google Scholar] [CrossRef] [PubMed]
  36. Richette, P.; Latourte, A. Osteoarthritis: Value of imaging and biomarkers. Rev. Prat. 2019, 69, 507–509. [Google Scholar]
  37. Ahn, J.M.; El-Khoury, G.Y. Computed Tomography of Knee Injuries. Imaging Decis. 2006, 10, 14–23. [Google Scholar] [CrossRef]
  38. Chan, W.P.; Lang, P.; Stevens, M.P.; Sack, K.; Majumdar, S.; Stoller, D.W.; Basch, C.; Genant, H.K. Osteoarthritis of the Knee: Comparison of Radiography, CT, and MR Imaging to Assess Extent and Severity. Am. J. Roentgenol. 1991, 157, 799–806. [Google Scholar] [CrossRef]
  39. Palczewski, P. Imaging Diagnosis of Osteoarthritis. Pol. J. Sports Med. 2021, 37, 103–115. [Google Scholar] [CrossRef]
  40. Mazrani, W.; McHugh, K.; Marsden, P.J. The Radiation Burden of Radiological Investigations. Arch. Dis. Child. 2007, 92, 1127–1131. [Google Scholar] [CrossRef]
  41. Möller, I.; Bong, D.; Naredo, E.; Filippucci, E.; Carrasco, I.; Moragues, C.; Iagnocco, A. Ultrasound in the Study and Monitoring of Osteoarthritis. Osteoarthr. Cartil. 2008, 16, S4–S7. [Google Scholar] [CrossRef]
  42. Wu, Y. Knee Joint Vibroarthrographic Signal Processing and Analysis; SpringerBriefs in Bioengineering; Springer: Berlin/Heidelberg, Germany, 2015; ISBN 978-3-662-44283-8. [Google Scholar]
  43. Mathiessen, A.; Cimmino, M.A.; Hammer, H.B.; Haugen, I.K.; Iagnocco, A.; Conaghan, P.G. Imaging of Osteoarthritis (OA): What Is New? Best Pract. Res. Clin. Rheumatol. 2016, 30, 653–669. [Google Scholar] [CrossRef] [PubMed]
  44. McNally, E.G. The Development and Clinical Applications of Musculoskeletal Ultrasound. Skelet. Radiol. 2011, 40, 1223–1231. [Google Scholar] [CrossRef] [PubMed]
  45. Krakowski, P.; Nogalski, A.; Jurkiewicz, A.; Karpiński, R.; Maciejewski, R.; Jonak, J. Comparison of Diagnostic Accuracy of Physical Examination and MRI in the Most Common Knee Injuries. Appl. Sci. 2019, 9, 4102. [Google Scholar] [CrossRef]
  46. Krakowski, P.; Karpiński, R.; Jojczuk, M.; Nogalska, A.; Jonak, J. Knee MRI Underestimates the Grade of Cartilage Lesions. Appl. Sci. 2021, 11, 1552. [Google Scholar] [CrossRef]
  47. Peterfy, C.G.; Guermazi, A.; Zaim, S.; Tirman, P.F.J.; Miaux, Y.; White, D.; Kothari, M.; Lu, Y.; Fye, K.; Zhao, S.; et al. Whole-Organ Magnetic Resonance Imaging Score (WORMS) of the Knee in Osteoarthritis. Osteoarthr. Cartil. 2004, 12, 177–190. [Google Scholar] [CrossRef] [PubMed]
  48. Marlovits, S.; Singer, P.; Zeller, P.; Mandl, I.; Haller, J.; Trattnig, S. Magnetic Resonance Observation of Cartilage Repair Tissue (MOCART) for the Evaluation of Autologous Chondrocyte Transplantation: Determination of Interobserver Variability and Correlation to Clinical Outcome after 2 Years. Eur. J. Radiol. 2006, 57, 16–23. [Google Scholar] [CrossRef]
  49. Zhou, Z.; Lu, Z. Gadolinium-based Contrast Agents for Magnetic Resonance Cancer Imaging. WIREs Nanomed. Nanobiotechnol. 2013, 5, 1–18. [Google Scholar] [CrossRef]
  50. Runge, V.M. Critical Questions Regarding Gadolinium Deposition in the Brain and Body After Injections of the Gadolinium-Based Contrast Agents, Safety, and Clinical Recommendations in Consideration of the EMA’s Pharmacovigilance and Risk Assessment Committee Recommendation for Suspension of the Marketing Authorizations for 4 Linear Agents. Investig. Radiol. 2017, 52, 317–323. [Google Scholar] [CrossRef]
  51. Fraum, T.J.; Ludwig, D.R.; Bashir, M.R.; Fowler, K.J. Gadolinium-based Contrast Agents: A Comprehensive Risk Assessment. Magn. Reson. Imaging 2017, 46, 338–353. [Google Scholar] [CrossRef] [PubMed]
  52. Piccolo, C.L.; Mallio, C.A.; Vaccarino, F.; Grasso, R.F.; Zobel, B.B. Imaging of Knee Osteoarthritis: A Review of Multimodal Diagnostic Approach. Quant. Imaging Med. Surg. 2023, 13, 7582–7595. [Google Scholar] [CrossRef]
  53. Chalian, M.; Pooyan, A.; Alipour, E.; Roemer, F.W.; Guermazi, A. What Is New in Osteoarthritis Imaging? Radiol. Clin. North Am. 2024, 62, 739–753. [Google Scholar] [CrossRef] [PubMed]
  54. Wang, X.; Oo, W.M.; Linklater, J.M. What Is the Role of Imaging in the Clinical Diagnosis of Osteoarthritis and Disease Management? Rheumatology 2018, 57, iv51–iv60. [Google Scholar] [CrossRef] [PubMed]
  55. Tanamas, S.K.; Jones, G. Imaging of Knee Osteoarthritis. Clin. Pract. 2010, 7, 635. [Google Scholar] [CrossRef]
  56. Fukuda, T.; Yonenaga, T.; Miyasaka, T.; Kimura, T.; Jinzaki, M.; Ojiri, H. CT in Osteoarthritis: Its Clinical Role and Recent Advances. Skelet. Radiol. 2023, 52, 2199–2210. [Google Scholar] [CrossRef] [PubMed]
  57. Turmezei, T.D.; Lomas, D.J.; Hopper, M.A.; Poole, K.E.S. Severity Mapping of the Proximal Femur: A New Method for Assessing Hip Osteoarthritis with Computed Tomography. Osteoarthr. Cartil. 2014, 22, 1488–1498. [Google Scholar] [CrossRef] [PubMed]
  58. Gielis, W.P.; Weinans, H.; Nap, F.J.; Roemer, F.W.; Foppen, W. Scoring Osteoarthritis Reliably in Large Joints and the Spine Using Whole-Body CT: OsteoArthritis Computed Tomography-Score (OACT-Score). JPM 2020, 11, 5. [Google Scholar] [CrossRef] [PubMed]
  59. D’Agostino, V.; Sorriento, A.; Cafarelli, A.; Donati, D.; Papalexis, N.; Russo, A.; Lisignoli, G.; Ricotti, L.; Spinnato, P. Ultrasound Imaging in Knee Osteoarthritis: Current Role, Recent Advancements, and Future Perspectives. JCM 2024, 13, 4930. [Google Scholar] [CrossRef]
  60. Nelson, A.E. Ultrasound in Osteoarthritis. In Musculoskeletal Ultrasound in Rheumatology Review; Kohler, M.J., Ed.; Springer International Publishing: Cham, Switzerland, 2021; pp. 405–424. ISBN 978-3-030-73554-8. [Google Scholar]
  61. Ehmig, J.; Engel, G.; Lotz, J.; Lehmann, W.; Taheri, S.; Schilling, A.F.; Seif Amir Hosseini, A.; Panahi, B. MR-Imaging in Osteoarthritis: Current Standard of Practice and Future Outlook. Diagnostics 2023, 13, 2586. [Google Scholar] [CrossRef]
  62. Mallio, C.A.; Bernetti, C.; Agostini, F.; Mangone, M.; Paoloni, M.; Santilli, G.; Martina, F.M.; Quattrocchi, C.C.; Zobel, B.B.; Bernetti, A. Advanced MR Imaging for Knee Osteoarthritis: A Review on Local and Brain Effects. Diagnostics 2022, 13, 54. [Google Scholar] [CrossRef]
  63. Krakowski, P.; Karpiński, R.; Jonak, J.; Maciejewski, R. Evaluation of Diagnostic Accuracy of Physical Examination and MRI for Ligament and Meniscus Injuries. J. Phys. Conf. Ser. 2021, 1736, 012027. [Google Scholar] [CrossRef]
  64. Krakowski, P.; Karpiński, R.; Maciejewski, R.; Jonak, J. Evaluation of the Diagnostic Accuracy of MRI in Detection of Knee Cartilage Lesions Using Receiver Operating Characteristic Curves. J. Phys. Conf. Ser. 2021, 1736, 012028. [Google Scholar] [CrossRef]
  65. De Tocqueville, S.; Marjin, M.; Ruzek, M. A Review of the Vibration Arthrography Technique Applied to the Knee Diagnostics. Appl. Sci. 2021, 11, 7337. [Google Scholar] [CrossRef]
  66. McCoy, G.; McCrea, J.; Beverland, D.; Kernohan, W.; Mollan, R. Vibration Arthrography as a Diagnostic Aid in Diseases of the Knee. A Preliminary Report. J. Bone Jt. Surgery. Br. Vol. 1987, 69, 288–293. [Google Scholar] [CrossRef] [PubMed]
  67. Jonak, J.; Karpinski, R.; Machrowska, A.; Krakowski, P.; Maciejewski, M. A Preliminary Study on the Use of EEMD-RQA Algorithms in the Detection of Degenerative Changes in Knee Joints. IOP Conf. Ser. Mater. Sci. Eng. 2019, 710, 012037. [Google Scholar] [CrossRef]
  68. Karpiński, R.; Machrowska, A.; Maciejewski, M. Application of acoustic signal processing methods in detecting differences between open and closed kinematic chain movement for the knee joint. Appl. Comput. Sci. 2019, 15, 36–48. [Google Scholar] [CrossRef]
  69. Choi, D.; Ahn, S.; Ryu, J.; Nagao, M.; Kim, Y. Knee Acoustic Emission Characteristics of the Healthy and the Patients with Osteoarthritis Using Piezoelectric Sensor. Sens. Mater. 2018, 30, 1629. [Google Scholar] [CrossRef]
  70. Vatolik, I.; Everington, M.; Hunter, G.; Swann, N.; Augousti, A.T. Development of a Multi-Modal Sensor Network to Detect and Monitor Knee Joint Condition. Meas. Sens. 2022, 24, 100483. [Google Scholar] [CrossRef]
  71. Schlüter, D.K.; Spain, L.; Quan, W.; Southworth, H.; Platt, N.; Mercer, J.; Shark, L.-K.; Waterton, J.C.; Bowes, M.; Diggle, P.J.; et al. Use of Acoustic Emission to Identify Novel Candidate Biomarkers for Knee Osteoarthritis (OA). PLoS ONE 2019, 14, e0223711. [Google Scholar] [CrossRef]
  72. Nevalainen, M.T.; Veikkola, O.; Thevenot, J.; Tiulpin, A.; Hirvasniemi, J.; Niinimäki, J.; Saarakkala, S.S. Acoustic Emissions and Kinematic Instability of the Osteoarthritic Knee Joint: Comparison with Radiographic Findings. Sci. Rep. 2021, 11, 19558. [Google Scholar] [CrossRef]
  73. Karpiński, R.; Krakowski, P.; Jonak, J.; Machrowska, A.; Maciejewski, M.; Nogalski, A. Analysis of Differences in Vibroacoustic Signals between Healthy and Osteoarthritic Knees Using EMD Algorithm and Statistical Analysis. J. Phys. Conf. Ser. 2021, 2130, 012010. [Google Scholar] [CrossRef]
  74. Karpiński, R.; Machrowska, A.; Maciejewski, M.; Jonak, J.; Krakowski, P. Concept and validation of a system for recording vibroacoustic signals of the knee joint. IAPGOS 2024, 14, 17–21. [Google Scholar] [CrossRef]
  75. Machrowska, A.; Karpiński, R.; Krakowski, P.; Jonak, J. Diagnostic factors for opened and closed kinematic chain of vibroarthrography signals. Appl. Comput. Sci. 2019, 15, 34–44. [Google Scholar] [CrossRef]
  76. Karpiński, R.; Krakowski, P.; Jonak, J.; Machrowska, A.; Maciejewski, M.; Nogalski, A. Diagnostics of Articular Cartilage Damage Based on Generated Acoustic Signals Using ANN—Part I: Femoral-Tibial Joint. Sensors 2022, 22, 2176. [Google Scholar] [CrossRef]
  77. Karpiński, R.; Krakowski, P.; Jonak, J.; Machrowska, A.; Maciejewski, M.; Nogalski, A. Diagnostics of Articular Cartilage Damage Based on Generated Acoustic Signals Using ANN—Part II: Patellofemoral Joint. Sensors 2022, 22, 3765. [Google Scholar] [CrossRef] [PubMed]
  78. Figueroa, D.; Calvo, R.; Vaisman, A.; Carrasco, M.A.; Moraga, C.; Delgado, I. Knee Chondral Lesions: Incidence and Correlation Between Arthroscopic and Magnetic Resonance Findings. Arthrosc. J. Arthrosc. Relat. Surg. 2007, 23, 312–315. [Google Scholar] [CrossRef]
  79. Bredella, M.A.; Tirman, P.F.; Peterfy, C.G.; Zarlingo, M.; Feller, J.F.; Bost, F.W.; Belzer, J.P.; Wischer, T.K.; Genant, H.K. Accuracy of T2-Weighted Fast Spin-Echo MR Imaging with Fat Saturation in Detecting Cartilage Defects in the Knee: Comparison with Arthroscopy in 130 Patients. Am. J. Roentgenol. 1999, 172, 1073–1080. [Google Scholar] [CrossRef]
  80. Edelsten, L.; Jeffrey, J.E.; Burgin, L.V.; Aspden, R.M. Viscoelastic Deformation of Articular Cartilage during Impact Loading. Soft Matter 2010, 6, 5206. [Google Scholar] [CrossRef]
  81. Temple, D.K.; Cederlund, A.A.; Lawless, B.M.; Aspden, R.M.; Espino, D.M. Viscoelastic Properties of Human and Bovine Articular Cartilage: A Comparison of Frequency-Dependent Trends. BMC Musculoskelet. Disord. 2016, 17, 419. [Google Scholar] [CrossRef]
  82. Zhao, H.; Ma, C.; Liu, S.; Ma, S.; Zhang, A.; You, Z.; Chen, L.; Zhao, H. Interleukin-6 Induces Extracellular Matrix Degradation and Angiogenesis in Osteoarthritis Models of Temporomandibular Joint via Estrogen-Related Receptor γ. SSRN J. 2019. [Google Scholar] [CrossRef]
  83. Burr, D.B.; Gallant, M.A. Bone Remodelling in Osteoarthritis. Nat. Rev. Rheumatol. 2012, 8, 665–673. [Google Scholar] [CrossRef] [PubMed]
  84. Kalo, K.; Niederer, D.; Sus, R.; Sohrabi, K.; Banzer, W.; Groß, V.; Vogt, L. The Detection of Knee Joint Sounds at Defined Loads by Means of Vibroarthrography. Clin. Biomech. 2020, 74, 1–7. [Google Scholar] [CrossRef]
  85. Karpiński, R. Knee joint osteoarthritis diagnosis based on selected acoustic signal discriminants using machine learning. ACS 2022, 18, 71–85. [Google Scholar] [CrossRef]
  86. Machrowska, A.; Karpiński, R.; Maciejewski, M.; Jonak, J.; Krakowski, P.; Syta, A. Application of Recurrence Quantification Analysis in the Detection of Osteoarthritis of the Knee with the Use of Vibroarthrography. Adv. Sci. Technol. Res. J. 2024, 18, 19–31. [Google Scholar] [CrossRef] [PubMed]
  87. Machrowska, A.; Karpiński, R.; Maciejewski, M.; Jonak, J.; Krakowski, P. Application of eemd-dfa algorithms and ann classification for detection of knee osteoarthritis using vibroarthrography. Appl. Comput. Sci. 2024, 20, 90–108. [Google Scholar] [CrossRef]
  88. Sarillee, M.; Hariharan, M.; Anas, M.N.; Omar, M.I.; Aishah, M.N.; Oung, Q.W. Assessment of Knee Joint Abnormality Using Acoustic Emission Sensors. In Proceedings of the 2014 IEEE International Conference on Control System, Computing and Engineering (ICCSCE 2014), Penang, Malaysia, 28–30 November 2014; IEEE: Penang, Malaysia, 2014; pp. 378–383. [Google Scholar]
  89. Khan, T.I.; Kusumoto, M.; Nakamura, Y.; Ide, S.; Yoshimura, T. Acoustic Emission Technique as an Adaptive Biomarker in Integrity Analysis of Knee Joint. J. Phys. Conf. Ser. 2018, 1075, 012020. [Google Scholar] [CrossRef]
  90. Kiselev, J.; Ziegler, B.; Schwalbe, H.J.; Franke, R.P.; Wolf, U. Detection of Osteoarthritis Using Acoustic Emission Analysis. Med. Eng. Phys. 2019, 65, 57–60. [Google Scholar] [CrossRef]
  91. Kalo, K.; Niederer, D.; Sus, R.; Sohrabi, K.; Groß, V.; Vogt, L. Reliability of Vibroarthrography to Assess Knee Joint Sounds in Motion. Sensors 2020, 20, 1998. [Google Scholar] [CrossRef]
  92. Gong, R.; Ohtsu, H.; Hase, K.; Ota, S. Vibroarthrographic Signals for the Low-Cost and Computationally Efficient Classification of Aging and Healthy Knees. Biomed. Signal Process. Control 2021, 70, 103003. [Google Scholar] [CrossRef]
  93. Khokhlova, L.; Komaris, D.-S.; Tedesco, S.; O’Flynn, B. Test-Retest Reliability of Acoustic Emission Sensing of the Knee during Physical Tasks. Sensors 2022, 22, 9027. [Google Scholar] [CrossRef] [PubMed]
  94. Ota, S.; Ando, A.; Tozawa, Y.; Nakamura, T.; Okamoto, S.; Sakai, T.; Hase, K. Preliminary Study of Optimal Measurement Location on Vibroarthrography for Classification of Patients with Knee Osteoarthritis. J. Phys. Ther. Sci. 2016, 28, 2904–2908. [Google Scholar] [CrossRef]
  95. Prill, R.; Walter, M.; Królikowska, A.; Becker, R. A Systematic Review of Diagnostic Accuracy and Clinical Applications of Wearable Movement Sensors for Knee Joint Rehabilitation. Sensors 2021, 21, 8221. [Google Scholar] [CrossRef]
  96. Wu, Y.; Yang, S.; Zheng, F.; Cai, S.; Lu, M.; Wu, M. Removal of Artifacts in Knee Joint Vibroarthrographic Signals Using Ensemble Empirical Mode Decomposition and Detrended Fluctuation Analysis. Physiol. Meas. 2014, 35, 429–439. [Google Scholar] [CrossRef] [PubMed]
  97. Bączkowicz, D.; Majorczyk, E. Joint Motion Quality in Vibroacoustic Signal Analysis for Patients with Patellofemoral Joint Disorders. BMC Musculoskelet. Disord. 2014, 15, 426. [Google Scholar] [CrossRef] [PubMed]
  98. Bączkowicz, D.; Majorczyk, E.; Kręcisz, K. Age-Related Impairment of Quality of Joint Motion in Vibroarthrographic Signal Analysis. BioMed Res. Int. 2015, 2015, 591707. [Google Scholar] [CrossRef] [PubMed]
  99. Wu, Y.; Chen, P.; Luo, X.; Huang, H.; Liao, L.; Yao, Y.; Wu, M.; Rangayyan, R.M. Quantification of Knee Vibroarthrographic Signal Irregularity Associated with Patellofemoral Joint Cartilage Pathology Based on Entropy and Envelope Amplitude Measures. Comput. Methods Programs Biomed. 2016, 130, 1–12. [Google Scholar] [CrossRef]
  100. Kręcisz, K.; Bączkowicz, D. Analysis and Multiclass Classification of Pathological Knee Joints Using Vibroarthrographic Signals. Comput. Methods Programs Biomed. 2018, 154, 37–44. [Google Scholar] [CrossRef] [PubMed]
  101. Andersen, R.E.; Arendt-Nielsen, L.; Madeleine, P. Knee Joint Vibroarthrography of Asymptomatic Subjects during Loaded Flexion-Extension Movements. Med. Biol. Eng. Comput. 2018, 56, 2301–2312. [Google Scholar] [CrossRef]
  102. Sharma, M.; Acharya, U.R. Analysis of Knee-Joint Vibroarthographic Signals Using Bandwidth-Duration Localized Three-Channel Filter Bank. Comput. Electr. Eng. 2018, 72, 191–202. [Google Scholar] [CrossRef]
  103. Bączkowicz, D.; Kręcisz, K.; Borysiuk, Z. Analysis of Patellofemoral Arthrokinematic Motion Quality in Open and Closed Kinetic Chains Using Vibroarthrography. BMC Musculoskelet. Disord. 2019, 20, 48. [Google Scholar] [CrossRef] [PubMed]
  104. Gong, R.; Hase, K.; Goto, H.; Yoshioka, K.; Ota, S. Knee Osteoarthritis Detection Based on the Combination of Empirical Mode Decomposition and Wavelet Analysis. JBSE 2020, 15, 20-00017. [Google Scholar] [CrossRef]
  105. Madeleine, P.; Andersen, R.E.; Larsen, J.B.; Arendt-Nielsen, L.; Samani, A. Wireless Multichannel Vibroarthrographic Recordings for the Assessment of Knee Osteoarthritis during Three Activities of Daily Living. Clin. Biomech. 2020, 72, 16–23. [Google Scholar] [CrossRef]
  106. Befrui, N.; Elsner, J.; Flesser, A.; Huvanandana, J.; Jarrousse, O.; Le, T.N.; Müller, M.; Schulze, W.H.W.; Taing, S.; Weidert, S. Detection and Grading of Knee Joint Cartilage Defect Using Multi-Class Classification in Vibroarthrography. CAOS 2018, 2, 6–11. [Google Scholar]
  107. Ozmen, G.C.; Safaei, M.; Lan, L.; Inan, O.T. A Novel Accelerometer Mounting Method for Sensing Performance Improvement in Acoustic Measurements from the Knee. J. Vib. Acoust. 2021, 143, 031006. [Google Scholar] [CrossRef] [PubMed]
  108. Shidore, M.M.; Athreya, S.S.; Deshpande, S.; Jalnekar, R. Screening of Knee-Joint Vibroarthrographic Signals Using Time and Spectral Domain Features. Biomed. Signal Process. Control 2021, 68, 102808. [Google Scholar] [CrossRef]
  109. Jeong, H.K.; An, S.; Herrin, K.; Scherpereel, K.; Young, A.; Inan, O.T. Quantifying Asymmetry Between Medial and Lateral Compartment Knee Loading Forces Using Acoustic Emissions. IEEE Trans. Biomed. Eng. 2022, 69, 1541–1551. [Google Scholar] [CrossRef] [PubMed]
  110. Kręcisz, K.; Bączkowicz, D.; Kawala-Sterniuk, A. Using Nonlinear Vibroartrographic Parameters for Age-Related Changes Assessment in Knee Arthrokinematics. Sensors 2022, 22, 5549. [Google Scholar] [CrossRef] [PubMed]
  111. Borzucka, D.; Kręcisz, K.; Bączkowicz, D. Influence of External Load during Back Squats on Knee Joint Arthrokinematics Analyzed by Vibroarthrography. Research Square 2024. [Google Scholar] [CrossRef]
  112. Lee, T.-F.; Lin, W.-C.; Wu, L.-F.; Wang, H.-Y. Analysis of Vibroarthrographic Signals for Knee Osteoarthritis Diagnosis. In Proceedings of the 2012 Sixth International Conference on Genetic and Evolutionary Computing, Kitakyushu, Japan, 25–28 August 2012; IEEE: Kitakyushu, Japan, 2012; pp. 223–228. [Google Scholar]
  113. Kim, K.S.; Seo, J.H.; Kang, J.U.; Song, C.G. An Enhanced Algorithm for Knee Joint Sound Classification Using Feature Extraction Based on Time-Frequency Analysis. Comput. Methods Programs Biomed. 2009, 94, 198–206. [Google Scholar] [CrossRef] [PubMed]
  114. Wu, Y.; Cai, S.; Yang, S.; Zheng, F.; Xiang, N. Classification of Knee Joint Vibration Signals Using Bivariate Feature Distribution Estimation and Maximal Posterior Probability Decision Criterion. Entropy 2013, 15, 1375–1387. [Google Scholar] [CrossRef]
  115. Rangayyan, R.M.; Wu, Y. Analysis of Vibroarthrographic Signals with Features Related to Signal Variability and Radial-Basis Functions. Ann. Biomed. Eng. 2009, 37, 156–163. [Google Scholar] [CrossRef]
  116. Wu, Y.; Cai, S.; Xu, F.; Shi, L.; Krishnan, S. Chondromalacia Patellae Detection by Analysis of Intrinsic Mode Functions in Knee Joint Vibration Signals. In Proceedings of the World Congress on Medical Physics and Biomedical Engineering, Beijing, China, 31–26 May 2012; Long, M., Ed.; IFMBE Proceedings; Springer: Berlin/Heidelberg, Germany, 2013; Volume 39, pp. 493–496. ISBN 978-3-642-29304-7. [Google Scholar]
  117. Cai, S.; Wu, Y.; Xiang, N.; Zhong, Z.; He, J.; Shi, L.; Xu, F. Detrending Knee Joint Vibration Signals with a Cascade Moving Average Filter. In Proceedings of the 2012 Annual International Conference of the IEEE Engineering in Medicine and Biology Society, San Diego, CA, USA, 28 August–1 September 2012; IEEE: San Diego, CA, USA, 2012; pp. 4357–4360. [Google Scholar]
  118. Wang, Y. (Ed.) Transdisciplinary Advancements in Cognitive Mechanisms and Human Information Processing; IGI Global: Hershey, PA, USA, 2011; ISBN 978-1-60960-553-7. [Google Scholar]
  119. Yang, S.; Cai, S.; Zheng, F.; Wu, Y.; Liu, K.; Wu, M.; Zou, Q.; Chen, J. Representation of Fluctuation Features in Pathological Knee Joint Vibroarthrographic Signals Using Kernel Density Modeling Method. Med. Eng. Phys. 2014, 36, 1305–1311. [Google Scholar] [CrossRef]
  120. Bachi, L.; Billeci, L.; Varanini, M. QRS Detection Based on Medical Knowledge and Cascades of Moving Average Filters. Appl. Sci. 2021, 11, 6995. [Google Scholar] [CrossRef]
  121. Ma, C.; Yang, J.; Wang, Q.; Liu, H.; Xu, H.; Ding, T.; Yang, J. A Method of Feature Fusion and Dimension Reduction for Knee Joint Pathology Screening and Separability Evaluation Criteria. Comput. Methods Programs Biomed. 2022, 224, 106992. [Google Scholar] [CrossRef]
  122. Azami, H.; Mohammadi, K.; Bozorgtabar, B. An Improved Signal Segmentation Using Moving Average and Savitzky-Golay Filter. JSIP 2012, 03, 39–44. [Google Scholar] [CrossRef]
  123. Rangayyan, R.M.; Oloumi, F.; Wu, Y.; Cai, S. Fractal Analysis of Knee-Joint Vibroarthrographic Signals via Power Spectral Analysis. Biomed. Signal Process. Control 2013, 8, 23–29. [Google Scholar] [CrossRef]
  124. Cai, S.; Yang, S.; Zheng, F.; Lu, M.; Wu, Y.; Krishnan, S. Knee Joint Vibration Signal Analysis with Matching Pursuit Decomposition and Dynamic Weighted Classifier Fusion. Comput. Math. Methods Med. 2013, 2013, 904267. [Google Scholar] [CrossRef] [PubMed]
  125. Nalband, S.; Sundar, A.; Prince, A.A.; Agarwal, A. Feature Selection and Classification Methodology for the Detection of Knee-Joint Disorders. Comput. Methods Programs Biomed. 2016, 127, 94–104. [Google Scholar] [CrossRef]
  126. Caesarendra, W.; Tjahjowidodo, T. A Review of Feature Extraction Methods in Vibration-Based Condition Monitoring and Its Application for Degradation Trend Estimation of Low-Speed Slew Bearing. Machines 2017, 5, 21. [Google Scholar] [CrossRef]
  127. Yiakopoulos, C.T.; Gryllias, K.C.; Antoniadis, I.A. Rolling Element Bearing Fault Detection in Industrial Environments Based on a K-Means Clustering Approach. Expert. Syst. Appl. 2011, 38, 2888–2911. [Google Scholar] [CrossRef]
  128. Karpiński, R.; Szabelski, J.; Maksymiuk, J. Effect of Physiological Fluids Contamination on Selected Mechanical Properties of Acrylate Bone Cement. Materials 2019, 12, 3963. [Google Scholar] [CrossRef]
  129. Szabelski, J. Effect of Incorrect Mix Ratio on Strength of Two Component Adhesive Butt-Joints Tested at Elevated Temperature. MATEC Web Conf. 2018, 244, 01019. [Google Scholar] [CrossRef]
  130. Karpiński, R.; Szabelski, J.; Maksymiuk, J. Seasoning Polymethyl Methacrylate (PMMA) Bone Cements with Incorrect Mix Ratio. Materials 2019, 12, 3073. [Google Scholar] [CrossRef]
  131. Özhan, O. Short-Time-Fourier Transform. In Basic Transforms for Electrical Engineering; Springer International Publishing: Cham, Switzerland, 2022; pp. 441–464. ISBN 978-3-030-98845-6. [Google Scholar]
  132. Rhif, M.; Ben Abbes, A.; Farah, I.R.; Martínez, B.; Sang, Y. Wavelet Transform Application for/in Non-Stationary Time-Series Analysis: A Review. Appl. Sci. 2019, 9, 1345. [Google Scholar] [CrossRef]
  133. Percival, D.B.; Walden, A.T. Wavelet Methods for Time Series Analysis; Cambridge University Press: Cambridge, UK, 2000; ISBN 978-0-511-84104-0. [Google Scholar]
  134. Ocak, H. A Medical Decision Support System Based on Support Vector Machines and the Genetic Algorithm for the Evaluation of Fetal Well-Being. J. Med. Syst. 2013, 37, 9913. [Google Scholar] [CrossRef]
  135. Oh, S.L.; Adam, M.; Tan, J.H.; Hagiwara, Y.; Sudarshan, V.K.; Koh, J.E.W.; Chua, K.C.; Chua, K.P.; Tan, R.S.; Ng, E.Y.K. Automated identification of coronary artery disease from short-term 12 lead electrocardiogram signals by using wavelet packet decomposition and common spatial pattern techniques. J. Mech. Med. Biol. 2017, 17, 1740007. [Google Scholar] [CrossRef]
  136. Ho, T.K. Random Decision Forests. In Proceedings of the 3rd International Conference on Document Analysis and Recognition, Montreal, QC, Canada, 14–16 August 1995; IEEE Computer Society Press: Montreal, QC, Canada, 1995; Volume 1, pp. 278–282. [Google Scholar]
  137. Wu, X.; Kumar, V.; Ross Quinlan, J.; Ghosh, J.; Yang, Q.; Motoda, H.; McLachlan, G.J.; Ng, A.; Liu, B.; Yu, P.S.; et al. Top 10 Algorithms in Data Mining. Knowl. Inf. Syst. 2008, 14, 1–37. [Google Scholar] [CrossRef]
  138. Liu, K.; Luo, X.; Yang, S.; Cai, S.; Zheng, F.; Wu, Y. Classification of Knee Joint Vibroarthrographic Signals Using K-Nearest Neighbor Algorithm. In Proceedings of the 2014 IEEE 27th Canadian Conference on Electrical and Computer Engineering (CCECE), Toronto, ON, Canada, 4–7 May 2014; IEEE: Toronto, ON, Canada, 2014; pp. 1–4. [Google Scholar]
  139. Rogala, M. Neural Networks in Crashworthiness Analysis of Thin-Walled Profile with Foam Filling. Adv. Sci. Technol. Res. J. 2020, 14, 93–99. [Google Scholar] [CrossRef]
  140. Gajewski, J.; Vališ, D. Verification of the Technical Equipment Degradation Method Using a Hybrid Reinforcement Learning Trees–Artificial Neural Network System. Tribol. Int. 2021, 153, 106618. [Google Scholar] [CrossRef]
  141. Kruse, R.; Mostaghim, S.; Borgelt, C.; Braune, C.; Steinbrecher, M. Radial Basis Function Networks. In Computational Intelligence; Texts in Computer Science; Springer International Publishing: Cham, Switzerland, 2022; pp. 125–148. ISBN 978-3-030-42226-4. [Google Scholar]
Figure 1. Flow diagram of the search and selection process for the literature review.
Applsci 15 00279 g001
Figure 2. Location of sensors used to record the vibroarthrographic signal in the individual analysed studies on a 3D knee model.
Applsci 15 00279 g002
Figure 3. Presentation of the accuracy level of the classification methods used in the selected works [76,77,85,87,88,92,100,104,108,119,121,125].
Applsci 15 00279 g003
Table 1. Comparison of diagnostic methods for knee osteoarthritis (OA).
Diagnostic MethodAdvantagesDisadvantagesSources
RadiographyNoninvasive
Inexpensive
High availability
Time
Exposure to ionising radiation,
Shows developed changes in the knee joint, unable to diagnose small cartilage lesions in early stages
[52,53,54,55]
Computed tomographyNoninvasive
High resolution
Time
Lack of cartilage visualisation unless enhanced with the administration of intra-articular contrast agent
Based on bone changes, it allows for the estimation of cartilage damage
Contrast agent exposure in contrast-enhanced CT
[56,57,58]
UltrasoundDynamic test
Noninvasive
Low cost
High sensitivity for detecting soft tissue and structures
Real-time imaging
Ability to assess inflammation
The quality of the examination depends on the experience of the sonographer
Lack of visibility of all knee parts as ultrasound cannot penetrate through bones
[59,60]
Magnetic resonance imagingNoninvasive
High resolution
Quantitative measurements of articular cartilage
3D imaging
Detection of damage to cartilage, menisci, ligaments
High cost
Complex
Long acquisition times
Requires specialised equipment and personnel
[61,62,63,64]
VibroarthrographyNoninvasive
Low cost
Provides information about the condition of the moving joint
Repeatability
No dedicated equipment
No test protocols
[11,65]
Table 3. Selected works with classification method and classification evaluation.
AuthorsFeature ExtractionClassification MethodsClassification Evaluation
Yang et al. [119]SF (DFA, AEA)LS-SVMACC 82.67%, SEN 0.6429, SPE 0.9362
BDRACC 88%, SEN 0.7143, SPE 0.9787
Sarillee et al. [88]SF (K, S)FFNNACC 83.6–85.76%
SVMACC 83.37–85.74%
Nalband et al. [125]TD (RQA, ApEn, SampEn), TFD (Wavelet energy)LS-SVMACC 91.01–94.31%, SEN 0.9.22–0.9807, SPE 0.8333–0.8648
RFACC 86.52–91.01%, SEN 0.9411–0.9615, SPE 0.7568–0.8684
Kręcisz et al. [100]TD (VMS, R4), Cf (FF, SHE, TC, DFA, MSE), RQA (RR, DET, LAM, H, TT, LMAX), FDF (FT)SLIn 2-class classification: ACC 90.4%, SEN 0.934, SPE 0.848
In 5-class classification: ACC 69%, SEN 0.914, SPE 0.69
MLPIn 2-class classification: ACC 88.8%, SEN 0.917, SPE 0.833
In 5-class classification: ACC 69%, SEN 0.912, SPE 0.69
RFIn 2-class classification: ACC 87.2%, SEN 0.901, SPE 0.818
In 5-class classification: ACC 62%, SEN 0.899, SPE 0.62
SMOIn 2-class classification: ACC 84.5%, SEN 0.893, SPE 0.758
In 5-class classification: ACC 61.5%, SEN 0.89, SPE 0.615
Befrui et al. [11]TD (segmentation), FD (partial sum of the power spectrum)SVMSEN 0.80, SPE 0.75
Gong et al. [104]ST (K, S), TFD (CWT)LS-SVMACC 74.19–86.67%
Shidore et al. [108]TD (SH, IF, MF, CF, S, K), SD (STFT)SVMACC 84.61–87.69%, SEN 0.8571–1.0, SPE 0.7954–0.8461
RFACC 81.54–84.61%, SEN 0.7647–0.8846, SPE 0.8158–0.8709
NBACC 83.07–84.62%, SEN 0.8519–0.8846, SPE 0.8158–0.8205
Gong et al. [92]TD (S, K), TFD (H)KNNACC 87.27%, SEN 0.8846, SPE 0.8821
LRACC 88%, SEN 0.875, SPE 0.8519
Karpiński [85]TD (SA, RMS, PV, PPV, CF, IF, SF, VAR, K)MLPACC 86–90%, SEN 0.875–0.917%, SPE 0.846–0.917
RBFACC 84–88%, SEN 0.84–0.875, SPE 0.84–0.913
Ma et al. [121]TD (PPV, SA, VAR, MF, K, S, II, FF, VMS, TC)RFACC 93–96%, SEN 0.92–0.96
SVMACC 79–95%, SEN 0.65–0.93
KNNACC 91–95%, SEN 0.90–0.94
Karpiński et al. [76]TD (MV, SA, RMS, PV, PPV, CF, IF, SF, VAR, M6A, M8A)MLPACC 93.7–96.32%
RBFACC 89.63–91.91%
Karpiński et al. [77]TD (MV, SA, RMS, PV, PPV, CF, IF, SF, VAR, K, M6A, M8A)MLPACC 89.71–98.53%
RBFACC 97.06–98.53%
Machrowska et al. [87]VAR, StDev, RMS, FF, CF, FM4, K, PPV, M6A, IF, SM, M, M8A, S, PVMLPACC 91.89–93.24%, SEN 0.889–0.932, SPE 0.932–0.933
RBFACC 80.41–81.08%, SEN 0.714–721, SPE 0.84–0.848
Disclaimer/Publisher’s Note: The statements, opinions and data contained in all publications are solely those of the individual author(s) and contributor(s) and not of MDPI and/or the editor(s). MDPI and/or the editor(s) disclaim responsibility for any injury to people or property resulting from any ideas, methods, instructions or products referred to in the content.

