Article

Enhancing Disaster Situation Awareness Through Multimodal Social Media Data: Evidence from Typhoon Haikui

1
School of Surveying and Urban Spatial Information, Henan University of Urban Construction, Pingdingshan 467000, China
2
Aerospace Information Research Institute, Chinese Academy of Sciences, Beijing 100094, China
3
College of Geodesy and Geomatics, Shandong University of Science and Technology, Qingdao 266590, China
4
School of Mathematics and Statistics, Henan University of Science and Technology, Luoyang 471000, China
*
Author to whom correspondence should be addressed.
Appl. Sci. 2025, 15(1), 465; https://doi.org/10.3390/app15010465
Submission received: 8 October 2024 / Revised: 1 January 2025 / Accepted: 3 January 2025 / Published: 6 January 2025

Abstract

:
Emergency situation awareness during sudden natural disasters presents significant challenges. Traditional methods, characterized by low spatial and temporal resolution as well as coarse granularity, often fail to comprehensively capture disaster situations. However, social media platforms, as a vital source of social sensing, offer significant potential to supplement disaster situational awareness. This paper proposes an innovative framework for disaster situation awareness based on multimodal data from social media to identify social media content related to typhoon disasters. Integrating text and image data from social media facilitates near real-time monitoring of disasters from the public perspective. In this study, Typhoon Haikui (Strong Typhoon No. 11 of 2023) was chosen as a case study to validate the effectiveness of the proposed method. We employed the ERNIE natural language processing model to complement the Deeplab v3+ deep learning image semantic segmentation model for extracting disaster damage information from social media. A spatial visualization analysis of the disaster-affected areas was performed by categorizing the damage types. Additionally, the Geodetector was used to investigate spatial heterogeneity and its underlying factors. This approach allowed us to analyze the spatiotemporal patterns of disaster evolution, enabling rapid disaster damage assessment and facilitating emergency response efforts. The results show that the proposed method significantly enhances situational awareness by effectively identifying different types of damage information from social sensing data.

1. Introduction

Situational awareness in natural disasters refers to the cognition, comprehension, and prediction of various elements in a dynamic disaster environment within specific spatial and temporal contexts [1]. Social sensing information, represented by Volunteered Geographic Information (VGI), offers advantages such as large data volumes, extensive coverage, and high spatial and temporal resolution, allowing individuals to act as “social sensors” [2]. Since its introduction, the definition of the term Volunteered Geographic Information (VGI) has been expanded. In this paper, we adopt the definition of VGI as introduced by Tzavella: “VGI is the voluntarily exchangeable information that includes any geographic and spatial information provided by the population (before, during, and after a crisis) and is available through different VGI platforms, i.e., OpenStreetMap, social media platforms, mobile applications, and more” [3]. Social media data, as a typical form of geospatial big data, also serves as a key source of VGI. In recent years, social media has rapidly evolved, playing a crucial role in sensing disaster events.
The focus of disaster monitoring has shifted from observation to perception, emphasizing the dynamics and comprehensiveness of the disaster situation. Traditional Internet of Things (IoT) sensors, such as water level sensors, are primarily used for monitoring water levels in large water bodies such as reservoirs and rivers. Although real-time results are often available from these sensors, they have limited spatial coverage and resolution, making it difficult to capture spatial heterogeneity [4]. While remote sensing imagery can monitor affected areas, it is constrained by satellite revisit cycles and weather conditions, leading to insufficient temporal resolution and challenges in accurately identifying fine details [5]. Furthermore, remote sensing cannot quickly monitor short-term disasters, while information shared by individuals online during disasters may contain real-time details about locations, types, and severity of damage, providing valuable insights for rapid disaster situation awareness [6]. During disasters, social media can be utilized for information dissemination, communication, and organizing relief efforts [7]. Although social media platforms may not provide precise measurements of physical quantities (e.g., water level height), they offer flexible coverage and strong real-time capabilities in disaster situational awareness. Social media can facilitate disaster sensing anytime and anywhere, addressing the limitations of traditional observational data in capturing societal perceptions and information.
The information on social media exhibits multimodal characteristics, including various forms such as text, images, videos, and geotagging data. These multimodal data are more suitable for rapid disaster situation awareness, thereby supporting emergency management agencies in conducting rescue operations and post-disaster recovery efforts at multiple levels. Social media platforms can rapidly disseminate real-time information about disaster events, including the location, scale, and extent of impact, allowing the public to stay informed about the disaster situation. Wu Kejie [8], using typhoons as an example, found that tweets during typhoon events often include information on wind and rain intensity, providing real-time reflections of the intensity of hazardous factors. Daly [9] analyzed the spatiotemporal metadata extracted from images collected from social media during wildfire events and demonstrated that geotagged information helped identify areas affected by the fire. Sit et al. [10] and Wu et al. [11] found a strong correlation between social media activity and disaster losses. Wang [12] used social media and crowdsourced data for high-resolution monitoring of urban flooding. Rescue teams can use social media to understand the needs of affected individuals and provide aid. Firoj Alam [13] developed a standardized social media text dataset for disaster relief, reannotating existing disaster image datasets to address four tasks: disaster type detection, identifying the presence of disaster information, humanitarian aid, and damage assessment. Wang [14] used a spatial-logistic growth model based on social media data to rapidly estimate earthquake-affected areas. Disaster information on social media can also be highly personalized, helping individuals receive assistance. During disasters, people can share their emotions and experiences via social media platforms. Yang Tengfei [15] extracted fine-grained public sentiment information from social media big data and applied it to disaster mitigation services. Yu Feng [7] identified eight common tasks related to the extraction and analysis of VGI (Volunteered Geographic Information) from social media data concerning natural disasters, including (1) extraction of disaster-related social media posts, (2) humanitarian aid classification, (3) witness post identification, (4) sentiment analysis, (5) damage and severity assessment, (6) flood level estimation, (7) disaster phase classification, and (8) unsupervised topic modeling. During disasters, the multimodal content on social media becomes a critical channel for disseminating key information. Although previous studies have primarily focused on topic modeling and sentiment analysis of text data to understand public needs and emotions and to allocate rescue resources accordingly, image data also provide a rich reflection of the disaster situation. Traditional methods, such as keyword filtering, have limitations [16], while natural language processing (NLP) techniques, including models like TF-IDF [17] and Word2Vec [18], have significantly improved the classification of disaster-related texts. Further research has explored the application of deep learning in short text classification, such as using TextCNN [19] and LSTM [10] networks, as well as unsupervised learning methods like LDA for tweet classification. Mao [20] applied a probabilistic classification model with n-gram features to identify genuine power outage tweets and used LSTM to extract outage locations from the text. Jain’s comparative study of Word2Vec, GloVe, ELMo, and BERT showed that, possibly due to the informal structure and character limitations of tweets, the performance of BERT and ELMo was very similar to that of Word2Vec and GloVe in disaster tweet classification [21]. Simultaneously, image analysis demonstrates great potential in disaster response, though its application in social media data analysis remains relatively uncommon. Advances in computer vision techniques, from SURF visual features [22] to deep convolutional neural networks (DCNNs) [23], have provided new avenues for the automatic identification of disaster-related images. Research suggests that multimodal deep learning frameworks that combine image and text features can enhance the performance of image data classification [24], which is critical for the rapid and accurate assessment of disaster impacts and response efforts. Therefore, leveraging both text and image information from social media holds immense potential for disaster response and damage assessment. Zishan’s study [25] found that using text features improved classification performance when classifying corresponding images. Wu [26] confirmed the significant advantages of multimodal data in enhancing the accuracy of spatial information extraction. Acquiring an appropriate number of labeled data after a disaster can delay situation awareness tasks. Therefore, in this study, we employed transfer learning to apply models trained on past disaster events and datasets for situational awareness of Typhoon “Haikui”.
In recent years, the rapid development of deep learning techniques in the fields of computer vision and natural language processing has enabled the extraction of more disaster-related information from social media, such as disaster conditions and affected locations. Multimodal social media data have been increasingly used to enhance disaster damage assessment and situational awareness of natural disasters. In disaster scenarios, the use of location-based real-time social media posts in spatial decision support processes holds significant potential for resource allocation, identifying damaged areas, estimating damage severity, and determining evacuation or aid routes. Disaster management professionals and volunteers have validated the reliability and practicality of crowdsourced images for damage assessment [27]. Images and text offer strong complementarity; for instance, the severity of a disaster can be easily observed from images, while information about affected individuals can be more accurately extracted from text [28]. Rescue organizations also require concise situational awareness information, such as damage severity assessments. Nguyen [29] trained an effective damage assessment classifier using web image data, developing a damage severity assessment model. Nguyen’s experiments demonstrated that domain-specific fine-tuning of deep convolutional neural networks (CNNs) outperformed other advanced techniques for disaster damage assessment. Hussein [30] focused on detecting human and environmental damage in disaster impact detection. Muhammad [31], in collaboration with volunteer response organizations, utilized image data shared on Twitter and applied deep neural network-based image processing techniques to identify disaster damage. After a disaster, rapid assessment and classification of damage is essential, along with the provision of medicine, food, water, shelter, and essential infrastructure. Dou [32] used fine-grained topics in social media to assess disaster losses, while Chen [33] proposed a novel method to classify and quantify typhoon-related damage using social media text. Chen’s approach employed a multi-instance, multi-label classifier built on the BERT model to identify damage categories in social media content and quantify damage severity by measuring word similarity. Li [34] implemented a supervised learning approach using a backpropagation neural network for typhoon damage assessment.
Typhoon disasters unfold as dynamic processes, with the central location of the typhoon continuously shifting and its path extending over time. The categories of disaster damage and the severity experienced by affected areas also evolve temporally. Therefore, analyzing the temporal and spatial aspects of social media data is crucial for capturing the spatiotemporal dynamics of typhoon progression. Almost all social media data are timestamped, yet posts containing geotagged locations account for less than 1% of all social media posts [35]. Early studies often plotted the locations of disaster-related posts as static points on maps and used kernel density estimation (KDE) to generate heat maps [36], where the concentration of points is represented as a raster image. Mohamed [37] identified affected areas through spatial clustering. Liang Chunyang [38] applied a Latent Dirichlet Allocation (LDA) topic model and Support Vector Machine (SVM) to classify Weibo posts, proposing a weighted model based on check-in user activity to address the spatial heterogeneity of social media users, with results showing that a series of maps could reflect the spatiotemporal trends of typhoon disasters. Firoj [39] utilized the Stanford Named Entity Recognizer to identify people, organizations, and locations. Jens and Friedrike [40] incorporated time as an additional dimension in three-dimensional density estimation, visualizing the data through a spatiotemporal cube. In densely populated urban areas, the performance of remote sensing in flood detection can be limited; therefore, geotagged flood-related social media posts can complement remote sensing flood detection. Volunteered Geographic Information (VGI) locations have been used to generate flood probability maps through kernel smoothing applications. Yan [4] proposed a novel framework to extract fine-grained location and water depth information from social media text and images, analyzing the spatiotemporal characteristics of the extracted information to enable large-scale situational awareness at the urban level.
Previous social sensing data have predominantly been unimodal. The method proposed in this paper effectively integrates information from different modalities, enhancing the accuracy and comprehensiveness of disaster situation awareness. Additionally, it demonstrates a strong generalization capability, making it applicable to disaster data of various types and scales. This study proposes a multimodal social media-based framework for disaster situational awareness to identify social media content related to typhoon disasters. The framework aims to address the limitations of previous research, such as low spatiotemporal resolution of disaster damage distribution and high noise in social media data, by leveraging fine-grained spatiotemporal situational awareness. Compared to prior studies, this work achieves significant advancements in spatiotemporal resolution, data integration methods, and the characterization of dynamic spatiotemporal features. It offers a novel perspective on extracting socially-perceived information during disasters, enhancing the efficiency of spatiotemporal situational awareness throughout the disaster process. Transfer learning was employed to apply the mature Deeplab v3+ (Encoder-Decoder with Atrous Separable Convolution for Semantic Image Segmentation) image segmentation algorithm to extract disaster damage information from Typhoon “Haikui” images on Weibo. For disaster damage information that cannot be extracted from social media images, such as power and water outages, the natural language processing model ERNIE (Enhanced Representation through Knowledge Integration) is used to extract the information from text and quickly generate disaster maps. This framework offers complementary views of disaster situational awareness, capitalizing on the advantages of social perception from social media data to enhance the accuracy and efficiency of disaster monitoring, providing valuable insights for decision-makers in the formulation and adjustment of emergency management strategies. The method proposed in this paper has a higher spatiotemporal resolution compared to previous studies. It extracts various disaster damage information from actual images and supplements the damage information with text, reflecting the dynamic perception process of typhoon disasters. Fuzhou, Fujian Province, a region significantly impacted by Typhoon “Haikui”, was selected as a case study for analysis. The regional and local overview map of the study area are shown in Figure 1. The contributions of this research are threefold:
  • In terms of fine-grained temporal information extraction, traditional remote sensing imagery has long revisit cycles and coarse temporal resolution, making continuous monitoring challenging. In contrast, Sina Weibo social media data can achieve minute-level temporal resolution, enabling minute-by-minute situational awareness of disasters, thereby significantly improving temporal granularity.
  • For the fine-grained spatial information extraction, conventional observation stations are costly to construct and limited in number, making it difficult to capture spatial heterogeneity. By extracting disaster damage characteristics from real images and utilizing multi-dimensional data fields such as text, images, and geolocation, this approach identifies damage locations that are often missed by disaster relief agencies. This improves spatial resolution, providing real-time, on-site information about disaster damage, and helping decision-makers gain a more comprehensive understanding of the extent and severity of the disaster-affected areas.
  • For the coarse-grained spatiotemporal information extraction, the proposed integrated method offers a detailed reflection of the dynamic evolution of typhoon disaster situations. It explores the spatiotemporal characteristics of the pre-disaster, during-disaster, and post-disaster stages, providing an objective and spatiotemporal depiction of the typhoon’s development, key inflection points, and the impact of disaster damage.
The remainder of this paper is organized as follows. Section 2 introduces the methodology used in this paper. Section 3 presents the case study and analyzes the results. Finally, Section 4 provides the conclusion.

2. Methodology

2.1. Overview

This study proposes a research framework for extracting social perception information and conducting disaster damage situational awareness using multimodal social media data. Unlike most approaches that rely on a single data source, this method leverages multimodal data from Sina Weibo to effectively extract disaster damage information, making it widely applicable for disaster monitoring. The primary objective of the research is to extract disaster damage locations and information from multimodal social media data and to achieve disaster situational awareness by analyzing their spatiotemporal characteristics.
Figure 2 illustrates the research framework, which consists of three main steps:
  • Step 1: Data Collection and Preprocessing—Collect multimodal data from Sina Weibo related to Typhoon Haikui in Fuzhou and filter images related to disaster damage using the MobileNetV3 binary classifier.
  • Step 2: Multimodal Social Sensing Information Extraction—Extract disaster-related information by segmenting and classifying images with DeepLabV3+ and analyzing text with the ERNIE model to identify geographic locations and disaster categories.
  • Step 3: Spatiotemporal Heterogeneity of Disaster and Driver Analysis—Visualize the spatiotemporal distribution of disaster information, conduct disaster hotspot analysis, and apply the Geodetector to explore spatial heterogeneity and driving factors of disaster hotspots.
In this study, experiments were conducted using an NVIDIA GeForce RTX 3050 Laptop GPU. The relevant image classification and disaster damage image segmentation tests were performed in a deep learning environment running on the PyTorch 1.7.1 framework.

2.2. Data Collection and Preprocessing

Using typhoon disasters as an example, we demonstrated the effectiveness of this method for short-term, intense disaster situational awareness. Fujian Province, located along the southeastern coast of China and adjacent to both the East China Sea and South China Sea, is a key path for typhoon formation and development. In the summer and autumn, warm and humid oceanic air provides ample energy, creating favorable conditions for the formation and intensification of typhoons. The coastal areas of Fujian Province host a large number of densely-populated cities and rural communities. Some regions have relatively fragile infrastructure and weaker defenses against typhoons, which increases disaster risk and makes the impact of typhoons on the local economy and residents’ lives more significant. The sources of Weibo multimodal data and basic geographic data are shown in Table 1 and Table 2 respectively
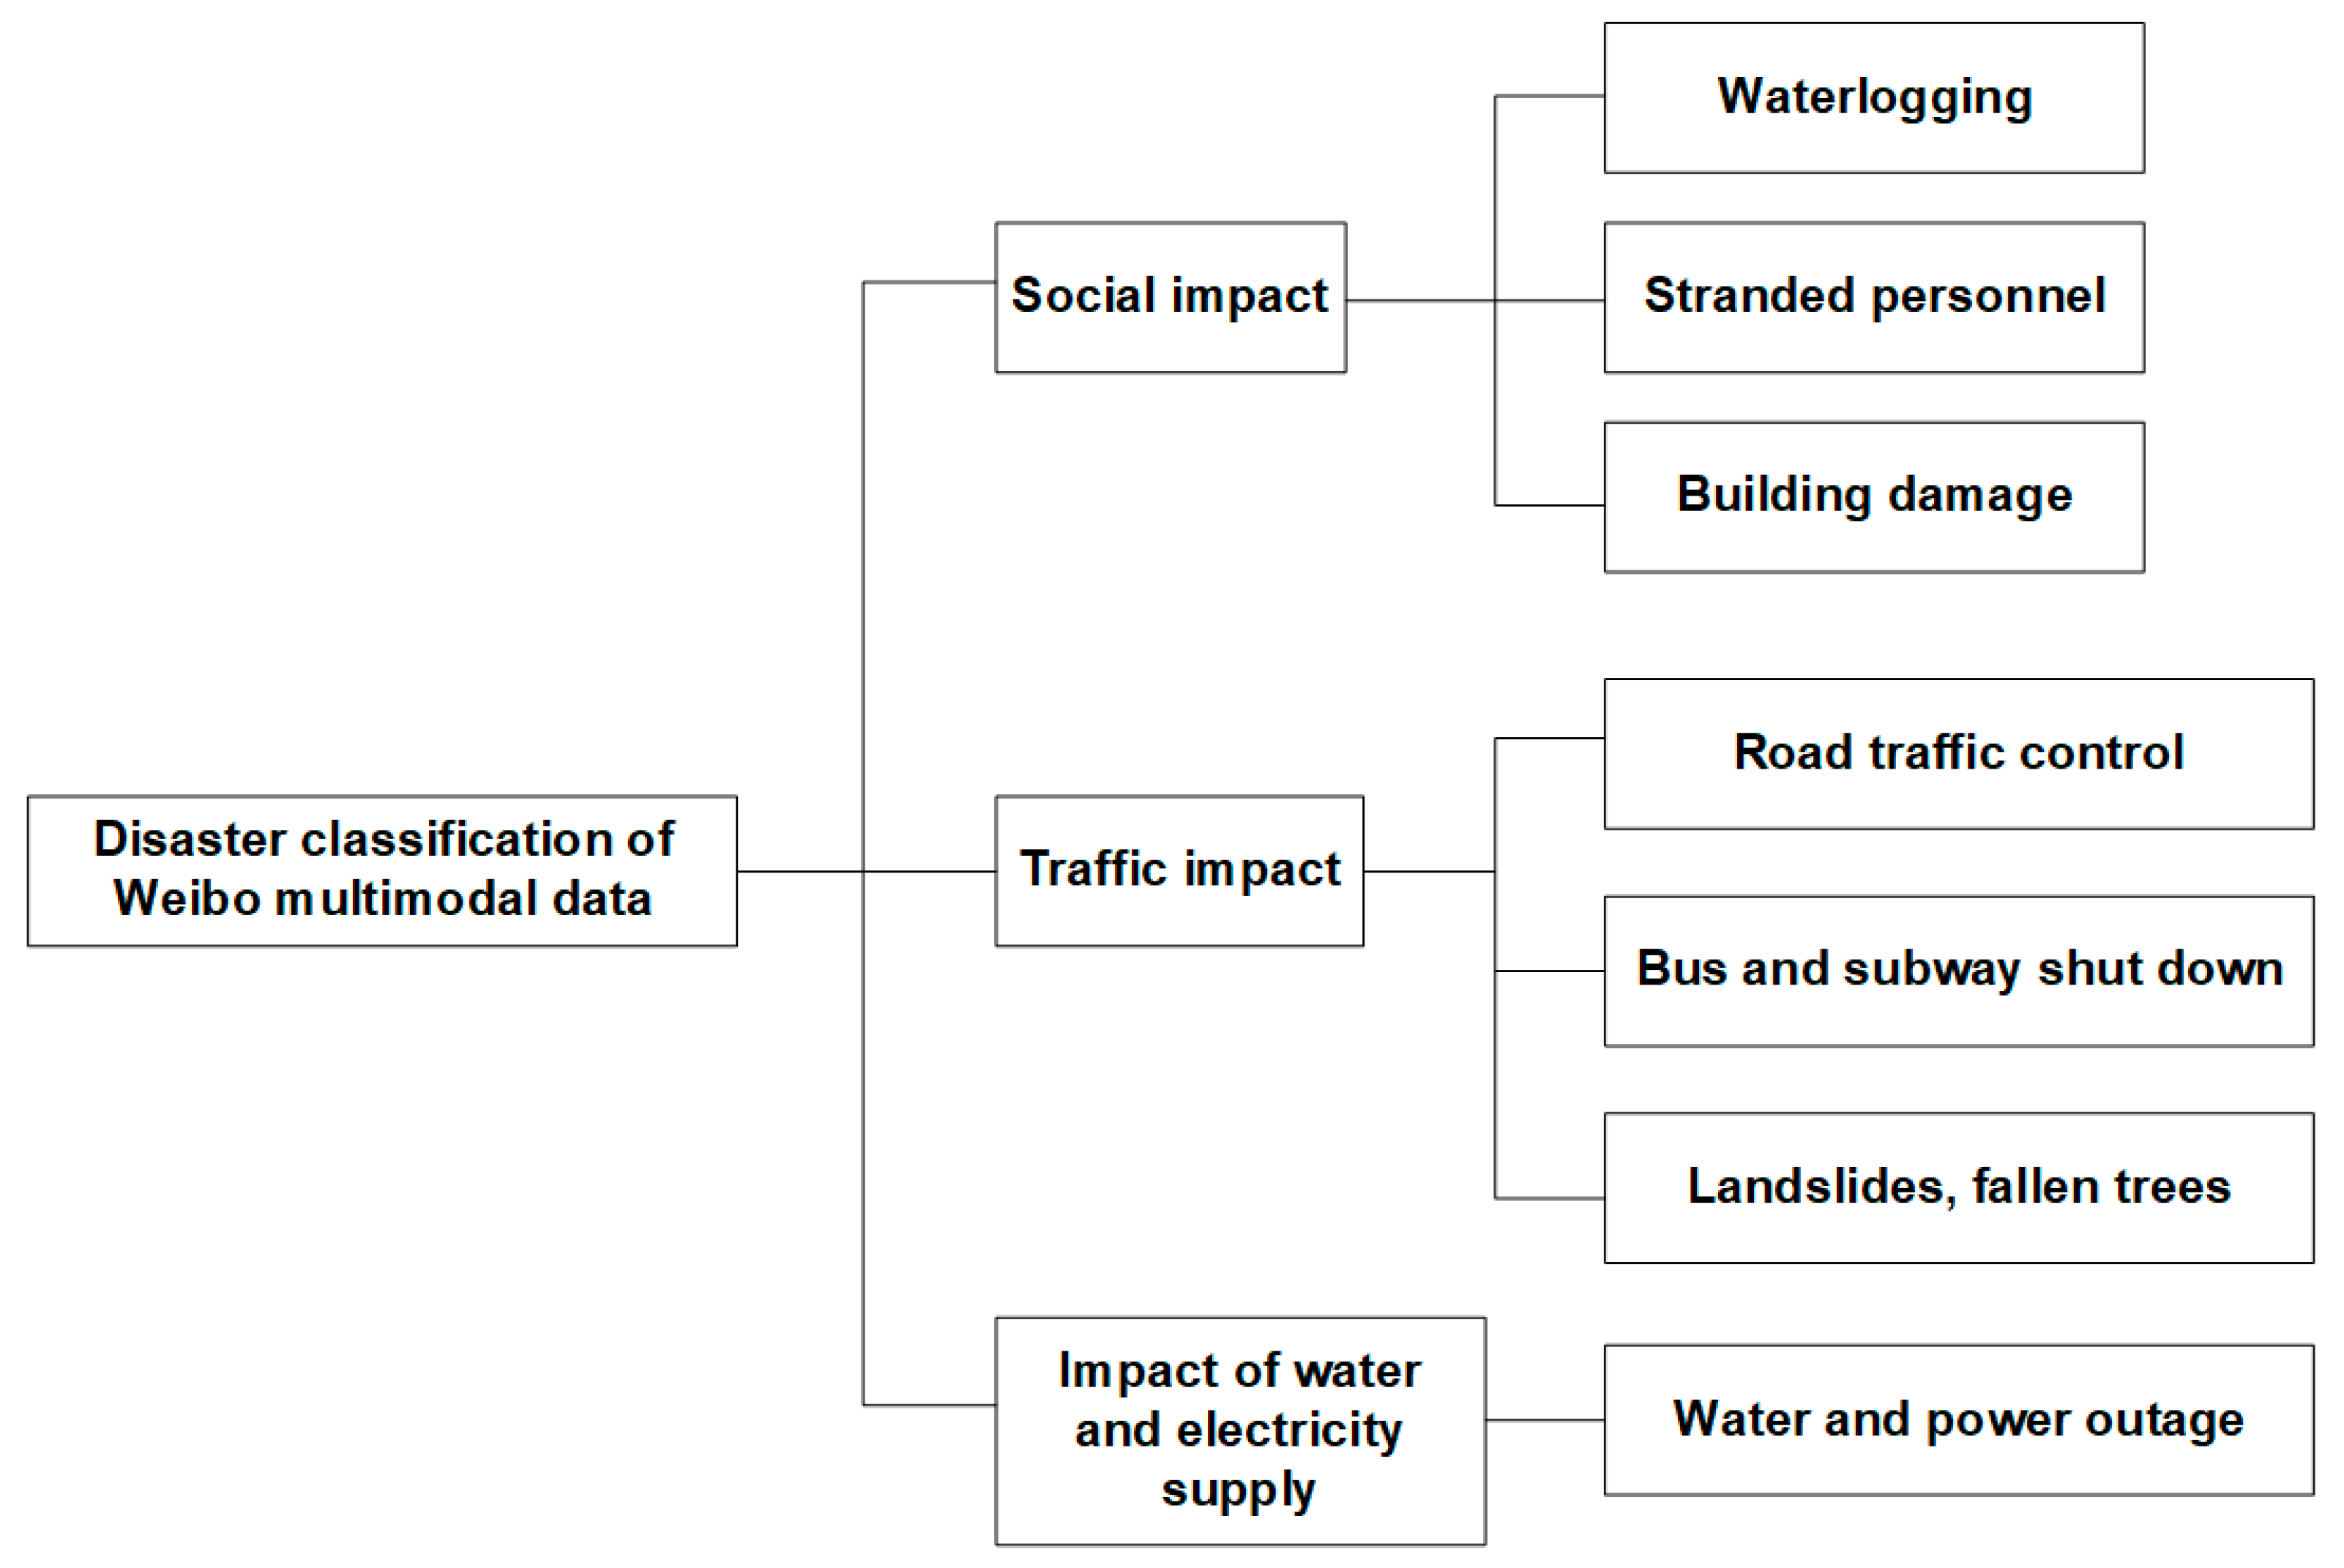
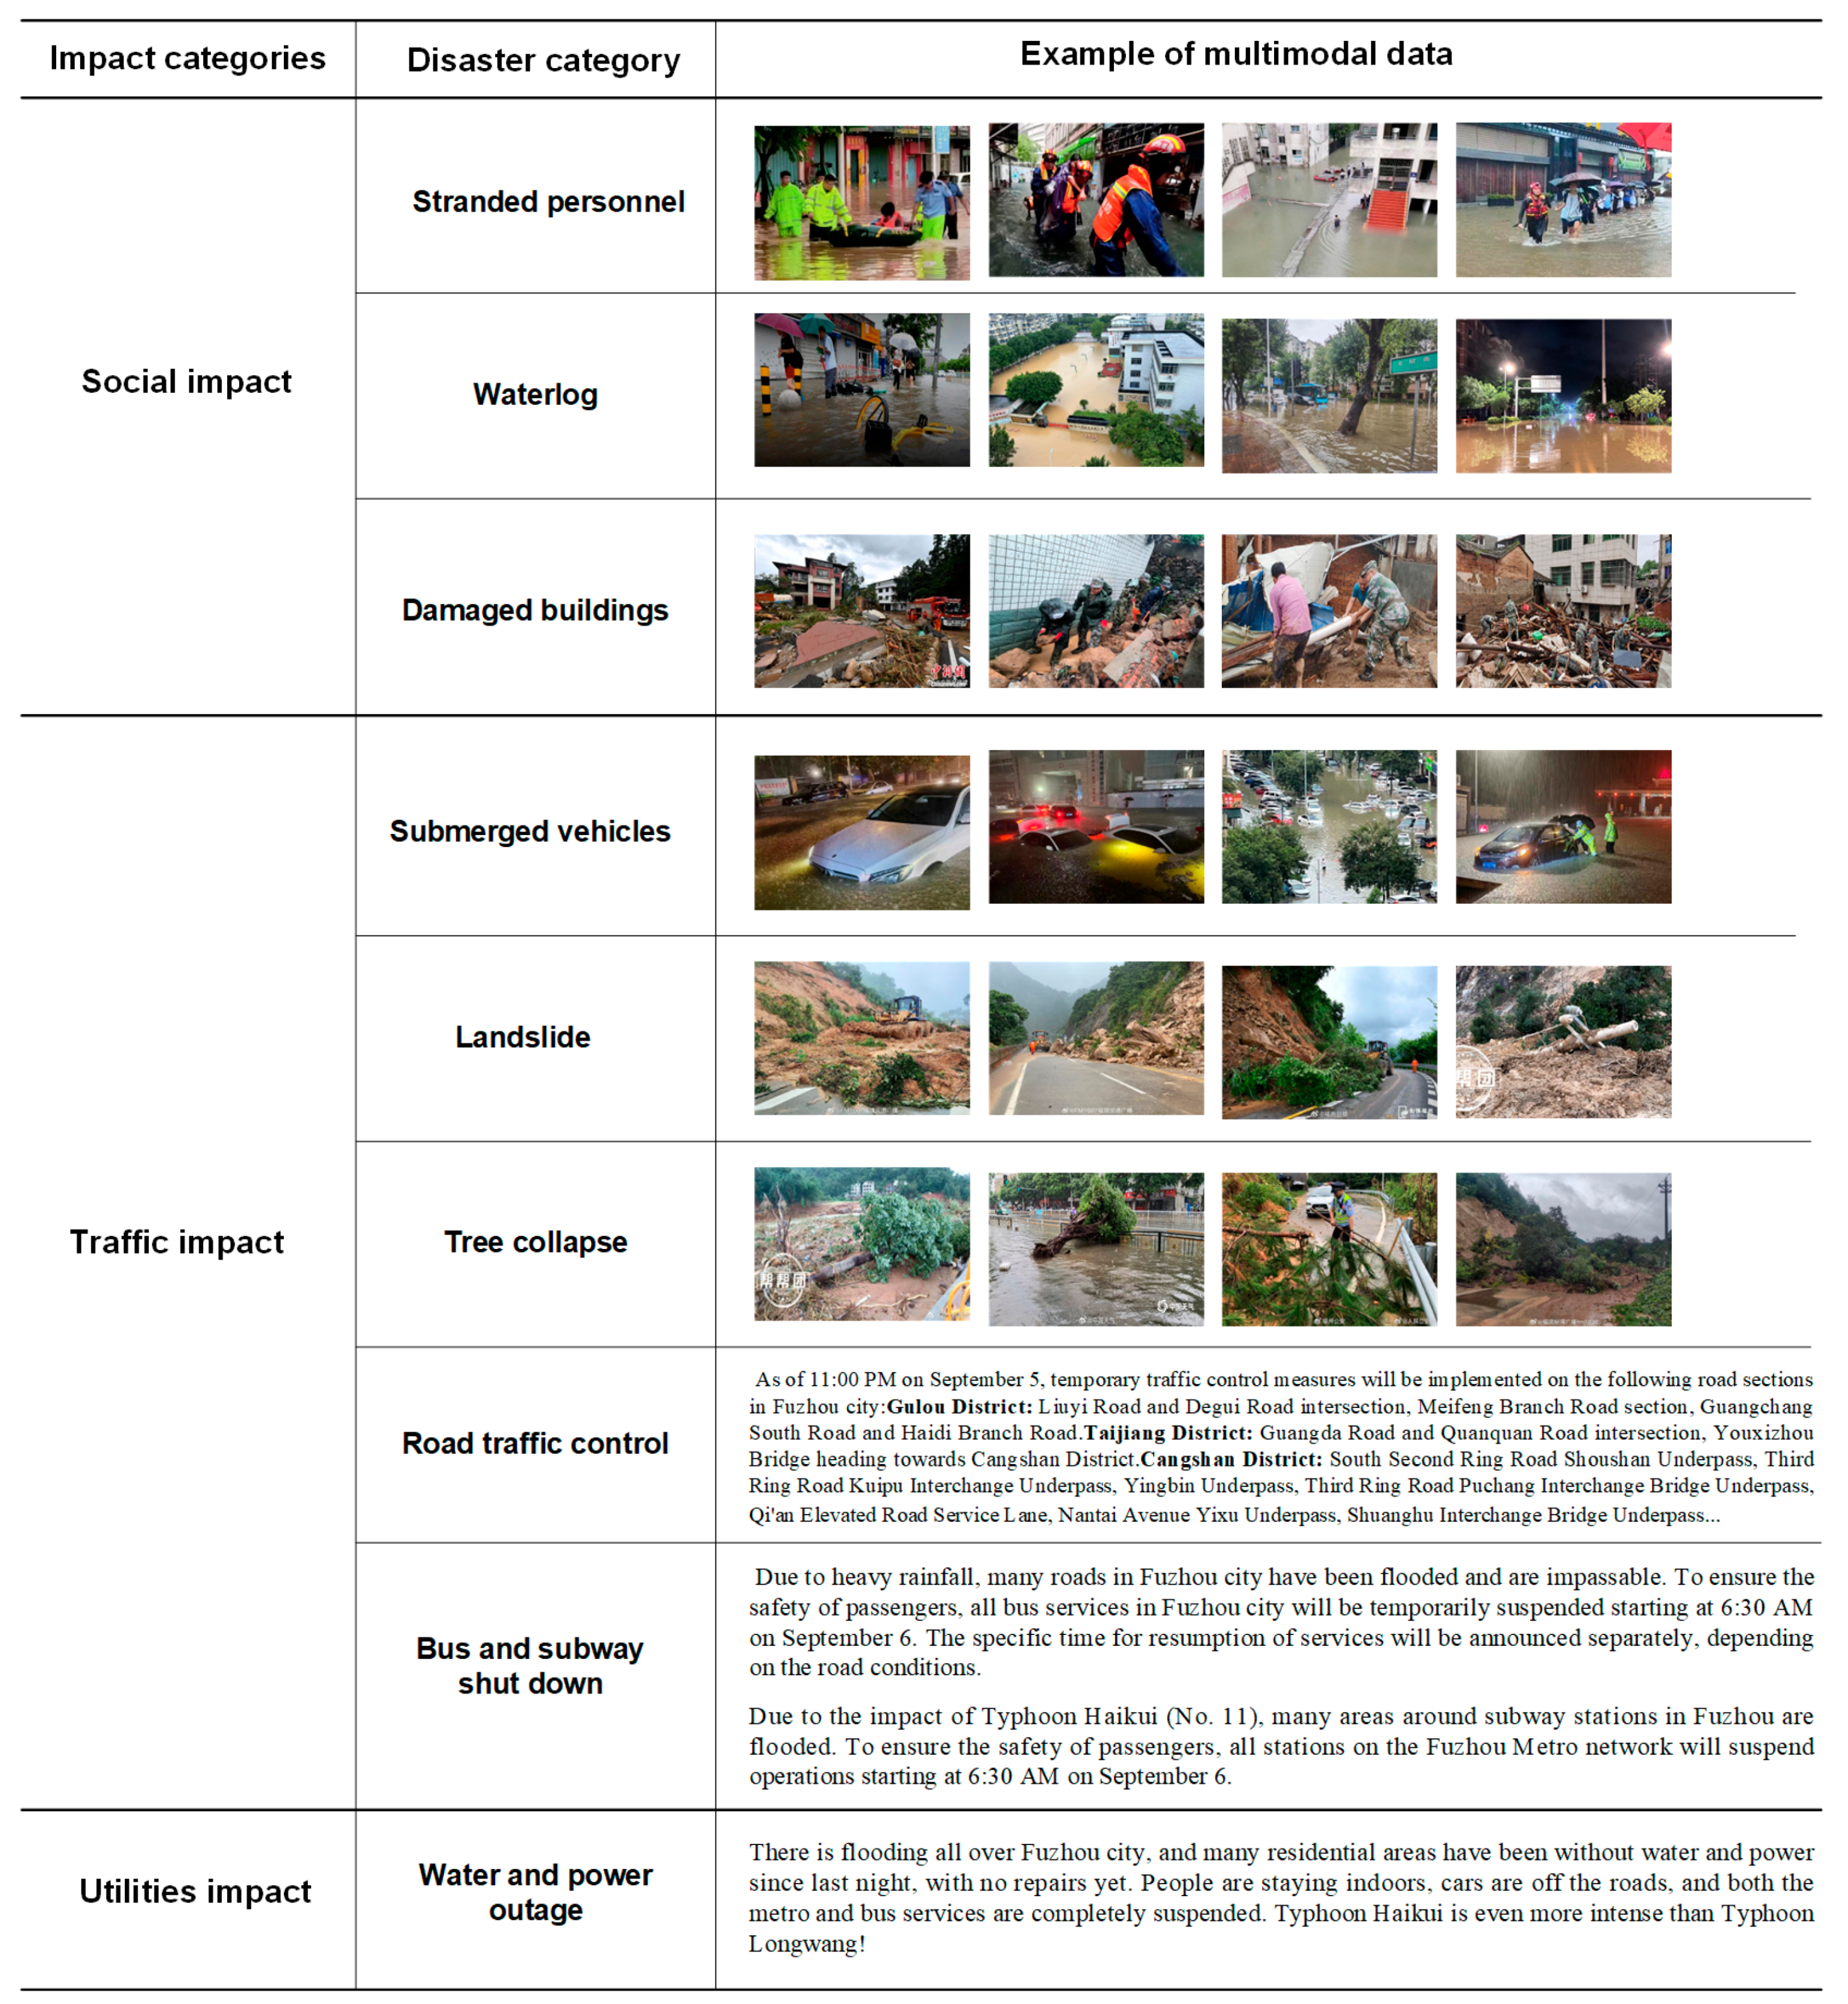
Referring to the “Technical Specifications for Investigation of Meteorological Disasters—Collection of Meteorological Disaster Information” issued by the China Meteorological Administration in 2019 [42], and in combination with the disaster-stricken characteristics of the multimodal data of social media in Fuzhou City during the Typhoon Haikui that were collected, the categories of disaster loss information were classified, as shown in Figure 3. The disaster classification example of Weibo multi-modal data is shown in Figure 4.

2.2.1. Weibo Multimodal Data Acquisition

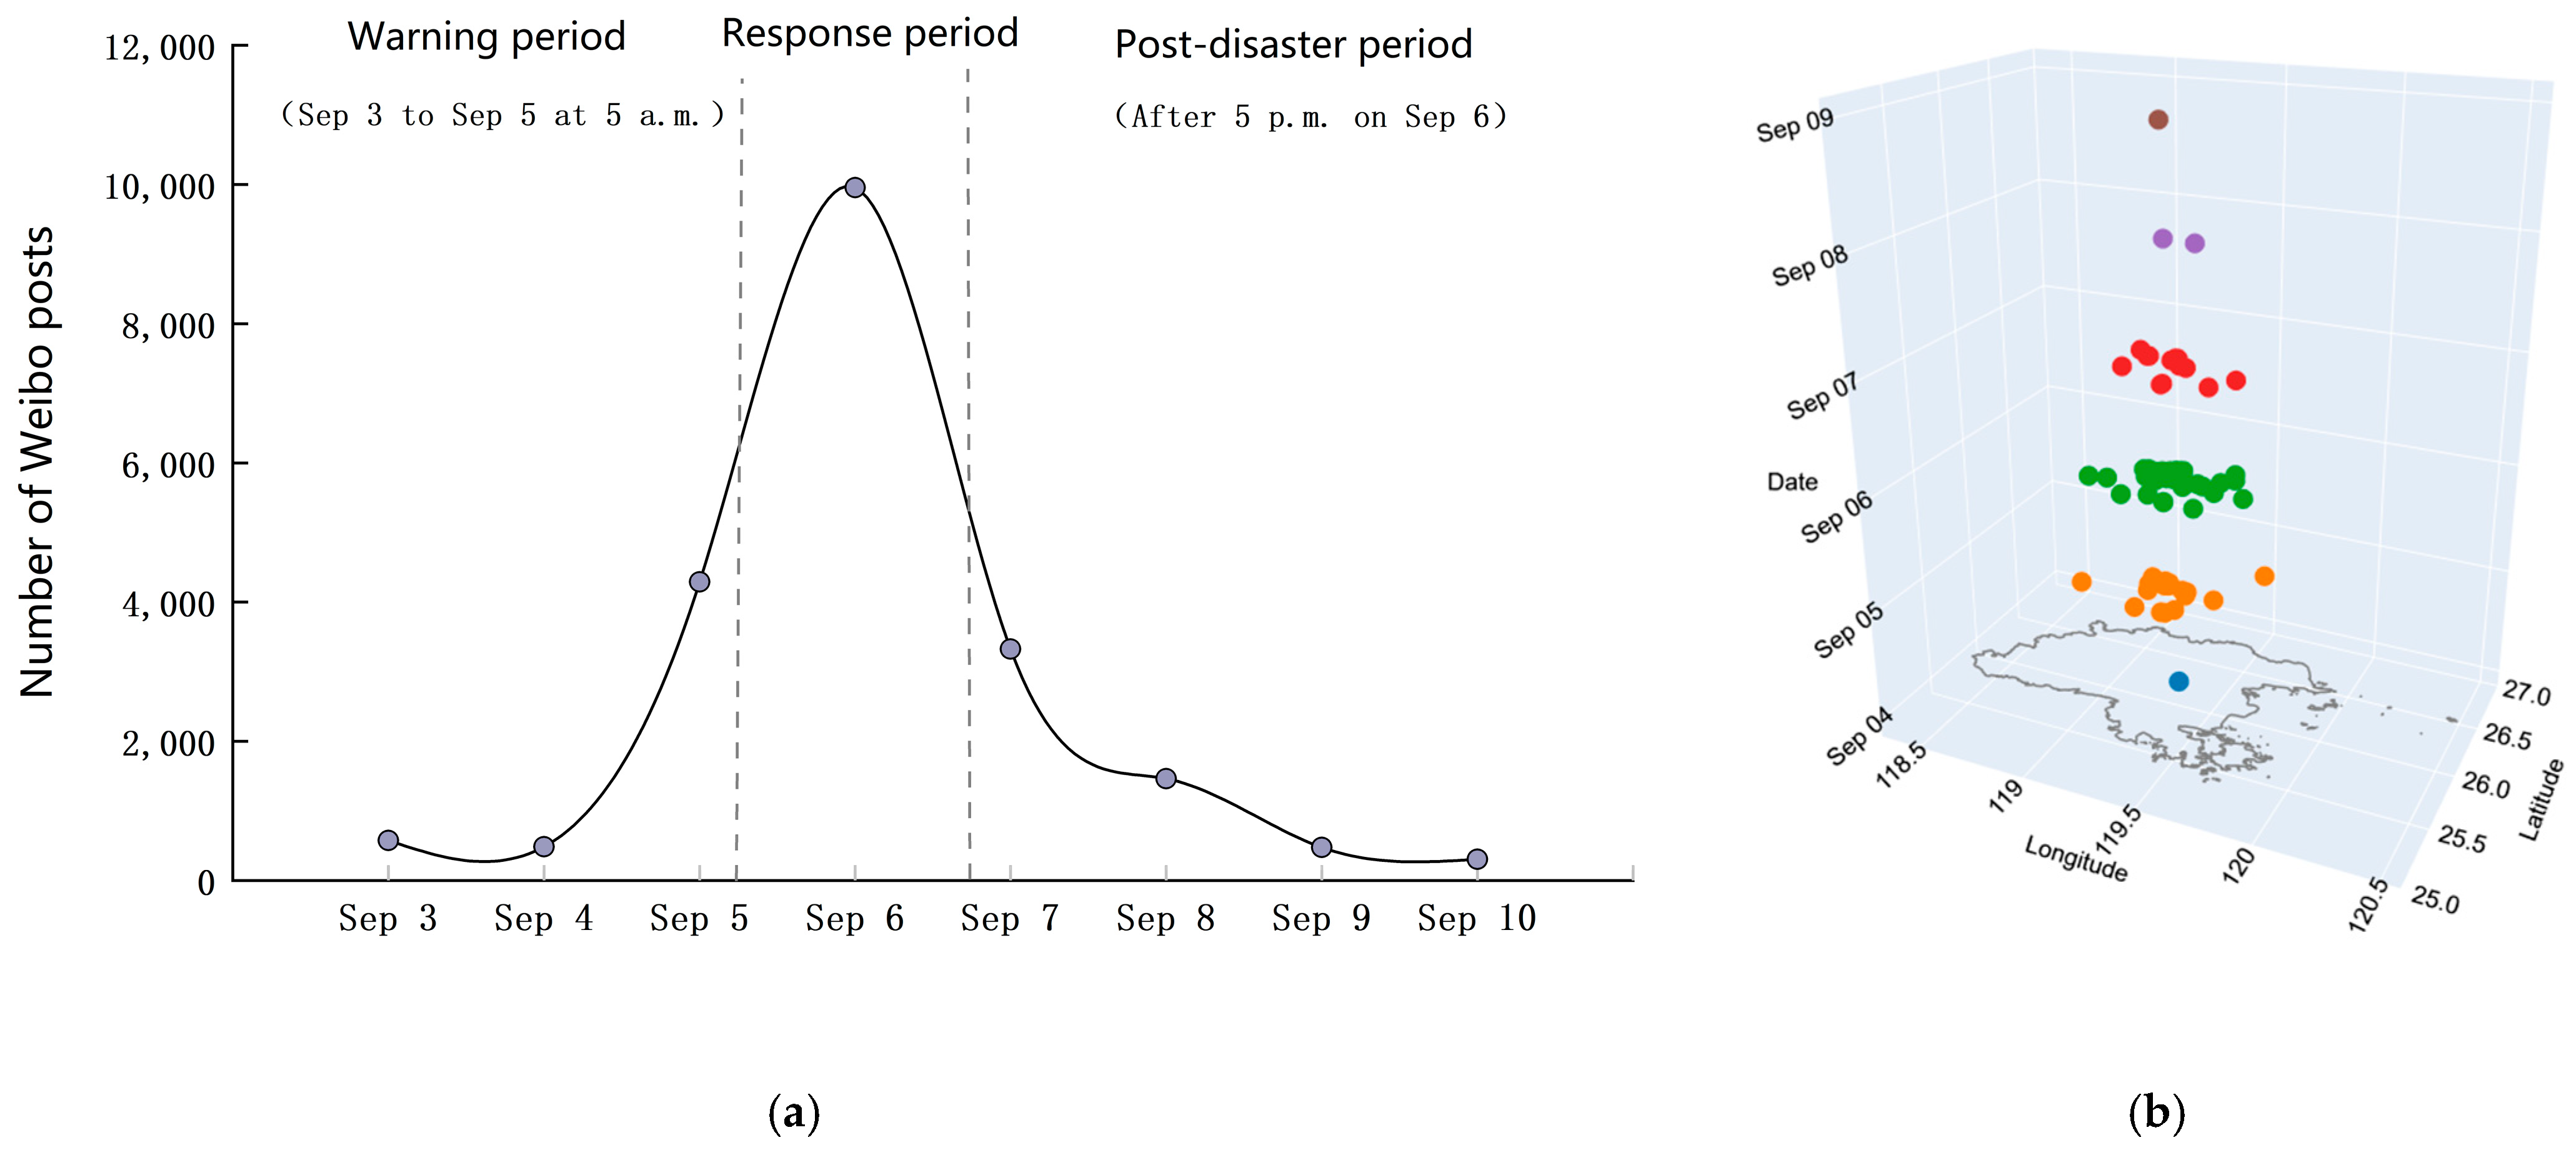
Social media data for this study were sourced from the Sina Weibo platform. Given that the Weibo Application Programming Interface (API) typically does not allow filtering by time range or specific topics, we utilized Weibo’s advanced search feature. A data collection tool was developed in Python to filter and collect data using keywords such as “Haikui”, “Fuzhou”, and “rainstorm”, along with specified time ranges. The collected data included the posting time of the Weibo post, textual content, image URLs, and geotagged locations. Image data were downloaded locally via the image URLs for further analysis in the case study of Typhoon Haikui. Weibo accounts are classified into personal and official categories, and it was observed that official accounts tend to share more information regarding disaster damage than personal accounts. A total of 20,875 Weibo posts were collected and plotted as a time–series curve (Figure 5), showing daily variations in post volume. The timeline of the Typhoon Haikui event was divided into three phases: the warning phase, the emergency phase, and the post-disaster phase, based on the typhoon’s landfall in Fujian Province and the termination of its numbering. The warning phase lasted from 3 September to 5:00 a.m. on 5 September; the emergency phase spanned from 5:00 a.m. on 5 September to 5:00 p.m. on 6 September; and the post-disaster phase covered from 5:00 p.m. on 6 September to 10 September. Only posts that explicitly indicated the location of the disaster or contained images with clear location references were retained for this study. Manual screening was conducted to ensure the quality and accuracy of the data.

2.2.2. Weibo Image Deduplication

Social media users tend to frequently repost content that is most relevant to the disaster. Due to the high number of reposts, some images were shared multiple times on Weibo. While repeated images can emphasize key areas, they hinder the extraction of damage information from more remote regions. Therefore, we performed a deduplication process on the image data. The ImageHash library in Python offers ready-made methods and supports various hashing algorithms, enabling efficient image deduplication. After using the ImageHash library to remove duplicates, 3258 unique images from Fuzhou were retained, accounting for approximately 61% of the total images collected from Fuzhou.

2.2.3. Disaster-Related Image Filtering Using MobileNetV3

Despite filtering based on keywords and time, not all images are directly related to disaster damage. The objective of this study is to enhance disaster situational awareness, and filtering out images unrelated to disaster damage can improve the accuracy of damage segmentation. Due to computational constraints, we utilized the lightweight deep neural network MobileNetV3 [43] for relevance classification (Figure 6), categorizing Weibo images as either disaster-related or unrelated. To train the image relevance classification model, we constructed a sample dataset. The relevant image sets in the training and validation datasets were sourced from the “Hainan Wind Disaster Monitoring Dataset Based on Social Media” [41] and Weibo images of Typhoon Chaba in 2022. We manually divided a mixed dataset, comprising Typhoon Chaba 2022 Weibo images and the Hainan Wind Disaster Monitoring Dataset, into a training set with 18,260 images, categorized as either typhoon-related or unrelated. The MobileNetV3 image classification model was then trained to classify images unrelated to typhoon damage as irrelevant. Subsequently, transfer learning was applied to use the trained model for the relevant classification of Typhoon Haikui’s Weibo images. The concept of transfer learning involves leveraging the pre-trained model’s existing weights to obtain a high-performance classifier with a limited number of labeled samples. This method allows us to transfer the network’s features and parameters from large-scale image classification tasks to more specific domains.

2.3. Extract Multimodal Social Sensing Disaster Information

2.3.1. Disaster Image Segmentation Using Deeplabv3+

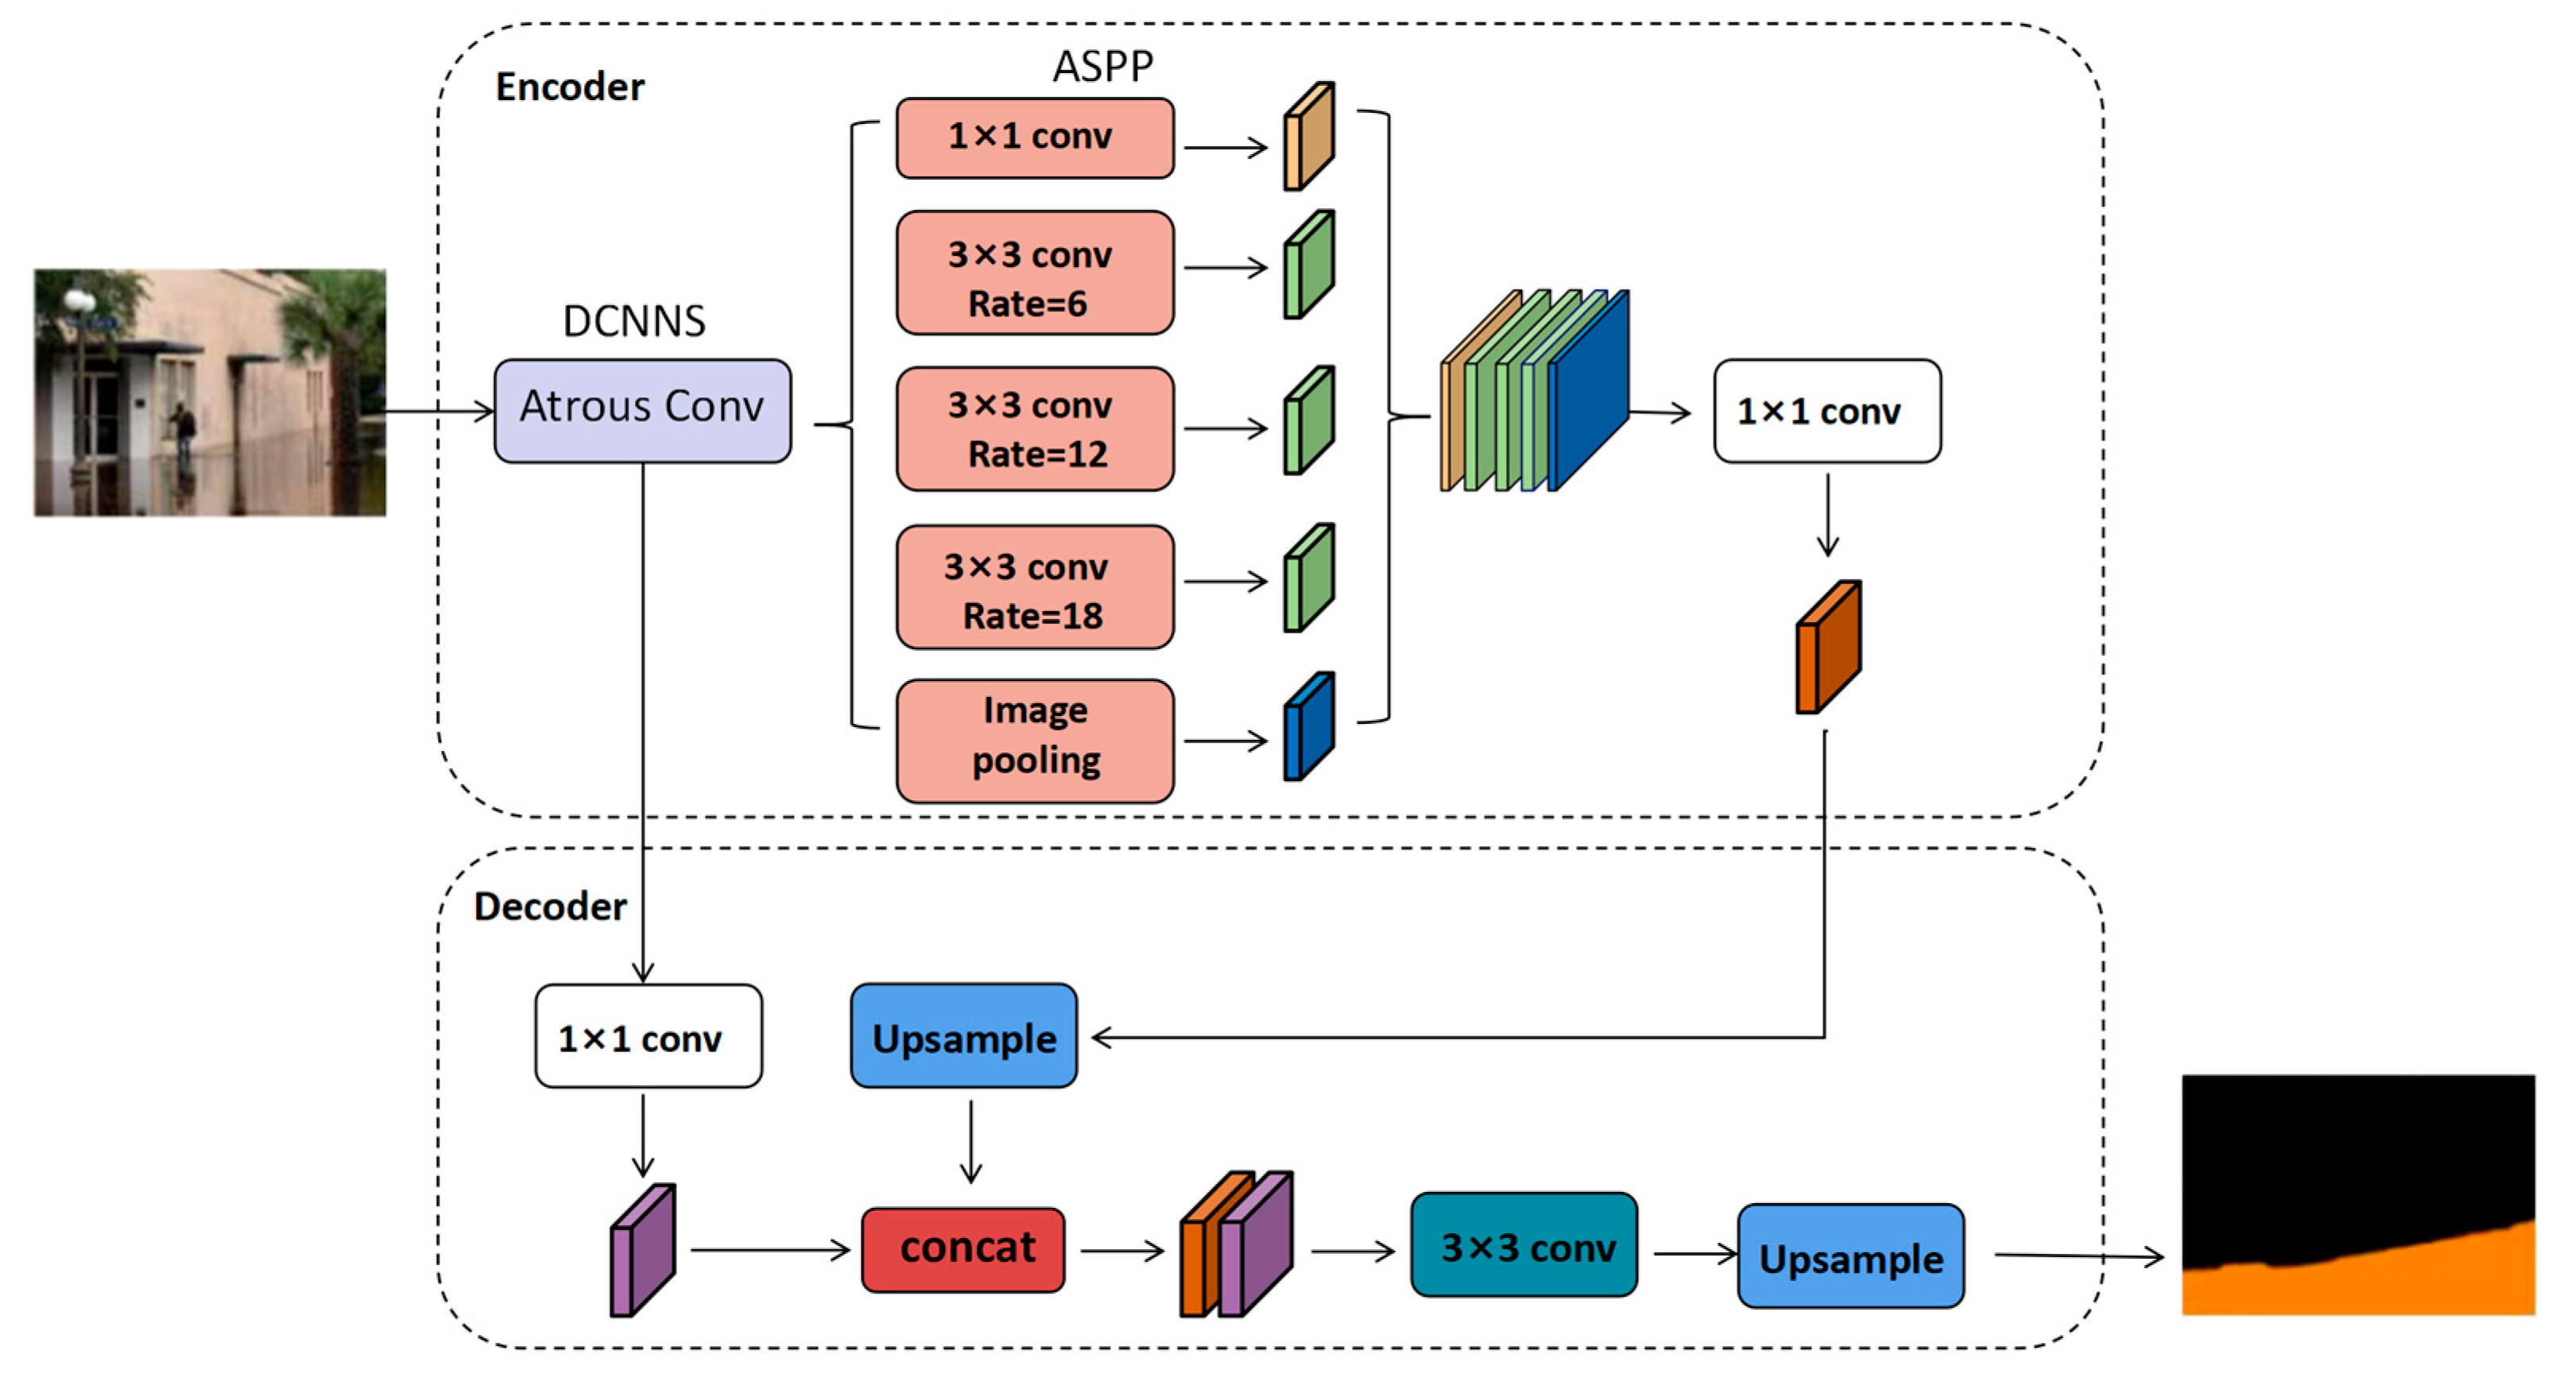
This study utilizes social media images for disaster damage analysis, enhancing situational awareness through image segmentation techniques. The core method employed is semantic segmentation, which classifies disaster-affected areas in images on a per-pixel basis. The sample dataset for the disaster damage image segmentation model was primarily derived from the “Deep Learning Benchmarks and Datasets for Social Media Image Classification in Disaster Response” [39], developed by Firoj Alam et al. in 2020, supplemented with images from Typhoon Chaba in 2022. Since the original dataset was not suitable for image segmentation tasks, we manually annotated flood images using the EISeg tool and collected additional disaster damage images via Weibo. After filtering, a total of 2226 images were used. These images were annotated into five categories: urban flooding, submerged vehicles, fallen trees, damaged buildings, and landslides. The segmentation model is based on the pre-trained DeepLabv3+ [44] architecture, with MobileNetV2 as the backbone network, incorporating Inverted Residual Blocks and depthwise separable convolutions to extract both shallow and deep features (Figure 7). The dataset was split into training and validation sets in a 9:1 ratio. During training, the backbone network was frozen for the first 100 epochs, after which it was unfrozen for 300 additional epochs. The batch size was set to 8 during the frozen phase and 16 during the unfrozen phase. The optimizer used was Stochastic Gradient Descent (SGD), with an initial learning rate of 0.01, a momentum of 0.9, and an L2 regularization value of 0.0001. The loss functions included cross-entropy, focal loss, and Dice loss, with a learning rate decay strategy applied during training.
To evaluate the performance of pixel classification, we employed four metrics: Overall Accuracy (OA), Mean Intersection Over Union (MIoU), Mean Pixel Accuracy (MPA), and Recall (RC). These metrics were calculated using a confusion matrix based on four cases: True Positive (TP), False Positive (FP), True Negative (TN), and False Negative (FN). TP represents the number of image pixels correctly classified as belonging to the flood category, while TN refers to the number of pixels correctly classified as part of the non-flood (background) category. FP denotes the number of pixels incorrectly classified as flood-related, even though they do not belong to the flood category, and FN represents the number of pixels that should have been classified as flood-related but were mistakenly associated with the background category. The formulas for calculating these evaluation metrics are as follows:
Overall Accuracy (OA) refers to the ratio between the number of correctly classified pixels and the total number of pixels.
O A = T P + T N T P + T N + F P + F N
Mean Intersection Over Union (MIoU) is the average ratio of the intersection to the union between the segmentation result and the ground truth. A higher MIoU indicates that the segmentation result is closer to the actual ground truth, and the segmentation algorithm performs better across all categories.
MIou = 1 k + 1 i = 0 k T P T P + F P + F N
We evaluated the performance of the Deeplabv3+-based disaster monitoring method through experiments on the test set. Although the overall accuracy of the dataset was relatively high, the MIoU for the category-specific metric was 60.78, indicating that it is challenging to accurately align the boundaries of floodwater with the ground truth. This may be due to the issue of sample imbalance, where the number of pixels in the floodwater category is much smaller than that of the background category, causing the model to favor background predictions and resulting in a lower MIoU. The final accuracy reached 89.05, demonstrating the effectiveness of the DeepLabv3+ model in disaster damage image segmentation.

2.3.2. ERNIE-Based Extraction of Location and Damage Information

In this study, the ERNIE model [45] was used to extract information from text, including the time of disaster occurrence, the geographical location of affected areas, the type of disaster damage, and rescue and aid requests. For the same Weibo post, when both the text and images contain disaster damage information, they can complement each other in providing a more comprehensive view of the situation. On one hand, textual descriptions of severely affected areas may be insufficient, while on the other hand, images struggle to convey social impacts such as water and power outages.
Geographic information from social media related to disaster damage can provide detailed insights into affected areas for disaster response and management. Early methods such as text semantic classification, topic modeling, and sentiment analysis are insufficient to meet these needs. Weibo’s check-in location is only available when the location feature is enabled, and disaster response and aid efforts require highly accurate geographic information. Text can facilitate fine-grained location extraction, including roads, intersections, and points of interest (POI), which help in quickly locating disaster-affected areas and providing aid. Therefore, we extracted disaster-related information by identifying key terms such as full geographic locations, disaster damage types, and time from the text. We matched the recognized flood images with the corresponding posts to filter the textual data associated with typhoon disaster damage. Geographic location extraction typically involves two key steps: identification and geolocation. The first step identifies location descriptions from the text content of social media messages, and the second step aims to find appropriate geographic coordinates and spatial representations for these identified locations. We used the ERNIE model to extract full addresses in the format of “province-city-district (county)-specific location”. Subsequently, a map application API was used for geocoding, accurately converting the addresses into WGS1984 latitude and longitude coordinates for spatial visualization.

2.4. Spatiotemporal Heterogeneity of Disaster and Its Driving Factors

2.4.1. Disaster Hotspot Analysis

The First and Second Laws of Geography indicate that spatial patterns of interest in geography can be categorized into three types: spatial autocorrelation, spatial local heterogeneity, and spatial stratified heterogeneity. In this study, hotspot analysis is employed to measure spatial heterogeneity. The Global G index (Getis–Ord General G) and the Local G index (Getis–Ord Gi*) are used to assess the clustering of hotspots and coldspots for different disaster situations on a global and local scale, respectively. Additionally, the geographic detector method is utilized to attribute the causes of spatial heterogeneity, analyzing the driving factors behind the evolution of disaster situations from a holistic perspective.
The formula for the Global G index is as follows:
G = i = 1 n j = 1 n w i j x i x j i = 1 n j = 1 n x i x j , x j
The Local G index is used to describe the degree of clustering of high or low values of a single geographic feature in relation to its surrounding areas. The calculation formula is as follows:
G i * = j = 1 n w i j ( x j x ¯ ) S n j = 1 n w i j 2 j = 1 n w i j 2 n 1 , i j

2.4.2. Analyzing Disaster Drivers with Geodetector

The Geodetector is a novel statistical method for detecting spatial heterogeneity and revealing the driving factors behind it. It consists of four detectors: differentiation and factor detector, interaction detector, risk detector, and ecological detector, and has been widely applied in various fields of natural and social sciences [46]. In this study, the differentiation and factor detector is used to analyze the driving factors of different disaster scenarios caused by typhoons, to assess the extent to which different influencing factors (X) explain the spatial heterogeneity of disaster attributes (Y). This is measured using the q-value, with the formula as follows:
q = 1 h = 1 L N h σ h 2 N σ 2
where h = 1,…, L represents the strata of attribute Y or factor X, N h and N refer to the number of units in stratum h and the entire region, and σ h 2 and σ 2 are the variances of Y in stratum h and the entire region.

3. Case Validation: Typhoon Haikui

Typhoon Haikui not only serves as the case study in this paper, but the methods used are also applicable to situational awareness for other disasters, such as floods, earthquakes, and landslides, making them broadly representative. The effectiveness of the method was tested during Typhoon Haikui from 3 September to 10 September 2023. This paper uses the severe damage caused by Typhoon Haikui in Fuzhou, Fujian Province, as an example to explore the application of multimodal social media data in disaster situational awareness. Haikui made landfall in Dongshan County, Fujian, on 5 September, bringing extreme precipitation that broke multiple historical records and resulted in significant damage. The intensity of precipitation in Fuzhou was influenced by multiple meteorological factors, leading to prolonged heavy rainfall and exacerbating the severity of the disaster.

3.1. Spatiotemporal Situation Analysis of Haikui

This section presents an analysis of the spatial and temporal patterns of different types of damage during Typhoon Haikui, validating the effectiveness of the proposed method.
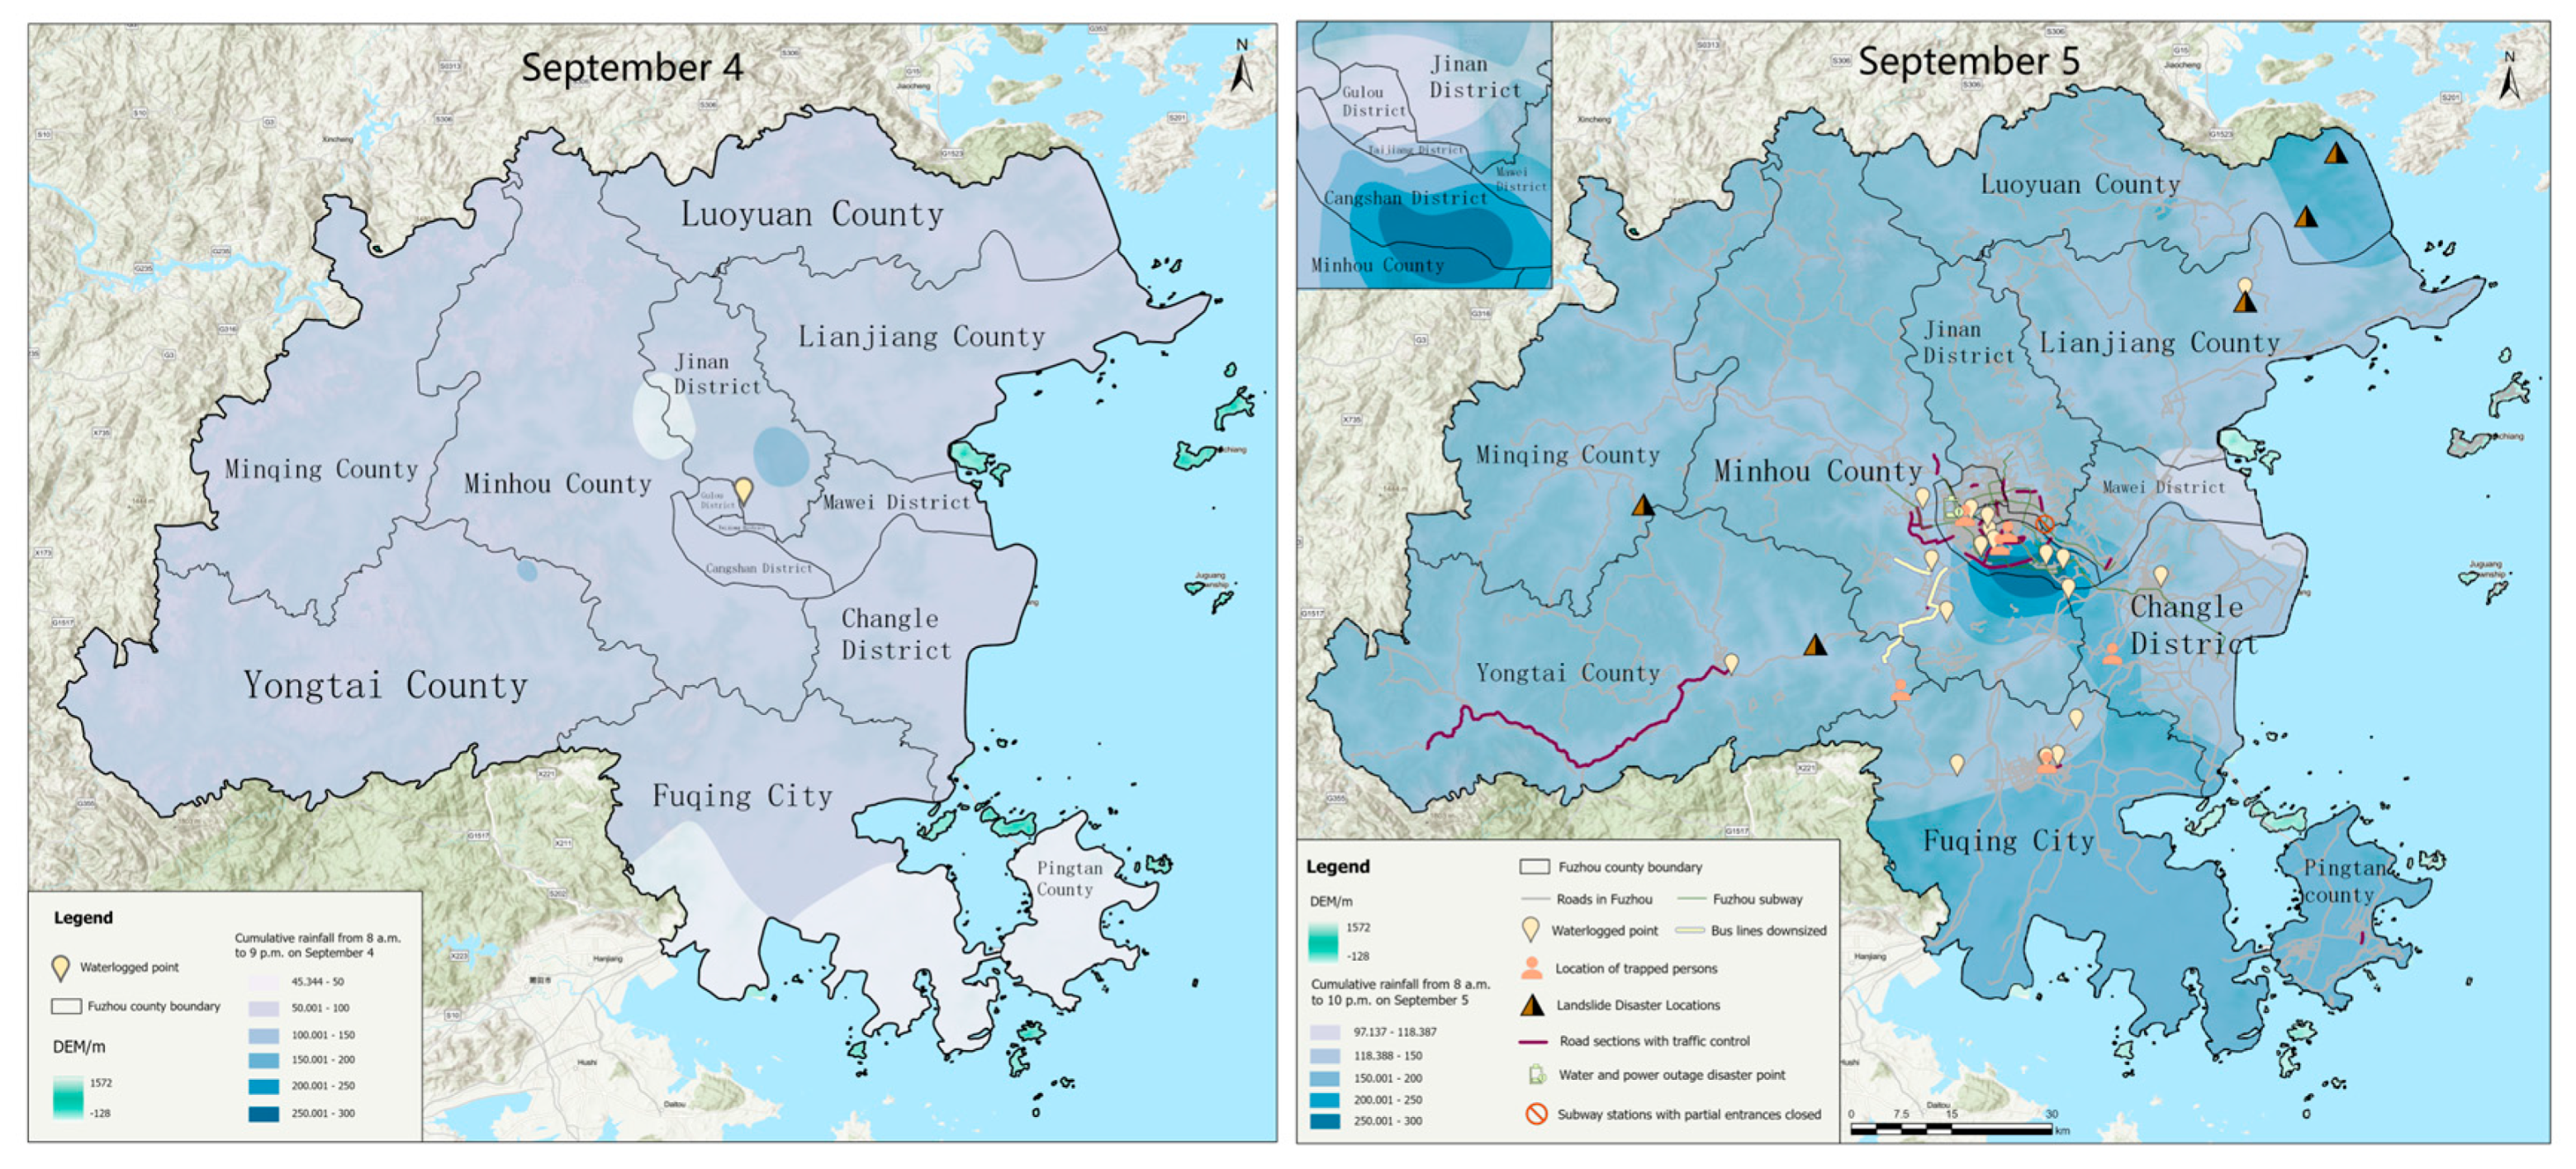
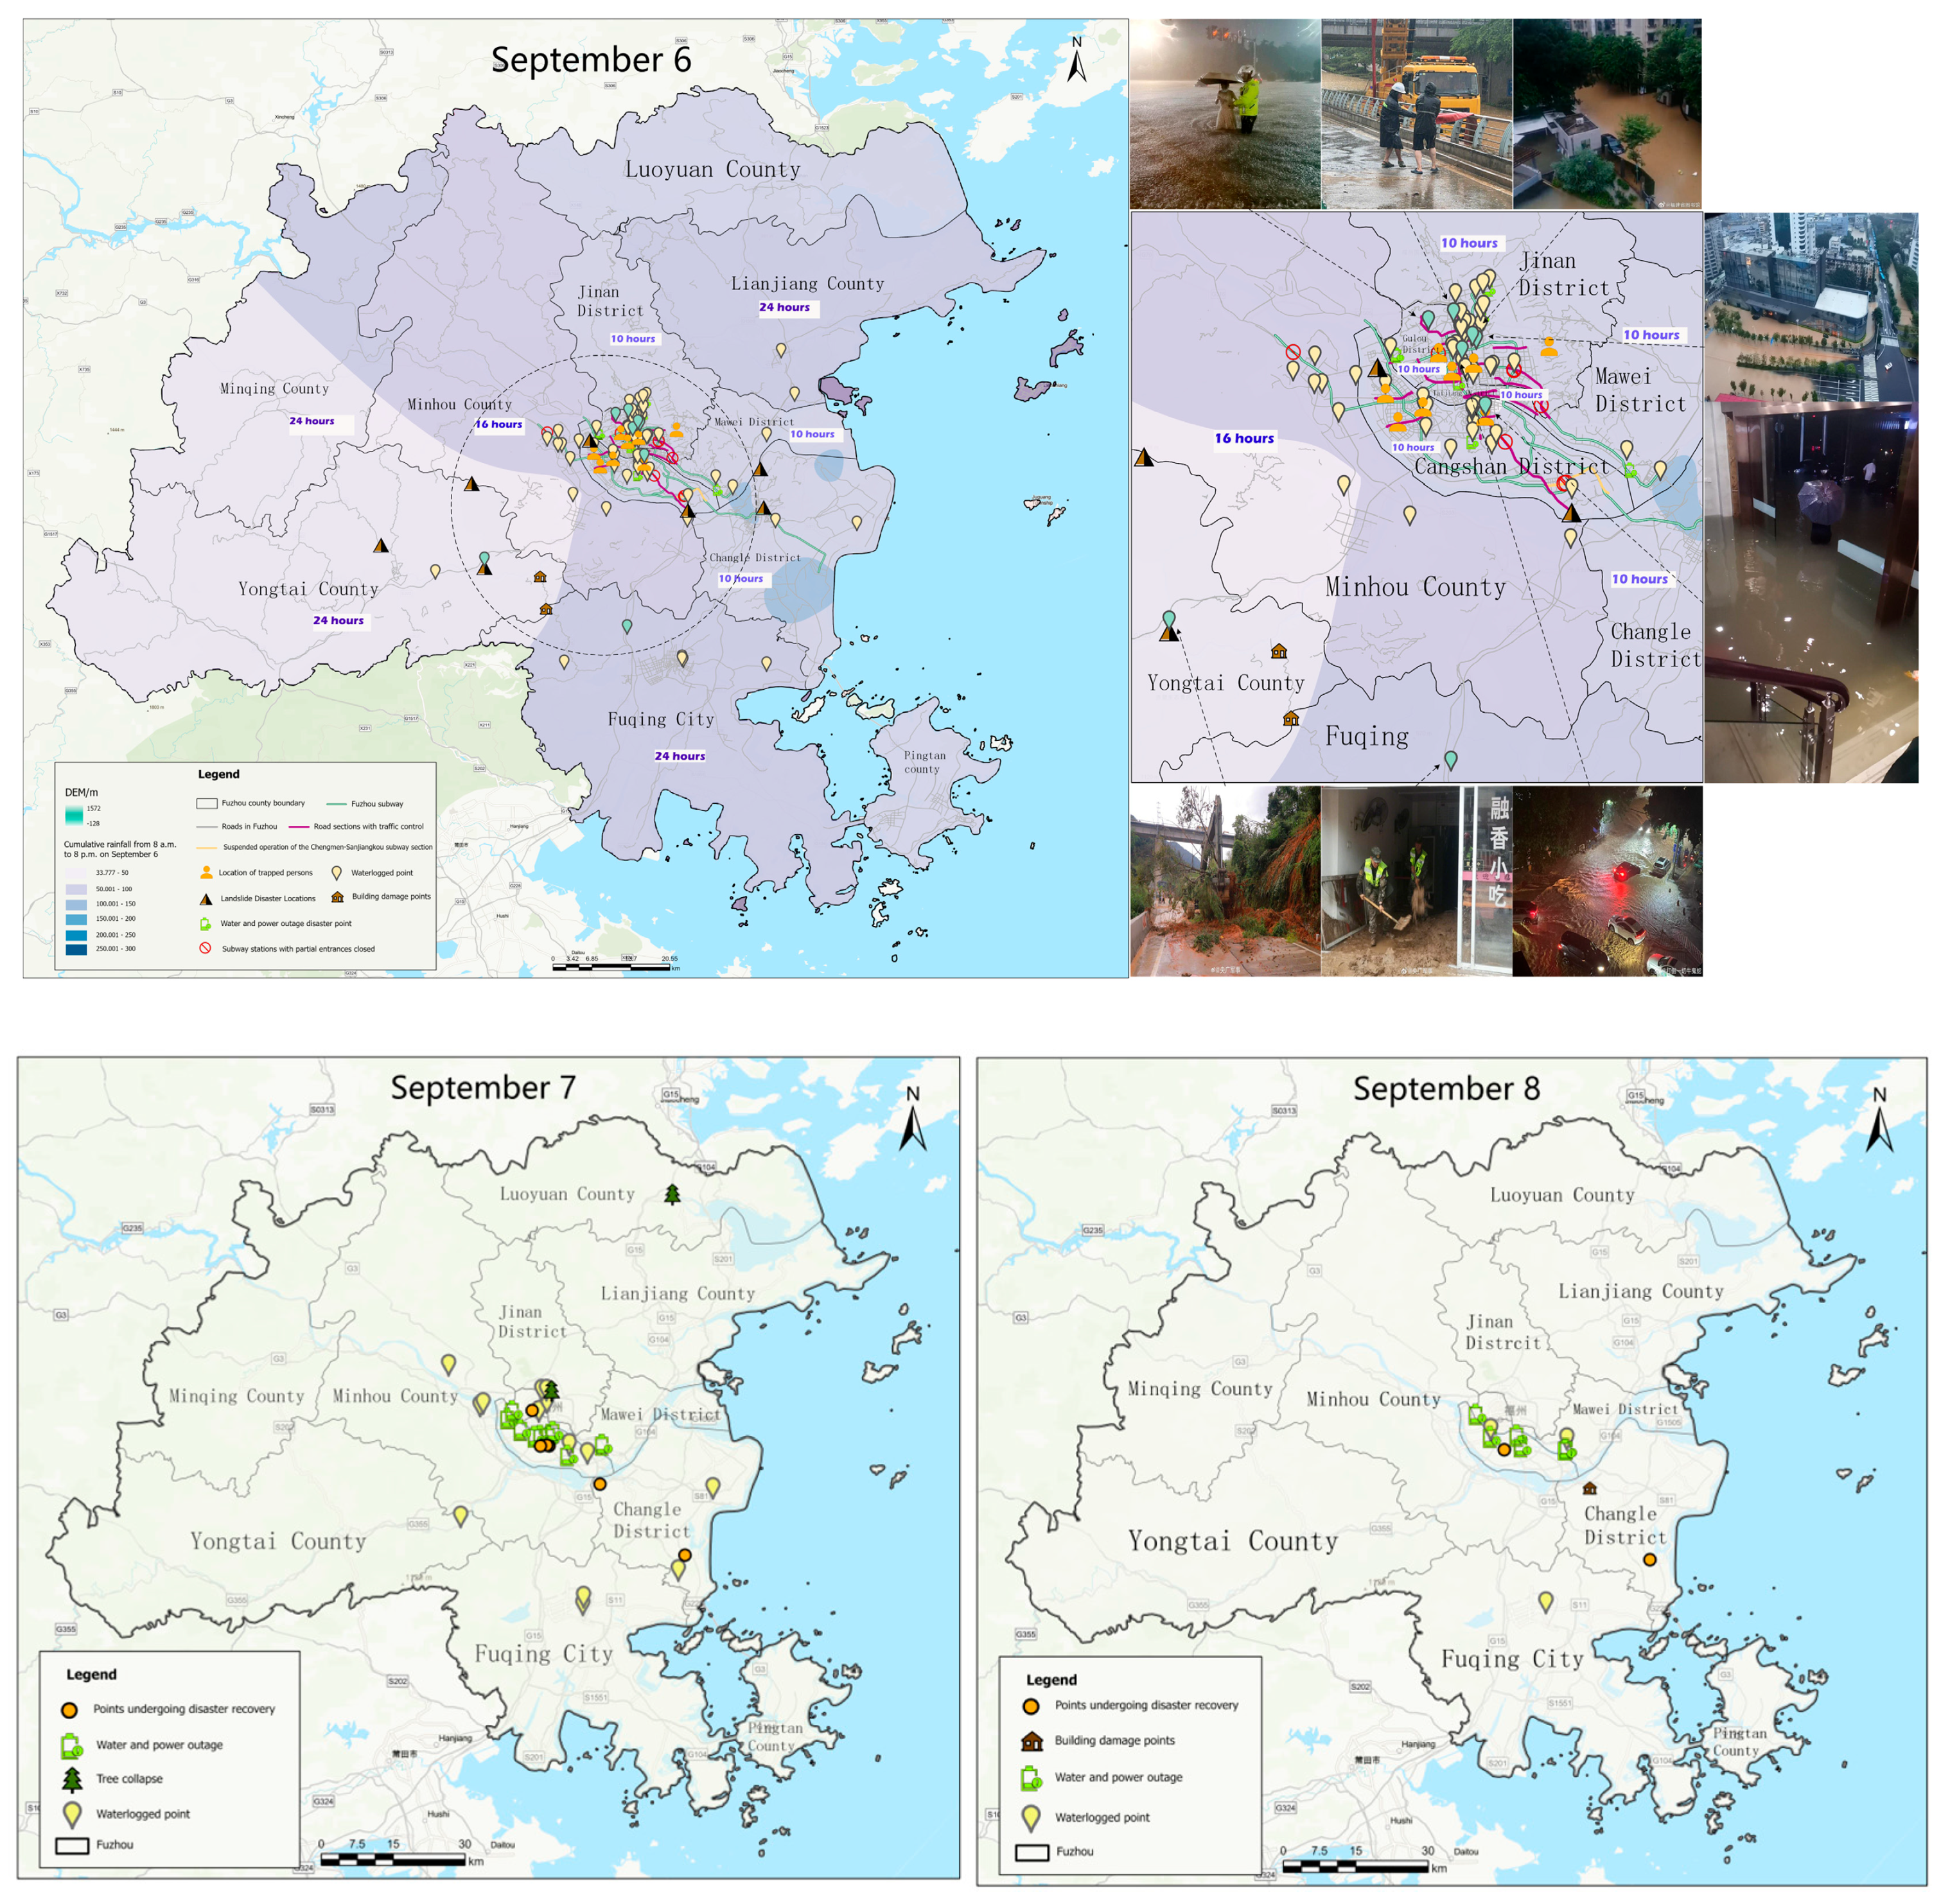
Based on the daily distribution maps of disaster points (Figure 8), waterlogging began to appear on 4 September, with a relatively small affected area. By 5 September, the scope of the disaster had significantly expanded, with multiple types of incidents emerging, including trapped individuals, traffic disruptions, and landslides, spreading to a wider range of areas. The severity peaked on 6 September, when reports of trapped individuals, traffic control, and building damage became widespread, and the number of disaster-related social media posts surged, highlighting the worsening situation. On 7 September, the severity began to decline, with disaster reports becoming less frequent and localized, and post-disaster reconstruction efforts were initiated. By 8 September, the situation had largely stabilized, with disaster reports significantly reduced. Spatially, different regions experienced varying disaster types. Northern and southern mountainous areas (e.g., Luoyuan County, Lianjiang County, and Yongtai County) experienced more landslides, building damage, and traffic interruptions due to the complex topography and the potential for heavy rainfall to trigger landslides. In contrast, Fuzhou’s urban areas were primarily affected by flooding, trapped individuals, traffic control, and power outages. These urban areas, characterized by dense populations and infrastructure in low-lying areas, were particularly vulnerable to heavy rainfall.
By integrating real-time disaster data over time, using multimodal data processing and semantic segmentation techniques, the method accurately captured the changing patterns of disaster impact across time and space. This enables rapid formulation of rescue strategies, more efficient resource allocation, and a better understanding of disaster dynamics.

3.2. Impact Awareness

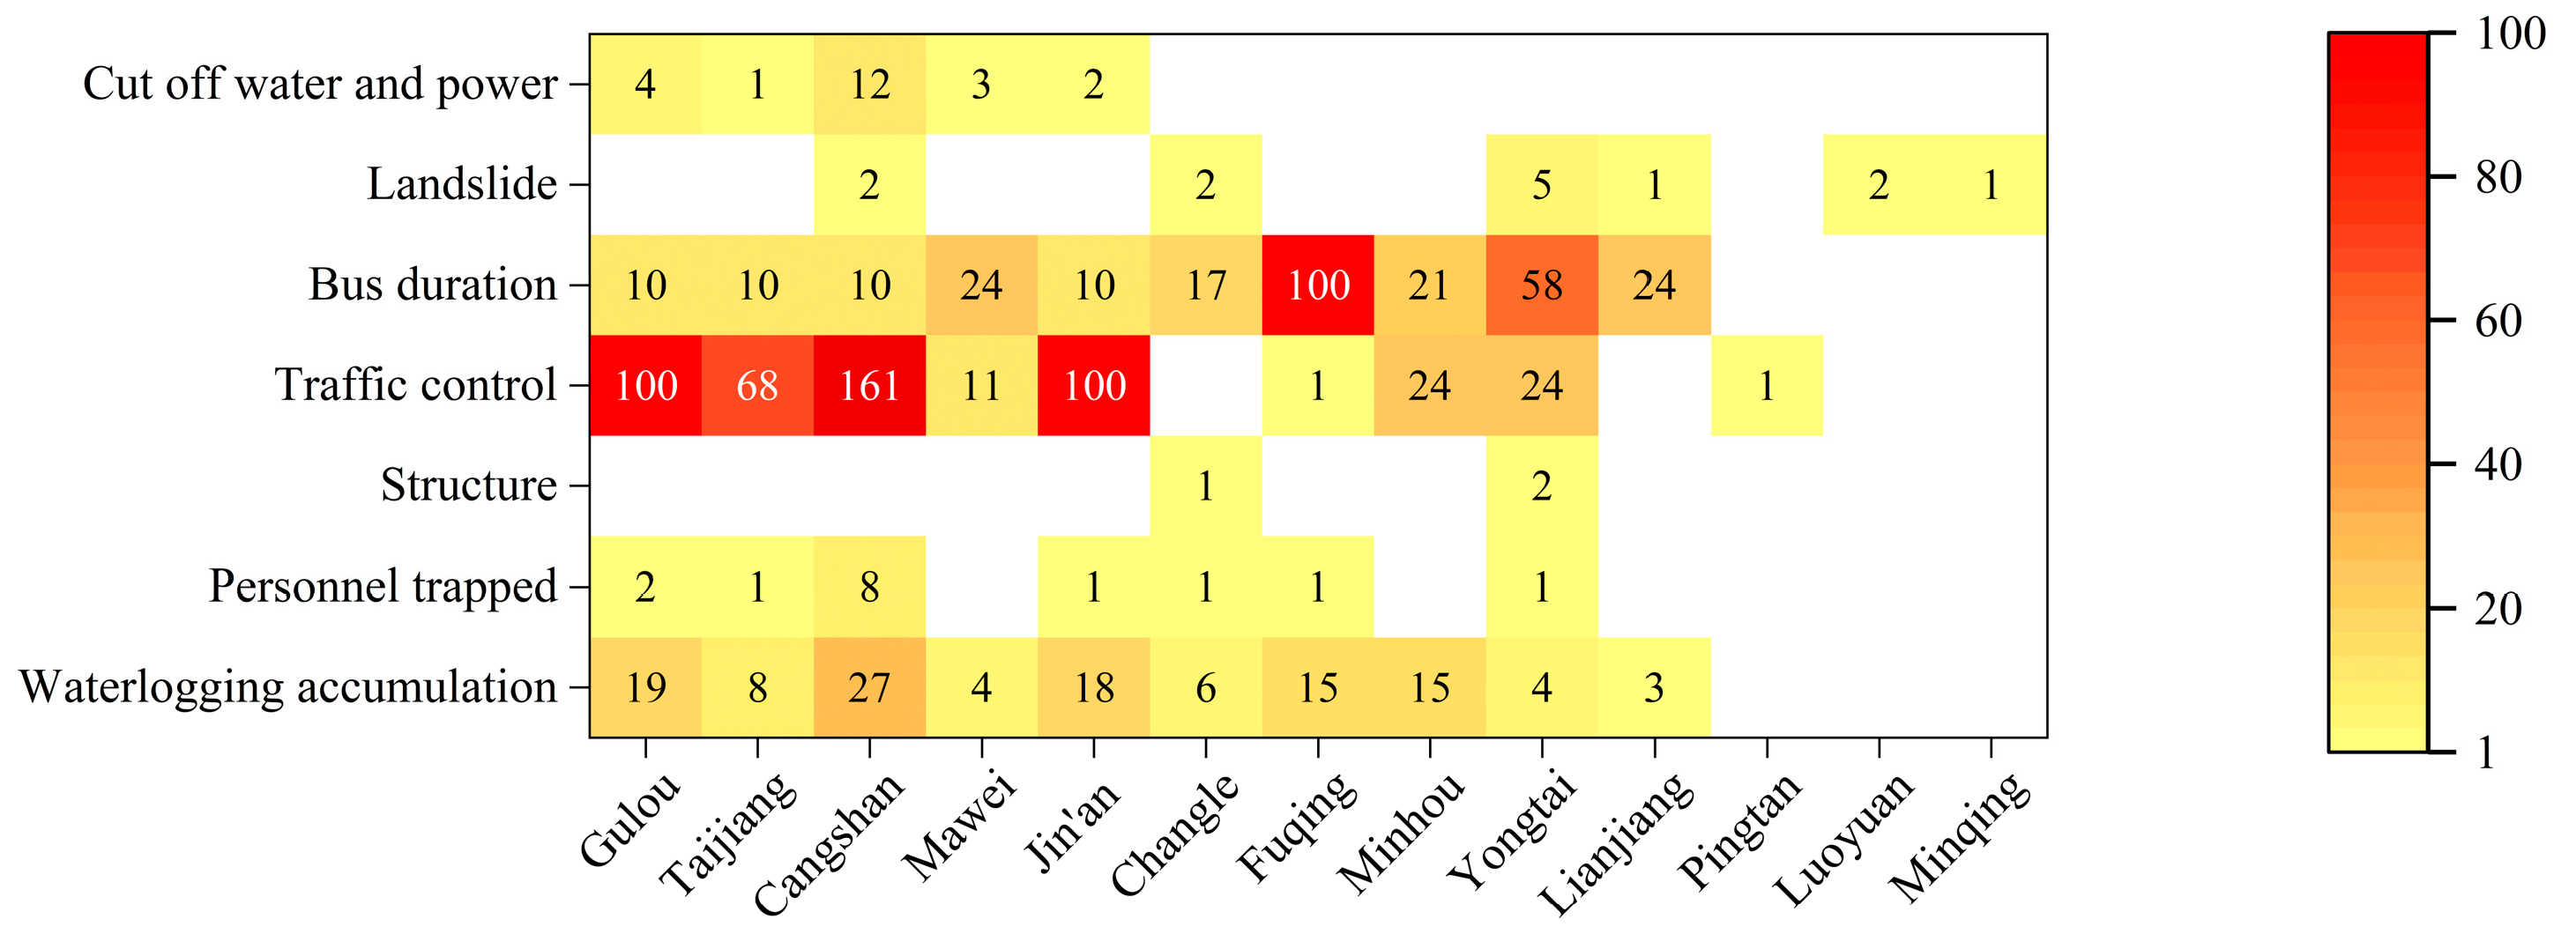
The matrix heat map Figure 9 represents the number of disaster points for different disaster categories across various districts and counties, with darker red indicating a higher number of points. As shown in the figure, the number of disaster points related to traffic control and public transportation suspension is particularly prominent in several districts, especially in Cangshan District and Taijiang District, where traffic control points reached 161 and public transportation suspension points reached 100.
The percentage stacked bar chart Figure 10 illustrates the distribution of disaster categories across various districts and counties. It reveals significant differences in the types of disasters between regions. For example, Gulou District is predominantly affected by traffic control, while Minhou County’s main disasters are landslides and water/power outages. Overall, traffic control and flooding account for a large proportion of disasters in most districts and counties, while landslides and building damage are relatively less common.

3.2.1. Social Impact

Flooding was the most reported disaster type on social media during Typhoon Haikui, with 119 posts containing specific location information. An hourly and daily analysis of flood reports was conducted and compared with precipitation data for the same periods.
As of 6 September, there were over 80 areas with flooding in urban districts, including 12 underpasses. The maximum road surface water depth reached 1.4 m, while the deepest underpass flooding approached 4 m. To date, 147 towns have been affected, with a total of 51,272 people impacted, including 36,026 who have been urgently relocated. There are 63 heavily-flooded residential communities, 44 underground parking garages that have been flooded, and 16 flooded urban villages. Additionally, 4194.65 hectares of farmland has been submerged, 170 roads and bridges have been damaged, 919 houses have been damaged, 67 houses have collapsed, 125 power lines have been affected, 85.4 km of communication lines have been damaged, and 21 communication base stations have been impacted. The direct economic losses are estimated at approximately CNY 552.1 million. Severe flooding occurred on several urban roads, with 81 identified flooded areas; by 5:00 p.m. on the 6th, 60 of these had been cleared, while work was underway to address the remaining 21.
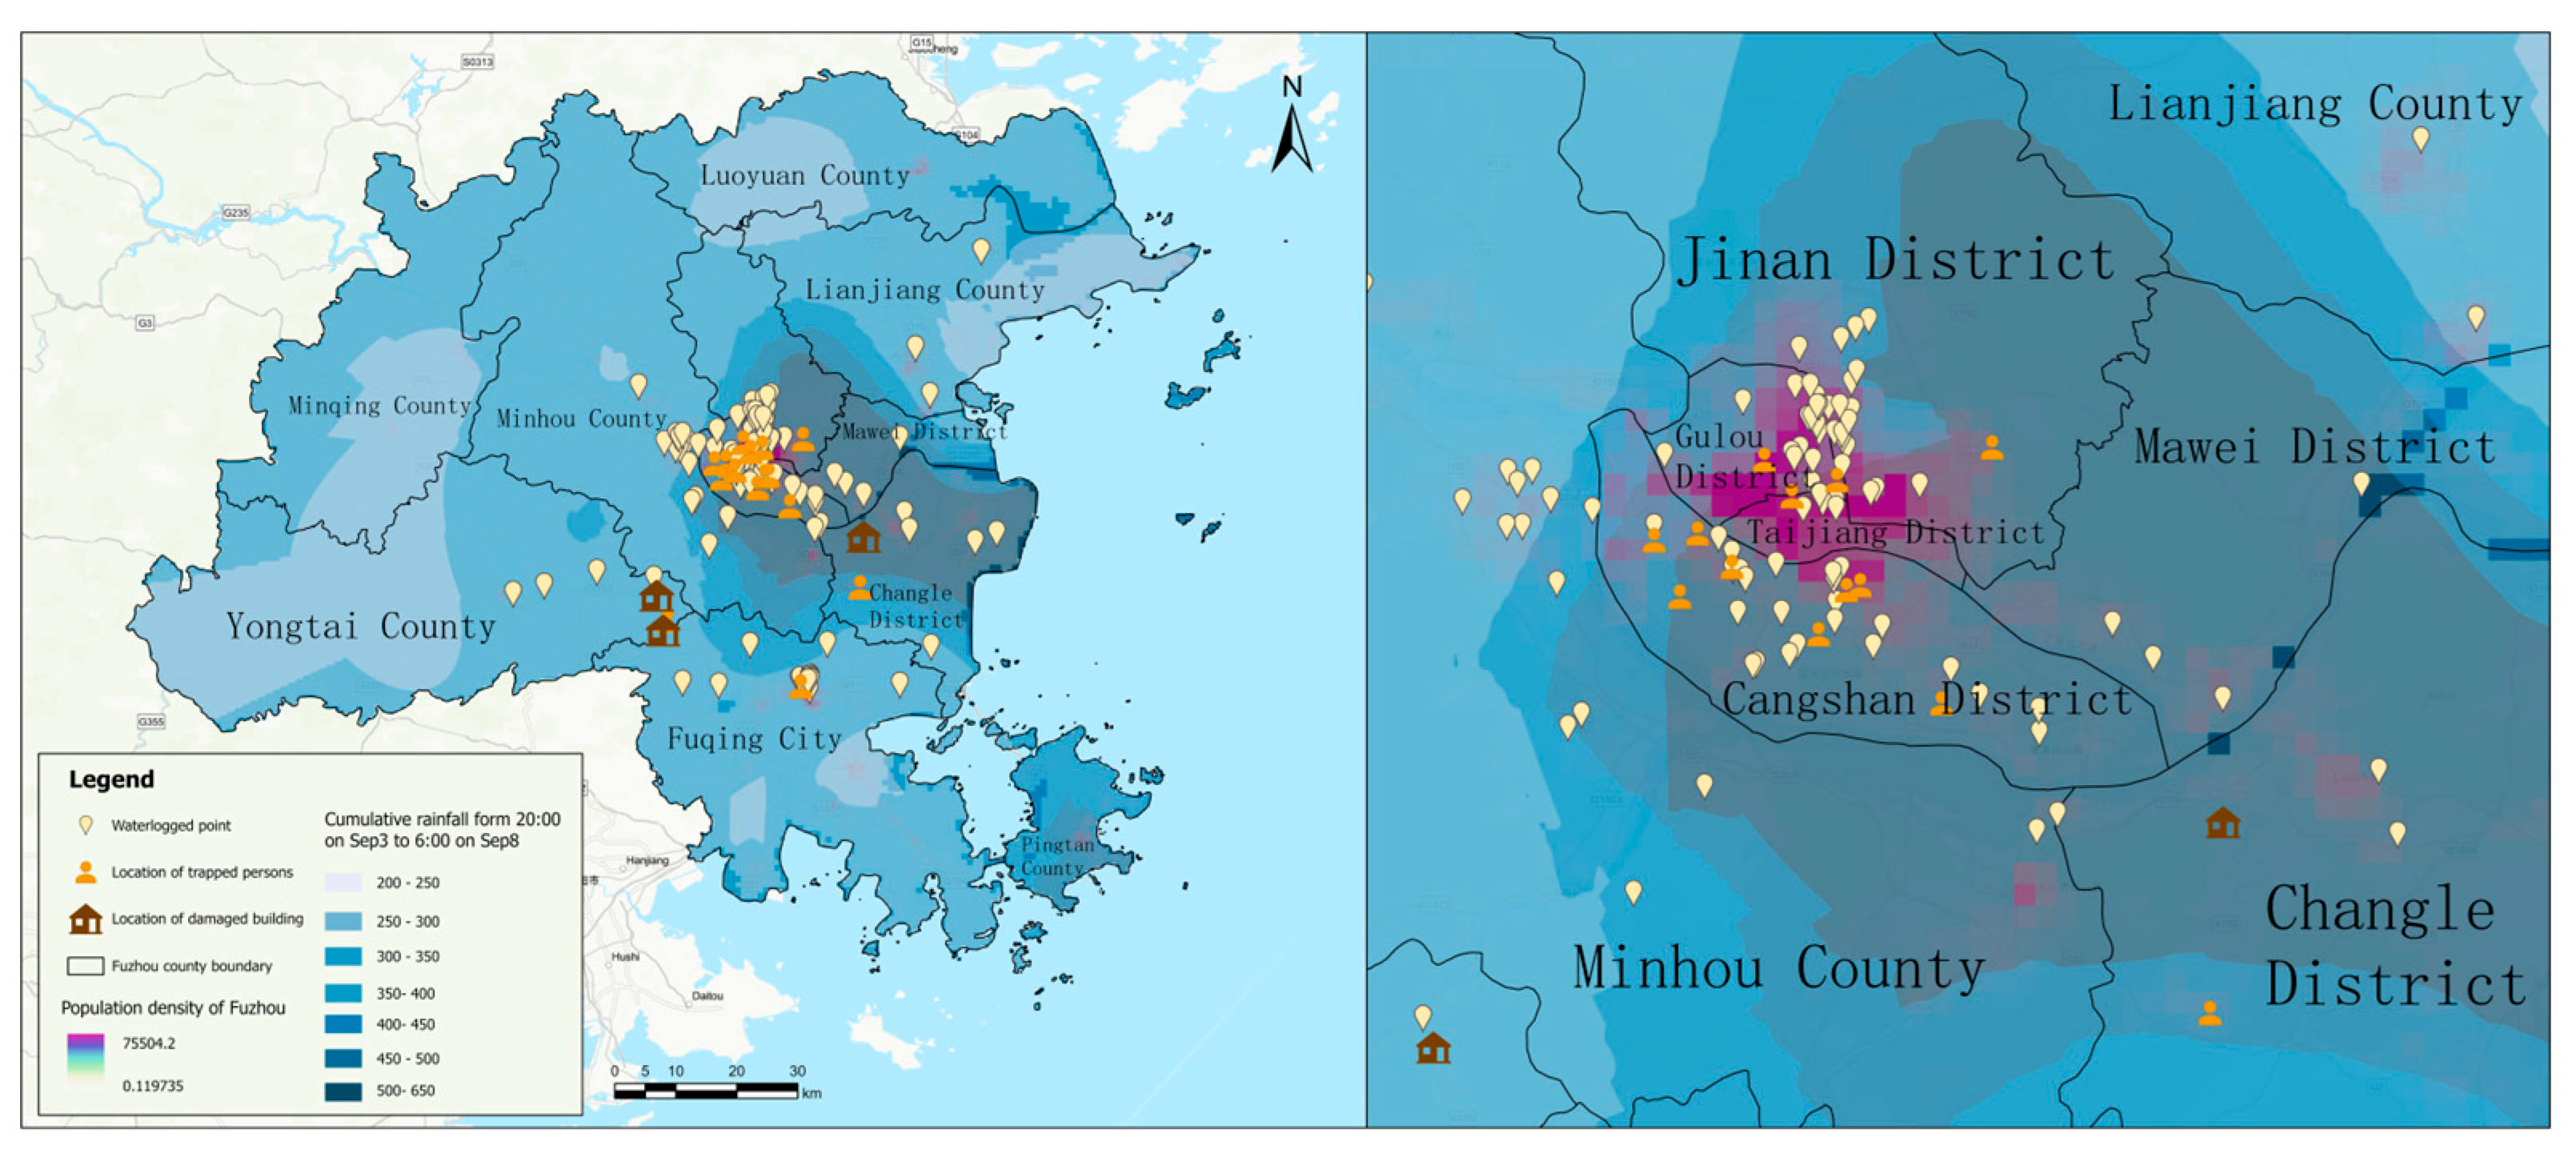
As shown in Figure 11, Flooding disaster points in Fuzhou are primarily concentrated in the city’s core districts, including Gulou District, Taijiang District, Jin’an District, Cangshan District, Mawei District, and Changle District. These urban core areas account for 68.91% of the total number of flooding disaster points. Fuzhou’s topography is characteristic of an estuarine basin, with mid- and low-altitude mountains in the west and alternating hills and plains in the east. Surface runoff primarily flows through the low-lying areas along the Minjiang River and its tributaries, where the city’s central districts are located. Therefore, the high concentration of flooding points in the lower-elevation central areas is reasonable. In this study, we conducted a spatial overlay analysis by combining the geographic location data of stranded individuals with Fuzhou’s population density data. The results showed that stranded individuals were mainly distributed in densely-populated areas, particularly in and around Taijiang District and Gulou District, exhibiting a clear spatial correlation. This finding highlights the relationship between the distribution of stranded individuals and residential patterns during disaster events, providing important insights for optimizing the allocation of rescue resources and improving the efficiency of emergency responses.

3.2.2. Traffic Impact

Through spatial visualization analysis of road closures mentioned in Weibo posts, the results are shown in Figure 12 that traffic control sections are primarily concentrated in Fuzhou’s core administrative areas, including Gulou District, Taijiang District, Jin’an District, Cangshan District, Mawei District, and Changle District. Further spatial statistical analysis revealed that 89.8% of the total traffic control sections are located in these core urban districts. This concentration suggests that the impact of the typhoon on roads is particularly significant in the city’s core areas, likely due to higher traffic density, denser populations, and more complex infrastructure, making these areas more susceptible to disruption from severe weather.
A quantitative analysis of Fuzhou’s public transportation system during the typhoon revealed its vulnerability. By analyzing the suspension durations of bus routes and using the mode to determine the most common suspension duration, we performed a regional classification based on the geographical distribution of Fuzhou’s county boundaries and created a map showing the distribution of bus suspension times. The results indicate that bus service suspension times within the central urban districts were relatively short, likely due to more robust infrastructure and faster deployment of emergency resources such as debris removal vehicles, repair teams, and emergency supplies, which are typically prioritized in central areas. Additionally, the heavy reliance on the bus system by central district residents made the restoration of bus services a top priority. In contrast, the bus suspension times in the peripheral counties around the central district generally lasted around 24 h. Notably, the suspension duration in Fuqing City was significantly higher than in other regions, peaking at 100 h, followed by Yongtai County with a suspension time of 58 h. Further analysis suggests that the prolonged suspension in Fuqing City was mainly due to persistent heavy rainfall in the area. These findings provide critical data support and decision-making references for managing public transportation and emergency responses during extreme weather events.
Fuzhou’s metro system experienced a city-wide service disruption from 6:30 a.m. to 12:00 p.m. on 6 September. Apart from this specific period, the main disruptions to metro operations were caused by flooding, which led to the temporary closure of some metro station entrances. Specifically, from noon on 6 September, the section of Line 1 between Chengmen and Sanjiangkou was suspended. After repairs and adjustments, this section resumed service at 6:30 a.m. on 8 September, restoring operations between Xiangfeng and Sanjiangkou. This suspended section is located in Cangshan District, which recorded the highest rainfall on 6 September, suggesting a direct correlation between rainfall and metro operation disruptions. Additionally, the temporarily closed metro station entrances showed significant spatial overlap with areas of severe flooding.
Furthermore, landslide disasters were mainly concentrated in the mountainous areas surrounding the central urban districts and along nearby roads. The majority of landslide points were located near major traffic routes, leading to traffic interruptions and frequent occurrences of washed-out roadbeds and culverts. These events severely impacted road capacity and posed significant threats to traffic safety in the affected areas.

3.2.3. Water and Electricity Impact

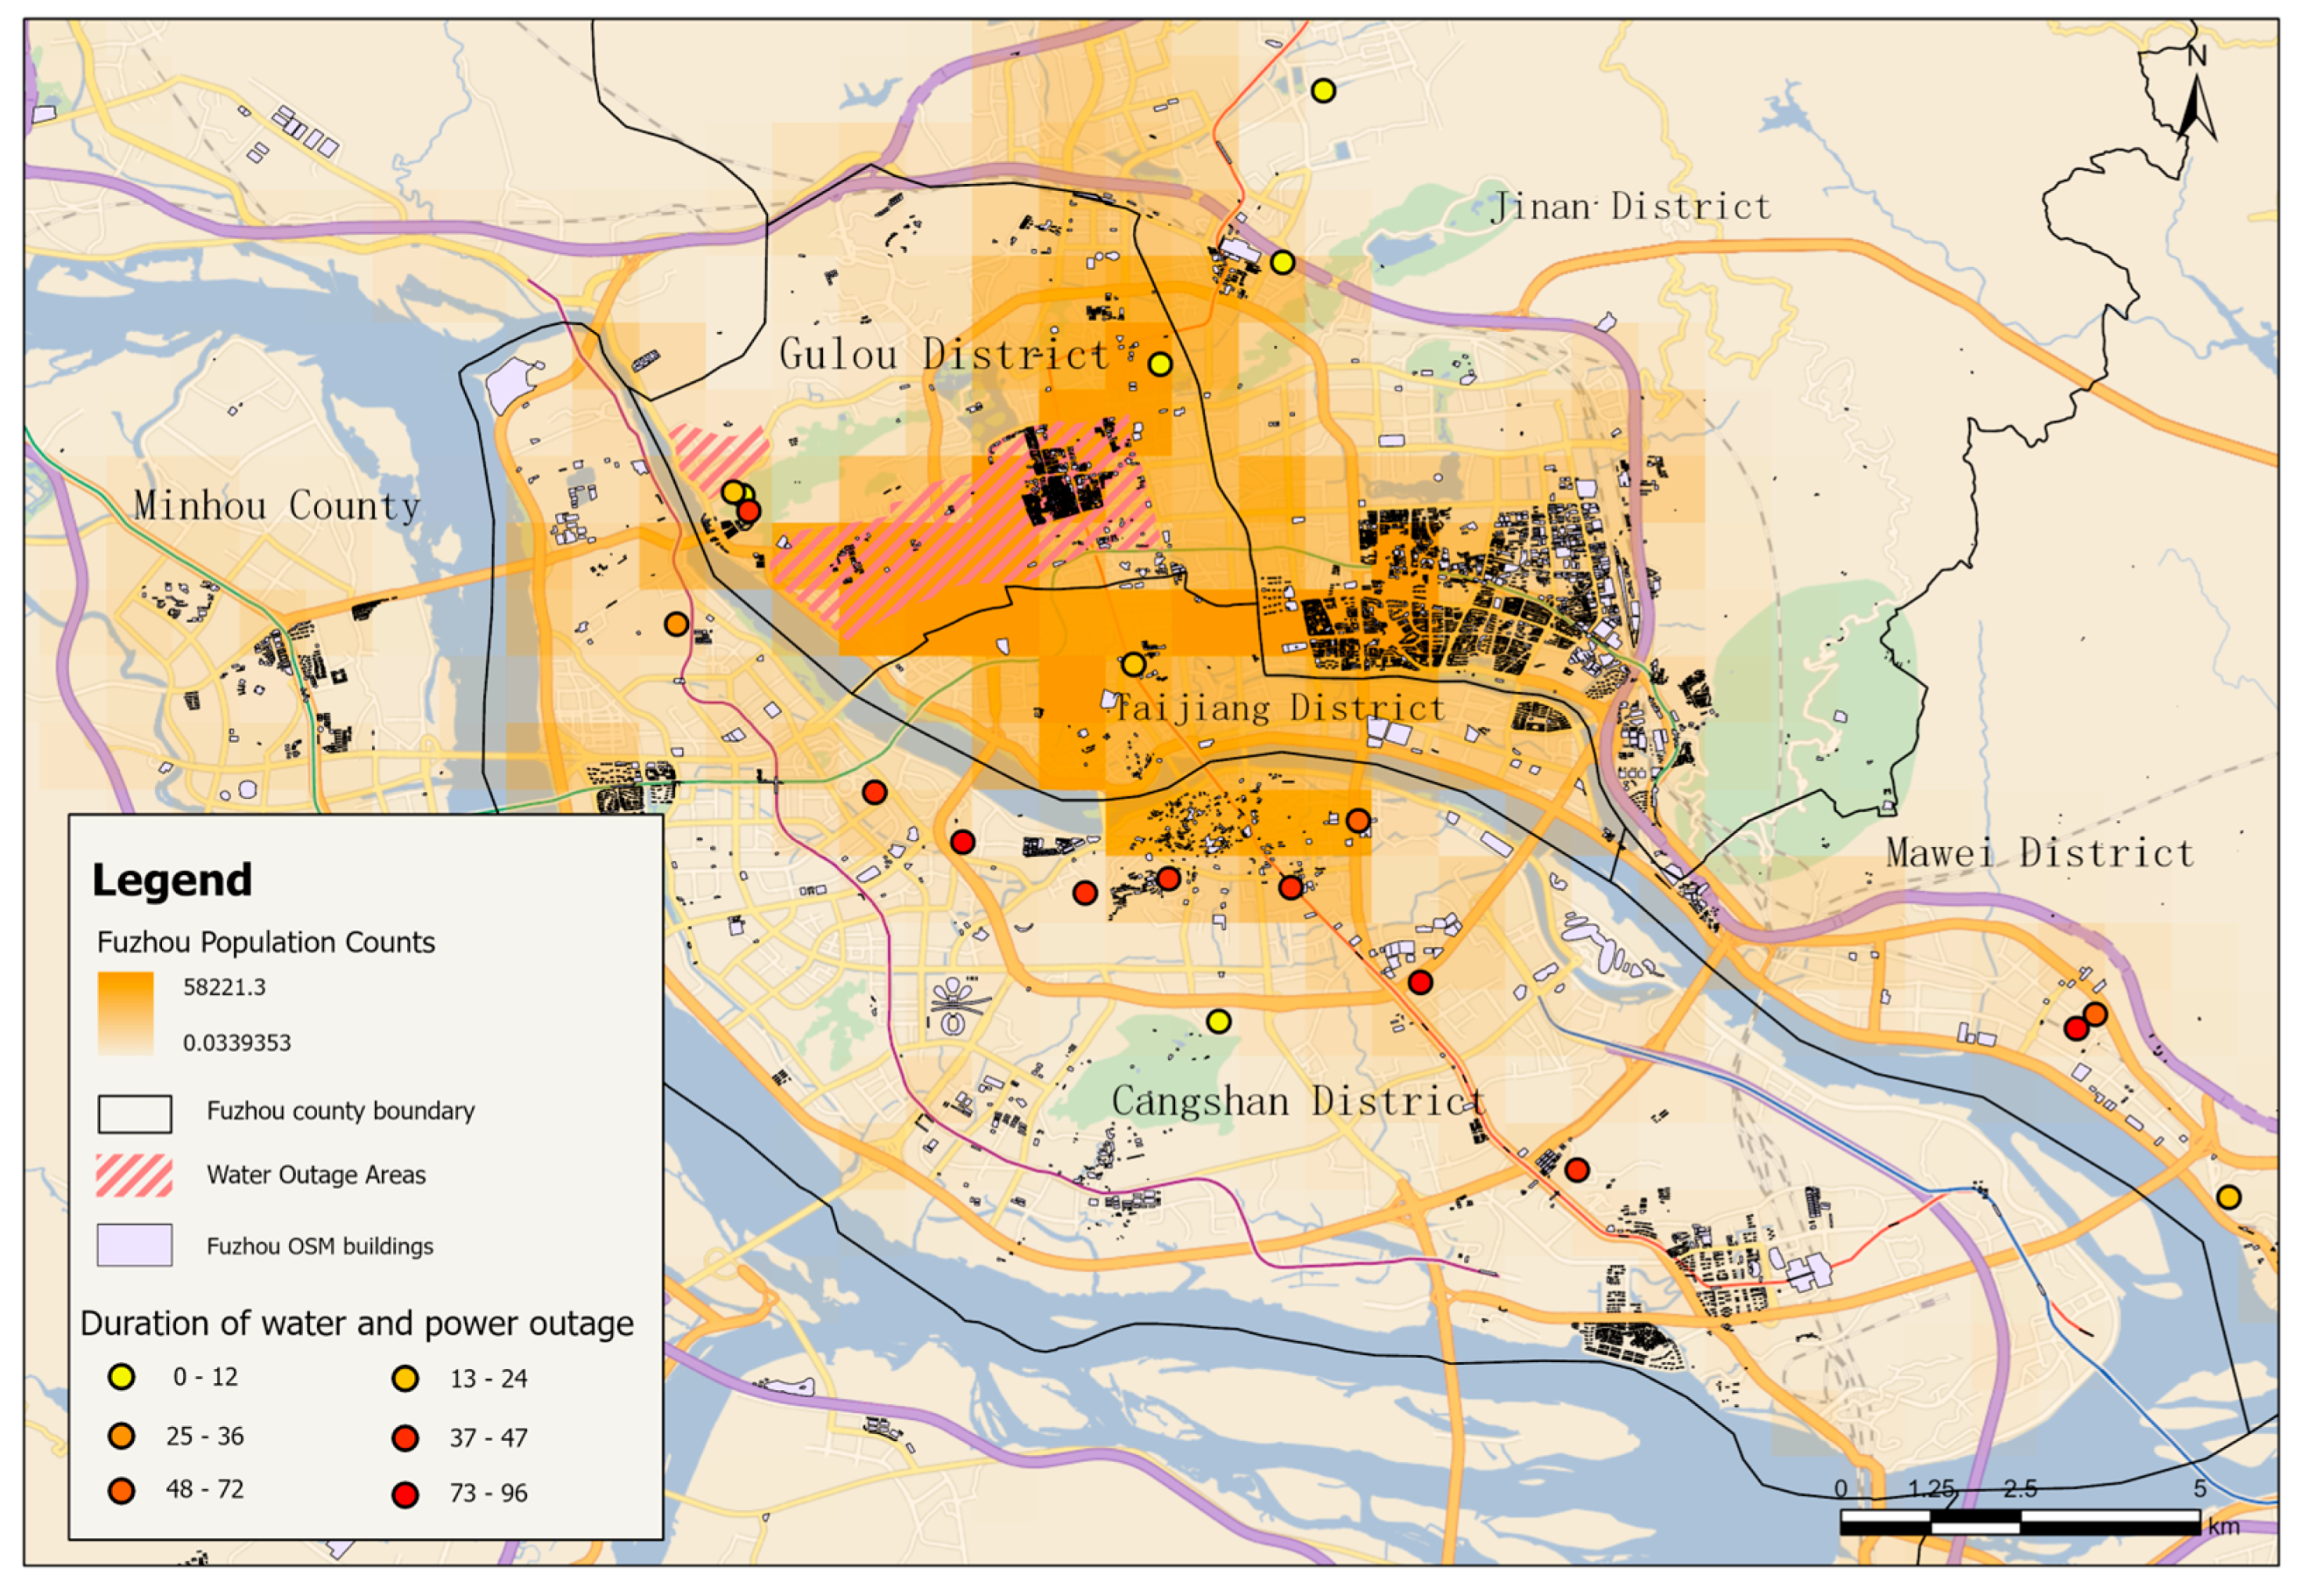
This study found a significant spatial correlation between water and power outages and geographic location. Analysis of Weibo data in Figure 13 shows that prolonged outages were primarily concentrated in the Cangshan District of Fuzhou, which may be related to the area’s weaker infrastructure capacity or lower elevation. Additionally, the spatial distribution of water outages was mainly concentrated in the Gulou District, indicating the vulnerability of the water supply system in this area when facing floods. Further spatial comparison analysis revealed a high degree of overlap between the locations of water and power outages and the areas that experienced the highest rainfall on 6 September. This suggests that rainfall distribution directly influenced the occurrence of these outages. This spatial consistency indicates that rainfall is likely a key factor contributing to the water and power outages in these areas, especially in Gulou and Cangshan Districts. These findings provide important spatial guidance for future urban flood control and disaster management. Strengthening infrastructure and emergency response plans in these high-risk areas could effectively reduce the impact of similar disasters on residents’ lives.

3.3. Spatial Heterogeneity and Attribution Analysis

By generating a 1000-row by 1000-column grid map and assigning weights to different types of disasters, the dominant disaster type in each grid cell can be calculated, allowing for single-category membership for each disaster type. From the disaster grid distribution map shown in Figure 14a, it is evident that the disaster points representing floods, shown in blue, are the most widespread, covering almost the entire study area, particularly in Fuzhou’s central urban district and surrounding areas. The second most prominent disaster type is traffic control, represented in yellow, concentrated mainly in and around Fuzhou’s central urban district. This indicates that the central urban area is the region most affected by disasters. Other types of disasters, such as stranded individuals, building damage, water and power outages, and landslides, are scattered, but their overall numbers are relatively small. This distribution reflects the severe impact of flooding on traffic and other infrastructure, especially in the urban center, where disaster distribution is more concentrated, possibly due to the area’s dense population and complex infrastructure.
A hotspot analysis was performed on the disaster grid map, resulting in a disaster hotspot map, as shown in Figure 14b. From the disaster hotspot map, we can observe that the overall confidence level of the disaster hotspots is high, showing strong spatial heterogeneity. The varying shades of red in the map represent different confidence levels for the hotspot areas, with dark red indicating 99% confidence, and orange representing 90% and 95% confidence levels. These hotspots are primarily concentrated in Fuzhou’s central urban district and surrounding areas, suggesting that this region is the most severely affected by the disasters. Additionally, the southern and southeastern regions also show some high-confidence hotspots, though they are fewer in number and lower in density. The heterogeneity in disaster distribution underscores the importance of allocating resources effectively. This distribution pattern reflects the concentration of disasters within Fuzhou, potentially linked to factors such as urbanization, population density, and infrastructure vulnerability. The concentration of hotspot areas suggests that these regions may require more emergency resources and stronger disaster response capabilities. Our findings indicate that, after a disaster, authorities should promptly monitor areas with concentrated disaster information on social media to facilitate rapid response.
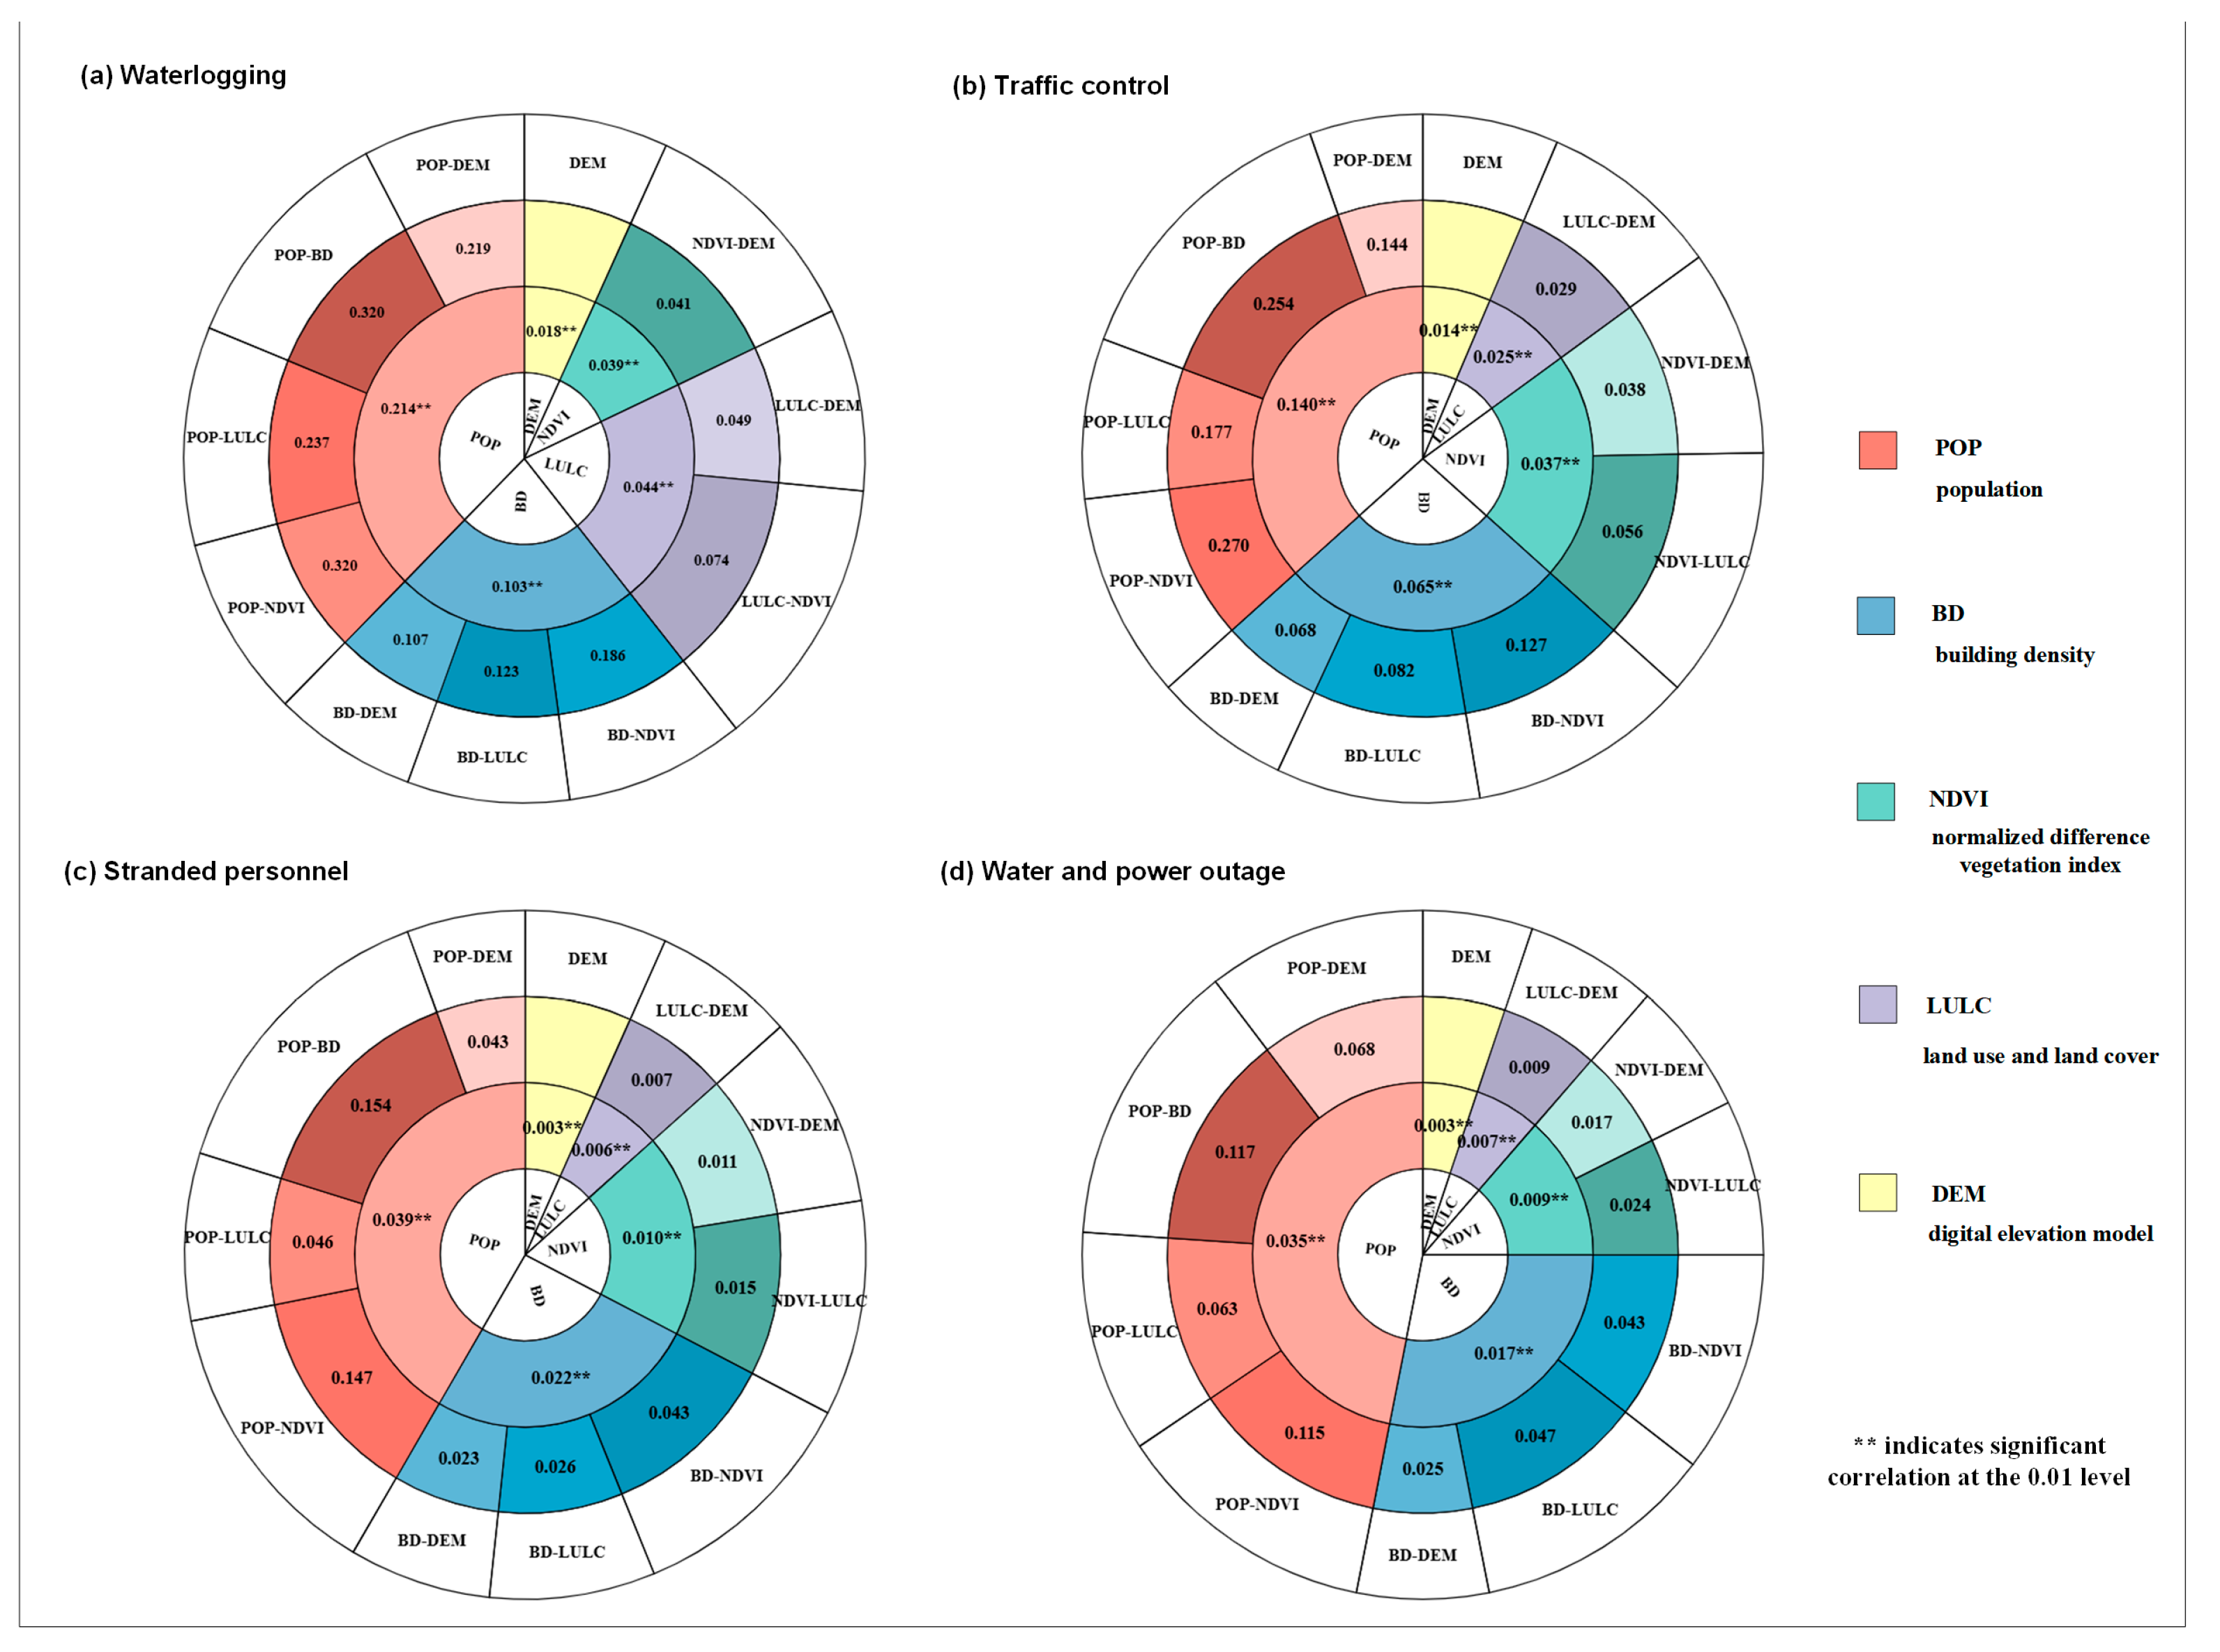
Figure 15 illustrates the explanatory power of driving factors for four types of disasters (urban flooding, traffic control, stranded individuals, and water/power outages) using Geodetector analysis. The study employed the natural breaks method to classify each factor. The inner ring of the diagram represents the explanatory power of single factors (population density, building density, NDVI, land cover, and DEM) for disaster events, while the outer ring shows the explanatory power of the interactions between these factors. The results indicate a significant positive correlation between the number of disaster points and the q-values from the Geodetector analysis, leading us to select the four disaster types with the most data points for further analysis. Urban flooding showed the highest q-value and interaction values, especially in the interaction between population density and other factors, demonstrating a notable two-factor enhancement effect. This suggests that the geographic distribution of urban flooding is influenced by a combination of multiple factors, with the interaction between population density and factors such as building density or land cover having a stronger explanatory power for flooding occurrences. Overall, population density emerged as the most significant factor across all four types of disasters, followed by building density. This analysis further underscores the critical role that the interaction of multiple geographic factors plays in the formation and development of disaster events.

4. Conclusions

4.1. Significance and Contributions

This study proposes an innovative framework for disaster situation awareness by integrating computer vision, natural language processing, and spatiotemporal analysis to identify disaster-related content from social media. By extracting multimodal information from social media, this approach facilitates the understanding of disaster evolution patterns. While textual data provide descriptions of disasters, images complement these by depicting the extent of damage, and the integration of both modalities enhances the efficiency of resource allocation. The effectiveness of this method was validated through a case study on the disaster situation awareness of Typhoon Haikui in Fuzhou, Fujian Province, from 3 September to 10 September 2023. The study conducted a detailed analysis of the temporal evolution of typhoon-related disasters and examined the inter-relations among different types of disasters from a holistic perspective. This provides valuable insights for predicting disaster developments and improving disaster prevention systems. Using the proposed disaster situation awareness method, 119 instances of waterlogging were extracted from social media data, significantly exceeding the 80 instances recorded in official data. Additionally, the disaster damage categories identified in this study include waterlogging, stranded individuals, building damage, vehicle inundation, traffic restrictions, landslides, fallen trees, suspension of public transportation, and power and water outages. These categories, while overlapping with official records, also provide significant complementary information. Moreover, the method in this paper can collect disaster information in near real-time and improve the timeliness of official disaster investigations. These validation results demonstrate the effectiveness and scientific contributions of this method. It not only extends the scope of official disaster data but also captures the diversity of disaster damage categories. This comprehensive information supports post-disaster emergency management and resource allocation, offering a more complete and nuanced understanding of disaster impacts.
Several important conclusions were drawn. First, social media offers a pathway to acquire near-real-time disaster information with fine-grained spatiotemporal resolution; time can be precise to the minute, and location can be detailed to roads, intersections, and points of interest (POI), providing specific disaster information. Second, social media multimodal data help reveal the overall process of disaster situational awareness, uncovering spatiotemporal patterns in disaster evolution. Lastly, in terms of heterogeneous driving factors, population density has the most significant explanatory power for the four types of disasters, followed by building density. The interaction of multiple geographic factors plays a key role in the formation and development of disasters.

4.2. Limitations and Future Research

Although this study proposes an effective framework for disaster situation awareness, several limitations remain. First, incomplete geographic coverage and network interruptions may lead to gaps in social perception information. Second, the limited spatial resolution of some images on social media may result in insufficient segmentation accuracy, affecting the precision of disaster damage classification. Furthermore, the diversity and inconsistency of textual descriptions could cause errors in disaster classification by natural language processing models. Lastly, while the geographical detector can analyze spatial heterogeneity, it is constrained by the number of input variables, potentially limiting its ability to uncover deeper spatiotemporal patterns.
To address these limitations, we propose the following improvements for future research: (1) Multi-source Data Integration: Supplement social media data by leveraging satellite remote sensing imagery, drone footage, or surveillance videos to obtain disaster information from network-disconnected areas. (2) Utilization of Indirect Information: Recognize that family members of stranded or missing individuals may share relevant personal information and locations via social media, or that affected individuals might post disaster information after relocating to safe areas. These indirect data sources could be used to infer disaster situations in network-disconnected regions. (3) Model Optimization: Future efforts could focus on enhancing models by integrating network traffic monitoring and disconnection detection technologies to identify potential information gaps and prioritize these areas for analysis, thereby improving the comprehensiveness and accuracy of disaster assessment. (4) Enhancement of Training Data and Algorithms: Refine the training datasets and algorithms for models such as Deeplab v3+ and ERNIE to better handle various disaster scenarios, thereby improving their generalization ability and robustness. (5) Integration of Additional Spatial Analysis Tools: Employ advanced spatial analysis techniques, such as geographically-weighted regression, to delve deeper into the geographical factors influencing disaster progression, uncovering more complex characteristics of spatial heterogeneity.

Author Contributions

Conceptualization, S.G. and T.Y.; methodology, Y.X. and N.M.; software, Y.X. and X.W.; validation, Y.X. and X.W.; formal analysis, T.Y. and Y.X.; investigation, Y.X. and H.H.; resources, S.G; data curation, Y.X.; writing—original draft preparation, Y.X. and T.Y.; writing—review and editing, S.G. and N.M.; visualization, Y.X. and H.H.; supervision, T.Y. and N.M.; project administration, T.Y.; funding acquisition, S.G. and N.M. All authors have read and agreed to the published version of the manuscript.

Funding

The second batch of “Fourteenth Five-Year Plan” teaching materials for general higher education in Henan Province, China: Principles and Applications of Geographic Information System (Third Edition).

Institutional Review Board Statement

Not applicable.

Informed Consent Statement

Not applicable.

Data Availability Statement

The original data presented in this study are openly available. The URLs are referred to in the main text.

Conflicts of Interest

The authors declare no conflicts of interest.

References

  1. Cheng, C.; Pei, T.; Liu, Y. Practice and Method Exploration of Natural Disaster Situation Awareness in the New Era. Acta Geogr. Sin. 2023, 78, 548–557. [Google Scholar]
  2. Goodchild, M.F. Citizens as Sensors: The World of Volunteered Geography. GeoJournal 2007, 69, 211–221. [Google Scholar] [CrossRef]
  3. Tzavella, K.; Fekete, A.; Friedrich, F. Opportunities Provided by Geographic Information Systems and Volunteered Geographic Information for a Timely Emergency Response during Flood Events in Cologne, Germany. Nat. Hazards 2018, 91, 29–57. [Google Scholar] [CrossRef]
  4. Yan, Z.; Guo, X.; Zhao, Z.; Tang, L. Achieving Fine-Grained Urban Flood Perception and Spatio-Temporal Evolution Analysis Based on Social Media. Sustain. Cities Soc. 2024, 101, 105077. [Google Scholar] [CrossRef]
  5. Lin, L.; Tang, C.; Liang, Q.; Wu, Z.; Wang, X.; Zhao, S. Rapid Urban Flood Risk Mapping for Data-Scarce Environments Using Social Sensing and Region-Stable Deep Neural Network. J. Hydrol. 2023, 617, 128758. [Google Scholar] [CrossRef]
  6. Rajput, A.A.; Li, Q.; Zhang, C.; Mostafavi, A. Temporal Network Analysis of Inter-Organizational Communications on Social Media during Disasters: A Study of Hurricane Harvey in Houston. Int. J. Disaster Risk Reduct. 2020, 46, 101622. [Google Scholar] [CrossRef]
  7. Feng, Y.; Huang, X.; Sester, M. Extraction and Analysis of Natural Disaster-Related VGI from Social Media: Review, Opportunities and Challenges. Int. J. Geogr. Inf. Sci. 2022, 36, 1275–1316. [Google Scholar] [CrossRef]
  8. Wu, K.; Wu, J.; Ye, M. Application of Social Media Data in Natural Disaster Emergency Management: A Review. Prog. Geogr. 2020, 39, 1412–1422. [Google Scholar] [CrossRef]
  9. Daly, S.; Thom, J.A. Mining and Classifying Image Posts on Social Media to Analyse Fires. In Proceedings of the ISCRAM 2016 Conference, Rio de Janeiro, Brazil, 22–25 May 2016; pp. 1–14. [Google Scholar]
  10. Sit, M.A.; Koylu, C.; Demir, I. Identifying Disaster-Related Tweets and Their Semantic, Spatial and Temporal Context Using Deep Learning, Natural Language Processing and Spatial Analysis: A Case Study of Hurricane Irma. In Social Sensing and Big Data Computing for Disaster Management; Routledge: London, UK, 2020; pp. 8–32. [Google Scholar]
  11. Wu, D.; Cui, Y. Disaster Early Warning and Damage Assessment Analysis Using Social Media Data and Geo-Location Information. Decis. Support Syst. 2018, 111, 48–59. [Google Scholar] [CrossRef]
  12. Wang, R.-Q.; Mao, H.; Wang, Y.; Rae, C.; Shaw, W. Hyper-Resolution Monitoring of Urban Flooding with Social Media and Crowdsourcing Data. Comput. Geosci. 2018, 111, 139–147. [Google Scholar] [CrossRef]
  13. Alam, F.; Sajjad, H.; Imran, M.; Ofli, F. CrisisBench: Benchmarking Crisis-Related Social Media Datasets for Humanitarian Information Processing. arXiv 2021, arXiv:2004.06774. [Google Scholar] [CrossRef]
  14. Wang, Y.; Ruan, S.; Wang, T.; Qiao, M. Rapid Estimation of an Earthquake Impact Area Using a Spatial Logistic Growth Model Based on Social Media Data. In Social Sensing and Big Data Computing for Disaster Management; Routledge: London, UK, 2020; pp. 68–87. [Google Scholar]
  15. Yang, T.; Xie, J.; Li, G.; Mou, N.; Li, Z.; Tian, C.; Zhao, J. Social Media Big Data Mining and Spatio-Temporal Analysis on Public Emotions for Disaster Mitigation. ISPRS Int. J. Geo-Inf. 2019, 8, 29. [Google Scholar] [CrossRef]
  16. Murthy, D.; Longwell, S.A. Twitter and Disasters: The Uses of Twitter during the 2010 Pakistan Floods. Inf. Commun. Soc. 2013, 16, 837–855. [Google Scholar] [CrossRef]
  17. Xiao, Y.; Li, B.; Gong, Z. Real-Time Identification of Urban Rainstorm Waterlogging Disasters Based on Weibo Big Data. Nat. Hazards 2018, 94, 833–842. [Google Scholar] [CrossRef]
  18. Mikolov, T. Efficient Estimation of Word Representations in Vector Space. arXiv 2013, arXiv:1301.3781. [Google Scholar]
  19. Huang, X.; Li, Z.; Wang, C.; Ning, H. Identifying Disaster Related Social Media for Rapid Response: A Visual-Textual Fused CNN Architecture. Int. J. Digit. Earth 2020, 13, 1017–1039. [Google Scholar] [CrossRef]
  20. Mao, H.; Thakur, G.; Sparks, K.; Sanyal, J.; Bhaduri, B. Mapping Near-Real-Time Power Outages from Social Media. In Social Sensing and Big Data Computing for Disaster Management; Routledge: London, UK, 2020; pp. 88–102. [Google Scholar]
  21. Jain, P.; Ross, R.; Schoen-Phelan, B. Estimating Distributed Representation Performance in Disaster-Related Social Media Classification. In Proceedings of the 2019 IEEE/ACM International Conference on Advances in Social Networks Analysis and Mining (ASONAM), Vancouver, BC, Canada, 27–30 August 2019; pp. 723–727. [Google Scholar]
  22. Jing, M.; Scotney, B.W.; Coleman, S.A.; McGinnity, M.T. The Application of Social Media Image Analysis to an Emergency Management System. In Proceedings of the IEEE 11th International Conference on Availability, Reliability and Security (ARES), Salzburg, Austria, 31 August–2 September 2016; pp. 805–810. [Google Scholar]
  23. Ahmad, S.; Ahmad, K.; Ahmad, N.; Conci, N. Convolutional Neural Networks for Disaster Images Retrieval. In Proceedings of the MediaEval 2017 Workshop, Dublin, Ireland, 13–15 September 2017. [Google Scholar]
  24. Ofli, F.; Alam, F.; Imran, M. Analysis of Social Media Data Using Multimodal Deep Learning for Disaster Response. arXiv 2020, arXiv:2004.11838. [Google Scholar]
  25. Ahmad, Z.; Jindal, R.; Mukuntha, N.; Ekbal, A.; Bhattacharyya, P. Multi-Modality Helps in Crisis Management: An Attention-Based Deep Learning Approach of Leveraging Text for Image Classification. Expert Syst. Appl. 2022, 195, 116626. [Google Scholar] [CrossRef]
  26. Wu, Y.; Chen, Y.; Zhang, R.; Cui, Z.; Liu, X.; Zhang, J.; Wang, M.; Wu, Y. A Spatial Information Extraction Method Based on Multi-Modal Social Media Data: A Case Study on Urban Inundation. ISPRS Int. J. Geo-Inf. 2023, 12, 368. [Google Scholar] [CrossRef]
  27. Lue, E.; Wilson, J.P.; Curtis, A. Conducting Disaster Damage Assessments with Spatial Video, Experts, and Citizens. Appl. Geogr. 2014, 52, 46–54. [Google Scholar] [CrossRef]
  28. Alam, F.; Ofli, F.; Imran, M. Descriptive and Visual Summaries of Disaster Events Using Artificial Intelligence Techniques: Case Studies of Hurricanes Harvey, Irma, and Maria. Behav. Inf. Technol. 2020, 39, 288–318. [Google Scholar] [CrossRef]
  29. Nguyen, D.T.; Ofli, F.; Imran, M.; Mitra, P. Damage Assessment from Social Media Imagery Data during Disasters. In Proceedings of the 2017 IEEE/ACM International Conference on Advances in Social Networks Analysis and Mining (ASONAM), Sydney, NSW, Australia, 31 July–3 August 2017; pp. 569–576. [Google Scholar]
  30. Mouzannar, H.; Rizk, Y.; Awad, M. Damage Identification in Social Media Posts Using Multimodal Deep Learning. In Proceedings of the 15th International Conference on Information Systems for Crisis Response and Management, Rochester, NY, USA, 20–23 May 2018. [Google Scholar]
  31. Imran, M.; Alam, F.; Qazi, U.; Peterson, S.; Ofli, F. Rapid Damage Assessment Using Social Media Images by Combining Human and Machine Intelligence. arXiv 2020, arXiv:2004.06675. [Google Scholar]
  32. Dou, M.; Wang, Y.; Gu, Y.; Dong, S.; Qiao, M.; Deng, Y. Disaster Damage Assessment Based on Fine-Grained Topics in Social Media. Comput. Geosci. 2021, 156, 104893. [Google Scholar] [CrossRef]
  33. Chen, Z.; Lim, S. Social Media Data-Based Typhoon Disaster Assessment. Int. J. Disaster Risk Reduct. 2021, 64, 102482. [Google Scholar] [CrossRef]
  34. Li, S.; Wang, Y.; Huang, H.; Huang, L.; Chen, Y. Study on Typhoon Disaster Assessment by Mining Data from Social Media Based on Artificial Neural Network. Nat. Hazards 2023, 116, 2069–2089. [Google Scholar] [CrossRef]
  35. Malik, M.; Lamba, H.; Nakos, C.; Pfeffer, J. Population Bias in Geotagged Tweets. In Standards and Practices in Large-Scale Social Media Research; Technical Report WS-15-18; AAAI Press: Washington, DC, USA, 2015; Volume 9, pp. 18–27. [Google Scholar]
  36. Chae, J.; Thom, D.; Jang, Y.; Kim, S.; Ertl, T.; Ebert, D.S. Public Behavior Response Analysis in Disaster Events Utilizing Visual Analytics of Microblog Data. Comput. Graph. 2014, 38, 51–60. [Google Scholar] [CrossRef]
  37. Bakillah, M.; Li, R.-Y.; Liang, S.H. Geo-Located Community Detection in Twitter with Enhanced Fast-Greedy Optimization of Modularity: The Case Study of Typhoon Haiyan. Int. J. Geogr. Inf. Sci. 2015, 29, 258–279. [Google Scholar] [CrossRef]
  38. Liang, C.; Lin, G.; Zhang, M.; Wang, W.; Zhang, W.; Lin, J.; Deng, C. A Study on the Effectiveness of Social Media Data in Reflecting the Spatial and Temporal Distribution of Typhoon Disasters. J. Geo-Inf. Sci. 2018, 20, 807–816. [Google Scholar]
  39. Alam, F.; Ofli, F.; Imran, M.; Alam, T.; Qazi, U. Deep Learning Benchmarks and Datasets for Social Media Image Classification for Disaster Response. In Proceedings of the 2020 IEEE/ACM International Conference on Advances in Social Networks Analysis and Mining (ASONAM), Hague, The Netherlands, 7–10 December 2020; pp. 151–158. [Google Scholar]
  40. Kersten, J.; Klan, F. What Happens Where during Disasters? A Workflow for the Multifaceted Characterization of Crisis Events Based on Twitter Data. J. Contingencies Crisis Manag. 2020, 28, 262–280. [Google Scholar] [CrossRef]
  41. Zhang, Q.; Xie, J.; Liu, Z.; Yang, T.; Li, Z. Hainan Wind Disaster Monitoring Dataset Based on Social Media. China Sci. Data 2019, 4. [Google Scholar]
  42. China Meteorological Administration. QX/T 531-2019 Technical Specification for Meteorological Disaster Investigation Meteorological Disaster Information Collection; China Meteorological Press: Beijing, China, 2019. [Google Scholar]
  43. Howard, A.; Sandler, M.; Chu, G.; Chen, L.; Chen, B.; Tan, M.; Wang, W.; Zhu, Y.; Pang, R.; Vasudevan, V.; et al. Searching for MobileNetV3; IEEE: Piscataway, NJ, USA, 2019; pp. 1314–1324. [Google Scholar]
  44. Chen, L.; Zhu, Y.; Papandreou, G.; Schroff, F.; Adam, H. Encoder-Decoder with Atrous Separable Convolution for Semantic Image Segmentation; Ferrari, V., Hebert, M., Sminchisescu, C., Weiss, Y., Eds.; Springer: Berlin/Heidelberg, Germany, 2018; Volume 11211, pp. 833–851. [Google Scholar]
  45. Sun, Y.; Wang, S.; Feng, S.; Ding, S.; Pang, C.; Shang, J.; Liu, J.; Chen, X.; Zhao, Y.; Lu, Y.; et al. ERNIE 3.0: Large-Scale Knowledge Enhanced Pre-Training for Language Understanding and Generation. arXiv 2021, arXiv:2107.02137. [Google Scholar]
  46. Wang, J.; Xu, C. Geodetector: Principle and prospective. Acta Geogr. Sin. 2017, 72, 116–134. [Google Scholar]
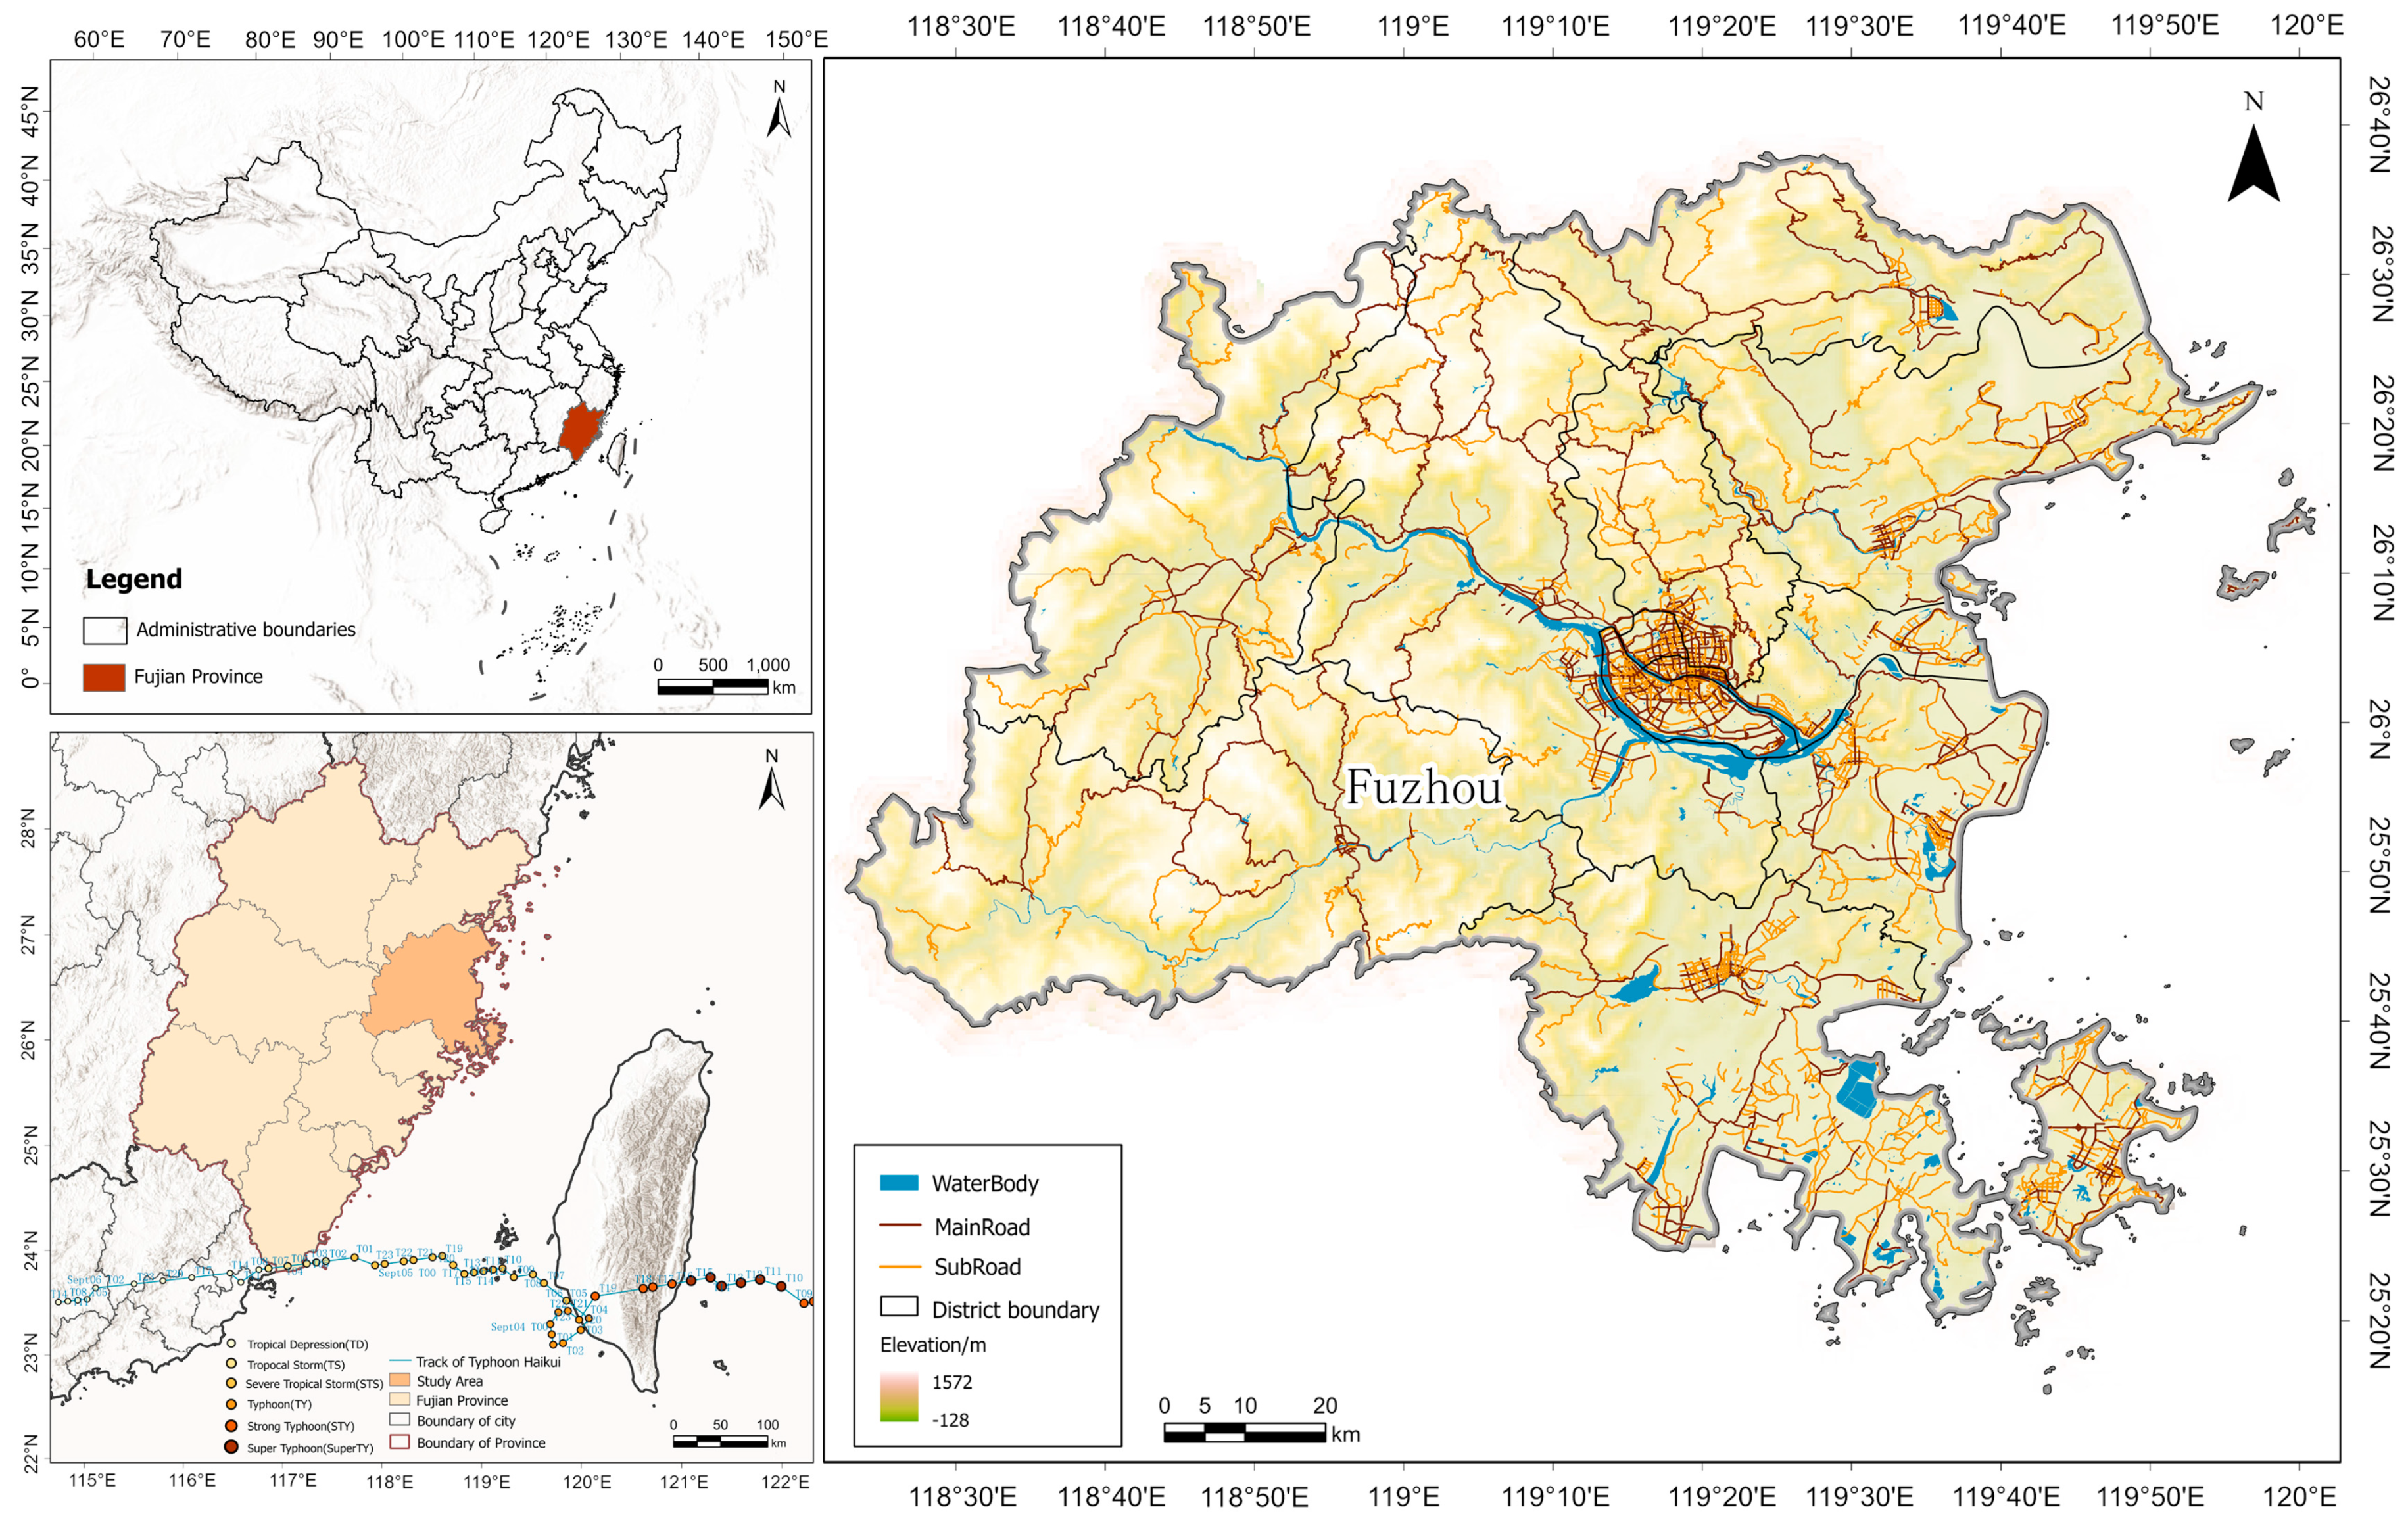
Figure 1. Regional and local overview of the study area.
Applsci 15 00465 g001
Figure 2. The structure of the proposed framework.
Applsci 15 00465 g002
Figure 3. Disaster classification.
Applsci 15 00465 g003
Figure 4. Example of disaster classification of Weibo multimodal data.
Applsci 15 00465 g004
Figure 5. Time–series distribution of Weibo data. (a) A graph of daily quantities during Typhoon; (b) Three-dimensional spatial distribution map during typhoon.
Applsci 15 00465 g005
Figure 6. Network structure of the MobileNetV3 model.
Applsci 15 00465 g006
Figure 7. Network structure of Deeplabv3+ model.
Applsci 15 00465 g007
Figure 8. Distribution map of spatial and temporal situational awareness of disaster situation.
Applsci 15 00465 g008aApplsci 15 00465 g008b
Figure 9. Disaster quantity matrix heat map of districts and counties.
Applsci 15 00465 g009
Figure 10. Stacked bar chart of disaster category percentage by district and county.
Applsci 15 00465 g010
Figure 11. Total social impact map.
Applsci 15 00465 g011
Figure 12. Total traffic impact map.
Applsci 15 00465 g012
Figure 13. Total water and electricity impact map.
Applsci 15 00465 g013
Figure 14. Disaster fishing net map. (a) Fishing net map of the distribution of disaster; (b) Fishing net map of disaster hotspot.
Applsci 15 00465 g014
Figure 15. Disaster driving factor rising sun map.
Applsci 15 00465 g015
Table 1. Weibo multimodal data.
DataDataset CategoryData sources
Disaster damage
correlation image data
Train and test dataset⟪Typhoon disaster monitoring dataset in Hainan based on social media⟫ [41]
Validation datasetWeibo images during Typhoon Haikui
Disaster Segmentation Image DataTrain and test datasetScreening and Annotation of Deep Learning Benchmarks and Datasets for Social Media Image
Classification for Disaster Response [39] and Weibo Images Related to Disaster Damage in Typhoon Siempa 2022
Validation datasetImages of damage during Typhoon Haikui
Text dataValidation datasetTexts corresponding to images during Typhoon Haikui 2023
Table 2. Basic geographic data.
Typhoon dataFrom the typhoon website of the National Meteorological Center, including the start and end time, latitude and longitude, typhoon grade, wind speed, pressure, moving direction, and moving speed of Typhoon Haikui No. 11 in 2023
Cumulative rainfall dataSourced from Weibo images, kriging interpolation of rainfall fields after geocoding of observation stations
Road dataOpenstreetMap website
Bus and subway dataUse the Python package TransBigData to obtain traffic space-time big data
Disclaimer/Publisher’s Note: The statements, opinions and data contained in all publications are solely those of the individual author(s) and contributor(s) and not of MDPI and/or the editor(s). MDPI and/or the editor(s) disclaim responsibility for any injury to people or property resulting from any ideas, methods, instructions or products referred to in the content.