Article

Climate Variability and Adaptation Strategies in a Pastoralist Area of the Eastern Bale Zone: The Case of Sawena District, Ethiopia

by
Mesfin Bekele Gebbisa
1,2 and
Zsuzsanna Bacsi
3,*
1
Doctoral School of Economics and Regional Sciences, The Hungarian University of Agriculture and Life Sciences, 2100 Godollo, Hungary
2
Department of Economics, School of Business and Economics, Madda Walabu University, Bale-Robe 243, Ethiopia
3
Institute of Agricultural and Food Economics, The Hungarian University of Agriculture and Life Sciences, Georgikon Campus, 8360 Keszthely, Hungary
*
Author to whom correspondence should be addressed.
Appl. Sci. 2025, 15(1), 69; https://doi.org/10.3390/app15010069
Submission received: 14 November 2024 / Revised: 23 December 2024 / Accepted: 24 December 2024 / Published: 25 December 2024
(This article belongs to the Special Issue Potential Impacts and Risks of Climate Change on Agriculture)

Abstract

:
This study was conducted in Sawena district, located in the Eastern Bale Zone of Ethiopia, with the aim of analyzing climate variability and identifying adaptation strategies. Secondary data covering the period from 1984 to 2023 were utilized, along with structured and unstructured questionnaires. Primary data were gathered from 350 pastoralist households across six kebeles through a household survey. This study used the Mann–Kendall test, Sen’s slope estimator, the coefficient of variation, descriptive statistics, and a multivariate probit model to analyze climate variability and adaptation strategies. The Mann–Kendall test, Sen’s slope estimator, and coefficient of variation analysis results showed significant rainfall increases in September, October, and November, with high winter variability and an upward autumn trend. Temperature analysis revealed consistent warming, with the greatest increases in September (0.049 °C/year) and summer (0.038 °C/year), and an annual mean rise of 0.034 °C per year, indicating climate shifts affecting pastoralist and agro-pastoral livelihood strategies and water resources that lead the area toward vulnerability. The descriptive results indicated that pastoralist households have adopted various adaptation strategies: 45.1% participate in seasonal livestock migration, 26.3% rely on productive safety net programs, 19% pursue livelihood diversification, and 9.7% engage in agroforestry. Multivariate analysis indicates that education, age, credit access, livestock ownership, asset value, and media exposure influence these strategies. The findings highlight the importance of policies to enhance climate resilience through diversification, sustainable land management, and improved access to resources like credit and markets, alongside strengthened education and targeted extension services.

1. Introduction

1.1. Climate Variability and Pastoralism

Pastoralism is crucial for its economic, ecological, and sociocultural value in Ethiopia. Economically, pastoralism accounts for 10–40% of the country’s GDP [1], 30–35 percent of its agricultural GDP [2], and generates 90% of Ethiopia’s livestock exports, which account for 20% of the country’s total exports [3]. The pastoralist and agro-pastoralist sectors, primarily lowland grazing systems, contribute significantly to domestic consumption and export markets by producing 34% of national red meat, 38% of total milk, 21% of cow’s milk [4], and 80% of the annual milk supply [5].
In terms of social aspects, Ethiopian communities deeply embed pastoralism in their cultural heritage, promoting highlander cultures and attracting tourists [6]. Livestock is a symbol of wealth and social status in pastoralist communities. Over 70% of wildlife sanctuaries and parks are located in pastoralist areas [7], making them prime locations for eco-tourism initiatives. The unique culture and lifestyle of pastoralist communities offer rich inspiration for tourism [3].
Ecologically, pastoralism plays a crucial role in biodiversity maintenance, habitat creation, and vegetation management [8]. It provides essential ecosystem services, such as grazing, which is an effective tool for biodiversity maintenance and restoration [9]. Ethiopia’s lowland regions, home to numerous ecological and historical sites, are significant tourist attractions. These include the UNESCO-registered archeological site in Afar and other stunning, unique landscapes [3].
Pastoralism plays a vital economic, social, and ecological role in Ethiopia, but it is highly vulnerable to climate variability. These fluctuations have led to widespread loss of livelihoods and increased food insecurity among pastoralists, resulting from droughts, locust invasions, displacement, and floods. Additionally, climate variability creates competition and conflicts over scarce resources, which have intensified due to the depletion of natural resources and population growth [10]. Specifically, due to climate change and variability in Ethiopia, the number of people needing humanitarian aid rose from 20 million to 26.2 million in 2022, with over 54% of those affected residing in pastoralist areas [11].
Climate change and variability in Ethiopia has had a significant impact on pastoralists and agro-pastoralists, leading to the loss of 50–80% of their cattle herds. This has made it difficult for them to restock their herds, forcing many to abandon pastoralism and engage in non-pastoralist livelihoods such as charcoal production. This, in turn, aggravates deforestation and environmental degradation [10,12].
Pastoralism is a farming practice where households rely on meat, milk, and cereals in most of the area sourced from their livestock’s sale and, in return, purchased from the market. Climate change can lead to livestock mortality, crop failures, and increased food insecurity. This vulnerability is exacerbated by declining milk yields and constraints on pastoralists’ ability to sell livestock and buy cereals. As climate change vulnerability increases, the value of livestock may decrease and cereal prices may rise, making trade less favorable. Herd reconstruction is slow because the mortality rate in female reproductive stock and reductions in herd sizes below a certain threshold make it unlikely for pastoralists to recover their losses [13,14].
To address these climate variability challenges, pastoralists employ different adaptation and coping strategies. These strategies help to them adapt to changing conditions, diversify livelihoods, enhance livestock production, increase feed availability, and improve community resilience, contributing to sustainable land use and economic development. However, they must tailor strategies to the specific needs of different pastoralist households [15,16,17,18]. As a result, scientific investigations into pastoralist adaptation strategies to climate variability and change are critical to addressing climate change-related vulnerability and policy decision-making in the pastoralist areas of the study area.

1.2. Theoretical Background

The application of the Mann–Kendall test is widely applied with climate-related time series for trend detection. When a significant trend is detected, Sen’s slope estimator can be used to estimate the rate of change [19]. The MK test and Sen’s slope estimator were used by [20] for monthly rainfall data from 1989 to 2018 in Kerala (India), identifying a positive trend on the annual scale and in the monsoon season. Shah and Kiran [21] applied these statistical procedures for temperature and rainfall trend detection in Pakistan between 2000 and 2020, detecting significant positive trends in rainfall, both in the monsoon and the non-monsoon seasons, and increasing temperature trends in summer and autumn. Jiqin et al. [22] carried out similar analysis for the Dire Dawa region in Eastern Ethiopia for 1981–2021, identifying increasing temperature trends and decreasing rainfall trends. In [23] temperature time series were analyzed by these tools in Ghana, from 1986 to 2015, revealing significant increasing trends in minimum temperatures. In [24] a similar analysis was performed in the Amhara region, Ethiopia, for the period 1990–2020, detecting a positive trend in annual maximum temperatures and a negative one in the annual minimum temperatures. Beside rainfall and temperature series, the MK test is also widely applied for hydrological data, e.g., to analyze the total annual river flow time series for more than 50 rivers and 40 to 180 years of annual data [25]. Although there exist criticisms related to the power of the Mann–Kendall test [26,27], its reliability and power increase with the length of the time series. Data series considerably longer than 10 measurement points tend to lead to reliable results [26,27]. As [19] argue, a reasonable minimum length of time series for trend analysis should be 5 years of monthly data, i.e., 60 data points. This gives a solid foundation for applying the MK test and Sen’s slope estimator for our 40-year time series of monthly or seasonal data.
The multivariate probit (MVP), introduced by Ashford and Snowden in 1970 [28], is a class of models used when the dependent variable is multivariate, correlated, and discrete, while the explanatory variables are a mixture of continuous and discrete variables [29,30]. Various applications of these models can be found in the biological, sociological, and economic literature, and they are particularly useful for evaluating which socioeconomic factors influence the choice between adopting or rejecting a specific strategy. The multivariate probit is popular for modeling correlated binary data, with an attractive balance of flexibility and simplicity [30]. The field of application is extensive: Adugna et al. [31] used an MVP model to assess the choice of market outlets by Ethiopian farmers, using age, gender, education, household size, size of livestock herd, access to market information, distance from roads, and access to credit as factors influencing the farmers’ decisions. MVP is generally used for assessing the decisions related to adaptation to climate change. Inkoom and Dadzie [32] analyzed the climate adaptation strategies of cocoa farmers in Ghana, establishing that the main socioeconomic variables influencing the farmers’ climate adaptation strategy choices were sex, age, education, farm size, quality of extension service delivery, access to credit, and membership in farmer groups. GC and Yeo [33] assessed the influential factors on climate change adaptation options by farmers in Nepal, also including age, gender, education, household size, size of livestock herd, access to information, distance, and access to credit among other factors influencing the farmers’ adaptation strategy choices. Mulwa et al. [34] used a similar model for assessing the climate adaptation strategies of smallholder farmers in Malawi, relying on very similar socioeconomic features of the analyzed farmer population. These studies serve as a theoretical background for our analysis, in which we will analyze how the Ethiopian pastoralist households of the research area adopt one of four possible strategies available to them, and how these decisions are influenced by their socioeconomic characteristics.

1.3. Research Gap and the Objective of the Study

To the best of the researcher’s knowledge, previous literature reviews in the Eastern Bale Zone primarily focused on the highland areas, overlooking the diverse experiences and perceptions of pastoralist communities across different ecological zones and cultural contexts, largely due to the region’s security issues. Exceptions include studies by Gebbisa and Mulatu [16] and Debele and Desta [35] on livelihood strategies in pastoralist areas, as well as Taye [36] and Desta et al. [37] on climate change vulnerability and adoption strategies. Therefore, this study addresses the gap in the geographical and spatial distribution of studies by focusing on areas beyond the highlands.
The overall objective of this study was to analyze climate variability and adaptation strategies in pastoralist areas of the Eastern Bale Zone, focusing on Sawena district, Ethiopia. Specifically, the study aimed to examine climate variability—particularly trends and fluctuations in rainfall and temperature—as well as to identify the adaptation strategies employed and the key factors that influence these strategies in the study area.

2. Materials and Methods
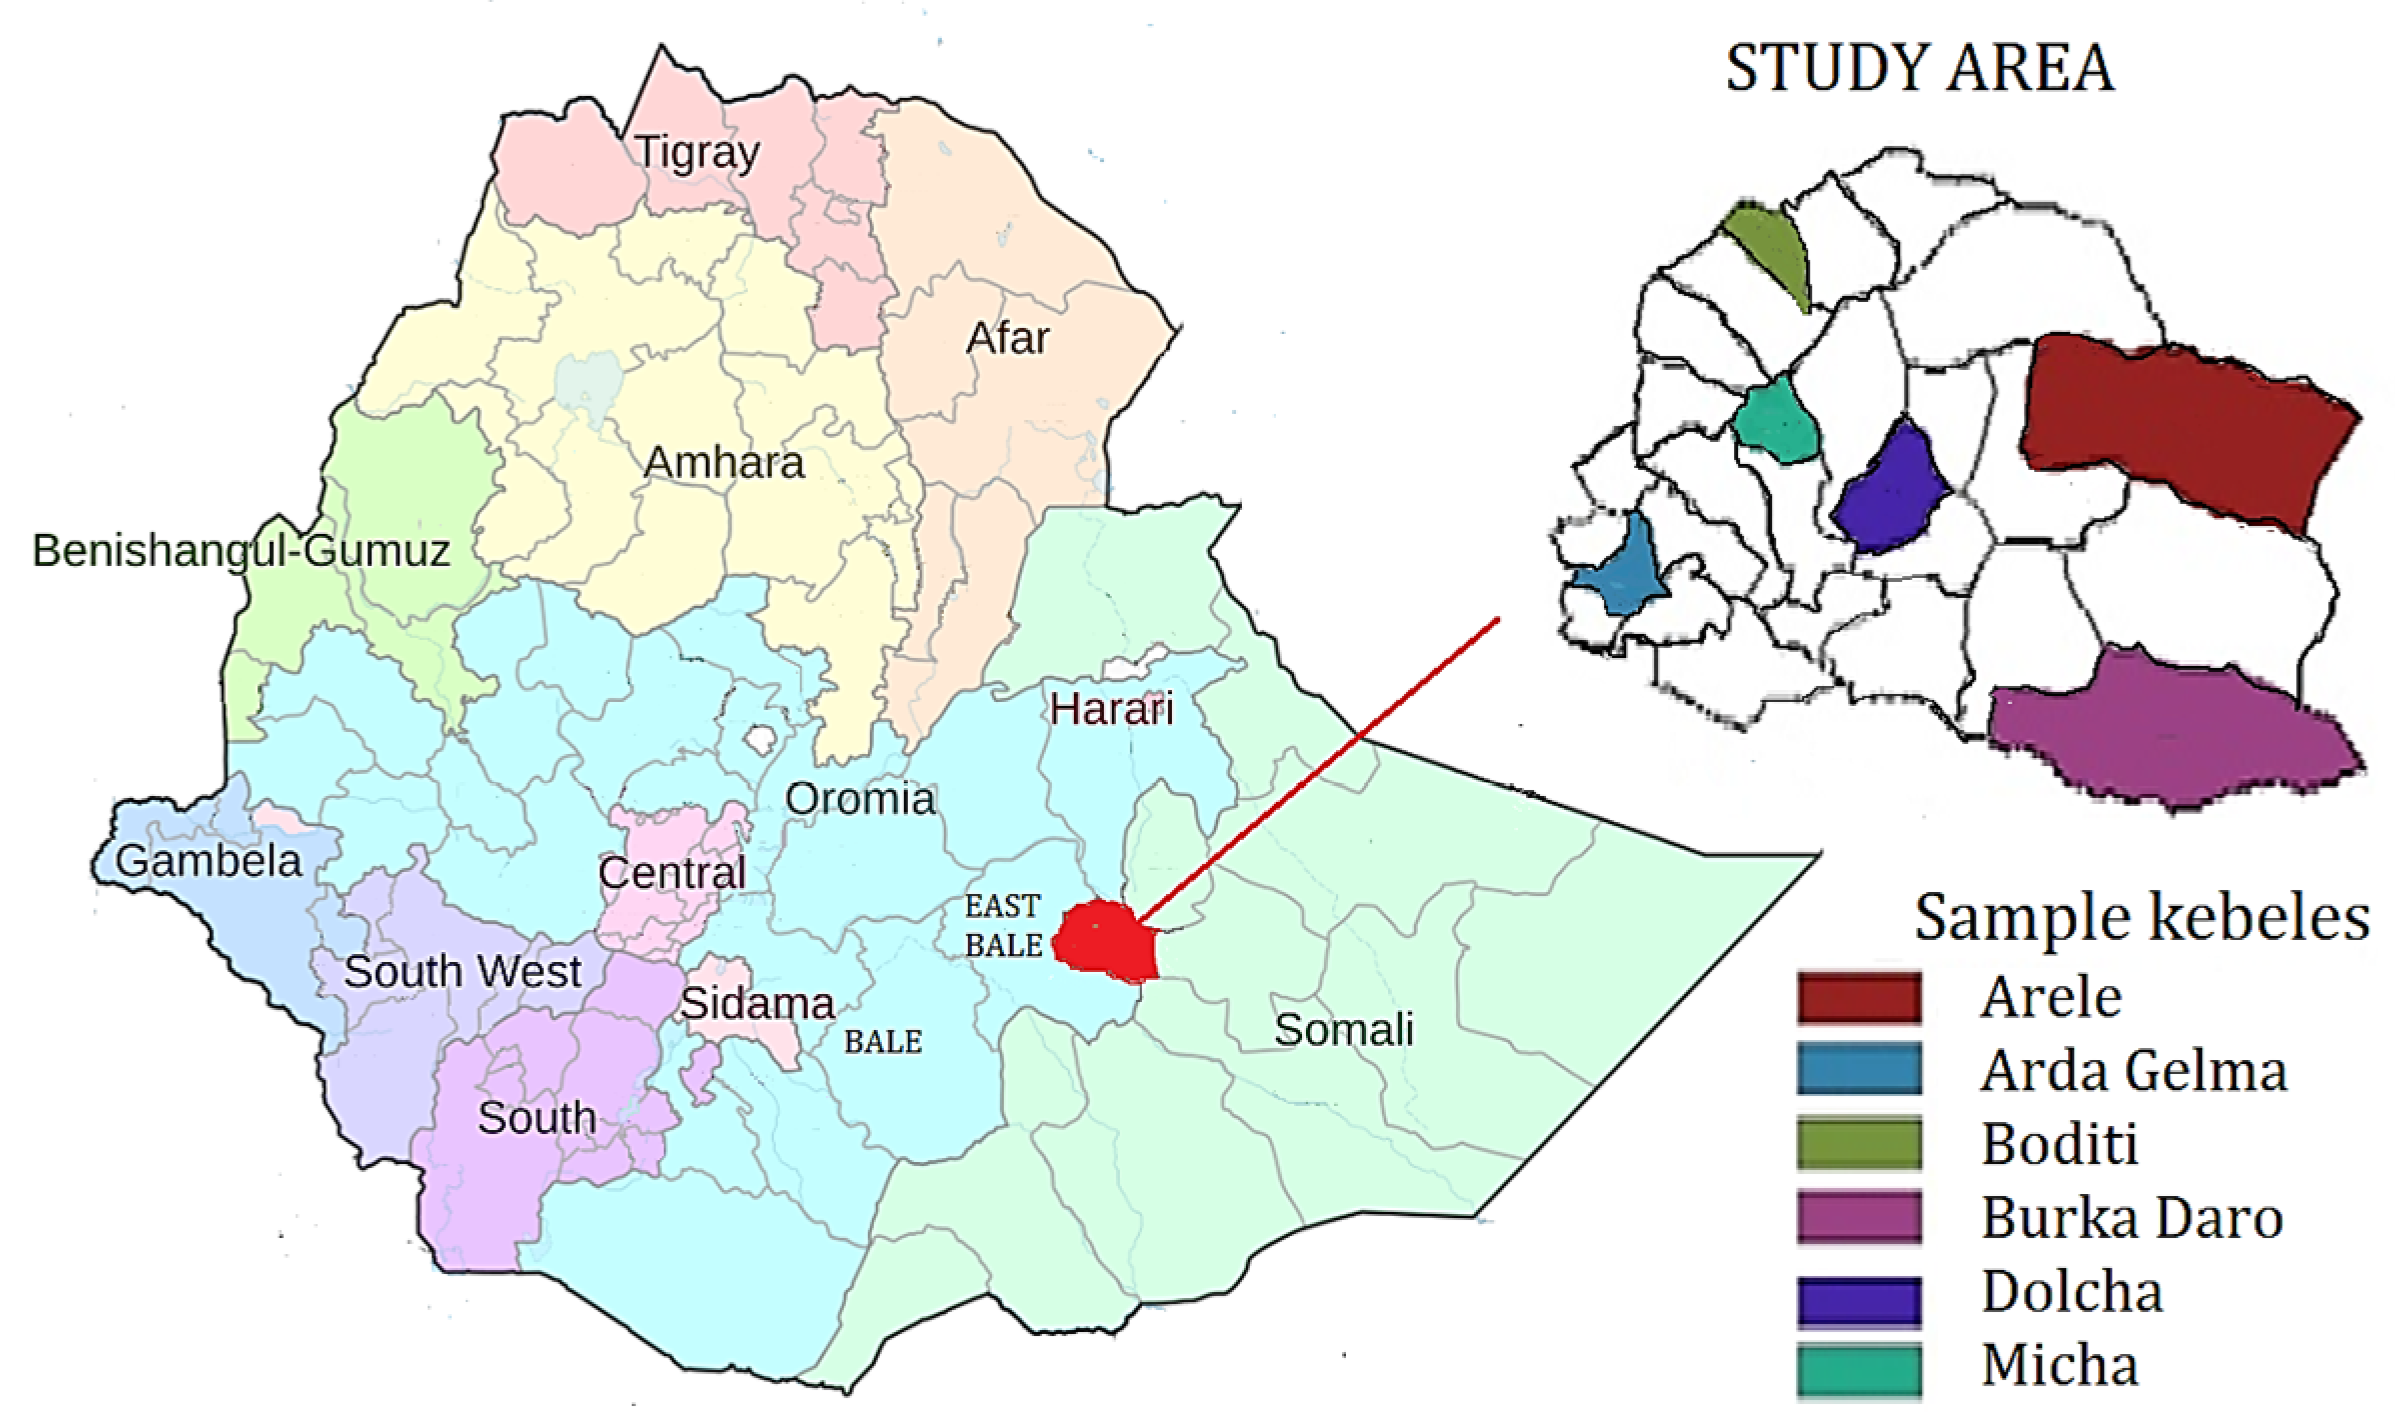
2.1. The Study Area

The study was conducted in Sawena district, Eastern Bale Zone, Oromia National Regional State, and Southeast Ethiopia, located 605 km and 60 km from Finfinne, the country’s capital, and Ginir, the zone’s center, respectively (Figure 1). Micha Town serves as the district’s capital and administrative center. The district borders the Somalia National Regional State to the east, Lega Hida district to the north, Gololcha district to the west, Ginir district to the south, and Rayitu district to the southeast. The district lies between the latitudes 60°59′40″ N–70°46′15″ N and longitudes 40°47′00″ E–41°42′15″ E. The district spans approximately 8263 km2 and divides into 28 rural kebeles and one urban kebele [38].
Physically, the district is characterized by sub-tropical highlands, lowlands, rugged areas, deep gorges, and flat-topped plateaus. The Sawena district’s altitude increases to 2970 m above sea level. The district is classified into sub-tropical (‘Woina dega’) and tropical (‘Kola’) thermal zones. The district’s average annual temperature varies from 21.5 to 38 °C, with an average annual rainfall of 350 to 700 mm [38].
The population of Sawena district is estimated at approximately 98,902, with 93.29% residing in rural areas and 6.71% in urban areas. The district has an average population density of 10.71 people per square kilometer [38]. Sawena is home to diverse ethnic groups, with 90% of the population being Oromo and the remaining 10% comprising Amhara and Somali communities. Afan Oromo is the dominant language spoken across the district, along with several other languages. In terms of religion, 98% of the population is Muslim, while the remaining 2% follow Orthodox Christianity, Waqefata, Catholicism, and other religions [39].
The primary livelihood systems in the study area are agro-pastoralism, which accounts for 24.13%, and livestock production, which makes up 75.77%. Land use classifications include crop production (2.13%), grazing land (25.17%), forest and bushland (6.44%), with other uses comprising 66.26%. The region’s typical vegetation cover includes shrubland and bushland, largely dominated by various Acacia species with minimal or no herbaceous growth. The average landholding per household in agro-pastoralist areas is 2.08 hectares [40].

2.2. Data Source and Type

The study gathered both qualitative and quantitative data from primary and secondary sources. Primary data were collected directly from selected pastoralist households using structured and unstructured questionnaires. Secondary data came from various sources, including the Meteoblue database [41], published journals, books, online sources, academic databases, governmental and intergovernmental databases, and organizational databases, as explained below.
For primary data, structured and unstructured questionnaires were administered to 350 pastoralist households across six kebeles, using both English and Afan Oromo to ensure accessibility and comprehension. Respondents remained anonymous to protect their privacy. This mix of quantitative data from meteorological sources and qualitative insights from household surveys provided a comprehensive perspective on climate variability and adaptation strategies in the region’s pastoralist communities.

2.2.1. Secondary Data About Climate Variability

The study analyzed climate variability and adaptation strategies in the pastoralist areas of the Eastern Bale Zone using both primary and secondary data. Secondary data included long-term rainfall and temperature records from 1984 to 2023, sourced from the Meteoblue database [41], to assess climate trends over time. Additionally, the study reviewed relevant articles and reports on climate variability and adaptation strategies to support a broader understanding of the topic. The researcher downloaded daily rainfall and temperature data (1984–2023) for the Sawena district from the MeteoBlue database. Daily temperature and rainfall values were then aggregated to obtain monthly data. Monthly temperatures were grouped by season to calculate seasonal rainfall (by winter, spring, summer, and autumn), and data for all months were combined to determine the annual temperature and rainfall amount, leading to 40 annual data points.

2.2.2. Primary Data Collection

The study employed purposive and random sampling in a multi-stage process to select Sawena district from six pastoralist districts in the Eastern Bale Zone. Sawena, covering 8263 square kilometers, comprises 25% of the zone’s pastoralist land, making it the largest district by area. It also accounts for 14% of the pastoralist population, ranking third in population size within the zone [39]. This makes it an ideal location for conducting the study.
In the first stage, six out of the 29 administrative kebeles within the district were selected randomly, considering factors such as altitude, climate, and population density. This selection ensures a representative sample of the district’s socioeconomic and environmental diversity, providing a more comprehensive basis for analysis. The selected kebeles are Arda Gelma, Arele, Burka Daro, Boditi, Dolicha, and Micha.
In the second stage, households were chosen from each kebele using simple random sampling from the housing registry at kebele administration offices, and the number of selected households was determined proportionally to their total household size, as is shown in Table 1.
The Sawena district had a total population of around 98,902 people and 20,605 households. The sample size was calculated using Kothari’s [42] equation. When the population is finite, the equation may be used to calculate the sample size. The equation is clarified in the following way:
n = z 2 · p · q · N e 2 N 1 + z 2 · p · q  
where
Z: is the value of the standard variant at a 95% confidence interval (Z = 1.96);
p: is the estimated proportion of an attribute that is present in the population (p = 0.5);
q: is the estimated proportion of an attribute that is not present in the population (q = 0.5);
e: is the margin of error considered, which is 5% for this study;
N: is the size of the population, in the chosen six kebeles Arda Gelma, Arele, Boditi, Burka Daro, Dolicha, and Micha, with a total household population of 3871 (Table 1). Thus
n = 1.96 2 0.5 0.5 3871 0.05 2 3871 1 + 1.96 2 0.5 0 . 5 = 350
Using the calculation, the total household sample size for respondents was 350 households. The household sample respondents at the kebele (i.e., sub-district) level were chosen proportionately depending on the household size. i.e.,
Number   of   sample   households   in   kebele = Total   sample   size × Total   households   in   kebele / Total   households   in   6   kebeles
The primary unit of this study was the household, with the head of the family serving as the main unit of observation. Here, “household” is defined as a domestic unit of individuals living together, sharing common spaces, resources, and responsibilities within a single dwelling [43]. The sample frame was established using a list of households recorded by the kebele administration.
A questionnaire was administered through individual interviews with the heads of selected households from February 2021 to April 2021. The data collected included demographic information, the perceptions of the household regarding climate change, the adoption strategies they employed, and the determinants influencing these strategies in the area.

2.3. Method of Data Analysis

The study achieved the stated objectives by sorting out, editing, coding, organizing, summarizing, and analyzing both the secondary and primary (i.e., survey) data using descriptive statistics, non-parametric tests, and econometric models. The research used XLSTATA 2024 and STATA software Version 14.1 to examine the data and estimate the parameters.
The following statistical procedure was applied. First the climate time series of monthly and seasonal data of 40 years were analyzed for trend and variability. Trends were assessed by the Mann–Kendall test [44,45,46] and Sen’s slope estimator [47]. This analysis reveals the magnitude of climate change in the study area. After that, multivariate probit analysis was performed to assess the adaptation strategies of pastoralist households to climate change, in relation to their demographic, financial, and geographical characteristics.

2.3.1. Trend and Variability Analysis for Climate Data

To analyze the trends and variability of rainfall and temperature in the study area, the study was employed the Mann–Kendall statistical test, Sen’s slope estimator, and the coefficient of variation.
The Mann–Kendall test, formulated by [44], is a non-parametric method for detecting trends, i.e., it is used for any distribution, not requiring the normality of the data. The test analyzes differences in signs between earlier and later data points, because if a trend is present, the sign values will tend to increase constantly or decrease constantly.
The distribution of the test statistic was later provided by [45], specifically for testing non-linear trends and identifying turning points. The test produces a simple statistic (Z) and p-value, making interpretation straightforward. The Mann–Kendall statistic is calculated as follows [46]:
S = j = 1 n 1 i = j + 1 n s i g n Z i Z j
where n is the length series (i.e., number of years), j = 1, 2, 3………n, and Zj is the variable to be analyzed (e.g., annual rainfall in year j), and for every i > j,
S i g n Z i Z j = + 1   i f   Z i Z j > 0   0   i f   Z i Z j = 0 1   i f   Z i Z j < 0
Kendall [45] utilized a normal-approximation test for large datasets comprising over 10 values. This method utilizes a normal distribution with mean and variance to address non-monotonic trends in the data. The computation considers if there are tied groups in the data. A tied group is a collection of sample data with the same value. If the Zj series contain K tied groups (i.e., the K of the values occurs repeatedly), then tk is the value of the kth tied group (k = 1 … K).
The expected value of S is E(S) = 0, and the variance of S is calculated as:
V a r   S = n 1 2 n + 5 k = 1 K t k t k 1 2 t k + 5 18
If there are no tied groups, this summary process can be ignored [30]. In cases where the sample size is >10, the standard normal test statistic Z is computed as follows:
Z = S 1 V a r s ,               i f   S > 0     0   ,                           i f   S = 0 S + 1 V a r s ,               i f   S < 0
Positive Z values indicate increasing trends, whereas negative Z values show decreasing trends. The p-value determines the statistical significance of the trend. The lower the p-value, the more statistically significant the observed difference. The null hypothesis H0 implies no trend (the data are independent and randomly ordered). In contrast, the alternative hypothesis H1 indicates the existence of a trend.
Sen’s slope estimator is a non-parametric test used to discover trends in univariate time series drawn from unknown distributions, thus it is an alternative to the least-squares regression line [47]. If Sen’s slope is positive, then the trend in the time series is increasing; if it is negative, then the trend is decreasing. Sen’s slope estimator is calculated in the following way. First calculate the slope (Ri) of all the data pairs as in Equation (7):
R i = Z i Z j i j   for i , j = 1 , 2 , 3 n ,   i > j ,
Thus, we arrive at N = n (n − 1)/2 values of Ri. Sen’s slope estimator is the median of these N values of Ri, ranked from smallest to largest, computed as in Equation (8):
R m e d = R k   w h e r e   k = N + 1 2   i f   N   i s   o d d R k + R k + 1   2   w h e r e   k = N 2 i f   N   i s   e v e n
The coefficient of variation (CV) is a measure of statistical significance that evaluates the variability of a set of values, independent of a unit of measurement. It is also used to compare the distributions within various units [48]. In this study, the coefficient of variation was used to quantify the consistency and variability of rainfall and temperature across time in the study area. For small datasets the unbiased estimator for this is in Equation (9):
C V = 1 + σ μ × 100
where CV stands for the coefficient of variation, σ for the standard deviation, and μ for the mean of the time series, i.e., precipitation and temperature. The CV classifies climate variability as low (CV < 20), moderate (20 < CV < 30), or high (CV > 30) [49].

2.3.2. Analysis of Variables Affecting Adaptation to Climate Change

The research used a multivariate probit model to examine the variables that affect the adaptation methods of local pastoralists to climate change and household variability. This model took into consideration the potential relationship of unmeasured factors with each outcome variable. The multivariate probit model offers advantages over other models by considering the correlation structure among choice variables and extending the probit model to jointly estimate several correlated binary outcomes. The multivariate probit model can generally be expressed as in Equation (10):
Y m i = β m i X m i + µ m i
where Y*mi represents the dependent variable of choice of the mth existing adaptation strategy (m = 1 … k) to climate change and variability chosen by the ith local pastoralist (i = 1 … n). The dependent variables are polychotomous variables showing whether adaptation strategies towards climate change are the choice of local pastoralists or not.
The researcher identified existing adaptation and coping approaches to climate change and variability, which can be categorized into four main areas: seasonal livestock migration, the productive safety net program, livelihood diversification, and seedling planting initiatives (Table 2). These strategies were obtained from the Oromia Regional State Pastoral Development Commission [40]. Every pastoralist can use one or several adaptation and coping strategy techniques in response to climate change and variability.
The adaptation methods to climate change and variability are influenced by Xmi, a 1 × k independent variable for the ith pastoralist and the mth strategy, with Strategy1 denoting seasonal livestock migration, Strategy2 the productive safety net program, Strategy3 livelihood diversification, and Strategy4 seedling planting. The unknown parameters to be estimated are represented by βmi, a k × 1 vector. The error terms are denoted as μmi, and the variables’ distribution follows a multivariate normal distribution with a zero mean, and the variance–covariance matrix V represents the correlations between the variables.
As can be seen from the following equations, the system consists of m equations, representing the adoption of the m adaptation strategies:
Seasonal livestock migration: Y1i = β1i X1i + μ1i
Livelihood diversification: Y2i = β2i X2i + μ2i
PSNP: Y3i = β3i X3i + μ3i
Plant seedling: Y4i = β4i X4i + μ4i
Decisions about adaptation or non-adaptation (yki) reveal latent dependent factors as:
Y = 1, if yk* > 0, and 0 otherwise (k = 1, 2, 3, 4)
In Equation (15) the value yk* represents an underlying or latent variable used to determine the value of Y based on its sign (whether it is positive or non-positive). This means that Y would take the value 1 if yk* is greater than for any k (1, 2, 3, or 4). If yk∗ ≤ 0, then Y is 0.
For each of the four adoption techniques, there are eight potential outcomes, and eight corresponding joint probabilities. The likelihood that all four components of the present adaptation techniques to climate change and variability were chosen by local pastoralists ‘i’ is provided as:
The probabilities of selecting the adaptation of seasonal livestock migration:
Pr ( y 1 i = 1 , y 2 i = 1 ,   y 3 i = 1 , y 4 i = 1 , )   = XPr ( μ 1 i β 1 x 1 i , μ 2 i β 2 x 2 i , μ 3 i β 3 x 3 i , μ 4 i β 4 x 4 i )
The probabilities of selecting the adaptation of livelihood diversification:
Pr ( y 1 i = 1 , y 2 i   = 1 ,   y 3 i = 1 , y 4 i = 1 , )   = XPr ( μ 2 i β 2 x 2 i , μ 3 i β 3 x 3 i , μ 4 i β 4 x 4 i , μ 1 i β 1 x 1 i )
The probabilities of selecting the adaptation of PSNP:
Pr ( y 1 i = 1 , y 2 i   = 1 ,   y 3 i = 1 , y 4 i = 1 , )   = XPr ( μ 3 i β 3 x 3 i , μ 1 i β 1 x 1 i , μ 2 i β 2 x 2 i , μ 4 i β 4 x 4 i )
The probabilities of selecting adaptation of seedling planting:
Pr ( y 1 i = 1 , y 2 i = 1 ,   y 3 i = 1 , y 4 i = 1 , )   = XPr ( μ 4 i β 4 x 4 i , μ 1 i β 1 x 1 i , μ 2 i β 2 x 2 i , μ 3 i β 3 x 3 i )
They jointly estimate this system of equations using the maximum likelihood approach. Train [50] used the Gewek–Hajivassiliour–Keane smooth recursive conditioning simulator to estimate the multivariate normal distribution. The GHK simulator, as demonstrated by [51], possesses favorable characteristics when applied to multivariate, normal, and limited dependent variables. Specifically, the simulated probabilities are unbiased and confined within the (0, 1) range, and the simulator is a continuous and differentiable function of the model’s parameters.

3. Results

3.1. Descriptive Statistics for Primary and Secondary Variables

The descriptive statistics of the selected sample pastoralist household in the study area explained by age, sex, total family size, education status, access to credit, livestock holding, asset value, access to mass media, access to veterinary extension services, distance to market, and access to rangeland are presented in Table 3.
The analysis reveals that, of the total number of respondents, 68.6% of household heads are male and 31.4% are female, indicating a male-dominant demography in decision-making in the pastoralist area. The level of access to critical resources varies: 60.6% of households have no access to credit, while 77.7% have access to mass media, which is vital for information dissemination, 32.2% of households have access to veterinary services, indicating decent service coverage. Access to rangeland is high at 76.6%, showing its importance in sustaining pastoralist livelihoods. The average age of household heads is 44, with family sizes averaging 8 members, indicating that large families are common in pastoralist settings. Livestock holdings average seven tropical livestock units, reflecting significant reliance on livestock assets.
In the same way, the average asset value of respondents is USD 3155, suggesting moderate economic stability, with a wide range from USD 486 to USD 10,009. Households are, on average, 15.3 km away from the nearest market, highlighting potential challenges in market access. Secondary data on annual rainfall show a mean of 371.4 mm with considerable variability (102.2 mm), indicating significant climatic variability. The average annual temperature is 23.4 °C, with minor fluctuations, pointing to consistent yet potentially stressful temperature conditions for agricultural and pastoralist activities.

3.2. Trend and Variability of Rainfall and Temperature

Climate variability is often analyzed through long-term trends and fluctuations in rainfall and temperature, two of the most influential climate indicators. The following discussion explores how rainfall and temperature trends and variability contribute to an understanding of climate variability in the analyzed region.

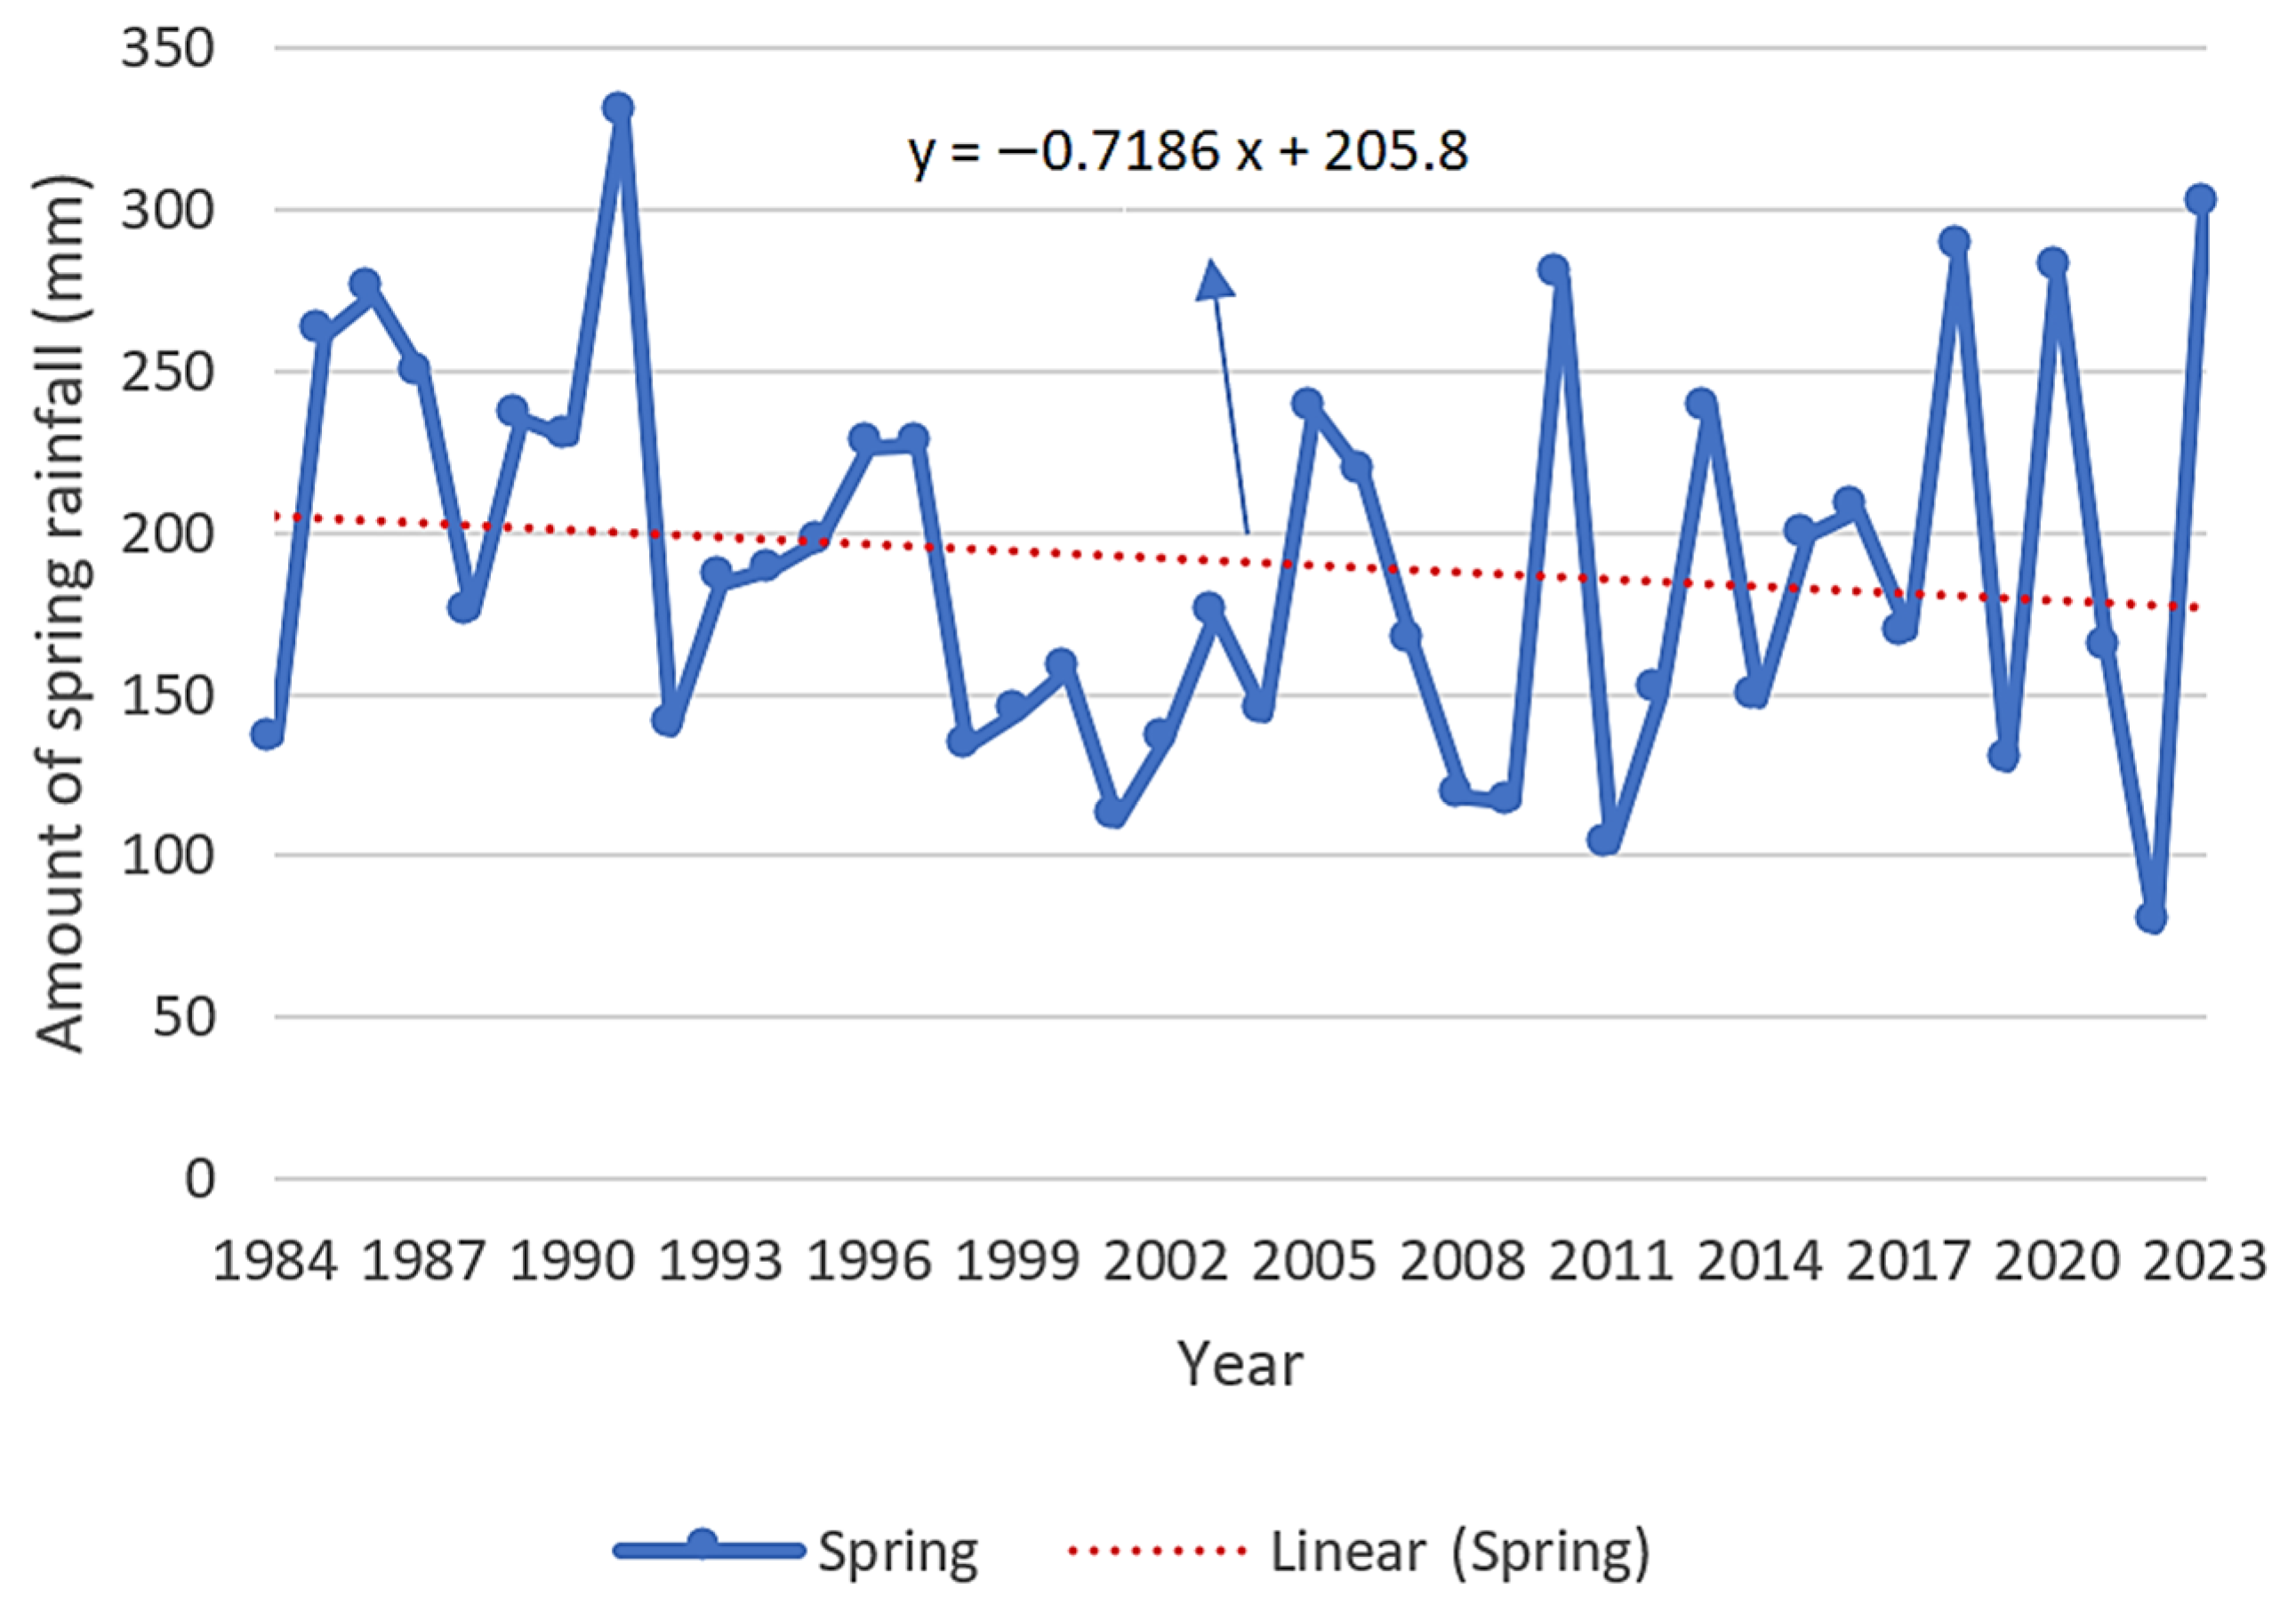
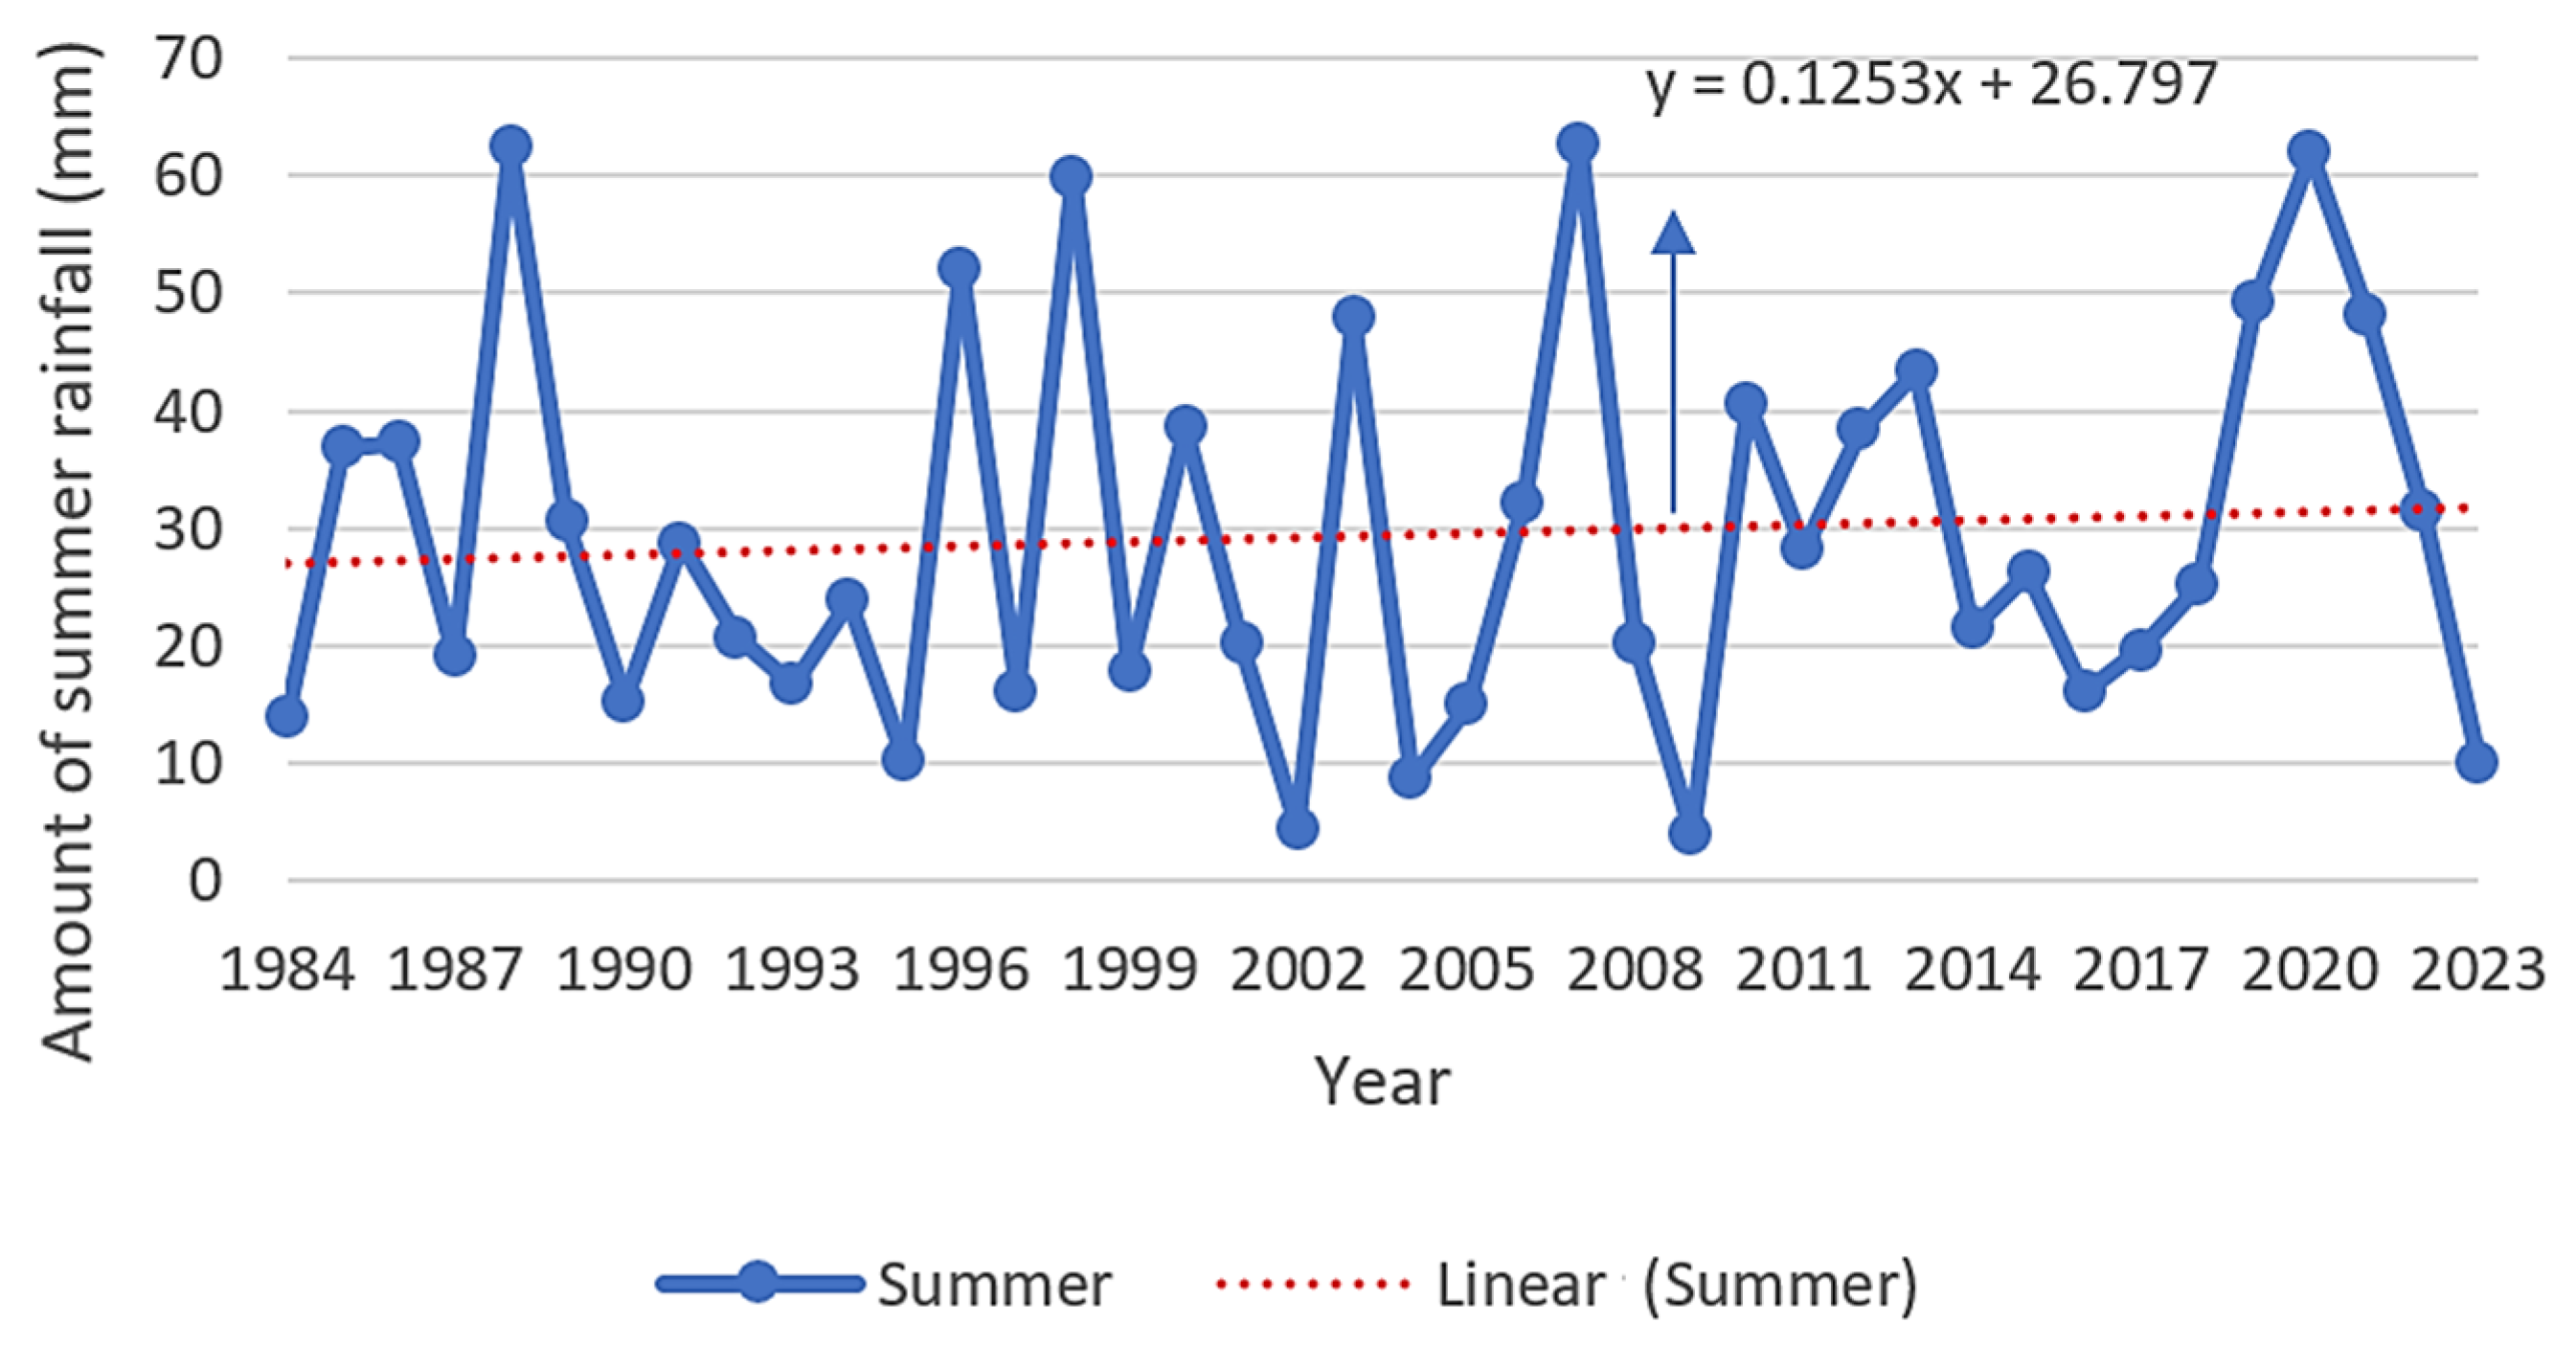
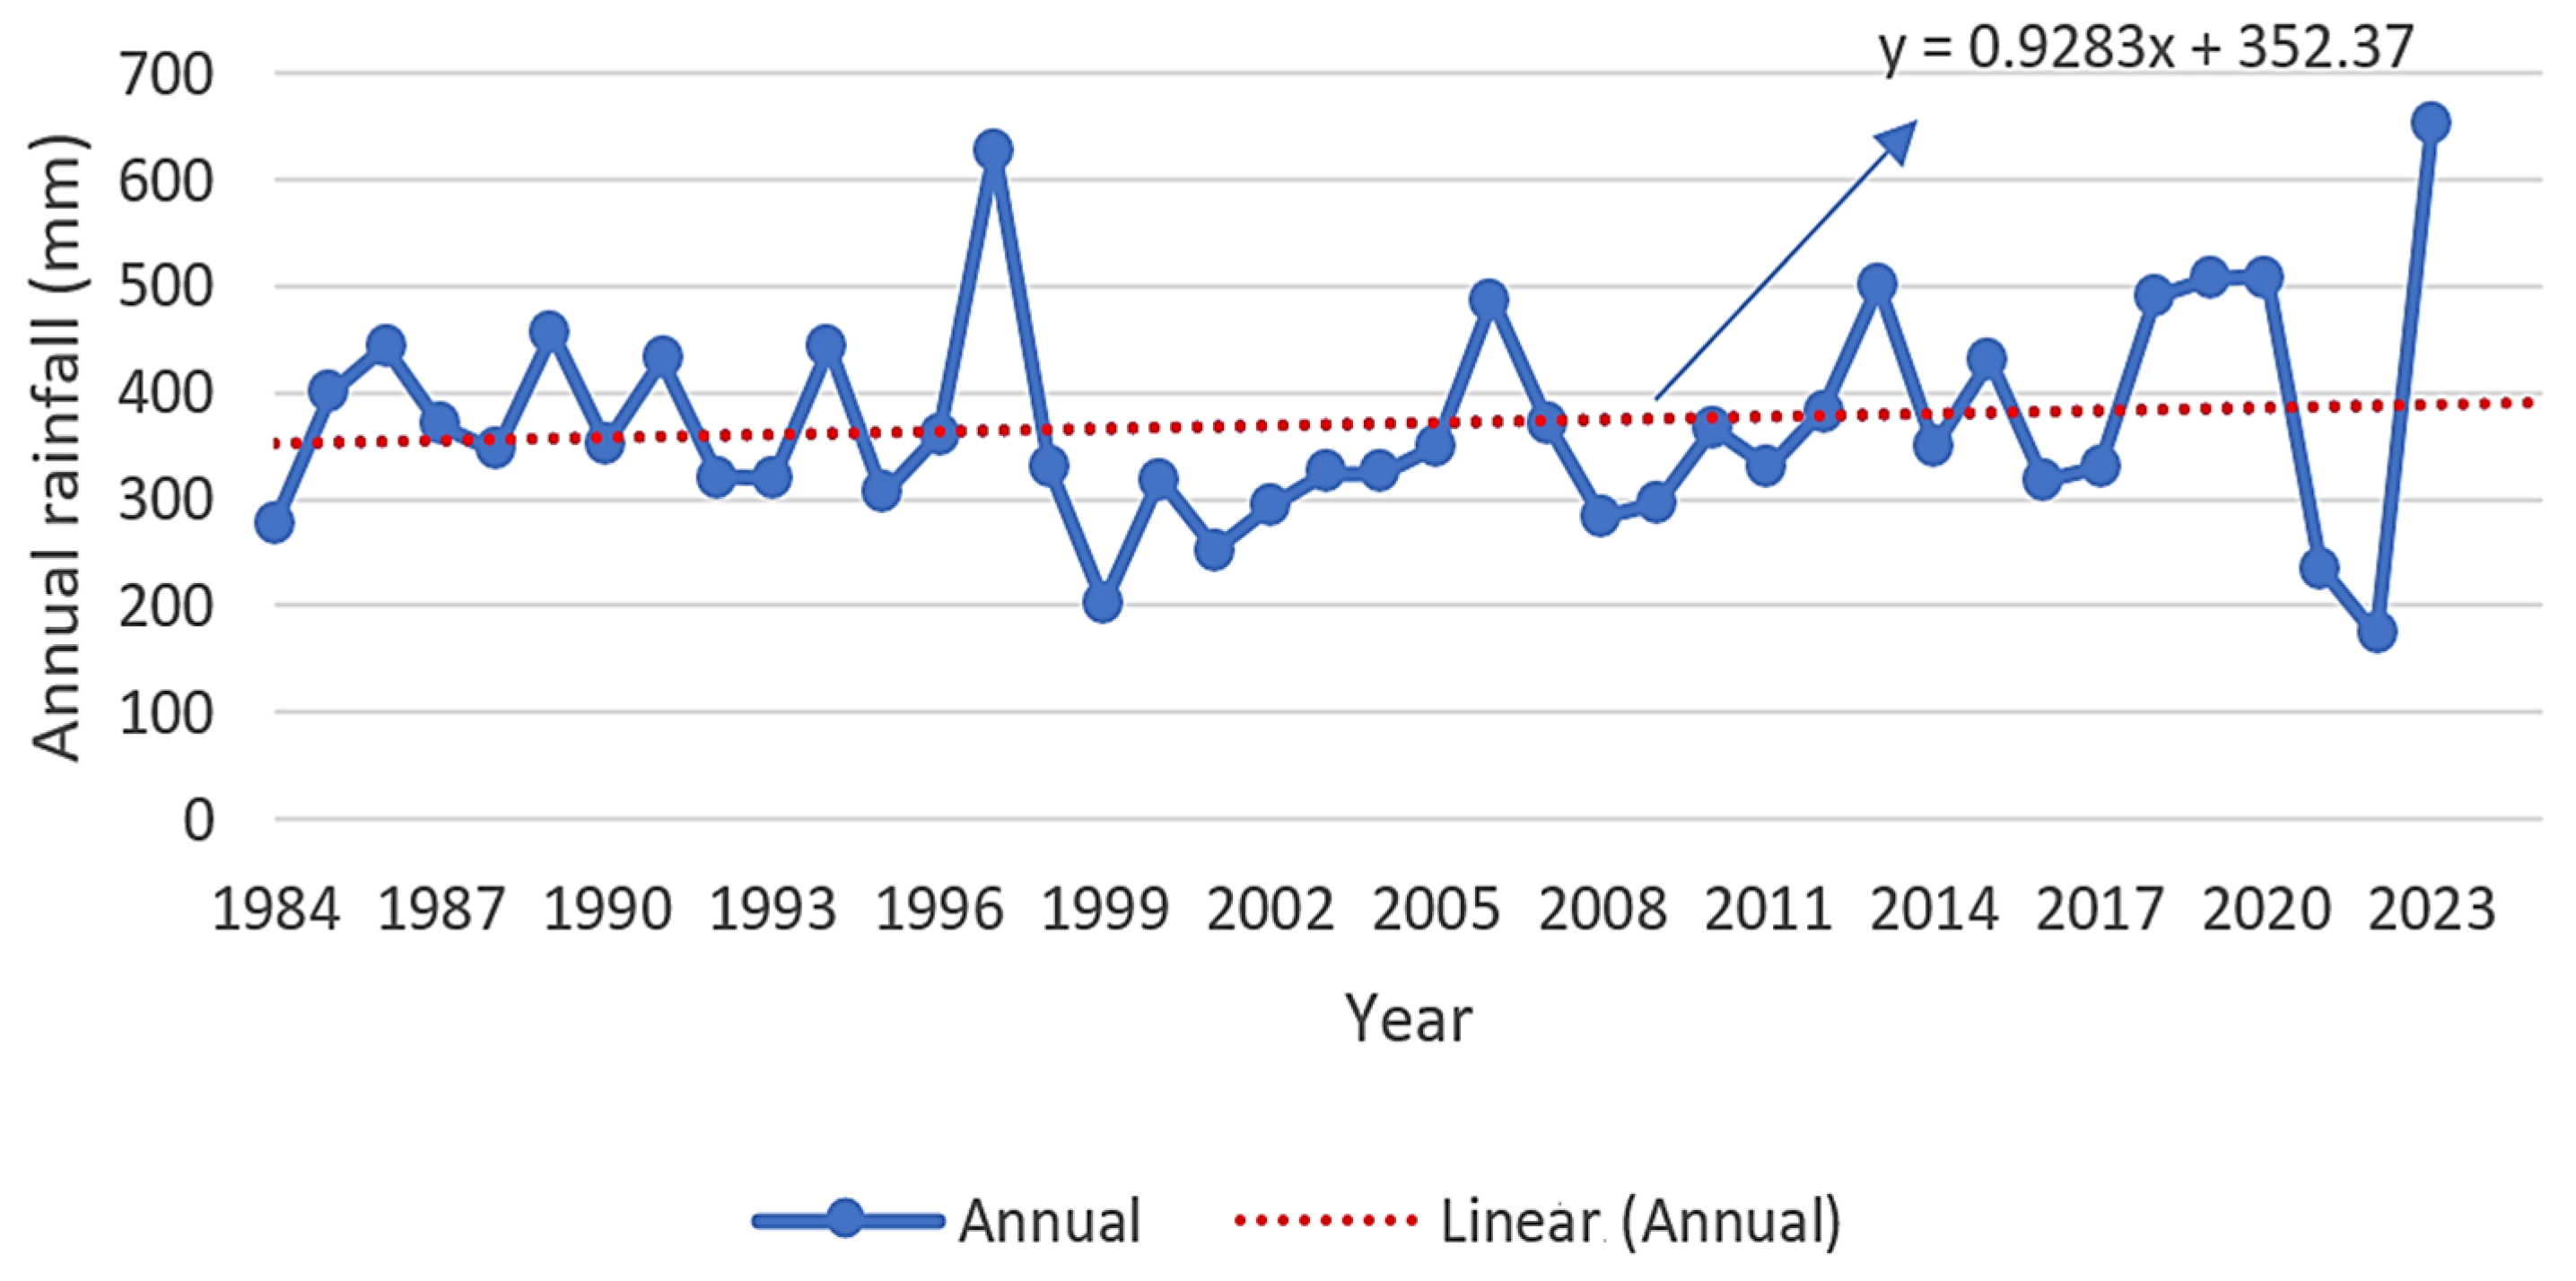
3.2.1. Trend and Variability of Rainfall

In Sawena district, by analyzing rainfall (Table 3) the Mann–Kendall test results for monthly rainfall revealed a significant increasing trend in September (MKS = 84), October (MKS = 246), and November (MKS = 118), with the Sen’s slope value showing annual changes of 0.096 mm, 1.284 mm, and 0.072 mm, respectively, at the 0.05 and 0.01 significance levels. October had the most pronounced upward trend, with a Sen’s slope of 1.284 mm/year. March and August also showed an upward trend in rainfall, with increases of 0.136 mm and 0.067 mm per year, though these were not statistically significant. Similarly, January, February, April, May, June, July, and December showed decreasing trends in rainfall, but none of these trends were statistically significant.
Regarding rainfall variability, January and February experienced the highest variability, with a fluctuation of 242.05% and 232.22%, respectively, indicating that rainfall in these months is highly inconsistent from year to year. In contrast, April showed the lowest variation at 38.1%, suggesting more stable and consistent rainfall during that month.
During the winter season, as Table 4 indicated. rainfall variability is high, with a coefficient of variation of 126.75%, indicating substantial fluctuations in rainfall amounts from year to year. In contrast, spring experiences relatively low variability, with a coefficient of 32.25%, reflecting more consistent and stable rainfall patterns. Despite this stability, there is no significant trend in spring rainfall, as shown by a Kendall’s tau of −0.105 and a p-value of 0.345.
Rainfall variability during summer and autumn is moderate, with coefficients of 56.49% and 57.84%, respectively. While both seasons exhibit similar levels of fluctuation, only autumn shows a significant increasing trend in rainfall, whereas summer does not. This suggests that autumn is becoming wetter over time, while the other seasons remain largely unchanged. A graphical representation of the rainfall trends in Sawena district is presented in Figure 2, Figure 3, Figure 4, Figure 5 and Figure 6.

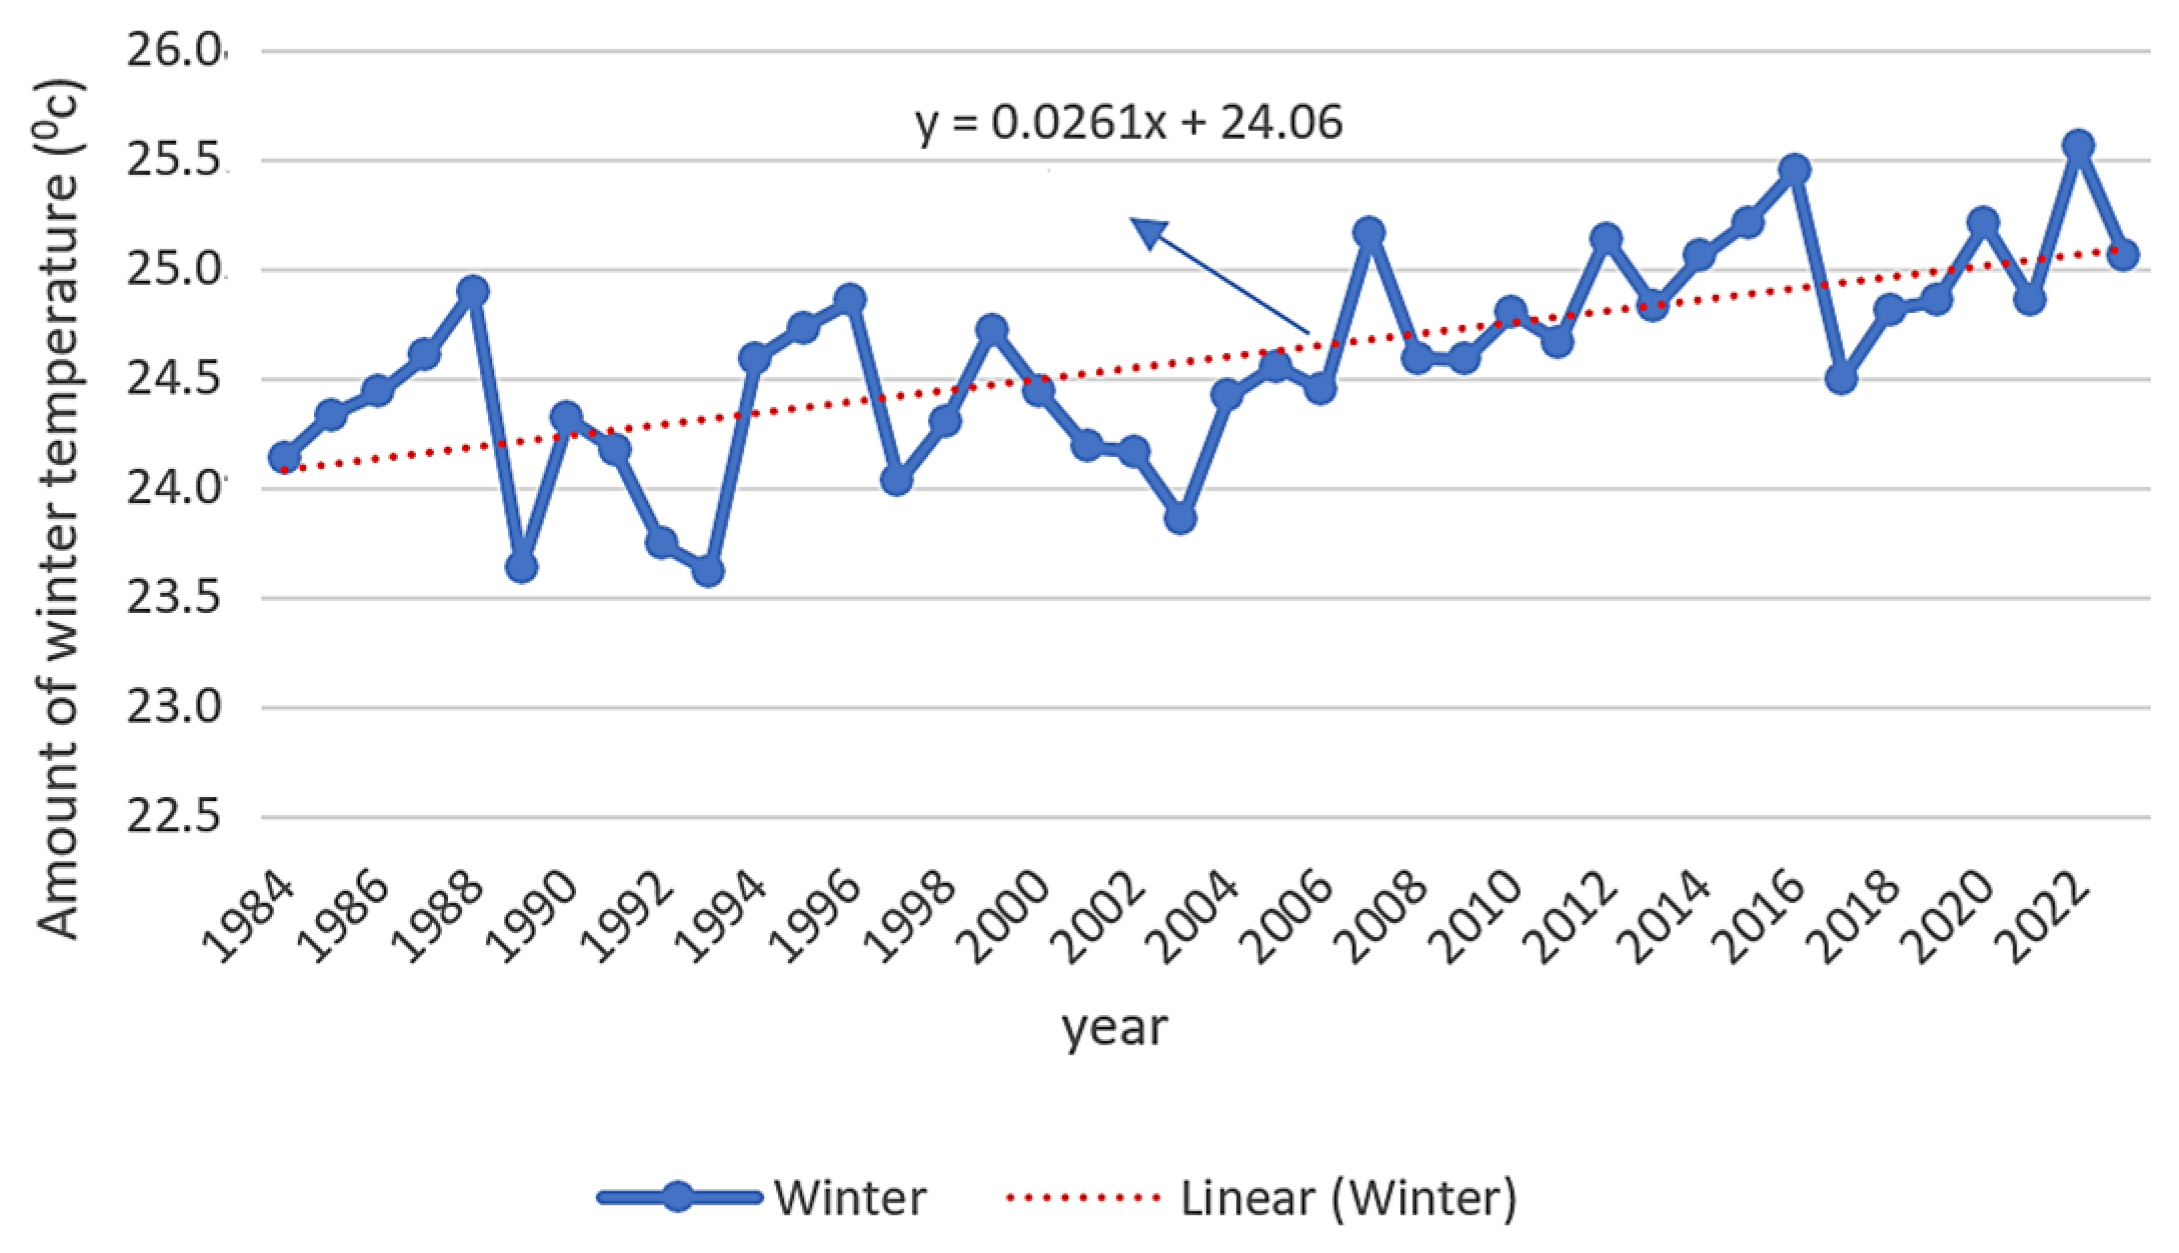
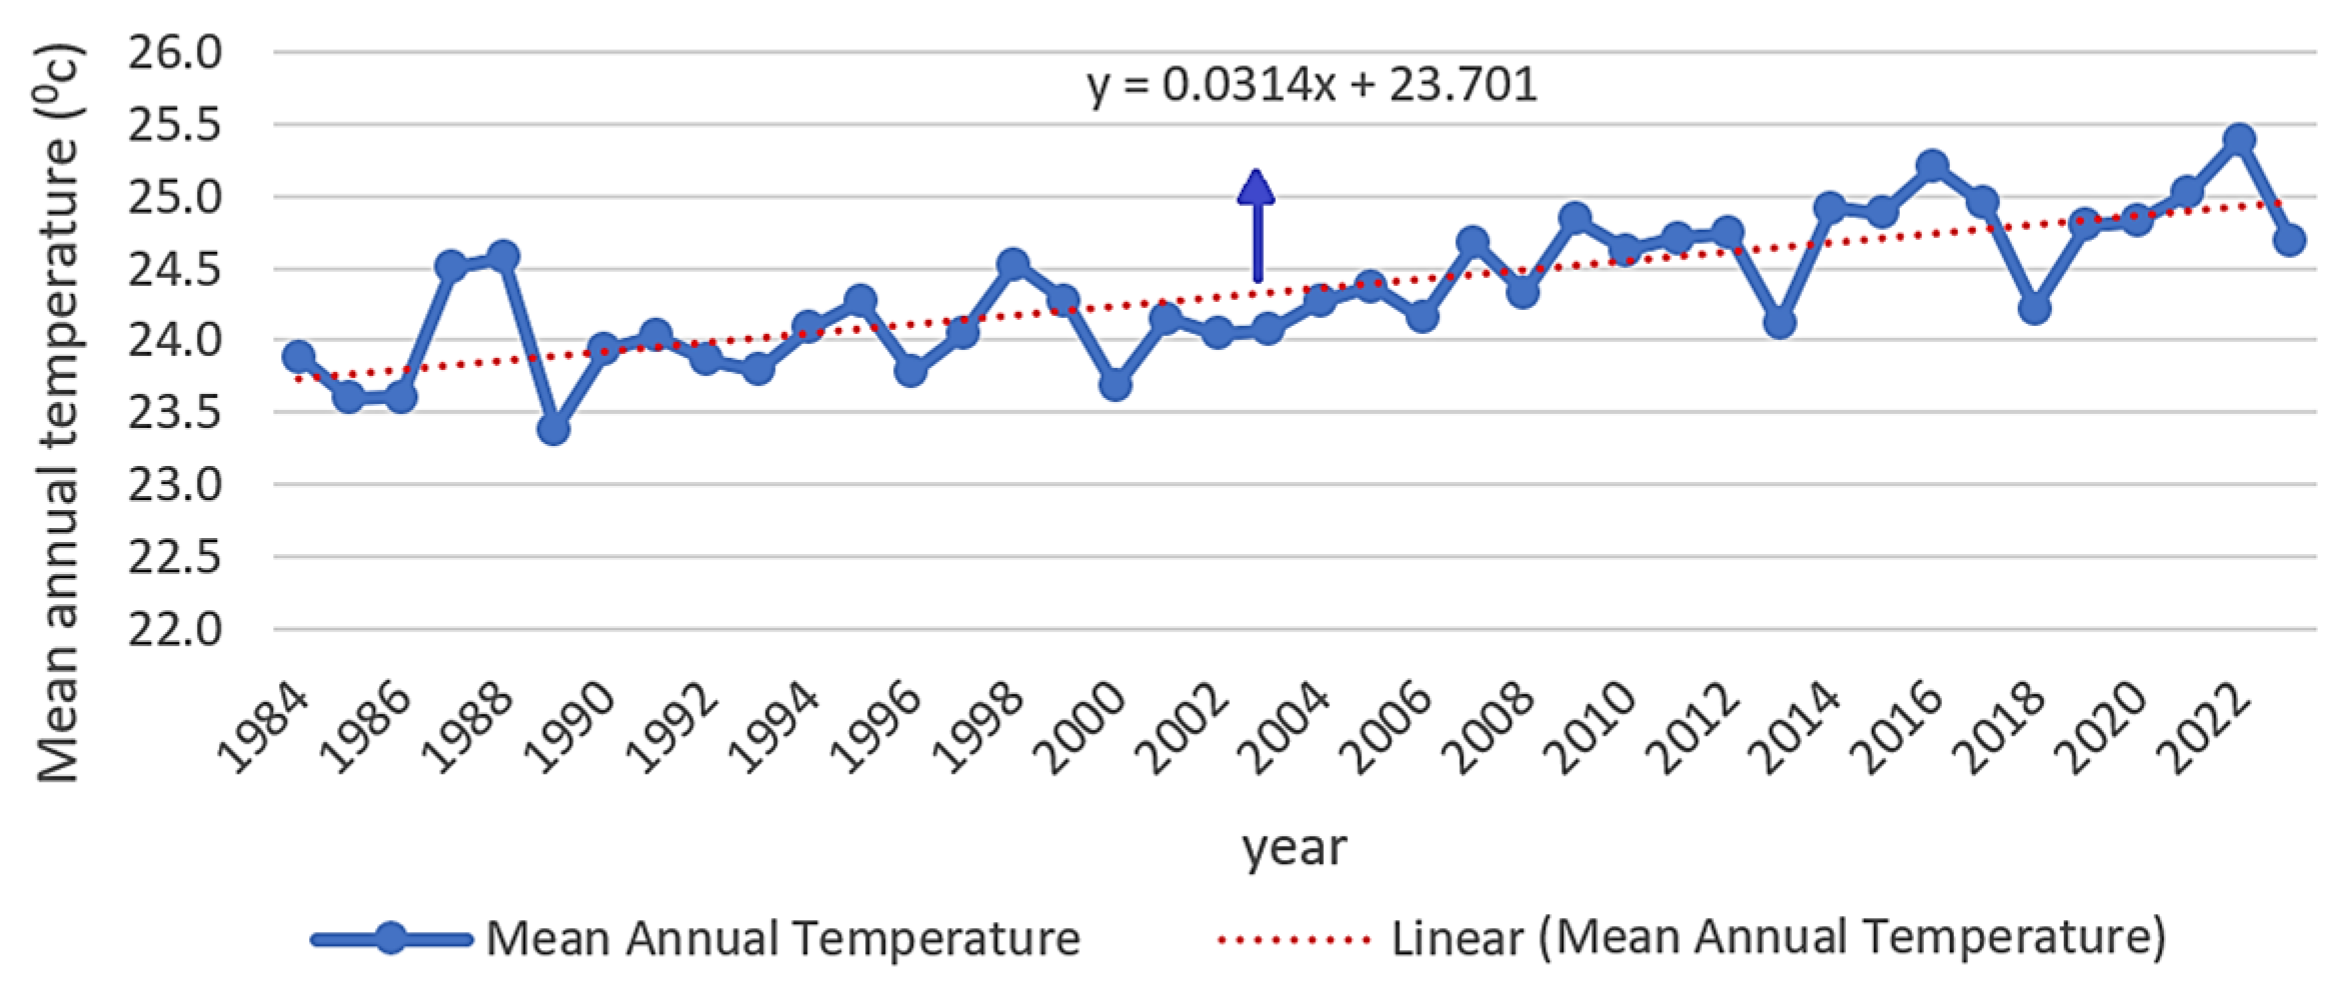
3.2.2. Trend and Variability of Temperature

The most significant consequence of global climate change is the rise in temperature. In this study, annual, monthly, and seasonal temperature data from 1984 to 2023 were analyzed to assess the variability and trends of temperature changes in the Sawena district (Table 5).
The Mann–Kendall trend analysis for temperature in Sawena district (1984–2023) reveals a consistent warming trend across most months and seasons. Significant increases in temperature are observed for January to October except March, with Kendall’s tau values indicating moderate to strong trends. September shows the highest warming rate (Sen’s slope = 0.049 °C/year), followed by June and August as indicated in Table 3.
However, March, September, and November displayed insignificant trends, with March showing a moderate rise but with an insignificant p-value of 0.116. November exhibited minimal change (p-value = 0.972), and December had a moderate but inconclusive upward trend (p-value = 0.064), suggesting some evidence of warming but not strong enough to confirm a definitive pattern.
In respect to seasons, as indicated in Table 5, winter, spring, summer, and autumn all exhibit significant warming trends in Sawena district. Winter temperatures rise by 0.026 °C/year, spring by 0.035 °C/year, summer experiences the strongest increase at 0.038 °C/year, and autumn follows with a 0.033 °C/year rise. These seasonal trends highlight the consistent warming across the district, reflecting the broader impact of climate change. The mean annual temperature also shows a strong and significant upward trend, indicating a steady annual temperature increase of 0.034 °C over the study period.
The coefficient of variation is generally low across the months, indicating stable temperature variations with its maximum (4.10%) and minimum (2.43%) variations recorded in April and January, respectively.
Overall, the temperature in Sawena district has increased significantly over the last four decades, with September showing the largest increase. Warming trends are especially pronounced during the winter, summer, and autumn seasons, while spring also exhibits moderate warming. The strong annual increase of 0.034 °C in the district suggests that climate change is having a noticeable impact, leading to warmer temperatures across all seasons. These findings may have important implications for agricultural practices, water resources, and general living conditions in the area, necessitating adaptive strategies to cope with rising temperatures. Figure 7 illustrates the winter season temperatures and Figure 8 illustrates the annual mean temperature trends in Sawena district.

3.3. Household Adaptation and Coping Strategies and Their Determinants

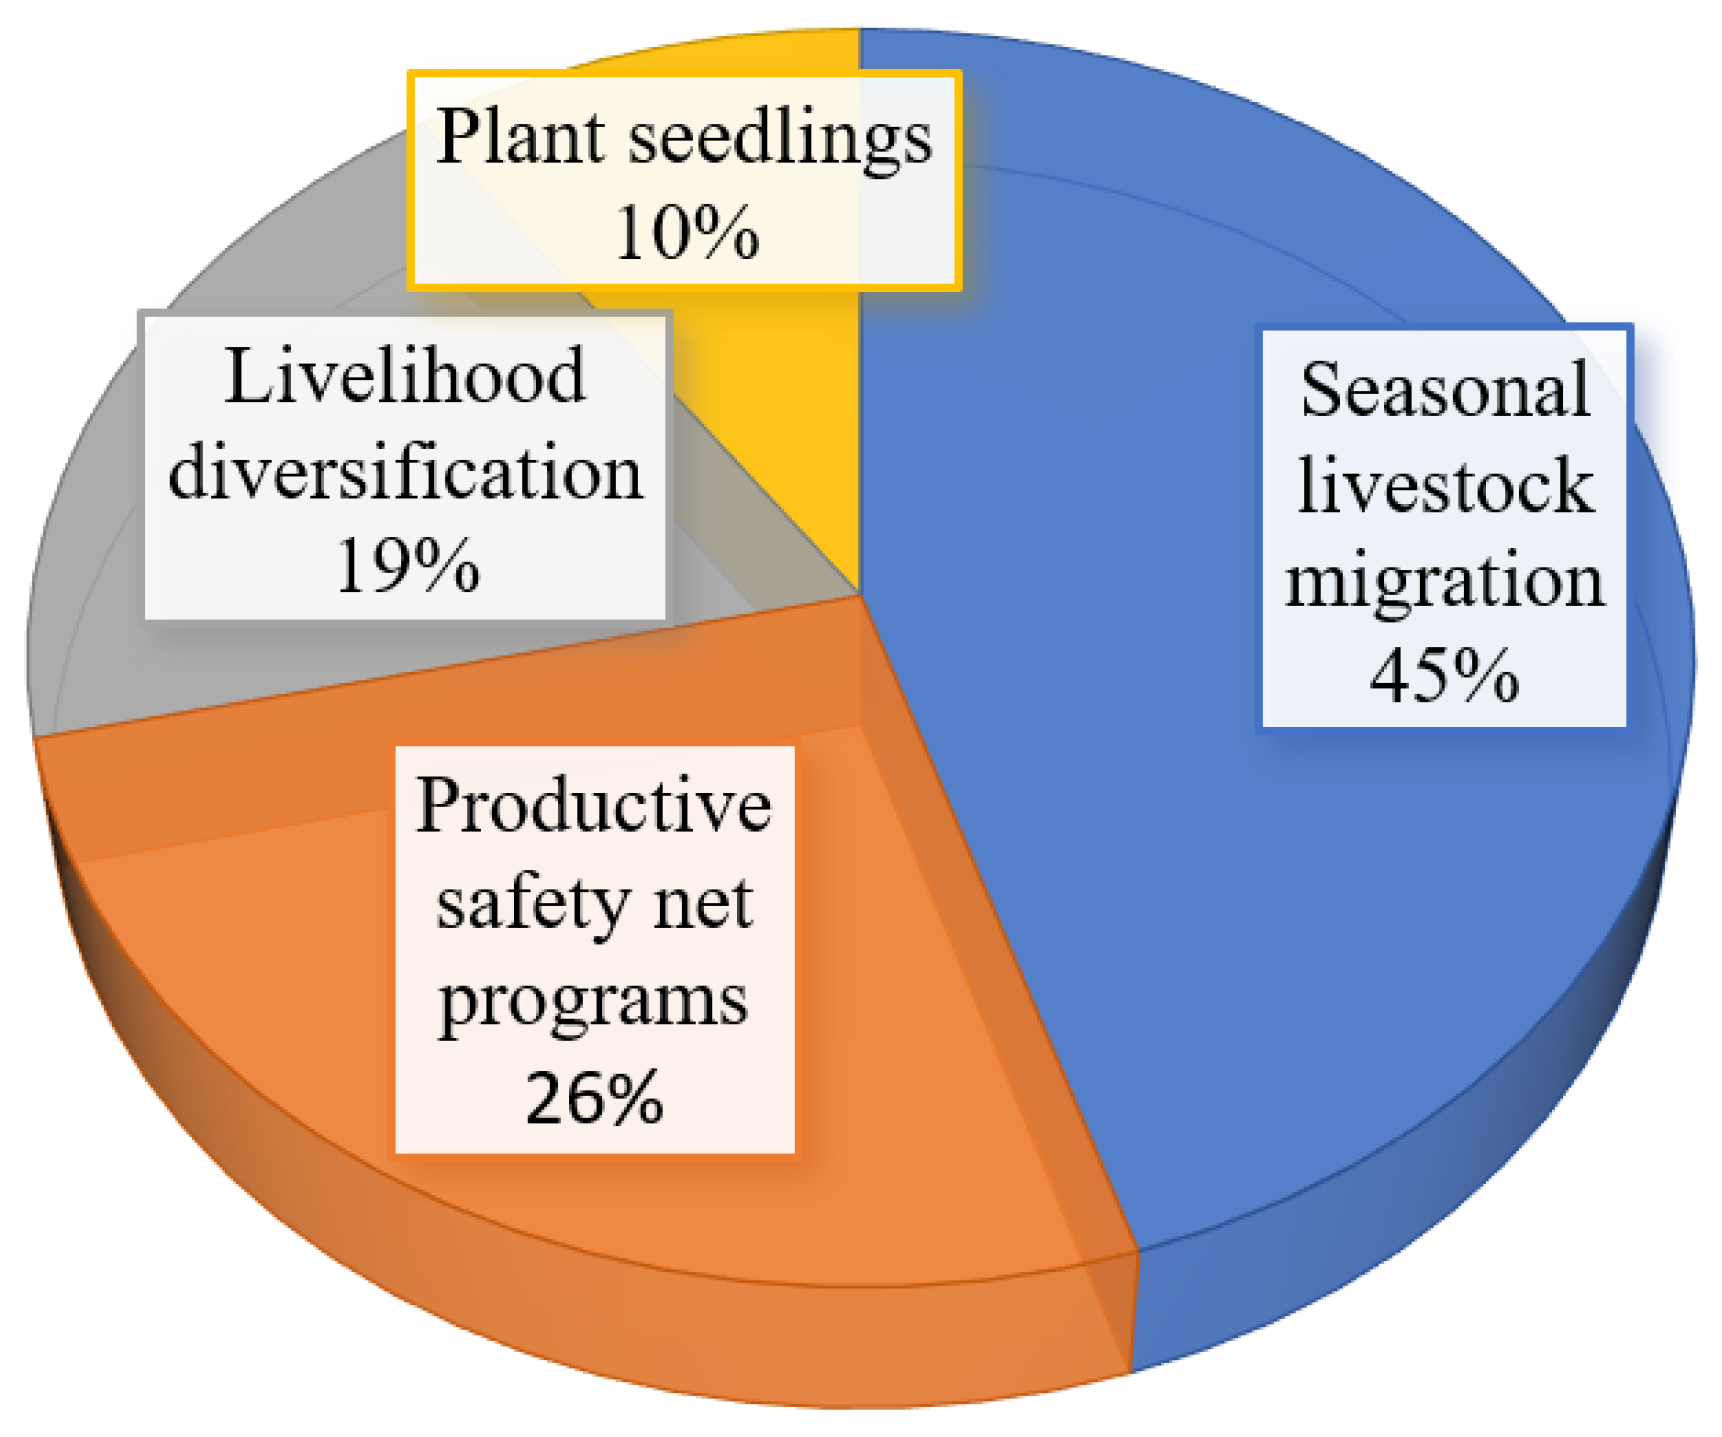
3.3.1. Household Adaptation and Coping Strategies Toward Climate Variability

The relationship between adaptation strategies and climate patterns in pastoralist areas is complex and multifaceted. Climate patterns, such as variations in rainfall and temperature changes, often shape pastoralists’ strategies, directly impacting pasture availability, water resources, and livestock health. To address these challenges, adaptation serves as a proactive approach that helps pastoralists secure their livelihoods, protect their environment, and build resilience against the impacts of climate change.
As the historical trends of rainfall and temperature (1984–2023) of Sawena district indicate, there are warming temperatures and declining rainfall in most months that lead the pastoralist household adaptation to climate variability. In Sawena district, in response to the perceived climate variability which has impacts on pastoralists’ production systems and livelihood strategies, several adaptation practices at household level are taken up to cope with or adapt to climate change and variability. The most common adaptation practices, and the proportion of respondents involved at the household level, are seasonal livestock migration, livelihood diversification, seedling planting, and productive safety net programs (PSNPs); these being the coping strategies that are presented in Figure 9.
Seasonal livestock migration (SLM) as adaptation strategy is the most commonly adopted strategy in the study area; 45.1% of respondents adapted these strategies. It represents a traditional adaptation strategy where pastoralists move their livestock to different grazing areas to manage environmental risks such as drought and resource competition.
Around 26.3% of respondents are involved in productive safety net programs (PSNPs), which provide support to vulnerable households in exchange for participation in community-based work or training. This suggests that a significant portion of the population relies on external aid to manage economic instability, likely reflecting issues such as poverty or climate vulnerability.
Nearly 19% of households have adopted livelihood diversification (LD), which involves seeking alternative income sources apart from livestock, such as small-scale farming, business, or wage employment. While this percentage is lower than migration and PSNP participation, it demonstrates a growing trend toward economic diversification as a resilience-building strategy.
Only 9.7% of respondents adopt plant seedling strategies (PSs), likely as part of agroforestry or reforestation efforts. Although less common, this strategy is important for long-term climate adaptation and land restoration, indicating an opportunity for increased awareness and support for sustainable land management practices.
There is a causal relationship between temperature and rainfall patterns and the strategies employed by pastoralist households in the study area. These strategies include adaptation strategies like seasonal livestock migration, livelihood diversification, and planting seedlings, as well as coping strategies like participation in the productive safety net program (PSNP).
Rising temperatures increase water scarcity, reduce pasture availability, and affect livestock health. This compels households to adapt strategies that mitigate heat stress and its impacts. For instance, the significant warming trend in Sawena district (e.g., 0.034 °C annual increase) has led to widespread seasonal livestock migration (45.1%). This strategy allows pastoralists to access cooler or more vegetated areas. Temperature rise also encourages livelihood diversification (19%) to reduce dependence on livestock, which is more vulnerable to heat stress. Initiatives to plant seedlings (9.7%) are an adaptation to mitigate the long-term effects of warming through soil restoration and shade creation.
Declining and erratic rainfall disrupts water availability and grazing patterns, leading to resource competition and reduced livestock productivity. Rainfall variability (e.g., 242% in January) necessitates seasonal livestock migration, enabling households to adapt to inconsistent pasture and water resources. Livelihood diversification becomes essential when pastoral activities fail due to erratic rainfall.
With regard to coping strategies, the declining trends in rainfall during critical dry months (e.g., January and February) have pushed households toward PSNP participation (26.3%) to offset food and income deficits. In addition, households may sell assets or borrow food during dry spells to cope with immediate rainfall deficits, particularly in highly variable months like January and February. During extreme heat events, households may reduce herd sizes or migrate to cooler areas temporarily, demonstrating reactive, short-term coping mechanisms.

3.3.2. Determinants of Household Adaptation and Coping Strategies

The study used a multivariate probit model to understand how households adapt to climate change in a specific area. It focused on common adaptation and coping strategies, like seasonal livestock migration (SLM), safety net programs (PSNPs), diversifying livelihoods (LDs), and planting seedlings (PS), assessing their frequency and importance in coping with climate stress. Key factors included household characteristics (age, sex, family size, and education), financial resources (credit and assets), and access to resources. The study also examined the effects of market distance, access to rangeland, and media exposure. The results in Table 6 show that out of the 11 factors tested, nine significantly influenced at least one of these adaptation strategies among pastoralist households.
Table 6 reveals that the multivariate probit model identifies the primary factor influencing the adaptation strategies of the pastoralist households in the study area as follows:
Age of the Household Head (AGE): Older heads are more likely to adopt seasonal livestock migration (by 3.5%), benefiting from their experience and knowledge. This aligns with [52]. However, their age negatively affects participation in safety net programs, reducing the likelihood by 0.1% due to potential physical limitations. This aligns with [53].
Education Level (EDUCH): Higher education levels improve decision-making, enabling households to adopt sustainable practices and diversify their livelihoods. Educated heads are 4% more likely to engage in seasonal migration and 3% more likely to participate in safety net programs, reducing dependence on pastoralism. Education also supports the adoption of new technologies and climate-resilient practices. This aligns with [52,53].
Additionally, higher education levels increase the adoption of livelihood diversification and the planting seedling by 2%. Education helps pastoralist households diversify their income by encouraging them to adopt new technologies, entrepreneurship, and off-farm jobs. The result aligns with [54]. A higher education level supports the adoption of sustainable practices, such as planting seedlings and using drought-resistant crops, which strengthens climate resilience and promotes better land management. This aligns with [55].
Access to credit (CREDIT) is essential for pastoralists, as it enables them to diversify their income by investing in alternative livelihood activities. Studies show that with increased credit access, the likelihood of adopting livelihood diversification rises by 5.4%, enhancing household income and overall well-being. This financial flexibility boosts resilience and promotes socioeconomic growth in pastoralist communities. This study supports [56].
The herd size (LIVEST) measured in the tropical livestock unit (TLU) plays a key role in pastoralist adaptation practices. A higher TLU increases the likelihood of seasonal livestock migration by 2.5%, helping to manage forage and water competition sustainably. This supports [57]. The TLU also supports livestock diversification, with a 3.6% increase, optimizing resource use and improving resilience in challenging climates. These strategies contribute to healthier grazing lands and better livelihoods for pastoralist households. The result aligns [58].
Asset Value (ASSET): Higher asset values decrease the likelihood of adopting seasonal migration (by 4.5%) and increase the chances of livelihood diversification (by 18%), reducing reliance on livestock and enhancing resilience to climatic and market fluctuations. This supports [52,59].
Access to Mass Media (MEDIA): Increased access to mass media raises the likelihood of households diversifying their livelihoods by 6%, helping them overcome barriers and seize opportunities. Additionally, exposure to various media platforms increases the adoption of seedling planting by 3%. Overall, mass media access strengthens community resilience and adaptive capacity, offering better livelihood options in the face of socio-economic and environmental challenges. The result aligns with [15,60].
Access to Extension Services (ACCT): This is crucial for pastoralist households, significantly enhancing the adoption of seasonal livestock migration strategies. Having access to these services increases the likelihood of adopting migration by 16%. This indicates that effective use of extension services can improve livelihoods, resilience, and sustainability in evolving rangeland ecosystems. This supports [15].
Distance to Nearest Market (DISMA): Greater distances negatively impact livelihood diversification (by 0.9%) and positively impact the adoption of seedlings planting (by 0.7%), highlighting the importance of market accessibility for pastoralists. This supports [61].
Access to Rangeland (RNGLD): Adequate access to rangeland is essential for adopting seasonal migration (increasing its likelihood by 47%) and reducing reliance on livestock. Limited access can promote livelihood diversification (by 64%) and negatively impact the adoption of sustainable practices. This aligns [52,62]. Additionally, access to rangeland adversely affects the adoption of seedling planting; a 1% increase in access to rangeland leads to a 20% reduction in the likelihood of planting. This reluctance may stem from land disputes or uncertainty over land ownership, highlighting the challenges pastoralists face in utilizing land resources effectively. This supports [63].

4. Discussion

Climate variability in this context pertains to changes in weather patterns like temperature and rainfall on a basis within their scope [64]. The study found that precipitation in the Sawena district between 1984 and 2023 exhibited increases during September through November with October showing the most notable rise in rainfall levels, over the years analyzed; though overall annual rainfall trends did not show significant shifts and other months displayed varying patterns without distinct trends. In January and February, there was an amount of variation noted with coefficients of variation reaching over 230%.
Research conducted in areas of Ethiopia shows notable changes in rainfall throughout the seasons [65,66] that align with the findings made in Sawena district. Furthermore, this pattern of change matches what has been seen in parts of East Africa where erratic rainfall affects the availability of water and forage [67,68]. These findings are consistent with what has been observed in arid regions where rain during the dry season shows significant variations over time. The fluctuations in climate difficulties for herders and the management of water resources require approaches to address the effects of climate change.
Temperature trends in Ethiopia indicate substantial annual and seasonal warming, often exceeding 0.03 °C per year, particularly during the dry season [48,66,69]. This trend aligns with observations in other East African pastoralist regions, notably in Kenya and Tanzania, where decades of consistent warming have occurred [70,71,72]. The temperature increase in Sawena reflects these broader regional patterns. Such rising temperatures, alongside shifting rainfall dynamics, pose significant challenges to Ethiopia’s livestock sector—an economic mainstay highly susceptible to climate variability. Pastoralists and agro-pastoralists are grappling with intensified heat stress, declining water availability, and reduced feed quality [69]. To address these impacts, adaptation strategies such as adopting drought-resistant livestock breeds are critical for sustaining livelihoods.
In Sawena district, households have adopted a range of strategies to combat climate variability, with seasonal livestock migration being the most prevalent (45.1%), reflecting its deep roots in pastoralist culture. This aligns with broader findings where seasonal migration is vital for adaptive grazing and mitigating environmental pressures, especially in regions with restricted mobility [69,70]. Such practices support resilience and climate adaptability, as observed in Kenya among the Maasai pastoralist systems [71,72]. Additionally, 26.3% of Sawena households rely on productive safety net programs for essential support, paralleling the experiences of Karrayu pastoralists in Ethiopia who use these programs to buffer against climate impacts [71].
Livelihood diversification, practiced by 19% of Sawena households, further bolsters resilience through activities like crop farming, trading, and adopting drought-resistant livestock such as camels, consistent with strategies noted by [69,70,73]. Planting seedlings, embraced by 9.7% of Sawena households, contributes to soil health and erosion prevention, echoing agro-pastoralist practices that include agroforestry, crop rotation, and organic manure use, which reinforce overall system sustainability. In the same way, key factors, such as age, education, credit access, livestock ownership, asset value, mass media access, extension services, market distance, and access to rangeland, influence adaptation strategies like seasonal migration, safety net participation, and livelihood diversification and seedling planting.

5. Conclusions and Policy Recommendations

5.1. Conclusions

The Sawena district experienced a mixed rainfall trend from 1984 to 2023, with significant increases only observed in specific months such as September, October, and November. Overall, there is no significant trend in annual rainfall, suggesting that the region experiences highly variable rainfall patterns, which may challenge livelihood activities of pastoralist and long-term planning for pastoral development activities. In contrast, temperature trends show a consistent and significant increase across all months and seasons, with the annual mean temperature rising at a statistically significant rate. This warming trend underscores the growing vulnerability of the district to the impacts of climate change.
The most common adaptation strategies in Sawena district are seasonal livestock migration, participation in PSNP, livelihood diversification, and seedling planting. The dominance of seasonal livestock migration adaptation strategies highlights the population’s reliance on traditional pastoralist systems, while growing participation in PSNP reveals vulnerability during climatic and economic stress. Moderate livelihood diversification indicates a gradual shift toward more stable income sources, reducing dependence on pastoralism. The low adoption of seedling planting suggests a gap in climate resilience efforts.
This study identified several key factors influencing the adoption of livelihood strategies in the Sawena district. Education consistently has a positive and statistically significant impact on all strategies. Access to credit (CREDT) positively influences livelihood diversification, while livestock ownership (LIVEST) and access to rangeland (RNGLD) have a significant positive effect on seasonal livestock migration. In the same way, distance to the market (DISMA) negatively affects livelihood diversification and seedling planting, indicating the challenges posed by market inaccessibility.

5.2. Policy Recommendations

This study proposes the following recommendations to enhance climate resilience and sustainable development, based on the analysis of rainfall, temperature trends, and livelihood strategies in the Sawena district.

5.2.1. Strengthen Climate Adaptation Strategies

Diversify Adaptation Measures: Promote integrated approaches to complement seasonal livestock migration, such as forage production, water harvesting technologies, and small-scale irrigation to reduce dependency on traditional pastoral systems.
Encourage Seedling Planting: Increase community awareness of and capacity-building programs promoting the benefits of tree planting and agroforestry as climate resilience measures. Provide incentives such as subsidized seedlings and technical support.
Increase the usefulness and coverage of the productive safety net program (PSNP) by adding climate risk reduction elements such as drought-tolerant crop varieties and community-based water storage facilities.

5.2.2. Improve Access to Resources and Services

Market Accessibility: Invest in rural infrastructure to reduce the distance to markets. Construct and maintain roads to enhance market linkages, allowing pastoralists to sell their products and access inputs easily.
Credit Availability: Strengthen financial services in rural areas by promoting microfinance institutions tailored to pastoral needs. Facilitate access to credit with flexible repayment schemes to encourage livelihood diversification.
Education and Training: Prioritize education initiatives targeting pastoral communities. Incorporate practical training programs focused on sustainable pastoralism, climate-smart practices, and entrepreneurial skills to empower households to adopt diverse livelihood strategies.

5.2.3. Address Temperature and Rainfall Variability

Climate Information Services: Establish community-based weather and climate information dissemination systems to help households plan their activities based on seasonal forecasts. Use local languages and participatory approaches to ensure inclusivity.
Rangeland Management: Develop policies that promote sustainable rangeland use, including rotational grazing systems and the rehabilitation of degraded lands through reseeding and soil conservation techniques.
Early Warning Systems: Strengthen existing early warning systems to provide timely alerts on climate-related risks such as droughts and floods, allowing pastoralists to make informed decisions.

Author Contributions

Conceptualization, M.B.G. and Z.B.; methodology, M.B.G.; software, M.B.G.; validation, M.B.G. and Z.B.; formal analysis, M.B.G. and Z.B.; investigation, M.B.G.; resources, M.B.G. and Z.B.; data curation, M.B.G.; writing—original draft preparation, M.B.G. and Z.B.; writing—review and editing, M.B.G. and Z.B.; visualization, M.B.G. and Z.B.; supervision, Z.B.; project administration, Z.B. All authors have read and agreed to the published version of the manuscript.

Funding

This research received no external funding.

Institutional Review Board Statement

Ethical review and approval were waived for this study as research data has been robustly anonymized, such that the original providers of the data cannot be identified, directly or indirectly, by anyone.

Informed Consent Statement

Informed consent was obtained from all subjects involved in the study.

Data Availability Statement

Data supporting the reported results are publicly accessible at https://www.meteoblue.com/en/historyplus [41], accessed on 31 October 2024, https://www.fao.org/food-agriculture-statistics/data [43], accessed on 10 September 2024, and https://climateknowledgeportal.worldbank.org/, [64], accessed on 31 October 2024.

Conflicts of Interest

The authors declare no conflicts of interest.

References

  1. Guye, M.H.; Abiyot, L.; Yimer, M. Existential threats to pastoralism in an arid environment: The fate of Gujii pastoralists in Southern Ethiopia. J. Degrad. Min. Lands Manag. 2023, 10, 4179–4190. [Google Scholar] [CrossRef]
  2. Ministry of Agriculture (MoA). Ethiopia Country Programming Paper to End Drought Emergencies in the Horn of Africa; Ministry of Agriculture: Addis Ababa, Ethiopia, 2012; pp. 1–26.
  3. IGAD Centre for Pastoral Areas and Livestock Development (ICPALD). Total Economic Valuation of Pastoralism in Ethiopia—Study Report; IGAD Centre for Pastoral Areas and Livestock Development: Nairobi, Kenya, 2020; pp. 1–27. [Google Scholar]
  4. Shapiro, B.I.; Gebru, G.; Desta, S.; Negassa, A.; Nigussie, K.; Aboset, G.; Mechale, H. Ethiopia livestock sector analysis: A 15-year livestock sector strategy. In ILRI Project Report; ILRI: Addis Ababa, Ethiopia, 2017. [Google Scholar]
  5. Abduletif, A.A. Benefits and challenges of pastoralism system in Ethiopia. Stud. Mundi-Econ. 2019, 6, 56–67. [Google Scholar]
  6. Salachna, A.; Marcol, K.; Broda, J.; Chmura, D. The Contribution of Environmental and Cultural Aspects of Pastoralism in the Provision of Ecosystem Services: The Case of the Silesian Beskid Mts (Southern Poland). Sustainability 2022, 14, 10020. [Google Scholar] [CrossRef]
  7. IGAD Centre for Pastoral Areas and Livestock Development (ICPALD). Policies and Proclamations Relevant to Pastoral Areas Land Management for Ethiopia, Kenya, and Uganda Review Report 2016; IGAD Centre for Pastoral Areas and Livestock Development: Nairobi, Kenya, 2017; pp. 1–52. [Google Scholar]
  8. Manzano, P.; Burgas, D.; Cadahía, L.; Eronen, J.T.; Fernández-Llamazares, A.; Bencherif, S.; Holand, Ø.; Seitsonen, O.; Byambaa, B.; Fortelius, M.; et al. Toward a holistic understanding of pastoralism. One Earth 2021, 4, 651–665. [Google Scholar] [CrossRef]
  9. Perley, C.J.K. Pastoral Agriculture in the Post-industrial Age: Building Functional Integrity and Realising Potential. Front. Sustain. Food Syst. 2021, 5, 552838. [Google Scholar] [CrossRef]
  10. Shibru, M.; Opere, A.; Omondi, P.; Gichaba, M. Understanding physical climate risks and their implication for community adaptation in the borana zone of southern Ethiopia using mixed-methods research. Sci. Rep. 2023, 13, 6916. [Google Scholar] [CrossRef]
  11. United Nations Office for the Coordination of Humanitarian Affairs (OCHA). Ethiopia: Drought Update. 2022. Available online: https://reliefweb.int/report/ethiopia/ethiopia-drought-update-no-4-june-2022 (accessed on 12 August 2024).
  12. Tofu, D.A.; Fana, C.; Dilbato, T.; Dirbaba, N.B.; Tesso, G. Pastoralists’ and agro-pastoralists’ livelihood resilience to climate change-induced risks in the Borana zone, south Ethiopia: Using resilience index measurement approach. Pastoralism 2023, 13, 4. [Google Scholar] [CrossRef]
  13. Gebremeskel, E.N.; Solomon Desta, S.; Kassa, G.K. Pastoral development in Ethiopia. In Trends and the Way Forward. Development Knowledge and Learning; World Bank and the International Fund for Agricultural Development (IFAD); World Bank: Washington, DC, USA, 2019; pp. 1–99. [Google Scholar]
  14. Federal Democratic Republic of Ethiopia (FDRE). Ethiopia’s Climate Resilient Green Economy, National Adaptation Plan; Federal Democratic Republic of Ethiopia: Addis Ababa, Ethiopia, 2019; pp. 1–162.
  15. Kemal, A.W.; Mohammed, A.A.; Lelamo, L.L. Pastoralists’ adaptation strategies to climate change and determinant factors in Korahey Zone, Ethiopia. Am. J. Clim. Chang. 2022, 11, 79–102. [Google Scholar] [CrossRef]
  16. Gebbisa, M.B.; Mulatu, G. Choice of Livelihood Strategies and Its Determinants in Pastoralist Area of Bale Zone: The Case of Sawena District, Oromia, South East Ethiopia. Open Access Libr. J. 2020, 7, e6737. [Google Scholar] [CrossRef]
  17. Fenetahun, Y.; Xinwen, X.; Yong-dong, W. Determinants of pastoral communities for adoption of forage production technology in Yabello rangeland, Southern Ethiopia. J. Ecol. Nat. Environ. 2019, 11, 108–114. [Google Scholar] [CrossRef]
  18. Mohamed, A.A. Pastoralism and development policy in Ethiopia: A review study. Bp. Int. Res. Crit. Inst. Humanit. Soc. Sci. 2019, 2, 1–11. [Google Scholar] [CrossRef]
  19. Meals, D.W.; Spooner, J.; Dressing, S.A.; Harcum, J.B. Statistical Analysis for Monotonic Trends. Tech Notes 6 for the U.S. Environmental Protection Agency. 2011. Available online: https://www.epa.gov/polluted-runoff-nonpoint-source-pollution/nonpoint-source-monitoring-technical-notes (accessed on 8 December 2024).
  20. Sudarsan, G.; Lasitha, A. Rainfall Trend analysis using Mann-Kendall and Sen’s slope test estimation—A case study. E3S Web Conf. 2023, 405, 04013. [Google Scholar] [CrossRef]
  21. Shah, S.A.; Kiran, M. Mann-Kendall test: Trend analysis of temperature, rainfall and discharge of Ghotki Feeder Canal in District Ghotki, Sindh, Pakistan. Environ. Ecosyst. Sci. 2021, 5, 137–142. [Google Scholar] [CrossRef]
  22. Jiqin, H.; Gelata, F.T.; Gemeda, S.C. Application of MK trend and test of Sen’s slope estimator to measure impact of climate change on the adoption of conservation agriculture in Ethiopia. J. Water Clim. Chang. 2023, 14, 977. [Google Scholar] [CrossRef]
  23. Frimpong, B.F.; Koranteng, A.; Molkenthin, F. Analysis of temperature variability utilising Mann–Kendall and Sen’s slope estimator tests in the Accra and Kumasi Metropolises in Ghana. Environ. Syst. Res. 2022, 11, 24. [Google Scholar] [CrossRef]
  24. Mekonnen, G.T.; Berlie, A.B.; Legesse, S.A.; Wubie, M.A. The implication of climate change in causing urban heat island in Gondar City, Ethiopia: An analysis made using Mann–Kendall’s trend test and homogeneity test. Arab. J. Geosci. 2023, 16, 638. [Google Scholar] [CrossRef]
  25. Hamed, K.H. Trend detection in hydrologic data: The Mann–Kendall trend test under the scaling hypothesis. J. Hydrol. 2008, 349, 350–363. [Google Scholar] [CrossRef]
  26. Blain, G.C. The Mann-Kendall test: The need to consider the interaction between serial correlation and trend. Acta Sci. 2013, 35, 393–402. [Google Scholar] [CrossRef]
  27. Wang, F.; Shao, W.; Yu, H.; Kan, G.; He, X.; Zhang, D.; Ren, M.; Wang, G. Re-evaluation of the Power of the Mann-Kendall Test for Detecting Monotonic Trends in Hydrometeorological Time Series. Front. Earth Sci. 2020, 8, 14. [Google Scholar] [CrossRef]
  28. Ashford, J.R.; Sowden, R.R. Multivariate probit analysis. Biometrics 1970, 26, 535–546. [Google Scholar] [CrossRef]
  29. Lin, C.-T.J.; Jensen, K.L.; Yen, S.T. Awareness of foodborne pathogens among US consumers. Food Qual. Prefer. 2005, 16, 401–412. [Google Scholar] [CrossRef]
  30. Ting, B.; Wright, F.; Zhou, Y.-H. Fast Multivariate Probit Estimation via a Two-Stage Composite Likelihood. Stat. Biosci. 2022, 14, 533–549. [Google Scholar] [CrossRef]
  31. Adugna, M.; Ketema, M.; Goshu, D.; Debebe, S. Market outlet choice decision and its effect on income and productivity of smallholder vegetable producers in Lake Tana basin, Ethiopia. Rev. Agric. Appl. Econ. 2019, 23, 83–90. [Google Scholar] [CrossRef]
  32. Inkoom, E.W.; Dadzie, S.K.N. Multivariate Probit Modeling of Climate-Smart Adaptation Choices among farmers in Sub-Saharan Africa: Ghanaian study of Cocoa farmers. Clim. Chang. Econ. 2024, 15, 245007. [Google Scholar] [CrossRef]
  33. GC, A.; Yeo, J.-H. Perception to Adaptation of Climate Change in Nepal: An Empirical Analysis Using Multivariate Probit Model. Sci 2020, 2, 87. [Google Scholar] [CrossRef]
  34. Mulwa, C.; Marenya, P.; Rahut, D.B.; Kassie, M. Response to climate risks among smallholder farmers in Malawi: A multivariate probit assessment of the role of information, household demographics, and farm characteristics. Clim. Risk Manag. 2017, 16, 208–221. [Google Scholar] [CrossRef]
  35. Debele, B.; Desta, G. Livelihood diversification: Strategies, determinants and challenges for pastoral and agro-pastoral communities of Bale Zone, Ethiopia. Int. Rev. Soc. Sci. Humanit. 2016, 11, 37–51. [Google Scholar]
  36. Taye, D. Impact of Climate Variability and Vulnerability on livelihood. J. Agric. Sci. Eng. Innov. 2022, 2, 18–27. [Google Scholar] [CrossRef]
  37. Desta, G.D.; Abshare, M.W.; Nicolau, M. Role of Highland–Lowland Linkage as a Coping Strategy for Global Environmental and Socioeconomic Changes: The Case of Southeast Ethiopia. Mt. Res. Dev. 2023, 43, R1–R10. [Google Scholar] [CrossRef]
  38. Oromia Planning and Economic Development Commission (OPEDC). Oromiya in Brief Part-XII. Oromia Planning and Economic Development Commission, Regional Socio-economic Profile Study and GIS Directorate, Finfinne. 2024. Available online: https://www.oromiaplan.gov.et/om/content/qoannoo (accessed on 10 February 2024).
  39. Eastern Bale Zone Planning and Economic Development Commission (EBZPEC). Physical and Socio-Economic Profile of Eastern Bale Zone; unpublished book; Eastern Bale Zone Planning and Economic Development Commission: Ginir, Ethiopia, 2022; pp. 1–32. [Google Scholar]
  40. Oromiya Pastoral Area Development Commission (OPADC). Livestock Production and Productivity Improvement Towards Pastoral Livelihood Enhancement in the Pastoral Areas of Oromia Region; unpublished report; Oromiya Pastoral Area Development Commission: Addis Ababa, Ethiopia, 2021; pp. 1–40.
  41. Meteoblue. Weather History Data Base. Available online: https://www.meteoblue.com/en/historyplus (accessed on 31 October 2024).
  42. Kothari, C.R. Research Methodology: Methods and Techniques, 2nd ed.; New Age International: Hong Kong, 2004. [Google Scholar]
  43. Food and Agricultural Organization (FAO). Food and Agricultural Statistics Data Series. Available online: https://www.fao.org/food-agriculture-statistics/data (accessed on 10 September 2024).
  44. Mann, H.B. Nonparametric tests against trend. Econom. J. Econom. Soc. 1945, 13, 245–259. [Google Scholar] [CrossRef]
  45. Kendall, M.G. Rank Correlation Methods, 4th ed.; Charles Griffin and Co., Ltd.: London, UK, 1975. [Google Scholar]
  46. Sneyers, R. On the Statistical Analysis of Series of Observations; World Meteorological Organization: Geneva, Switzerland, 1991; Volume 143, pp. 1–192. [Google Scholar]
  47. Sen, P.K. Estimates of the regression coefficient based on Kendall’s tau. J. Am. Stat. Assoc. 1968, 63, 1379–1389. [Google Scholar] [CrossRef]
  48. Sarkar, A.; Saha, S.; Sarkar, D.; Mondal, P. Variability and trend analysis of the rainfall of the past 119 (1901–2019) years using statistical techniques: A case study of Uttar Dinajpur, India. J. Clim. Chang. 2021, 7, 49–61. [Google Scholar] [CrossRef]
  49. Asfaw, A.; Simane, B.; Hassen, A.; Bantider, A. Variability and time series trend analysis of rainfall and temperature in northcentral Ethiopia: A case study in Woleka sub-basin. Weather Clim. Extrem. 2018, 19, 29–41. [Google Scholar] [CrossRef]
  50. Train, K.E. Discrete Choice Methods with Simulation, 2nd ed.; Cambridge University Press: Cambridge, UK, 2009; pp. 1–343. [Google Scholar]
  51. Cappellari, L.; Jenkins, S.P. Multivariate probit regression using simulated maximum likelihood. STATA J. 2003, 3, 278–294. [Google Scholar] [CrossRef]
  52. Dai, X.; Li, B.; Zheng, H.; Yang, Y.; Yang, Z.; Peng, C. Can sedentarization decrease the dependence of pastoral livelihoods on ecosystem services? Ecol. Econ. 2023, 203, 107612. [Google Scholar] [CrossRef]
  53. Tadesse, T.; Gebremedhin Zeleke, T. The impact of the productive safety net program (PSNP) on food security and asset accumulation of rural households’: Evidence from Gedeo zone, Southern Ethiopia. Cogent Econ. Financ. 2022, 10, 2087285. [Google Scholar] [CrossRef]
  54. Sun, Q.; Fu, C.; Bai, Y.; Oduor, A.M.O.; Cheng, B. Livelihood diversification and residents’ welfare: Evidence from Maasai mara national reserve. Int. J. Environ. Res. Public Health 2023, 20, 3859. [Google Scholar] [CrossRef]
  55. Tiwari, A. Strategies to Strengthen Plant Breeding Status in India. In Commercial Status of Plant Breeding in India; Springer: Singapore, 2020; pp. 91–127. [Google Scholar] [CrossRef]
  56. Balense, A.; Debebe, S. Analysis of Income Diversification and Livelihood Strategies Among Pastoral and Agro-pastoral Households in Southern Ethiopia. J. Investig. Manag. 2020, 9, 72–79. [Google Scholar] [CrossRef]
  57. Hufana-Duran, D.; Duran, P.G. Animal reproduction strategies for sustainable livestock production in the tropics. IOP Conf. Ser. Earth Environ. Sci. 2020, 492, 012065. [Google Scholar] [CrossRef]
  58. Watete, P.W.; Makau, W.K.; Njoka, J.T.; Opiyo, L.A.M.; Mureithi, S.M. Are there options outside livestock economy? Diversification among households of northern Kenya. Pastoralism 2016, 6, 3. [Google Scholar] [CrossRef]
  59. Naod, E.; Addisu Legesse, S.; Tegegne, F. Livestock diversification prospects for climate change adaptation in Dangila district, Ethiopia. Trop. Anim. Health Prod. 2020, 52, 1435–1446. [Google Scholar] [CrossRef] [PubMed]
  60. Javaid, U. Role of mass media in promoting agricultural information among farmers of district nankana. Pak. J. Agric. Sci. 2017, 54, 711–715. [Google Scholar] [CrossRef]
  61. Ewalo, W.; Vedeld, P. Climate change in the Sidama region, Ethiopia: Linking perceptions and adaptation. GeoJournal 2023, 88, 5775–5793. [Google Scholar] [CrossRef]
  62. Habib, N.; Ariyawardana, A.; Aziz, A.A. The influence and impact of livelihood capitals on livelihood diversification strategies in developing countries: A systematic literature review. Environ. Sci. Pollut. Res. 2023, 30, 69882–69898. [Google Scholar] [CrossRef]
  63. Hardegree, S.P.; Jones, T.A.; Roundy, B.A.; Shaw, N.L.; Monaco, T.A. Assessment of range planting as a conservation practice. Rangel. Ecol. Manag. 2016, 69, 237–247. [Google Scholar] [CrossRef]
  64. World Bank Group (WBG). World Bank, Climate Change Knowledge Portal. Available online: https://climateknowledgeportal.worldbank.org/ (accessed on 31 October 2024).
  65. Gashaw, T.; Wubaye, G.B.; Abeyou, W.; Worqlul, A.W.; Dile, Y.T.; Mohammed, J.A.; Birhan, D.A.; Tefera, G.W.; van Oel, P.R.; Haileslassie, A.; et al. Local and regional climate trends and variabilities in Ethiopia: Implications for climate change adaptations. Environ. Chall. 2023, 13, 100794. [Google Scholar] [CrossRef]
  66. Belay, A.; Demissie, T.; Recha, J.W.; Oludhe, C.; Osano, P.M.; Olaka, L.A.; Solomon, D.; Berhane, Z. Analysis of climate variability and trends in Southern Ethiopia. Climate 2021, 9, 96. [Google Scholar] [CrossRef]
  67. Gebrechorkos, S.H.; Hülsmann, S.; Bernhofer, C. Long-term trends in rainfall and temperature using high-resolution climate datasets in East Africa. Sci. Rep. 2019, 9, 11376. [Google Scholar] [CrossRef]
  68. Nicholson, S.E. Climate and climatic variability of rainfall over eastern Africa. Rev. Geophys. 2017, 55, 590–635. [Google Scholar] [CrossRef]
  69. Abrham, T.; Mekuyie, M. Effects of climate change on pastoral households in the Harshin District of the Somali Region, Ethiopia. Jàmbá-J. Disaster Risk Stud. 2022, 14, 1202. [Google Scholar] [CrossRef]
  70. Gudere, A.; Ndunda, E.; Wemali, E. Analysis of Temporal Rainfall and Temperature Trends in Marsabit County, Kenya. East Afr. Agric. For. J. 2023, 87, 74–82. [Google Scholar]
  71. Kedir, H.; Tekalign, S. Climate variability and livelihood strategies pursued by the pastoral community of the karrayu people, Oromia region, Central Ethiopia. East Afr. J. Sci. 2016, 10, 61–70. [Google Scholar]
  72. Ndesanjo, R.B.; Theilade, I.; Nielsen, M.R. Pathways to Enhance Climate Change Resilience among Pastoral Households in Northern Tanzania. In African Handbook of Climate Change Adaptation; Springer International Publishing: Cham, Switzerland, 2021; pp. 2591–2609. [Google Scholar]
  73. Bobadoye, A.O.; Ogara, W.O.; Ouma, G.O.; Onono, J.O. Pastoralist perceptions on climate change and variability in Kajiado in relation to meteorology evidence. Acad. J. Interdiscip. Stud. 2016, 5, 37–46. [Google Scholar] [CrossRef]
Figure 1. Map of the study area. Source: authors’ own construction.
Applsci 15 00069 g001
Figure 2. Trend of winter season rainfall.
Applsci 15 00069 g002
Figure 3. Trend of spring season rainfall.
Applsci 15 00069 g003
Figure 4. Trend of Summer season rainfall.
Applsci 15 00069 g004
Figure 5. Trend of autumn season rainfall.
Applsci 15 00069 g005
Figure 6. Trend of annual rainfall in Sawena district.
Applsci 15 00069 g006
Figure 7. Trend of winter season temperature.
Applsci 15 00069 g007
Figure 8. Trend of mean annual temperature.
Applsci 15 00069 g008
Figure 9. The most common adaptation and coping strategies of households in Sawena district. Source: authors’ own computation.
Applsci 15 00069 g009
Table 1. Household sample respondents at kebele level.
Name of KebelesTotal HouseholdSample Household
Arda Gelma70864
Arele54049
Boditi36533
Burka Daro48544
Dolcha71565
Mica105895
Total3871350
Source: authors’ own computation based on data from [38].
Table 2. Adaptation and coping strategies of study area.
SNStrategiesCategoriesReasoning
1Seasonal Livestock MigrationAdaptation strategiesTraditional, long-term practice to manage climatic variability sustainably.
2Productive Safety Net Programs (PSNPs)Coping strategiesShort-term relief to address immediate climate shocks (e.g., climate variability such as drought).
3Livelihood DiversificationAdaptation strategiesLong-term approach to reduce climate risks by diversifying income sources.
4Seedling PlantingAdaptation strategiesForward-looking environmental strategy for resilience and land restoration.
Table 3. Descriptive statistics.
I. Dummy VariablesNumber of Responses% of
Responses
Number of
Responses
% of
Responses
MaleFemale
1Sex (SEX)24068.611031.4
Not accessibleAccessible
2Access to credit (CREDIT)21260.613839.4
3Access to mass media (MEDIA)7022.327277.7
4Access to veterinary extension services (ACCT)23767.711332.3
5Access to rangeland (RNGLD)8223.426876.6
II. Quantitative variablesMeanMaximumMinimumStd. dev.
6Age of the household head (AGE)44822013.02
7Total family size in the household (FAMSZ)81702.73
8Education status of the household head (EDUCH)21002.33
9Tropical livestock unit of holding (LIVEST)76534.72
10Asset value in USD (ASSET)315510,0094861646
11Distance from nearest market in km (DISMA)15.3460.0216.72
12Annual rainfall in mm371.4652172102.2
13Annual temperature in °C23.425.3923.370.478
Table 4. Mann–Kendall trend analysis of rainfall in Sawena district (1984–2023).
ItemMean Annual RFStd. DeviationCoefficient of VariationKendall’s TauMK-Statistic (S)p-ValueSen’s Slope
Month
January2.746.620242.05−0.072−510.5460.000
February5.9313.777232.22−0.018−120.8920.000
March31.3433.716107.570.041320.7180.136
April41.0438.49938.100−0.062−480.584−0.302
May58.6732.69555.720−0.062−480.584−0.351
June7.5310.150134.66−0.083−650.456−0.035
July12.7110.90385.780−0.012−90.926−0.008
August9.129.754106.980.090700.4210.067
September61.9012.397104.170.108840.034 **0.096
October44.8041.64392.9530.3152460.004 *1.284
November75.2742.04555.8530.2161180.047 **0.072
December10.3317.227166.80−0.153−1610.173−0.975
Season
Winter18.9924.077126.75−0.159−1240.152−0.129
Spring191.0661.62632.253−0.105−820.345−1.044
Summer29.3616.58856.4900.064500.5680.117
Autumn131.9776.34057.8430.2081620.041 **1.935
Annual371.40102.21427.5210.062480.4490.653
Source: own computation; ** and * indicate 5% and 1% levels of significance, respectively.
Table 5. Mann–Kendall trend analysis of temperature in Sawena district (1984–2023).
ItemMeanStd. DeviationCoeff. of VariationKendall’s TauMK Statistic (MKS)p-ValueSen’s Slope
Month
January24.490.5962.4320.3622820.001 *0.025
February25.690.6752.6250.3923060.000 *0.026
March25.691.0193.9670.1741360.1160.022
April23.940.9834.1070.2622040.018 *0.035
May24.010.9323.8800.2972320.007 *0.033
June24.850.9543.8380.3722900.000 *0.042
July23.880.8133.4040.3052380.006 *0.035
August24.420.7333.0030.4183260.000 *0.039
September25.390.7843.0890.5154020.000 *0.049
October23.350.8943.8300.3002340.007 *0.036
November22.790.8923.9130.00540.9720.001
December23.590.8483.5940.2051600.0640.021
Season
Winter24.590.4651.8920.4823760.001 *0.026
Spring24.550.7383.0060.3312580.003 *0.035
Summer24.380.6892.8260.4443460.000 *0.038
Autumn23.840.6762.8360.3853000.000 *0.033
Annual24.340.4781.9660.6034920.000 *0.034
Source: own computation, * indicates a 1% level of significance.
Table 6. The results of the multivariate probit analysis.
VariablesSLMPSNPLDPS
Coefficientp-ValueCoefficientp-ValueCoefficientp-ValueCoefficientp-Value
SEX−0.090.1110.050.3550.040.2290.0750.937
AGE0.0350.025 **−0.0010.035 **0.0040.816−0.0480.654
FAMSZ0.020.116−0.010.21−0.010.1820.0080.584
EDUCH0.040.00 *0.030.001 *0.020.001 *0.020.001 *
CREDT−0.010.786−0.050.3140.0540.049 **0.060.09
LIVEST0.0250.05 **−0.000.4960.0360.008 *−0.0840.815
ASSET−0.0450.00 *0.0350.7690.1800.023 **0.0010.501
MEDIA−0.020.6930.010.9250.060.046 **0.030.045 **
ACCT0.160.005 *−0.120.27−0.030.254−0.450.925
DISMA−0.320.5420.0820.567−0.0090.00 *0.0070.00 *
RNGLD0.470.00 *0.370.25−0.640.00 *−0.200.00 *
Constant−0.050.7170.220.1050.670.00 *0.160.081
Source: own computation, ** and * indicate 5% and 1% levels of significance, respectively.
Disclaimer/Publisher’s Note: The statements, opinions and data contained in all publications are solely those of the individual author(s) and contributor(s) and not of MDPI and/or the editor(s). MDPI and/or the editor(s) disclaim responsibility for any injury to people or property resulting from any ideas, methods, instructions or products referred to in the content.

