Abstract
This study presents a novel approach to FTIR spectroscopy at low temperatures under atmospheric pressure. The work aimed to confirm the efficiency of a fundamentally new cryogenic setup that enables material research under the specified conditions. The new technique combines a nitrogen-based cryogenic capillary cooling system with precise temperature monitoring via a PID controller, along with DRIFT spectroscopy for hydrocarbon materials. New fundamental data were obtained on the properties and behavior of hydrocarbon compounds such as methanol, kerosene, and ethanol. The IR spectra of these samples contain key characteristic vibrations of hydrocarbon functional groups, which demonstrate the effective operability of the cryogenic device. A detailed description of the setup and measurement technique is provided, along with a thorough comparison of the results with data from other authors. The application scope of the cryogenic device, the relevance of the research, and potential future developments are also discussed.
Keywords:
FTIR; cryogenic; hydrocarbon; atmospheric pressure; low temperature; methanol; kerosene; ethanol; spectroscopy 1. Introduction
Since the creation of spectroscopy direction and its technologies, allowing research materials using spectroscopic methods at low temperatures, the whole process has always been accompanied by vacuum formation. Otherwise, it would be difficult to study the nanostructure [1,2], molecular composition [3,4] and physical, chemical, thermal, and optical properties [5,6,7] of a substance due to the presence of moisture and other impurities in the ambient atmosphere that prevent high-quality research and substance analysis by any of the spectroscopic methods, including FTIR [8,9,10,11].
Low-temperature research of materials [12], including hydrocarbon compounds, which implies using IR spectroscopy, involves the presence of ultra-low pressure, i.e., vacuum. On account of this, high-quality fundamental research on the hydrocarbon substances’ optical properties under atmospheric pressure is still not popular since this situation is associated with a number of problems, such as developing complexity, maintaining and further upgrading technologies for spectroscopic study that allow achieving low temperatures at atmospheric pressure, the complexity of creating an inert or IR-inactive environment [13,14] that would help to achieve accuracy due to the low noise level of spectra and high radiation intensity, and also the lack of developed accurate step-by-step methodology of research.
There are few technologies worldwide for studying hydrocarbon substances at low temperatures and atmospheric pressure. Although some studies [15,16,17,18,19] report spectroscopic experiments under these conditions, scientific research in this area remains limited due to the challenges mentioned earlier. We propose a technology for FTIR spectroscopy of hydrocarbon fuels at atmospheric pressure and cryogenic temperatures (80 K), offering solutions to these challenges in non-vacuum environments.
This article presents an experimental setup: a cryogenic-capillary system with low-temperature cell and corresponding measurement technique. This system enables the acquisition of novel fundamental data on the properties and behavior of hydrocarbon materials at low temperatures and atmospheric pressure—data that can significantly advance high-quality research in this area. In particular, it provides insights into molecular behavior under these conditions, which can support the development of more accurate and efficient technological equipment. Also, this work can contribute to information replenishment as fundamental spectral data of hydrocarbons at low temperatures for overall study of extraterrestrial ices being conducted by many scientists from various space missions launched by Nasa, ESA, etc. This new device and measurement technique can be used in the engineering sphere as a new method and technology for obtaining fundamental data about the behavior of hydrocarbon compounds under specific conditions.
Their spectra are compared with those reported by other researchers [20,21,22,23,24,25,26,27,28] to validate the performance and efficiency of the proposed technique and setup, which is the aim of this work. The results of our research and obtained spectra confirm the efficiency of our developed device.
2. Materials and Methods
2.1. Spectrometer Configuration: Experimental Design and Modification
To achieve reliable results in low-temperature spectroscopic studies of hydrocarbon substances under atmospheric pressure, we carry out experiments using a cryogenic capillary setup equipped with a low-temperature measurement cell. For precise spectroscopic data on hydrocarbons, we utilize a high-accuracy mid-infrared Fourier spectrometer FSM 2203 manufactured by “Infraspec,” (Saint Petersburg, Russia) offering a spectral resolution of 0.125 cm−1 within the 370–7800 cm−1 range with a DTGS detector and supplied with a diffuse reflection accessory. Each spectrum was averaged over 64 shots. The spectrometer chamber was being continuously blown with gaseous nitrogen to maintain an IR-inactive environment.
To perform low-temperature diffuse reflection spectroscopy under atmospheric pressure, it was necessary to design a setup capable of studying hydrocarbon materials in these conditions. A key aspect of this system is the ability to regulate the sample’s temperature within the diffuse reflection accessory (Figure 1), where the sample is placed in the cuvette chamber of the spectrometer. A critical feature is the capacity to cool the sample down to 80 K, enabled by the structural modifications we have made. The diffuse reflection technique requires minimal sample preparation and is suitable for analyzing uneven surfaces and a variety of coatings, such as polymers. The attachment can also be used to measure solid samples that have been previously pestled or ground. Additionally, this approach enables spectral analysis over a wide range, providing a notable benefit compared to conventional transmission methods, especially in cases where it is impossible to study with transmission.
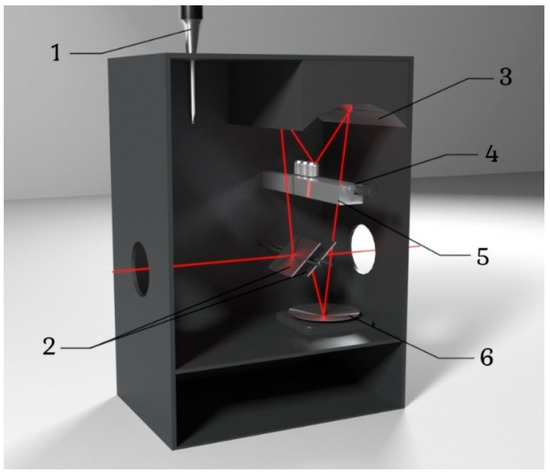
Figure 1.
Schematic representation of the diffuse reflection attachment: 1—micrometer screw; 2—double-sided flat mirror; 3—elliptical mirror; 4—retractable sample holder; 5—directive; 6—spherical mirror.
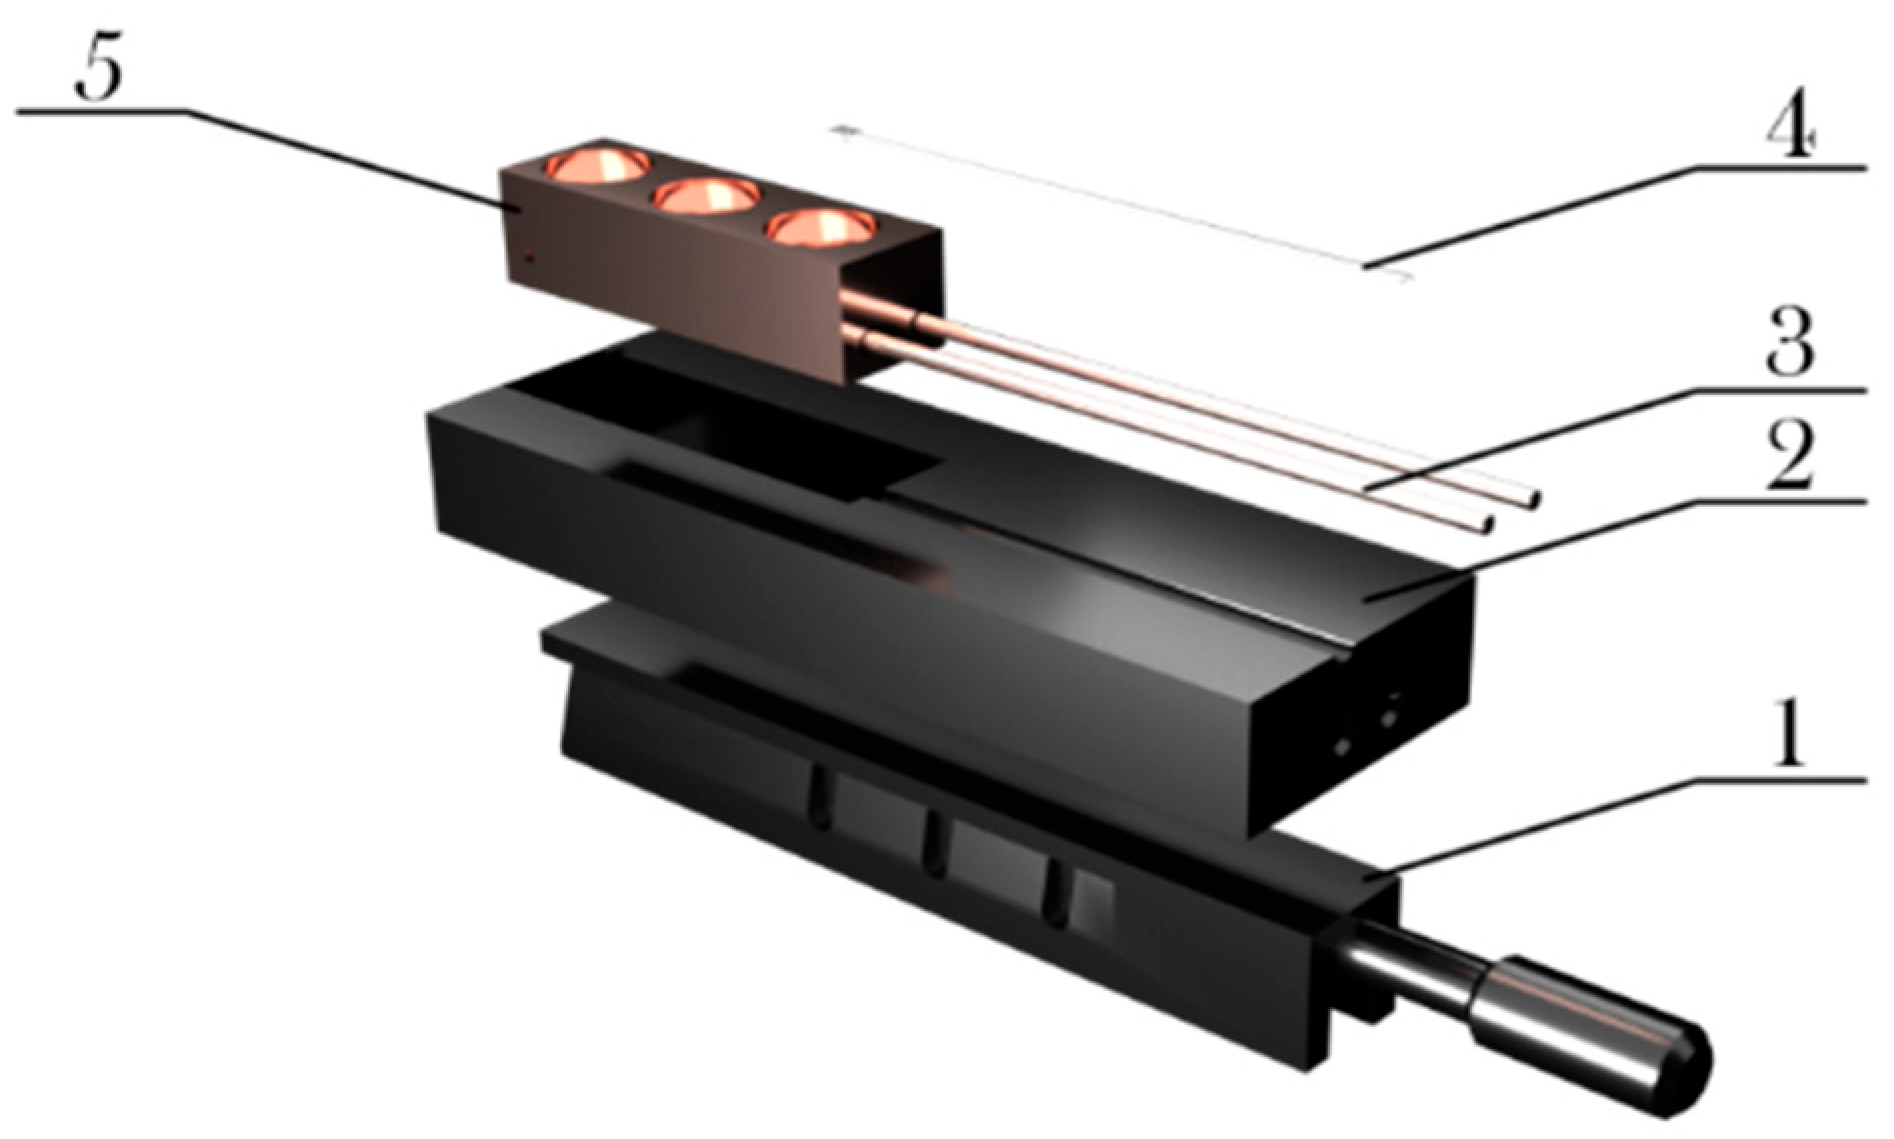
To enable cooling of the test sample within the cell of the retractable holder in this accessory, a custom modification was developed based on the standard sample holder (Figure 2). The improved holder is constructed from two main materials: copper and polylactide. These materials were selected for specific parts of the holder due to their distinct thermal conductivity characteristics. Polylactide, which has a thermal conductivity between approximately 0.11 and 0.19 W/m*K, is used to minimize the influence of ambient temperature on both the copper rod and the samples placed inside the measuring cells.

Figure 2.
Three-dimensional model of modernized specialized retractable sample holder, disassembled. 1—holder handle, 2—heat insulating cover of the holder, 3—cryogenic capillary system, 4—temperature sensor (thermocouple), 5—container.
The rod containing cylindrical recesses (cells) for placing samples (Figure 2, item 5) is made of copper, a material known for its excellent thermal conductivity, to ensure quick and uniform temperature distribution supplied by the cryogenic capillary system. The cryogenic capillary system (Figure 2, item 3) is likewise made of copper for the same purpose.
The cooling of test samples to 80 K is achieved by a continuous flow of liquid and gaseous nitrogen through the copper tubing of the cryogenic capillary system. The efficient thermal contact between the copper tube, the copper bar, and the sample cells—combined with copper’s high thermal conductivity—ensures rapid cooling of the material under investigation (such as hydrocarbons) to the target temperature. To drive nitrogen through the copper tubing, high pressure is generated by heating it in a dedicated Dewar vessel. This heating forces the nitrogen out of the vessel and into the capillary system, thereby cooling the samples. The temperature of the copper bar is tracked using a thermocouple fixed to its surface, which is monitored by a LakeShore 325 PID controller (Figure 2, item 4). Warming the samples is carried out by using a power heater and its cables attached to the bar.
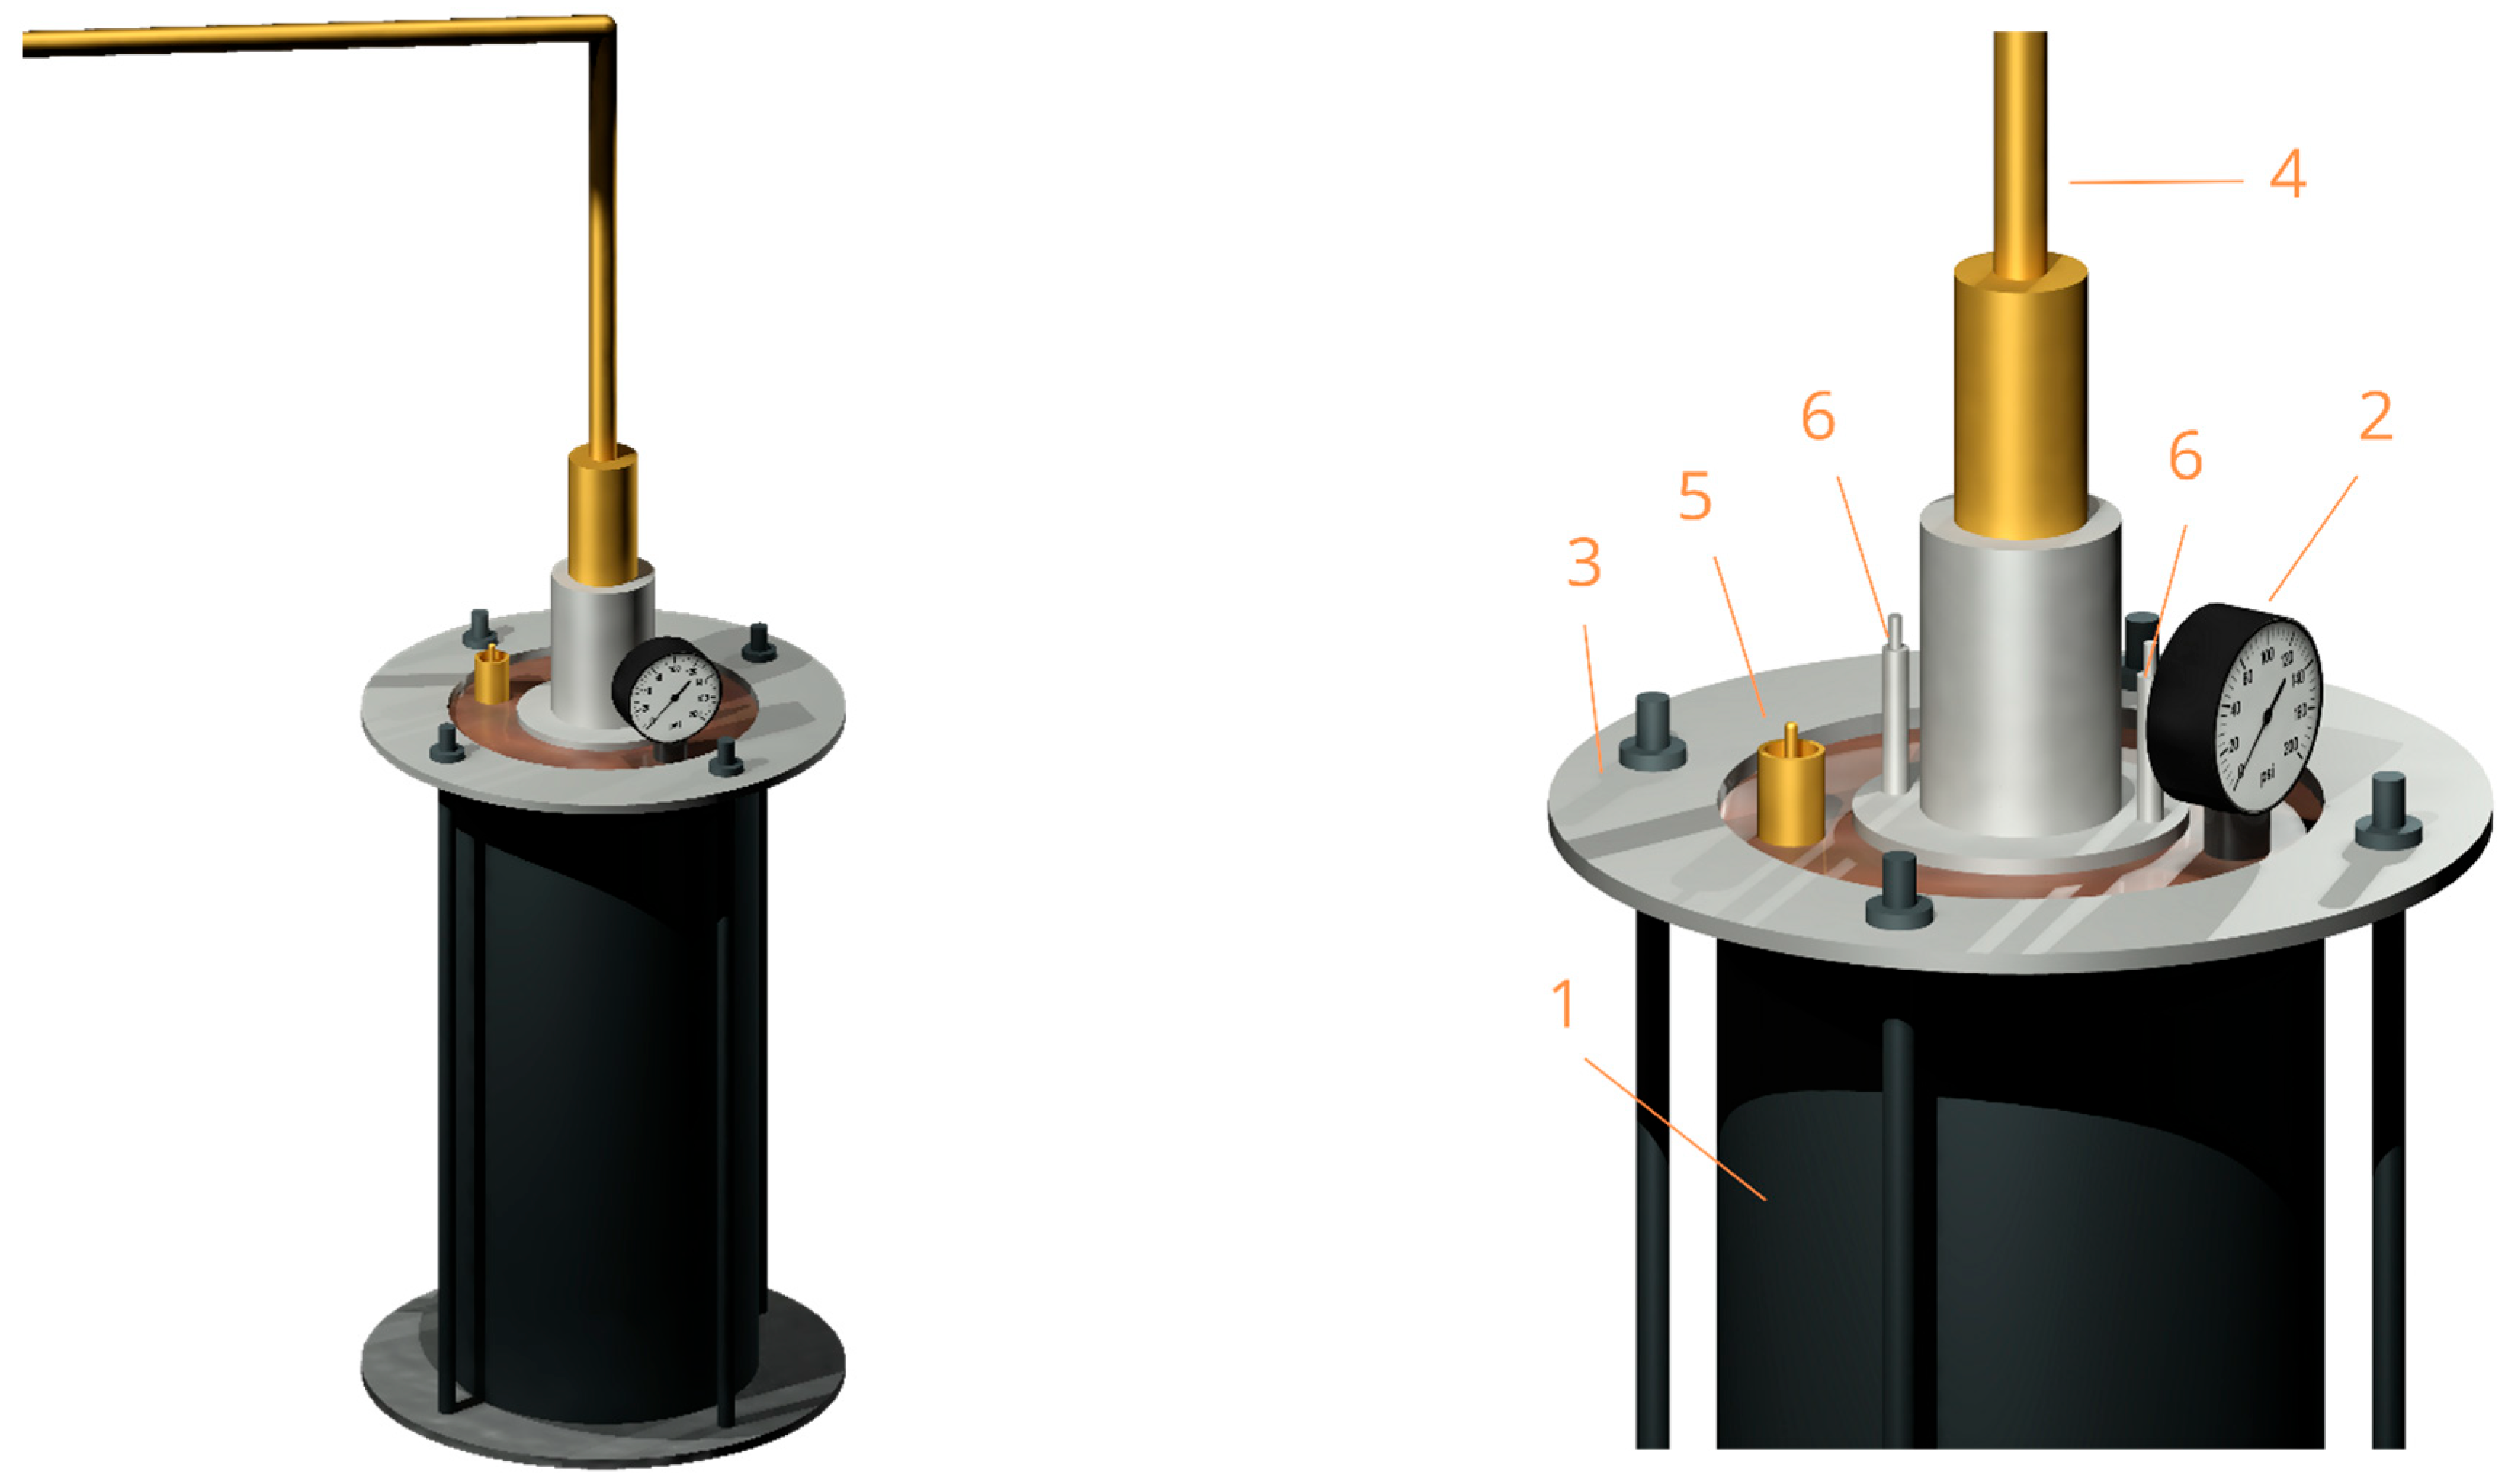
The cryogenic capillary system is linked to the previously mentioned Dewar vessel using a hermetically sealed fastening mechanism (Figure 3). This setup is designed to deliver and maintain the cooling of samples at atmospheric pressure within the low-temperature cell, using the continuous circulation of liquid and gaseous nitrogen at 80 K through copper capillaries. The system includes a Dewar vessel (vacuum flask) (Figure 3, item 1), a pressure gauge (Figure 3, item 2), a sealing fastening unit (Figure 3, item 3), a copper capillary (Figure 3, item 4), a check valve (Figure 3, item 5) to prevent excessive pressure buildup inside the flask, and electrical contacts for clamps (Figure 3, item 6) to establish an electrical connection and supply voltage from the heater.

Figure 3.
Cryogenic capillary system and Dewar vessel (vacuum flask). “1—vacuum flask, 2—pressure gauge, 3—a sealing fastening unit, 4—copper capillary, 5—check valve, 6—electrical contacts for clamps”.
Pre-Experiment Checklist:
- Dewar sealed; check that valve is working; pressure ≥ 6 psi (0.4 atm).
- Heater powers contact element; nitrogen circulates via thermal expansion.
- No stray electrical connections, avoiding short circuits.
- Thermocouple is functional and connected to PID controller.
- Capillaries are insulated for minimal heat loss and stable cooling.
It is essential to determine the precise sample temperature while recording a spectrum. For this purpose, we use an E-type thermocouple (composed of chromel and constantan), which is connected to the cryogenic temperature PID controller.
The experiment begins by connecting the cryogenic capillary system to the sample cell and placing it into the diffuse reflection attachment within the FTIR spectrometer. When the sample temperature reaches its lowest value and the PID controller displays 80 K, we collect the Fourier-transform infrared spectra. After that, the heating phase begins by adjusting the heater power connected to the sample bar by the heating cables. During the warming process, spectra are recorded at specific temperatures by balancing the cold nitrogen supply with heater power. After the experiment, the obtained spectra are analyzed, and the findings are summarized.
2.2. Materials
Kerosene (brand “Derzhava” with maximum sulfur content not exceeding 1.4% according to GOST 18499-73 (technical kerosene) [29], methanol (“Honeywell”, purity ≥ 99.2%), and ethanol (purity ≥ 99.9%, dried, “SeccoSolv”, Darmstadt, Germany) were used as test hydrocarbons. Prior to the measurements, all samples were filtered, hermetically sealed, and stored in liquid form at 277–278 K to prevent evaporation and contamination.
Preparation of the test sample (kerosene, methanol, ethanol) includes only a few steps—opening the properly sealed vessel, picking up 1 mL of liquid using a disposable syringe, putting it into the second and third cells (0.5 mL each) and inserting the holder into the diffuse reflection attachment. A syringe is used to take equal doses of samples for each experiment.
Samples are placed into cells that are already situated in an IR-inactive inert medium, which is filled with nitrogen from a gasifier to ensure sample purity.
2.3. Gasifier for Creating IR-Inactive Environment
To maintain the experiment’s integrity, a blowing system was connected to the diffuse reflection attachment. Introducing gaseous nitrogen into this attachment creates an inert atmosphere, which protects both the samples and the copper bar from frost buildup and ensures the experiment’s consistency by providing an IR-inactive environment. The next step in our experimental procedure involves preparing the aforementioned gasifier—this includes verifying the gasifier’s hermetic seal, filling the gasifier vessel with nitrogen, and connecting it to the spectrometer’s cuvette compartment via a hose. This setup supplies the diffuse reflection attachment—through which IR radiation passes—with an inert, IR-inactive atmosphere, preventing water vapor from depositing on the samples during cooling. The gasifier’s design is illustrated in Figure 4.

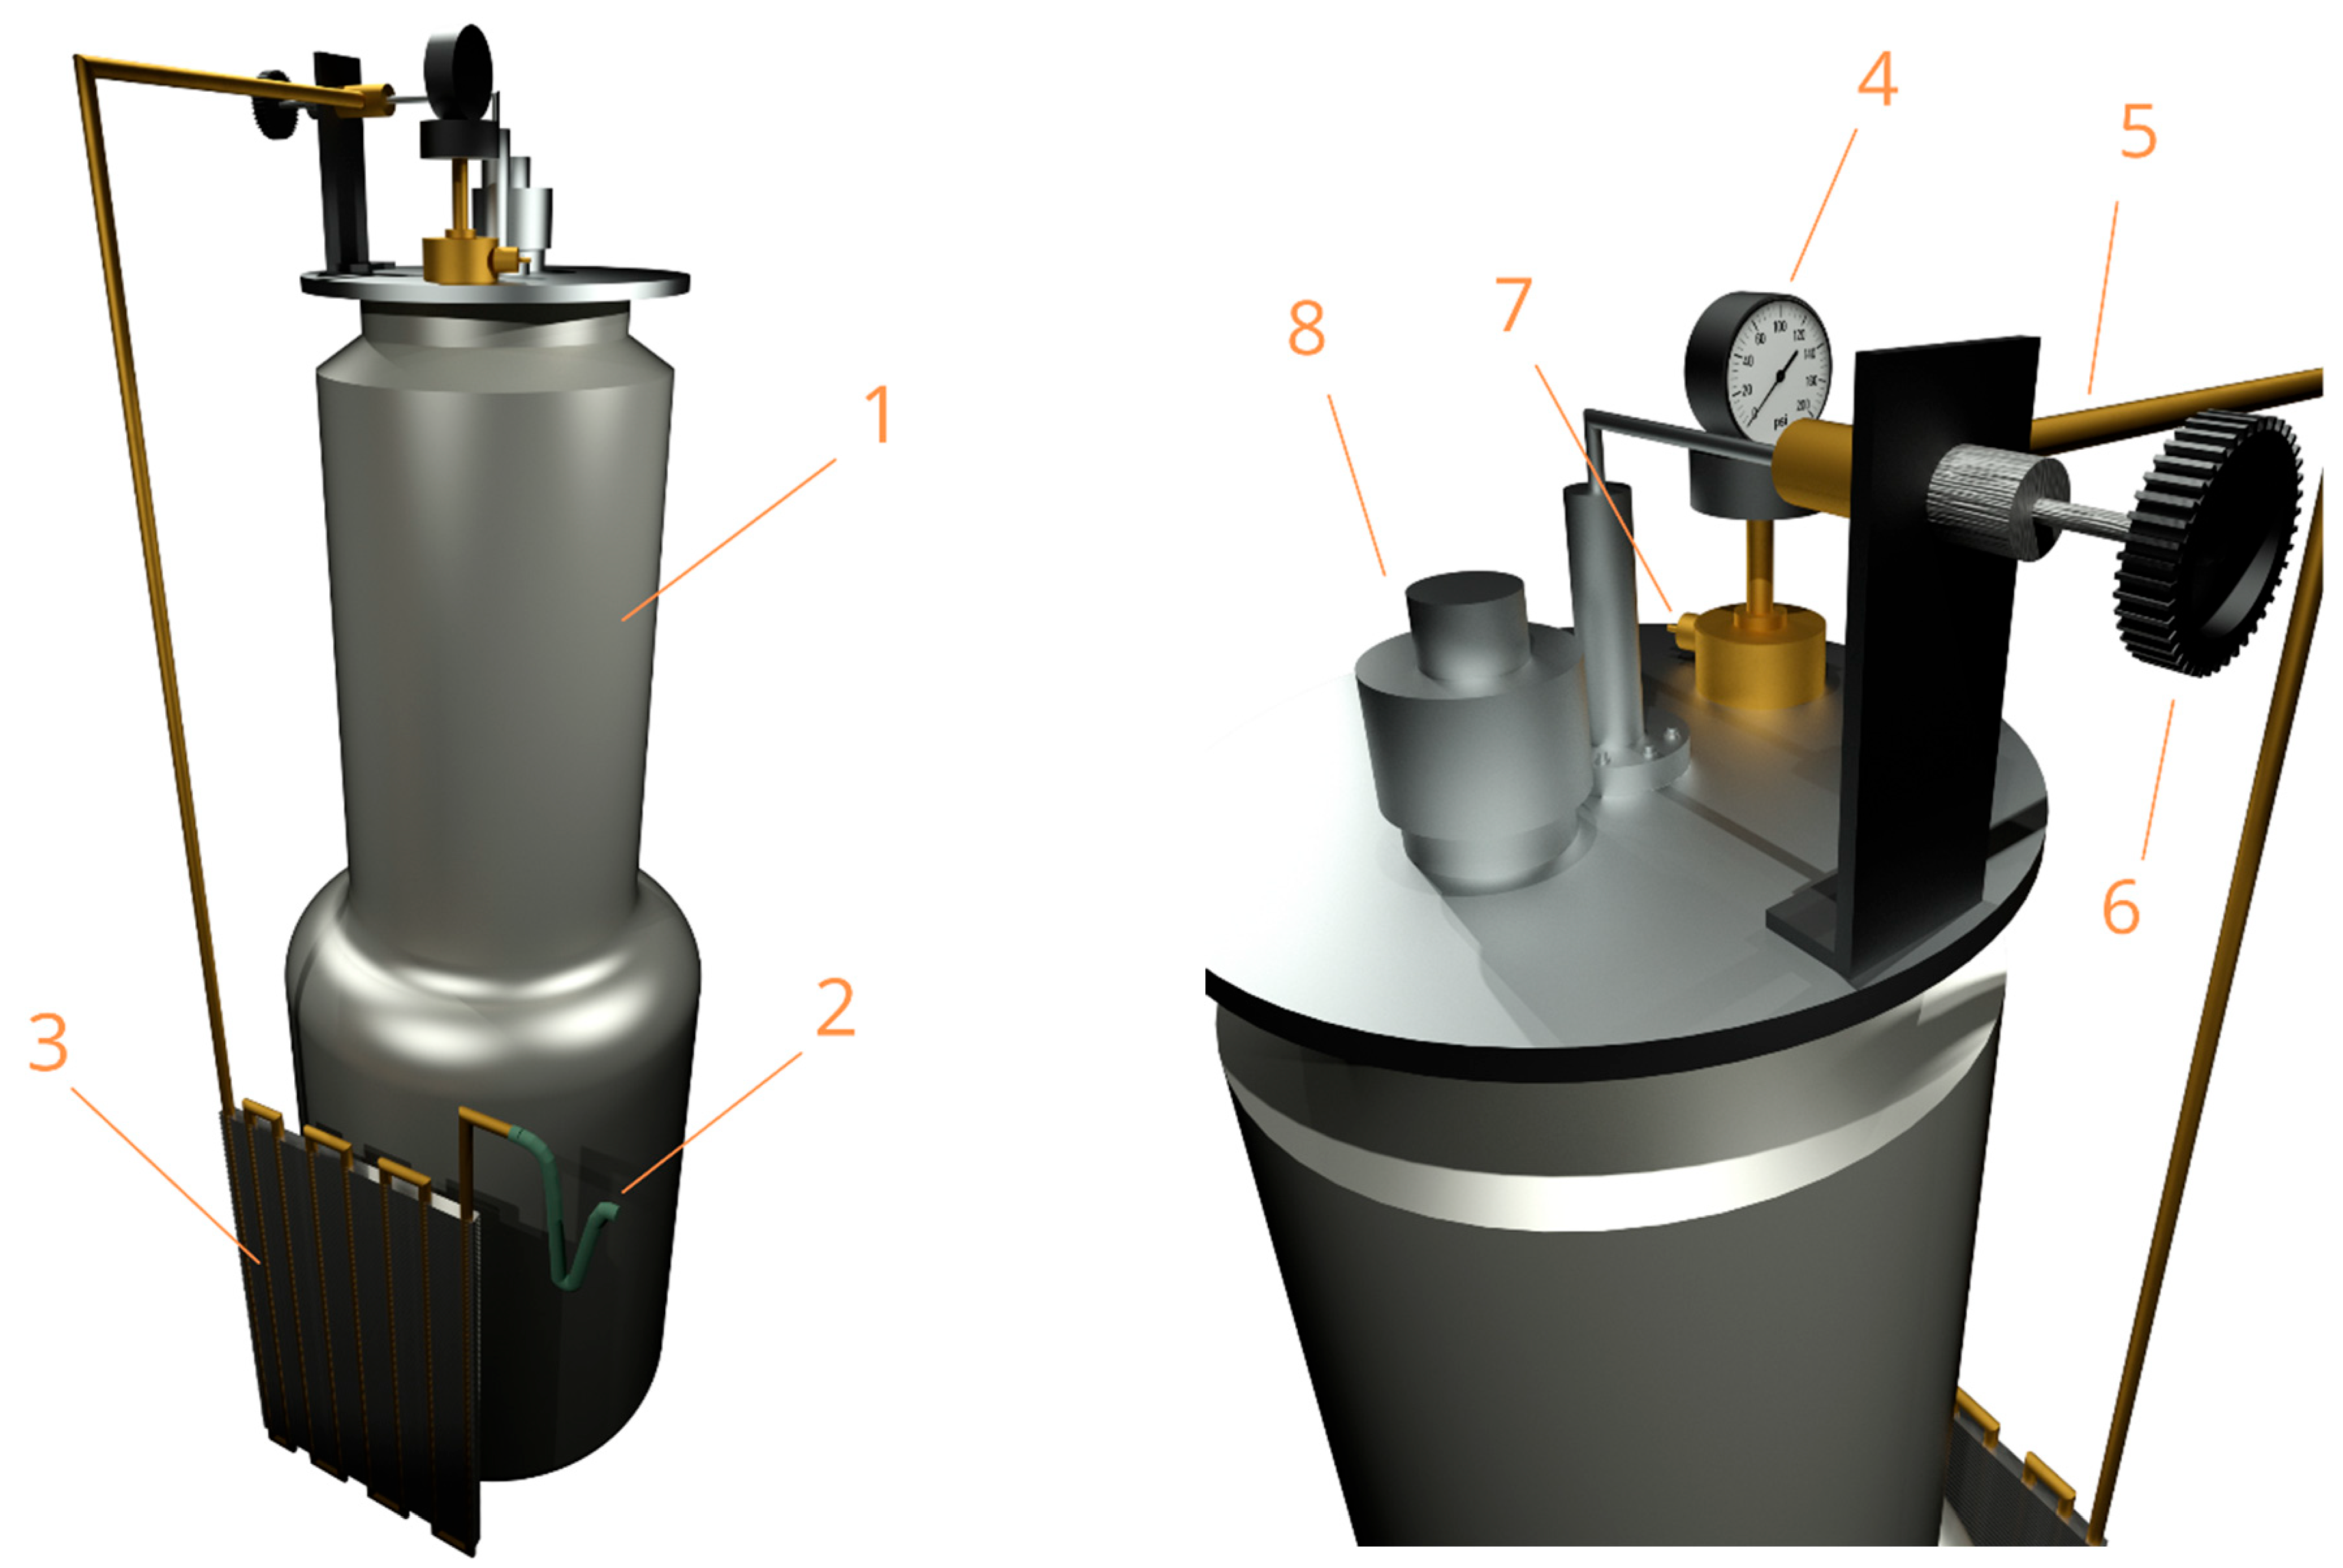
Figure 4.
Gasifier generating nitrogen for inert IR-inactive environment. “1—Dewar vessel, 2—hose, 3—radiators, 4—pressure gauge, 5—capillary tube, 6—the valve, 7—check valve, 8—the lid”.
The vessel (Figure 4, item 1) serves as the nitrogen storage container and functions as a Dewar vessel. The manometer (pressure gauge) (Figure 4, item 4) displays the internal overpressure, allowing us to estimate the remaining nitrogen supply time. The hose (Figure 4, item 2) connects the gasifier to the spectrometer, supplying the diffuse reflection attachment with an inert, IR-inactive nitrogen atmosphere. The capillary tube (Figure 4, item 5) facilitates nitrogen transfer, while the radiators (Figure 4, item 3) conduct heat and help generate gaseous nitrogen specifically. The lid (Figure 4, item 8) prevents nitrogen from escaping, the valve (Figure 4, item 6) controls nitrogen flow, and the check valve (Figure 4, item 7) protects against excessive pressure buildup.
2.4. Estimation of Uncertainty and Error
Since our experiment involves measuring two main quantities—the characteristic peak/band wavenumbers of functional groups and the temperatures of hydrocarbon samples—we encounter uncertainties associated with each of these measurements. To estimate these uncertainties, we use a well-known technique. The calculation is carried out according to the ISO Guide to the Expression of Uncertainty in Measurement (GUM) methodology. There are two types of uncertainty—A and B. The first uncertainty is derived from the statistical analysis of repeated observations and is based on the standard deviation of the mean. The second is estimated by non-statistical means, relying on previous data, calibration certificates, manuals, or expert judgment. In our research, the expanded uncertainty coefficient is 2 (unitless), corresponding to a 95% confidence level.
2.5. Calibration of Cryogenic Cell by Temperature
The temperature measurement accuracy of the copper sample holder was verified using a reference platinum resistance thermometer (Class A, PT100) and compared with readings from a type E thermocouple (chromel–constantan) connected to a PID controller. Deviations did not exceed ±0.5 K in the range of 80–300 K.
2.6. Experimental Methodology
Spectra were recorded every 5 degrees during heating from 80 to 100 K. At each step, the temperature was held constant for 1–2 min to ensure thermal equilibrium. Spectral image acquisition time was approximately 30 s per scan, and triplicates were averaged for each condition. The liquid nitrogen flow rate was ~0.5 L/h with active cooling. Warming was performed by heating samples via heater cables and monitoring the temperature increase. There is schematic diagram of the entire experimental installation in Figure 5, offering a clearer overview of the system. Actual photos of the installation have been added to Appendix A.
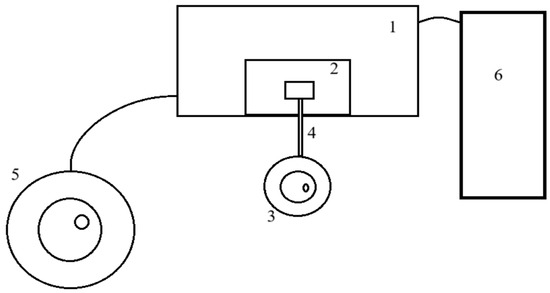
Figure 5.
Schematic diagram of the setup (top view). 1—Fourier spectrometer, 2—cuvette compartment with diffuse reflection attachment, 3—cryogenic cooler with Dewar vessel, 4—capillary system, 5—gasifier, providing nitrogen to the cuvette compartment, 6—computer desk with specific software.
Here, we provide a step-by-step explanation of the experimental procedure. Once all necessary equipment and instrumentation have been properly prepared, the investigation begins into the optical properties of the test materials (hydrocarbon compounds) at low temperature (80 K) and atmospheric pressure. The experiment is carried out by following these steps:
Stage 1: Begin by filling both the gasifier and the cryogenic capillary system with nitrogen and ensuring they are securely sealed. Connect the components as follows:
(1) Attach the gasifier to the spectrometer’s cuvette compartment inlet using a hose to maintain an inert environment.
(2) Link the cryogenic capillary system to the temperature PID controller via the E-type thermocouple (chromel–constantan), and connect it to a heater using wires with alligator clips to generate additional pressure inside the flask, thereby improving nitrogen circulation through the capillary system.
Stage 2: Seal the cuvette compartment using layers of polypropylene and polyethylene film, leaving only openings for the micrometer screw and the retractable holder. This helps preserve the nitrogen-based IR-inactive environment within the cuvette, which enhances the quality of the recorded IR spectra. Since nitrogen and air have relatively similar molecular weights, maintaining this environment is feasible.
Stage 3: Place a pre-ground potassium bromide sample—known for its tendency to absorb ambient moisture—into the first cell of the container bar on the retractable holder. This sample will serve as a reference spectrum for later dividing the spectra of the test substances. Then, place the hydrocarbon test samples into the second and third cells and insert the holder into the diffuse reflection attachment.
Stage 4: Adjust the vertical micrometer screw to identify the position of the sample holder that yields the highest IR beam intensity for each cell individually. Once the optimal position is determined, cease further adjustments. Use this setting to record the spectra of the samples with the “FSpec” software, and subsequently analyze the data in “Origin.”
Stage 5: Acquire the spectra while gradually cooling the samples from room temperature (290–300 K) down to near boiling point of nitrogen (80 K). Use the temperature controller to monitor the sample temperature in real time, and activate the heater to increase nitrogen flow through the capillary by building pressure inside the flask. At 80 K, record the spectra. Then, the sample heater is turned on, allowing precise control of the sample temperature. Continue spectra recording during the heating process at certain temperatures. Finally, compare the spectra obtained during cooling and heating to evaluate any differences.
Stage 6: After collecting all the necessary spectra, conclude the experiment by removing the sample holder from the attachment, disconnecting the electrical leads from the vacuum flask, and detaching the thermocouple from the PID controller. Flush the spectrometer’s compartment with gaseous nitrogen to eliminate any possible remaining hydrocarbon vapors, thereby cleaning the interior of the diffuse reflection attachment and the spectrometer.
2.7. Methods of Preliminary Results Processing
In addition, spectral acquisition in practical conditions is often subject to environmental and instrumental errors that introduce noise and interference [30,31]. Traditional chemometric methods require pre-processing steps, such as noise removal, to improve the signal-to-noise ratio. In this study, to demonstrate the capabilities of the developed cryogenic measurement system, we evaluated its performance by recording and analyzing the IR spectra of hydrocarbon samples (kerosene, methanol, ethanol) at temperatures ranging from 80 K to 100 K. OriginPro 9.9 software was used for pre-processing of the spectral data, which included intensity normalization of the spectra (baseline correction and area normalization), smoothing (Savitzky–Golay filter), and analysis of absorption band range. Thus, the recorded IR spectra of hydrocarbon compounds were processed using OriginPro to ensure accuracy and comparability under all temperature conditions. The following pre-processing steps were performed:
Baseline correction: A polynomial fitting algorithm (order 3–5) was used to remove background drift and scattering effects caused by the instrument optics and sample surface roughness.
Normalization: The spectra were normalized to the unit area under the curve (area normalization) to allow comparison of relative band intensities and to minimize the influence of sample amount or surface morphology.
Smoothing: A Savitzky–Golay filter with a window size of 11 points and a second-order polynomial was applied to reduce high-frequency noise without distorting the peak shapes.
3. Results
3.1. Uncertainty Assessment
The objective of this assessment is to determine the combined and expanded uncertainties of temperature measurements in the experimental setup as well as the accuracy of band wavenumbers in recording IR spectra of hydrocarbon substances at temperatures down to 80 K and atmospheric pressure.
A spectrometer with a diffuse reflection attachment was used as a measuring instrument, the error analysis of which is carried out during the recording and analyzing of infrared spectra. The assessment of the combined uncertainty of spectral measurements takes into account the following sources: (1) spectral resolution (Ur), the indicator that is responsible for the ability of device to distinguish peaks; (2) instrument error, which means the calibration error of the spectrometer (Ui); (3) digital noise/baseline instability (Un), namely the noise and instability impact to the result; (4) deviation of peak position approximation (Ua), which occurs when the peak is being smoothed. According to the GUM, total standard uncertainty is defined by the root sum square (RSS), which is the combination of all uncertainty sources’ contributions:
Taking into account all these uncertainties and having performed all the calculations, we present uncertainty contributions in Table 1.

Table 1.
Uncertainty budget of spectra analysis.
Thus, the expanded uncertainty in determining the positions of absorption bands in the IR spectra obtained with the spectrometer is ±0.936 cm−1 at a 95% confidence level. This uncertainty must be taken into account when interpreting the spectra.
As for temperature, the measurement device is a thermocouple attached to a PID controller, the uncertainty of which is under investigation. Thermocouple uncertainty assessment consists of determining contributions of the following sources: (1) thermocouple voltage (Yv), the quantity, signaling about deviation of voltage measuring; (2) contact thermal resistance (Yc), the deviation of temperature measuring, occurring based on a material’s resistance to heating/cooling on the contact point; (3) temperature gradient in bar (Yg), namely the deviation due to temperature distribution across the copper bar; (4) PID controller fluctuation (Yf), the instrument error.
Having calculated all errors and deviations, we present temperature measurement uncertainty budget in Table 2.
Table 2.
Uncertainty budget of temperature measurement.
3.2. FTIR Spectroscopy Data of Hydrocarbon Samples Obtained Using the Cryogenic System
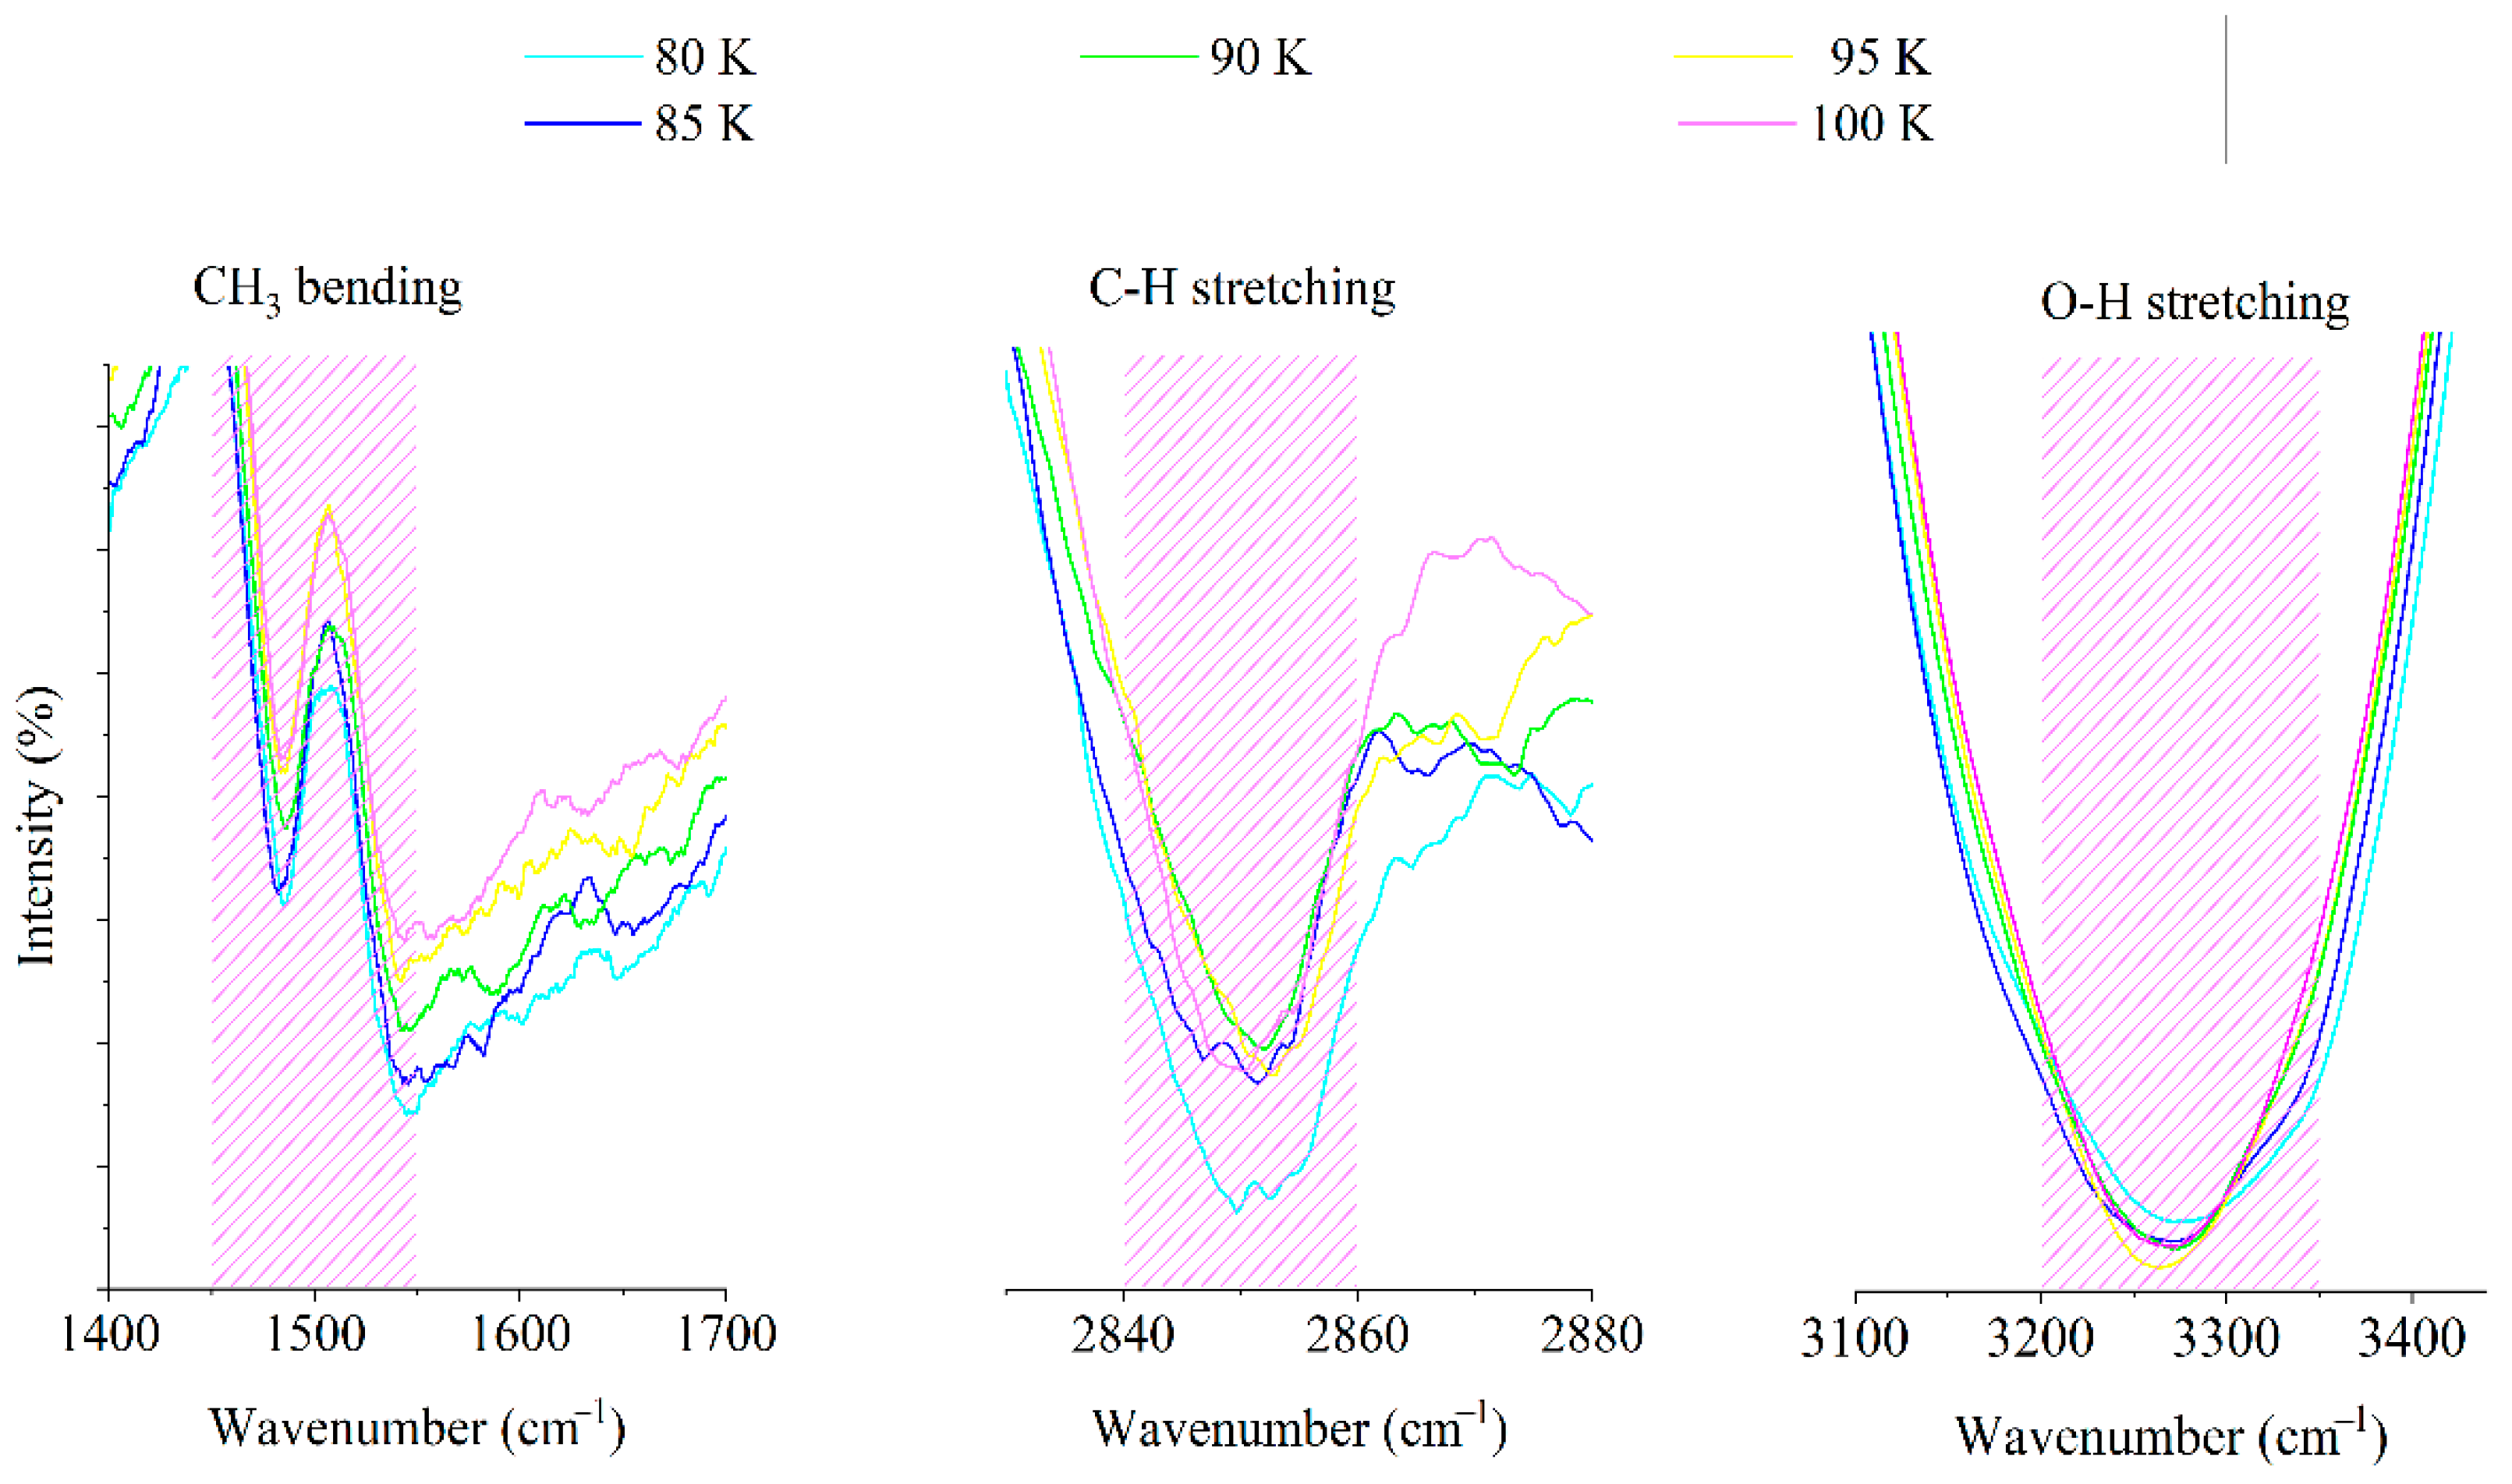
Figure 6 shows the results of the experiment with CH3OH methanol and obtaining its spectra. Key characteristic peaks corresponding to the vibrational modes of methanol functional groups can be observed, in particular CH3 bending in the range of 1450–1550 cm−1, C-H stretching in the range of 2840–2860 cm−1, and O-H stretching in the range 3200–3350 cm−1. These bands correspond to key IR peaks of methanol, in particular alcohol and hydrocarbon groups. Also, there is a comparison of our data with results of other authors in this field in Table 3. Assignments discovered in their works mostly correspond with our data, in particular CH3 bending, C-H stretching, and O-H stretching vibrations, although they have been obtained under vacuum and in almost the same temperature range.
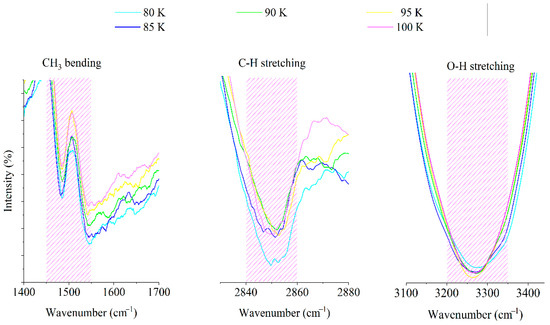
Figure 6.
Methanol characteristic peaks at low temperatures.
Table 3.
Comparison of methanol spectra results.
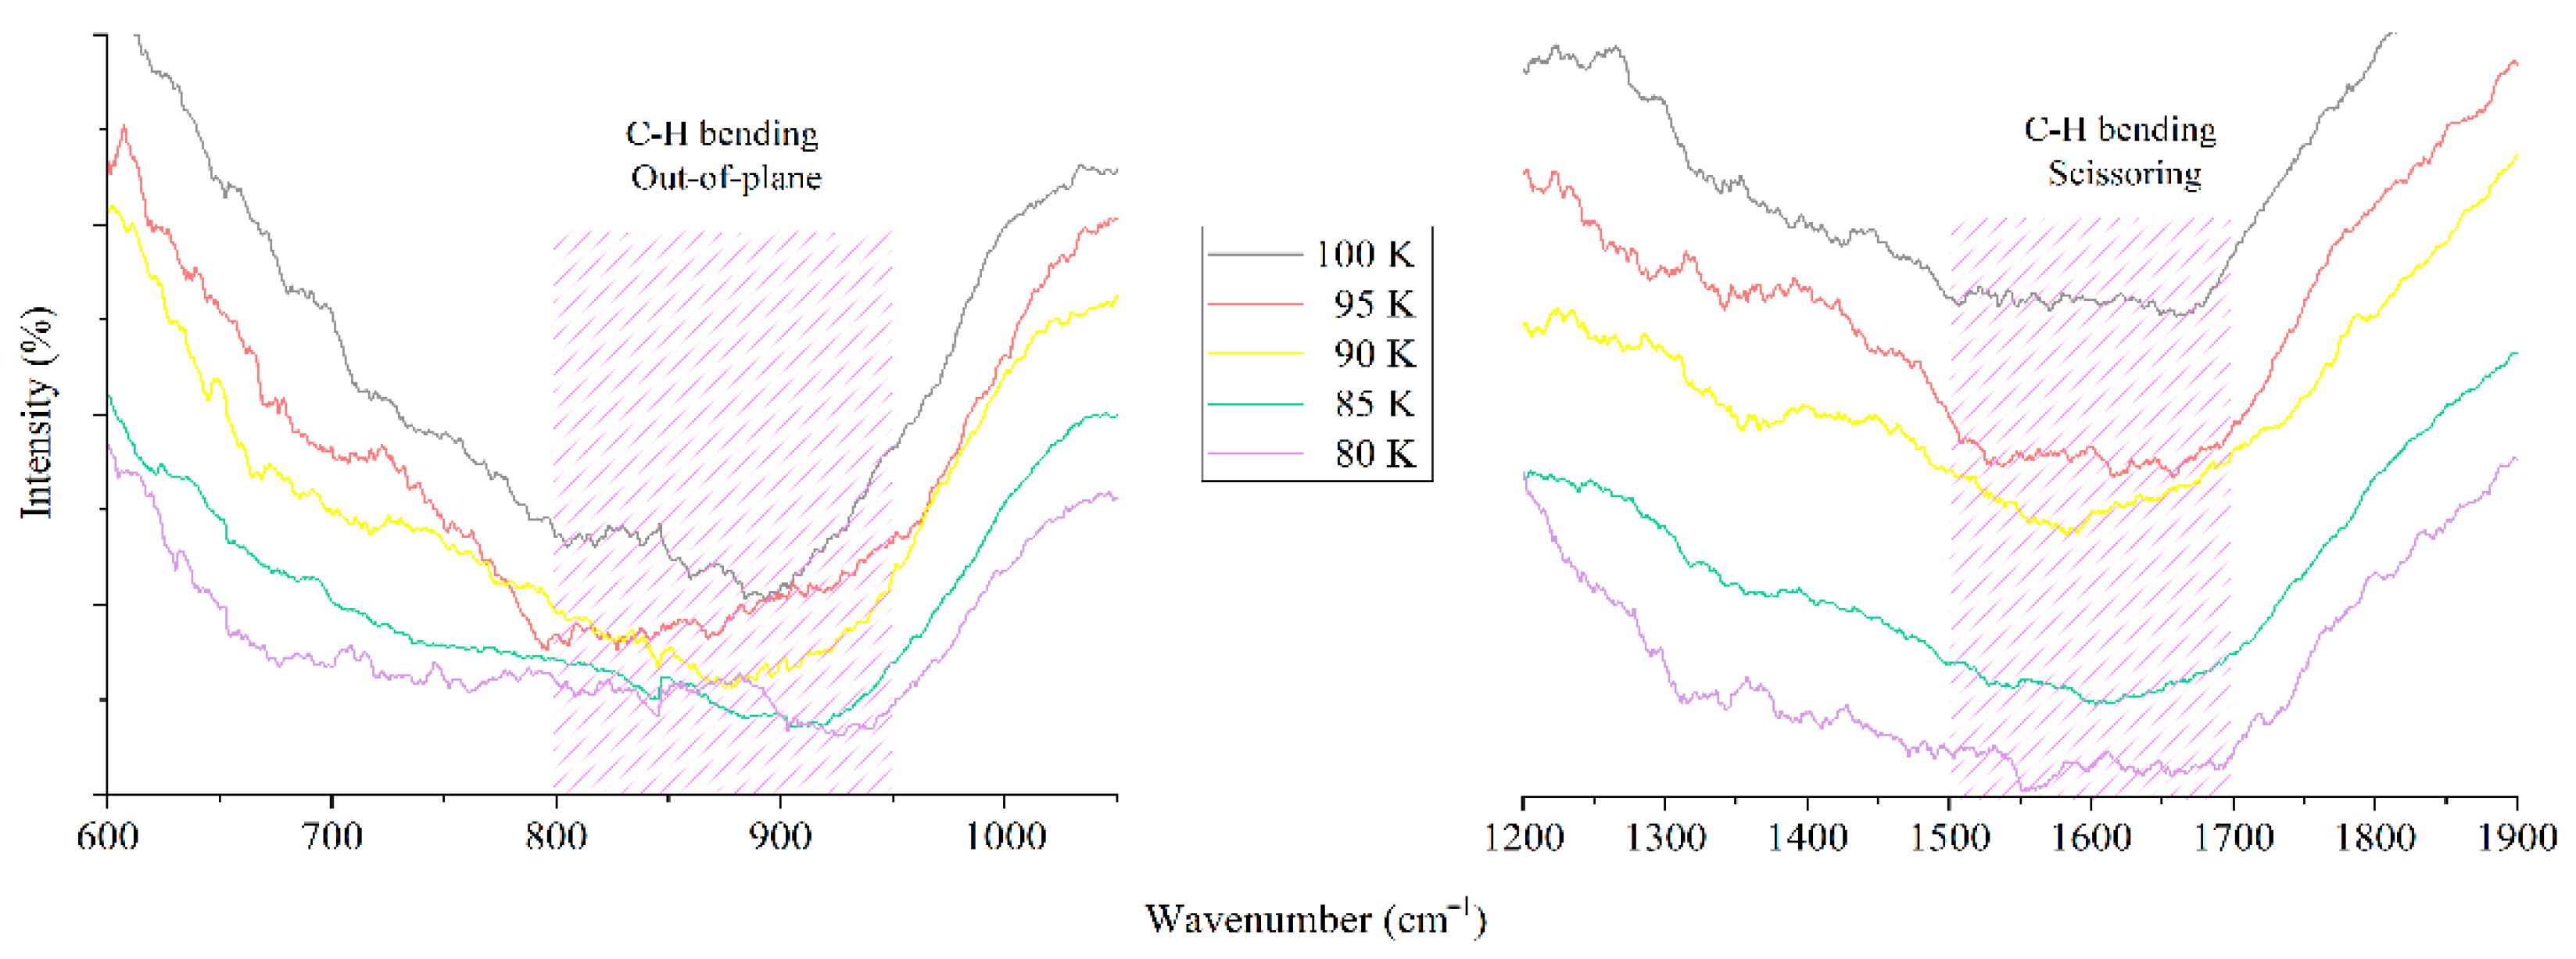
As for Figure 7—C-H bending characteristic peaks of kerosene are also present—out-of-plane vibration in the range of 800–950 cm−1 and scissoring vibration in the range of 1500–1700 cm−1. Comparison with other authors’ results is provided in Table 4. All data correlate well. C-H bending peaks are good examples of the activity of kerosene functional groups while being exposed to IR radiation, since they exhibit intense vibrations in certain way. Slight broadening of the bending peaks seen in the Figure 7 and Table 4 is due to a hypsocromic shift, the occurrence of which can be explained by the method of obtaining solid kerosene (80–100 K), since it was gradually cooled from room temperature (300 K) from liquid phase at atmospheric pressure.
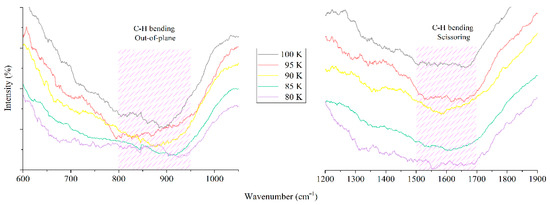
Figure 7.
Characteristic peaks of kerosene at low temperatures.
Table 4.
Comparison of kerosene spectra results.
There is a comparison of the characteristic peaks of ethanol C2H5OH functional groups in Table 5, in particular C-H and O-H stretching vibrations; all data show good correlation. This stretching highlights the important alcohol and hydrocarbon components of the ethanol molecule, which exhibit dynamic behavior in response to IR radiation. Those peaks and comparisons prove the usability and reliability of the setup and measurement technique.
Table 5.
Comparison of ethanol spectra results.
4. Discussion
The obtained results open up new application areas for low-temperature FTIR spectroscopy of hydrocarbon fuels:
Identification of frozen fuels and lubricants: the spectral “signature” of hydrocarbons at 80 K can be used to identify the fuel type in samples stored or found in a frozen state (e.g., when investigating accidents in the Far North). The method allows one to determine without heating whether a frozen hydrocarbon liquid is kerosene, diesel fuel, jet fuel, or gasoline based on the position and intensity of characteristic bands.
Cryostorages and space research: the cryogenic FTIR analysis technique is applicable in the design of long-term storage systems for hydrocarbon energy carriers at ultra-low temperatures (e.g., fuel reserves in polar regions or at near-Earth orbital stations). It also holds promise for simulating extraterrestrial conditions, such as studying the interaction of hydrocarbons with the surface at the temperature of Titan’s moon (~94 K) and for testing fuel tank materials in the cold of space.
The practical value is confirmed by the possibility of using the method to identify fuels. In the future, it is planned to automate the process of cryo-spectroscopic analysis, create an autonomous cell capable of cooling and scanning samples without operator participation, as well as to extend the technique to other types of fuel. This work contains results only for hydrocarbons such as methanol, kerosene and ethanol; future works could involve other hydrocarbon compounds, like gasoline, diesel, natural gas, aviation kerosene, their mixtures, etc. That would help with identifying the presence of these fuels in different ices (polar, extraterrestrial) at low temperatures and their properties and behavior under those conditions. Future studies using this experimental setup will also allow for a more detailed study of the physicochemical behavior and phase transitions of various substances under cryogenic conditions at atmospheric pressure. In the long term, this may contribute to the development of analytical tools for planetary science, astrochemistry, and environmental monitoring of fuel pollutants in frozen environments.
5. Conclusions
The idea for this work sprang from the desire to obtain new fundamental data about the low-temperature properties and behavior of hydrocarbons under non-vacuum conditions. For this purpose, we used modified cryogenic DRIFT spectroscopy based on a standard diffuse reflection attachment of a Fourier spectrometer, as a result of which we acquired a cryogenic setup, connected to the spectrometer. This cryogenic setup is a device capable of cooling hydrocarbon substances at atmospheric pressure and in an IR-inactive environment, subsequently allowing us to obtain a mid FTIR spectra of the samples. This study shows the behavior and properties of hydrocarbons, or more precisely—methanol, kerosene and ethanol—by band strengths of their characteristic vibrations’ specific wavenumbers. All spectral data are confirmed by comparison with the results of other authors studying hydrocarbon substances in this field and showed good correlation. The cryogenic setup allowing precise temperature control and a thorough measurement technique involving FTIR spectroscopy demonstrates effective operability in obtaining hydrocarbon spectral data.
Thus, the conducted study lays the foundation for subsequent fundamental and applied work on cryo-spectroscopy of hydrocarbon materials, offering both confirmation of theoretical ideas about the vibrational properties of cooled fuels and a tool for solving practical problems of the fuel and energy complex.
6. Patents
While conducting work and obtaining results in this area of research, two patents of the Republic of Kazakhstan were received:
1. Upgraded low-temperature sample holder for IR-spectroscopy, № 9621 of 19 July 2024, Darkhan Yerezhep, Abdurakhman Aldiyarov, Oleg Golikov, Alisher Kenbay;
2. Low-temperature diffuse reflection measuring cell in the mid-IR range № 7284 of 15 July 2022, Alisher Kenbay, Darkhan Yerezhep, Abdurakhman Aldiyarov.
Author Contributions
Conceptualization, A.A., Y.K. and D.Y., methodology, G.T., A.K., A.A., A.N.,and D.Y.; software, G.T. and A.K.; validation, G.T. and Y.K., formal analysis, G.T. and A.N.; investigation, A.K., A.A., A.L. and A.N.; resources, Y.K. and A.L.; data curation, A.L. and A.N.; writing—original draft preparation, A.K., A.L., and D.Y.; writing—review and editing, A.K., Y.K. and D.Y.; visualization, A.K.; supervision, A.A. and D.Y.; project administration, D.Y.; funding acquisition, Y.K. All authors have read and agreed to the published version of the manuscript.
Funding
The publication of the article was carried out with the support and funding of the Science Committee of Science and Higher Education of the Republic of Kazakhstan within the framework of the implementation of the grant funding project of the IRN AP19680205.
Data Availability Statement
The original contributions presented in this study are included in the article. Further inquiries can be directed to the corresponding authors.
Acknowledgments
We express our gratitude and appreciation for technical support to the leading engineer at the Faculty of Physics and Technology, Al Farabi Kazakh National University, Drobyshev N.S.
Conflicts of Interest
The authors declare no conflicts of interest.
Abbreviations
The following abbreviations are used in this manuscript:
| DRIFT | Diffuse Reflectance Infrared Fourier Transform |
| ESA | European Space Agency |
| FTIR | Fourier-transform InfraRed |
| IR | InfraRed |
| NASA | National Aeronautics and Space Administration (American) |
| PID | Proportional-Integral-Derivative |
| RSS | Root Sum Square |
Appendix A
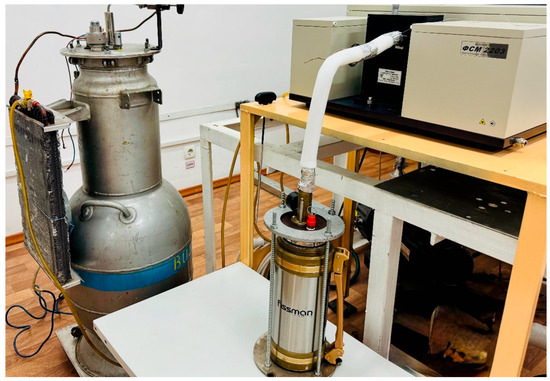
Figure A1.
Photograph of the actual installation are presented, showcasing the gasifier, IR-Fourier spectrometer, diffuse reflectance module, and the cryogenic-capillary system, with the cuvette compartment intentionally left open to enhance visual accessibility of the setup.
Figure A1.
Photograph of the actual installation are presented, showcasing the gasifier, IR-Fourier spectrometer, diffuse reflectance module, and the cryogenic-capillary system, with the cuvette compartment intentionally left open to enhance visual accessibility of the setup.

References
- Shaalan, N.M. An approach to fabricate nanomaterials using a closed low-temperature growth system. Mater. Chem. Phys. 2024, 328, 129930. [Google Scholar] [CrossRef]
- Sorokin, N.I.; Arkharova, N.A.; Karimov, D.N. Synthesis of nano-sized solid electrolyte Pr1-ySryF3-y and the effect of heat treatment on the ionic conductivity of fluoride nanoceramics. Crystallogr. Rep. 2024, 69, 561–568. [Google Scholar] [CrossRef]
- Carrascosa, H.; Muñoz Caro, G.M.; Martín-Doménech, R.; Cazaux, S.; Chen, Y.-J.; Fuente, A. Formation and desorption of sulphur chains (H2Sx and Sx ) in cometary ice: Effects of ice composition and temperature. Mon. Not. R. Astron. Soc. 2024, 533, 967–978. [Google Scholar] [CrossRef]
- Kakkenpara Suresh, S.; Dulieu, F.; Vitorino, J.; Caselli, P. Experimental study of the binding energy of NH3 on different types of ice and its impact on the snow line of NH3 and H2O. Astron. Astrophys. 2024, 682, A163. [Google Scholar] [CrossRef]
- Sokolov, D.Y.; Yerezhep, D.; Vorobyova, O.; Golikov, O.; Aldiyarov, A.U. Infrared analysis and effect of nitrogen and nitrous oxide on the glass transition of methanol cryofilms. ACS Omega 2022, 7, 46402–46410. [Google Scholar] [CrossRef]
- Yerezhep, D.; Akylbayeva, A.; Golikov, O.; Sokolov, D.Y.; Shinbayeva, A.; Aldiyarov, A.U. Analysis of vibrational spectra of tetrafluoroethane glasses deposited by physical vapor deposition. ACS Omega 2023, 8, 19567–19574. [Google Scholar] [CrossRef]
- Bhavani, G.; Durga Rao, T.; Niranjan, M.K.; Kumar, K.R.; Sattibabu, B.; Petkov, V.; Kannan, E.S.; Reddy, B.H. Structural, magnetic, optical and electronic properties of Gd2NiIrO6. Phys. B Condens. Matter 2024, 695, 416477. [Google Scholar] [CrossRef]
- Xu, J.; Liu, Q.; Zheng, T.; Xie, M.; Shen, H.; Li, Y.; Guo, F.; Zhang, Q.; Duan, M.; Wu, K.-H. Comparing low-temperature NH3-SCR activity, operating temperature window and kinetic properties of the Mn-Fe-Nb/TiO2 catalysts prepared by different methods. Sep. Purif. Technol. 2025, 356, 129906. [Google Scholar] [CrossRef]
- Nishikino, T.; Sugimoto, T.; Kandori, H. Low-temperature FTIR spectroscopy of the L/Q switch of proteorhodopsin. Phys. Chem. Chem. Phys. 2024, 26, 22959–22967. [Google Scholar] [CrossRef]
- Yang, Z.; Su, B.; Ding, H.; Qiu, Y.; Zhong, D. Prediction of asphalt low-temperature performance by FTIR spectra using comparative modelling strategy. Road Mater. Pavement Des. 2024, 26, 1–16. [Google Scholar] [CrossRef]
- Moszczyńska, J.; Liu, X.; Wiśniewski, M. Non-thermal ammonia decomposition for hydrogen production over carbon films under low-temperature plasma—In-situ ftir studies. Int. J. Mol. Sci. 2022, 23, 9638. [Google Scholar] [CrossRef] [PubMed]
- Moody, G.; Kavir Dass, C.; Hao, K.; Chen, C.-H.; Li, L.-J.; Singh, A.; Tran, K.; Clark, G.; Xu, X.; Berghäuser, G.; et al. Intrinsic homogeneous linewidth and broadening mechanisms of excitons in monolayer transition metal dichalcogenides. Nat. Commun. 2015, 6, 8315. [Google Scholar] [CrossRef]
- Dillinger, S.; Mohrbach, J.; Hewer, J.; Gaffga, M.; Niedner-Schatteburg, G. Infrared spectroscopy of N2 adsorption on size selected cobalt cluster cations in isolation. Phys. Chem. Chem. Phys. 2015, 17, 10358–10362. [Google Scholar] [CrossRef] [PubMed]
- Fortes, P.R.; Da Silveira Petruci, J.F.; Wilk, A.; Cardoso, A.A.; Raimundo, I.M., Jr.; Mizaikoff, B. Optimized design of substrate-integrated hollow waveguides for mid-infrared gas analyzers. J. Opt. 2014, 16, 094006. [Google Scholar] [CrossRef]
- Serdyukov, V.I.; Sinitsa, L.N.; Lugovskoi, A.A.; Emel’yanov, N.M. Liquid-nitrogen-cooled optical cell for the study of absorption spectra in a fourier spectrometer. Atmos. Ocean. Opt. 2020, 33, 393–399. [Google Scholar] [CrossRef]
- Serdyukov, V.I.; Sinitsa, L.N.; Lugovskoi, A.A.; Emelyanov, N.M. Low-temperature cell for studying absorption spectra of greenhouse gases. Atmos. Ocean. Opt. 2019, 32, 220–226. [Google Scholar] [CrossRef]
- Sung, K.; Mantz, A.W.; Smith, M.A.H.; Brown, L.R.; Crawford, T.J.; Devi, V.M.; Benner, D.C. Cryogenic absorption cells operating inside a Bruker IFS-125HR: First results for 13CH4 at 7μm. J. Mol. Spectrosc. 2010, 262, 122–134. [Google Scholar] [CrossRef]
- Mantz, A.W.; Sung, K.; Brown, L.R.; Crawford, T.J.; Smith, M.A.H.; Malathy Devi, V.; Chris Benner, D. A cryogenic Herriott cell vacuum-coupled to a Bruker IFS-125HR. J. Mol. Spectrosc. 2014, 304, 12–24. [Google Scholar] [CrossRef]
- Kenbay, A.A.; Yu Golikov, O.; Aldiyarov, A.U.; Yerezhep, D.E. Low-temperature cell for IR Fourier spectrometric investigation of hydrocarbon substances. Sci. Tech. J. Inf. Technol. Mech. Opt. 2023, 23, 696–702. [Google Scholar] [CrossRef]
- Hudson, R.L.; Gerakines, P.A.; Yarnall, Y.Y. Infrared spectroscopic and physical properties of methanol ices—Reconciling the conflicting published band strengths of an important interstellar solid. Astrophys. J. 2024, 970, 108. [Google Scholar] [CrossRef]
- Carrascosa, H.; Satorre, M.Á.; Escribano, B.; Martín-Doménech, R.; Muñoz Caro, G.M. Physical properties of methanol (CH3OH) ice as a function of temperature: Density, infrared band strengths, and crystallization. Mon. Not. R. Astron. Soc. 2023, 525, 2690–2700. [Google Scholar] [CrossRef]
- Luna, R.; Molpeceres, G.; Ortigoso, J.; Satorre, M.A.; Domingo, M.; Maté, B. Densities, infrared band strengths, and optical constants of solid methanol. Astron. Astrophys. 2018, 617, A116. [Google Scholar] [CrossRef]
- Dollah, A.; Zainol Rashid, Z.; Hidayati Othman, N.; Nurliyana Che Mohamed Hussein, S.; Mat Yusuf, S.; Shuhadah Japperi, N. Effects of ultrasonic waves during waterflooding for enhanced oil recovery. Int. J. Eng. Technol. 2018, 7, 232. [Google Scholar] [CrossRef]
- Mirea, R.; Cican, G. Theoretical assessment of different aviation fuel blends based on their physical-chemical properties. Eng. Technol. Appl. Sci. Res. 2024, 14, 14134–14140. [Google Scholar] [CrossRef]
- Biaktluanga, L.; Lalhruaitluanga, J.; Lalramnghaka, J.; Thanga, H.H. Analysis of gasoline quality by ATR-FTIR spectroscopy with multivariate techniques. Results Chem. 2024, 8, 101575. [Google Scholar] [CrossRef]
- Aldiyarov, A.; Yerezhep, D.; Sokolov, D.; Korshikov, E.; Nurmukan, A.; Tasmukhanova, A.; Ramos, M.A. Multiple phase transitions in ethanol thin films obtained by physical vapor deposition. Appl. Surf. Sci. 2025, 687, 162259. [Google Scholar] [CrossRef]
- Hudson, R.L. An IR investigation of solid amorphous ethanol—Spectra, properties, and phase changes. Spectrochim. Acta Part A Mol. Biomol. Spectrosc. 2017, 187, 82–86. [Google Scholar] [CrossRef]
- Golub, P.; Doroshenko, I.; Pogorelov, V.; Sablinskas, V.; Balevicius, V.; Ceponkus, J. Temperature evolution of cluster structures in ethanol. Dataset Pap. Sci. 2013, 2013, 473294. [Google Scholar] [CrossRef]
- GOST 18499-73; Kerosene for Technical Use. USSR National Committee on Standards: Moscow, Union of Soviet Socialist Republics, 1973.
- Xie, M.; Xu, Q.; Xie, L.; Li, Y.; Han, B. Establishment and optimization of the three-band fluorometric indices for oil species identification: Implications on the optimal excitation wavelengths and the detection band combinations. Anal. Chim. Acta 2023, 1280, 341871. [Google Scholar] [CrossRef]
- Zhang, S.; Li, M.; Li, J. Waveconv-slstm-ket: A novel framework for the multi-task analysis of oil spill fluorescence spectra. Appl. Sci. 2025, 15, 3177. [Google Scholar] [CrossRef]


Disclaimer/Publisher’s Note: The statements, opinions and data contained in all publications are solely those of the individual author(s) and contributor(s) and not of MDPI and/or the editor(s). MDPI and/or the editor(s) disclaim responsibility for any injury to people or property resulting from any ideas, methods, instructions or products referred to in the content. |
© 2025 by the authors. Licensee MDPI, Basel, Switzerland. This article is an open access article distributed under the terms and conditions of the Creative Commons Attribution (CC BY) license (https://creativecommons.org/licenses/by/4.0/).