Abstract
Hydrangeas are economically important ornamental plants whose growth and flower characteristics depend on irrigation water quality (IWC), i.e., hydrogenionic potential (pH) and electrical conductivity (EC). Unfavorable IWC causes plant stress, reduced growth and tissue damage, leading to physiological responses such as proline accumulation (for stress protection) and increased malondialdehyde (MDA, an indicator of damage). A greenhouse pot experiment was conducted as a three-factor study in three replicates. The study examined the impact of different pH levels (4, 5, and 6, compared to a control treatment of pH 7), and EC levels (2, 3, and 4 dS m−1, compared to a control treatment of 1 dS m−1) on biomass, i.e., plant height (cm), stem number (n), flower number (n), leaf number (n) and weight (g), flower weight (g) and diameter (cm), growth index (GI) and the proline and MDA concentrations in two hydrangea varieties (Early Blue and Bianco). Study results showed a significant impact of (p = 0.0001) pH on all tested morphological properties, except flower diameter. Notably, pH 6 maximized biomass accumulation, i.e., plant height (56.6 cm), leaf number (n = 97) and weight, flower weight (156.8 g), and GI (36 cm), while pH 4 promoted the highest number of flowers (n = 10) and stems (n = 10), which are both crucial for aesthetic and market value. EC significantly (p = 0.001) affected plant height (EC 2 = 56.3 cm), flower (EC 2 = 181.9 g) and leaf weight (EC 3 = 148.2 g), and growth index (EC 2 = 27.2 cm). The lowest stress indicators (proline and MDA concentrations) were recorded at pH 6 (MDA = 0.215 µmol g−1 FW, proline = 659.5 µmol g−1 FW) and EC 2 (MDA = 0.551 µmol g−1 FW, proline = 4068.2 µmol g−1 FW). The highest MDA and proline concentrations were observed under extreme conditions of pH 4 (MDA = 1.257 µmol g−1 FW, proline = 12,811.7 µmol g−1 FW) and EC 4 (MDA = 0.692 µmol g−1 FW, proline = 4880.8 µmol g−1 FW). No significant effect of variety on proline and MDA concentrations was observed, while the highest GI was recorded for the Early Blue variety (24.3 cm). This research identifies pH 6 and EC 2 as key conditions for optimizing hydrangea biomass and reducing stress, offering practical guidelines for growers. The findings provide a foundation for developing precise irrigation water quality strategies in the commercial production of ornamental plants.
1. Introduction
The genus Hydrangea (family Hydrangeaceae) comprises a diverse group of ornamental plants that are highly valued worldwide for their impressive and attractive flowers. As important horticultural plants, they are cultivated as shrubs, potted plants, and cut flowers [1], with key species including Hydrangea macrophylla and Hydrangea paniculata [1,2]. The genus holds significant economic value; H. macrophylla alone accounted for over $120 million in US sales in 2014 [1], highlighting the importance of research into optimizing their cultivation. Data on flower production in the Republic of Croatia is very scarce. According to the latest report from the Croatian Bureau of Statistics [3], in 2024, flowers were cultivated on 162 hectares (including open fields and greenhouses). The Croatian Chamber of Economy [4] states that Croatia annually imports 1376 t of flowers worth 7.44 million euros, while simultaneously exporting 152 t, valued at almost one million (960,000) euros. Furthermore, official data on the specific types of flowers cultivated in the Republic of Croatia are currently unavailable. Insights into the current market situation were gathered directly from growers, who plan their production and flower selection based on customer demand. Based on this information, two varieties of hydrangea, which are in highest demand, were chosen as the test plants for this research.
Successful hydrangea cultivation depends on understanding environmental requirements such as semi-shade and moisture [2], as well as sensitivity to key substrate factors such as pH and electrical conductivity (EC) [1,5,6]. The existing diversity within the genus, including different ploidy levels [7], suggests the need for research into specific varieties’ responses to these variables. pH fundamentally influences plant physiology by regulating nutrient availability [8,9], whereby an extreme pH (too high or too low) can lead to nutrient deficiencies or toxicities [8,9,10,11]. In H. macrophylla, pH directly controls the color of flower sepals through aluminium (Al3+) availability: acidic soils (pH 4.5–5.5) result in blue flowers due to higher Al3+ solubility and uptake, while neutral to alkaline soils (pH ≥ 6.0) lead to pink or red flowers due to reduced Al3+ availability [1,12]. Furthermore, managing pH in hydrangea cultivation is crucial for achieving desired aesthetic outcomes and ensuring overall plant health, balancing the need for low pH to produce blue flowers against the risk of acidity stress or other nutritional imbalances [1,13]. Electrical conductivity (EC) measures the total concentration of dissolved salts in the substrate or irrigation water, which is crucial for nutrient management [14,15,16,17,18]. Low EC indicates nutrient deficiency, leading to reduced growth [6,18], while high EC (salinity) stresses plants through osmotic stress (hindering water uptake) and ionic toxicity (accumulation of harmful ions like sodium (Na+) and chloride (Cl−), disrupting metabolism) [6,13,17]. Previous study results indicate that the optimal EC level and tolerance vary depending on the species and varieties [13,16,19]. Accordingly, both parameters of irrigation water quality have an important direct or indirect impact on the growth and quality of hydrangeas. However, due to the interaction of these parameters, sources in the literature emphasize the dominance of water pH. Bamsey et al. [20] claim that knowledge of irrigation water pH is critical for crop production. Although the EC primarily affects osmotic potential and plant water uptake [21] by reflecting the total content of macro- and micro-elements available to plants [22], pH directly controls the chemical forms of these ions and their availability to plants, as well as influencing plant physiological functions [23,24,25]. This is also confirmed by Penn and Camberato [26] who claim that pH is considered to be the “master variable” in soil chemistry due to its profound impact on countless chemical reactions involving essential plant nutrients, phytotoxic elements, and pollutants. These research findings indicate that irrigation water with a high pH, in contrast to EC (electrical conductivity), is detrimental to the stem length and flower diameter of Ranunculus asiaticus [27], reduces the dry flower mass of marigold [28], and results in a significant loss of marigold’s aesthetic value [29]. Furthermore, as stated by Loganathachetti and Mundra [30], bacterial diversity was lower in root and community patterns where irrigation water pH was a key structuring factor compared to EC. It is also important to note the moderate tolerance of hydrangea to the low salinity levels applied in this study. For instance, Conolly et al. [31] demonstrated that H. macrophylla exhibited moderate tolerance to soil salinity at an EC range from 2.0 to 4.0 dS·m−1. However, a further, even smaller increase in EC values to 5.65 dS·m−1 resulted in a smaller plant size and reduced dry weight of aerial organs, including leaves, inflorescences, and flowers [32].
Abiotic stresses, such as unfavorable pH and EC, negatively impact plant growth and productivity [18,33], whereby plants respond through complex signaling pathways involving stress perception, signal transduction (including calcium—Ca2+, reactive oxygen species—ROS, hormones), and reprogramming of gene expression, leading to metabolic and physiological adaptations [34,35]. A common result of many abiotic stresses is oxidative stress, caused by excessive ROS accumulation, and plants defend themselves with a sophisticated antioxidant system (enzymatic and non-enzymatic) [36,37,38]. Oxidative stress is key to understanding plant responses to pH and EC variations and potential differences among varieties, while biochemical markers quantify the cellular stress response, i.e., malondialdehyde (MDA), a product of lipid peroxidation, is a reliable indicator of the level of oxidative membrane damage caused by ROS [39]. Furthermore, proline, an amino acid, accumulates in response to osmotic stress (high EC, drought) and acts as a compatible osmolyte (helping to maintain water balance), osmoprotectant (protecting cellular structures), and potentially as an antioxidant [40,41,42]. Measuring MDA (an indicator of damage) and proline (an indicator of adaptive response) provides complementary information about varieties’ coping strategies under pH- and EC-induced stress. In alkaline conditions, micronutrients like iron (Fe) and manganese (Mn) become insoluble and unavailable for root absorption, causing iron deficiency chlorosis. This condition inhibits chlorophyll synthesis and photosynthesis, ultimately suppressing plant growth and biomass. For hydrangeas, pH-regulated iron availability is crucial for healthy development [11]. Elevated substrate salinity creates osmotic stress by lowering water potential and hindering water absorption by the roots. To counteract this physiological drought, plants accumulate compatible osmolytes such as proline for cellular protection and osmotic adjustment [43]. Thus, an increased proline concentration serves as a reliable biochemical marker of osmotic stress. However, studies systematically evaluating the combined effects of pH and EC and the specific responses of MDA and proline in different hydrangea varieties are lacking [32].
We hypothesize that differences in the pH and EC of irrigation water will affect the morphological properties and biochemical responses, i.e., accumulation of stress markers (MDA, proline) in two distinct hydrangea varieties, reflecting their specific tolerance strategies. The objective of this research is to quantify the effects of different irrigation water pH and EC levels on growth parameters and the accumulation of MDA and proline in two commercially relevant hydrangea varieties to assess differences in stress tolerance strategies among varieties. It is important to point out that extreme values of pH and EC were not applied, where a reaction of the plant is to be expected. However, the study focuses on the hydrangea’s reaction to the smallest changes in pH and EC values that can be expected in hydrangea cultivation due to variations in irrigation water sources.
2. Materials and Methods
2.1. Pot Experimental Design
A pot experiment was conducted in a greenhouse (located in the continental Republic of Croatia, 46°29′ N and 16°27′ E, 176 m altitude) using a three-factor design with three replicates and five plants per treatment. Consequently, a total of 480 plants were included in the study (4 EC × 4 pH × 2 varieties × 3 replicates × 5 plants per replicate). The greenhouse was equipped with a double-layer film inflated with air, energy-saving thermal screens to reduce heating energy consumption, supplementary lighting, and a blackout system for photoperiod control. The three-factor study consisted of the pH of irrigation water: pH 4, pH 5, pH 6, and pH 7 (control treatment), electrical conductivity (EC, dS m−1): EC 1 (control treatment), EC 2, EC 3, EC 4, and two varieties of bigleaf hydrangea (H. macrophylla): ‘Early Blue’ (blue flower color) and ‘Bianco’ (white flower color). Plants were grown from seedlings starting at the beginning of March 2024 in 3 L growing pots filled with Klasmann TS 4 substrate (white peat: 0–25 mm; white sod peat: 10–25 mm), with a pH of 6, intended for ornamental plant cultivation and with the following composition: 140 mg/L N, 160 mg/L P2O5, 180 mg/L K2O, and 100 mg/L Mg. It contained <10 %vol. dry matter and had an air capacity of 15–20 %vol. The substrate water holding capacity (SWHC) was 45 %vol., as determined by the procedure outlined in the Materials and Methods section.
2.2. Irrigation Water Quality Treatment
The pH 7 and EC 1 of the control treatments corresponded to well water used for irrigation, while the different pH and EC treatments were prepared by adding concentrated solutions to the irrigation water. The well water analysis is presented in Table 1, while the irrigation water quality was interpreted according to Ayers and Westcot [44], and Kos [45]. Considering the measured values, the water is suitable for irrigation without restrictions.

Table 1.
Well water quality.
Nutrient solutions were prepared in two 100 L tanks (A and B) with the compositions shown in Table 2. Prior to each irrigation event, pH and EC values were monitored using a handheld meter (HI-9814 Groline Hydroponic Portable Meter, Hanna Instruments Ltd., Woonsocket, RI, USA).
Table 2.
Compositions of concentrated solutions according to different EC values.
The irrigation volume was consistent across all treatments and determined gravimetrically. Three samples (n = 3) of 100 g (air-dry weight) of the substrate were collected in paper bags and oven-dried at 70 °C (due to the high organic matter content) until a constant weight was achieved. After cooling, the substrate samples were weighed, and the substrate water content (SWC) was calculated as the average of the three samples using the standard gravimetric method [46]. Subsequently, the substrate water holding capacity (SWHC) was determined by placing the substrate in three plastic containers with perforated bottoms to allow the free drainage of excess water. The substrate samples were saturated with water until drainage water appeared. The containers were then sealed with plastic lids to prevent evaporation. The substrate-filled containers were placed in a darkened room for two days. Afterwards, 100 g of substrate was sampled from each of the three containers, and the SWHC was determined using the standard gravimetric method [46]. The final result represented the mean value of the three samples (n = 3). Finally, the irrigation rate (IR) was calculated as the difference between SWHC and SWC and adjusted for the volume of the growing pot; specifically, the weight of substrate per pot:
where IRpot is the irrigation rate per growing pot and IR is irrigation rate.
IRpot = (IR × substrate weight/pot)/1 g oven dry soil,
Plants were irrigated using drip irrigation with short-angle arrow drippers (9.5 cm length, 1.2 bar working pressure), with one dripper placed in each growing pot. The drippers had a flow rate of 1 L h−1; therefore, each pot was irrigated for 15 min per irrigation event to achieve an irrigation volume of 0.25 L. The irrigation time was determined using an SM150 soil moisture sensor (Delta-T Devices Ltd., Cambridge, UK), adapted for use in substrates with an integrated calibration for peat mix and an accuracy of ±3%, measuring SWC in vol.%. The sensor was placed in the growing pot at the beginning of the study period and left in place until sampling to avoid disturbing the substrate within the pot. During the growing period, daily temperature (°C) and air humidity (%) were monitored and recorded using Extech RH550 (Industrial Electronics, Inc., Gray, TN, USA).
2.3. Morphological and Biochemical Analysis
After all the hydrangea flowers had fully bloomed, the following measurements were taken for each study treatment: plant height (cm), number of flowering branches (n), number of flowers (n), number of leaves (n), flower head diameter (cm), leaf weight (g) and flower head weight (g). A laboratory analytical balance (Kern ADJ 100-4) was used for weighing (Kern&Sohn GmbH, Balingen, Germany). The following formula was used to calculate growth index (GI) [7]:
Growth index = [(height from the substrate surface + widest width + perpendicular width)/3].
Before sampling for morphological and biochemical analysis, plant quality was assessed according to Liu et al. [47]. The malondialdehyde (MDA) and proline content were determined according to the methodology previously presented by Duan et al. [48]. During the measurement of morphological properties, hydrangea leaves were sampled and frozen at −80 °C for subsequent proline and MDA content analysis. Leaves were sampled from all study treatments and replicates, while for analysis, samples from five plants within each replicate were homogenized.
2.4. Statistical Analysis
The significance of study factors (pH, EC, and hydrangea variety) was determined by analysis of variance (ANOVA) using STATSTICA 14.0.0.15 (TIBCO Software Inc., Palo Alto, CA, USA). Fisher’s least significant difference (LSD) test was used to test the differences among the variables. For correlation analysis, pairwise Pearson correlation matrices were calculated for selected numerical variables. Statistical significance was assessed, and only significant correlations were displayed in the lower triangle of the correlogram plots. Principal component analysis was performed on log-transformed, centered, and scaled numerical data to explore variable relationships and sample clustering. PCA results were visualized by plotting sample scores in the space of the principal components, including 95% confidence ellipses for varieties and scaled eigenvector loadings. Component loadings for the first three principal components were extracted.
3. Results
3.1. Growing Conditions
Daily values of air temperature (°C) and air humidity (%) during the study period (March–May) are presented in Figure 1. Daily air temperature ranged from 10 °C to 27.5 °C, while the average temperature was 19.7 °C. Air humidity ranged from 52.1% to 95.4%, while the average air humidity was 70.3%.
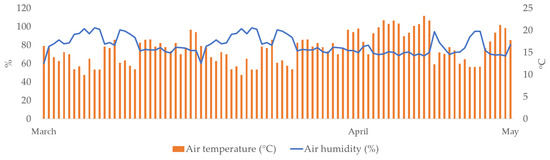
Figure 1.
Daily air temperatures (°C) and air humidity (%) during the study period (March–May 2024).
The irrigation rate was equal for all study treatments (0.25 L/growing pot). A total of ten irrigation rates were added during the study period; therefore, the net irrigation rate was 2.5 L/growing pot. The irrigation events and SWC (%) are presented in Figure 2. SWC ranged from 36 %vol. (management allowable depletion, MAD) to 45 %vol. (SWHC). Consequently, the SWC was maintained at 80% of SWHC, ensuring ideal moisture conditions and thus preventing the plants from experiencing water deficit stress. Considering that irrigation was scheduled to compensate for the water deficit up to the SWHC, the amount of drainage water was negligible.
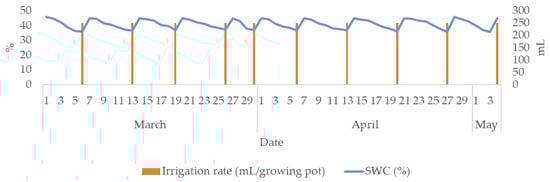
Figure 2.
Substrate water content (%), irrigation rate (ml) and time during the study period (March–May 2024).
3.2. Impact of pH and EC of Irrigation Water and Hydrangea Varieties on Morphologycal Characteristics
3.2.1. The Effect of Irrigation Water pH on the Morphological Characteristics of Hydrangea
Irrigation water pH had a statistically significant effect on all observed morphological properties except flower diameter (Table 3). The highest plant height (Figure 3a, 56.63 cm, p < 0.000), leaf number (Figure 3d, 96.63, p < 0.000), flower weight (Figure 3f, 182.56 g, p < 0.000) and leaf weight (Figure 3g, 156.83 g, p < 0.00) were recorded at pH 6. The highest values for stem number (Figure 3b, 9.71, p < 0.007) and flower number (Figure 3c, 9.54, p < 0.013) were recorded at pH 4, while the highest flower diameter (Figure 3e, 14.6 cm, n.s.) was recorded at pH 7.
Table 3.
Significance of pH, EC and variety on morphological characteristics of hydrangea.
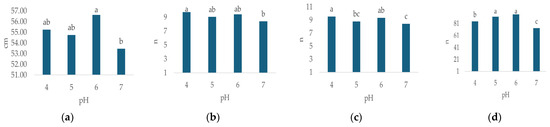
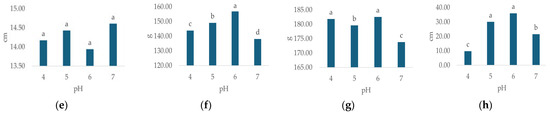
Figure 3.
Average values of observed morphological characteristics: (a) plant height (cm), (b) stem number (n), (c) flower number (n), (d) leaf number (n), (e) flower diameter (cm), (f) leaf weight (g), (g) flower weight (g), and (h) growth index (GI, cm) of hydrangea in different irrigation water pH treatments (pH 4, pH 5, pH 6 and pH 7). Columns with the same letters are not significantly different.
In general, the lowest values of plant height (Figure 3a, 53.46 cm, p < 0.000), stem number (Figure 3b, n = 8.42, p < 0.007), flower number (Figure 3c, n = 8.42, p < 0.013), leaf number (Figure 3d, n = 73.17, p < 0.000), flower weight (Figure 3f, 173.83 g, p < 0.000) and leaf weight (Figure 3g, 138.09 g, p < 0.00) were recorded at pH 7, while the lowest flower diameter (Figure 3e, 13.94 cm, n.s.) was recorded at pH 6. GI varied significantly (p = 0.000) with differing irrigation water pH (Table 3), ranging from 9.8 cm (pH 4) to 36 cm (pH 6), (Figure 3h).
3.2.2. The Effect of Irrigation Water EC on the Morphological Characteristics of Hydrangea
A significant impact of irrigation water EC (Table 3) was recorded for plant height (p < 0.02), flower weight (p < 0.000), leaf weight (p < 0.00), and GI (p < 0.031).
The average values of hydrangea morphological characteristics under different EC treatments are presented in Figure 4. Plant height (Figure 4a, cm) ranged from 54.21 (EC 1) to 56.29 (EC 2), stem number (Figure 4b, n) from 9 (EC 4) to 9.38 (EC 1), flower number (Figure 4c, n) from 8.92 (EC 4) to 9.17 (EC 1), leaf number (Figure 4d, n) from 84.46 (EC 1) to 89.46 (EC 3), flower diameter (Figure 4e, cm) from 13.61 (EC 3) to 14.64 (EC 4), flower weight (Figure 4f, g) from 176.49 (EC 3) to 181.93 (EC 2), leaf weight (Figure 4g, g) from 145.5 (EC 4) to 148.19 (EC 3) and GI (Figure 4h, cm) from 15 (EC 4) to 27.2 (EC 2).
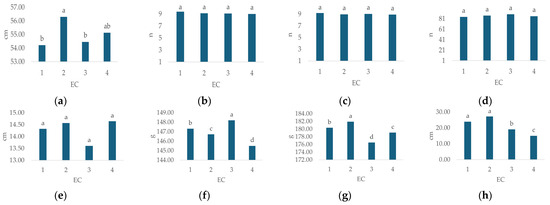
Figure 4.
Average values of observed morphological characteristics: (a) plant height (cm), (b) stem number (n), (c) flower number (n), (d) leaf number (n), (e) flower diameter (cm), (f) leaf weight (g), (g) flower weight (g), and (h) growth index (GI, cm) of hydrangea in different irrigation water EC treatments (EC 1, EC 2, EC 3, and EC 4). Columns with the same letters are not significantly different.
3.2.3. The Effect of Hydrangea Variety on Morphological Characteristics
Morphological characteristics, except leaf number, differed significantly depending on the hydrangea variety (Table 3). The highest plant height (Figure 5a, 6.9 cm), leaf number (Figure 5d, n = 87.5), flower diameter (Figure 5e, 14.8 cm), leaf weight (Figure 5g, 147.9 g) and GI (Figure 5h, 24.3 cm) values were recorded for Early Blue, while the highest stem number (Figure 5b, n = 9.6), flower number (Figure 5c, n = 9.5), and flower weight (Figure 5f, 180.09 cm) values were recorded for the Bianco variety.
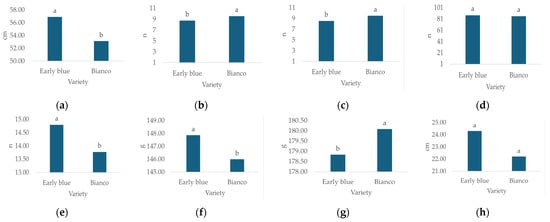
Figure 5.
Average values of observed morphological characteristics: (a) plant height (cm), (b) stem number (n), (c) flower number (n), (d) leaf number (n), (e) flower diameter (cm), (f) leaf weight (g), (g) flower weight (g), and (h) growth index (GI, cm) of hydrangea varieties (1 = Early Blue, 2 = Bianco). Columns with the same letters are not significantly different.
3.2.4. Impact of pH and EC of Irrigation Water and Hydrangea Varieties on Biochemical Parameters
The irrigation water pH and EC significantly affected the MDA and proline content (Table 4). The lowest proline (659.5 µmol g−1 FW, Figure 6a) and MDA (0.215 µmol g−1 FW, Figure 6b) concentrations were recorded in the slightly acidic reaction, i.e., pH 6, while the highest proline (12881.86 µmol g−1 FW, Figure 6a) and MDA (1.257 µmol g−1 FW, Figure 6b) concentrations were measured at pH 4.
Table 4.
The significance of impact of study factors (pH, EC and hydrangea variety) on the proline and MDA content.
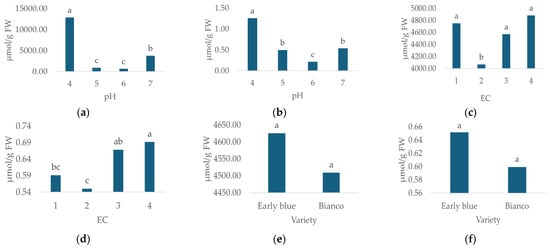
Figure 6.
Proline and MDA concentrations for different irrigation water pH (a,b), EC (c,d) and hydrangea varieties (e,f). Columns with the same letters are not significantly different.
As for the irrigation water EC, the lowest proline (4068.206 µmol g−1 FW, Figure 6c) and MDA (0.550 µmol g−1 FW, Figure 6d) concentrations were recorded in the EC 2 irrigation water treatment, while the highest concentrations of proline (4880.794 µmol g−1 FW, Figure 6c) and MDA (0.691 µmol g−1 FW, Figure 6d) were measured in the EC 4 treatment. In this study, no significant effect of variety on proline and MDA concentrations was recorded (Table 4). The highest proline and MDA concentrations were recorded for the Early Blue variety (Figure 6e,f).
For the Early Blue variety, a very high positive correlation (r = 0.97) was found between the flower and stem number (Figure 7). A high positive correlation was found between leaf and stem number (r = 0.8), leaf and flower number (r = 0.76), and between proline and MDA concentrations (r = 0.86). A moderate positive correlation (r = 0.66) was found between leaf weight and flower weight. A low positive correlation was found between flower weight and stem number (r = 0.36), flower number (r = 0.34), and leaf number (r = 0.41). Furthermore, a low positive correlation was found between leaf weight and stem number (r = 0.39), flower number (r = 0.39), leaf number (r = 0.48), and between proline and flower diameter (r = 0.33). A high negative correlation was found between flower diameter and stem number (r = −0.76), flower number (r = −0.73), and between proline and leaf weight (r = −0.71). A moderate negative correlation was found between flower diameter and leaf number (r = −0.57), proline and stem number (r = −0.52), flower number (r = −0.5), leaf number (r = −0.61), and flower weight (r = −0.6). A moderate negative correlation was also found between MDA and leaf number (r = −0.51) and leaf weight (r = −0.65). A low negative correlation was found between MDA concentration and stem number (r = −0.4), flower number (r = −0.36), and flower weight (r = −0.42).
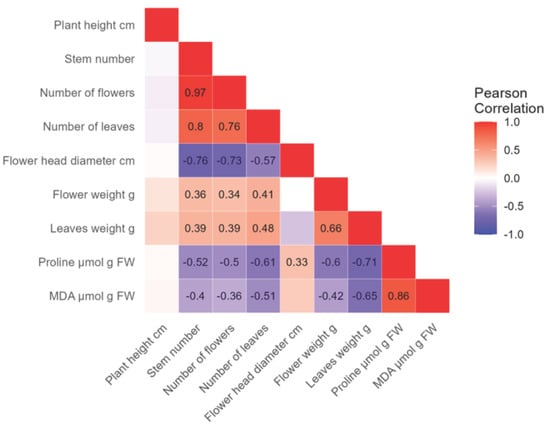
Figure 7.
The analysis shows the negative (−, purple) and positive (+, red) correlations between morphological properties, proline, and MDA concentrations in the Early Blue hydrangea variety. The strength of the correlation and its significance are indicated by a number, while empty fields are not significant.
For the Bianco hydrangea variety, a very high positive correlation (r = 0.96) was found between flower and stem number (Figure 8). A high positive correlation was found between leaf weight and leaf number (r = 0.84) and between proline and MDA concentrations (r = 0.86). A moderate positive correlation was found between flower diameter and plant height (r = 0.41) as well as between flower weight and stem number (r = 0.55) and flower number (r = 0.57). A low positive correlation was found between flower diameter and plant height (r = 0.41), leaf number and plant height (r = 0.39), and flower weight (r = 0.31). A high negative correlation was found between MDA and leaf number (r = −0.73), as well as leaf weight (r = −0.71). A moderate negative correlation was found between proline concentration and leaf number (r = −0.68), and leaf weight (r = −0.65). A low negative correlation was found between flower diameter and stem number (r = −0.4), and flower number (r = −0.4). Furthermore, a low negative correlation was found between proline and plant height (r = −0.41), MDA and plant height (r = 0.42), and flower weight (r = −0.3).
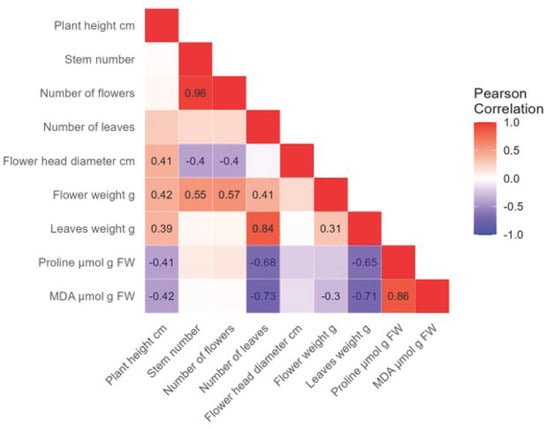
Figure 8.
The analysis shows the negative (−, purple) and positive (+, red) correlations between morphological properties, proline, and MDA concentrations in the Bianco hydrangea variety. The strength of the correlation and its significance are indicated by a number, while empty fields are not significant.
Principal component analysis (PCA) was conducted to analyze the relationships among the measured morphological parameters and to visualize the differences between Variety 1 (Early Blue, red color) and Variety 2 (Bianco, blue color) (Figure 9). The first three principal components (PCs) explained a substantial portion of the total variance in the dataset: PC1 accounted for 45.24%, PC2 for an additional 24.32%, and PC3 for 12.4%. Cumulatively, the first two components (PC1 and PC2) captured 69.56% of the total variability.
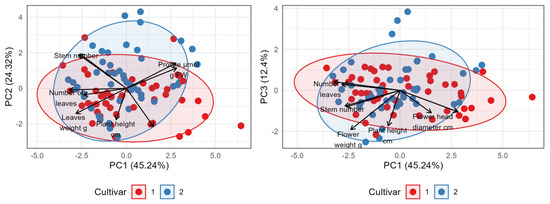
Figure 9.
Biplot of principal components (left: 1 and 2, right: 1 and 3) from PC analysis of variation between two cultivars based on morphological properties, proline and MDA concentrations. Arrows represent the eigenvalues of each of the selected parameters.
The PCA biplots (PC1 vs. PC2 and PC1 vs. PC3) indicate a partial separation of samples based on variety affiliation, which is most pronounced along the PC1 axis. Samples belonging to Variety 1 predominantly exhibited positive scores on the PC1 axis, whereas Variety 2 samples generally showed negative scores on the same axis. Despite this trend, considerable overlap exists between the groups. The PC2 and PC3 axes contributed less to the differentiation between the two varieties. Interpretation of the variable loadings revealed that the PC1 axis is primarily defined by the contrast between plant height and flower diameter, which have strong positive correlations (loadings) with PC1, and variables such as flower number, stem number, leaf number, and leaf weight, which have strong negative correlations with PC1. Thus, PC1 effectively separates varieties characterized by greater height and flower diameter from those featuring a higher number of flowers, stems, and leaves, with greater leaf weight. The PC2 axis further differentiates samples, mainly contrasting plant height (positive loading) against most other measured growth parameters (negative loadings). The PCA analysis successfully summarizes the main sources of variation within the data. It indicates that Variety 1 and Variety 2 are partially distinct, with the primary difference (explained by PC1) being that Variety 1 tends towards taller plants with larger flower head diameters, whereas Variety 2 tends towards a higher number of flowers, stems, and leaves, and greater leaf weight. Significant variability exists within each variety.
4. Discussion
The objective of this study was to analyze the effect of irrigation water pH and electrical conductivity (EC) on the morphological properties and biochemical responses of two hydrangea varieties (Early Blue and Bianco). Growing conditions during the study period were ideal for hydrangeas: the substrate water content (SWC) was in the range of readily available water (RAW, Figure 2), air temperature was moderate, and air humidity was high (Figure 1). Sources from the literature list different optimal SWC and MAD values for growing hydrangeas, such as 0.24 m3 m–3 [49] and 0.37 cm3 cm−3 [50] for pine bark substrate, suggesting that hydrangeas require relatively high water content in the growing substrate to maximize plant growth and avoid water stress [51]. Generally, hydrangeas require high air humidity, while a decrease in humidity leads to a decrease in height and in leaf growth [52]. As previously stated by Nordli et al. [53], temperatures between 15 and 18 °C promote generative growth, and temperatures above 24 °C enhance the vegetative growth of hydrangeas.
The most important finding of this study was the effect of irrigation water pH on nearly all observed morphological properties (Table 3) as well as proline and MDA concentrations (Table 4). Our findings emphasize the importance of an optimal irrigation water pH range in hydrangea cultivation, which is contrary to the findings of Zaman et al. [54] who claim that the pH of the irrigation water is not an acceptable criterion of water quality because the water pH tends to be buffered by soil, and most crops can tolerate a wide pH range. In this study, the highest values for most morphological parameters related to plant size and biomass, specifically plant height, leaf number, and the weight of both leaves and flowers, were observed at pH 6 (Figure 3). This result is consistent with established horticultural knowledge of acid-loving plants like hydrangeas [11]. Generally, a substrate pH in a slightly acidic range (5.5 to 6.5) is known to optimize the availability of essential micronutrients such as iron (Fe), manganese (Mn), aluminum (Al), and macronutrients, promoting robust vegetative and floral development [11,47,48], the micronutrients become less available at higher, alkaline pH levels [25]. This explains why the plants in our pH 6 treatment exhibited the greatest biomass (leaf and flower weight, (Figure 3f,g) and lowest stress indicators (Figure 6a,b) because plants were not limited by nutrient deficiency or toxicity and could perform metabolic functions like photosynthesis and protein synthesis efficiently. Conversely, limited growth (Figure 3) was recorded at pH 7, which likely induced nutrient deficiencies, particularly in iron, leading to reduced biomass accumulation [11,47]. An interesting finding is that the highest stem (Figure 3b) and flower number (Figure 3c) were recorded at a low pH (4), usually associated with a change in hydrangea flower color [55,56], which was not observed in this study. Although it is well-established that soil pH significantly influences anthocyanin pigment synthesis in H. macrophylla, leading to blue coloration at lower pH values and pink/red coloration at higher pH values, it should be noted that not all cultivars react with the same intensity or speed [57,58]. Some varieties may require more extreme or prolonged low-pH conditions to exhibit a noticeable color shift, or the genetic background of the Early Blue variety tested might predispose it to less dramatic color changes. Nevertheless, as stated by Moore [59], some varieties do not produce blue blooms, regardless of pH. While the low, slightly acidic pH (4) might seem like a stressor, our results suggest it likely provided optimal nutrient availability and uptake and optimized the solubility and availability of iron and manganese [60,61,62], which are crucial for various physiological processes, including those underpinning robust vegetative growth and flower initiation. As stated by Barrow and Hartemink [63], the effects of pH on nutrient availability are not solely due to the effects of reaction with soils but are an interaction between these effects and the effects on the rate of uptake by plants.
Also, in this study, no visible changes such as necrosis or leaf color changes were observed. Despite statistical significance within minor changes in irrigation water pH and EC (narrow range) in most of the observed morphological characteristics, both varieties maintained their aesthetically attractive appearance, flower size and color until the end of the growing season. Therefore, the visual score analysis for all study treatments showed a score of 5, corresponding to 0% damage.
Nevertheless, the principal component analysis (PCA) effectively visualized the distinct morphological strategies of the two varieties. A clear separation along the PC1 axis revealed a fundamental trade-off: Early Blue tended towards taller plants with larger flower diameters, while Bianco produced a higher number of stems and flowers, resulting in a bushier habit with greater leaf mass. This finding is of importance for commercial growers, as the choice of variety can be tailored to the desired aesthetic outcome. Early Blue produces prominent, large blooms and Bianco produces dense, multi-flowered plants.
Despite these significant differences in morphology, it is crucial to note that there was no statistically significant difference in the proline or MDA responses between the two varieties. This suggests that while their genetic blueprints dictate different growth habits, their fundamental physiological tolerance to the tested pH and EC stresses was comparable. To mitigate abiotic stress, plants employ several methods of avoidance, adaptation, and acclimation [64]. As stated by Yang et al. [65], plants under abiotic stress can adapt to changing environmental factors through phenotypic plasticity, whereby the plants’ salt and pH tolerance vary among species, and even cultivars within a species [31,66,67,68,69,70]. However, limited information is available on the salt tolerance of hydrangea, particularly among different species and cultivars [71]. It seems that the hydrangea varieties used in this study have the same adaptive response to abiotic stress, yet different morphological responses to abiotic stress. Similar findings were reported for alfalfa [72], hydrangea [73], Pennisetum glaucum L. [74], Acer rubrum L. [75] in response to various abiotic stresses. Furthermore, the proline and MDA data provide a clear physiological explanation for the morphological results. Proline, an osmoprotectant, and MDA, an indicator of lipid peroxidation and cellular damage, were lowest at pH 6 and EC 2—the same treatments that generally yielded the best morphological parameters. Conversely, their concentrations were highest at the extremes of pH 4 and EC 4, confirming that these conditions were physiologically stressful for the hydrangea plants. The strong positive correlation between proline and MDA (r = 0.86 for both varieties) further reinforces that the plants were experiencing significant oxidative stress under these adverse conditions [43,76]. The negative correlations observed, particularly between stress indicators (proline/MDA) and growth parameters (e.g., leaf weight and leaf number), are also very telling. For instance, in Early Blue, as proline increased, leaf weight and the number of leaves decreased. This directly supports the conclusion that the physiological stress experienced by the plants actively inhibited their ability to produce and maintain biomass.
The extremely high levels of proline and MDA at pH 4 indicate a significant stress response. It is possible that the highly acidic conditions, while potentially increasing the number of flowering branches, were detrimental to the overall health and biomass of the plant, essentially forcing a stress-induced flowering response rather than promoting healthy growth [32,50]. This highlights a critical trade-off between the number of flowers and the overall quality and size of the plant.
While less impactful than pH, EC also significantly affected morphological parameters, including plant height and flower and leaf weight, with a non-linear response to EC observed. The highest stress markers (proline and MDA) were observed at the highest EC level (EC 4), which is an expected outcome as elevated salinity induces osmotic stress and ion toxicity [16,77,78] and stimulates the accumulation of proline [79]. The data show a direct and significant correlation between the increasing EC of the irrigation water and the concentration of proline in the hydrangea leaf tissue. Specifically, the highest proline concentration (4880.794 µmol g−1 FW) was measured in the EC 4 treatment, which represented the highest salinity level in this study. When subjected to high salinity (a high EC value), the plant experiences osmotic stress, making it difficult for the roots to absorb water from the substrate [80]. However, the optimal morphological results were often found in the moderate EC treatments (EC 2) rather than the lowest (EC 1). This suggests that the EC 1 treatment may have provided insufficient nutrient concentrations for maximal growth, while the EC 4 treatment began to cause detrimental salinity effects. Therefore, an optimal irrigation water EC range exists that supplies adequate nutrients without inducing stress, and our findings place this optimum level at around the EC 2 and EC 3 levels tested in this study. This result aligns well with the findings of a previous study by Miralles et al. [32], wherein watering with irrigation water with EC 5.65 dS m−1 severely decreased the size of all hydrangea aerial organs (leaves, inflorescences, and flowers), reduced the dry weight of the aerial part by 70%, delayed flowering development, and produced a darker, pink-colored flower compared with freshwater treatment. The same authors claim that a high EC also caused tip and edge burn in the leaves, the overall effect being a non-commercial plant. Similar findings are reported by Niu et al. [71] who assessed the relative salt tolerance of 11 cultivars of hydrangea, including H. macrophylla. The authors noted that the leaf area and total shoot dry weight (DW) of all cultivars in EC 5 and EC 10 treatments were significantly reduced compared to the control treatment (EC 1) and that the high EC levels were negatively correlated with visual quality, leaf area and shoot DW. In this study, the highest EC level (4) induced clear salinity stress, evidenced by the peak concentrations of proline and malondialdehyde (MDA). This was due to a combination of osmotic stress, which limits water uptake and triggers proline accumulation for cellular protection and direct ion toxicity, which causes the cellular membrane damage indicated by the rise in MDA [76].
The highest GI (Figure 3h) was recorded at pH 6 (36 cm). A further decrease in pH led to a reduction in GI by 16.7% at pH 5 and a substantial 72.8% at pH 4. Conversely, an increase to pH 7 resulted in a 40.3% reduction. These findings align with Thakur et al. [1], who report that hydrangeas thrive best in soil or media with a pH range of 5.5–6.5. Regarding EC, the highest GI value (Figure 4h) was observed in the EC 2 treatment, reaching 27.2 cm. Further increases in EC led to significant GI reductions: 30.2% at EC 3 and 44.9% at EC 4. Conversely, in the control treatment (EC 1), the GI value was 12.1% lower compared to EC 2. Therefore, concerning vegetative growth, this study indicates that the most favorable irrigation water pH and EC values are pH 6 and EC 2, respectively. This is consistent with Wu and Dodge [81], who consider hydrangea moderately salinity tolerant, as it performs well with substrate EC values between 2 and 4 dS m−1. In this study, the Early Blue variety exhibited an 8.6% higher GI compared to the Bianco variety. In general, limited information is available on the growth and salt tolerance of hydrangea, particularly among different species and cultivars [71].
This study was conducted under controlled greenhouse conditions over a single growing season which allows control of growing conditions and tested factors; however, the results may differ in field conditions with changing environmental factors. Future research should include leaf analysis to directly measure the nutrient content and confirm the mechanisms behind the observed growth differences in pH treatments. Also, investigating a wider range of EC values could also help to more precisely define the upper and lower limits for optimal hydrangea production.
5. Conclusions
In conclusion, the pH of irrigation water is the most critical factor influencing the growth and health of H. macrophylla. For maximizing overall plant size and biomass, a pH of 6.0 is optimal. Extreme acidity (pH 4) and neutrality (pH 7) are detrimental, inducing physiological stress that limits growth, despite the former potentially increasing flower number. EC should also be carefully managed to a moderate level to ensure adequate nutrient supply without causing salinity stress. This research highlights pH 6 and EC 2 as critical parameters for enhancing hydrangea biomass and minimizing plant stress, which is an important finding for hydrangea cultivation. Finally, the choice between the Early Blue and Bianco varieties should be based on the desired morphological outcome, as they exhibit a clear trade-off between plant height/flower size and plant height/flower number, while sharing a similar tolerance to pH and EC stress. These findings provide practical, data-driven guidelines for optimizing the commercial production of these economically valuable ornamental plants.
Author Contributions
Conceptualization, M.M., L.G. and V.T.; methodology, M.M., V.T. and I.J.; formal analysis, M.M., M.R. and V.T.; investigation, M.M., I.J. and. L.G.; data curation, M.M., V.G. and Ž.B.; writing—original draft preparation, M.M., L.G. and I.J.; writing—review and editing, M.M., M.R. and Ž.B.; visualization, V.G. and Ž.B.; supervision, M.M. and I.J. All authors have read and agreed to the published version of the manuscript.
Funding
This research received no external funding.
Institutional Review Board Statement
Not applicable.
Informed Consent Statement
Not applicable.
Data Availability Statement
The original contributions presented in the study are included in the article, further inquiries can be directed to the corresponding author.
Conflicts of Interest
The authors declare no conflicts of interest.
References
- Thakur, R.; Thakur, R.; Chandermohan, C.N.; Kanwar, B.; Sharma, S. Hydrangea Cultivation: Advances in Propagation, Soil Management, and Disease Control. J. Plant Biota 2024, 4, 11–15. [Google Scholar] [CrossRef]
- Xue, C.; Wen, Y.; Sheng, S.; Gao, Y.; Zhang, Y.; Chen, T.; Peng, J.; Cao, S. Hormonal Regulation and Transcriptomic Insights into Flower Development in Hydrangea paniculata ‘Vanilla Strawberry’. Plants 2024, 13, 486. [Google Scholar] [CrossRef]
- Croatian Bureau of Statistics. Flower Production. Available online: https://web.dzs.hr/PxWeb/pxweb/hr/Poljoprivreda,%20lov,%20%c5%a1umarstvo%20i%20ribarstvo/Poljoprivreda,%20lov,%20%c5%a1umarstvo%20i%20ribarstvo__Biljna%20proizvodnja/BP1_NUTS2021.px/ (accessed on 23 July 2025).
- Croatian Chamber of Economy. Cvijeće Uvezeno u Listopadu Vrijedi pet Milijuna Kuna. Available online: https://www.hgk.hr/cvijece-uvezeno-u-listopadu-vrijedi-pet-milijuna-kuna (accessed on 23 July 2025).
- Zuo, Y.; Zhang, J.; Zhao, R.; Dai, H.; Zhang, Z. Application of Vermicompost Improves Strawberry Growth and Quality through Increased Photosynthesis Rate, Free Radical Scavenging and Soil Enzymatic Activity. Sci. Hortic. 2018, 233, 132–140. [Google Scholar] [CrossRef]
- Yang, T.; Samarakoon, U.; Altland, J.; Ling, P. Influence of Electrical Conductivity on Plant Growth, Nutritional Quality, and Phytochemical Properties of Kale (Brassica napus) and Collard (Brassica oleracea) Grown Using Hydroponics. Agronomy 2024, 14, 2704. [Google Scholar] [CrossRef]
- Shreckhise, J.H.; Owen, J.S.; Niemiera, A.X. Growth Response of Hydrangea macrophylla and Ilex crenata Cultivars to Low-Phosphorus Controlled-Release Fertilizers. Sci. Hortic. 2019, 246, 578–588. [Google Scholar] [CrossRef]
- Lin, M.H.; Gresshoff, P.M.; Ferguson, B.J. Systemic Regulation of Soybean Nodulation by Acidic Growth Conditions. Plant Physiol. 2012, 160, 2028–2039. [Google Scholar] [CrossRef] [PubMed]
- Rathinapriya, P.; Maharajan, T.; Jothi, R.; Prabakaran, M.; Lee, I.B.; Yi, P.H.; Jeong, S.T. Unlocking Biochar Impacts on Abiotic Stress Dynamics: A Systematic Review of Soil Quality and Crop Improvement. Front. Plant Sci. 2024, 15, 1479925. [Google Scholar] [CrossRef] [PubMed]
- Cassaniti, C.; Romano, D.; Flowers, T.J. The Response of Ornamental Plants to Saline Irrigation Water. In Irrigation—Water Management, Pollution and Alternative Strategies; InTech: Naples, FL, USA, 2012. [Google Scholar]
- Xiao, J.; Guo, G.; Jeong, B.R. Iron Supplement-enhanced Growth and Development of Hydrangea macrophylla in Vitro under Normal and High Ph. Cells 2021, 10, 3151. [Google Scholar] [CrossRef] [PubMed]
- Li, Z.; Lyu, T.; Lyu, Y. The Molecular Biology Analysis for the Growing and Development of Hydrangea macrophylla ‘Endless Summer’ under Different Light and Temperature Conditions. Horticulturae 2024, 10, 586. [Google Scholar] [CrossRef]
- Wortman, S.E. Crop Physiological Response to Nutrient Solution Electrical Conductivity and PH in an Ebb-and-Flow Hydroponic System. Sci. Hortic. 2015, 194, 34–42. [Google Scholar] [CrossRef]
- Friedman, S.P. Soil Properties Influencing Apparent Electrical Conductivity: A Review. Comput. Electron. Agric. 2005, 46, 45–70. [Google Scholar] [CrossRef]
- Smith, J.L.; Doran, J.W. Measurement and Use of PH and Electrical Conductivity for Soil Quality Analysis. Methods Assess. Soil Qual. 2015, 49, 169–185. [Google Scholar] [CrossRef]
- Ahirwar, S.; Hasan, M. The Effect of Electrical Conductivity of Irrigation Water on Water Uptake by Capsicum in Soilless Media. Int. J. Curr. Microbiol. Appl. Sci. 2018, 7, 2307–2319. [Google Scholar] [CrossRef]
- Lam, V.P.; Kim, S.J.; Park, J.S. Optimizing the Electrical Conductivity of a Nutrient Solution for Plant Growth and Bioactive Compounds of Agastache rugosa in a Plant Factory. Agronomy 2020, 10, 76. [Google Scholar] [CrossRef]
- Ding, X.; Jiang, Y.; Zhao, H.; Guo, D.; He, L.; Liu, F.; Zhou, Q.; Nandwani, D.; Hui, D.; Yu, J. Electrical Conductivity of Nutrient Solution Influenced Photosynthesis, Quality, and Antioxidant Enzyme Activity of Pakchoi (Brassica campestris L. ssp. chinensis) in a Hydroponic System. PLoS ONE 2018, 13, e0202090. [Google Scholar] [CrossRef] [PubMed]
- Omar, M.M.; Shitindi, M.J.; Massawe, B.H.J.; Pedersen, O.; Meliyo, J.L.; Fue, K.G. Modeling the Electrical Conductivity Relationship between Saturated Paste Extract and 1:2.5 Dilution in Different Soil Textural Classes. Front. Soil Sci. 2024, 4, 1421661. [Google Scholar] [CrossRef]
- Bamsey, M.; Graham, T.; Thompson, C.; Berinstain, A.; Scott, A.; Dixon, M. Ion-Specific Nutrient Management in Closed Systems: The Necessity for Ion-Selective Sensors in Terrestrial and Space-Based Agriculture and Water Management Systems. Sensors 2012, 12, 13349–13392. [Google Scholar] [CrossRef]
- Zhao, C.; Zhang, H.; Song, C.; Zhu, J.K.; Shabala, S. Mechanisms of Plant Responses and Adaptation to Soil Salinity. Innovation 2020, 1, 100017. [Google Scholar] [CrossRef]
- Nemali, K.S.; van Iersel, M.W. Light intensity and fertilizer concentration: I. Estimating optimal fertilizer concentrations from water-use efficiency of wax begonia. HortScience 2004, 39, 1287–1292. [Google Scholar] [CrossRef]
- Gao, Y.; Wu, J.; Pan, Y.; Zhao, J.; Zou, X. Effects of Different pH Values on the Growth and Physiological Characteristics of Anoectochilus roxburghii. J. Plant Growth Regul. 2025. [Google Scholar] [CrossRef]
- Ramut, R.; Chohura, P.; Jama-Rodzeńska, A. Effect of nutrient solution pH on the quality of Lactuca sativa L. in a hydroponic system under struvite fertilization. J. Elem. 2024, 29, 863–880. [Google Scholar] [CrossRef]
- Ferrarezi, R.S.; Lin, X.; Gonzalez Neira, A.C.; Tabay Zambon, F.; Hu, H.; Wang, X.; Huang, J.H.; Fan, G. Substrate pH Influences the Nutrient Absorption and Rhizosphere Microbiome of Huanglongbing-Affected Grapefruit Plants. Front. Plant Sci. 2022, 13, 856937. [Google Scholar] [CrossRef]
- Penn, C.J.; Camberato, J.J. A Critical Review on Soil Chemical Processes that Control How Soil pH Affects Phosphorus Availability to Plants. Agriculture 2019, 9, 120. [Google Scholar] [CrossRef]
- Valdez-Aguilar, L.A.; Grieve, C.M.; Poss, J.; Mellano, M.A. Hypersensitivity of Ranunculus asiaticus to Salinity and Alkaline pH in Irrigation Water in Sand Cultures. HortScience 2009, 44, 138–144. [Google Scholar] [CrossRef]
- Valdez-Aguilar, L.A.; Grieve, C.M.; Poss, J. Salinity and Alkaline pH in Irrigation Water Affect Marigold Plants: I. Growth and Shoot Dry Weight Partitioning. HortScience 2009, 44, 1719–1725. [Google Scholar] [CrossRef]
- Valdez-Aguilar, L.A.; Grieve, C.M.; Poss, J.; Layfield, D.A. Salinity and Alkaline pH in Irrigation Water Affect Marigold Plants: II. Mineral Ion Relations. HortScience 2009, 44, 1726–1735. [Google Scholar] [CrossRef]
- Loganathachetti, D.S.; Mundra, S. Water pH, not soil pH, alters bacterial community structural pattern and nitrogen cycling pathways in date palm (Phoenix dactylifera L.) roots and bulk soil under freshwater irrigation regime. Front. Ecol. Evol. 2023, 11, 1142073. [Google Scholar] [CrossRef]
- Conolly, N.B.; Bassuk, N.L.; MacRae, P.F., Jr. Response of five hydrangea species to foliar salt spray. J. Environ. Hort. 2010, 28, 125–128. [Google Scholar] [CrossRef]
- Miralles, J.; Valdés, R.; Franco, J.A.; Bañón, S.; Sánchez-Blanco, M.J. Irrigation of Hydrangea with Saline Reclaimed Wastewater: Effects of Fresh Water Flushing. Acta Hortic. 2013, 1000, 229–236. [Google Scholar] [CrossRef]
- Cerrato, M.D.; Mir-Rosselló, P.M.; Cortés-Fernández, I.; Ribas-Serra, A.; Douthe, C.; Cardona, C.; Sureda, A.; Flexas, J.; Gil Vives, L. Insights on Physiological, Antioxidant and Flowering Response to Salinity Stress of Two Candidate Ornamental Species: The Native Coastal Geophytes Pancratium maritimum L. and Eryngium maritimum L. Physiol. Mol. Biol. Plants 2024, 30, 1533–1549. [Google Scholar] [CrossRef]
- Pintó-Marijuan, M.; Munné-Bosch, S. Photo-Oxidative Stress Markers as a Measure of Abiotic Stress-Induced Leaf Senescence: Advantages and Limitations. J. Exp. Bot. 2014, 65, 3845–3857. [Google Scholar] [CrossRef]
- Lamers, J.; Van Der Meer, T.; Testerink, C. How Plants Sense and Respond to Stressful Environments. Plant Physiol. 2020, 182, 1624–1635. [Google Scholar] [CrossRef]
- Teklić, T.; Parađiković, N.; Špoljarević, M.; Zeljković, S.; Lončarić, Z.; Lisjak, M. Linking Abiotic Stress, Plant Metabolites, Biostimulants and Functional Food. Ann. Appl. Biol. 2021, 178, 169–191. [Google Scholar] [CrossRef]
- Esfandiari, E.O.; Shakiba, M.R.; Mahboob, S.A.; Alyari, H.; Toorchi, M. Water Stress, Antioxidant Enzyme Activity and Lipid Peroxidation in Wheat Seedling. J. Food Agric. Environ. 2007, 5, 149–153. [Google Scholar]
- Pál, M.; Horváth, E.; Janda, T.; Páldi, E.; Szalai, G. Physiological Changes and Defense Mechanisms Induced by Cadmium Stress in Maize. J. Plant Nutr. Soil Sci. 2006, 169, 239–246. [Google Scholar] [CrossRef]
- Alshammari, W.B.; Alshammery, K.; Lotfi, S.; Altamimi, H.; Alshammari, A.; Al-Harbi, N.A.; Jakovljević, D.; Alharbi, M.H.; Moustapha, M.E.; Abd El-Moneim, D.; et al. Improvement of Morphophysiological and Anatomical Attributes of Plants under Abiotic Stress Conditions Using Plant Growth-Promoting Bacteria and Safety Treatments. PeerJ 2024, 12, e17286. [Google Scholar] [CrossRef]
- Rédei, G.P. Proline Biosynthesis. In Encyclopedia of Genetics, Genomics, Proteomics and Informatics, 3rd ed.; Springer: New York, NY, USA, 2008; pp. 1563–1564. [Google Scholar]
- Lopez-Delacalle, M.; Silva, C.J.; Mestre, T.C.; Martinez, V.; Blanco-Ulate, B.; Rivero, R.M. Synchronization and Interaction of Proline, Ascorbate and Oxidative Stress Pathways under Abiotic Stress Combination in Tomato Plants. Environ. Exp. Bot. 2021, 183, 104351. [Google Scholar] [CrossRef]
- Mansour, M.M.F.; Ali, E.F. Evaluation of Proline Functions in Saline Conditions. Phytochemistry 2017, 140, 52–68. [Google Scholar] [CrossRef]
- Hayat, S.; Hayat, Q.; Alyemeni, M.N.; Wani, A.S.; Pichtel, J.; Ahmad, A. Role of Proline under Changing Environments: A Review. Plant Signal Behav. 2012, 7, 37–41. [Google Scholar] [CrossRef] [PubMed]
- Ayers, R.S.; Westcot, D.W. Water Quality for Agriculture; Food and Agriculture Organization of the United Nations: Rome, Italy, 1985. [Google Scholar]
- Kos, Z. Kriteriji Kvalitete Vode Za Natapanje. Priručnik za Hidrotehničke Melioracije, Kvaliteta i Raspoloživost Vode Za Natapanje; Građevinski Fakultet Sveučilišta u Rijeci: Rijeka, Croatia, 1997; pp. 5–68. [Google Scholar]
- FAO. Standard Operating Procedure for Soil Moisture Content by Gravimetric Method; FAO: Rome, Italy, 2023. [Google Scholar]
- Liu, Q.; Sun, Y.; Niu, G.; Altland, J.; Chen, L.; Jiang, L. Morphological and physiological responses of ten ornamental taxa to saline water irrigation. HortScience 2017, 52, 1816–1822. [Google Scholar] [CrossRef]
- Duan, Y.; Zhang, Y.; Zhao, B. Lead, Zinc Tolerance Mechanism and Phytoremediation Potential of Alcea rosea (Linn.) Cavan. and Hydrangea macrophylla (Thunb.) Ser. and Ethylenediaminetetraacetic Acid Effect. Environ. Sci. Pollut. Res. Int. 2022, 29, 41329–41343. [Google Scholar] [CrossRef]
- O’Meara, L.; Chappell, M.R.; van Iersel, M.W. Water Use of Hydrangea macrophylla and Gardenia jasminoides in Response to a Gradually Drying Substrate. HortScience 2014, 49, 493–498. [Google Scholar] [CrossRef]
- Basiri Jahromi, N.; Fulcher, A.; Walker, F.; Altland, J. Photosynthesis, Growth, and Water Use of Hydrangea paniculata ‘Silver Dollar’ Using a Physiological-Based or a Substrate Physical Properties-Based Irrigation Schedule and a Biochar Substrate Amendment. Irrig. Sci. 2020, 38, 263–274. [Google Scholar] [CrossRef]
- Li, T.; Bi, G.; Harkess, R.L.; Denny, G.C.; Scagel, C. Nitrogen Fertilization and Irrigation Frequency Affect Hydrangea Growth and Nutrient Uptake in Two Container Types. HortScience. 2019, 54, 167–174. [Google Scholar] [CrossRef]
- Codarin, S.; Galopin, G.; Chasseriaux, G. Effect of air humidity on the growth and morphology of Hydrangea macrophylla L. Sci. Hortic. 2006, 108, 303–309. [Google Scholar] [CrossRef]
- Nordli, E.F.; Strøm, M.; Torre, S. Temperature and photoperiod control of morphology and flowering time in two greenhouse grown Hydrangea macrophylla cultivars. Sci. Hortic. 2011, 127, 372–377. [Google Scholar] [CrossRef]
- Zaman, M.; Shahid, S.A.; Heng, L. Irrigation Water Quality. In Guideline for Salinity Assessment, Mitigation and Adaptation Using Nuclear and Related Techniques; Springer: Cham, Switzerland, 2018. [Google Scholar] [CrossRef]
- Rahmati, R.; Hamid, R.; Ghorbanzadeh, Z.; Jacob, F.; Azadi, P.; Zeinalabedini, M.; Farsad, L.K.; Kazemi, M.; Ebrahimi, M.A.; Shahinnia, F.; et al. Comparative transcriptome analysis unveils the molecular mechanism underlying sepal colour changes under acidic pH substratum in Hydrangea macrophylla. Int. J. Mol. Sci. 2022, 23, 15428. [Google Scholar] [CrossRef] [PubMed]
- Anaya-Covarrubias, J.Y.; Larranaga, N.; Almaráz-Abarca, N.; Escoto-Delgadillo, M.; Rodríguez-Macías, R.; Torres-Morán, M.I. Hydrangea DNA Methylation Caused by pH Substrate Changes to Modify Sepal Colour is Detected by MSAP and ISSR Markers. Agronomy 2019, 9, 871. [Google Scholar] [CrossRef]
- Midcap, J.T.; Bilderback, T.E. Evaluating Hydrangea Production with Improved Substrates; Center Applied Nursery Research: Athens, GA, USA, 2002; p. 3. [Google Scholar]
- Pietsch, G.M.; Brindley, J.C.; Owen, J.S., Jr.; Fulcher, A. A Fine Line between Phytotoxicity and Blue When Producing Hydrangea macrophylla in a Nursery at a Low Substrate pH. Horticulturae 2022, 8, 690. [Google Scholar] [CrossRef]
- Moore, G.M. Mechanisms of hormone action in plants. Proc. Plant Propagators’ Soc. 1984, 34, 79–90. [Google Scholar]
- Morrissey, J.; Guerinot, M.L. Iron uptake and transport in plants: The good, the bad, and the ionome. Chem Rev. 2009, 109, 4553–4567. [Google Scholar] [CrossRef] [PubMed]
- Broadley, M.; Brown, P.; Cakmak, I.; Rengel, Z.; Zhao, F. Function of nutrients: Micronutrients. In Marschner’s Mineral Nutrition of Higher Plants, 3rd ed.; Marschner, P., Ed.; Elsevier: Oxford, UK, 2012. [Google Scholar] [CrossRef]
- Khoshru, B.; Mitra, D.; Nosratabad, A.F.; Reyhanitabar, A.; Mandal, L.; Farda, B.; Djebaili, R.; Pellegrini, M.; Guerra-Sierra, B.E.; Senapati, A.; et al. Enhancing Manganese Availability for Plants through Microbial Potential: A Sustainable Approach for Improving Soil Health and Food Security. Bacteria 2023, 2, 129–141. [Google Scholar] [CrossRef]
- Barrow, N.J.; Hartemink, A.E. The effects of pH on nutrient availability depend on both soils and plants. Plant Soil 2023, 487, 21–37. [Google Scholar] [CrossRef]
- Saharan, B.S.; Brar, B.; Duhan, J.S.; Kumar, R.; Marwaha, S.; Rajput, V.D.; Minkina, T. Molecular and Physiological Mechanisms to Mitigate Abiotic Stress Conditions in Plants. Life 2022, 12, 1634. [Google Scholar] [CrossRef] [PubMed]
- Yang, X.; Lu, M.; Wang, Y.; Wang, Y.; Liu, Z.; Chen, S. Response Mechanism of Plants to Drought Stress. Horticulturae 2021, 7, 50. [Google Scholar] [CrossRef]
- Munns, R.; Tester, M. Mechanisms of salinity tolerance. Annu. Rev. Plant Biol. 2008, 59, 651–681. [Google Scholar] [CrossRef]
- Bian, M.; Zhou, M.; Sun, D.; Li, C. Molecular approaches unravel the mechanism of acid soil tolerance in plants. Crop J. 2013, 1, 91–104. [Google Scholar] [CrossRef]
- Toscano, S.; Romano, D.; Ferrante, A. Molecular Responses of Vegetable, Ornamental Crops, and Model Plants to Salinity Stress. Int. J. Mol. Sci. 2023, 24, 3190. [Google Scholar] [CrossRef]
- Wang, Z.; Nepal, P.; Kelly, M.; Porter, A.; Sun, Y.; Zhang, Y. Morphological and Physiological Responses of Three Ornamental Species to Saline Water Irrigation. HortScience 2025, 60, 940–952. [Google Scholar] [CrossRef]
- Rius-García, X.; Videgain-Marco, M.; Casanova-Gascón, J.; Acuña-Rello, L.; Zufiaurre-Galarza, R.; Martín-Ramos, P. Evaluation of Salt Tolerance in Four Self-Rooted Almond Genotypes for Super-High-Density Orchards Under Varying Salinity Levels. Agriculture 2025, 15, 254. [Google Scholar] [CrossRef]
- Niu, G.; Sun, Y.; Hooks, T.; Altland, J.; Dou, H.; Perez, C. Salt Tolerance of Hydrangea Plants Varied among Species and Cultivar within a Species. Horticulturae 2020, 6, 54. [Google Scholar] [CrossRef]
- Wang, F.; Wu, H.; Yang, M.; Xu, W.; Zhao, W.; Qiu, R.; Kang, N.; Cui, G. Unveiling Salt Tolerance Mechanisms and Hub Genes in Alfalfa (Medicago sativa L.) Through Transcriptomic and WGCNA Analysis. Plants 2024, 13, 3141. [Google Scholar] [CrossRef]
- Naumann, A.; Horst, W.J. Effect of aluminium supply on aluminium uptake, translocation and blueing of Hydrangea macrophylla (Thunb.) Ser. cultivars in a peat-clay substrate. J. Hortic. Sci. Biotechnol. 2003, 78, 463–469. [Google Scholar] [CrossRef]
- Rashid, M.; Noreen, S.; Shah, K.H.; Gaafar, A.R.Z.; Waqar, R. Morphological and biochemical variations caused by salinity stress in some varieties of Pennisetum glaucum L. J. King Saud Univ. Sci. 2024, 36, 102994. [Google Scholar] [CrossRef]
- Bissiwu, P.; Kulkarni, K.P.; Melmaiee, K.; Elavarthi, S. Physiological and Molecular Responses of Red Maple (Acer rubrum L.) Cultivars to Drought Stress. Plant Breed. Biotech. 2022, 10, 62–74. [Google Scholar] [CrossRef]
- Gill, S.S.; Tuteja, N. Reactive Oxygen Species and Antioxidant Machinery in Abiotic Stress Tolerance in Crop Plants. Plant Physiol. Biochem. 2010, 48, 909–930. [Google Scholar] [CrossRef] [PubMed]
- Huang, L.; Liu, X.; Wang, Z.; Liang, Z.; Wang, M.; Liu, M.; Suarez, D.L. Interactive Effects of PH, EC and Nitrogen on Yields and Nutrient Absorption of Rice (Oryza sativa L.). Agric. Water Manag. 2017, 194, 48–57. [Google Scholar] [CrossRef]
- Soufi, H.R.; Roosta, H.R.; Hamidpour, M. The Plant Growth, Water and Electricity Consumption, and Nutrients Uptake Are Influenced by Different Light Spectra and Nutrition of Lettuce. Sci. Rep. 2023, 13, 20766. [Google Scholar] [CrossRef] [PubMed]
- Sun, J.; He, L.; Li, T. Response of Seedling Growth and Physiology of Sorghum bicolor (L.) Moench to Saline-Alkali Stress. PLoS ONE 2019, 14, e0220340. [Google Scholar] [CrossRef]
- Altaf, M.A.; Shahid, R.; Ren, M.X.; Altaf, M.M.; Khan, L.U.; Shahid, S.; Jahan, M.S. Melatonin Alleviates Salt Damage in Tomato Seedling: A Root Architecture System, Photosynthetic Capacity, Ion Homeostasis, and Antioxidant Enzymes Analysis. Sci. Hortic. 2021, 285, 110145. [Google Scholar] [CrossRef]
- Wu, L.; Dodge, L. Landscape Plant Salt Tolerance Selection Guide for Recycled Water Irrigation. Available online: https://slosson.ucdavis.edu/Landscape_Plant_Selection_Guide_for_Recycled_Water_Irrigation/ (accessed on 23 July 2025).


Disclaimer/Publisher’s Note: The statements, opinions and data contained in all publications are solely those of the individual author(s) and contributor(s) and not of MDPI and/or the editor(s). MDPI and/or the editor(s) disclaim responsibility for any injury to people or property resulting from any ideas, methods, instructions or products referred to in the content. |
© 2025 by the authors. Licensee MDPI, Basel, Switzerland. This article is an open access article distributed under the terms and conditions of the Creative Commons Attribution (CC BY) license (https://creativecommons.org/licenses/by/4.0/).