Abstract
Surface subsidence induced by underground mining in mining areas significantly alters surface topography and hydrogeological conditions, forming depressions and fissures, thereby affecting regional runoff-ponding processes and groundwater infiltration patterns. Accurate assessment of infiltration volumes in subsidence zones under heavy rainfall is crucial for designing underground drainage systems and evaluating water-inrush risks in open-pit to underground transition mines. Taking the surface subsidence area of the Dahongshan Iron Mine as a case study, this paper proposes a rainfall infiltration calculation method based on the precise delineation of surface ponding-infiltration zones. By numerically simulating the subsidence range, the study divides the area into two distinct infiltration characteristic zones under different mining states: the caved zone and the water-conducting fracture zone. The rainfall infiltration volume under storm conditions was calculated separately for each zone. The results indicate that high-intensity mining-induced subsidence leads to a nonlinear surge in stormwater infiltration, primarily due to the significant expansion of the highly permeable caved zone. The core mechanism lies in the area expansion of the caved zone as a rapid infiltration channel, which dominates the overall infiltration capacity multiplication. These findings provide a scientific basis for the design of mine drainage systems and the prevention of water-inrush disasters.
1. Introduction
Mineral resources play a vital role in modern industry and infrastructure development. However, with economic growth and increasing resource demand, the exploitation of shallow deposits has become insufficient, driving mining operations toward deeper strata and more complex geological conditions [1]. This transition presents multifaceted challenges [2]. Mining-induced disturbances cause overlying strata to deform, fracture, and collapse under redistributed stress, leading to surface cracking and subsidence while drastically reducing the integrity of surrounding rock [3]. The resulting hydraulically conductive pathways connect subsurface voids with the surface, creating preferential channels for heavy rainfall, surface runoff, and groundwater infiltration, significantly increasing water-inrush risks [4]. During intense rainy seasons, infiltrated precipitation sharply raises underground water inflows, frequently triggering water inrushes, mine flooding, and even subsurface debris flows [5,6], posing severe threats to personnel safety and infrastructure. Consequently, analyzing rainfall infiltration mechanisms in underground mines and quantitatively assessing infiltration rates are essential for evaluating drainage system capacity and water-inrush hazards. These measures form the scientific foundation for disaster prevention in deep mining operations.
The impacts of rainfall and mining activities are mainly reflected in the weakening of rock mass strength. On one hand, precipitation erosion and pore water pressure reduce the mechanical parameters of structural planes; on the other hand, mining disturbances cause penetrating fractures in surrounding rock. These two factors jointly accelerate the deterioration process of rock mass [7,8,9,10,11], especially in the transition from open-pit to underground mining where multiple stress redistributions occur [12]. This strength attenuation directly changes groundwater migration conditions. As fracture networks expand and connect, the permeability of rock mass shows anisotropic enhancement, transforming rainwater infiltration patterns from homogeneous dispersion flow to fracture-dominated preferential flow [13]. Demand et al. [14] confirmed the complexity of preferential flow through fractures using a large-scale soil moisture sensor network, yet existing models remain insufficient in capturing such dynamic variations. Therefore, revealing the dynamic characteristics of rainfall infiltration under damaged rock mass conditions becomes a key prerequisite for disaster prevention. In terms of theoretical calculations, Zhan et al. [15] derived an analytical solution for unsaturated flow in infinitely long, overburdened layers and studied the influence of rainfall patterns on infiltration processes and deep percolation. Feng et al. [16] proposed multiple exponential functions to describe highly nonlinear soil water retention curves and hydraulic conductivity functions, deriving a semi-analytical solution for pore water pressure in steady-state unsaturated infinite slopes. Wu et al. [17] combined mass conservation, Darcy’s law, and elastic theory to derive an analytical solution for coupled seepage-deformation in unsaturated soil slopes during rainfall infiltration using Fourier integral transform methods. Tracy and Vahedifard [18] proposed an analytical solution for water-mechanics coupling in unsaturated soil infiltration, which accounts for the synergistic effects of pore water pressure and soil deformation. However, this solution is only applicable to one-dimensional homogeneous media and cannot be extended to three-dimensional heterogeneous deformation zones induced by mining. Specifically, it fails to characterize the distinct permeability characteristics between the caved zone and the water-conducting fractured zone, highlighting the limitations of theoretical analytical approaches in complex engineering scenarios. For numerical simulations, Su et al. [19] considered the coupling effects of seepage and stress fields to conduct finite element simulations of seepage and dam slope stability under changing water levels and rainfall intensities based on unsaturated seepage theory. Hou et al. [20] used finite element methods to simulate transient water transport in slopes with different fracture depths. Paronuzzi et al. [21] established numerical infiltration models to study rainfall infiltration processes in homogeneous and stratified colluvial deposits caused by heavy rainfall. Hou et al. [22] used numerical simulation software to study the phenomenon where rainwater initially infiltrates preferentially along fractures in unsaturated fractured soil and then flows away as surface runoff when rainfall exceeds the infiltration capacity. Wu et al. [5] employed COMSOL to solve coupled partial differential equations for soil slopes under rainfall infiltration based on multi-field coupling theory. Zhong et al. [23] proposed a two-step method to accurately simulate coupled surface–subsurface flood processes. Aguilar-López et al. [24] enhanced the dual-permeability model by reconstructing the parameters of the Mualem-van Genuchten soil water retention curve and modifying the hydraulic conductivity exchange function between the matrix and fracture domains. This improvement enabled accurate simulation of preferential flow in fractured clay, demonstrating the model’s applicability in scenarios involving non-capillary flow through wide fractures. Current research mainly focuses on water inflow mechanisms caused by rainfall infiltration, where accurate calculation of infiltration volume is a critical component. For instance, Ma et al. [25] demonstrated in their waste rock pile leaching simulations that dual-permeability models must account for moisture–solute exchange between preferential flow and matrix flow domains. However, their applicability to mining subsidence areas remains limited, as they cannot quantify either the catchment areas induced by surface collapse or the differential permeability characteristics across distinct subsidence zones. Meanwhile, Parsasadr et al. [26] employed a finite element model successfully captured the abrupt permeability enhancement in mining-induced relaxation zones yet failed to establish quantitative relationships between varying degrees of collapse deformation and the spatial heterogeneity of hydraulic conductivity. Further corroborating these findings, Li et al. [13] revealed through coupled rainfall-mining studies that vertically oriented mining-induced fractures synergistically interact with elevated pore water pressure from rainfall infiltration to exacerbate slope instability. Nevertheless, current modeling frameworks still lack precise characterization of the dynamic evolution of permeability properties in deformation zones.
In light of this, as shown in Figure 1, this study proposes a rainfall infiltration calculation method based on the delineation of surface runoff infiltration zones. Taking the Dahongshan Iron Mine as a case study, we established a refined three-dimensional computational model. By integrating field investigations and numerical simulations, we assessed surface deformation characteristics, divided the study area into caved zones and water-conducting fracture zones, and delineated the catchment boundaries surrounding the subsidence area. Different permeability coefficients were assigned to distinct zones, and the open-source hydraulic modeling software Hydrologic Engineering Center’s River Analysis System (HEC-RAS) was employed to calculate rainfall infiltration volumes under storm conditions for each subregion. Through comparative analysis, we examined how mining activities influence rainfall infiltration patterns in subsidence zones at varying mining intensities. The findings provide a scientific basis for designing mine drainage systems and preventing water inrush disasters.
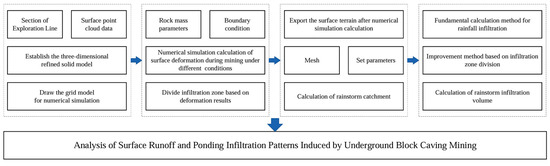
Figure 1.
Research technique route.
2. Calculation Method of Rainfall Infiltration Based on Infiltration Zone Division
2.1. Fundamental Principles
Currently, multiple methods are available for seepage analysis, each with its own merits and limitations. For instance, MODFLOW demonstrates excellent performance in groundwater flow simulations but requires significant computational resources [27]. The SWAT model is particularly suitable for watershed-scale analyses, though its spatial resolution remains constrained [28]. While MIKE SHE provides comprehensive hydrological modeling capabilities, its implementation demands relatively high-quality input data [29]. HEC-RAS has been demonstrated to exhibit strong relevance in assessing water inrush risks and reliably predicting future flood scenarios within the study area [30,31]. This modeling system maintains balanced performance between computational accuracy and efficiency, characterized by high computational productivity and low parameter sensitivity. The numerical computations of the two-dimensional hydrodynamic model combine the finite volume method and finite difference method, enabling effective calculation of the two-dimensional Saint-Venant equations or diffusive wave equations. The program preprocesses the divided computational grids into cells with a series of hydraulic characteristic curves derived from spatial data, thereby determining the elevation–volume curve for each cell. When the calculated water volume within a cell exceeds the cell’s capacity, overflow occurs. The computational grids are unstructured: grids not adjacent to boundaries are regular quadrilaterals, while those intersecting boundaries adopt irregular polygons (with up to eight sides) to accommodate complex boundaries. The grids support local refinement and alignment. External boundary conditions include water level, flow rate, stage–discharge relationship, and normal depth (channel bed slope). Internal boundaries support flow rate conditions, while initial conditions allow for either a uniform water level or completely dry riverbed. The hydrodynamic analysis mode in the software enables rainfall impact analysis on watersheds within the study area, performing stable and rapid flood inundation simulations. The unsteady flow simulation employs the continuity Equation (1) and momentum Equation (2) as its computational formulas.
In the formula, h is the water depth, m; u and v are the flow velocities of the water in the x and y directions, respectively, m/s; t is time, s.
Momentum equation in the x-direction is as follows:
Momentum equation in the y-direction is as follows:
In the formula, τx, τy are the frictional forces at the bottom of the riverbed, N.
Manning’s formula (Equation (4)) runs through the entire hydraulic calculation and is used to calculate water flow velocity, flow rate, frictional slope, etc.
In the formula, V is the average flow velocity, m/s; n is the Manning coefficient, which comprehensively reflects the influence of ground roughness on water flow; R is the hydraulic radius (ratio of wetted perimeter to cross-sectional area); S is the hydraulic slope.
Currently, there is no well-established or mature calculation method for determining rainfall infiltration volume in subsidence areas. Generally, parameter coefficient methods specified in relevant regulations are adopted for estimation purposes. The infiltration volume calculation formula is as follows:
In the formula, Q0 is the total amount of runoff and seepage in the collapsed area, m3/d; W0 is the regional surface runoff, m3/d; Hp is the 24 h rainstorm of design frequency, mm; F is the area of surface subsidence area, m2; α is the regional infiltration coefficient.
2.2. Improvement Methods
The rationality of delineating the subsidence area directly affects the accuracy of rainfall infiltration estimation. Conventional methods for determining the subsidence area involve defining the corresponding surface subsidence zone based on the angle of draw and the mining extent of the ore body and then using this area as the basis for estimating rainfall infiltration. However, as mining depths increase, the presence of massive overburden strata leads to distinct characteristics in surface subsidence patterns and ground pressure behavior that differ markedly from shallow underground mining scenarios. Conventional methods employing linear fault angle assumptions—where the angle extends directly from the mining boundary to the surface—fail to accurately capture the nonlinear strata movement mechanisms induced by deep mining. This limitation frequently results in significant deviations in subsidence zone predictions [32]. According to literature [33], surface subsidence caused by underground mining can be divided into three typical zones: (1) caved zone: the rock in this zone completely loses its original structure, texture, and physical-mechanical properties, collapsing into irregular or quasi-stratified rock blocks toward the goaf; (2) water-conducting fracture zone: located between the caved zone and the continuous deformation zone, this area exhibits new fractures and bed separation in the rock layers; and (3) continuous deformation zone: due to reduced support from underlying strata, the rock layers undergo plastic bending or slow, uniform subsidence under their own weight. The caved zone contains numerous interconnected voids between rock blocks, significantly enhancing permeability and serving as an excellent channel for rainfall infiltration into the mine workings. Thus, the height and extent of the caved zone directly influence atmospheric precipitation infiltration into the mine. The water-conducting fracture zone also exhibits increased permeability due to rock deformation and enhanced fracture development. If these fractures extend to the surface, they can become effective pathways for precipitation infiltration. In contrast, the continuous deformation zone experiences minimal changes in rock structure and seepage capacity and is generally not considered in infiltration assessments.
This study assumes that rainfall infiltration in the subsidence area comes from two sources: (1) infiltration directly through the caved zone and (2) infiltration directly through the water-conducting fracture zone. The permeability characteristics of rock masses undergo varying degrees of alteration depending on the magnitude of subsidence deformation. It is therefore inappropriate to apply a uniform rainfall infiltration coefficient across the entire subsidence area. The methodology for calculating rainfall infiltration presented in Reference [34] addresses this issue by the following:
In the formula, Q is the total amount of runoff and infiltration in the collapse area during rainstorm at the design frequency, m3/d; W1 is the area of the falling zone, m2, defined based on numerical simulation results; α1 is the infiltration coefficient of the falling zone area when the design frequency is rainstorm; W2 is the area of the infiltration directly through the water-conducting fracture zone, m2, defined based on numerical simulation results; α2 is the infiltration coefficient of the water-conducting fissure zone area when the design frequency is rainstorm; Φ is the surface runoff coefficient, a dimensionless parameter describing the efficiency of converting rainfall into surface runoff, which is the proportion of surface runoff in a certain period of time.
3. Surface Deformation Prediction and Infiltration Zone Division Based on Numerical Simulation
3.1. Engineering Background
The Dahongshan Iron Mine is located in Gasa Town, Xinping Yi and Dai Autonomous County, Yuxi City, Yunnan Province, with geographical coordinates of 101°39′ east longitude and 24°06′ north latitude. It is situated on the eastern bank of the Gasa River (the upper reaches of the Red River and Yuan River), adjacent to the eastern side of the Ailao Mountain Range. The surface elevation of the mining area ranges from 600 m to 1850 m, characterized by an eroded and denuded mountainous terrain with deep incisions, significant undulations, and well-developed reticulated valleys. The Manggang River, Feiwei River, and Laochang River flow through the mining area, converging into the Hunlong River, which joins the Gasa River approximately 9 km southwest of the mining area. The Dahongshan Iron Mine is located in a subtropical climate zone with distinct dry and wet seasons. The region receives abundant rainfall, with an annual precipitation of 700–1200 mm (average 930.8 mm). Over 60% of the rainfall occurs between June and September, primarily in the form of showers and heavy rainstorms.
At present, the Dahongshan Iron Mine is simultaneously conducting mining operations across multiple ore bodies within an area approximately 2000 m long east–west and 1000 m wide north–south, at elevations ranging from +360 m to +1300 m. The location of the mining area is shown in Figure 2. These operations include open-pit mining of shallow lava iron ore, deep mining of the II1 iron ore group, underground mining of the I copper ore belt, and the III–IV ore groups. This has resulted in a globally unique mining scenario featuring combined surface-underground extraction, concurrent shallow and deep mining, and the simultaneous application of three mining methods: caving, open stope, and backfill. The operation has established a large-scale, multi-section, multi-district concurrent mining pattern.
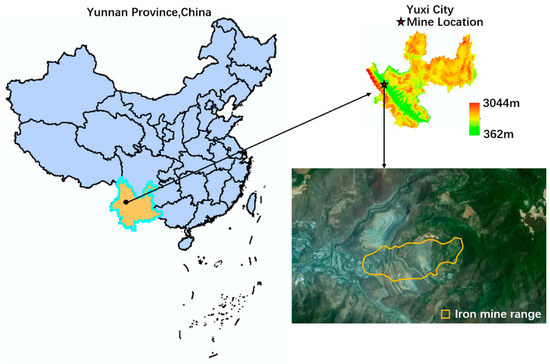
Figure 2.
Geographical location of mining area.
3.2. Establishment of Three-Dimensional Refined Model
Precision modeling can accurately reconstruct orebody morphology and geological structures (such as faults, fractures, and weak interlayers), providing a computational domain foundation for numerical simulations that more closely approximates real-world conditions. The Dahongshan Iron Mine features complex lithological distribution, with main rock types including gabbro-diabase, metasomatic sodium lava, dolomitic marble, copper ore belts, and iron ore belts. The area contains F1 and F2 fault structures and fold structures, as well as shallow and deep ore bodies. The F1 fault strikes northwest–west or nearly east–west, dips south or southwest with an inclination angle of 60–85°, and has a displacement exceeding 500 m. The F2 fault is inferred to have initially been a reverse fault and later transformed into a normal fault. It strikes nearly east–west, extends over 1.1 km, dips south with an inclination angle of approximately 80°. Both fault zones are filled with intruded gabbro-diabase. The F2 fault serves as the natural boundary between shallow and deep ore bodies, while the F1 fault marks the southern boundary of the deep ore bodies.
To mitigate and eliminate boundary effects in large-scale simulation calculations [25], the geometric model boundaries were extended by 100 m beyond the projected areas of both open-pit and underground mining zones. The model was constructed at a 1:1 scale, with initial dimensions of 3000 m × 2500 m × 1300 m (length × width × height, where the Z-axis elevation varies according to topographic contours). To ensure modeling precision, the absolute tolerance was set at 0.01 and the angular tolerance at 1°.
Research indicates that topography significantly influences surface subsidence, necessitating accurate representation of surface relief in computational models [35,36,37]. The mine employed unmanned aerial-vehicle oblique photogrammetry and laser scanning technology to acquire high-resolution surface point cloud data, which was processed to generate a precise 3D surface entity model as shown in Figure 3.
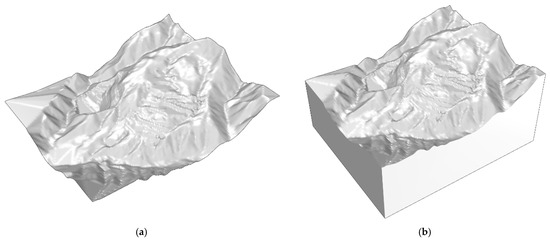
Figure 3.
Construction of 3D surface model of Dahongshan Iron Mine. (a) Surface grid; (b) surface model.
Based on the mining schedule, yearly excavation stope models were established to serve as the foundation for subsequent analysis and calculations, as illustrated in Figure 4.
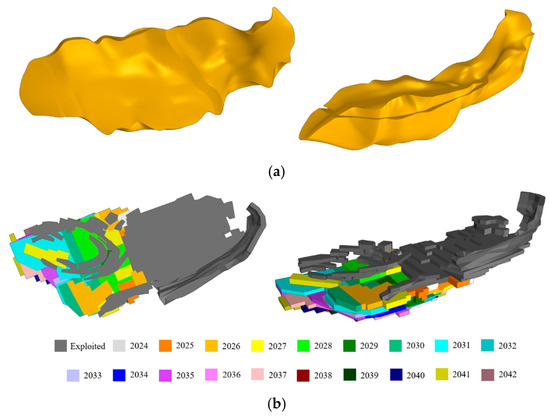
Figure 4.
Three-dimensional model of the Dahongshan Iron Mine area and mining room. (a) Iron ore model; (b) mining stope model.
The geometric modeling of different lithologies was achieved through cross-section profiling and block cutting methods. A specific elevation plane containing multiple section lines was selected as the reference surface for placing various cross-sections. Each section bearing lithological boundaries was sequentially positioned on this reference plane. The modeling accuracy improves with increasing number of incorporated cross-sections. For this study, 18 exploration profiles (A28–A45) with 50 m horizontal spacing between adjacent sections were utilized. Contour lines of identical lithologies at corresponding positions across all sections were identified to determine the spatial configuration and positioning of each rock formation. These contours were then integrated to form three-dimensional lithological interfaces. The base geometric model was subsequently partitioned using these established rock mass interfaces to obtain separate geometric models for each lithology. Based on this framework, the caved zone body was constructed according to field-measured vertical collapse extents. The entire modeling process strictly adhered to geological profiles obtained through precise mine exploration, achieving accurate representation of lithological distributions in the Dahongshan Iron Mine, as demonstrated in Figure 5.
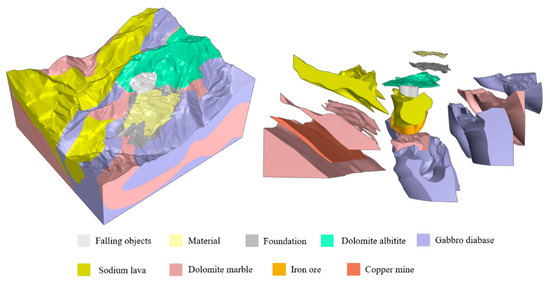
Figure 5.
Construction of 3D model for Dahongshan Iron Mine.
3.3. Range of Surface Movement Induced by Mining and Division of Infiltration Zones
The rock mechanical parameters for various lithologies in the Dahongshan Iron Mine were obtained through laboratory tests. Combined with structural plane joint identification for rock quality reduction [38], the Hoek–Brown empirical estimation method was employed to calculate the mechanical strength of rock masses. The final parameters used for numerical simulation are shown in Table 1.

Table 1.
Numerical simulation of rock mechanics parameters of Dahongshan Iron Mine.
The initial stress field adopted for this numerical calculation is characterized as follows: The maximum principal stress in the mining area is oriented along the NNE-SSW direction, ranging between N16°E and N65.68°E, with an average orientation of N40.84°E. All principal stresses generally increase with depth, exhibiting the following variation patterns:
The open-pit mining is expected to be completed by 2026 and will transition entirely to underground mining. Accordingly, the numerical simulation analysis considers three working conditions based on different underground mining extents: (1) current status; (2) mining until 2026; and (3) full extraction.
For the computational domain boundaries, the (1) initial geostress is first applied. (2) Displacement constraints are then implemented: All nodes at the model bottom are constrained in the x, y, and z directions. Both ends in the x-direction are constrained along x; both ends in the y-direction are constrained along y; the model top remains a free boundary [39]. The Mohr–Coulomb elastoplastic constitutive model is adopted for the simulation. The numerical computation process follows these steps: Initial geostress equilibrium under unmined conditions, with maximum unbalanced force set to 1.0 × 10⁻⁵ and planned stope-by-stope excavation calculations until final equilibrium is achieved.
A comparative analysis was conducted between the cumulative deformation data obtained from eight total stations installed around the subsidence crater and the numerical simulation results, as presented in Table 2. The discrepancy between field monitoring data and numerical calculations was found to be within 10%, demonstrating the high reliability of the selected mechanical parameters and refined modeling approach employed in the numerical simulations.
Table 2.
Comparison between numerical simulation results and monitoring data.
Based on numerical simulation results, surface deformation data under different working conditions were obtained. The caved zone and water-conducting fracture zone were delineated according to critical deformation values specified in technical standards (incline i in mm/m, curvature k in 10−3/m, and horizontal deformation ε in mm/m). The critical deformation thresholds are defined as follows:
Caved zone: incline (i): ±10 mm/m; curvature (k): ±0.6 × 10⁻³/m; and horizontal deformation (ε): ±6 mm/m;
Water-conducting fracture zone: incline (i): ±3 mm/m; curvature (k): ±0.2 × 10⁻³/m; and horizontal deformation (ε): ±2 mm/m.
The resulting surface contour maps for all three working conditions are presented in Figure 6, Figure 7 and Figure 8.
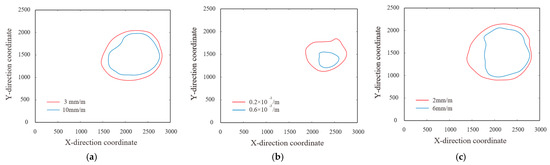
Figure 6.
Surface deformation contour line of Condition 1. (a) Incline; (b) curvature; (c) horizontal deformation.
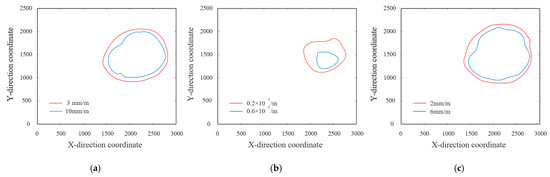
Figure 7.
Surface deformation contour line of Condition 2. (a) Incline; (b) curvature; (c) horizontal deformation.
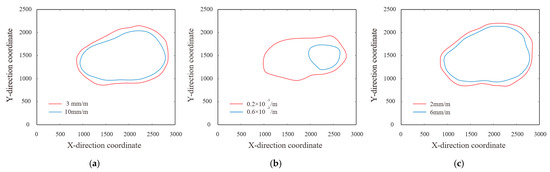
Figure 8.
Surface deformation contour line of Condition 3. (a) Incline; (b) curvature; (c) horizontal deformation.
4. Analysis of Surface Runoff-Ponding Infiltration Patterns Induced by Mining Activities
4.1. Simulation of Surface Runoff in Mining Areas Based on HEC-RAS
The high-precision surface DEM model for Working Condition 1 was generated by converting high-accuracy point cloud data of the study area obtained through unmanned aerial-vehicle oblique photogrammetry, with the imported topographic map shown in Figure 9a. The final surface deformation results from numerical simulations were exported to create surface DEM models for Working Conditions 2 and 3, as presented in Figure 10a and Figure 11a. The computational domain was delineated along the river channels, with a 2D grid spatial resolution of 10 m, resulting in a total of 88,358 grid elements. The generated meshes are displayed in Figure 9b, Figure 10b and Figure 11b.
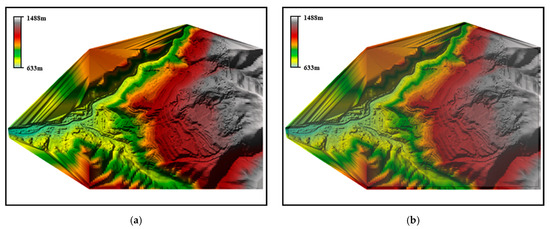
Figure 9.
Pretreatment of rainfall catchment simulation for Condition 1. (a) Topographic map after importing HEC-RAS; (b) grid division of computational domain.
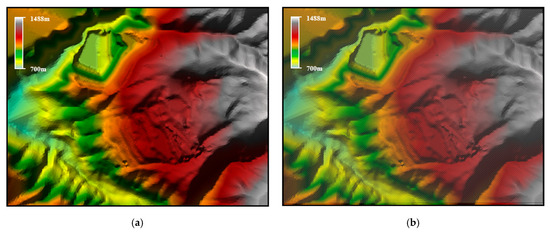
Figure 10.
Pretreatment of rainfall catchment simulation for Condition 2. (a) Topographic map after importing HEC-RAS; (b) grid division of computational domain.
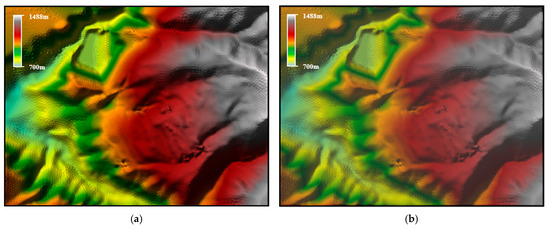
Figure 11.
Pretreatment of rainfall catchment simulation for Condition 3. (a) Topographic map after importing HEC-RAS; (b) grid division of computational domain.
After mesh generation, appropriate boundary conditions must be configured according to actual conditions. Boundary conditions primarily define the inflow and outflow conditions of the computational domain, while initial conditions specify the starting state of the entire calculation area. The model’s external boundaries mainly include settings along the outer perimeter of the 2D model (water level, discharge, stage–discharge relationship, channel bed slope, and precipitation conditions and water levels distributed across the entire 2D grid). The numerical model was configured with all external boundaries set as flow outlets under a hydraulic gradient of 0.03. The global rainfall condition was applied as the inflow boundary, incorporating both actual rainfall intensities over a two-month period and a 5-day continuous precipitation event equivalent to a 50-year storm recurrence interval (the rainfall input curve is shown in Figure 12). The simulation adopted a 15 min computational time step with synchronized output intervals for hydraulic parameters. A uniform Manning’s roughness coefficient of 0.05 was assigned throughout the study area to represent the hydraulically smooth characteristics of the fractured bedrock surface. The simulation results demonstrating the system’s hydrological response are presented in Figure 13.
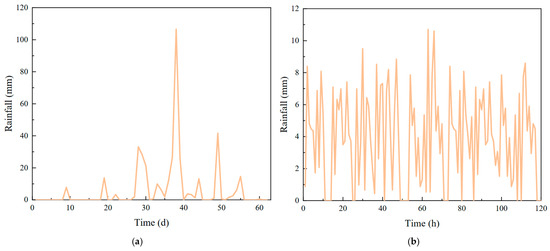
Figure 12.
Simulated rainfall curve. (a) Actual rainfall; (b) 50-year return period storm intensity.
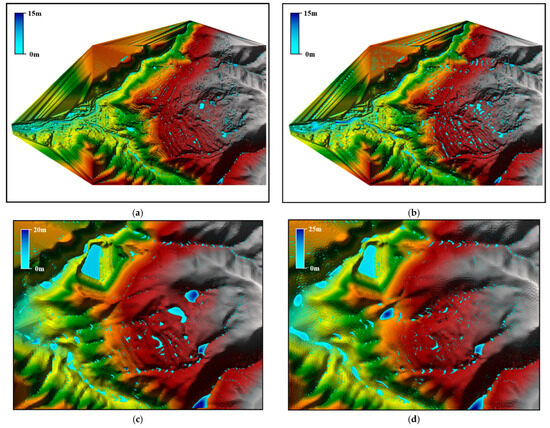
Figure 13.
Calculation results of rainfall runoff in Dahongshan Iron Mine. (a) Actual rainfall—Condition 1; (b) 50-year return period storm intensity—Condition 1; (c) 50-year return period storm intensity—Condition 2; (d) 50-year return period storm intensity—Condition 3.
4.2. Estimation of Rainfall Infiltration in Mining Area Under Rainstorm Condition
Based on the results, the catchment area surrounding the subsidence zone was delineated, and the final computational domain is shown in Figure 14. In the figure, the blue line represents the boundary of the caved zone, while the yellow line indicates the extent of the water-conducting fracture zone.
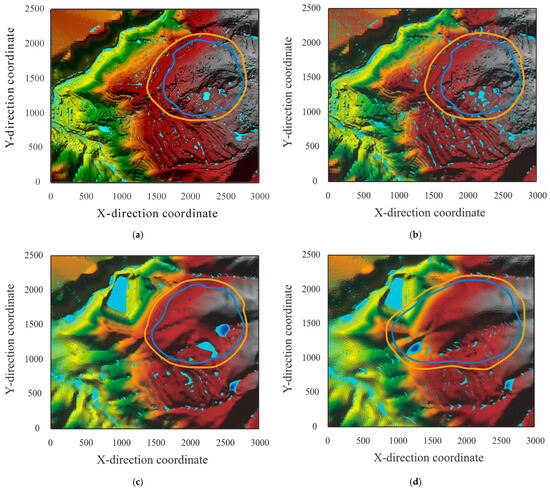
Figure 14.
Division of infiltration zone. (a) Actual rainfall—Condition 1; (b) 50-year return period storm intensity—Condition 1; (c) 50-year return period storm intensity—Condition 2; (d) 50-year return period storm intensity—Condition 3.
The infiltration coefficient and runoff coefficient are critical parameters affecting the accuracy of rainfall infiltration estimation, and different infiltration coefficients should be applied to different zoned areas. In accordance with the relevant provisions of the “Code for Design of Metal Mine” (GB 50830-2013) [40] (Table 3), the study area features overburden rock above the ore body characterized by repetitive collapse and brittle rock strata lacking a plastic impermeable layer. The recommended infiltration coefficient for design-frequency heavy rainfall is suggested to be 0.4–0.3. For the caved zone, this region is significantly affected by repeated mining disturbances, exhibiting a high degree of rock fragmentation and lacking cohesive backfill to impede infiltration. Consequently, it demonstrates a greater infiltration capacity under heavy rainfall conditions, justifying the adoption of the upper limit value of 0.4 as recommended by the standards. In contrast, the water-conducting fractured zone, while containing a certain degree of fracture networks, is located in a transitional area between the caved zone and intact rock strata, resulting in reduced effective infiltration pathways. Hence, a more conservative value of 0.3 is selected. This differential treatment better aligns with the field-observed seepage mechanisms—where pipe flow dominates in the caved zone, while fracture flow prevails in the water-conducting fractured zone—compared to traditional, uniform coefficient methods. It more accurately reflects the actual infiltration characteristics of each partition under heavy rainfall conditions. As for the runoff coefficient, in accordance with the provisions of the “Code for Design of Outdoor Wastewater Engineering” (GB 50014-2006) [41] (Table 4), a value of 0.3 is adopted for unpaved soil surfaces.
Table 3.
Reference values for stormwater infiltration coefficients for avalanche areas.
Table 4.
Table of runoff coefficient values.
The calculation results were imported into ArcGIS 9.3 to calculate the water collection in each region, and Equation (6) was used to calculate the rainfall infiltration in each working condition of the mining area. The calculation results are shown in Table 5 and Table 6.
Table 5.
Estimated results of total storm water infiltration (actual rainfall).
Table 6.
Estimated results of total storm water infiltration (50-year return period storm intensity).
The computational results demonstrate that the discrepancy between the actual monitored drainage volume and the infiltration quantity calculated using the proposed method is 8.06%, indicating a high level of accuracy for this methodology.
4.3. Result Analysis
Due to intensive mining operations at the Dahongshan Iron Mine, numerous collapse pits of varying sizes have formed on the surface. Under rainfall conditions, these pits transform into subsidence lakes, significantly altering both the area and spatial distribution patterns of rainfall infiltration zones. As mining progresses, the subsidence area expands, with particularly notable increases in the caved zone area. As shown in Figure 15, numerical simulations reveal that under Working Condition 2 compared to Condition 1, the infiltration area of the subsidence zone expands by approximately 10%, with newly formed caved zones accounting for over 70% of this increase. The peripheral caved zones and water-conducting fracture zones further extend the influence range of infiltration. Water accumulation areas leak into the goaf through hydrostatic pressure, resulting in a doubling of the infiltration volume. Under Working Condition 3, the subsidence area can reach 3.4 times the projected area of the goaf. Compared to Condition 1, the infiltration area of the subsidence zone expands by approximately 65%, with newly formed caved zones making up over 50% of this expansion. These caved zones become preferential pathways for rapid rainfall infiltration. Water accumulation areas directly leak into the goaf under hydrostatic pressure, increasing the stormwater infiltration volume in the subsidence zone by 2.4 times.
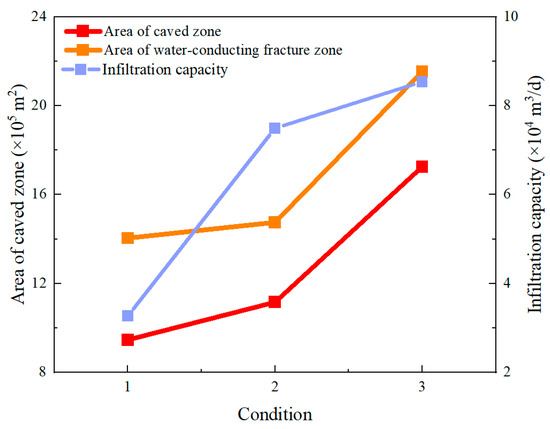
Figure 15.
Comparison of estimated infiltration area and total rainwater infiltration in different regions under different working conditions.
Since caved zones typically exhibit significantly higher permeability than the original ground surface and water-conducting fracture zones, their expansion directly enhances the overall rainfall infiltration capacity. Consequently, under identical storm conditions, the total volume of rainfall infiltrating underground increases substantially. This growth in infiltration volume is not linear but closely correlated with the expansion of highly permeable water-conducting fracture zones. During extreme storm events, the rapid water-conducting capability of caved zones further amplifies their contribution to total infiltration. Therefore, changes in the infiltration zone area due to mining disturbances—particularly the expansion of high-permeability zones—constitute the core mechanism governing increased rainfall infiltration in mining areas. Precisely delineating these zones and quantifying their area changes are critical for accurately assessing the impact of mining on rainfall infiltration.
4.4. Prevention and Control Measures
The surface subsidence area is classified into three hierarchical anti-seepage zones based on deformation characteristics, inundation extent, and temporal factors, with detailed classification criteria and corresponding mitigation measures provided in Table 7. The primary containment zone (Grade I) comprises inundated sections of both the caved zone and water-conducting fracture network, while the secondary zone (Grade II) includes non-flooded portions of the caved zone, and the tertiary zone (Grade III) covers non-submerged areas of the fractured zone. Differential anti-seepage measures are implemented accordingly: For Grades I and II, stratified fracture grouting is employed through sequential borehole injection of cementitious and chemical grouts into bedrock discontinuities under controlled pressure, facilitating permeation and filling of rock/soil fractures to form continuous impermeable barriers upon curing. The primary zone receives supplementary protection via geomembrane installation coupled with active pumping systems for seepage reduction. Grade III areas undergo direct fracture infilling treatments. Complementing these zonal measures, an annular water interception system is constructed along the subsidence perimeter through composite engineering of earthen cofferdams and open drainage channels, achieving controlled diversion of surface runoff and effective hydraulic isolation of the collapse area from external water sources.
Table 7.
Table of seepage control classifications and seepage control measures.
5. Conclusions and Discussion
5.1. Conclusions
Our conclusions include the following:
- (1)
- A rainfall infiltration calculation method based on precise delineation of surface catchment infiltration zones was proposed. By integrating field investigations, numerical simulations, and HEC-RAS catchment modeling, the caved zones and water-conducting fracture zones under different mining stages were identified. Different rainfall infiltration coefficients were applied to various infiltration zones, leading to the derivation of a calculation formula for rainfall infiltration volume in surface subsidence areas.
- (2)
- A refined 3D mine model was established using 18 exploration profiles to accurately reconstruct the complex geological environment of Dahongshan Iron Mine. Detailed stope models were created according to mining schedules, providing a foundation for simulating realistic mining-induced surface deformation. A high-precision DEM model of Shilu Iron Mine’s surface was developed using UAV oblique photography data, enabling surface catchment simulation under storm conditions and obtaining water accumulation patterns in mining-induced subsidence zones.
- (3)
- Underground mining reshapes the spatial distribution and infiltration mechanisms through surface deformation. With expanding the mining scope, in Working Condition 2, the infiltration area increased by 10% compared to Condition 1, with over 70% being newly formed caved zones; in Working Condition 3, the infiltration area expanded by 65% versus Condition 1, with newly formed caved zones accounting for over 50%. The peripheral expansion of caved zones and water-conducting fractures doubled the stormwater infiltration volume in Condition 2 and increased it by 2.4 times in Condition 3 compared to Condition 1. This nonlinear growth stems from significantly enhanced overall infiltration capacity due to expanded high-permeability caved zones, which serve as preferential pathways for rapid rainfall percolation and constitute the core mechanism controlling infiltration volume increases.
5.2. Discussion
The discussion is as follows:
- (1)
- The applicability of the model is constrained by specific geological conditions. When applied to other mining sites, parameter adjustments and validation must be conducted based on their unique geological characteristics. Rock mechanical parameters were determined through a combination of field tests and numerical inversion. However, due to limitations in exploration data density, spatial variability in localized regions may not be fully characterized. While the Mohr–Coulomb criterion effectively captures shear failure in rock masses, it does not account for strength degradation under cyclic loading. Future improvements could incorporate damage mechanics models to address this limitation.
- (2)
- Given that the waste backfill material in this study primarily consists of coarse-grained particles with large pore sizes, capillary effects exhibit a limited influence, and the difference between saturated and unsaturated permeability coefficients is negligible. Consequently, capillary effects were disregarded. However, for materials containing clay layers or fine-grained tailings, capillary action significantly impacts seepage behavior and must be accounted for using unsaturated flow models such as the Van Genuchten model. Future research should conduct comparative analyses of seepage characteristics across different backfill materials to refine mining seepage theory and develop more universal modeling approaches for varying geological conditions.
- (3)
- Poroelastic theory and fluid–solid coupling analysis hold substantial value for mechanistic studies. However, for large-scale models, fully coupled poroelastic analysis faces practical challenges, including high computational resource demands and insufficient permeability field data. Future work could focus on small-scale poroelastic simulations in critical zones, combined with parameter inversion using surface monitoring data, to enhance understanding of localized deformation mechanisms. While the current simplified approach provides effective support for engineering decision-making, refined poroelastic modeling represents a promising direction for subsequent research to improve prediction accuracy and model applicability.
Author Contributions
Conceptualization, Y.Z. and T.Y.; methodology, S.J. and X.W.; software, S.J. and X.W.; validation, Q.M. and T.Y.; formal analysis, S.J. and H.L.; investigation, Q.Z.; resources, T.Y.; data curation, S.J. and Q.Z.; writing—original draft, S.J. and Q.M.; writing—review and editing, Y.Z.; supervision, T.Y.; project administration, H.L. All authors have read and agreed to the published version of the manuscript.
Funding
This work was supported by the National Natural Science Foundation of China (Grant numbers 52374157), the National Key Research and Development Program of China (Grant number 2022YFC2903902), the Young Elite Scientists Sponsorship Program by CAST (2023QNRC001), and the Key Science and Technology Project of Ministry of Emergency Management of the People’s Republic of China (2024EMST080802).
Institutional Review Board Statement
Not applicable.
Informed Consent Statement
Not applicable.
Data Availability Statement
The original contributions presented in the study are included in the article; further inquiries can be directed to the corresponding author.
Acknowledgments
The authors would like to sincerely thank Jianjun Huang for his valuable contribution to this study. He provided additional on-site monitoring data and engineering control methods that greatly enhanced the revision of the manuscript.
Conflicts of Interest
The authors declare no conflicts of interest.
References
- Ak, H.; Iphar, M.; Yavuz, M.; Konuk, A. Evaluation of Ground Vibration Effect of Blasting Operations in a Magnesite Mine. Soil Dyn. Earthq. Eng. 2009, 29, 669–676. [Google Scholar] [CrossRef]
- Whittle, D.; Brazil, M.; Grossman, P.A.; Rubinstein, J.H.; Thomas, D.A. Combined Optimisation of an Open-Pit Mine Outline and the Transition Depth to Underground Mining. Eur. J. Oper. Res. 2018, 268, 624–634. [Google Scholar] [CrossRef]
- Christmann, P. Mineral Resource Governance in the 21st Century and a Sustainable European Union. Miner. Econ. 2021, 34, 187–208. [Google Scholar] [CrossRef]
- Lu, W.B.; Yang, J.H.; Yan, P.; Chen, M.; Zhou, C.B.; Luo, Y.; Jin, L. Dynamic Response of Rock Mass Induced by the Transient Release of In-Situ Stress. Int. J. Rock Mech. Min. Sci. 2012, 53, 129–141. [Google Scholar] [CrossRef]
- Wu, L.Z.; Zhang, L.M.; Zhou, Y.; Li, B.E. Analysis of Multi-Phase Coupled Seepage and Stability in Anisotropic Slopes under Rainfall Condition. Environ. Earth Sci. 2017, 76, 469. [Google Scholar] [CrossRef]
- Zhang, J.; Feng, X.; Wu, A.; Chen, H.Y.; Li, Z.R.; Wang, S.Y.; Sun, W.; Chen, C. Critical Early Warning of Underground Debris Flows in Mines Based on Rainfall–Collapse Characteristics. Nat. Hazards 2025, 121, 423–445. [Google Scholar] [CrossRef]
- Lan, X.; Wang, Y.; Wang, X.; Geng, J. Study on the Destabilisation Pattern and Volumetric Water Content Evolution Characteristics of Underground Mining Rock Formations Under Heavy Rainfall Conditions. Water 2025, 17, 136. [Google Scholar] [CrossRef]
- Li, X.H.; Li, Q.H.; Wang, Y.M.; Liu, W.; Hou, D.; Zheng, W.B.; Zhang, X. Experimental Study on Instability Mechanism and Critical Intensity of Rainfall of High-Steep Rock Slopes Under Unsaturated Conditions. Int. J. Min. Sci. Technol. 2023, 33, 1243–1260. [Google Scholar] [CrossRef]
- Li, Q.H.; Song, D.Q.; Yuan, C.M.; Nie, W. An Image Recognition Method for the Deformation Area of Open-Pit Rock Slopes Under Variable Rainfall. Measurement 2022, 188, 187–208. [Google Scholar] [CrossRef]
- Wang, C.; Min, H.; Zhu, T.; Wang, H.; Qin, W.N.; Zhang, G. Failure Mechanism and Stability Analysis of the Landslide: A Case Study for Open Pit Iron Mine in Xichang, Sichuan, China. Nat. Hazards 2023, 116, 663–691. [Google Scholar] [CrossRef]
- Nian, G.; Chen, Z.; Zhu, T.; Zhang, H.F.; Zhou, Z.H. Experimental Study on the Failure of Fractured Rock Slopes with Anti-Dip and Strong Weathering Characteristics Under Rainfall Conditions. Landslides 2024, 21, 165–182. [Google Scholar] [CrossRef]
- Xiang, P.; Ji, H.G.; Geng, J.M.; Zhao, Y.W. Characteristics and Mechanical Mechanism of In Situ Unloading Damage and Core Discing in Deep Rock Mass of Metal Mine. Shock Vib. 2022, 2022, 5147868. [Google Scholar] [CrossRef]
- Li, Q.; Wang, Y.; Li, X.; Gong, B. Rainfall–Mining Coupling Effects on Slope Failure Mechanism and Evolution Process: A Case Study of Open-Pit to Underground Mining. Water 2024, 16, 740. [Google Scholar] [CrossRef]
- Demand, D.; Blume, T.; Weiler, M. Spatio-temporal Relevance and Controls of Preferential Flow at the Landscape Scale. Hydrol. Earth Syst. Sci. 2019, 23, 4869–4889. [Google Scholar] [CrossRef]
- Zhan, T.L.T.; Qiu, Q.W.; Xu, W.J. Analytical Solution for Infiltration and Deep Percolation of Rainwater into a Monolithic Cover Subjected to Different Patterns of Rainfall. Comput. Geotech. 2016, 77, 1–10. [Google Scholar] [CrossRef]
- Feng, S.; Huang, R.H.; Zhan, L.T.; Liu, H.W. Semi-Analytical Solution of Pore-Water Pressure in Unsaturated Ground and Infinite Slope Considering Highly Nonlinear Soil Hydraulic Properties. Comput. Geotech. 2023, 164, 105795. [Google Scholar] [CrossRef]
- Wu, L.Z.; He, B.; Peng, J.B. Analysis of Rainfall-Caused Seepage into Underlying Bedrock Slope Based on Seepage Deformation Coupling. Int. J. Geomech. 2024, 24, 04024043. [Google Scholar] [CrossRef]
- Tracy, F.T.; Vahedifard, F. Analytical Solution for Coupled Hydro-Mechanical Modeling of Infiltration in Unsaturated Soils. J. Hydrol. 2022, 612, 128198. [Google Scholar] [CrossRef]
- Su, Z.; Chen, G.; Meng, Y. Study on Seepage Characteristics and Stability of Core Dam Under the Combined Action of the Variation of Reservoir Water Level and Rainfall. Geotech. Geol. Eng. 2021, 39, 193–211. [Google Scholar] [CrossRef]
- Hou, D.; Zhou, Y.; Zheng, X. Seepage and Stability Analysis of Fissured Expansive Soil Slope Under Rainfall. Indian Geotech. J. 2023, 53, 180–195. [Google Scholar] [CrossRef]
- Paronuzzi, P.; Fedrigo, D.; Bolla, A. Rainfall Infiltration through Stratified Colluvial Deposits: Analytical Approach vs. Numerical Modelling. Geosciences 2024, 14, 53. [Google Scholar] [CrossRef]
- Hou, X.P.; Fan, H.H. Study on Rainfall Infiltration Characteristics of Unsaturated Fractured Soil Based on COMSOL Multiphysics. Rock Soil Mech. 2022, 43, 563–572. [Google Scholar]
- Zhong, J.Z.; Li, D.; Jiang, K. Assessment of Urban Underground Spaces Inundation During Extreme Rainfall Events. Water Sci. Technol. 2024, 89, 2851–2866. [Google Scholar] [CrossRef]
- Aguilar-López, J.P.; Bogaard, T.; Gerke, H.H. Dual-Permeability Model Improvements for Representation of Preferential Flow in Fractured Clays. Water Resour. Res. 2020, 56, 8. [Google Scholar] [CrossRef]
- Ma, L.; Huang, C.; Liu, Z.S.; Morin, K.A.; Dy, E.; Tufa, K.; Fisher, E.; Zhou, J.; Aziz, M.; Meints, C. A Full-Scale Case Study on the Leaching Process of Acid Rock Drainage in Waste Rock Piles and the Net Infiltration Through Cover Systems. Water Air Soil Pollut. 2020, 231, 305. [Google Scholar] [CrossRef]
- Parsasadr, H.; Mustafa, S.; Golian, M.; Bense, V. Development of a Finite Element Groundwater Flow Model to Test Drainage Management Strategies for the Expansion of the Dareh-Zar Open Pit Mine, Iran. Hydrogeol. J. 2024, 32, 1145–1165. [Google Scholar] [CrossRef]
- Liu, B.; Liu, G.; Sha, J.; Sun, J.; Zhao, X.; Ren, S.; Liu, R.; Li, S. Numerical Simulation of the Interaction Between Mine Water Drainage and Recharge: A Case Study of Wutongzhuang Coal Mine in Heibei Province, China. Ecol. Indic. 2024, 158, 111568. [Google Scholar] [CrossRef]
- Liu, Z.; Rong, L.; Wei, W. Impacts of Land Use/Cover Change on Water Balance Using the SWAT Model in a Typical Loess Hilly Watershed of China. Geogr. Sustain. 2023, 4, 19–28. [Google Scholar] [CrossRef]
- Poozan, A.; Western, A.W.; Burns, M.J.; Arora, M. Modelling the Interaction Between Vegetation and Infiltrated Stormwater. J. Hydrol. 2022, 607, 127527. [Google Scholar] [CrossRef]
- AL-Hussein, A.A.M.; Khan, S.; Ncibi, K.; Hamdi, N.; Hamed, Y. Flood Analysis Using HEC-RAS and HEC-HMS: A Case Study of Khazir River (Middle East—Northern Iraq). Water 2022, 14, 3779. [Google Scholar] [CrossRef]
- Guven, D.S.; Yenigun, K.; Isinkaralar, O.; Isinkaralar, K. Modeling Flood Hazard Impacts Using GIS-Based HEC-RAS Technique Towards Climate Risk in Şanlıurfa, Türkiye. Nat. Hazards 2025, 121, 3657–3675. [Google Scholar] [CrossRef]
- Zuo, J.; Wang, J.; Jiang, Y. Macro/Meso Failure Behavior of Surrounding Rock in Deep Roadway and Its Control Technology. Int. J. Coal Sci. Technol. 2019, 6, 301–319. [Google Scholar] [CrossRef]
- Sun, M.; Du, Y.; Liu, Q.; Feng, G.; Peng, X.; Liao, C. Understanding the Spatial-Temporal Characteristics of Land Subsidence in Shenzhen Under Rapid Urbanization Based on MT-InSAR. IEEE J. Sel. Top. Appl. Earth Obs. Remote Sens. 2023, 16, 4153–4166. [Google Scholar] [CrossRef]
- Liu, Y.; Yang, T.; Zhao, Y.; Ma, K.; Hou, X.; Zhao, Q.; Li, J. Characteristics of Strata Movement and Method for Runoff Disaster Management for Shallow Multiseam Mining in Gully Regions: A Case Study. Int. J. Rock Mech. Min. Sci. 2023, 172, 105608. [Google Scholar] [CrossRef]
- Pu, C.; Xu, Q.; Zhao, K.; Jiang, Y.; Hao, L.; Liu, J.; Chen, W.; Kou, P. Characterizing the Topographic Changes and Land Subsidence Associated with the Mountain Excavation and City Construction on the Chinese Loess Plateau. Remote Sens. 2021, 13, 1556. [Google Scholar] [CrossRef]
- He, Z.; Yang, Z.; Wu, X.; Zhang, T.; Song, M.; Liu, M. Triggering of Land Subsidence in and Surrounding the Hangjiahu Plain Based on Interferometric Synthetic Aperture Radar Monitoring. Remote Sens. 2024, 16, 1864. [Google Scholar] [CrossRef]
- Li, J.D.; Yang, T.H.; Liu, F.Y.; Zhao, Y.; Liu, H.L.; Deng, W.X.; Gao, Y.; Li, H.B. Modeling Spatial Variability of Mechanical Parameters of Layered Rock Masses and Its Application in Slope Optimization at the Open-Pit Mine. Int. J. Rock Mech. Min. Sci. 2024, 181, 105859. [Google Scholar] [CrossRef]
- Li, J.; Gao, Y.; Yang, T.; Zhang, P.H.; Deng, W.X.; Liu, F.Y. Effect of Water on the Rock Strength and Creep Behavior of Green Mudstone. Geomech. Geophys. Geo-Energ. Geo-Resour. 2023, 9, 101. [Google Scholar] [CrossRef]
- Li, J.D.; Gao, Y.; Yang, T.H.; Zhang, P.H.; Zhao, Y.; Deng, W.X.; Liu, H.L.; Liu, F.Y. Integrated Simulation and Monitoring to Analyze Failure Mechanism of the Anti-Dip Layered Slope with Soft and Hard Rock Interbedding. Int. J. Min. Sci. Technol. 2023, 33, 1147–1164. [Google Scholar] [CrossRef]
- GB 50830-2013; Code for Design of Metal Mine. China Planning Press: Beijing, China, 2013.
- GB 50014-2006; Code for Design of Outdoor Wastewater Engineering. China Planning Press: Beijing, China, 2006.


Disclaimer/Publisher’s Note: The statements, opinions and data contained in all publications are solely those of the individual author(s) and contributor(s) and not of MDPI and/or the editor(s). MDPI and/or the editor(s) disclaim responsibility for any injury to people or property resulting from any ideas, methods, instructions or products referred to in the content. |
© 2025 by the authors. Licensee MDPI, Basel, Switzerland. This article is an open access article distributed under the terms and conditions of the Creative Commons Attribution (CC BY) license (https://creativecommons.org/licenses/by/4.0/).