Abstract
Physical activity has been shown to influence ocular health, yet the acute effects of exercise on retinal and choroidal structures remain underexplored. This prospective pre-post study evaluated 30 low-fit adults without diagnosed cardiovascular disease who underwent comprehensive ophthalmologic assessments, including OCT and OCTA imaging, before and after a submaximal aerobic capacity test. Statistically significant thinning was observed in specific retinal sectors, affecting both inner and outer layers, including the retinal pigment epithelium (RPE). Vascular analysis using the OCTAVA toolbox revealed a significant post-exercise reduction in vessel length density, total vessel length, branchpoint density and fractal dimension in the peripapillary plexus; and mean tortuosity in the macular superficial vascular complex (SVC). Choroidal thickness also showed a significant reduction in several regions. No significant changes were found in the foveal avascular zone (FAZ). These findings suggest that acute submaximal physical activity induces transient yet measurable changes in retinal and choroidal microvasculature. The results have potential implications for understanding ocular vascular dynamics and for evaluating ocular health in clinical and sports medicine contexts.
1. Introduction
Physical activity (PA) is defined as bodily movement that is produced by the contraction of skeletal muscles and increases energy expenditure. This movement is usually planned, structured and repetitive to improve or maintain one or more components of physical fitness. The benefits of PA are provided by an increase in cardiac output [], improvement of adipose tissue distribution [], insulin sensitivity [], cognitive function and numerous psychosocial factors []. Systematic training can also increase high-density lipoprotein (HDL) concentrations, thus helping to protect the cardiovascular system from atherosclerosis []. In addition, PA plays an important role in the treatment of numerous systemic diseases and recent studies have shown that regular PA can be beneficial even in retinal diseases, such as age-related macular degeneration (AMD) and diabetic retinopathy (DR) [,,]. Although the benefits of physical activity on systemic health are well established, its acute effects on ocular microcirculation, particularly in sedentary adults, remain underexplored. Understanding these responses is essential for identifying early vascular dysregulation and for informing exercise recommendations in clinical populations.
Due to these benefits, there has been an increase in individuals of all ages striving to maintain good health through regular PA []. However, without proper medical monitoring to understand the baseline health of each individual, amateur PA can result in various injuries.
Maximal exercise testing is considered the gold standard for determining the maximal aerobic exercise capacity of subjects; however, the effectiveness of such tests is often reduced due to musculoskeletal impairments or pain/fatigue rather than cardiac strain [].
One of the fundamental standard measures of aerobic fitness is maximal oxygen capacity (VO2 max), or the maximum amount of oxygen the body can absorb during high-intensity aerobic exercise []. VO2 max. tests are used to assess an individual’s work capacity over a specific period and to determine how efficiently the body absorbs and utilizes oxygen []. Because of the reduced cardiovascular demands in untrained or aging populations compared to a maximal test, exercise physiologists often use submaximal aerobic capacity testing. This assessment can be very useful in non-clinical populations to make initial fitness assessments, cases where it is necessary to quickly and reliably test a group of subjects [,] and rule out any cardiac abnormalities.
Acute and chronic systemic vascular changes occur during exercise: acute changes in the cardiovascular system include an increase in heart rate (HR) and stroke volume to stabilize metabolic demand. Non-vital organ blood vessels undergo vasoconstriction allowing increased flow to skeletal muscles []. All these changes are mediated by the sympathetic nervous system []. Chronic changes include a decrease in heart rate both at rest and during exercise and an increase in the heart’s pumping volume or systolic volume [,]. Recent publications have shown a decrease in blood flow in the internal carotid artery (ICA), due to a decrease in blood viscosity and activation of the sympathetic nervous system [,]. These changes in ICA may induce changes in retinal and choroidal vascularization. Numerous scientific studies are currently investigating the effects of physical exercises on eye and their impact on various aspects, such as intraocular pressure (IOP), myopia, ocular blood flow (OBF), ocular perfusion pressure (OPP) and retinal electrical function [].
It has been shown that the PA produces structural and functional changes in the optic nerve [,], retina [,,,,] and choroid [,]. This study focuses on the acute physiological response to a submaximal aerobic test, which is characterized by transient hemodynamic and autonomic changes. These acute responses, unlike chronic adaptations, may induce short-term modifications in retinal and choroidal microvasculature, which can be captured using Optical Coherence Tomography (OCT) and angiography by OCT (OCTA). Unlike previous studies that focused on young athletes or high-intensity protocols, our study investigates the acute vascular response to a submaximal aerobic test in a sedentary middle-aged population. This approach provides novel insights into the physiological dynamics of the retina and choroid under moderate cardiovascular stress. The purpose of this work is to analyze in low-fit adults without diagnosed cardiovascular disease the vascular changes that occur in the retina and choroid by OCT and OCTA after performing a submaximal aerobic capacity test.
2. Materials and Methods
This study is a prospective pre-post design, where participants undergo comprehensive ophthalmologic evaluations both before and after a submaximal aerobic capacity test. This approach allows for the assessment of changes in ocular health parameters as a direct result of the exercise intervention.
2.1. Participants
Study participants were middle-aged, cognitively healthy individuals without any serious systemic or general diseases. Prior to inclusion, all participants gave written informed consent and were ready and able to undergo the different procedures.
A total of 30 subjects were analyzed in the present study. These subjects were scheduled for the same day to undergo ophthalmologic tests at the Ramón Castroviejo Institute of Ophthalmological Research clinic and a stress test at the School of Medicine for Physical Education and Sport, both in the Complutense University of Madrid.
Although some participants exhibited relatively elevated blood pressure readings, all values remained within the clinically accepted normotensive range. These individuals undergo annual health evaluations, including blood pressure monitoring, and none have been diagnosed with hypertension or are receiving antihypertensive treatment. Therefore, they have been considered clinically normotensive for the purposes of this study.
This work complied with the Declaration of Helsinki and the studies were approved by the Clinical Research Ethics Committee of the Hospital Clínico San Carlos with internal no. 15/382-E_BS and internal no. 18/422-E_BS.
2.2. Ophthalmological Tests
In our study, none of the subjects have any ophthalmologic pathology that could affect OCT measurements. Therefore, we conducted a telephone screening with all patients to evaluate their ophthalmologic history. Screening questions are summarized in Table 1.

Table 1.
Telephone screening questions.
Participants who successfully completed the telephone screening were then scheduled for an ophthalmologic examination.
The visual examination included visual acuity (Snellen), slit lamp examination, applanation tonometry (Perkins MKII tonometer, Clement Clarke International, Essex, England), and OCT-OCTA examination (Heidelberg Engineering, Heidelberg, Germany). The OCT and OCTA were performed before and after the submaximal aerobic capacity test. All participants followed the same imaging protocol and timing post-exercise to ensure consistency across measurements. All participants were required to meet the ophthalmologic inclusion criteria outlined in Table 2.
Table 2.
Ophthalmological inclusion criteria.
2.2.1. Retinal Thickness Analysis by OCT
The Spectralis 2 OCT device from Heidelberg Engineering (Heidelberg, Germany) was used to capture the OCT images. OCT and OCTA images were acquired approximately 5 min after the cessation of pedaling, following the completion of active recovery and the 3-min passive recovery phase of the exercise protocol. The acquisition order was identical for all participants: macular, followed by peripapillary/ONH. The premium edition of the Spectralis glaucoma module, which incorporates an anatomical positioning system (APS) based on two fixed points, the center of the fovea and the center of the Bruch’s membrane opening (BMO), was employed. High-resolution scans of the optic nerve head (ONH) were performed, including four radial lines and three circles, all centered on the opening Bruch’s Membrane (BMO), to obtain highly reproducible thickness measurements of the retinal nerve fiber layer (RNFL). The macular exam was performed with the posterior pole scan, considering the fovea and the BMO alignment. A total of 121 B-scans per eye were conducted. Heidelberg segmentation software (version 1.10.4.0) was utilized to measure the total retinal thickness and the thickness of each retinal layer in the macular area. These measurements were manually verified and adjusted by the same optometrist (IL-C) in cases where automatic segmentation was incorrect. The thicknesses of the following retinal layers were analyzed: RNFL, ganglion cell layer (GCL), inner plexiform layer (IPL), inner nuclear layer (INL), outer plexiform layer (OPL), outer nuclear layer (ONL), and retinal pigment epithelium (RPE). The standard ETDRS macular grid was employed to analyze the inner and outer macular rings and named as appears in Figure 1A. Thickness measurements were taken in a foveal area with a diameter of 1 mm, 1–3 mm around the fovea for the inner ring, and 3–6 mm for the outer ring. Peripapillary retinal nerve fiber layer (pRNFL) thickness was measured in six different sectors, and a global average was also calculated.
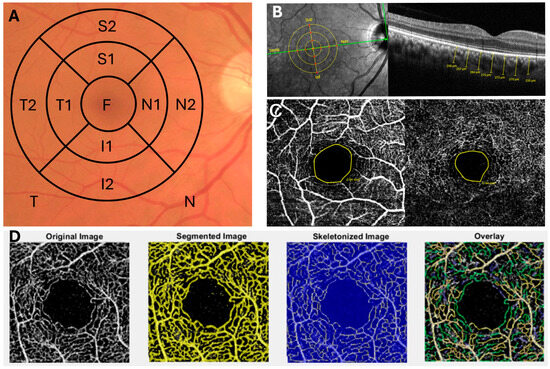
Figure 1.
Ophthalmologic Analysis Using OCT and OCTA Techniques. (A) ETDRS segmentation scheme with the nomenclature used in the OCT analysis of the retinal layers. (B) Manual analysis of choroidal thickness using OCT and its corresponding anatomical points analyzed. (C) OCTA analysis of the foveal avascular zone (FAZ) in the superficial and deep plexus. (D) OCTA image processing using the OCTAVA program for the analysis of various retinal vascular parameters.
Scans were considered of high quality when the signal-to-noise ratio was at least 25, and an average of 16 β-scans was performed. All measurements were presented in microns, based on the calibration provided by the manufacturers. Both eyes of each participant were scanned. However, to avoid potential bias due to inter-eye correlation, only one eye per subject was included in the final analysis. Eye selection was performed using a simple randomization procedure: prior to data processing, a random number generator was used to assign either the left or right eye for analysis. This approach ensured unbiased selection and minimized lateralization effects. No specific comparisons between left and right eyes were conducted, as the randomization was intended to control for such variability.
The colorimetric representation of the changes in the macular thickness between the baseline and post stress test was done with the Excel software (Version 16.101.1) and the colour scale function. The values are normalized for this scale were 1, in white, where there was no difference, 0.90 in blue tone, for thinning of layers, and 1.10 with red tone, when the layers were thicker after the stress test. The colour tone is provided directly by the software based on the thickness variation.
2.2.2. Choroidal Thickness Analysis
The thickness of the choroid was manually delineated using the measurement tool provided by the Heidelberg software (Heidelberg, Germany, version 1.10.4.0). The choroidal thickness was measured from the outer hyperreflective line of the RPE to the inner surface of the sclera, perpendicular to the retina. A subfoveal measurement was taken, and three additional measurements were performed at 500-micron intervals in the superior, inferior, nasal, and temporal sectors. This resulted in a grid of 13 measurements at 500, 1000, and 1500 µm intervals. The measurements were conducted following the instructions depicted in Salobrar et al. 2020 [] (Figure 1B).
2.2.3. Retinal Vascular Analysis by OCTA
The images were acquired using the Spectralis 2 OCT Angiography module by Heidelberg Engineering (Heidelberg, Germany), following the protocol previously described by López-Cuenca et al. []. We performed macular area analysis using a viewing angle of 15° × 15° and a lateral resolution of 5.7 μm/pixel. To examine the peripapillary area, the stimulus was shifted to a flexible external fixation lamp and centered on the subject’s optic nerve. For image acquisition in the peripapillary area (ONH), an angle of 10° × 10° and a resolution of 5.7 μm/pixel were employed.
The foveal avascular zone (FAZ) was manually measured using the measurement tool provided by the Heidelberg software (Figure 1C).
A thorough review and analysis of all images was conducted by the same optometrist (ESG), excluding those with artifacts such as center displacement, defocus, shadows, eye movements, blinking, or poor segmentation. High-quality images were exported in JPG format for subsequent analysis using an open-source toolbox, OCTAVA (OCTA Vascular Analyser), a tool that enables quantitative analysis and characterization of OCTA images (Figure 1D). OCTAVA performs the processing, segmentation, and quantitative analysis of maximum projection OCTA images, and analysis in both individual and batch modes, with magnification error correction by inputting the size of each image. Additionally, it includes filters to enhance image quality and segmentation techniques to distinguish between vessels and non-vessels [,].
The parameters analyzed in this study include vessel area density (%), vessel length density (%), total vessel length (mm), mean diameter (µm), median diameter (µm), branchpoint density (1/mm), fractal dimension, and mean tortuosity. These parameters were analyzed in the superficial vascular complex (SVC), the deep capillary plexus (DCP), and the optic nerve area (ON) before and after the stress test.
2.2.4. Physical Working Capacity Test
All participants underwent a submaximal indirect ergometry test (interrupted when the patient reached a minimum of 85% of their theoretical maximum heart rate) and supervised by the same expert (FMT). The theoretical maximum heart rate (HRmax), expressed in beats per minute (bpm), was calculated using the widely accepted formula: HRmax = 220—age []. The Physical Working Capacity (PWC) refers to the maximum amount of physical work an individual can perform over a given period. It is often used as a measure of aerobic fitness and is typically related to a specific heart rate. Each participant underwent a single submaximal aerobic capacity test during the study.
Prior to conducting this test, patients undergo a medical and surgery history assessment, including personal and family medical history, current situation (anamnesis), and exercise habits as well as any medications that may influence the test procedures and the response to exercise are taken. In addition, participants are examined through weight, height, cardiac and respiratory auscultation, resting blood pressure, resting heart rate, and peripheral pulses. Subsequently, a baseline or resting electrocardiogram (ECG) is performed.
The PWC test is conducted using a cycle ergometer or a single-wheel stationary bicycle, which serves as an ergometer to measure an individual’s work output under controlled conditions. The test procedure is as follows: With the cycle ergometer calibrated and the environmental conditions optimized, the handlebar and seat are adjusted to fit the subject’s characteristics. Before mounting the bicycle, the participant is fitted with electrodes and undergoes an electrocardiogram in both supine and standing positions. The test begins with a warm-up phase, which involves pedaling for 5 min at a constant rhythm of 60–70 rpm without any load.
Subsequently, the test follows this protocol: two-minute stages with a 25 W increment per stage, starting at 25 W (second stage 50 W, third stage 75 W, and so on). The test concludes when the participant reaches at least 85% of their theoretical maximum heart rate. The theoretical maximum heart rate is calculated using the formula: 220 minus the participant’s age. After the test, the recovery phase begins. The participant pedals for 1 min at half of the maximum load achieved during the exercise, maintaining a rhythm between 50–60 rpm. In the following two minutes, the load is reduced to 50% of the first minute of recovery or a constant load of 25 W at a rhythm below 50 rpm, constituting active recovery. Subsequently, the patient stops pedaling and remains seated at rest for 3 min to complete passive recovery, marking the end of the test.
Blood pressure is measured at the end of the warm-up, at the end of each stage, and at the 1st, 2nd, and 3rd minute of recovery. Electrocardiographic tracing and heart rate are continuously monitored throughout the test.
2.3. Sample Size Calculation
The sample size was determined using the Granmo online calculator (https://www.granmo.com, employing the statistical model for comparing two means in paired samples. This approach was selected as a practical approximation to the Wilcoxon signed-rank test, which is commonly used for analyzing dependent non-parametric data.
A significance level of 5% (α = 0.05) and a statistical power of 80% (1 − β = 0.80) were applied. Based on previous studies and the known variability of optical coherence tomography (OCT) measurements, an expected mean difference of 6 µm in fiber layer thickness was assumed, with a standard deviation of 8 µm.
No participant dropout was anticipated during the study period; therefore, the expected attrition rate was set to 0%.
According to these parameters, the minimum required sample size to detect a statistically significant difference was calculated to be 28 subjects.
Moreover, to justify the inclusion of n = 30, we have referenced other studies cited within this same work that report a sample size similar to ours, or even smaller [,,,,,,,,,,,,,,].
2.4. Statistical Analysis
GraphPad Prism (version 9, GraphPad Software Inc., San Diego, CA, USA) was used for the statistical analysis of this work. The Shapiro–Wilk test was used to examine the normality of the sample. To examine quantitative variables, the non-parametric statistical Wilcoxon for paired samples was used. As the data did not follow a normal distribution (Shapiro–Wilk test), results are presented as median and interquartile range (IR). Spearman’s correlation coefficients were used to correlate the quantitative variables. They were defined as statistically significant when p-value < 0.05, represented as * p < 0.05, ** p < 0.01 and *** p < 0.0001.
3. Results
3.1. Demographics and Parameters of Aerobic Capacity and Cardiovascular Health
The study participants (18 women and 12 men) had a median age of 58.00 (55.00–63.50) years. The median weight of the participants was 64.00 (54.40–73.70) kg and a median height of 159.00 (154.80–168.20) cm. The participants had a body mass index of 24.10 (22.60–26.50).
Additionally, when analyzing before and after the stress test the heart rate as well as systolic blood pressure (SBP) the participants exhibited statistically significant differences (p < 0.0001 and p < 0.05, respectively) (Table 3).
Table 3.
Demographics and parameters of aerobic capacity and cardiovascular health.
3.2. Macular Thickness of the Retinal Layers
When analyzing the thickness of the different retinal layers in the macular area before and after the stress test we found in the GCL a statistically significant decrease in thickness in the sectors I1 (p < 0.05) and N2 (p < 0.01) (Figure 2) (Supplementary Table S1).
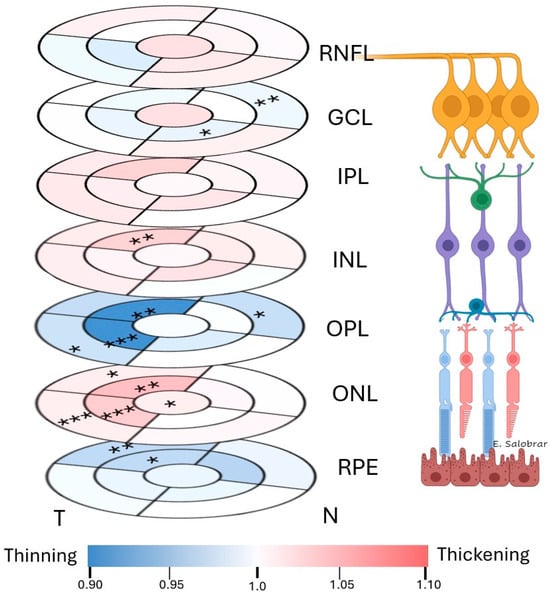
Figure 2.
Colorimetric changes in the retinal thickness in each layer between the baseline and post stress test measurements in the macular OCT rings. In red, thickening; in blue, thinning. (RNFL: retinal nerve fiber layer; GCL: ganglion cell layer; IPL: inner plexiform layer; INL: inner nuclear layer; OPL: outer plexiform layer; ONL: outer nuclear layer; RPE: retinal pigment epithelium). * p < 0.05. ** p < 0.01. *** p < 0.001.
In the INL, a statistically significant thickness increase was observed in the sectors S1 (p < 0.01) (Figure 2) (Supplementary Table S1).
In the OPL, a statistically significant thickness decrease was observed in the sectors T1 (p < 0.001), S1 (p < 0.01), N2 (p < 0.05) and T2 (p < 0.05) (Figure 2) (Supplementary Table S1).
In the ONL we found a statistically significant increase in thickness in the foveal sector (F) (p < 0.05), in S1 (p < 0.01), T1 (p < 0.001), S2 (p < 0.05) and T2 (p < 0.001) (Figure 2 (Supplementary Table S1).
Finally, in the RPE we found a statistically significant decrease in thickness in the sectors S1 (p < 0.05) and S2 (p < 0.01) (Figure 2) (Supplementary Table S1).
In the RNFL and IPL, no statistically significant differences were found (p > 0.05) (Figure 2) (Supplementary Table S1).
Finally, in the total retina thickness, we found a statistically significant increase in the thickness in the N2 sector (p < 0.05) (Supplementary Table S1).
3.3. Choroidal Thickness
When analyzing choroidal thickness after the stress test and comparing it with baseline values, we found a statistically significant decrease in thickness in: (i) the subfoveal analysis (p < 0.01); (ii) the superior sector at 1000 µm (p < 0.01) and 1500 µm (p < 0.001); (iii) the nasal sector at 500 µm (p < 0.001) and; (iv) in the inferior sector at 500 µm (p < 0.05) (Figure 3).
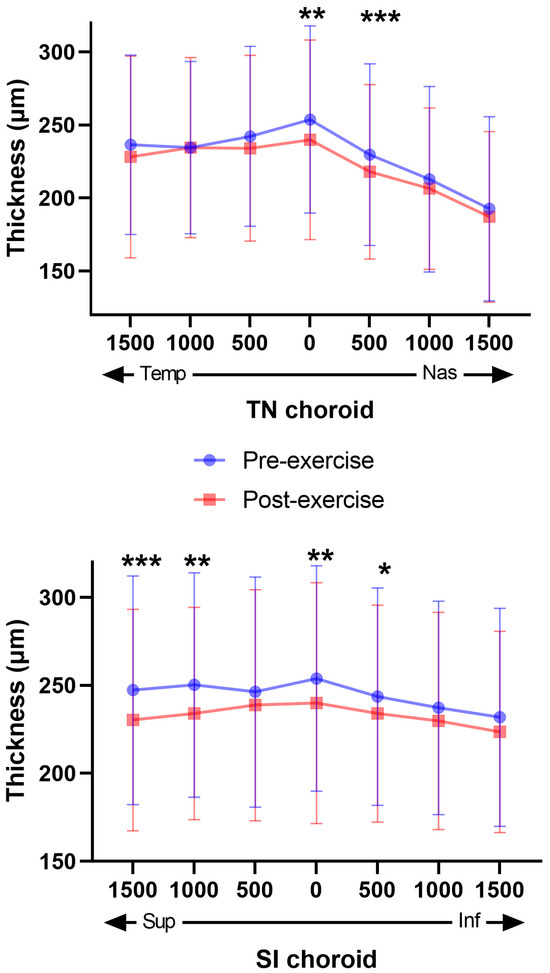
Figure 3.
Distribution of Choroidal Thicknesses Before and After stress test. The graphs show the distribution of choroidal thicknesses in two different regions: TN (temporal-nasal) in the upper graph and SI (superior-inferior) in the low graph. In both graphs, a significant decrease in choroidal thickness is observed post-exercise compared to pre-exercise. The blue dots represent pre-exercise values, while the red dots represent post-exercise values. The error bars indicate the variability of the measurements. Asterisks indicate levels of statistical significance: * p < 0.05, ** p < 0.01, *** p < 0.001.
3.4. Analysis of Foveal Avascular Zone
We found no statistically significant differences in the FAZ of either the superficial plexus or the deep plexus when comparing post-stress test values with pre-test values (p > 0.05) (Table 4).
Table 4.
FAZ analysis before and after stress test.
3.5. Vascular OCTA Study
When comparing vascular parameters between baseline and post-exercise measurements using the OCTAVA toolbox, it was found that post-stress test there was a statistically significant decrease in the ONH vascular area in: % vessel length density, total vessel length, branchpoint density, and fractal dimension (p < 0.05, in all cases). In the macular superficial vascular complex (SVC) this statistically significant reduction was observed in the mean tortuosity (p < 0.05) (Figure 4).
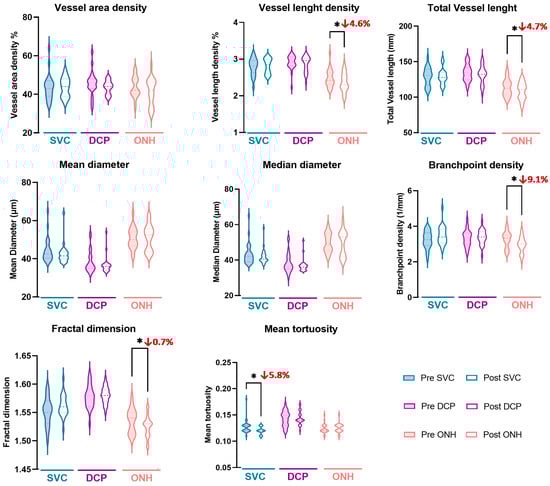
Figure 4.
Analysis of vascular parameters in different vascular plexus and areas between baseline and post stress test measurements using the OCTAVA toolbox. Asterisks indicate levels of statistical significance: * p < 0.05. SVC: Superficial vascular complex, DCP: deep capillary plexus and ONH: optic nerve head.
3.6. Correlations Between Cardiovascular and Ophthalmologic Measures Post Stress Test
The heart rate correlates significatively with N1 in the OPL (p < 0.05; r = 0.540) (Supplementary Table S2).
We found a positive correlation between the SBP and the N1 sector of the OPL (p < 0.05, r = 0.540) (Supplementary Table S2).
The value of DBP was significantly correlated with: (i) the F and I1 sectors in the RNFL (p < 0.05, r = −0.535 and r = −0.596, respectively); (ii) the N1 sector in the GCL (p < 0.01 r= −0.667)and the S1 (p < 0.05 r = −0.525); (iii)the F and N1 in the IPL (p < 0.05 and r = −0.567 and r = −0.546, respectively) and; (iv) the I1 sector in the total retinal thickness (p < 0.05 and r = −0.563) (Supplementary Table S2).
Absolute VO2max correlates significantly with: (i) the RNFL in S2 sectors (p < 0.01, r = 0.656); (ii) in the GCL with the T1 sector (p < 0.05 and r = 0.556), S1 sector (p < 0.01 and r = 0.745) and I1 sector (p < 0.05 and r= 0.649); (iii) in the IPL with the S1 sector (p < 0.01 and r = 0.695) and in the I1 sector (p < 0.05 and r = 0.526); (iv) in the OPL with the S1 sector (p < 0.05 and r = 0.540) (Supplementary Table S2).
Relative VO2max correlated significantly with total retinal thickness in the N1 (r = −0.626, p < 0.05), T1 and S1 sectors p < 0.05, r = −0.510 and r = −0.560, respectively) (Supplementary Table S2).
The DBP also has significantly correlation with: (i) the vessel area density in the SVC and DCP (p < 0.05 and p < 0.001; r = −0.511 and r = −0.7,2, respectively); (ii) the vessel length density in the DCP (p < 0.05, r = −0.532); (iii) the total vessel length in the DCP (p < 0.05, r = −0.540); (iv) the branchpoint density in the SVC and DCP (p < 0.01 and p < 0.05, r = −0.644 and r = −0.592, respectively); (v) the fractal dimension in the DCP (p < 0.01, r = −0.646) and; (vi) the mean tortuosity in the SVC (p < 0.01 and r = −0.647) (Supplementary Table S3).
The absolute VO2max and the relative VO2max has significantly correlation with the total vessel length in the SVC (p < 0.05 and r = 0.500 and r = 0.493, respectively).
No statistically significant correlations were found between the cardiovascular parameters and choroidal thickness and FAZ after stress test (Supplementary Table S4).
4. Discussion
The health benefits of PA are widely recognized, including the reduction of the risk of cardiovascular diseases, type II diabetes, depression, and cancer [,,]. At the ocular level, regular PA has also been associated with a lower prevalence of retinal microvascular abnormalities [,,] as well as benefits in diseases such as AMD and DR [,]. Despite these factors, a substantial number of adults worldwide (approximately 1.4 billion) do not meet the recommended 150 min of PA per week for optimal health [].
Nowadays, retinal and vascular changes induced by PA have been reported in the retina using OCT and OCTA. These advanced imaging techniques allow for detailed visualization of retinal microvasculature and structural alterations, providing valuable insights into how exercise influences ocular health [,,,,,,,,,,,,,,].
There is no consensus on the results obtained in studies analyzing retinal thickness using OCT after physical activity, with some authors reporting no significant changes in retinal thickness following exercise [,,]. However, in the present study, participants exhibited a statistically significant thinning of specific retinal sectors, both in the inner layers—in the I1, and N2 sectors of the GCL—as well as in the outer layers—in the S1, T1, T2, and N2 sectors of the OPL—and in the RPE in the S1 and S2 sectors. A possible explanation for the thickness decreases in these layers could be their proximity to or involvement in the vascular plexuses (SVC, DVP, and choriocapillaris) []. These results are consistent with the findings of Szalai et al., who studied the retina of young adults during the first five minutes following physical exercise []. These changes could be related to the increase in SBP, which induces vasoconstriction in the retinal arteriolar system. This may manifest as a reduced thickness of the previously mentioned retinal layers, which are composed of cellular bodies and vascular plexuses [,]. Another possible explanation for the observed thinning may be the retinal autoregulation mechanism, which acts as a myogenic response of the vascular wall to fluctuations in blood pressure. This process involves vasoconstriction in the arterioles, potentially accounting for the various changes observed in the study []. This myogenic response is assumed to be primarily mediated by endothelial cells in the vascular wall, along with other factors such as endothelin-1, nitric oxide, and carbon dioxide, among others []. However, on the other hand, in our study, both the outer and inner nuclear layers exhibited a statistically significant thickening in several sectors. These results are consistent with those of Szalai et al., who also found a statistically significant thickening of the ONL five minutes after physical exercise, which persisted until fifteen minutes post-exercise. The authors concluded in their study, that the observed changes in the nuclear layers do not appear to be related to the physical condition of the subjects []. The increases and decreases in retinal thickness observed after exercise could be attributed to an elevated secretion of atrial natriuretic peptide, which is released following physical activity and has been localized in the RPE, inner and outer plexiform layers, outer segments of photoreceptors [], and the choroid []. This peptide is involved in the regulation of extravascular fluid and may modulate cerebral blood flow, blood–brain barrier permeability, or cerebrospinal fluid volume. Given the similarity between the blood–brain barrier and the blood–retinal barrier, this peptide could also play a role in regulating retinal blood flow [,]. Moreover, due to its paracrine and autocrine functions, this peptide could play an important role in regulating fluid movement from RPE, potentially modulating the extracellular space of the retina []. The findings are consistent with sympathetic activation that redistributes blood flow toward exercising muscle, combined with retinochoroidal autoregulation (myogenic and endothelial) and a transient reduction in internal carotid flow described during exertion, which may explain the observed reductions in vascular density in the SVC/ONH and choroidal thinning. The potential involvement of natriuretic peptides in retinal fluid regulation may also contribute to the observed layer-specific thickness changes.
A recent study analyzed a sample of 220 subjects to investigate the effects of PA on retinal thickness and vascularization. When comparing the group with a low PA lifestyle to those with moderate PA, a significant increase in RNFL thickness was observed. Additionally, when comparing individuals with high PA, a greater foveal thickness was estimated. No changes were observed in other macular parameters or in the peripapillary region []. In our study, no changes were observed in RNFL, possibly because we compared baseline and post-exercise conditions in subjects with low physical fitness, who only reached 85% of their maximum cardiovascular capacity. Therefore, the results do not seem comparable between the two studies. Lastly, in our study, we observed a statistically significant decrease in total retinal thickness after exercise, a result that was not found by other authors either at 5 or 15 min after similar exercise [].
Research utilizing OCTA revealed that brief exercise markedly elevated heart rate and blood pressure, in addition to modifying optic nerve and macular perfusion. This led to a notable reduction in peripapillary and parafoveal flow density [,], aligning with our findings of significant some vascular parameters decrease in the optic nerve region and in the SVC. However, another study conducted in children aged 9 to 13 years revealed that moderate physical exercise for 20 min increased overall and parafoveal vascular density in both superficial and deep layers after 30 min of rest []. In sports settings, variations in intraocular pressure (IOP) across disciplines have been reported, potentially modulating ocular perfusion pressure. Although our study focuses on sedentary adults and submaximal exercise, these data help contextualize the interaction between systemic and ocular hemodynamics during physical exertion [].
In the present study comparing vascular parameters between baseline and post-exercise measurements using the OCTAVA toolbox, it was found that post stress test there was a statistically significant reduction in the macular SVC; this statistically significant decrease was also observed in the mean tortuosity.
In 2020, a study using OCTA demonstrated changes in the functional vascular density (VD) of the retina before and after an incremental continuous exercise test (ICRT) for 3 min, with and without a mask. The mask only affected at rest, reducing the VD of the SVC. However, changes in the long-term recovery of retinal microcirculation after exercise were not analyzed []. These changes were analyzed in a recent study that examined changes in the VD of the retina at rest, during exercise, and the subsequent 30 min in young healthy volunteers using OCTA, both with and without a mask. In this study it was found that both exercise and wearing mask affected the retinal VD in both the macula (SVC and DCP) and the ONH (SVC, nerve fiber vessels, and small nerve fiber vessels). These changes recovered after 30 min of rest, demonstrating that exercise-induced vasoconstriction in the retina recovers within this time []. The 30-min recovery time is more comparable to ours, as in our participants, once they reach 85% of their maximum capacity, a recovery period follows. VD is analyzed approximately 5 min after the end of the submaximal exercise test, rather than immediately, as is commonly done in most studies [,,].
However, not statistically significant results were found in the FAZ of either the superficial plexus or the deep plexus when comparing post-stress test values with pre-test values. These results are consistent with the findings of Kim et al. [] and Alnawaiseh et al. [] who also did not observe significant changes in the FAZ of the SVC after physical activity. In the same study, Alnawaiseh et al. demonstrated that after high-intensity interval training (HIIT), the flow density in the peripapillary region increased, while the mean FAZ area in the DVP and the macular flow density of the superficial layer significantly decreased []. In other publications, a decrease in the FAZ has also been confirmed in individuals who engage in high levels of PA [,] as well as increased VD and greater macular thickness [].
When we analyzed the peripapillary vascular plexus using OCTA and assessed the vascular parameters with OCTAVA, we found a significant decrease in the VD of the peripapillary plexus in various parameters: % vessel length density, total vessel length, branchpoint density, and fractal dimension. Although direct measurement of retinal or choroidal blood flow was not performed, vascular parameters derived from OCTA provide indirect but valuable insights into microvascular changes. These findings are consistent with those of Alnawaiseh et al. and Kim et al., who also found a significant decrease in peripapillary flow in all analyzed sectors [,]. Physiologically, this reduction in vascular parameters at the ONH could be attributed to a decrease caused by the opening of shunts, which would maintain the minimal perfusion necessary to preserve visual function [].
However, other authors have found an increase in peripapillary flow density in subjects who engage in high-intensity training [,]. Finally, the study by Hua et al. found no changes in the peripapillary plexus after performing a continuous incremental aerobic capacity test. The difference in the results obtained could be largely attributed to: (i) the type of OCTA used, which may vary in light source and scanning speed; (ii) artifacts produced in the image induced by rapid breathing after physical activity; (iii) images obtained in the peripapillary area are often taken after macular imaging in most publications, which could increase the rest time of the patients and make the results unreliable [,].
In the present study, choroidal thickness showed a statistically significant decrease after PA in the nasal and inferior sectors at 500 µm; superior at 1000 and 1500 µm and subfoveal. A reduction in choroidal thickness has also been reported by Li. et al. in children subjected to static cycling exercise for 20 min []. This decrease in choroidal thickness could be due to the sympathetic stimulation generated during exercise, causing a contraction of smooth muscle cells, which could justify this reduction [,]. In addition, this muscular contraction, together with the dehydration produced by the sweating suffered by the subjects, causes water not to enter the matrix of the vessels and compensate for the changes observed [,].
In a study like ours, in which a stress test was performed on a group of subjects with an average age of 60 years, no changes were found in the choroidal thickness measured by OCT. This study does not specify the type of stress test performed by the subjects or the duration of the test. In addition, the method of analysis of the choroid only analyzes the temporal and nasal choroid up to 1000 µm, being these the possible reasons for the disparity with our results [].
The evaluation of the choroidal thickness has been carried out at different time intervals after physical exercise, thus obtaining different results: (i) at 3 min after PA, different authors reported an increase in volume and a thickening of the superior zone of the choroidal thickness [,,] (ii) at 5 min Sayin et al. demonstrated an increase in the global choroidal thickness [] (iii) at 10 min in the study conducted by Insa-Sanchez et al. reported a decrease in choroidal thickness and volume when compared to the results obtained at 3 min where an increase in choroidal thickness and volume was observed []; (iv) at 15 min, several publications found no significant change in the choroidal thickness [,,]. Finally, the study conducted by Li et al. aimed to study the changes at the macular and choroidal level in children aged 9 to 13 years after performing PA with SS-OCT and SD-OCTA, finding a significant decrease in choroidal thickness in all the locations analyzed, which does not recover its baseline value until at least 30 min after exercise []. The discrepancies between the results obtained are thought to be due to the difference in age between children and adults, which could be due to anatomical differences between the two age groups such as the elasticity and resistance of the blood vessels and their self-regulating capacity [].
It has been established that choroidal vessels are under neurogenic control [,]. Exercise activates the sympathetic nervous system [], which would produce constriction of these vessels. In addition, various factors such as blood gasometry and pH, visual stimulation and vasoactive agents such as endothelin-I and nitric oxide, in endothelium-dependent vasodilation [,,] can alter vascular tone and diameters. Some of these factors could have influenced the decrease in choroidal thickness observed in the present study.
When analyzing the correlations after PA between retinal structural parameters and arterial blood pressures, we observed only a significant positive correlation between SBP and the N1 thickness of the OPL, as well as significant negative correlations between DBP values and the thickness of different sectors of the RNFL, GCL, IPL and total retinal thickness. In addition, we found a significant positive correlation between the thickness of various sectors of the RNFL, GCL, IPL and OPL in the retina and the absolute VO2 max values. It is known that DBP and SBP behave differently in response to PA [,]. SBP increases steadily during exercise due to increased cardiac output and vasoconstriction of the vascular bed that does not perform exercise []. This could produce a decrease in choroidal thickness and certain retinal layers observed in this work. Although DBP may increase or decrease after exercise, in our work we found no statistically significant differences between rest and PA.
After PA we found significant negative correlations between some vascular parameters of retinal plexuses such as the vessel area and branch point density in SVC and DCP, the vessel length density and fractal dimension in DCP, the main tortuosity in SVC and the DBP after exercise. On the other hand, after performing a Wingate test in young adult athletes, a moderate correlation has been identified between the variation in SBP and the variation in the super-superficial vascular plexus, as well as in the deep vascular plexus in the superior areas []. However, Kim et al. observed a significant correlation between changes in retinal vascularisation in the superficial and deep plexuses and exercise-induced increase in SBP [].
It has been shown that there is an increase in the artery-to-vein calibre ratio, where arteries increase in caliber in marathon runners compared to sedentary controls []. This increase in caliber in fit subjects could justify the changes in vascular density found in the different publications, as our study consisted of subjects with poor physical fitness. In addition, it has been demonstrated that the retina undergoes autoregulation during PA, mediated by an increase in vascular resistance and an increase in the partial pressure of oxygen [].
In the present study, a correlation was made between choroidal thickness and cardio-vascular variables at rest and after physical activity, the latter being the one analysed in most of the studies [,,,]. In the present study, we found no statistically significant correlations, and these results are consistent with those of the study by Karaküçük et al. in which no significant correlations were found between blood pressure and choroidal thickness []. This could be since the test conducted in both our study and that of Karakucuk lasts 30 min, and possibly, priority was not given to blood flow to peripheral organs during this time. Similar to the retina, which undergoes an autoregulatory mechanism when there are changes in blood pressure, the choroid is believed to exhibit sensitivity to changes in blood pressure, as occurs in cerebral circulation [].
The VD of the peripapillary plexus after PA did not show any statistically significant correlation with the cardiovascular parameters analyzed. However, Alnawaiseh et al. found a significant correlation between changes in the optic nerve and changes in DBP and mean arterial pressure []. These correlations seem to be influenced by the type of PA performed and the energy expenditure it induces in the subject.
The novelty of our study lies in its focus on a low-fit, middle-aged population undergoing a submaximal test, a scenario more representative of real-world clinical and preventive settings. The use of OCTA combined with the OCTAVA toolbox allowed for a detailed and reproducible quantification of microvascular changes, which may serve as early indicators of vascular reactivity or dysfunction.
Among the possible limitations of our study are the small number of subjects included (31 subjects). This study lacks a non-exercising control group, which prevents complete exclusion of diurnal fluctuations, particularly in choroidal thickness. Additionally, due to logistical constraints, validated physical activity questionnaires and direct VO2 max measurements were not collected, and BMI is available only at the cohort level. No functional correlates (e.g., mfERG, visual field testing) were performed in the post-exercise window. These aspects should be addressed in future studies, ideally incorporating a concurrent control arm and more extensive functional and anthropometric characterization. Additionally, comparing our results with those of other studies also presents certain limitations, such as: (i) choroidal thickness measurements are not completely objective as they use manual delineation; (ii) the type of OCT used, as the clear visualization of the choroidal boundaries facilitates its measurement; (iii) the sample sizes in most studies are small; (iv) the age range of the subjects is very disparate, in addition to the different physical conditions they present; (v) the time of day when the ophthalmological study was conducted, as there are diurnal variations in choroidal thickness [].
5. Conclusions
Low-fit adults without diagnosed cardiovascular disease who underwent a submaximal aerobic capacity test exhibited statistically significant thinning in specific retinal sectors, affecting both inner and outer retinal layers, including the retinal pigment epithelium (RPE). Vascular analysis using the OCTAVA toolbox revealed a significant post-exercise response in the macular SVC, characterized by a statistically significant reduction in SVC density, median vessel diameter, and mean tortuosity. Additionally, in the peripapillary vascular plexus, a significant decrease was observed in several vascular parameters, including vessel length density, total vessel length, branchpoint density, and fractal dimension. No statistically significant changes were detected in the FAZ of either the superficial or deep capillary plexus. However, choroidal thickness showed a significant post-exercise reduction in the nasal, inferior, temporal sectors, and the subfoveal region. Collectively, these findings indicate that acute physical exercise induces transient yet measurable changes in both retinal and choroidal microvasculature. These physiological responses may have important implications for the evaluation of ocular vascular health in clinical practice and sports medicine.
Supplementary Materials
The following supporting information can be downloaded at: https://www.mdpi.com/article/10.3390/app151910458/s1, Supplementary Table S1. OCT thickness analysis before and after stress test. Supplementary Table S2. Correlations between cardiovascular and OCT thickness measures post stress test. Supplementary Table S3. Correlations between cardiovascular parameters and vascular OCTAVA measures post stress test. Supplementary Table S4. Correlations between cardiovascular parameters and choroidal thickness and FAZ after stress test.
Author Contributions
Conceptualization, I.L.-C., F.M.-T. and E.S.-G.; methodology, I.L.-C. and E.S.-G.; formal analysis, I.L.-C., R.d.H. and E.S.-G.; investigation, E.S.-G., I.L.-C., R.d.H., L.E.-H., J.A.M., J.A.F.-A., L.S.-P., J.M.R., A.I.R., J.J.S. and J.M.R.; data curation, E.S.-G., I.L.-C., R.d.H., L.E.-H., J.A.M., J.A.F.-A., L.S.-P., J.M.R., A.I.R., J.J.S., J.M.R. and F.M.-T.; writing—original draft preparation, I.L.-C., R.d.H. and E.S.-G.; writing—review and editing, E.S.-G., I.L.-C., R.d.H., L.E.-H., J.A.M., J.A.F.-A., L.S.-P., J.M.R., A.I.R. and J.J.S.; supervision, I.L.-C. and E.S.-G. All authors have read and agreed to the published version of the manuscript.
Funding
This research was supported by the Basic Vision Sciences Research Group at the IIORC (UCM-920105). L.S.-P. is currently supported by a predoctoral fellowship (CT82/20-CT83/20) from the Complutense University of Madrid. J.A.M. is currently supported by a predoctoral fellowship (CT58/21-CT59/21) from the Complutense University of Madrid.
Institutional Review Board Statement
The study was conducted in accordance with the Declaration of Helsinki, and approved by Hospital Clínico San Carlos with internal no. 15/382-E_BS and internal no. 18/422-E_BS.
Informed Consent Statement
Informed consent was obtained from all subjects involved in the study.
Data Availability Statement
The data supporting the findings of this study are available from the corresponding author upon request.
Acknowledgments
We thank David León Dominguez for his contribution to the collection of ophthalmological data for this study.
Conflicts of Interest
The authors declare no conflicts of interest.
Abbreviations
The following abbreviations are used in this manuscript:
| AMD | age-related macular degeneration |
| BMO | opening Bruch’s Membrane |
| DBP | diastolic blood pressure |
| DCP | deep capillary plexus |
| DR | diabetic retinopathy |
| FAZ | Foveal avascular zone |
| GCL | ganglion cell layer |
| HDL | high-density lipoprotein |
| HIIT | high-intensity interval training |
| HR | heart rate |
| ICA | internal carotid artery |
| ICRT | incremental continuous exercise test |
| INL | Inner nuclear layer |
| IPL | inner plexiform layer |
| IOP | intraocular pressure |
| IR | interquartile range |
| OBF | ocular blood Flow |
| OCT | Optical Coherence Tomography |
| OCTA | Optical Coherence Tomography Angiography |
| OCTAVA | OCTA Vascular Analyser |
| OPP | ocular perfusion pressure |
| ONH | optic disc |
| ONL | Outer nuclear layer |
| OPL | outer plexiform layer |
| PA | Physical activity |
| PWC | Physical Working Capacity |
| pRNFL | Peripapillary retinal nerve fiber layer |
| RNFL | retinal nerve fiber layer |
| RPE | retinal pigment epithelium |
| SBP | systolic blood pressure |
| SVC | superficial Vascular complex |
| VD | vascular density |
| VO2 max | maximal oxygen capacity |
References
- Patel, H.; Alkhawam, H.; Madanieh, R.; Shah, N.; Kosmas, C.E.; Vittorio, T.J. Aerobic vs Anaerobic Exercise Training Effects on the Cardiovascular System. World J. Cardiol. 2017, 9, 134. [Google Scholar] [CrossRef]
- Crews, D.J.; Landers, D.M. A Meta-Analytic Review of Aerobic Fitness and Reactivity to Psychosocial Stressors. Med. Sci. Sports Exerc. 1987, 19, S11–S120. [Google Scholar] [CrossRef]
- Rosenthal, M.; Haskell, W.L.; Solomon, R.; Widstrom, A.; Reaven, G.M. Demonstration of a Relationship between Level of Physical Training and Insulin-Stimulated Glucose Utilization in Normal Humans. Diabetes 1983, 32, 408–411. [Google Scholar] [CrossRef] [PubMed]
- Mcardle, W.D.; Katch, F.I.; Katch, V.L. Fundamentos de Fisiología del Ejercicio, 2nd ed.; Mcardle, W.D., Katch, F.I., Katch, V.L., Eds.; McGraw-Hill Interamericana de España: Madrid, Spain, 2004. [Google Scholar]
- Cui, B.; Zhu, Y.; Zhang, X.; He, K.; Shi, Y.; Yu, J.; Zhou, W.; Zhu, Y.; Yan, H. Association of Physical Activity with Retinal Thickness and Vascular Structure in Elderly Chinese Population. Ophthalmic Res. 2022, 66, 281–292. [Google Scholar] [CrossRef] [PubMed]
- McGuinness, M.B.; Le, J.; Mitchell, P.; Gopinath, B.; Cerin, E.; Saksens, N.T.M.; Schick, T.; Hoyng, C.B.; Guymer, R.H.; Finger, R.P. Physical Activity and Age-Related Macular Degeneration: A Systematic Literature Review and Meta-Analysis. Am. J. Ophthalmol. 2017, 180, 29–38. [Google Scholar] [CrossRef]
- Wang, Y.X.; Wei, W.B.; Xu, L.; Jonas, J.B. Physical Activity and Eye Diseases. The Beijing Eye Study. Acta Ophthalmol. 2019, 97, 325–331. [Google Scholar] [CrossRef]
- Fernandez-Rio, J.; González-Villora, S.; Valero-Valenzuela, A.; Anton-Candanedo, A.; Merino-Barrero, J.A.; de los Ríos, J.V.S.; López Gajardo, M.A. Accelerometry-Measured Physical Activity in Amateur Footballers. Is It Enough to Obtain Health Benefits? Sustainability 2020, 12, 4477. [Google Scholar] [CrossRef]
- Noonan, V.; Dean, E. Submaximal Exercise Testing: Clinical Application and Interpretation. Phys. Ther. 2000, 80, 782–807. [Google Scholar] [CrossRef] [PubMed]
- Dahl, H.A.; Rodahl, K.; Stromme, S.B.; Åstrand, P.-O. Textbook of Work Physiology: Physiological Bases of Exercise; Human Kinetics: Champaign, IL, USA, 2003; ISBN 0736001409. [Google Scholar]
- McArdle, W.D.; Katch, F.I.; Katch, V.L. Fisiologia del Ejercicio; Energia, Nutricion y Rendimiento Humano; Deporte, A., Ed.; Lippincott Williams & Wilkins: Philadelphia, PA, USA, 1990; ISBN 84-206-5704-2. [Google Scholar]
- Astrand, P.; Rodahl, K.; Dahl, H.A.; Stromme, S.B. Manual de Fisiología del Ejercicio; Editorial Médica Panamericana: Madrid, Spain, 2010; ISBN 8499100120. [Google Scholar]
- Karakucuk, Y.; Okudan, N.; Bozkurt, B.; Belviranlı, M.; Sezer, T.; Gorçuyeva, S. Quantitative Assessment of the Effect of Acute Anaerobic Exercise on Macular Perfusion via Swept-Source Optical Coherence Tomography Angiography in Young Football Players. Int. Ophthalmol. 2020, 40, 1377–1386. [Google Scholar] [CrossRef]
- López Chicharro, J.; Fernández Vaquero, A. Fisiología Del Ejercicio, 4th ed.; Panamericana: Madrid, Spain, 2023; ISBN 9788491107491. [Google Scholar]
- Ikemura, T.; Suzuki, K.; Nakamura, N.; Yada, K.; Hayashi, N. Fluid Intake Restores Retinal Blood Flow Early After Exhaustive Exercise in Healthy Subjects. Eur. J. Appl. Physiol. 2018, 118, 1053–1061. [Google Scholar] [CrossRef]
- Li, S.; Pan, Y.; Xu, J.; Li, X.; Spiegel, D.P.; Bao, J.; Chen, H. Effects of Physical Exercise on Macular Vessel Density and Choroidal Thickness in Children. Sci. Rep. 2021, 11, 2015. [Google Scholar] [CrossRef]
- Dervişoğulları, M.S.; Totan, Y.; Kulak, A.E.; Güler, E. Acute Effects of Exercise on Choroidal Thickness and Ocular Pulse Amplitude. Ann. Clin. Anal. Med. 2019, 10, 62–66. [Google Scholar] [CrossRef]
- Alnawaiseh, M.; Lahme, L.; Treder, M.; Rosentreter, A.; Eter, N. Short-Term Effects of Exercise on Optic Nerve and Macular Perfusion Measured by Optical Coherence Tomography Angiography. Retina 2017, 37, 1642–1646. [Google Scholar] [CrossRef] [PubMed]
- Alten, F.; Nelis, P.; Schmitz, B.; Brand, S.M.; Eter, N. Optical Coherence Tomography Angiography as a Future Diagnostic Tool in Sports Medicine? Ophthalmologe 2019, 116, 722–727. [Google Scholar] [CrossRef] [PubMed]
- Kim, S.V.; Semoun, O.; Pedinielli, A.; Jung, C.; Miere, A.; Souied, E.H. Optical Coherence Tomography Angiography Quantitative Assessment of Exercise-Induced Variations in Retinal Vascular Plexa of Healthy Subjects. Investig. Ophthalmol. Vis. Sci. 2019, 60, 1412–1419. [Google Scholar] [CrossRef]
- Lefferts, W.K.; Hughes, W.E.; Heffernan, K.S. Effect of Acute High-Intensity Resistance Exercise on Optic Nerve Sheath Diameter and Ophthalmic Artery Blood Flow Pulsatility. J. Hum. Hypertens. 2015, 29, 744–748. [Google Scholar] [CrossRef]
- Szalai, I.; Csorba, A.; Jing, T.; Horváth, E.; Bosnyák, E.; Györe, I.; Nagy, Z.Z.; DeBuc, D.C.; Tóth, M.; Somfai, G.M. The Assessment of Acute Chorioretinal Changes Due to Intensive Physical Exercise in Senior Elite Athletes. J. Aging Phys. Act. 2022, 31, 497–505. [Google Scholar] [CrossRef] [PubMed]
- Insa-Sánchez, G.; Fuentes-Broto, L.; Cobos, A.; Orduna Hospital, E.; Segura, F.; Sanchez-Cano, A.; Perdices, L.; Pinilla, I. Choroidal Thickness and Volume Modifications Induced by Aerobic Exercise in Healthy Young Adults. Ophthalmic Res. 2021, 64, 604–612. [Google Scholar] [CrossRef]
- Salobrar-Garcia, E.; Méndez-Hernández, C.; de Hoz, R.; Ramírez, A.I.; López-Cuenca, I.; Fernández-Albarral, J.A.; Rojas, P.; Wang, S.; García-Feijoo, J.; Gil, P.; et al. Ocular Vascular Changes in Mild Alzheimer’s Disease Patients: Foveal Avascular Zone, Choroidal Thickness, and ONH Hemoglobin Analysis. J. Pers. Med. 2020, 10, 231. [Google Scholar] [CrossRef]
- López-Cuenca, I.; Salobrar-García, E.; Sánchez-Puebla, L.; Espejel, E.; Del Arco, L.G.; Rojas, P.; Elvira-Hurtado, L.; Fernández-Albarral, J.A.; Ramírez-Toraño, F.; Barabash, A.; et al. Retinal Vascular Study Using OCTA in Subjects at High Genetic Risk of Developing Alzheimer’s Disease and Cardiovascular Risk Factors. J. Clin. Med. 2022, 11, 3248. [Google Scholar] [CrossRef]
- Tian, F.; Li, Y.; Wang, J.; Chen, W. Blood Vessel Segmentation of Fundus Retinal Images Based on Improved Frangi and Mathematical Morphology. Comput. Math. Methods Med. 2021, 2021, 4761517. [Google Scholar] [CrossRef] [PubMed]
- Yang, J.; Huang, M.; Fu, J.; Lou, C.; Feng, C. Frangi Based Multi-Scale Level Sets for Retinal Vascular Segmentation. Comput. Methods Programs Biomed. 2020, 197, 105752. [Google Scholar] [CrossRef] [PubMed]
- Mauget-Faÿsse, M.; Arej, N.; Paternoster, M.; Zuber, K.; Derrien, S.; Thevenin, S.; Alonso, A.S.; Salviat, F.; Lafolie, J.; Vasseur, V. Retinal and Choroidal Blood Flow Variations after an Endurance Exercise: A Real-Life Pilot Study at the Paris Marathon. J. Sci. Med. Sport. 2021, 24, 1100–1104. [Google Scholar] [CrossRef]
- Liang, X.; Yan, Y.; Wu, X.; Li, S.; Hu, A. OCTA Quantitative Assessment of Exercise-Induced Variations and Recovery in Retinal Microvasculature of Healthy Subjects with or without Masks. Microvasc. Res. 2024, 155, 104719. [Google Scholar] [CrossRef]
- Hua, D.; Xu, Y.; Heiduschka, P.; Zhang, W.; Zhang, X.; Zeng, X.; Zhu, X.; He, T.; Zheng, H.; Xiao, X.; et al. Retina Vascular Perfusion Dynamics During Exercise With and Without Face Masks in Healthy Young Adults: An OCT Angiography Study. Transl. Vis. Sci. Technol. 2021, 10, 23. [Google Scholar] [CrossRef]
- Sayin, N.; Kara, N.; Pekel, G.; Altinkaynak, H. Choroidal Thickness Changes after Dynamic Exercise as Measured by Spectral-Domain Optical Coherence Tomography. Indian J. Ophthalmol. 2015, 63, 445–450. [Google Scholar] [CrossRef]
- Alwassia, A.; Adhi, M.; Zhang, J.; Regatieri, C.V.; Al-Quthami, A.; Salem, D.; Fujimoto, J.; Duker, J.S. Exercise-Induced Acute Changes in Systolic Blood Pressure Do Not Alter Choroidal Thickness as Measured by a Portable Spectral-Domain Optical Coherence Tomography Device. Retina 2013, 33, 160–165. [Google Scholar] [CrossRef]
- Taibbi, G.; Cromwell, R.L.; Zanello, S.B.; Yarbough, P.O.; Ploutz-Snyder, R.J.; Godley, B.F.; Vizzeri, G. Ophthalmological Evaluation of Integrated Resistance and Aerobic Training During 70-Day Bed Rest. Aerosp. Med. Hum. Perform. 2017, 88, 633–640. [Google Scholar] [CrossRef]
- Luksch, A.; Polska, E.; Imhof, A.; Schering, J.; Fuchsjäger-Mayrl, G.; Wolzt, M.; Schmetterer, L. Role of NO in Choroidal Blood Flow Regulation during Isometric Exercise in Healthy Humans. Invest. Ophthalmol. Vis. Sci. 2003, 44, 734–739. [Google Scholar] [CrossRef] [PubMed]
- Okuno, T.; Sugiyama, T.; Kohyama, M.; Kojima, S.; Oku, H.; Ikeda, T. Ocular Blood Flow Changes after Dynamic Exercise in Humans. Eye 2006, 20, 796–800. [Google Scholar] [CrossRef]
- Balducci, S.; Sacchetti, M.; Haxhi, J.; Orlando, G.; D’Errico, V.; Fallucca, S.; Menini, S.; Pugliese, G. Physical Exercise as Therapy for Type 2 Diabetes Mellitus. Diabetes Metab. Res. Rev. 2014, 30 (Suppl. S1), 13–23. [Google Scholar] [CrossRef]
- Maessen, M.F.H.; Verbeek, A.L.M.; Bakker, E.A.; Thompson, P.D.; Hopman, M.T.E.; Eijsvogels, T.M.H. Lifelong Exercise Patterns and Cardiovascular Health. Mayo Clin. Proc. 2016, 91, 745–754. [Google Scholar] [CrossRef] [PubMed]
- Zhang, H.; Tong, T.K.; Qiu, W.; Zhang, X.; Zhou, S.; Liu, Y.; He, Y. Comparable Effects of High-Intensity Interval Training and Prolonged Continuous Exercise Training on Abdominal Visceral Fat Reduction in Obese Young Women. J. Diabetes Res. 2017, 2017, 5071740. [Google Scholar] [CrossRef]
- Guthold, R.; Stevens, G.A.; Riley, L.M.; Bull, F.C. Worldwide Trends in Insufficient Physical Activity from 2001 to 2016: A Pooled Analysis of 358 Population-Based Surveys with 1·9 Million Participants. Lancet Glob Health 2018, 6, e1077–e1086. [Google Scholar] [CrossRef]
- Nelis, P.; Schmitz, B.; Klose, A.; Rolfes, F.; Alnawaiseh, M.; Krüger, M.; Eter, N.; Brand, S.M.; Alten, F. Correlation Analysis of Physical Fitness and Retinal Microvasculature by OCT Angiography in Healthy Adults. PLoS ONE 2019, 14, e0225769. [Google Scholar] [CrossRef]
- Karaküçük, Y.; Okudan, N.; Bozkurt, B.; Belviranli, M.; Tobakçal, F. Evaluation of the Effect of High-Intensity Interval Training on Macular Microcirculation via Swept-Source Optical Coherence Tomography Angiography in Young Football Players. Indian J. Ophthalmol. 2021, 69, 2334–2339. [Google Scholar] [CrossRef]
- Schmitz, B.; Nelis, P.; Rolfes, F.; Alnawaiseh, M.; Klose, A.; Krüger, M.; Eter, N.; Brand, S.M.; Alten, F. Effects of High-Intensity Interval Training on Optic Nerve Head and Macular Perfusion Using Optical Coherence Tomography Angiography in Healthy Adults. Atherosclerosis 2018, 274, 8–15. [Google Scholar] [CrossRef]
- Berry, E.C.; Marshall, H.N.; Mullany, S.; Torres, S.D.; Schmidt, J.; Thomson, D.; Knight, L.S.W.; Hollitt, G.L.; Qassim, A.; Ridge, B.; et al. Physical Activity Is Associated With Macular Thickness: A Multi-Cohort Observational Study. Investig. Ophthalmol. Vis. Sci. 2023, 64, 11. [Google Scholar] [CrossRef]
- Lee, S.S.Y.; McVeigh, J.; Straker, L.; Howie, E.K.; Yazar, S.; Haynes, A.; Green, D.J.; Hewitt, A.W.; Mackey, D.A. Physical Activity and Cardiovascular Fitness During Childhood and Adolescence: Association With Retinal Nerve Fibre Layer Thickness in Young Adulthood. J. Glaucoma 2021, 30, 813–819. [Google Scholar] [CrossRef] [PubMed]
- Tun, Y.Z.; Aimmanee, P. A Complete Review of Automatic Detection, Segmentation, and Quantification of Neovascularization in Optical Coherence Tomography Angiography Images. Diagnostics 2023, 13, 3407. [Google Scholar] [CrossRef] [PubMed]
- Bek, T.; Jeppesen, S.K. Reduced Oxygen Extraction in the Retinal Periphery When the Arterial Blood Pressure Is Increased by Isometric Exercise in Normal Persons. Investig. Ophthalmol. Vis. Sci. 2021, 62, 11. [Google Scholar] [CrossRef]
- Jeppesen, P.; Sanye-Hajari, J.; Bek, T. Increased Blood Pressure Induces a Diameter Response of Retinal Arterioles That Increases with Decreasing Arteriolar Diameter. Investig. Ophthalmol. Vis. Sci. 2007, 48, 328–331. [Google Scholar] [CrossRef]
- Skov Jensen, P.; Aalkjaer, C.; Bek, T. Differential Effects of Nitric Oxide and Cyclo-Oxygenase Inhibition on the Diameter of Porcine Retinal Vessels with Different Caliber during Hypoxia Ex Vivo. Exp. Eye Res. 2017, 160, 38–44. [Google Scholar] [CrossRef]
- Wolfensberger, T.J.; Holz, F.G.; Ationu, A.; Carter, N.D.; Bird, A.C. Natriuretic Peptides and Their Receptors in Human Neural Retina and Retinal Pigment Epithelium. Ger. J. Ophthalmol. 1994, 3, 248–252. [Google Scholar] [PubMed]
- García de Lacoba, M.; Fernández-Durango, R.; Triviño, A.; Ramírez, J.M.; Ramírez, A.I.; Salazar, J.J.; Fernández-Cruz, A.; Gutkowska, J. Existence of Atrial Natriuretic Peptide in Choroid, Retina and Ciliary Body in Rabbits. Rev. Esp. Fisiol. 1991, 47, 91–96. [Google Scholar] [PubMed]
- Palm, D.E.; Keil, L.C.; Sassani, J.W.; Severs, W.B. Immunoreactive Atrial Natriuretic Peptide in the Retina of Rats and Rabbits. Brain Res. 1989, 504, 142–144. [Google Scholar] [CrossRef]
- Rollin, R.; Madeiro, A.; Roldán-Pallarés, M.; Fernández-Cruz, A.; Fernández-Durango, R. Natriuretic Peptide System in the Human Retina. Mol. Vis. 2004, 10, 15–22. [Google Scholar] [PubMed]
- Menna, F.; De Luca, L.; Lupo, S.; Meduri, A.; Vingolo, E.M. Variations in Intraocular Pressure Among Athletes Across Different Sports Disciplines. J. Clin. Med. 2025, 14, 3211. [Google Scholar] [CrossRef]
- Salazar, J.J.; Ramírez, A.I.; De Hoz, R.; Salobrar-Garcia, E.; Rojas, P.; Fernández-Albarral, J.A.; López-Cuenca, I.; Rojas, B.; Triviño, A.; Ramírez, J.M. Anatomy of the Human Optic Nerve: Structure and Function. Opt. Nerve 2018, 203, 22–30. [Google Scholar]
- Lauermann, J.L.; Eter, N.; Alten, F. Optical Coherence Tomography Angiography Offers New Insights into Choriocapillaris Perfusion. Ophthalmologica 2018, 239, 74–84. [Google Scholar] [CrossRef]
- Poukens, V.; Glasgow, B.; Demer, J.L. Nonvascular Contractile Cells in Sclera and Choroid of Humans and Monkeys. Investig. Ophthalmol. Vis. Sci. 1998, 39, 1765–1774. [Google Scholar]
- Hirata, M.; Tsujikawa, A.; Matsumoto, A.; Hangai, M.; Ooto, S.; Yamashiro, K.; Akiba, M.; Yoshimura, N. Macular Choroidal Thickness and Volume in Normal Subjects Measured by Swept-Source Optical Coherence Tomography. Investig. Ophthalmol. Vis. Sci. 2011, 52, 4971–4978. [Google Scholar] [CrossRef] [PubMed]
- Sanchez-Cano, A.; Orduna, E.; Segura, F.; Lopez, C.; Cuenca, N.; Abecia, E.; Pinilla, I. Choroidal Thickness and Volume in Healthy Young White Adults and the Relationships between Them and Axial Length, Ammetropy and Sex. Am. J. Ophthalmol. 2014, 158, 574–583.e1. [Google Scholar] [CrossRef] [PubMed]
- Ikuno, Y.; Kawaguchi, K.; Nouchi, T.; Yasuno, Y. Choroidal Thickness in Healthy Japanese Subjects. Investig. Ophthalmol. Vis. Sci. 2010, 51, 2173–2176. [Google Scholar] [CrossRef]
- Kinoshita, T.; Mori, J.; Okuda, N.; Imaizumi, H.; Iwasaki, M.; Shimizu, M.; Miyamoto, H.; Akaiwa, K.; Semba, K.; Sonoda, S.; et al. Effects of Exercise on the Structure and Circulation of Choroid in Normal Eyes. PLoS ONE 2016, 11, e0168336. [Google Scholar] [CrossRef]
- Lacolley, P.; Regnault, V.; Segers, P.; Laurent, S. Vascular Smooth Muscle Cells and Arterial Stiffening: Relevance in Development, Aging, and Disease. Physiol. Rev. 2017, 97, 1555–1617. [Google Scholar] [CrossRef]
- Triviño, A.; de Hoz, R.; Rojas, B.; Salazar, J.J.; Ramirez, A.I.; Ramirez, J.M. NPY and TH Innervation in Human Choroidal Whole-Mounts. Histol. Histopathol. 2005, 20, 393–402. [Google Scholar] [CrossRef]
- Jablonski, M.M.; Iannaccone, A.; Reynolds, D.H.; Gallaher, P.; Allen, S.; Wang, X.F.; Reiner, A. Age-Related Decline in VIP-Positive Parasympathetic Nerve Fibers in the Human Submacular Choroid. Investig. Ophthalmol. Vis. Sci. 2007, 48, 479–485. [Google Scholar] [CrossRef]
- Christensen, N.J.; Galbo, H. Sympathetic Nervous Activity during Exercise. Annu. Rev. Physiol. 1983, 45, 139–153. [Google Scholar] [CrossRef]
- Kur, J.; Newman, E.A.; Chan-Ling, T. Cellular and Physiological Mechanisms Underlying Blood Flow Regulation in the Retina and Choroid in Health and Disease. Prog. Retin. Eye Res. 2012, 31, 377–406. [Google Scholar] [CrossRef]
- MacDonald, J.R. Potential Causes, Mechanisms, and Implications of Post Exercise Hypotension. J. Hum. Hypertens. 2002, 16, 225–236. [Google Scholar] [CrossRef] [PubMed]
- Jones, H.; Atkinson, G.; Leary, A.; George, K.; Murphy, M.; Waterhouse, J. Reactivity of Ambulatory Blood Pressure to Physical Activity Varies with Time of Day. Hypertension 2006, 47, 778–784. [Google Scholar] [CrossRef] [PubMed]
- Pressler, A.; Hanssen, H.; Dimitrova, M.; Krumm, M.; Halle, M.; Scherr, J. Acute and Chronic Effects of Marathon Running on the Retinal Microcirculation. Atherosclerosis 2011, 219, 864–868. [Google Scholar] [CrossRef] [PubMed]
Disclaimer/Publisher’s Note: The statements, opinions and data contained in all publications are solely those of the individual author(s) and contributor(s) and not of MDPI and/or the editor(s). MDPI and/or the editor(s) disclaim responsibility for any injury to people or property resulting from any ideas, methods, instructions or products referred to in the content. |
© 2025 by the authors. Licensee MDPI, Basel, Switzerland. This article is an open access article distributed under the terms and conditions of the Creative Commons Attribution (CC BY) license (https://creativecommons.org/licenses/by/4.0/).