Article

The Effects of Changing the Support Point in a Given Cross Section on Structural Stability

Faculty of Civil Engineering, Wrocław University of Science and Technology, 50-370 Wrocław, Poland
*
Author to whom correspondence should be addressed.
Appl. Sci. 2025, 15(19), 10774; https://doi.org/10.3390/app151910774
Submission received: 2 September 2025 / Revised: 30 September 2025 / Accepted: 4 October 2025 / Published: 7 October 2025
(This article belongs to the Section Civil Engineering)

Abstract

The aim of this study was to examine the effect of a change of the beam support point within the same support cross section and that of a change in the location of load application points on critical load values. In the literature on the stability of structures, the problem of a change of a rod system’s support point (within the same cross section) is neglected. Solely the effect of a change in load application points on the critical load value is considered. In this study, displacement differential equations describing the general stability loss problem for any nonprismatic thin-walled beam were derived. To solve the equations an approximation method (described in earlier papers by the authors), using the Chebyshev series of the first kind to approximate the sought functions, was employed. In the provided numerical examples the buckling problem was solved for nonprismatic I-beams with a bisymmetric cross section and a monosymmetric cross section. The determined critical load values were compared with the results obtained using the finite element method and the commercial Sofistik software. The results obtained in this study show the significant effect of beam support point location (within the same cross section), as well as the effect of load application point location, on critical load values.

1. Introduction

As evidenced by the extensive literature devoted to the analysis of rod structures, particularly the analysis of the vibrations and stability of the thin-walled nonprismatic elements of rod structures, this subject has been investigated by numerous researchers. Nguyen et al. in study [1] used the Ritz method to analyse the free vibrations and buckling of thin-walled composite nonprismatic I-beams. The equations of motion were derived from the Lagrange equations. The free vibration frequencies and the critical load values resulting in the buckling of the beams were determined. Andrade and Camotim in [2] used equations formulated according to the Camote Treffitz criterion, making it possible to analyse the lateral torsional buckling (LTB) of thin-walled monosymmetric I-beams with a tapered web. The Rayleigh–Ritz method was used to solve the derived differential equations.
A similar problem, i.e., the LTB of beams with a tapered web, was considered in [3] by Beyamina et al., who used the Ritz method to solve the nonlinear equilibrium equations derived by them. Andrade et al. in [4] presented a one-dimensional model for analysing the lateral torsional buckling of pre-deflected nonprismatic thin-walled beams with a monosymmetric open cross section. The authors analysed simply supported and cantilever I-beams with linearly tapered webs. Asgarian et al. in [5] presented a thin-walled nonprismatic beam model and used it to analyse the LTB stability of thin-walled nonprismatic beams with any cross sections. The equations of motion were derived using Hamilton’s principle. The derived differential equations with variable coefficients were solved using the power series method for various beam support configurations. Branford in [6] used the finite element method to analyse the LTB of monosymmetric nonprismatic I-beams loaded with any load under arbitrary support conditions. Challamel et al. in [7] analysed the lateral torsional buckling of linearly tapered cantilever beams. An analytical solution of the LTB problem, in the form of hypergeometric functions, was derived for cantilevers with linearly variable depth. Gupta et al. in [8] used the finite element method to analyse the lateral torsional buckling of thin-walled nonprismatic I-beams. The adopted model took into account the effect of the location of rod loads at different points of the cross section. The presented parametric analyses were carried out for single- and double-span continuous beams. Kitipornchai and Trahair in [9,10] derived, taking into consideration the Vlasov theory assumptions, differential equations describing the flexural–torsional instability problem for nonprismatic I-beams. The equations were used to analyse the lateral torsional buckling of simply supported nonprismatic I-beams with tapered flanges or with a tapered web. Kuś in [11,12,13] presented a method of determining the critical moment for a thin-walled nonprismatic steel beam with a linearly variable cross section. He used the Rayleigh–Ritz method to determine the critical load. The computations were performed using the Mathematica program. The above-mentioned papers contain many numerical examples for various load diagrams. In paper [14], Mohri et al. analysed the global stability of thin-walled open-cross section prismatic rods unstiffened along their length. As part of the cited paper, a thin-walled prismatic rod model was developed and then used to analyse the warping stability of a beam. Using the proposed model, the Ritz method and the Galerkin method, the authors of the above paper recalculated the coefficients used in Eurocode 3 for simply supported beams and showed that two of the coefficients obtained in this way were close to the ones calculated according to Eurocode 3, whereas the third coefficient (proposed by Wagner) calculated using the Galerkin method significantly diverged from the results based on Eurocode 3. Osmani and Meftah in [15] examined the impact of shear strains on the buckling of thin-walled nonprismatic beams with a bisymmetric cross section. Beams with open and closed cross sections, loaded with a combination of forces causing bending and axial strains, were analysed. In the analyses, the authors of the above study used nonlinear beam theory, which takes geometric nonlinearity into account. The Ritz method was used to solve the equilibrium equations. Polyzois and Raftoyiannis in [16] analysed the loss of stability for beams with nonprismatic webs subjected to bending loads. According to the AISC (American Institute of Steel Construction) specifications, a linearly tapered element is considered as a prismatic element with a modified length. Modification factors are used to determine the modified length. On the basis of the obtained results, the authors proposed appropriate revisions of the design guidelines for steel beams with linearly tapered cross sections. Raftoyiannis and Adamakos as part of study [17] developed a numerical procedure for determining the critical load causing the LTB of I-beams with nonprismatic webs. Factors modifying the elastic critical moment for an average cross section were given for different taper coefficients. In paper [18], Rezaiee-Pajand et al. investigated the LTB of a thin-walled nonprismatic beam based on variable material parameters in both longitudinal and transverse directions. The beam’s cross section was assumed to be a symmetric double-tee cross section with linearly variable web depth. The presented solution was obtained for cases in which changes in the elastic modulus and in the G-modulus were described by power functions. The sought lateral displacement and torsion angle of the beam were approximated with sine trigonometric functions. In study [19], Soltani presented a method of analysing the LTB of symmetric composite beams with a nonprismatic double-tee cross section. In this method, the classic composite beam theory and Vlasov’s model are used to determine the total potential energy and to define a variational formula for torsional angle. The problem was solved using the Ritz method. Soltani and Asgarian in [20,21] used the finite element method and the differential quadrature method to analyse the LTB of nonprismatic bisymmetric I-beams with variable material parameters along the beam’s length. The analyses were carried out for beams with various support conditions. Equilibrium equations were derived using energy methods with Vlasov’s assumptions taken into account. Also, Soltani et al. in [22] analysed the LTB of a pin supported nonprismatic I-beams with variable material parameters along the longitudinal axis of the beam. The analysis was performed using the finite element method. The beam’s material properties were assumed to change along its longitudinal axis. The analysis was carried out using the finite element method. The beam’s material properties were assumed to change continuously along the longitudinal axis. The derived differential equations were solved using the power series method. In study [23], Soltani et al. applied the finite difference method to solve the LTB problem for nonprismatic thin-walled beams with any boundary conditions. Zhang and Tong in [24] analysed the LTB of I-beams with a nonprismatic web. Using Vlasov’s assumptions, they analysed the derived equations describing the considered types of beams. It was shown that the finite element method using equivalent prismatic beam elements can yield results significantly differing from the results obtained using other methods. Giżejowski in [25] investigated the spatial loss of stability in the girts of steel frame structures, and also in floor beams resting on girders characterized by limited ability to rotate on the supports. The effect of the stiffness of the face plates and the support ribs, and that of the cutouts in their joints with the girders in steel floors were analysed. Kim and Kim in [26] proposed a method of analysing the free vibrations and spatial stability of thin-walled tapered beams and space frames, based on the finite element method. Inertia matrices, elastic stiffness matrices and geometric stiffness matrices were determined for a rod with an asymmetric thin-walled cross section. Cubic polynomials were adopted as shape functions for a two-node element. The results were compared with those reported by other authors. Nguyen et al. in [27,28] analysed the flexural, torsional and flexural–torsional buckling of composite thin-walled beams with open cross sections and with various types of material parameter variation across wall thickness. In [27], the authors analysed axially loaded beams, while in [28] beams transversely loaded were analysed for different distributions of material parameters. The stability loss problem was solved using a two-node finite beam element with 14 degrees of freedom. Using the proposed method, they determined the critical load for thin-walled monosymmetric I-beams and C-beams with an arbitrary material properties distribution across wall thickness. Using the variational approach, Pasquino and Marotti de Sciarra in [29] derived displacement Euler–Lagrange equations describing the stability loss problem. Soltani et al. in [30,31] examined the lateral torsional buckling of thin-walled beams and the flexural–torsional buckling of nonprismatic thin-walled beam-columns with a double-tee cross section, taking into account the nonlocal elastic model. The material properties of the analysed rods varied continuously along the rod’s longitudinal axis. Flexural–torsional equations describing the stability loss problem were derived on the basis of Eringen’s nonlocal elasticity theory and the energy method, taking into account Vlasov’s thin-walled beam theory assumptions. The buckling loads were determined using the differential quadrature method (DQM). In the above papers, this method was used as a numerical tool for the direct solution of differential equations. Yang and Yau in [32] derived differential equilibrium equations for a nonprismatic I-beam and defined a finite beam element taking into account the effect of warping torsion. In the expressions for virtual work, the effects of geometric nonlinearity were taken into account. Strains were determined on the basis of the membrane theory of shells. The displacements of each cross section were determined using the Vlasov’s theory assumptions. The derived linear and geometric stiffness matrices are applicable in buckling analyses and can be useful in an incremental analysis of large displacements. In [33], Latalski and Zulli extended Generalized Beam Theory (GBT) to cover the case of thin-walled beams with curvilinear cross sections. The authors consistently took the curvature of a thin-walled beam’s cross section and the deformation of the latter in its plane into account in the description of the beam’s kinematic characteristics. The considerations applied to beams with a constant cross section along the beam length. Iandiorio and Salvini in [34] presented a geometrically nonlinear shell theory and then applied it to describe thin-walled tubular shells with open and closed cross sections, respectively. Thanks to this way of describing the problem, the influence of nonlinear effects due to large displacements and high rotations could be taken into account. By taking into account the cross section’s in-plane and out-of-plane deformations, the model described in [34] combines the traditionally separate beam theory and shell theory, whereby it becomes possible to analyse intermediate structural behaviours.
The subject of the present study is the instability of nonprismatic thin-walled beams with an open cross section. The study’s main aim, constituting its original contribution, was to carry out an analysis of the effect of a change of support points (within the same support cross section) on the critical load value and also to analyse the effect of a change in the location of external load application points on this load value for various locations of beam support points. In the literature devoted to the stability of structures, the problem of a change of a rod system’s support points within the same cross section is neglected. Solely the effect of a change of load application points on the critical load value for centroids or shear centres adopted (by default) as the support points is considered. In the general case for a nonprismatic rod, the axes defined by the centroids and shear centres of the rod’s cross sections are curvilinear axes, despite the “rectilinear” character of the rod in a typical engineering context. In order to preserve this “rectilinearity” in the description of the thin-walled nonprismatic rod, displacement equations were derived relative to an additional, arbitrary longitudinal, rectilinear reference axis and the accompanying other cartesian coordinate system axes relative to which the thin-walled rod’s parameters and its cross section geometric characteristics were determined.
Displacement differential equations describing the general stability loss problem for any thin-walled rod under any loading case and load were derived using the minimum elastic energy principle. Also, a method of determining the critical load, using an approximation of the displacement functions by means of the Chebyshev series of the first kind and a recurrence algorithm described in the author(s) earlier papers [35,36,37,38,39,40], is presented.
In the provided numerical examples, the stability loss problem was solved for nonprismatic I-beams with bisymmetric and monosymmetric cross sections.
Three static beam schemes were analysed: pinned-pinned, clamped-clamped, and clamped-free. The determined critical load values were compared with the results obtained using the finite element method and the commercial Sofistik software version 2025.

2. Mathematical Description of Rod Model

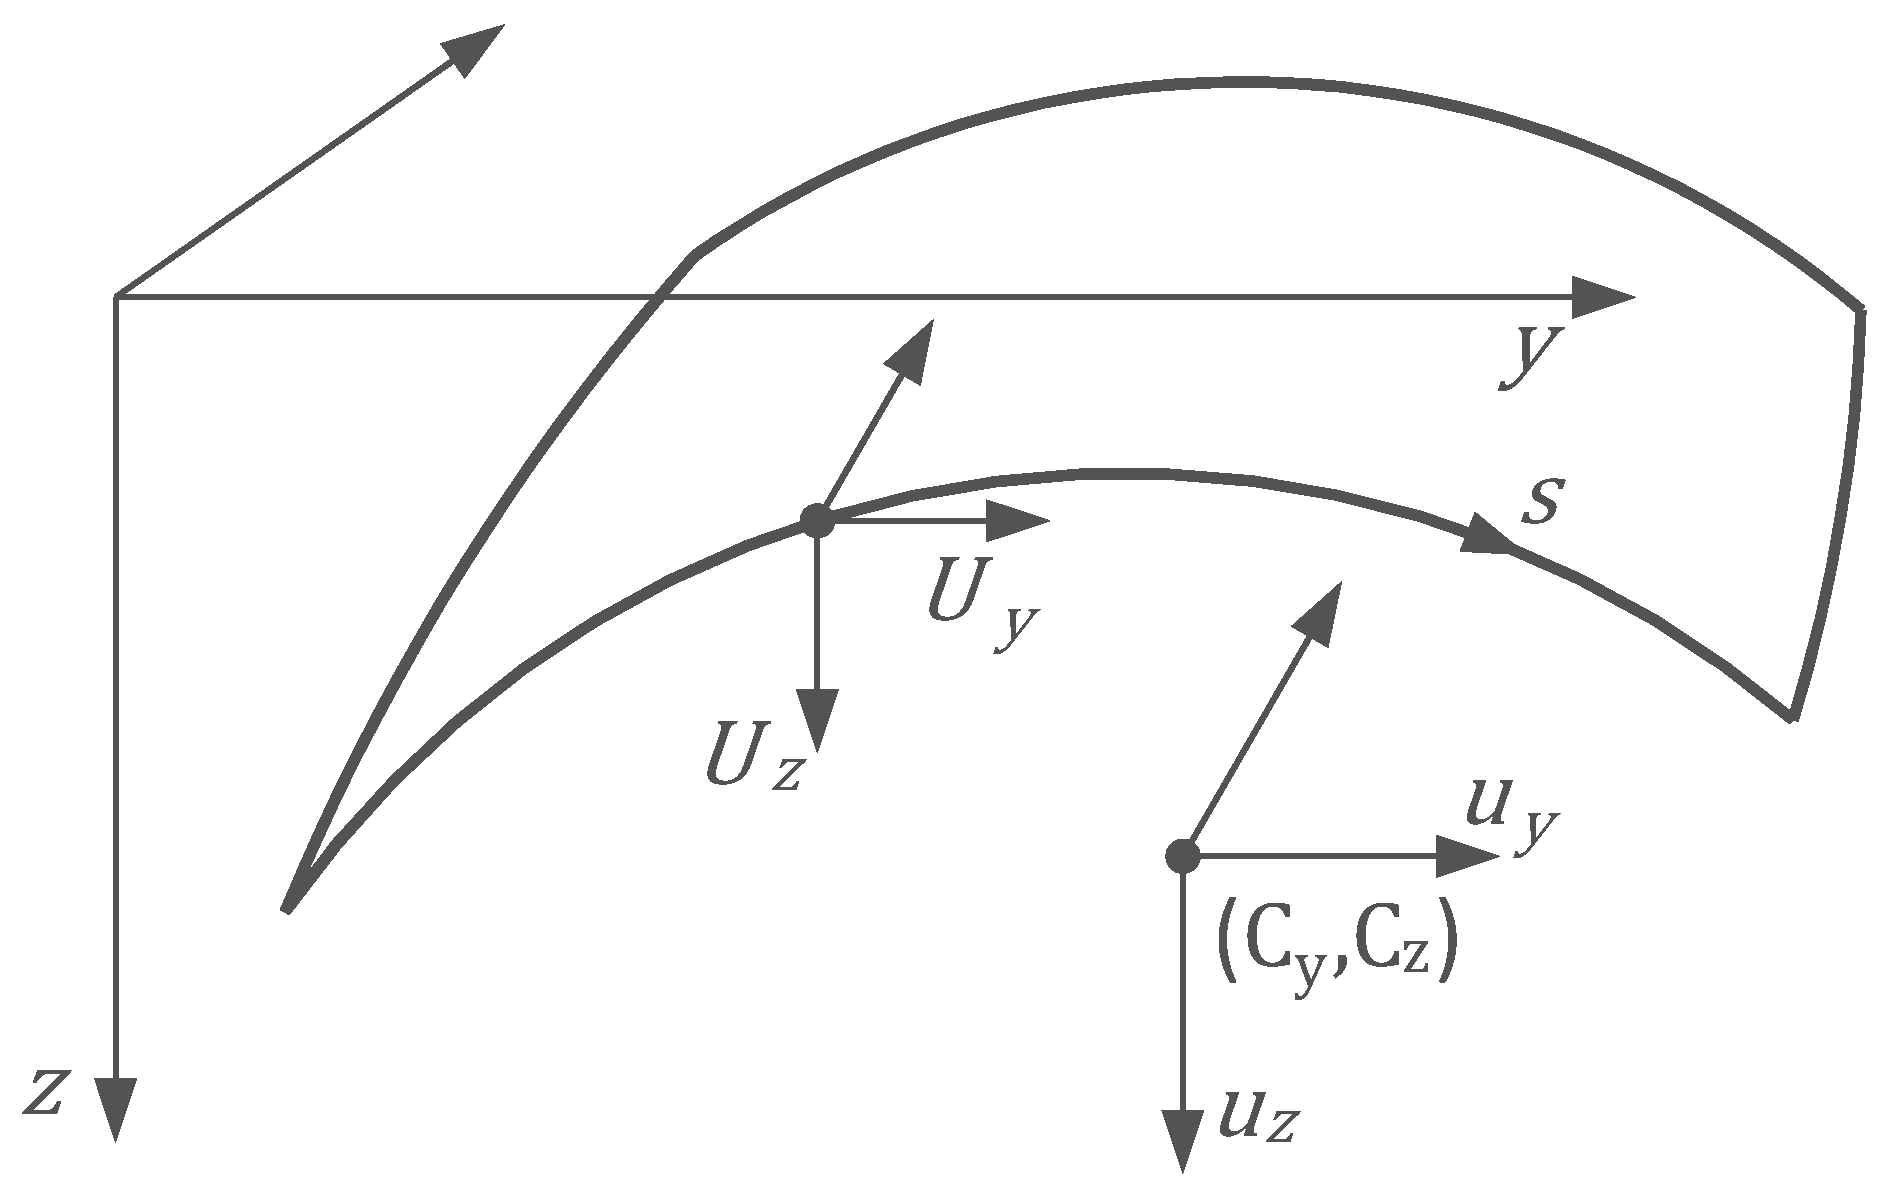
A model presented in the authors’ previous papers [38,40] was used in this study to describe a thin-wall beam with an open cross section. The model was obtained by generalizing Wilde’s model [41], incorporating additional components containing derivatives of functions describing the changeable locations of shear centres into its mathematical description. Wilde’s model [41] was derived on the basis of the momentless theory of shells, using Vlasov’s assumptions. As the detailed derivation of the equations describing the considered model can be found in the authors’ paper [38], only the most important of the equations are quoted here. Figure 1 shows the coordinate systems used in the description of the considered model.
Under the adopted assumptions, the displacement of any point of the thin-walled rod is given by the following formula:
u = U x e x + U y e y + U z e z = u x x , s e x + u y x z x , s C z x θ x e y + u z x + y x , s C y x θ x   e z
where θ x is the angle of rotation relative to the axis defined by the points with coordinates C y x , C z x specifying the shear centre; u y x , u z x are the cross section displacement components in the shear centre, measured along the axis of the global coordinate system; and u x x , s is a measure of cross section displacement along axis x, which takes into account warpings relative to plane x = c o n s t (Figure 2).
As shown in [38,41], the use of Vlasov’s assumptions ( γ t , s = 0 ) leads to the following formula for displacements u x :
u x = u o x y u y , x z u z , x y C z , x z C y , x θ ω θ , x ,
where u o x = u o x x is an integration constant independent of s, and ω = ω x , s is a sectorial coordinate described by the following relation:
ω x , s = z C z y , s + y C y z , s d s .
The linear components of the strain tensor are defined as follows:
γ α β = 1 2 a α u , β + a β u , α
Using this definition, the linear component of strain γ x x was determined as follows:
γ x x = u o x , x y u y , x x z u z , x x ω θ , x x ψ θ , x δ θ ,
where
ψ = ω , x + y , x z C z z , x y C y + y C z , x z C y , x , δ = y C z , x x z C y , x x .
The definitions of the nonlinear components of the strain tensor are given by the formulas
γ x x n l = 1 2 u , x u , x , γ x s n l = 1 2 u , x u , s
After substituting function u ( x , s ) defined by Formula (2) into definition (7)1, calculating appropriate derivatives and performing laborious transformations (which for reasons of space, will not be presented), ultimately the following was obtained:
γ x x n l = 1 2 α x , 1 x , 1 u o x , x 2 + α y , 1 y , 1 u y , x 2 + α y , 2 y , 2 u y , x x 2 + α z , 1 z , 1 u z , x 2 + α z , 2 z , 2 u z , x x 2 + α θ θ θ 2 + α θ , 1 θ , 1 θ , x 2 + α θ , 2 θ , 2 θ , x x 2 + α x , 1 y , 1 u o x , x u y , x + α x , 1 y , 2 u o x , x u y , x x + α x , 1 z , 1 u o x , x u z , x + α x , 1 z , 2 u o x , x u z , x x + α x , 1 θ u o x , x θ + α x , 1 θ , 1 u o x , x θ , x + α x , 1 θ , 2 u o x , x θ , x x + α y , 1 z , 1 u y , x u z , x + α y , 2 z , 2 u y , x x u z , x x + α y , 1 y , 2 u y , x u y , x x + α y , 1 z , 2 u y , x u z , x x + α z , 1 y , 2 u z , x u y , x x + α z , 1 z , 2 u z , x u z , x x + α y , 1 θ u y , x θ + α y , 1 θ , 1 u y , x θ , x + α y , 1 θ , 2 u y , x θ , x x + α y , 2 θ u y , x x θ + α y , 2 θ , 1 u y , x x θ , x + α y , 2 θ , 2 u y , x x θ , x x + α z , 1 θ u z , x θ + α z , 1 θ , 1 u z , x θ , x + α z , 1 θ , 2 u z , x θ , x x + α z , 2 θ u z , x x θ + α z , 2 θ , 1 u z , x x θ , x + α z , 2 θ , 2 u z , x x θ , x x + α θ θ , 1 θ θ , x + α θ θ , 2 θ θ , x x + α θ , 1 θ , 2 θ , x θ , x x
where the coefficients α p , i q , , j are defined by the following formulas:
α x , 1 x , 1 = 1 α y , 1 y , 1 = 1 + y , x 2 α z , 1 z , 1 = 1 + z , x 2 α y , 2 y , 2 = y 2 α z , 2 z , 2 = z 2 α θ θ = κ 2 + η y 2 + η z 2 α θ , 1 θ , 1 = μ 2 + ϑ y 2 + ϑ z 2 α θ , 2 θ , 2 = ω 2 α x , 1 y , 1 = y , x α x , 1 y , 2 = y α x , 1 z , 1 = z , x α x , 1 z , 2 = z α x , 1 θ = κ α x , 1 θ , 1 = μ α x , 1 θ , 2 = ω α y , 1 z , 1 = y , x z , x α y , 1 z , 2 = y , x z α z , 1 y , 2 = y z , x α y , 2 z , 2 = y z α y , 1 y , 2 = y y , x α z , 1 z , 2 = z z , x α y , 1 θ , 2 = y , x ω α z , 1 θ , 2 = z , x ω α y , 1 θ = y , x κ + η y α z , 1 θ = z , x   κ + η z α y , 1 θ , 1 = y , x   μ + ϑ y α z , 1 θ , 1 = z , x   μ + ϑ z α y , 2 θ = y κ α z , 2 θ = z κ α y , 2 θ , 1 = y μ α z , 2 θ , 1 = z μ α y , 2 θ , 2 = y ω α z , 2 θ , 2 = z ω α θ θ , 1 = κ μ + η y ϑ y + η z ϑ z α θ θ , 2 = κ ω α θ , 1 θ , 2 = μ ω
κ = y , x C z , x + y C z , x x z , x C y , x z C y , x x , μ = ω , x + y C z , x z C y , x , η y = z , x C z , x , η z = y , x C y , x , ϑ y = z C z , ϑ z = y C y .
The notations of the above coefficients followed the convention: coefficient α p , i q , j , is a multiplier of product x i u p x j u q , in which u r = u o x , u y , u z , θ . Using Formula (7)2 we get the following:
γ x s n l = 1 2 ζ y , 1 y , 1 u y , x 2 + ζ z , 1 z , 1 u z , x 2 u z , x 2 + ζ θ θ θ 2 + ζ θ , 1 θ , 1 θ , x 2 + ζ x , 1 y , 1 u o x , x u y , x + ζ x , 1 z , 1 u o x , x u z , x + ζ x , 1 θ u o x , x θ + ζ x , 1 θ , 1 u o x , x θ , x + ζ y , 1 y , 2 u y , x u y , x x + ζ y , 1 z , 2 u y , x u z , x x + ζ y , 1 z , 1 u y , x u z , x + ζ y , 2 z , 1 u y , x x u z , x + ζ z , 1 z , 2 u z , x u z , x x + ζ y , 1 θ , u y , x θ + ζ y , 1 θ , 1 u y , x θ , x + ζ y , 1 θ , 2 u y , x θ , x x + ζ y , 2 θ u y , x x θ + ζ y , 2 θ , 1 u y , x x θ , x + ζ z , 1 θ u z , x θ + ζ z , 1 θ , 1 u z , x θ , x + ζ z , 1 θ , 2 u z , x θ , x x + ζ z , 2 θ u z , x x θ + ζ z , 2 θ , 1 u z , x x θ , x + ζ θ θ , 1 θ θ , x + ζ θ θ , 2 θ θ , x x + ζ θ , 1 θ , 2 θ , x θ , x x
where
ζ y , 1 y , 1 = y , x y , s ζ z , 1 z , 1 = z , x z , s ζ θ θ = κ χ + η z y , s η y z , s ζ θ , 1 θ , 1 = μ ω , s ζ x , 1 y , 1 = 1 2 y , s ζ x , 1 z , 1 = 1 2 z , s ζ x , 1 θ = 1 2 χ ζ x , 1 θ , 1 = 1 2 ω , s ζ y , 1 y , 2 = 1 2 y y , s ζ z , 2 y , 1 = 1 2 z y , s ζ y , 1 z , 1 = 1 2 y , x z , s + z , x y , s ζ y , 2 z , 1 = 1 2 y z , s ζ z , 1 z , 2 = 1 2 z z , s ζ y , 1 θ = 1 2 y , x χ + κ y , s z , s ζ z , 1 θ = 1 2 z , x χ + κ z , s + y , s ζ y , 1 θ , 1 = 1 2 y , x ω , s + μ y , s ζ z , 1 θ , 1 = 1 2 z , x ω , s + μ z , s ζ y , 1 θ , 2 = 1 2 ω y , s ζ z , 1 θ , 2 = 1 2 ω z , s ζ y , 2 θ = 1 2 y χ ζ z , 2 θ = 1 2 z χ ζ y , 2 θ , 1 = 1 2 y ω , s ζ z , 2 θ , 1 = 1 2 z ω , s ζ θ θ , 1 = 1 2 κ ω , s + ϑ z y , s ϑ y z , s + μ χ ζ θ θ , 2 = 1 2 ω χ ζ θ , 1 θ , 2 = 1 2 ω ω , s χ = y , s C z , x z , s C y , x .
A similar notation convention as previously was followed: coefficient ζ p , i q , , j , is a multiplier of product x i u p x j u q .
Using constitutive Equations (38) and (41) and taking into account the fact that in the considered case γ x s = γ s s = 0 , stresses n x x can be written in the following form:
n x x = E g 1 + β 2 2 γ x x .
where E = E / 1 ν 2 , ν is Poisson’s ratio, E is Young’s modulus, and g is wall thickness. Since it was assumed that γ x s = γ s s = 0 , real forces n x s cannot be determined from the constitutive relations, i.e., the strain–stress relations given above. Forces n x s should be determined from the equilibrium equations. Without going into details concerning the derivation of the formulas expressing the stresses, the final result is as follows (see Wilde [41]):
n x s = 1 + β 2 3 2 s s 1 + β 2 1 2 E g 2 β β , x 1 + β 2 2 γ x x + 1 + β 2 1 γ x x , x d s .

3. Derivation of Displacement Equations for Stability Loss

A system of displacement equations describing the static problem with second-order effects taken into account (a second-order theory problem) was derived from the minimum potential energy principle, using the following formula:
δ U S + U 0 W = δ U S + δ U 0 δ W = 0 ,
where U S is the linear part of the potential energy of the elastic strain, U 0 is the potential energy from the initial stress, and W is the work of the external load.
The potential energy of the elastic strain is expressed by the following formula:
U S = 1 2 E γ x x 2 d A * d x + 1 2 a a G I s θ , x 2 d x
where G I s is stiffness in Saint-Venant torsion and d A * = g * d s , g * = 1 + β 2 3 2 g .
The formula for the potential energy from the initial stress has the following form:
U 0 = n 0 x x γ x x n l + n 0 x s γ x s n l + n 0 s x γ s x n l d S = n 0 x x γ x x n l + 2 n 0 x s γ x s n l d S ,
where
n 0 x x = E g 1 + β 2 2 γ x x 0 , ,
γ x x 0 represents the strains induced by external loads, determined for the linear problem;
n 0 x s = 1 + β 2 3 2 s s 1 + β 2 1 2 E g 2 β β , x 1 + β 2 2 γ x x 0 + 1 + β 2 1 γ x x , x 0 d s ,
γ x x n l is the nonlinear part of the strains, defined by Formula (8);
γ x s n l is the nonlinear part of the strains, defined by Formula (11).
In the case of external load work, the load applied to the rod along its length is reduced to the points that are the main poles of the cross sections, i.e., to the shear centres.
W = a b p u p d x = a b p x u x p + p y u y p + p z u z p d x ,
where
p = p x , p y , p z is the external load vector;
u p = u x p , u y p , u z p , T is the vector of the displacement of the external load application points.
The components of displacement vector u p are defined by the formulas:
u x p = u o x y p u y , x z p u z , x y p C z , x z p C y , x θ ω p θ , x ,
u y p = u y z p C z θ 1 2 y p C y θ 2 ,
u z p = u z + y p C y θ 1 2 z p C z θ 2
where
x p , y p , z p is the vector of the external load application point coordinates;
ω p is the sectorial coordinate of the load application point.
The generalized external load determined in this way is a following load.
As a result of the transformation performed on Formula (15) one gets a system of displacement equations, i.e., a system of four coupled differential equations, three of which are fourth-order equations. The equations are defined by the following formulas:
E A * u o x , x + S z * u y , x x + S y * u z , x x + S ω * θ , x x + S ψ * θ , x + S δ * θ , x + χ E I x , 1 x , 1 0 u o x , x I y , 1 x , 1 0 u y , x I y , 2 x , 1 0 u y , x x I z , 1 x , 1 0 u z , x I z , 2 x , 1 0 u z , x x I θ x , 1 0 θ I θ , 1 x , 1 0 θ , x I θ , 2 x , 1 0 δ θ , x x , x χ p x = 0
E I z * u y , x x S z * u o x , x + I y z * u z , x x + I ω z * θ , x x + I ψ z * θ , x + I δ z * θ , x x + χ I y , 2 y , 2 0 u y , x x + I y , 2 x , 1 0 u o x , x + I y , 2 y , 1 0 u y , x + I z , 1 y , 2 0 u z , x + I z , 2 y , 2 0 u z , x x + I θ y , 2 0 θ + I θ , 1 y , 2 0 θ , x + I θ , 2 y , 2 0 θ , x x , x x I y , 1 y , 1 0 u y , x + I y , 1 x , 1 0 u o x , x + I y , 2 y , 1 0 u y , x x + I z , 1 y , 1 0 u z , x + I z , 2 y , 1 0 u z , x x + I θ y , 1 0 θ + I θ , 1 y , 1 0 θ , x + I θ , 2 y , 1 0 θ , x x , x χ p x y p , x + p y = 0 ,
E I y * u z , x x S y * u o x , x + I y z * u y , x x + I ω y * θ , x x + I ψ y * θ , x + I δ y * θ , x x + χ I z , 2 z , 2 0 u z , x x + I z , 2 x , 1 0 u o x , x + I z , 2 y , 1 0 u y , x + I z , 2 y , 2 0 u y , x x + I z , 2 z , 1 0 u z , x + I θ z , 2 0 θ + I θ , 1 z , 2 0 θ , x + I θ , 2 z , 2 0 θ , x x , x x I z , 1 z , 1 0 u z , x + I z , 1 x , 1 0 u o x , x + I z , 1 y , 1 0 u y , x + I z , 1 y , 2 0 u y , x x + I z , 2 z , 1 0 u z , x x + I θ z , 1 0 θ + I θ , 1 z , 1 0 θ , x + I θ , 2 z , 1 0 θ , x x , x χ p x z p , x + p z = 0 ,
E I ω * θ , x x S ω * u o x , x + I ω z * u y , x x + I ω y * u z , x x + I ψ ω * θ , x + I δ ω * θ , x x + I ψ * θ , x + S ψ * u o x , x I ψ z * u y , x x I ψ y * u z , x x I ψ ω * θ , x x I δ ψ * θ , x + I δ * θ S δ * u o x , x + I δ z * u y , x x + I δ y * u z , x x + I δ ω * θ , x x + I δ ψ * θ , x G I s θ , x , x + χ I θ , 2 θ , 2 0 θ , x x + I θ , 2 x , 1 0 u o x , x + I θ , 2 y , 1 0 u y , x + I θ , 2 y , 2 0 u y , x x + I θ , 2 z , 1 0 u z , x + I θ , 2 z , 2 0 u z , x x + I θ , 2 θ 0 θ + I θ , 2 θ , 1 0 θ , x , x x I θ , 1 θ , 1 0 θ , x + I θ , 1 x , 1 0 u o x , x + I θ , 1 y , 1 0 u y , x + I θ , 1 y , 2 0 u y , x x + I θ , 1 z , 1 0 u z , x + I θ , 1 z , 2 0 u z , x x + I θ , 1 θ 0 θ + I θ , 2 θ , 1 0 θ , x x , x + I θ θ 0 θ + I θ x , 1 0 u o x , x + I θ y , 1 0 u y , x + I θ y , 2 0 u y , x x + I θ z , 1 0 u z , x + I θ z , 2 0 u z , x x + I θ , 1 θ 0 θ , x + I θ , 2 θ 0 θ , x x = χ p x ω p θ , x , x + p x y p C z , x z p C y , x p y z p C z + p y y p C y θ p z y p C y + p z z p C z θ .
The equations describing the boundary conditions, accompanying the above equations are as follows:
N δ u o x a b = 0 ,
where
N = E A * u o x , x S z * u y , x x S y * u z , x x S ω * θ , x x S ψ * θ , x S δ * θ + χ I x , 1 x , 1 0 u o x , x + I y , 1 x , 1 0 u y , x + I y , 2 x , 1 0 u y , x x + I z , 1 x , 1 0 u z , x + I z , 2 x , 1 0 u z , x x + I θ x , 1 0 θ + I θ , 1 x , 1 0 θ , x + I θ , 2 x , 1 0 δ θ , x x ,
Q y δ u y a b = 0 ,
where
Q y = E I z * u y , x x + S z * u o x , x I y z * u z , x x I ω z * θ , x x I ψ z * θ , x I δ z * θ , x χ I y , 1 x , 1 0 u o x , x + I y , 1 y , 1 0 u y , x + I y , 2 y , 1 0 u y , x x + I z , 1 y , 1 0 u z , x + I z , 2 y , 1 0 u z , x x + I θ y , 1 0 θ + I θ , 1 y , 1 0 θ , x + I θ , 2 y , 1 0 θ , x x χ I y , 2 x , 1 0 u o x , x + I y , 2 y , 1 0 u y , x + I y , 2 y , 2 0 u y , x x + I z , 1 y , 2 0 u z , x + I z , 2 y , 2 0 u z , x x + I θ y , 2 0 θ + I θ , 1 y , 2 0 θ , x + I θ , 2 y , 2 0 θ , x x , x + χ p x y p
M z δ u y , x a b = 0 ,
where
M z = E I z * u y , x x + S z * u o x , x I y z * u z , x x I ω z * θ , x x I ψ z * θ , x I δ z * θ + χ I y , 2 x , 1 0 u o x , x + I y , 2 y , 1 0 u y , x + I y , 2 y , 2 0 u y , x x + I z , 1 y , 2 0 u z , x + I z , 2 y , 2 0 u z , x x + I θ y , 2 0 θ + I θ , 1 y , 2 0 θ , x + I θ , 2 y , 2 0 θ , x x ,
Q z δ u z a b = 0 ,
where
Q z = E I y * u z , x x + S y * u o x , x I y z * u y , x x I ω y * θ , x x I ψ y * θ , x I δ y * θ , x + χ I z , 1 x , 1 0 u o x , x + I z , 1 y , 1 0 u y , x + I z , 1 y , 2 0 u y , x x + I z , 1 z , 1 0 u z , x + I z , 2 z , 1 0 u z , x x + I θ z , 1 0 θ + I θ , 1 z , 1 0 θ , x + I θ , 2 z , 1 0 θ , x x χ I z , 2 x , 1 0 u o x , x + I z , 2 y , 1 0 u y , x + I z , 2 y , 2 0 u y , x x + I z , 2 z , 1 0 u z , x + I z , 2 z , 2 0 u z , x x + I θ z , 2 0 θ + I θ , 1 z , 2 0 θ , x + I θ , 2 z , 2 0 θ , x x , x + χ p x z p
M y δ u z , x a b = 0 ,
where
M y = E I y * u z , x x + S y * u o x , x I y z * u y , x x I ω y * θ , x x I ψ y * θ , x I δ y * θ + χ I z , 2 x , 1 0 u o x , x I z , 2 y , 1 0 u y , x I z , 2 y , 2 0 u y , x x I z , 2 z , 1 0 u z , x I z , 2 z , 2 0 u z , x x I θ z , 2 0 θ I θ , 1 z , 2 0 θ , x I θ , 2 z , 2 0 θ , x x ,
M x δ θ a b = 0 ,
where
M x = E I ω * θ , x x + S ω * u o x , x I ω z * u y , x x I ω y * u z , x x I ψ ω * θ , x I δ ω * θ , x + I ψ * θ , x S ψ * u o x , x + I ψ z * u y , x x + I ψ y * u z , x x + I ψ ω * θ , x x + I δ ψ * θ χ I θ , 1 x , 1 0 u o x , x + I θ , 1 y , 1 0 u y , x + I θ , 1 y , 2 0 u y , x x + I θ , 1 z , 1 0 u z , x + I θ , 1 z , 2 0 u z , x x + I θ , 1 θ 0 θ + I θ , 1 θ , 1 0 θ , x + I θ , 2 θ , 1 0 θ , x x χ I θ , 2 x , 1 0 u o x , x + I θ , 2 y , 1 0 u y , x + I θ , 2 y , 2 0 u y , x x + I θ , 2 z , 1 0 u z , x + I θ , 2 z , 2 0 u z , x x + I θ , 2 θ 0 θ + I θ , 2 θ , 1 0 θ , x + I θ , 2 θ , 2 0 θ , x x , x + G I s θ , x + χ p x ω p
B δ θ , x a b = 0 ,
where
B = E I ω * θ , x x S ω * u o x , x + I ω z * u y , x x + I ω y * u z , x x + I ψ ω * θ , x + I δ ω * θ + χ I θ , 2 x , 1 0 u o x , x + I θ , 2 y , 1 0 u y , x + I θ , 2 y , 2 0 u y , x x + I θ , 2 z , 1 0 u z , x + I θ , 2 z , 2 0 u z , x x + I θ , 2 θ 0 θ + I θ , 2 θ , 1 0 θ , x + I θ , 2 θ , 2 0 θ , x x
The coefficients in Formulas (22)–(32) are expressed by the following formulas:
A * = S d A *   ,   S y * = S z d A *   ,   S z * = S y d A *   ,   S ψ * = S ψ d A *   , S δ * = S δ d A *   , I y * = S z 2 d A *   ,   I z * = S y 2 d A *   ,   I y z * = S y z d A *   ,   I ω * = S ω 2 d A *   , I ψ y * = S z ψ d A *   ,   I ψ z * = S y ψ d A *   ,   I ψ ω * = S ω ψ d A *   , I δ y * = S z δ d A *   ,   I δ z * = S y δ d A *   ,   I δ ω * = S ω δ d A *   , I x , 1 x , 1 0 = S n 0 x x α x , 1 x , 1 d s *   , I y , 1 y , 1 0 = S n 0 x x α y , 1 y , 1 + 2 n 0 x s ζ y , 1 y , 1 d s *   ,   I y , 2 y , 2 0 = S n 0 x x α y , 2 y , 2 d s *   , I z , 1 z , 1 0 = S n 0 x x α z , 1 z , 1 + 2 n 0 x s ζ z , 1 z , 1 d s *   , I z , 2 z , 2 0 = S n 0 x x α z , 2 z , 2 d s *   ,   I θ θ 0 = S n 0 x x α θ θ + 2 n 0 x s ζ θ θ d s *   , I θ , 1 θ , 1 0 = S n 0 x x α θ , 1 θ , 1 + 2 n 0 x s ζ θ , 1 θ , 1 d s *   , I θ , 2 θ , 2 0 = S n 0 x x α θ , 2 θ , 2 d s *   ,   I y , 1 x , 1 0 = S n 0 x x α y , 1 x , 1 + 2 n 0 x s ζ y , 1 x , 1 d s *   , I y , 2 x , 1 0 = S n 0 x x α y , 2 x , 1 d s *   , I z , 1 x , 1 0 = S n 0 x x α z , 1 x , 1 + 2 n 0 x s ζ z , 1 x , 1 d s *   , I z , 2 x , 1 0 = S n 0 x x α z , 2 x , 1 d s *   , I θ x , 1 0 = S n 0 x x α θ x , 1 + 2 n 0 x s ζ θ x , 1 d s *   ,   I θ , 1 x , 1 0 = S n 0 x x α θ , 1 x , 1 + 2 n 0 x s ζ θ , 1 x , 1 d s *   ,   I θ , 2 x , 1 0 = S n 0 x x α θ , 2 x , 1 d s *   , I y , 2 y , 1 0 = S n 0 x x α y , 2 y , 1 + 2 n 0 x s ζ y , 2 y , 1 d s *   ,   I z , 1 y , 1 0 = S n 0 x x α z , 1 y , 1 + 2 n 0 x s ζ z , 1 y , 1 d s *   ,   I z , 2 y , 1 0 = S n 0 x x α z , 2 y , 1 + 2 n 0 x s ζ z , 2 y , 1 d s * , I θ y , 1 0 = S n 0 x x α θ y , 1 + 2 n 0 x s ζ θ y , 1 d s * , I θ , 1 y , 1 0 = S n 0 x x α θ , 1 y , 1 + 2 n 0 x s ζ θ , 1 y , 1 d s * , I θ , 2 y , 1 0 = S n 0 x x α θ , 2 y , 1 + 2 n 0 x s ζ θ , 2 y , 1 d s * , I z , 1 y , 2 0 = S n 0 x x α z , 1 y , 2 + 2 n 0 x s ζ z , 1 y , 2 d s * , I z , 2 y , 2 0 = S n 0 x x α z , 2 y , 2 d s * , I θ y , 2 0 = S n 0 x x α θ y , 2 + 2 n 0 x s ζ θ y , 2 d s * , I θ , 1 y , 2 0 = S n 0 x x α θ , 1 y , 2 + 2 n 0 x s ζ θ , 1 y , 2 d s * , I θ , 2 y , 2 0 = S n 0 x x α θ , 2 y , 2 d s * , I z , 2 z , 1 0 = S n 0 x x α z , 2 z , 1 + 2 n 0 x s ζ z , 2 z , 1 d s * , I θ z , 1 0 = S n 0 x x α θ z , 1 + 2 n 0 x s ζ θ z , 1 d s * , I θ , 1 z , 1 0 = S n 0 x x α θ , 1 z , 1 + 2 n 0 x s ζ θ , 1 z , 1 d s * , I θ , 2 z , 1 0 = S n 0 x x α θ , 2 z , 1 + 2 n 0 x s ζ θ , 2 z , 1 d s * , I θ z , 2 0 = S n 0 x x α θ z , 2 + 2 n 0 x s ζ θ z , 2 d s * , I θ , 1 z , 2 0 = S n 0 x x α θ , 1 z , 2 + 2 n 0 x s ζ θ , 1 z , 2 d s * , I θ , 2 z , 2 0 = S n 0 x x α θ , 2 z , 2 d s * , I θ , 1 θ 0 = S n 0 x x α θ , 1 θ + 2 n 0 x s ζ θ , 1 θ d s * , I θ , 2 θ 0 = S n 0 x x α θ , 2 θ + 2 n 0 x s ζ θ , 2 θ d s * , I θ , 2 θ , 1 0 = S n 0 x x α θ , 2 θ , 1 + 2 n 0 x s ζ θ , 2 θ , 1 d s * , d s * = 1 + β 2 d s .

4. Solution of Displacement Equations

The theorem given by Lewanowicz in [42] was used to solve the considered problem. The theorem describes a method of solving ordinary differential equations by means of Gegenbauer polynomials. (A detailed description of this method can be found in [42] and in the present authors’ publications [38,39,40].) Here, zero-order Gegenbauer polynomials λ = 0 , i.e., Chebyshev polynomials of the first order, were used to solve the problem.
T k x = m = 0 k / 2 1 m Γ k m m ! k 2 m ! 2 x k 2 m .
A description of the solution method using Chebyshev polynomials can be found in study [43] by S. Paszkowski. Examples of the use of Chebyshev polynomials to solve mechanics problems can be found in papers [35,36,37,38,39,40] by the present authors.
The solved system of differential equations has the following form:
i = 0 n P i x   f i x = P x ,
In the method presented by Paszkowski [43] and Lewanowicz [42], solutions are sought in the form of the following series:
f x = 1 2 b 0 f T 0 x + k = 1 b k f T k x ,
where f = f 1 f 2 f m T , b k f = b k f 1 b k f 2 b k f m T a bk[fi] is the k-th term of the Chebyshev series expansion of function f i .
It can be shown that system (35) is equivalent to the following system (42)
i = 0 n Q i x f x i = P x ,
where matrices Q i x can be determined from the following relations:
Q i x = j = i n 1 j i j j i P j x j i ,         i = 0 ,   1 , , n
As shown in [42], the system of equations in such a form satisfies the following recurrence relation:
i = 0 n 2 i m = 0 n i ϱ n i m k   b k n + i + 2 m Q i x   f x = m = 0 n ϱ n 0 m k b k n + 2 m P x       for       k n
where
ϱ i j m k = 1 m i j m k i j + m k i + j + 2 m   k + m + 1 i m   k 2 i 2 1 , α 0 = 1 ,             α k = α α + 1 α + k 1       for       k 1
Expansion coefficients   b k Q i x   f x of the product of functions Q i x   f x     are calculated from the formula given below (42) under the assumption that matrices Q i x contain exclusively polynomials. If this assumption is not satisfied, one should first apply appropriate approximation to matrix Q i x :
b k x l f x = 2 l j = 0 l l j b k l + 2 j f x       for       k , l 0
When calculating coefficients with negative subscripts, one should also use the following relations b k f =   b k f , k > 1   .
The displacement equations describing the considered stability loss problem are differential equations of the fourth order. In this particular case (for n = 4 ), the infinite system of Equation (39) assumes the following form:
k + 1 k + 2 k + 3 b k 4 Q 0 x , χ f x 4 k 2 4 k + 3 b k 2 Q 0 x , χ f x + 6 k 2 9 k b k Q 0 x , χ f x 4 k 2 4 k 3 b k + 2 Q 0 x , χ f x + k 1 k 2 k 3 b k + 4 Q 0 x , χ f x + 2 k 2 9 k + 1 k + 2 b k 3 Q 1 x , χ f x 3 k 1 k + 2 b k 1 Q 1 x , χ f x + 3 k + 1 k 2 b k + 1 Q 1 x , χ f x k 1 k 2 b k + 3 Q 1 x , χ f x + 4 k 2 9 k 2 4 k + 1 b k 2 Q 2 x , χ f x 2 k b k Q 2 x , χ f x + k 1 b k + 2 Q 2 x , χ f x + 8 k 2 9 k 2 4 k 2 1 b k 1 Q 3 x , χ f x b k + 1 Q 3 x , χ f x + 16 k 2 9 k 2 4 k 2 1 k   b k Q 4 x , χ f x = 0 for k 4
The system of equations describing the problem formulated in Section 3 was reduced to the following matrix form:
i = 0 4 K i x + χ R i x f i x = 0
Hence the matrix function coefficients P i x in Formula (35) are defined by the formula
P i x = K i x + χ R i x , i = 1 , 2 , 3 , 4 ; P x = 0
where the matrices K i and R i assume the following forms:
K 0 = E 0 0 0 k 14 0 0 0 0 k 24 0 0 0 0 k 34 0 0 0 0 k 44 0 , K 1 = E k 11 1 0 0 k 14 1 k 21 1 0 0 k 24 1 k 31 1 0 0 k 34 1 k 41 1 0 0 k 44 1   , K 2 = E k 11 2 k 12 2 k 13 2 k 14 2 k 21 2 k 22 2 k 23 2 k 24 2 k 31 2 k 32 2 k 33 2 k 34 2 k 41 2 k 42 2 k 43 2 k 44 2 , K 3 = E 0 k 12 3 k 13 3 k 14 3 k 21 3 k 22 3 k 23 3 k 24 3 k 31 3 k 32 3 k 33 3 k 34 3 k 41 3 k 42 3 k 43 3 k 44 3 , K 4 = E 0 0 0 0 0 k 22 4 k 23 4 k 24 4 0 k 32 4 k 33 4 k 34 4 0 k 42 4 k 43 4 k 44 4 ,
R 0 = 0 0 0 r 14 0 0 0 0 r 24 0 0 0 0 r 34 0 0 0 0 r 44 0 , R 1 = r 11 1 r 12 1 r 13 1 r 14 1 r 21 1 r 22 1 r 23 1 r 24 1 r 31 1 r 32 1 r 33 1 r 34 1 r 41 1 r 42 1 r 43 1 r 44 1 , R 2 = r 11 2 r 12 2 r 13 2 r 14 2 r 21 2 r 22 2 r 23 2 r 24 2 r 31 2 r 32 2 r 33 2 r 34 2 r 41 2 r 42 2 r 43 2 r 44 2 , , R 3 = 0 r 12 3 r 13 3 r 14 3 r 21 3 r 22 3 r 23 3 r 24 3 r 31 3 r 32 3 r 33 3 r 34 3 r 41 3 r 42 3 r 43 3 r 44 3 , R 4 = 0 0 0 0 0 r 22 3 r 23 3 r 24 3 0 r 32 3 r 33 3 r 34 3 0 r 42 3 r 43 3 r 44 3 .
The coefficients of stiffness matrix K i and geometric stiffness matrix R i are defined by the following formulas:
k 14 0 = S δ , x * k 24 0 = I δ z , x x * k 34 0 = I δ y , x x * k 44 0 = I δ ω , x x * I δ ψ , x * + I δ * k 11 1 = A , x * k 14 1 = S ψ , x * + S δ * k 21 1 = S z , x x * k 24 1 = I ψ z , x x * + 2 I δ z , x * k 31 1 = S y , x x * k 34 1 = I ψ y , x x * + 2 I δ y , x * k 41 1 = S ω , x x * + S ψ , x * S δ * k 44 1 = I ψ ω , x x * + 2 I δ ω , x * I ψ , x * G E I s , x k 11 2 = A * k 12 2 = S z , x * k 13 2 = S y , x * k 14 2 = S ω , x * + S ψ * k 21 2 = 2 S z , x * k 22 2 = I z , x x * k 23 2 = I y z , x x * k 24 2 = I ω z , x x * + 2 I ψ z , x * + I δ z * k 31 2 = 2 S y , x * k 32 2 = I y z , x x * k 33 2 = I y , x x * k 34 2 = I ω y , x x * + 2 I ψ y , x * + I δ y * k 41 2 = 2 S ω , x * + S ψ * k 42 2 = I ω z , x x * I ψ z , x * + I δ z * k 43 2 = I ω y , x x * I ψ y , x * + I δ y * k 44 2 = I ω , x x * + I ψ ω , x * + 2 I δ ω * I ψ * G E I s k 12 3 = S z * k 13 3 = S y * k 14 3 = S ω * k 21 3 = S z * k 22 3 = 2 I z , x * k 23 3 = 2 I y z , x * k 24 3 = 2 I ω z , x * + I ψ z * k 31 3 = S y * k 32 3 = 2 I y z , x * k 33 3 = 2 I y , x * k 34 3 = 2 I ω y , x * + I ψ y * k 41 3 = S ω * k 42 3 = 2 I ω z , x * I ψ z * k 43 3 = 2 I ω y , x * I ψ y * k 44 3 = 2 I ω , x * k 22 4 = I z * k 23 4 = I y z * k 24 4 = I ω z * k 32 4 = I y z * k 33 4 = I y * k 34 4 = I ω y * k 42 4 = I ω z * k 43 4 = I ω y * k 44 4 = I ω *
and
r 14 0 = I θ x , 1 0 , x r 24 0 = I θ y , 1 0 , x + I θ y , 2 0 , x x r 34 0 = I θ z , 1 0 , x + I θ z , 2 0 , x x r 44 0 = I θ θ 0 I θ , 1 θ 0 , x + I θ , 2 θ 0 , x x p z y p C y + p y z p C z r 11 1 = I x , 1 x , 1 0 , x r 12 1 = I y , 1 x , 1 0 , x r 13 1 = I z , 1 x , 1 0 , x r 14 1 = I θ x , 1 0 I θ , 1 x , 1 0 , x r 21 1 = I y , 1 x , 1 0 , x + I y , 2 x , 1 0 , x x r 22 1 = I y , 1 y , 1 0 , x + I y , 2 y , 1 0 , x x r 23 1 = I z , 1 y , 1 0 , x + I z , 1 y , 2 0 , x x r 24 1 = I θ y , 1 0 I θ , 1 y , 1 0 , x + 2 I θ y , 2 0 , x + I θ , 1 y , 2 0 , x x r 31 1 = I z , 1 x , 1 0 , x + I z , 2 x , 1 0 , x x r 32 1 = I z , 1 y , 1 0 , x + I z , 2 y , 1 0 , x x r 33 1 = I z , 1 z , 1 0 , x + I z , 2 z , 1 0 , x x r 34 1 = I θ z , 1 0 I θ , 1 z , 1 0 , x + 2 I θ z , 2 0 , x + I θ , 1 z , 2 0 , x x r 41 1 = I θ x , 1 0 I θ , 1 x , 1 0 , x + I θ , 2 x , 1 0 , x x r 42 1 = I θ y , 1 0 I θ , 1 y , 1 0 , x + I θ , 2 y , 1 0 , x x r 43 1 = I θ z , 1 0 I θ , 1 z , 1 0 , x + I θ , 2 z , 1 0 , x x r 44 1 = I θ , 1 θ , 1 0 , x + 2 I θ , 2 θ 0 , x + I θ , 2 θ , 1 0 , x x p x ω p , x
r 11 2 = I x , 1 x , 1 0 r 12 2 = I y , 1 x , 1 0 I y , 2 x , 1 0 , x r 13 2 = I z , 1 x , 1 0 I z , 2 x , 1 0 , x r 14 2 = I θ , 1 x , 1 0 I θ , 2 x , 1 0 , x r 21 2 = I y , 1 x , 1 0 + 2 I y , 2 x , 1 0 , x r 22 2 = I y , 1 y , 1 0 + I y , 2 y , 1 0 , x + I y , 2 y , 2 0 , x x , r 23 2 = I z , 1 y , 1 0 I z , 2 y , 1 0 , x + 2 I z , 1 y , 2 0 , x + I z , 2 y , 2 0 , x x r 24 2 = I θ , 1 y , 1 0 + I θ y , 2 0 I θ , 2 y , 1 0 , x + 2 I θ , 1 y , 2 0 , x + I θ , 2 y , 2 0 , x x r 31 2 = I z , 1 x , 1 0 + 2 I z , 2 x , 1 0 , x r 32 2 = I z , 1 y , 1 0 + 2 I z , 2 y , 1 0 , x I z , 1 y , 2 0 , x + I z , 2 y , 2 0 , x x r 33 2 = I z , 1 z , 1 0 + I z , 2 z , 1 0 , x + I z , 2 z , 2 0 , x x r 34 2 = I θ , 1 z , 1 0 + I θ z , 2 0 I θ , 2 z , 1 0 , x + 2 I θ , 1 z , 2 0 , x + I θ , 2 z , 2 0 , x x r 41 2 = I θ , 1 x , 1 0 + 2 I θ , 2 x , 1 0 , x r 42 2 = I θ , 1 y , 1 0 + I θ y , 2 0 + 2 I θ , 2 y , 1 0 , x I θ , 1 y , 2 0 , x + I θ , 2 y , 2 0 , x x r 43 2 = I θ , 1 z , 1 0 + I θ z , 2 0 + 2 I θ , 2 z , 1 0 , x I θ , 1 z , 2 0 , x + I θ , 2 z , 2 0 , x x r 44 2 = I θ , 1 θ , 1 0 + 2 I θ , 2 θ 0 + I θ , 2 θ , 1 0 , x + I θ , 2 θ , 2 0 , x x p x ω p r 12 3 = I y , 2 x , 1 0 r 13 3 = I z , 2 x , 1 0 r 14 3 = I θ , 2 x , 1 0 r 21 3 = I y , 2 x , 1 0 r 22 3 = 2 I y , 2 y , 2 0 , x r 23 3 = I z , 2 y , 1 0 + I z , 1 y , 2 0 + 2 I z , 2 y , 2 0 , x r 24 3 = I θ , 2 y , 1 0 + I θ , 1 y , 2 0 + 2 I θ , 2 y , 2 0 , x r 31 3 = I z , 2 x , 1 0 r 32 3 = I z , 2 y , 1 0 I z , 1 y , 2 0 + 2 I z , 2 y , 2 0 , x r 33 3 = 2 I z , 2 z , 2 0 , x r 34 3 = I θ , 2 z , 1 0 + I θ , 1 z , 2 0 + 2 I θ , 2 z , 2 0 , x r 41 3 = I θ , 2 x , 1 0 r 42 3 = I θ , 2 y , 1 0 I θ , 1 y , 2 0 + 2 I θ , 2 y , 2 0 , x r 43 3 = I θ , 2 z , 1 0 I θ , 1 z , 2 0 + 2 I θ , 2 z , 2 0 , x r 44 3 = 2 I θ , 2 θ , 2 0 , x r 22 4 = I y , 2 y , 2 0 r 23 4 = I z , 2 y , 2 0 r 24 4 = I θ , 2 y , 2 0 r 32 4 = I z , 2 y , 2 0 r 33 4 = I z , 2 z , 2 0 r 34 4 = I θ , 2 z , 2 0 r 42 4 = I θ , 2 y , 2 0 r 43 4 = I θ , 2 z , 2 0 r 44 4 = I θ , 2 θ , 2 0
In order to determine multiplier χ defining the critical load, one solves the eigenproblem, limiting oneself to the “first” eigenvalue χ k r y t , for which matrix Equation (43) has a nonzero solution f x .
The sought vector of solutions f x has the form f x = u o x u y u z θ T , where
u β x = 1 2 b 0 u β T 0 x + k = 1 b k u β T k x ,   β = o x ,   y ,   z   ;     θ = 1 2 b 0 θ T 0 x + k = 1 b k θ T k x ,
The above system, satisfied when k 4 , should be completed with fourteen equations describing the boundary conditions. When formulating the conditions, the following relations for the values of polynomials of the first kind and their derivatives in points x = 1 are used:
T k 1 = 1 , d m T k x   / d x m   | x = 1 = k 2 m 1 ! ! l = m + 1 m 1 k + l   , d m T k x   / d x m   | x = 1 = 1 k m   d m T k x   / d x m   | x = 1   .
An exemplary Chebyshev equation describing boundary condition u z ± a = 0 has the following form:
u z x | x = a = 1 2 b 0 u z   T 0 1 + k = 1 b k u z   T 1 = 1 2 b 0 u z + k = 1 b k u z   = 0 , u z x | x = a = 1 2 b 0 u z   T 0 1 + k = 1 b k u z   T 1 = 1 2 b 0 u z + k = 1 1 k b k u z   = 0 .
The obtained infinite system of Equation (42) after it is cut down to a finite system (4M of the first equations) assumes the form
A χ b = 0
where
A is a coefficient matrix dependent on χ , dim A = 4 M × 4 M ;
b = b 0 u o x , b 0 u y , b 0 u z , b 0 θ , , b M 1 u o x , b M 1 u y , b M 1 u z , b M 1 θ T
is a vector of the expansion of the sought functions describing the generalized displacements of the system; χ is a load multiplier.
The value of critical load multiplier χ k r y t resulting in stability loss is calculated from the following condition:
det A χ k r y t = 0 .
After solving Equation (53) and substituting χ = χ k r y t into Equation (52) one gets a homogenous system of algebraic equations for determining the form of stability loss:
A χ k r y t b = 0 .
The way of determining prestresses n 0 x x , n 0 x s (see Formula (17) and its commentary) needs to be explained in more detail. It follows from this formula that the stresses depend on strains γ x x 0 . The latter are calculated by determining the static response of the considered system. For this purpose, one should solve (using the method proposed in this paper) the following system of equations:
i = 0 4 K i x f 0 i x = χ P x .
where summands K i x are defined by Formulas (44) and (46), f 0 x = u 0 x 0 u y 0 u z 0 θ 0 T , and vector P x has the form
P x = p x , p y + p x y p , x , p z + p x z p , x , p x ω p θ , x , x + p x y p C z , x z p C y , x p y z p C z + p z y p C y T .
Using the method presented in this paper to solve the static problem (first-order theory) one should modify Formula (41) by substituting for zero the following expression:
k + 1 k + 2 k + 3 c k 4 P x 4 k 2 4 k + 3 c k 2 P x + 6 k 2 9 k c k P x 4 k 2 4 k 3 c k + 2 P x + k 1 k 2 k 3 c k + 4 P x , .

5. Problem Formulation

As already mentioned in the Introduction, the subject of this study was an analysis of the stability of nonprismatic beams with regard to the impact of factors, including the location of the support points of the same cross section and the location of the external load application points, on the critical load value. Bisymmetric and monosymmetric I-beams with linearly variable cross section heights, which were subjected to uniformly distributed load q [ kN / m ] , were analysed. Also, the effect of the beam’s taper parameter, being a ratio of the beam’s depth at its two ends t p = h ( a ) / h ( a ) , on the critical load value was examined assuming the following taper parameter values in the calculations: t p = 1.0 ,   0.8 , 0.6 , 0.4 , 0.2 . All the analysed beams had length L = 2 a = 8   m . The material parameters of the beams were as follows: E = 210 GPa ,   G = 80 , 77 GPa . Three types of rods differing in their cross sections were analysed: a rod with a bisymmetric cross section, a rod with a monosymmetric cross section with a wider bottom flange (hereafter referred to as “⏊”), and a rod with a monosymmetric cross section with a wider top flange (hereafter referred to as “⏉”). The dimensions of the cross sections of the analysed beams are shown in Figure 3. The sought functions were approximated with a 15-term Chebyshev series. The calculations were performed with the use of Mathematica software version 12 [44].
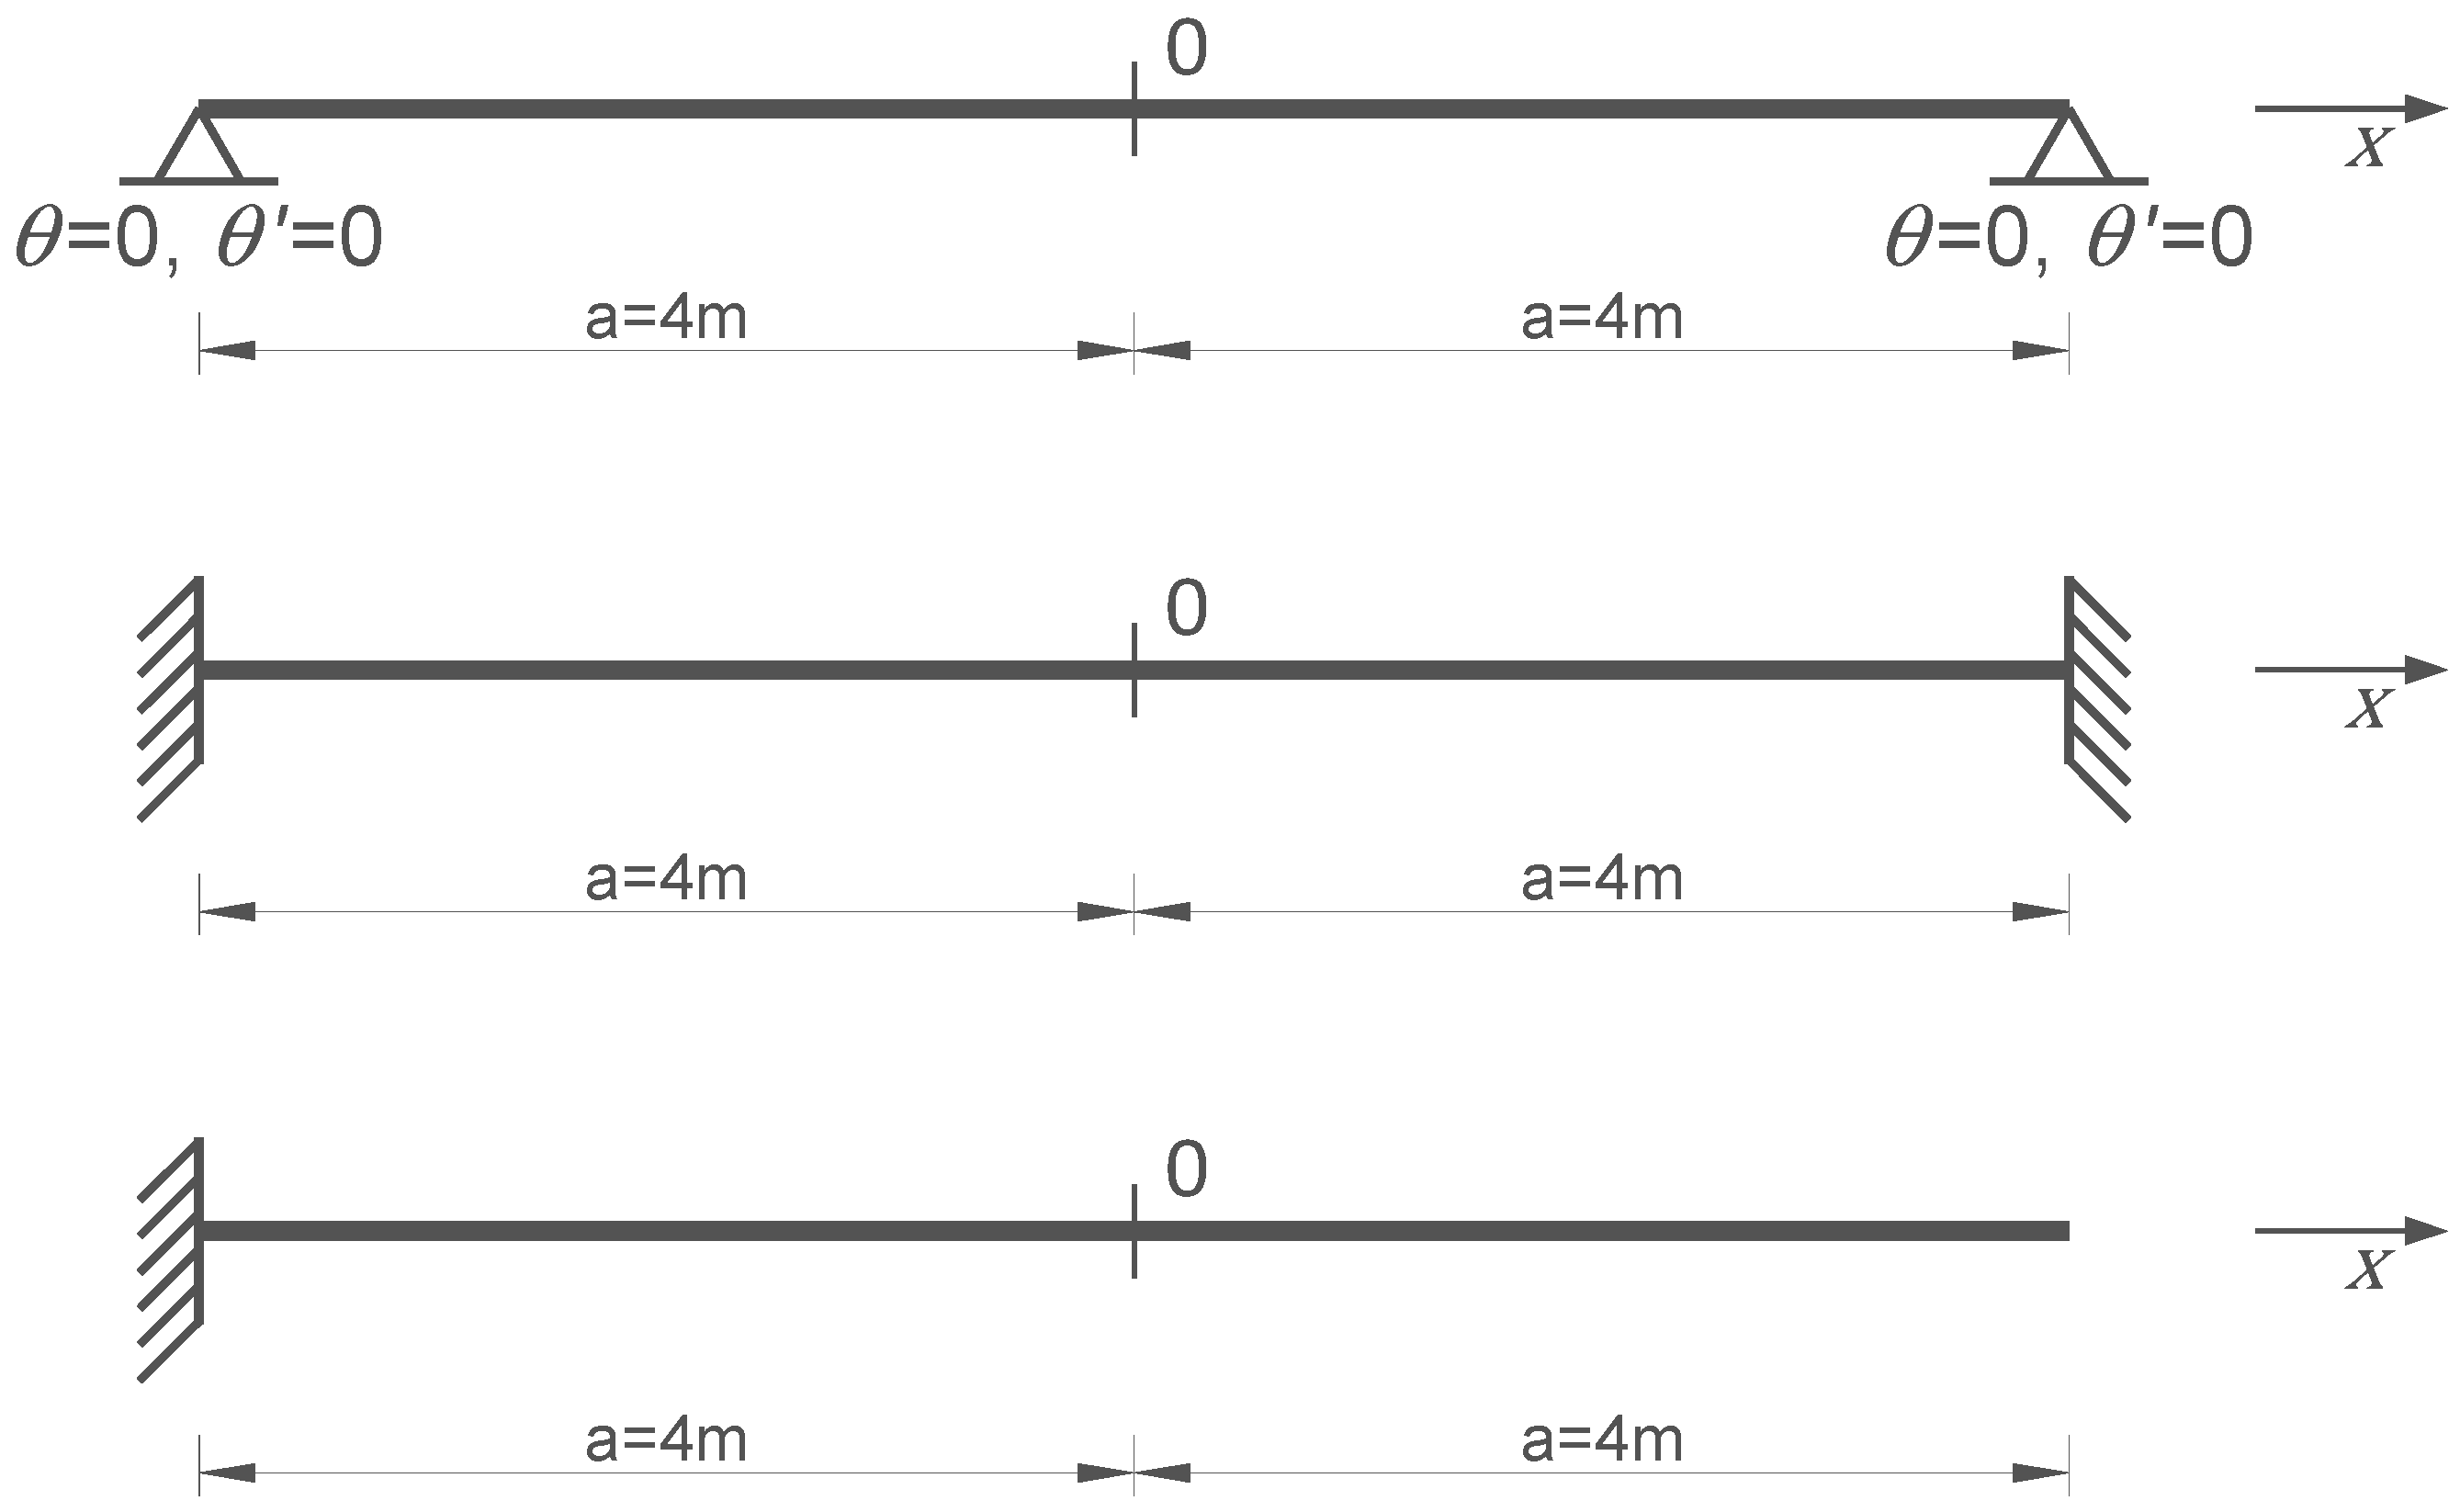
Four groups of tests were carried out. Within the first group, the effect of a change of load application points on the critical load value for a fixed beam support point was studied. Computations were performed for three static beam schemes: pinned-pinned (P-P), clamped-clamped (C-C) and clamped-free (C-F). The boundary conditions defining the considered support schemes (denoted as P, C, F) have the following form:
-
Pinned—P:
u = 0 , v = 0 , w = 0 , M y = 0 , M z = 0 , θ = 0 , θ = 0 ;
-
Clamped—C:
u = 0 , v = 0 , w = 0 , v x = 0 , w x = 0 , θ = 0 , θ = 0 ;
-
Free—F:
N = 0 , Q y = 0 , Q z = 0 , M y = 0 , M z = 0 , M x = 0 , B = 0 .
The static schemes are shown in Figure 4.
The following load application points were adopted in the computations: the centre of the bottom flange, the shear centre, the centre of the cross section, the centre of the web, and the centre of the top flange. The support points were the centres of the webs of the support cross sections. (These points needed to be determined only for the pinned-pinned loading case.) Within this test group, the effect of web taper parameter t p on critical load values was also examined. The results are presented in Table 1, Table 2, Table 3, Table 4, Table 5, Table 6, Table 7, Table 8 and Table 9. Within the second group, the effect of a change of the support point for fixed load application points was analysed. As already mentioned, such an analysis makes sense (as regards the static schemes shown in Figure 4) only for the pinned-pinned loading diagram. The support points were as follows: the centre of the bottom flange, the centre of the web, and the centre of the top flange. For a given loading diagram, the points were the same at both ends of the analysed beam. As the load application points, the centres of the bottom flange, the web, and the top flange were adopted. Critical load values were determined for different values of taper parameter t p . The results are presented in Table 10, Table 11, Table 12, Table 13, Table 14, Table 15, Table 16, Table 17 and Table 18.
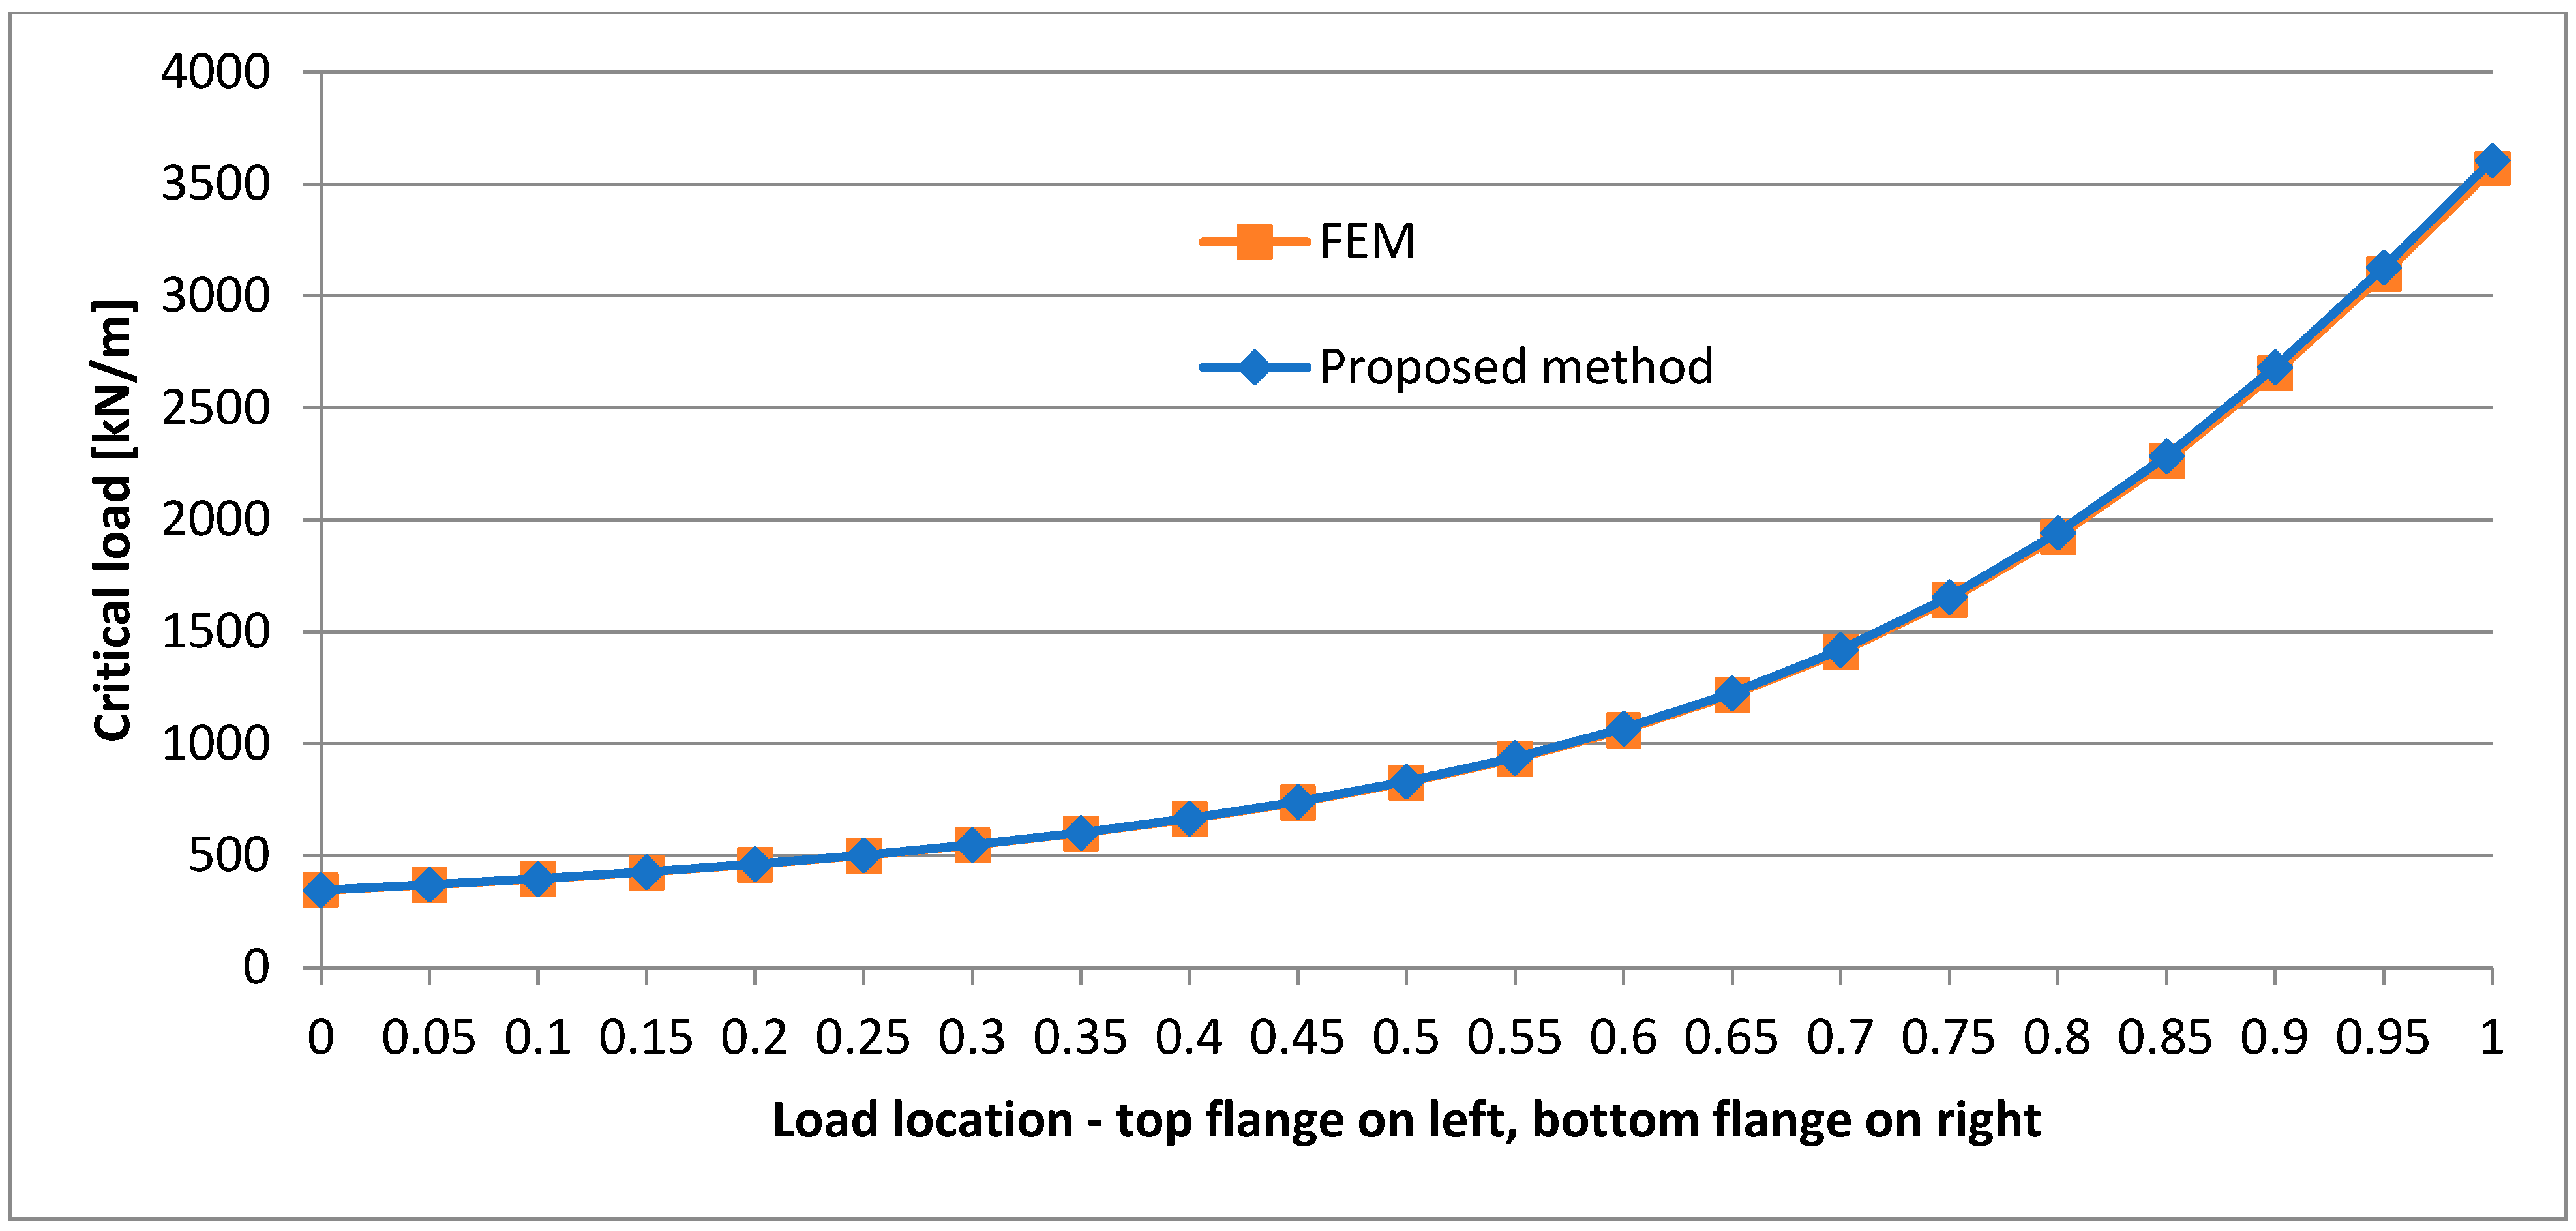
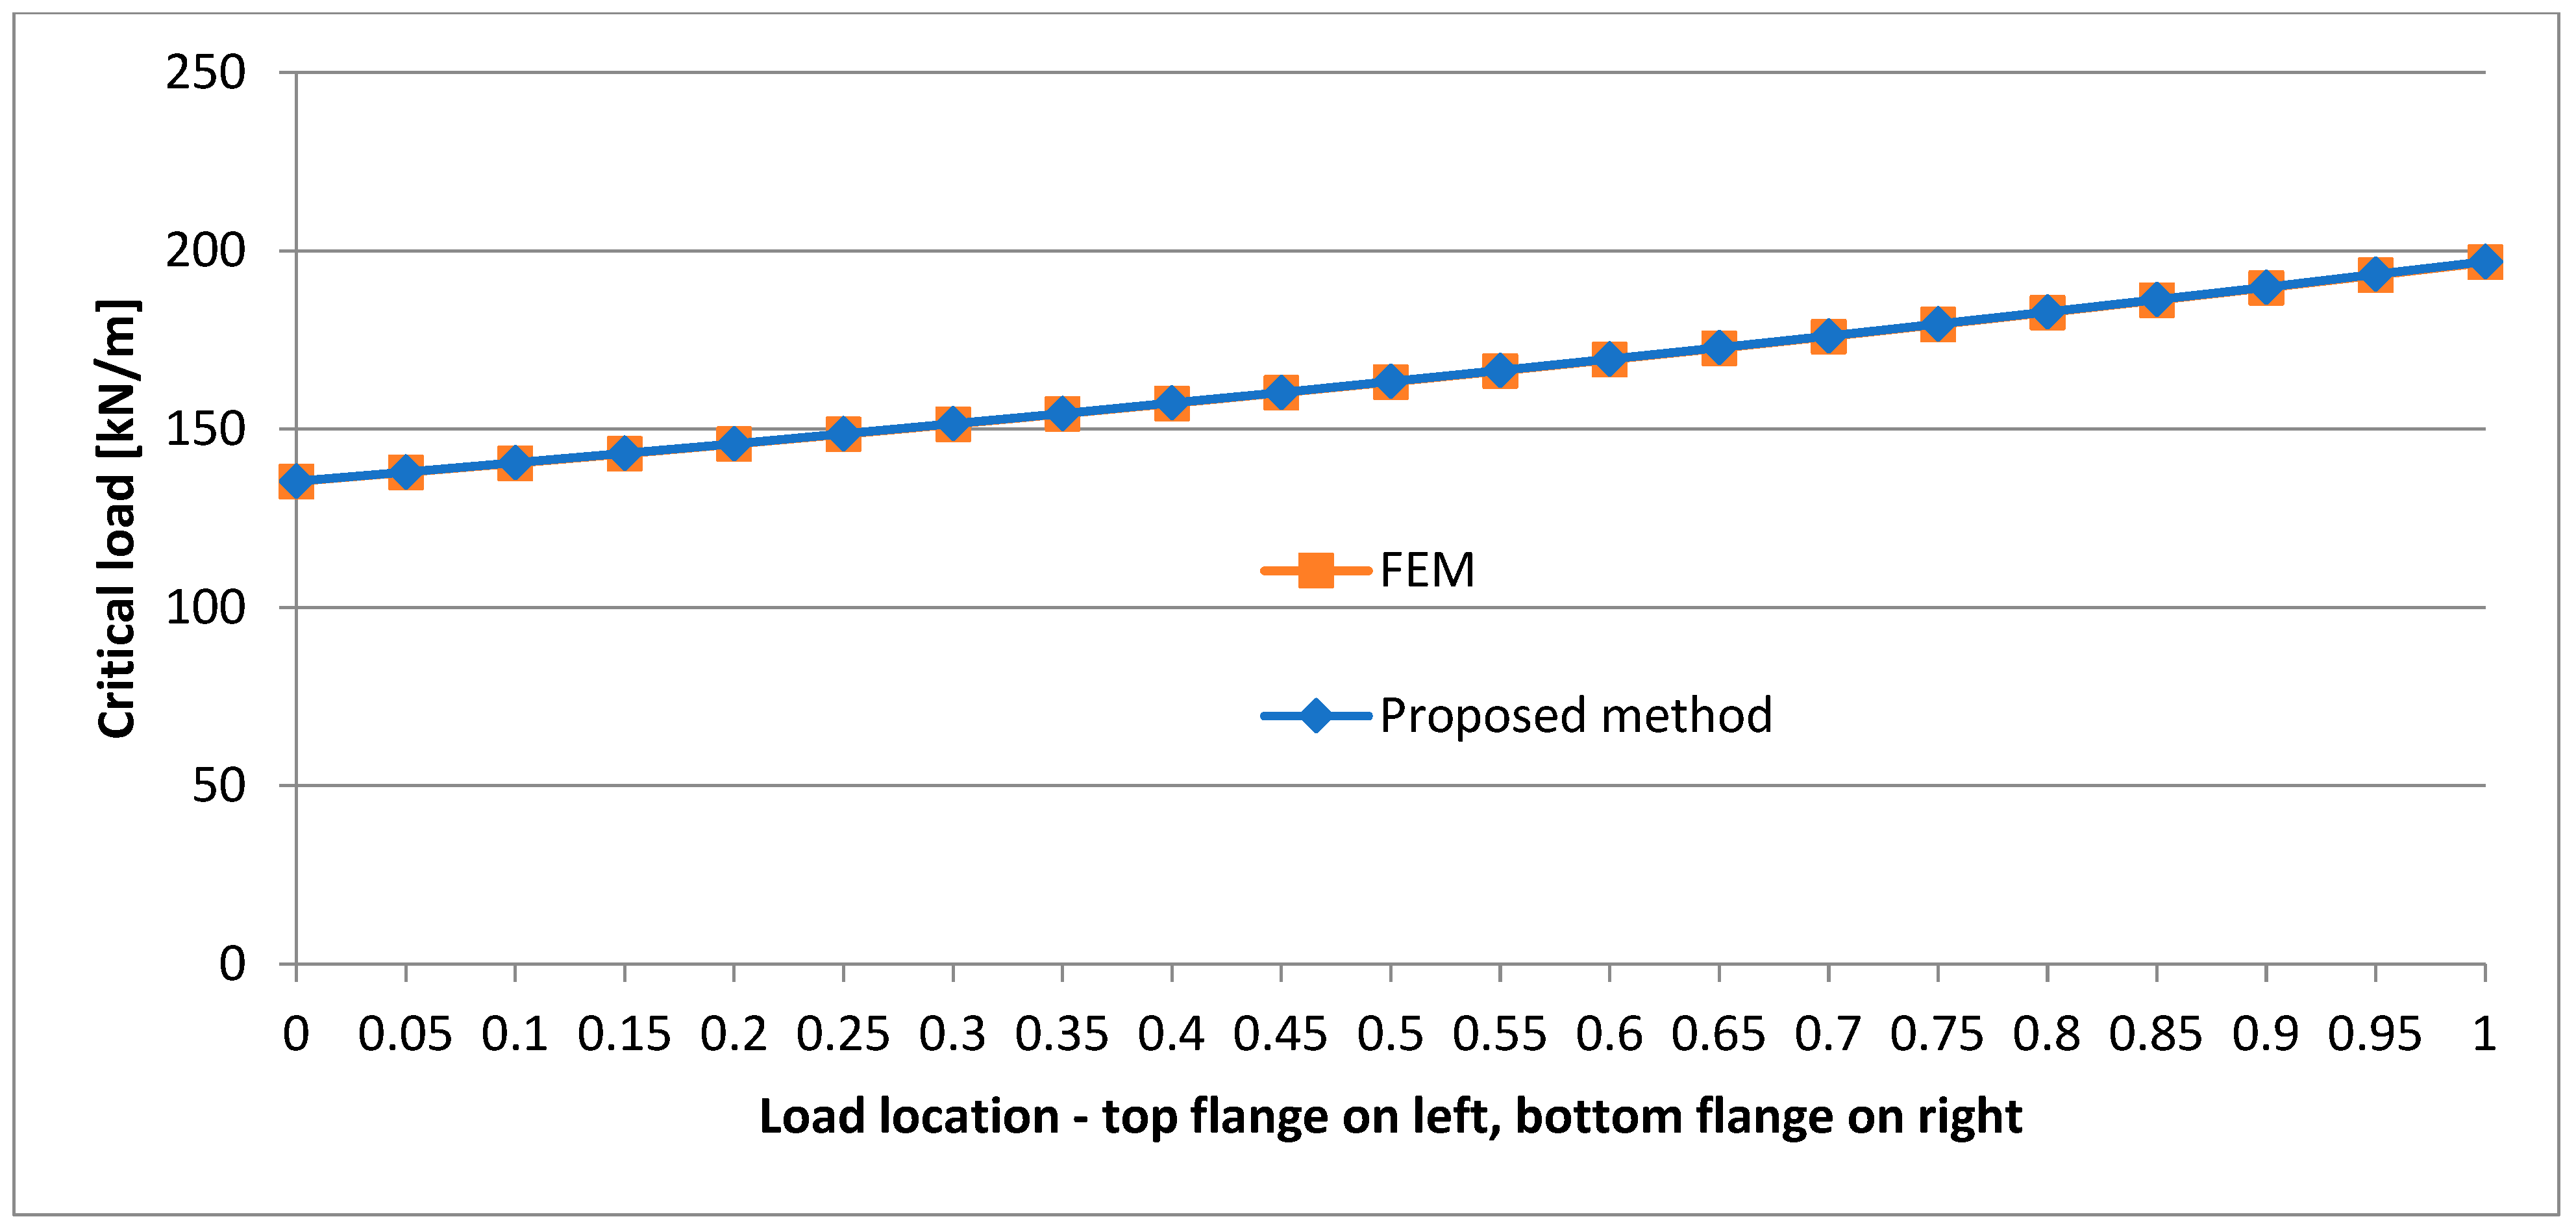
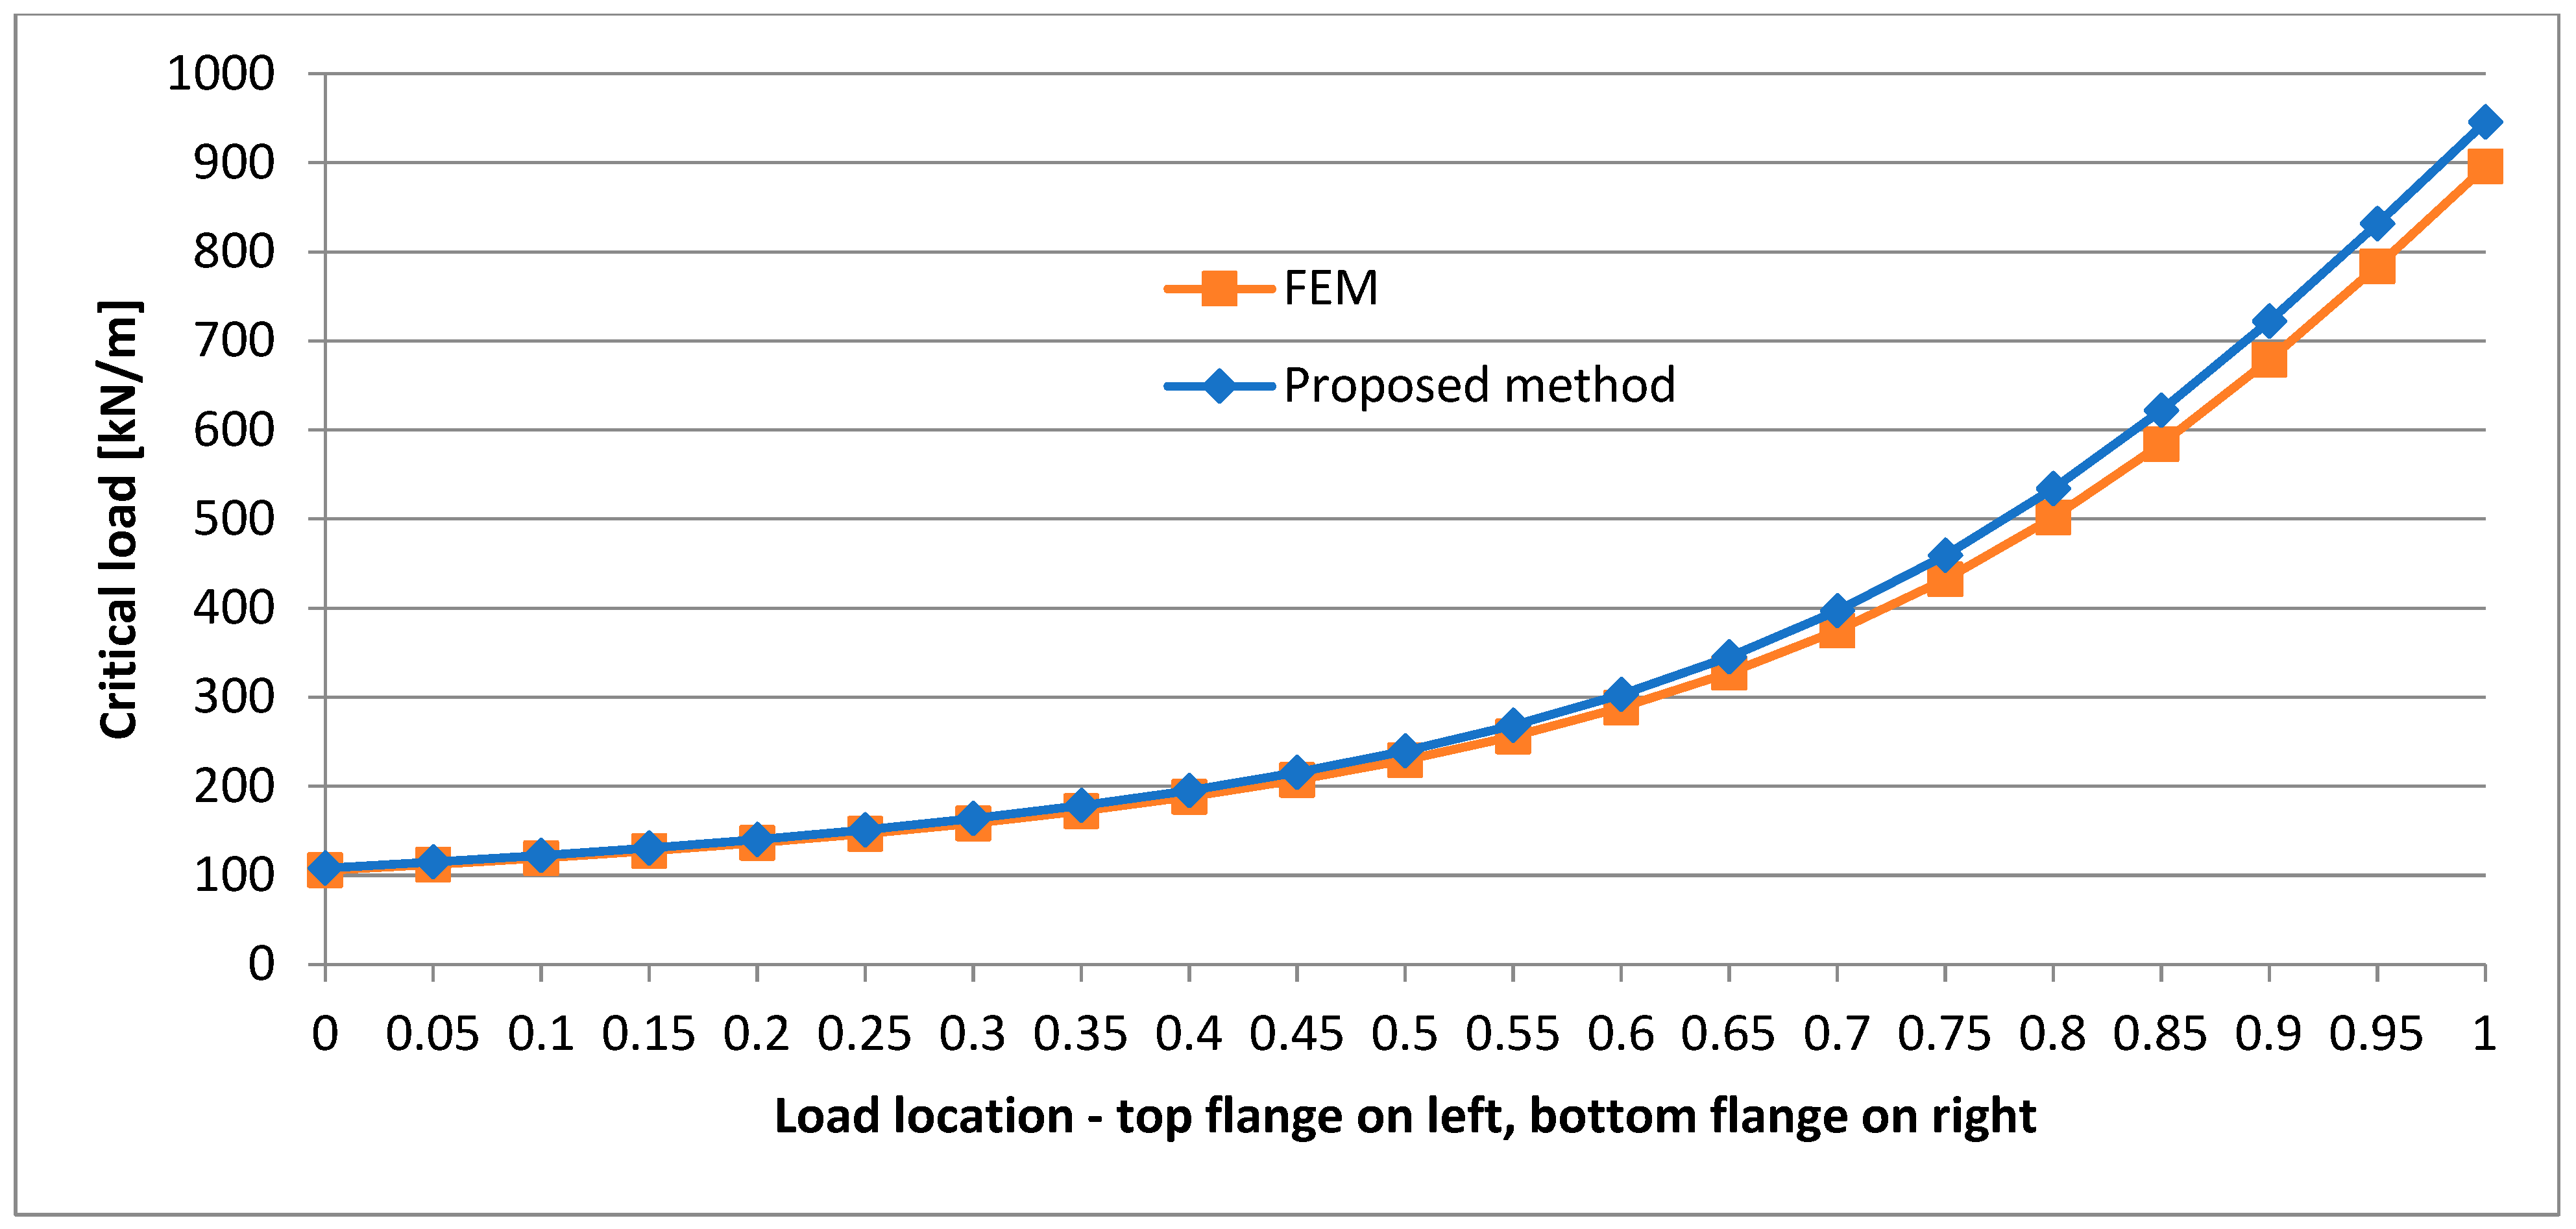
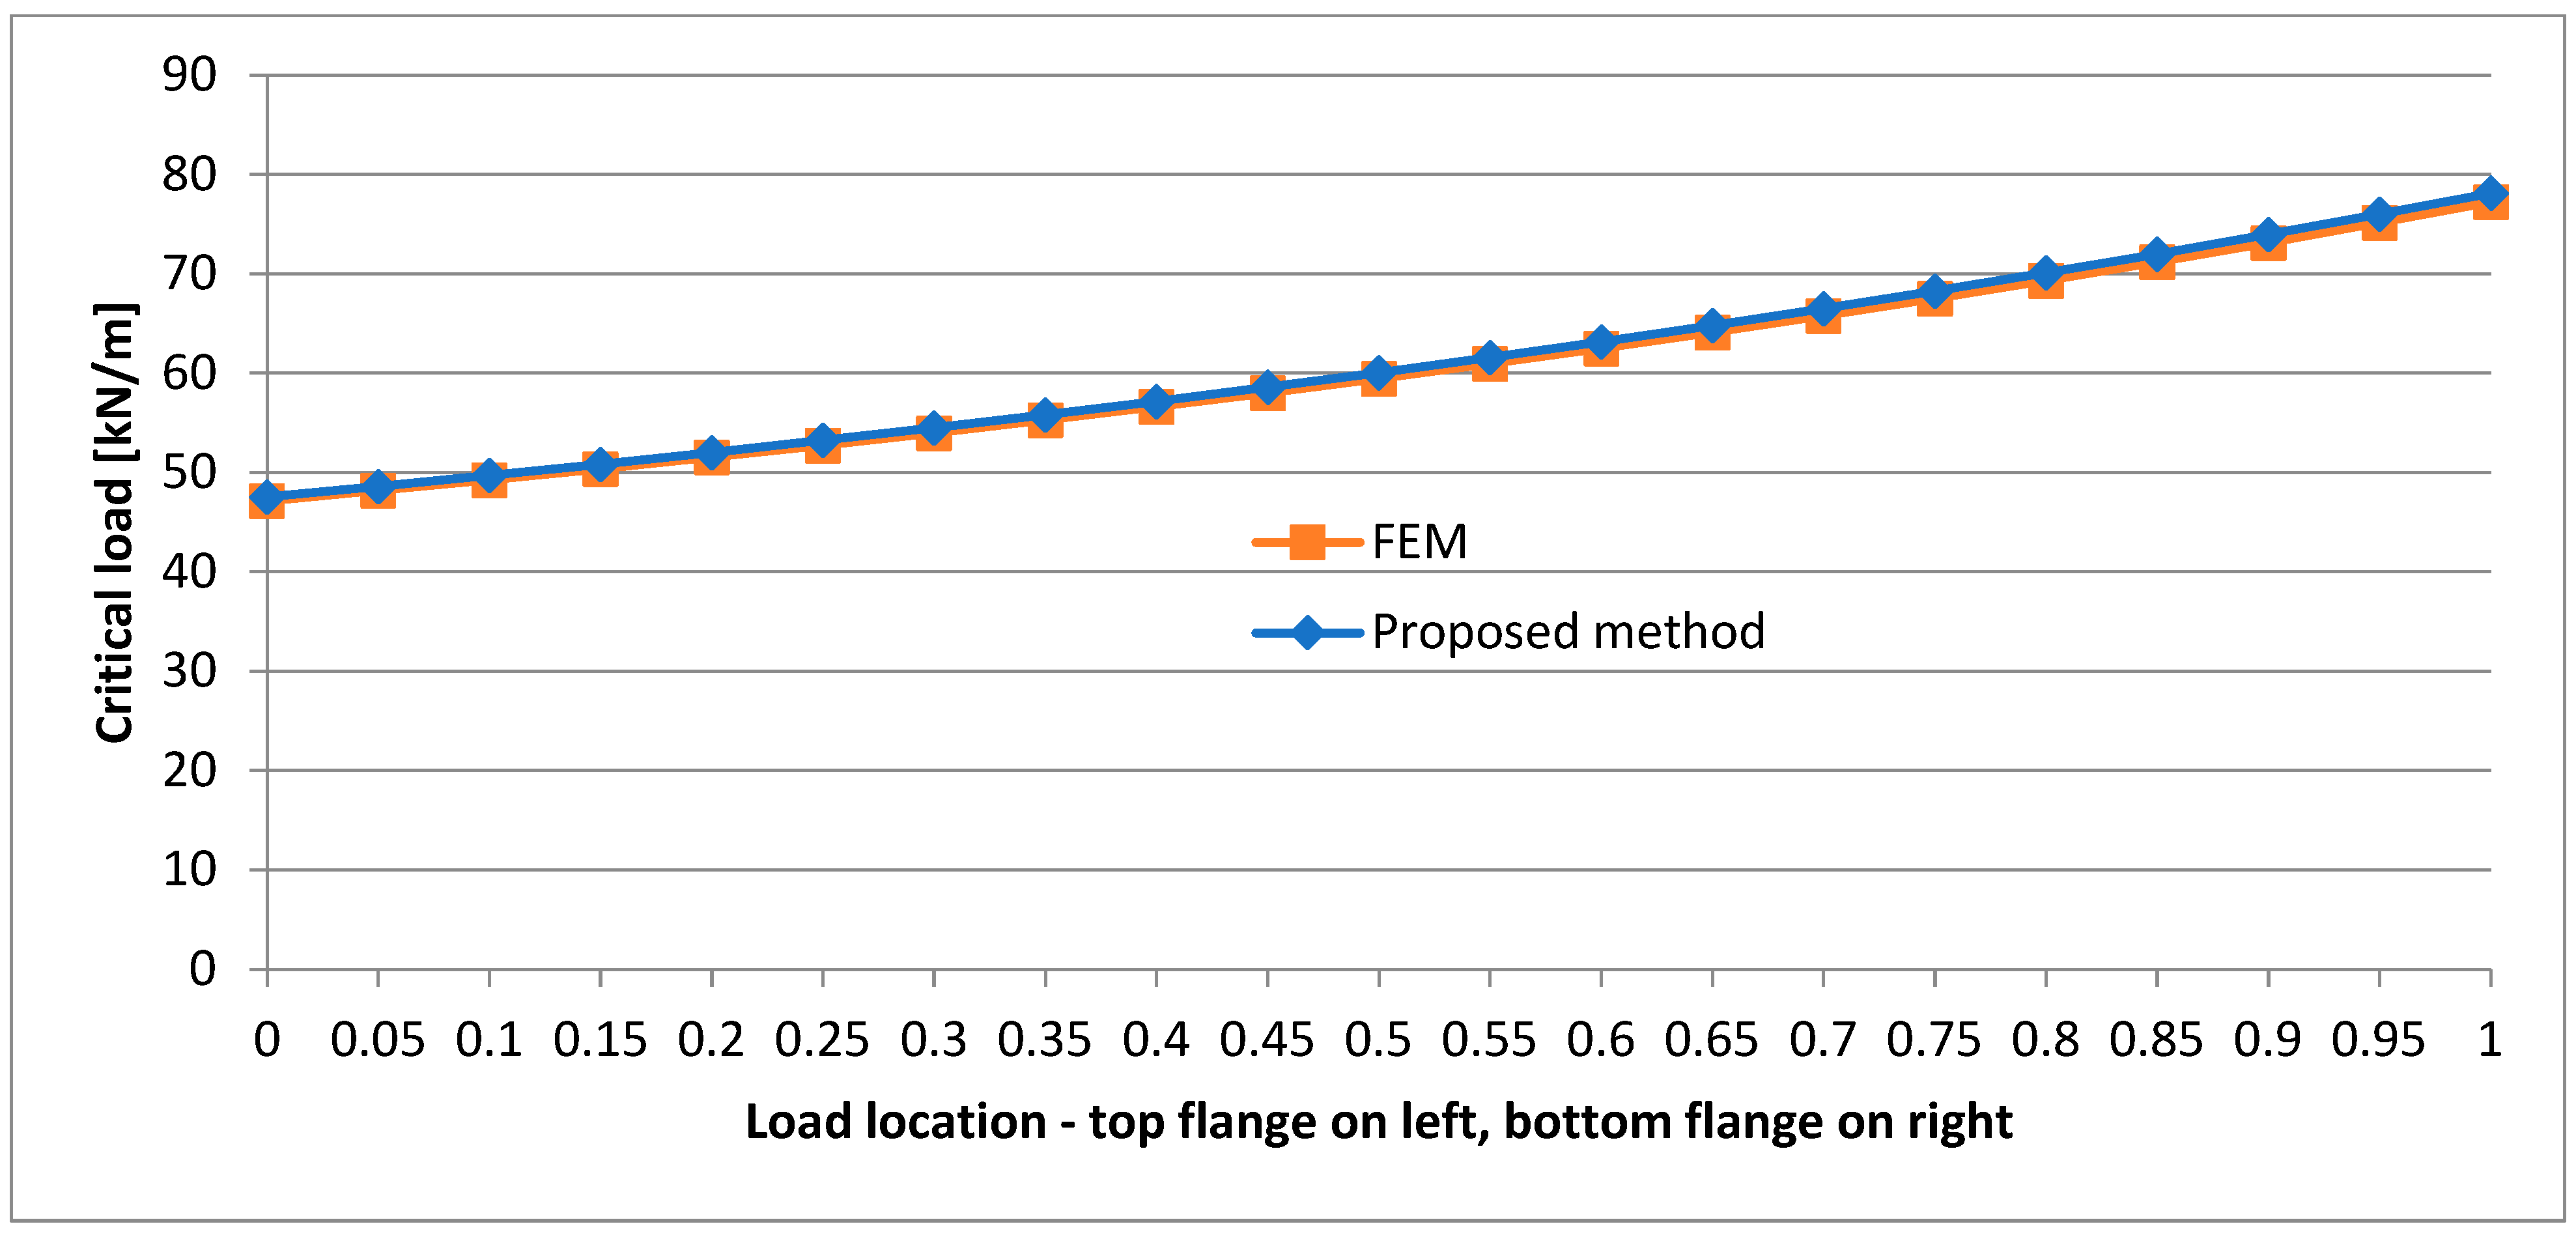
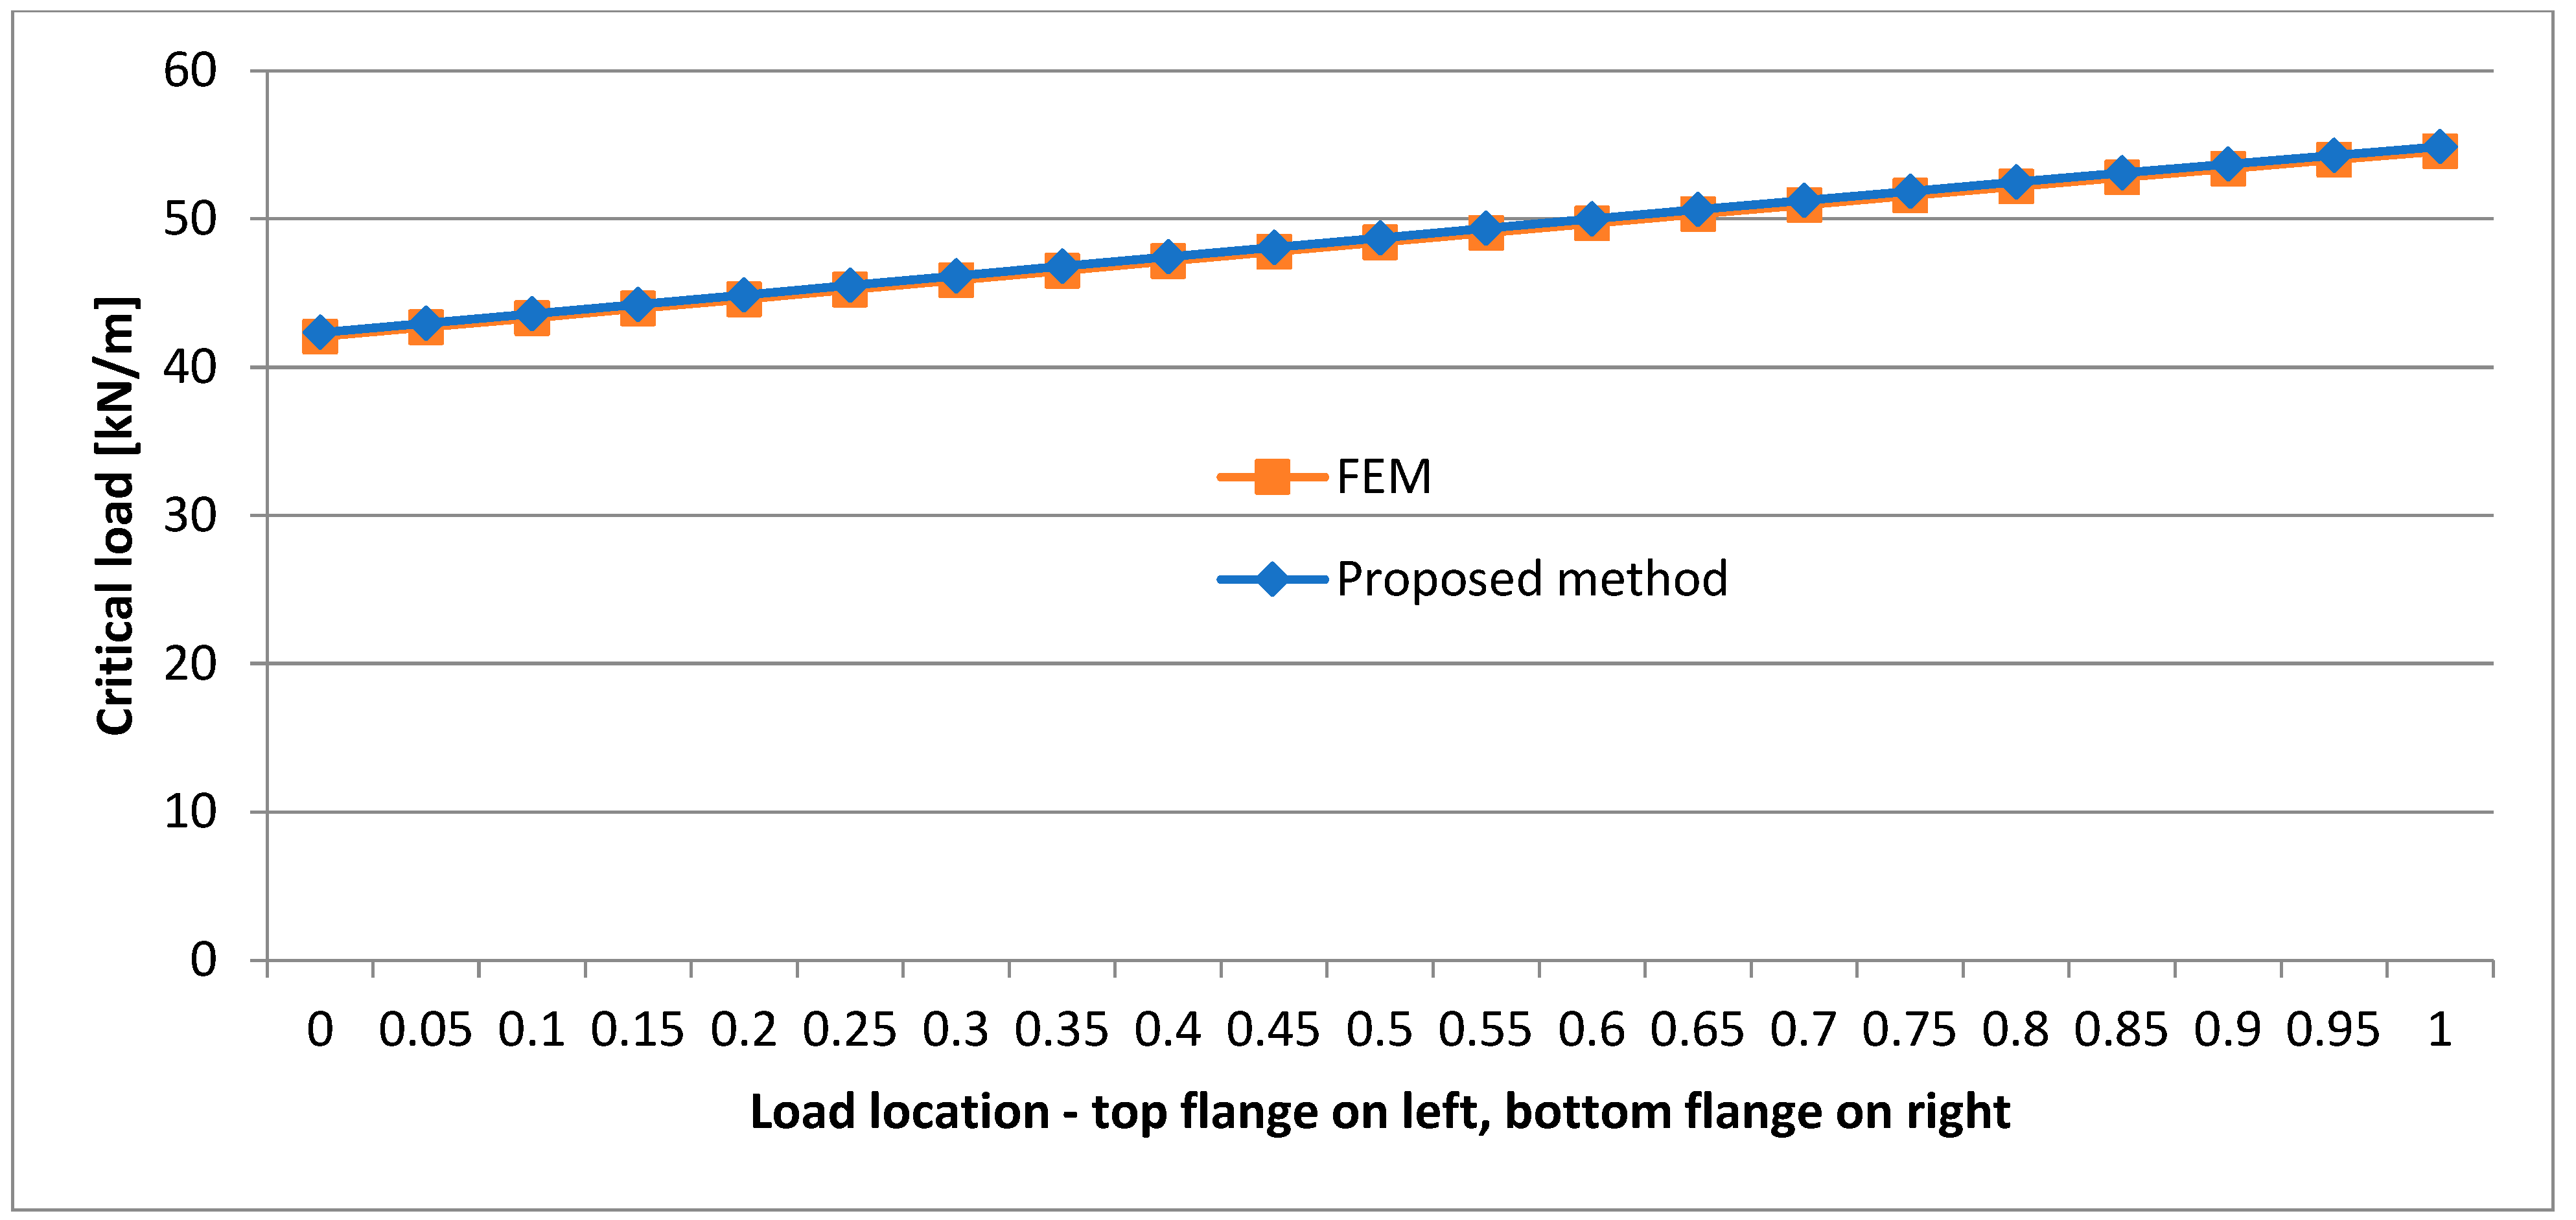
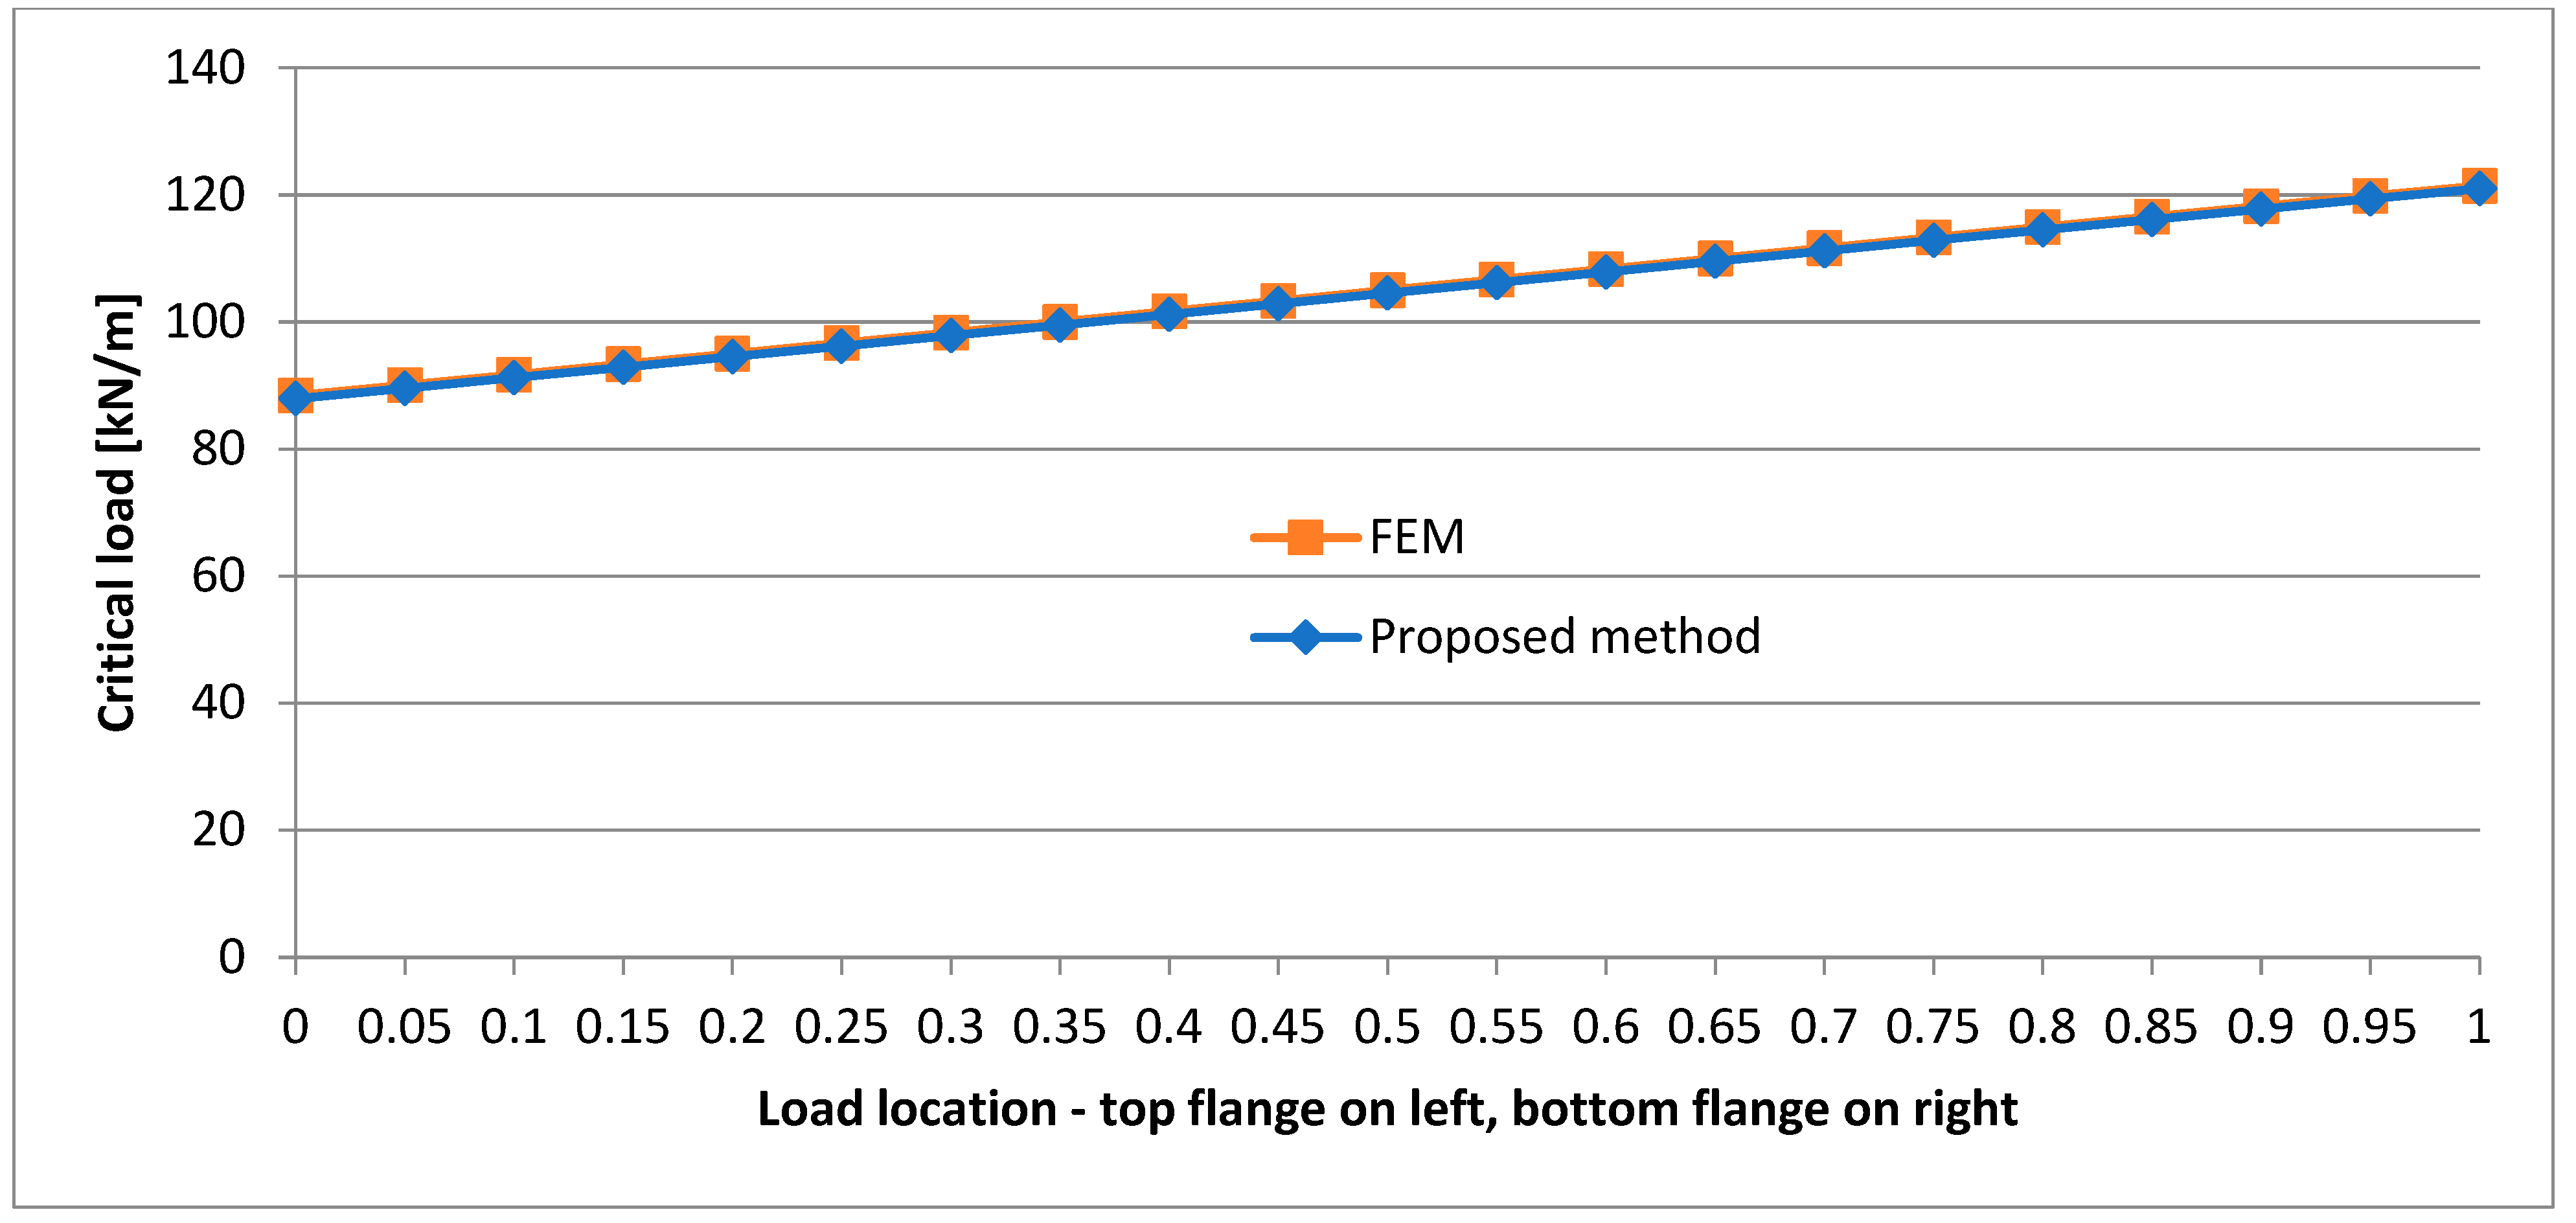
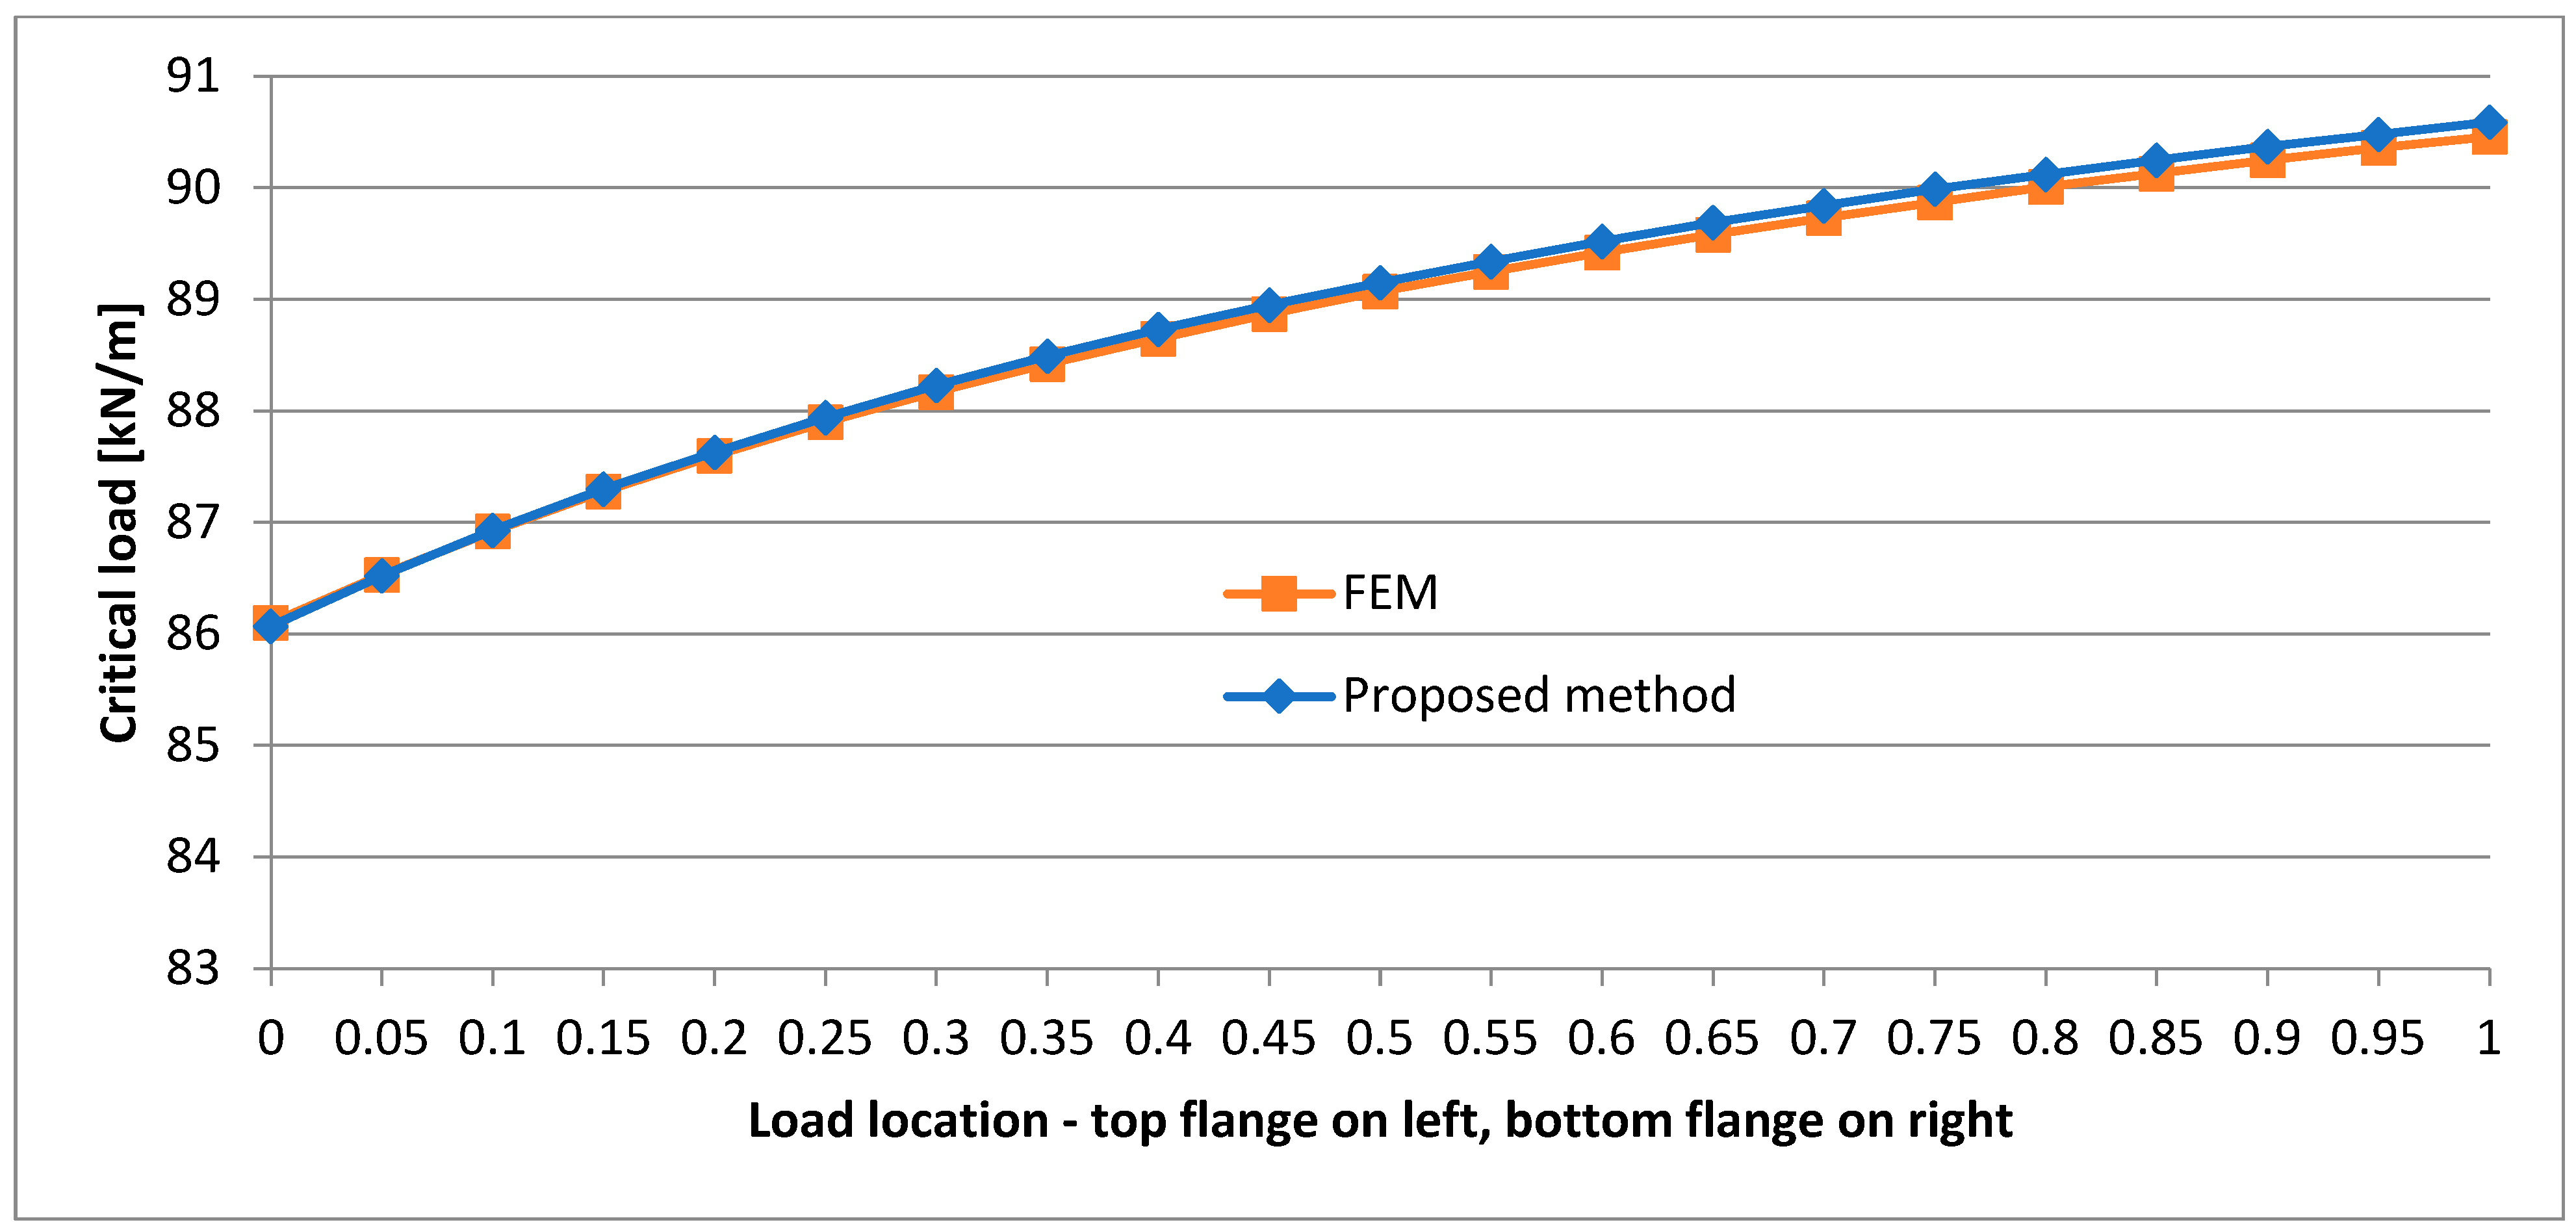
Within the third test group, as within the first group, the effect of a change of application points on the critical load value for fixed beam support points was studied. The difference between the first group and the third one consisted in taking into account in the latter the continuous change of load application points along the height. Calculations were performed for only prismatic beams ( t p = 1.0 ), taking into account (as in the second group) three beam support points: the centre of bottom flange, the centre of web, and the centre of the top flange. The results are presented in Figure 5, Figure 6, Figure 7, Figure 8, Figure 9, Figure 10, Figure 11, Figure 12 and Figure 13.
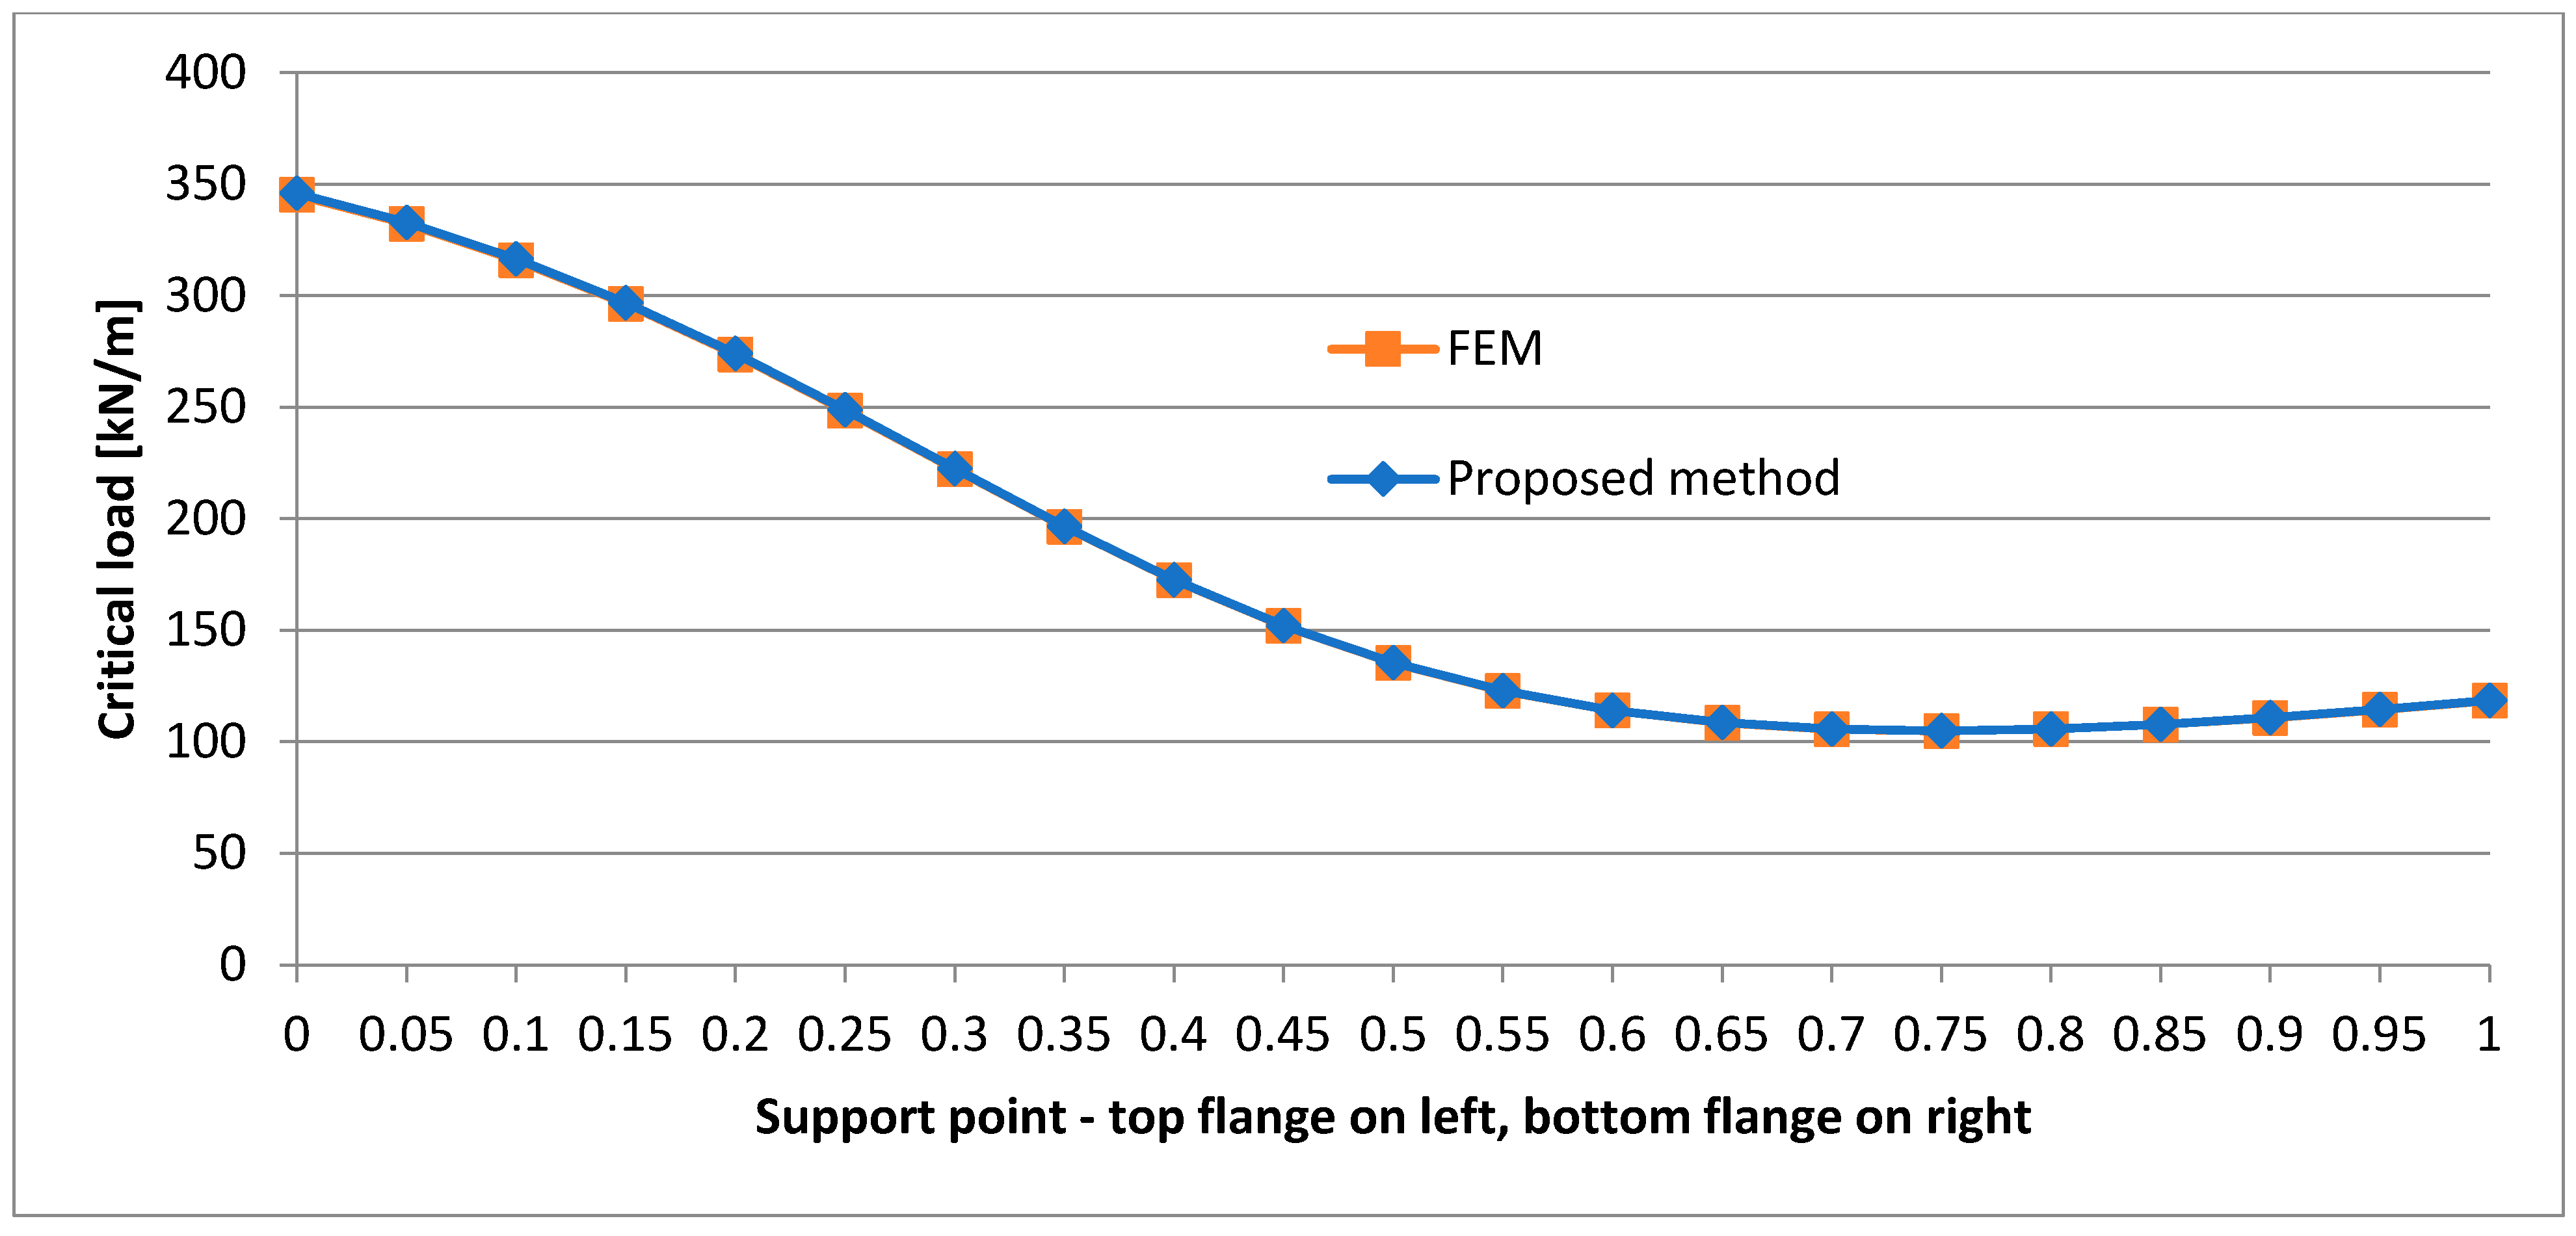
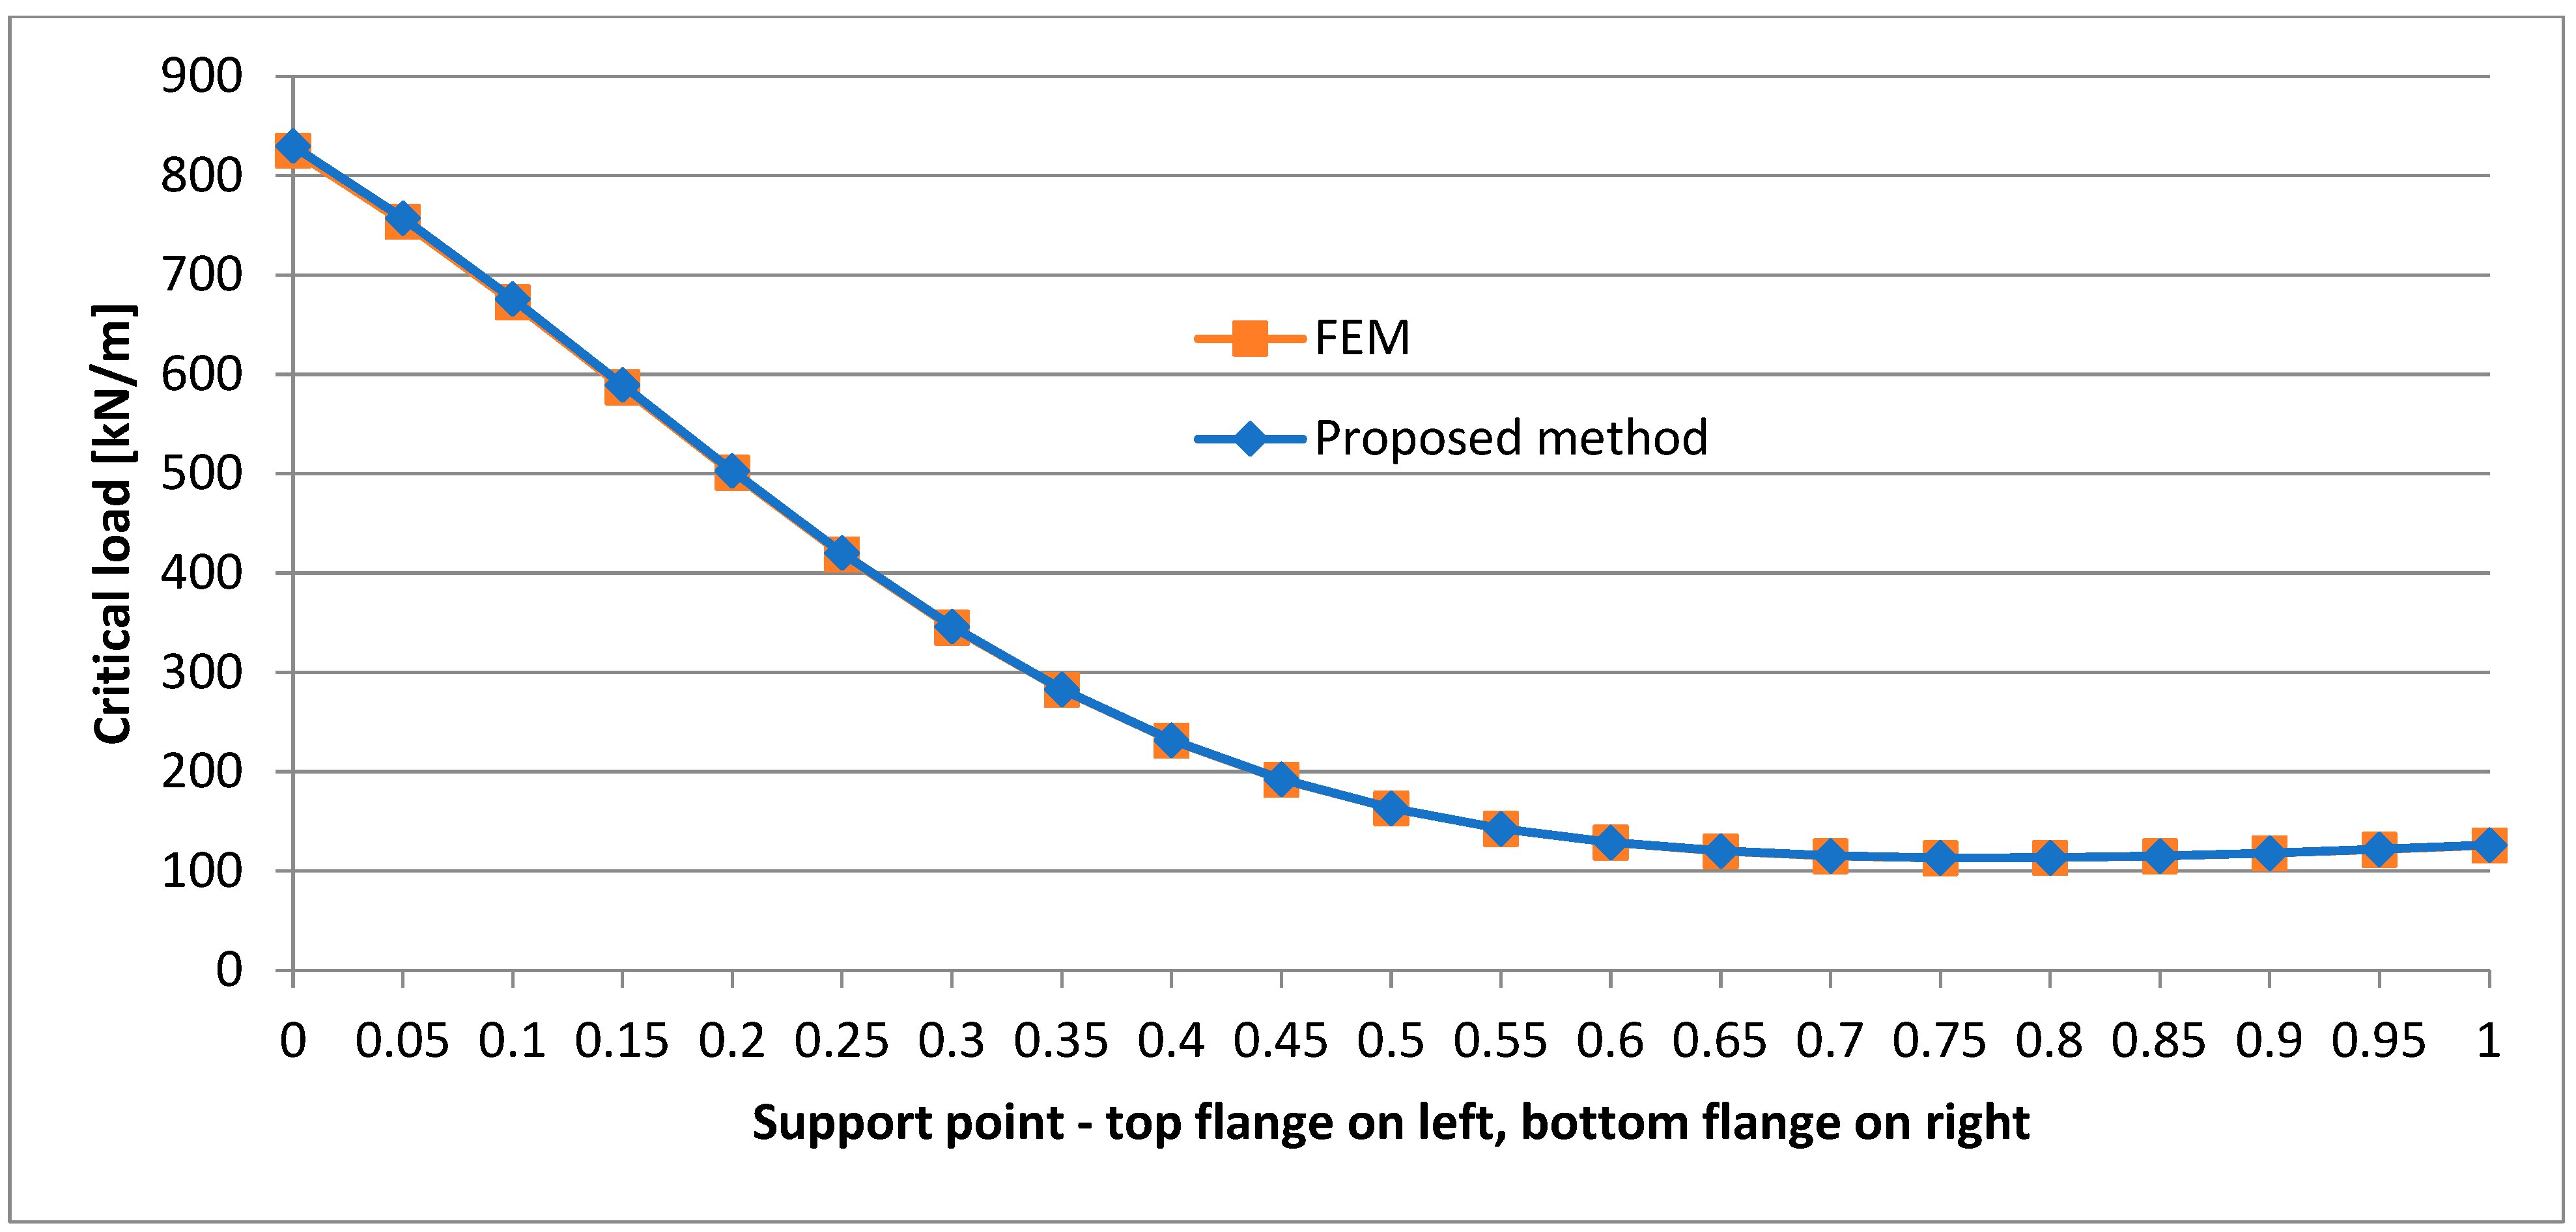
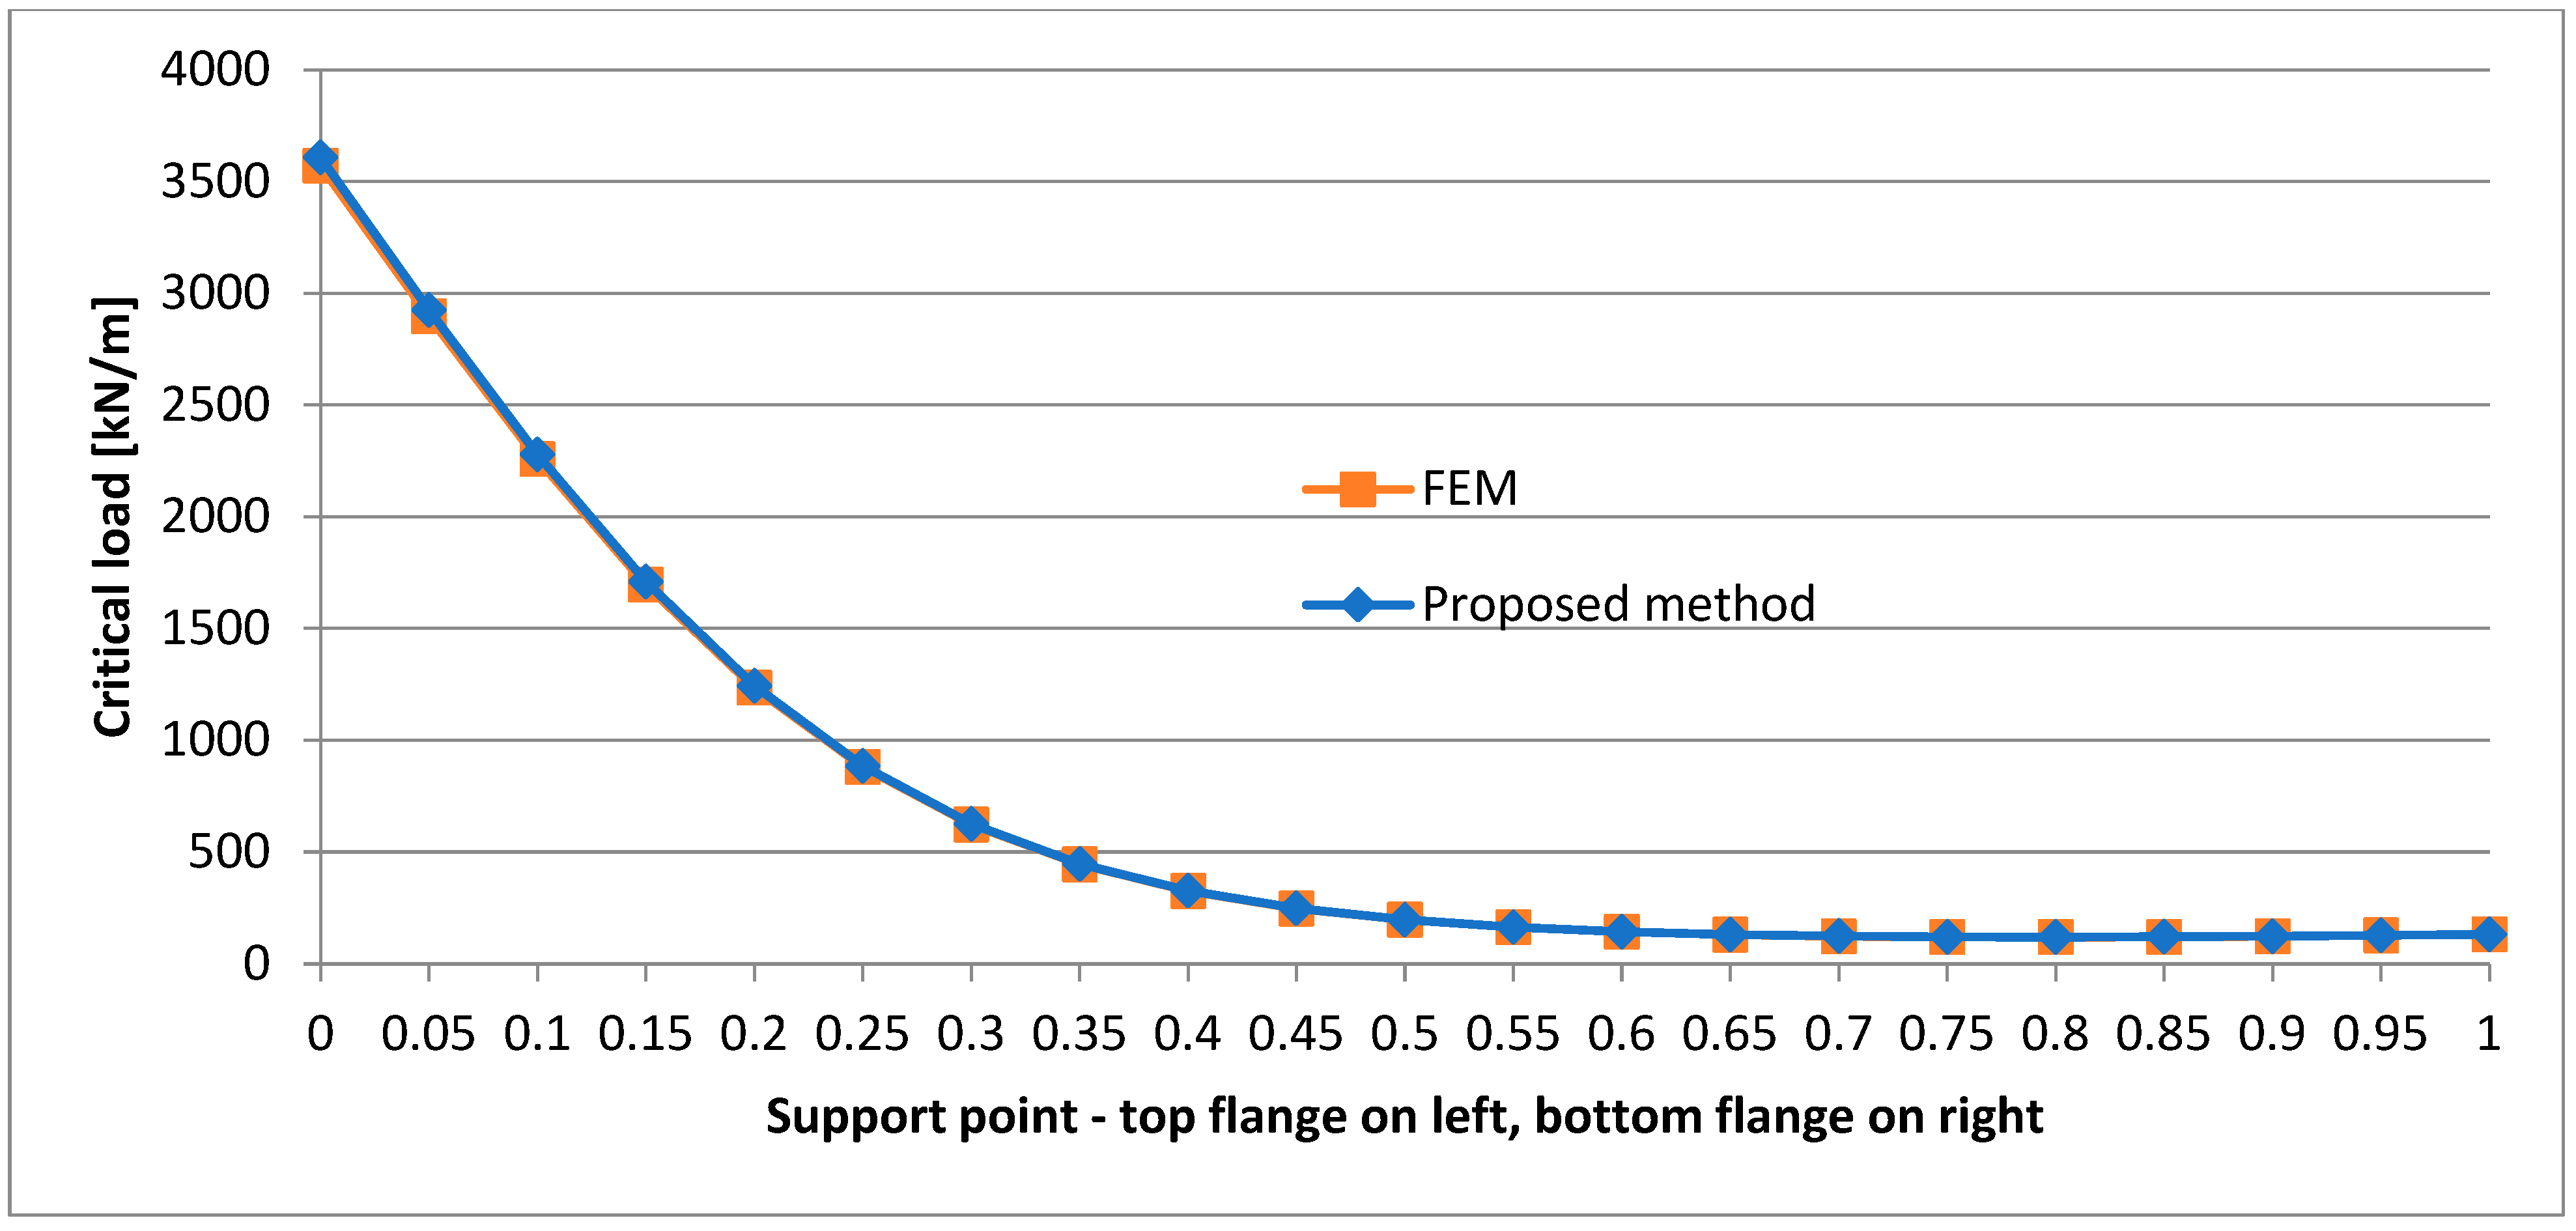
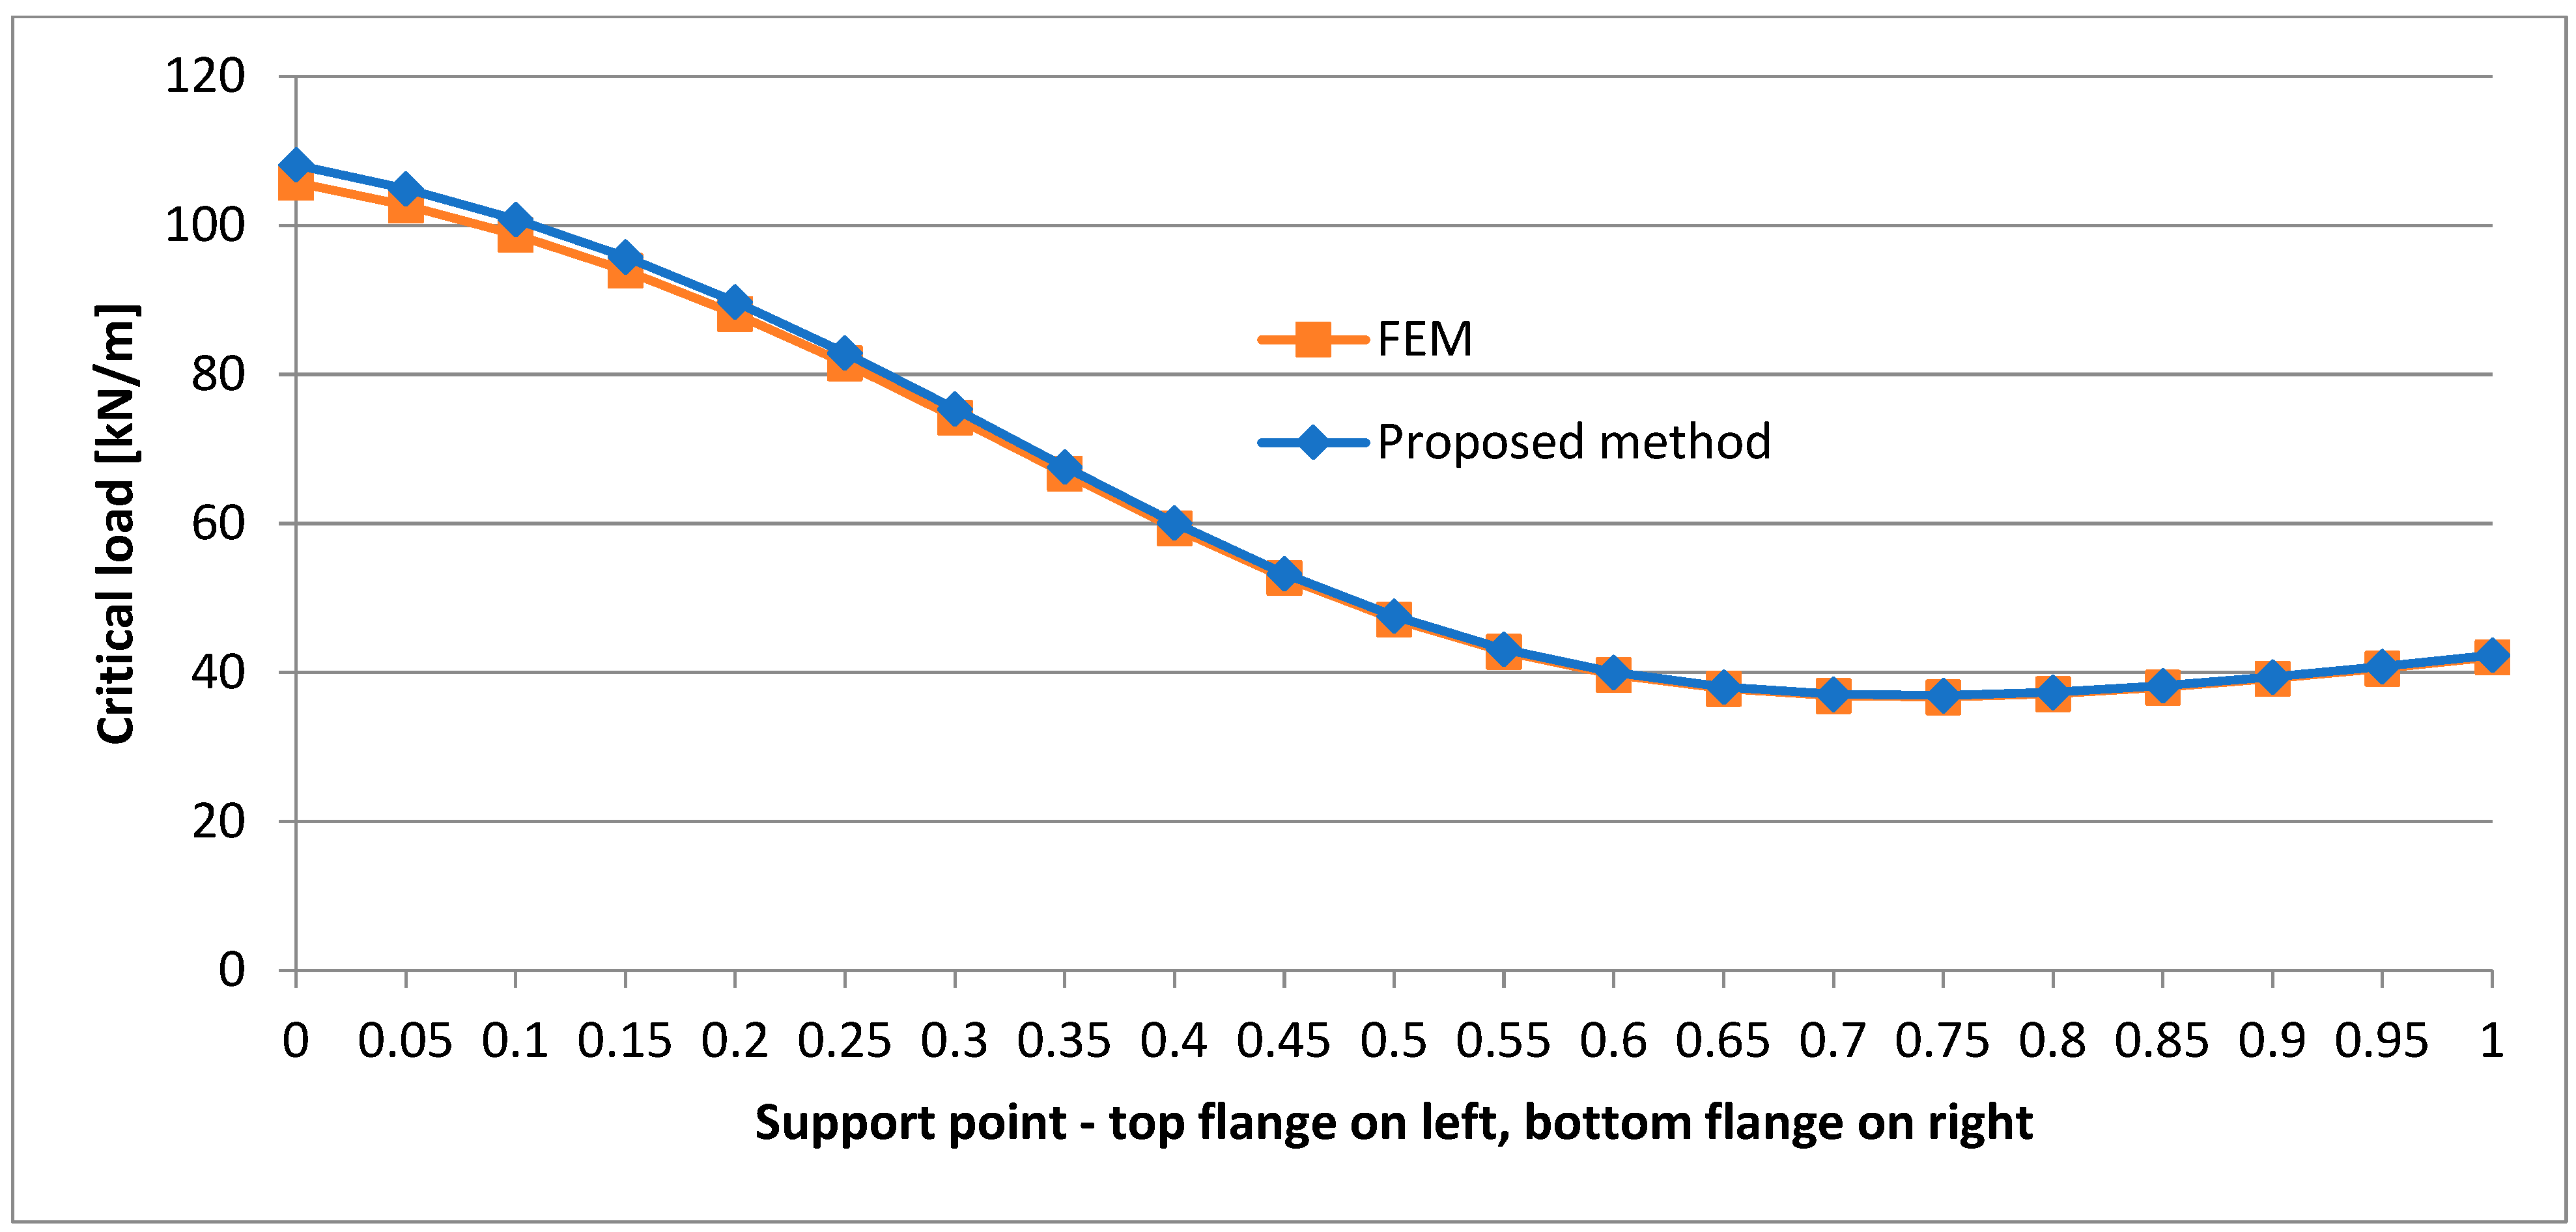
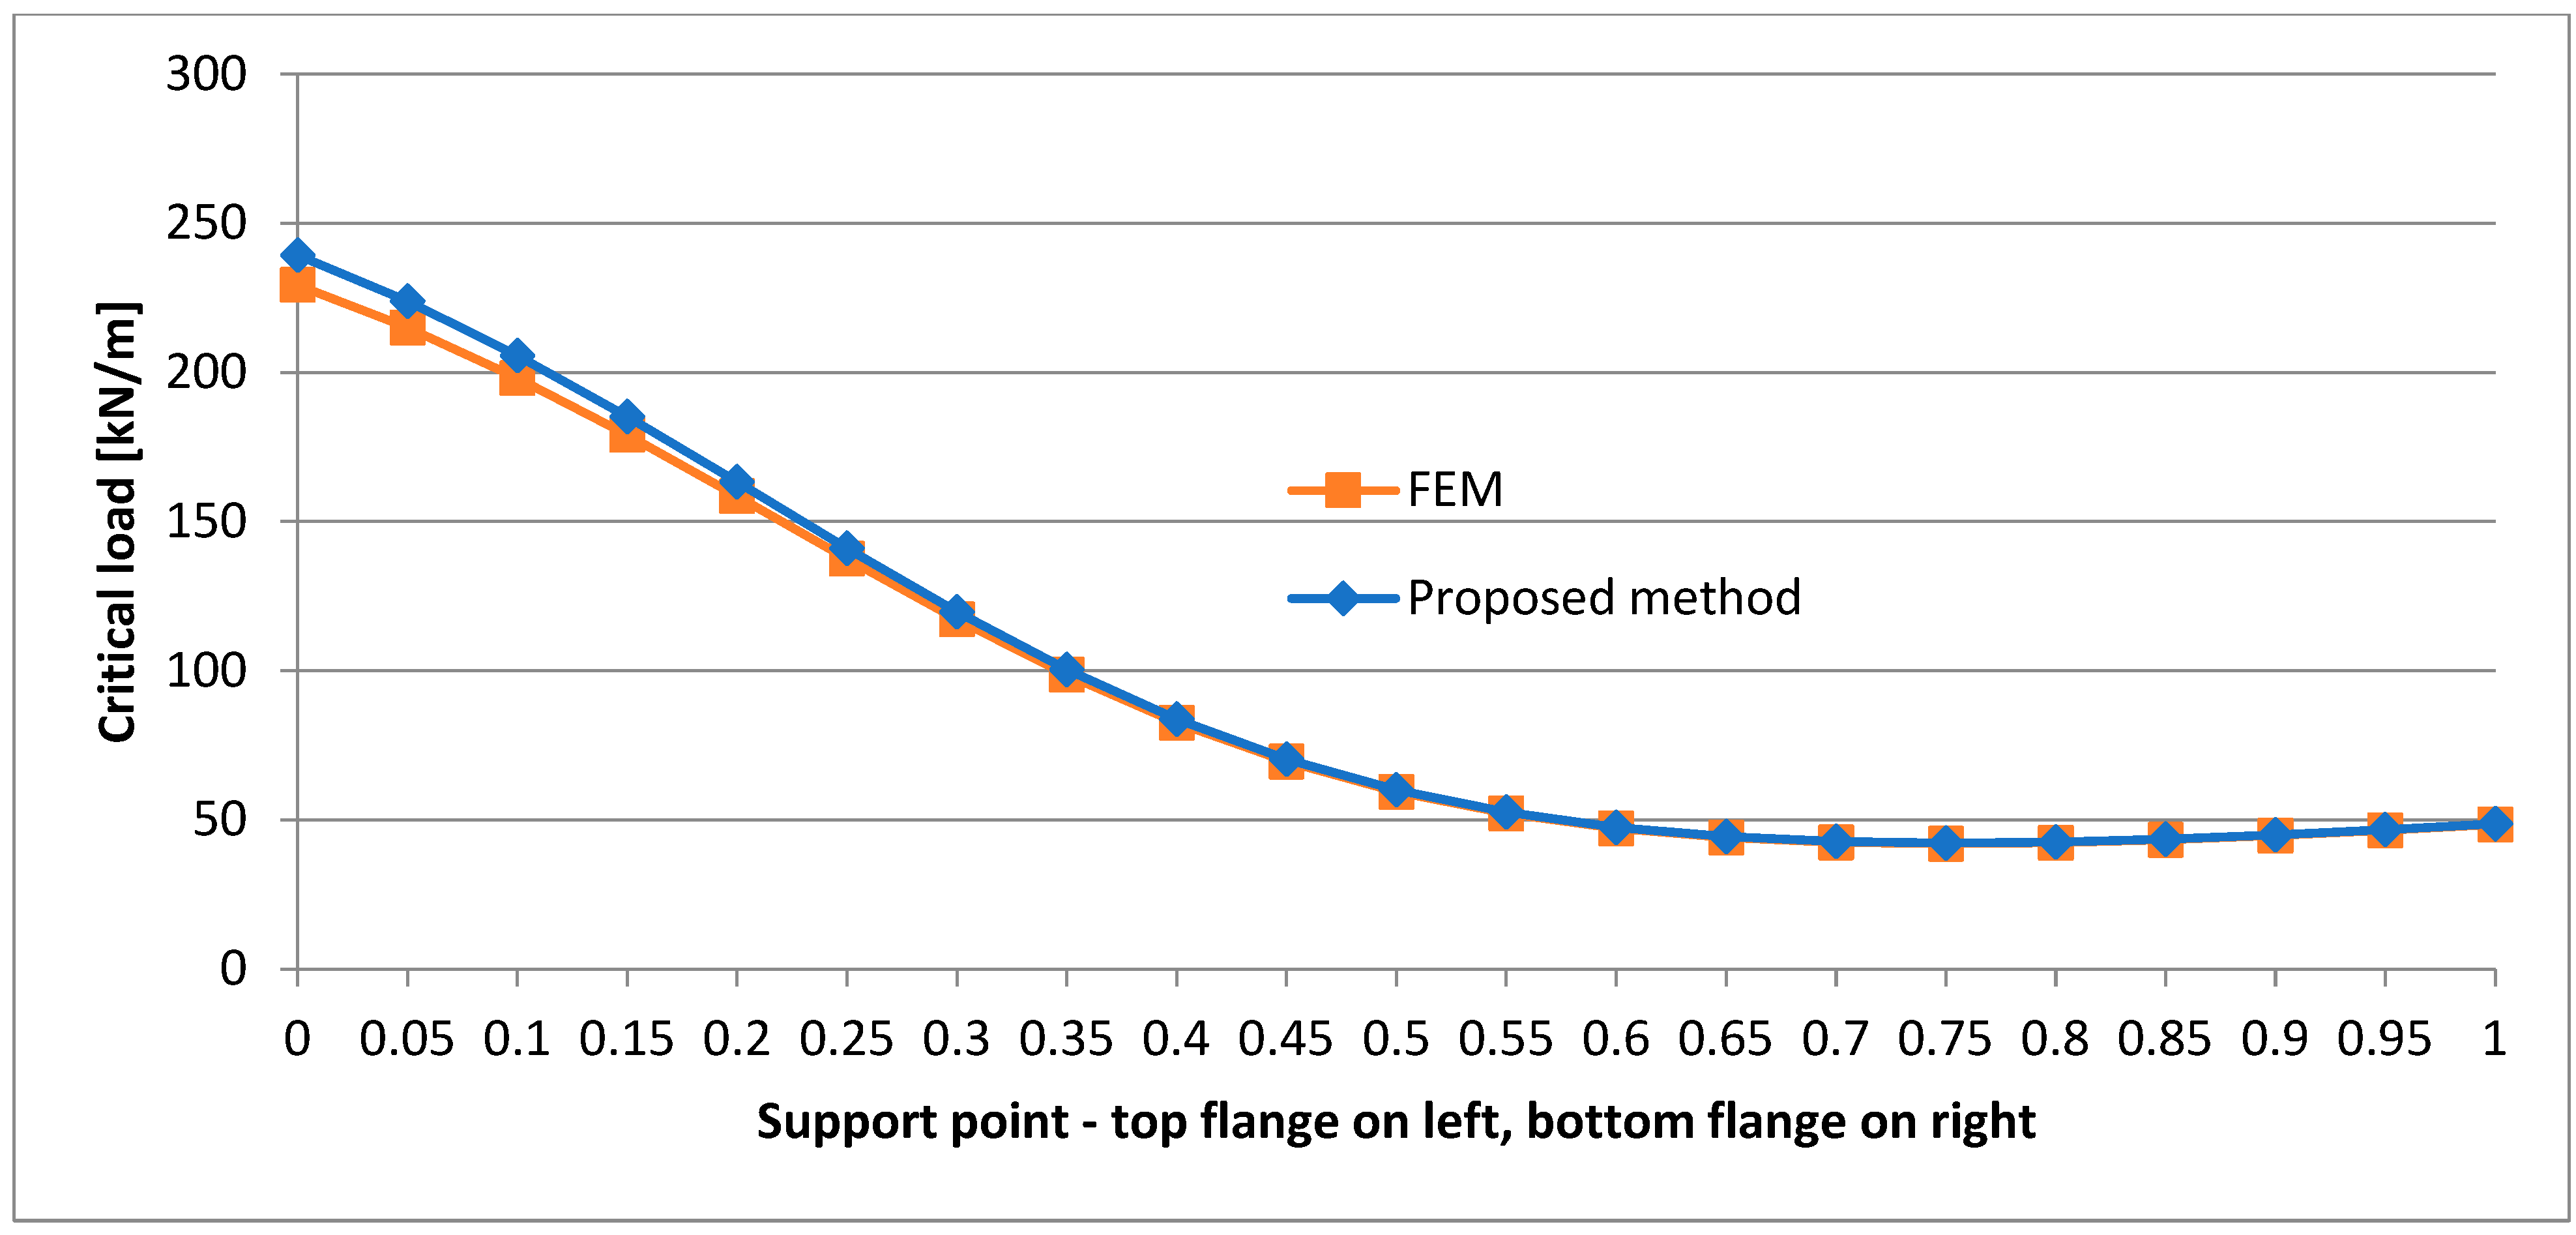
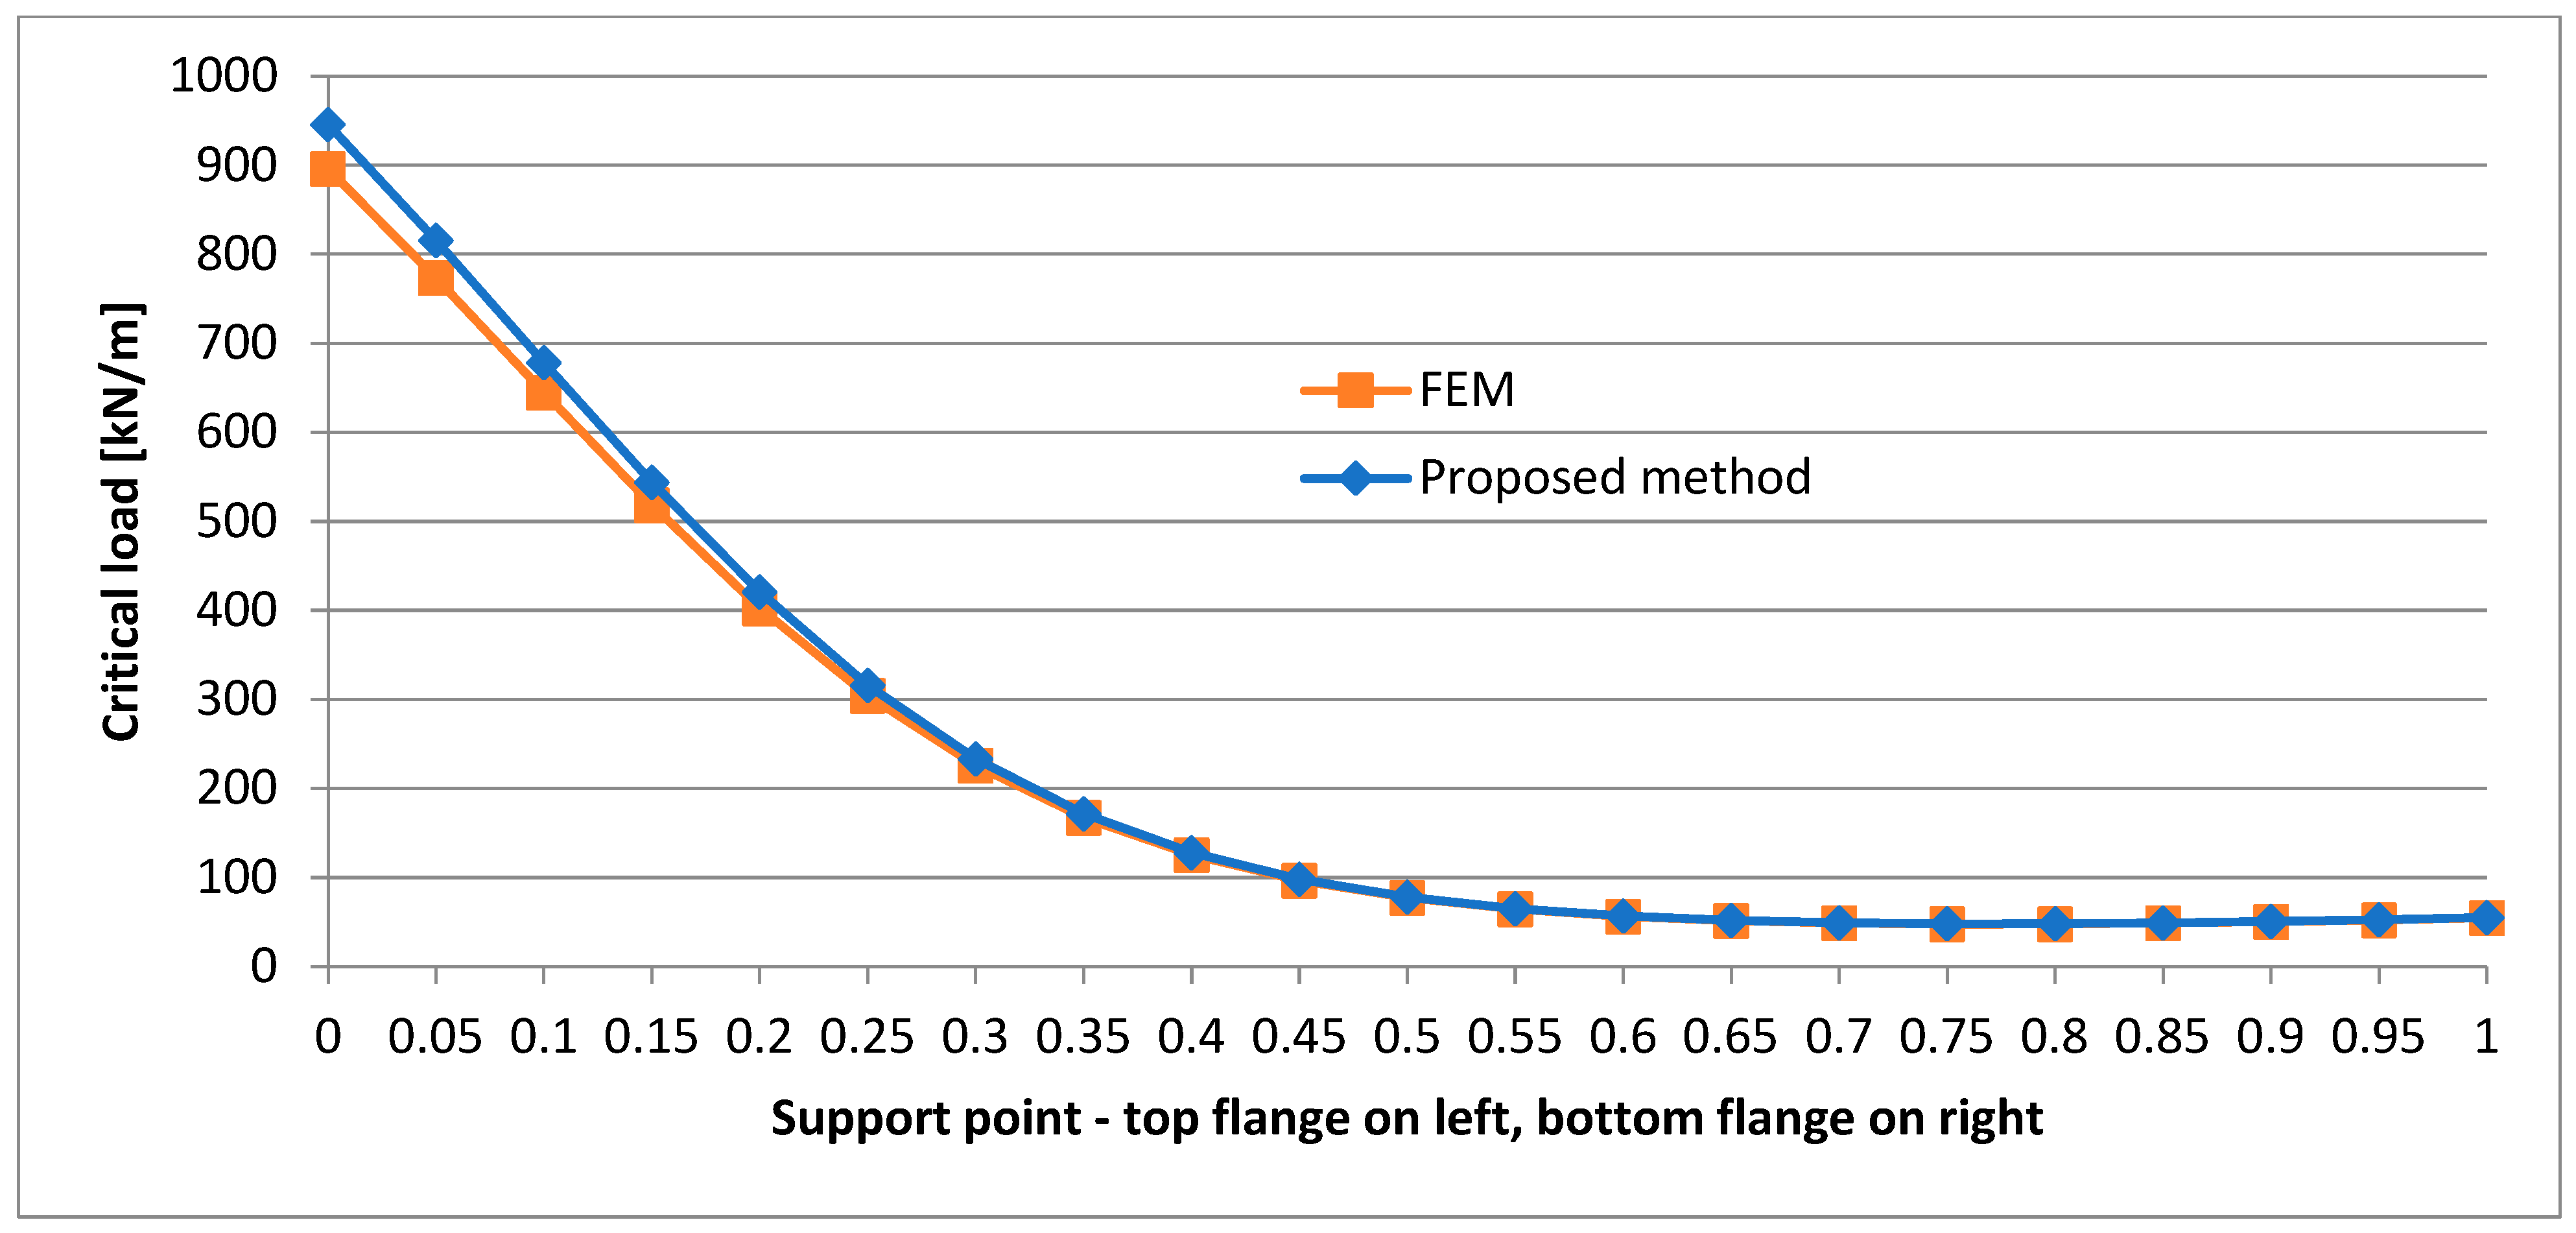
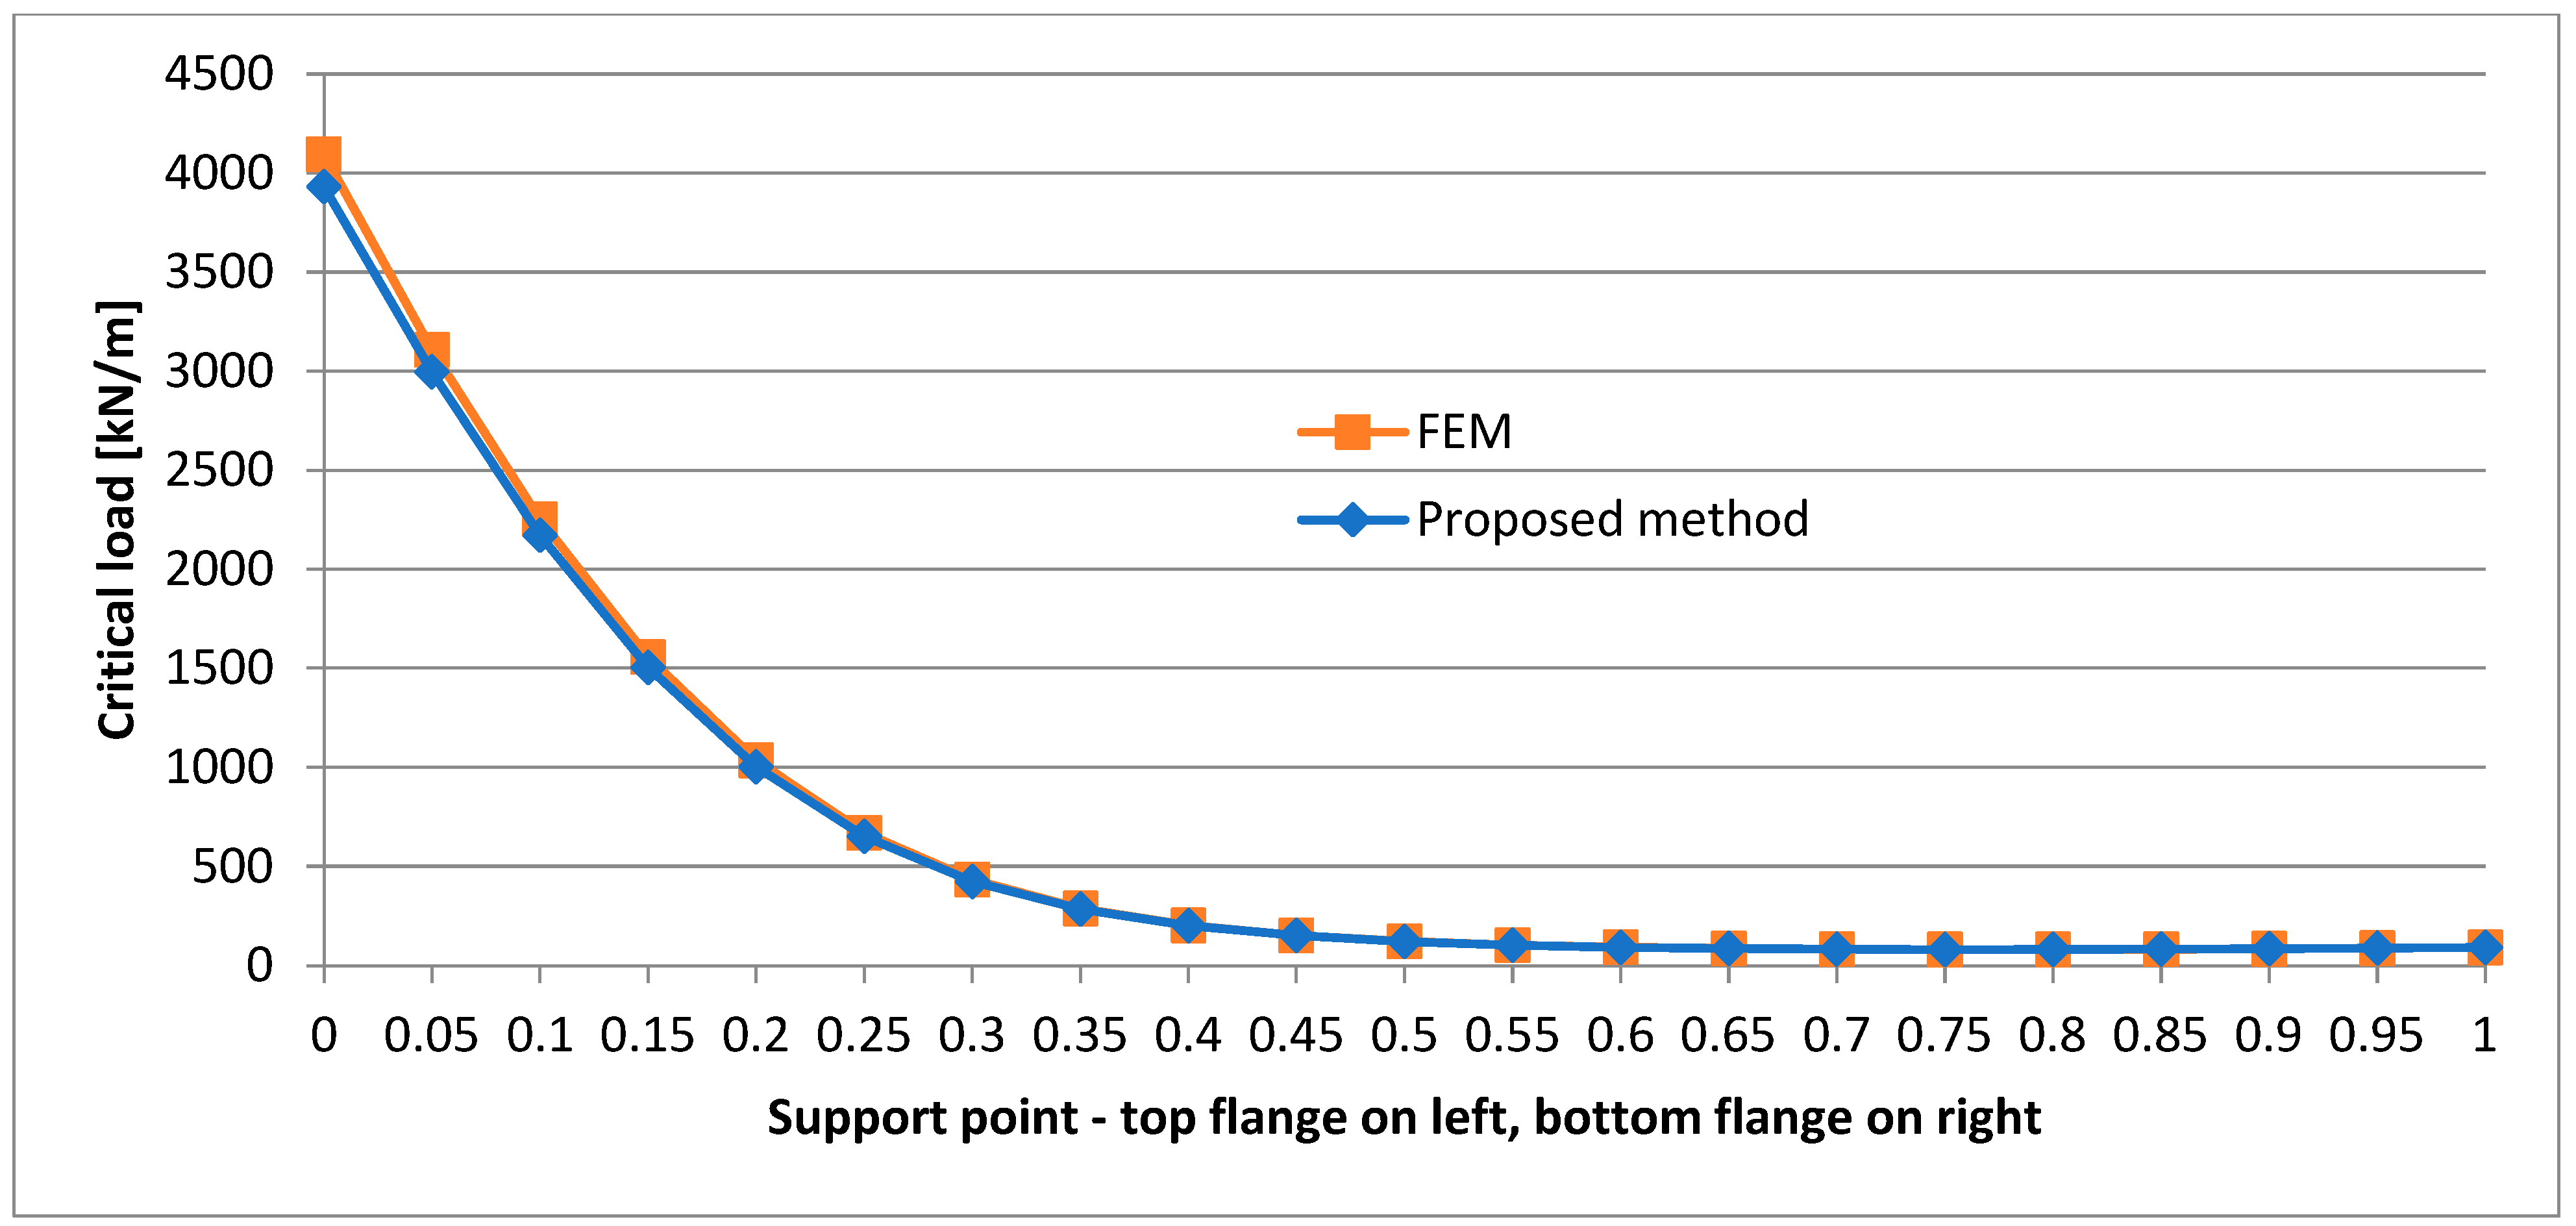
Within the fourth test group, as within the second group, the effect of a change of the support point for fixed load application points was examined. The difference between the two groups consisted in taking into account in this test group the continuous change of the beam support point along the height. Calculations were performed for only prismatic beams, taking into account (as in group 2) three load application points: the centre of the bottom flange, the centre of the web, and the centre of the top flange. The results are presented in Figure 14, Figure 15, Figure 16, Figure 17, Figure 18, Figure 19, Figure 20, Figure 21 and Figure 22.
In order to verify the correctness and effectiveness of the proposed method, besides the calculations performed using this method in all the test groups, critical load values were also determined using the finite element method (FEM) and the commercial Sofistik software. A typical 1D prismatic finite element (the Euler–Bernoulli model) with an additional degree of freedom due to confined torsion was used in the calculations. The element has seven degrees of freedom in each of its nodes. The beam was modelled using prismatic finite elements in which the finite element cross section was identical with the actual beam’s mean cross section in the finite element location. As a result, something like a beam with a stepwise variable cross section was obtained in the FE model. The beam was modelled with 50 finite elements and with 25, 50 and 75 elements when checking the convergence of the solutions.
In order to test the convergence of the solutions obtained using the proposed method and to evaluate the relative changes in the obtained results, the authors carried out an analysis of the influence of approximation base size on the critical load values for selected beams. Beams with convergence parameter p = h ( a ) / h ( a ) = 0.2 were selected for the analysis. It emerges from the authors’ many years of experience that the lower the value of this parameter, the worse the convergence of the solutions. The calculations were performed assuming that each of the sought displacement functions was to be approximated with 10, 15 and 20 Chebyshev series terms. The obtained results are presented in Table 19, Table 20, Table 21, Table 22, Table 23, Table 24, Table 25, Table 26 and Table 27. The tables also contain critical load values (for the same selected systems) determined using FEM for various finite element grids. The results were obtained by dividing the beam into 25, 50 and 75 elements, respectively. The last row in each of Table 19, Table 20, Table 21, Table 22, Table 23, Table 24, Table 25, Table 26 and Table 27 contains relative changes in the critical load value calculated for different approximation base sizes. The relative changes are defined by the formula Err i = q i q 20 / q 20 · 100 % , i = 10 , 15 , for the results obtained by the method proposed in this paper, and by Err i = q 75 q i / q 75 · 100 % , i = 25 , 50 .

6. Analysis of Results

The results reported in the previous section were subjected to further analysis. Adopting the critical force values for the P-P beams as comparative reference values, the critical forces for the C-C beams relative to the critical forces for the P-P beams (the same configuration is compared, but for five different values of the beam taper parameter) are as follows:
  • For beams with a bisymmetric cross section:
    7.24–7.87 times greater when the load acts on the bottom flange;
    4.26–4.55 times greater when the load acts in the centre of the web;
    2.46–2.56 times greater when the load acts on the top flange.
Furthermore, the lower the beam taper coefficient, the higher this ratio.
  • For beams with the “⏊”cross section:
    5.36–5.51 times greater when the load acts on the bottom flange;
    3.09–3.39 times greater when the load acts in the centre of the web;
    2.06–2.20 times greater when the load acts on the top flange.
Furthermore, as the beam taper coefficient value decreased, the critical force initially diminished and then increased.
  • For beams with the “⏉” cross section:
    7.62–9.24 times greater than when the load acts on the bottom flange;
    4.71–5.51 greater when the load acts in the centre of the web;
    2.40–2.62 greater when the load acts on the top flange.
Furthermore, as the beam taper coefficient value decreased, the critical force initially increased and then decreased.
In the case of beams with loading diagram C-F, the ratio of critical forces for the C-F beams to the comparative reference critical forces for the P-P beams are as follows:
  • For beams with a bisymmetric cross section:
    0.56–0.95 when the load acts on the bottom flange;
    0.39–0.78 when the load acts in the centre of the web;
    0.16–0.51 when the load acts on the top flange.
Furthermore, the lower the beam taper coefficient, the higher this ratio.
  • For beams with the “⏊” cross section:
    0.95–1.61 when the load acts on the bottom flange;
    0.59–1.48 when the load acts in the centre of the web;
    0.26–0.94 when the load acts on the top flange.
As in the case of the beams with a bisymmetric cross section, the lower the beam taper coefficient, the higher this ratio.
  • For beams with the “⏉” cross section:
    0.34–0.56 when the load acts on the bottom flange;
    0.28–0.44 when the loads acts in the centre of the web;
    0.15–0.32 when the load acts on the top flange.
As in the case of the beams with a bisymmetric cross section, the lower the beam taper coefficient, the higher this ratio.
The results presented in Table 1, Table 2, Table 3, Table 4, Table 5, Table 6, Table 7, Table 8, Table 9, Table 10, Table 11, Table 12, Table 13, Table 14, Table 15, Table 16, Table 17 and Table 18 also corroborate the fact that the higher the load is applied, the lower the critical load value.
One might intuitively expect that in the case of beams (with a given loading diagram and cross section), as the web taper parameter t p decreases, beam stiffness diminishes, and also the critical load value would decrease. Indeed, this happens for beams with the P-P loading diagram and the C-C loading diagram, whereas the results for the cantilever beam (C-F) are surprising. In this case, for beams with a bisymmetric cross section and with the “⏊” cross section, as taper parameter t p decreases, the critical load value increases, regardless of the load application point. In the case of beams with the “⏉” cross section, an identical relationship occurs when the load is applied above the shear centre of the cross section.
It is interesting to note that the proportions between critical loads N s / N d and N g / N d are preserved, where
  • N d is the critical load value when the load is applied to the bottom flange;
  • N s is the critical load value when the load is applied to the centre of the web;
  • N g is the critical load value when the load is applied to the top flange.
For beams with different web taper coefficients, the (arithmetic) mean µ of the proportions and their standard deviation (from the mean) σ for the beams with taper coefficients t p = 1.0 , 0.8 , 0.6 , 0.4 , 0.2 are presented in Table 19.
The above results show that in the case of the P-P and C-C beams, the proportions are constant and practically independent of the web taper coefficient, whereas a notable effect of the taper coefficient is observed for the C-F cantilever beam.
More information about the character of changes in critical load values depending on the load application point for the P-P prismatic beam and the different beam support points (in the centre of the top flange, in the centre of the web and in the centre of the bottom flange) is supplied in Figure 5, Figure 6, Figure 7, Figure 8, Figure 9, Figure 10, Figure 11, Figure 12 and Figure 13, where the load location shifts from the top flange to the bottom flange. The following was observed for the beams with a bisymmetric cross section and the “⏉” cross section:
  • When the top flange is the support point, the rate of critical load increment increases as the load application point is lowered;
  • When the centre of the web is the support point, the critical load increment is close to a linear increment (the rate of increment is almost constant) as the load application point is lowered;
  • When the bottom flange is the support point, the rate of critical load increment slightly decreases as the load application point is lowered.
The behaviour of the beam with the “⏊” cross section differs from the above observations. In the case of this beam the following can be observed:
  • When the top flange is the support point, the rate of critical load increment increases as the load application point is lowered (as for beams with a bisymmetric cross section and the “⏉” cross section);
  • When the centre of the web is the support point, the rate of critical load increment slightly increases when the load application point is lowered;
  • When the bottom flange is the support point, the critical load increment is close to a linear increment (the rate of increment is almost constant) as the load application point is lowered.
The relationship between the critical load value and the support point for the P-P beams can be traced in Table 28 and Table 29. Assuming the critical load value for the case when the centre of the bottom of the bottom flange is the support point as the comparative reference value, the following ratios were determined: N ^ s / N ^ d , and N ^ g / N ^ d . The ratios show how many times the critical load value will increase when the support points change their location from the bottom flange to the centre of the web and the centre of the top of the top flange, respectively. The symbols in the ratios denote the following:
  • N ^ d is the critical load value when the beam is supported in the centre of the bottom flange;
  • N ^ s is the critical load value when the beam is supported in the centre of the web;
  • N ^ g is the critical load value when the beam is supported in the centre of the top of the top flange.
The calculations showed that for a given configuration (loading diagram + cross section) the influence of the web taper parameter t p is slight. The averages of the ratios and their standard deviation are shown in Table 20. The table also contains results for three load application points: in the centre of the top of the top flange, in the centre of the web, and in the centre of the bottom of the bottom flange. The results show that due to the changes of the support points from the bottom flange to the centre of the web, the critical load value increases
  • 1.162–1.523 times for the beam with a bisymmetric cross section;
  • 1.177–1.539 times for the beam with the “⏊” cross section;
  • 1.027–1.323 times for the beam with the “⏉” cross section.
When the support point is moved from the bottom flange to the centre of the top flange, the critical load increases
  • 3.004–25.946 times for the beam with a bisymmetric cross section;
  • 2.712–16.840 times for the beam with the “⏊” cross section;
  • 2.779–39.170 times for the beam with the “⏉” cross section.
It should be noted that all the values of the lower limits of the critical load increase ranges refer to the cases when the beam was loaded in the centre of the top flange, while all the upper limit values refer to the case when the load was applied in the centre of the bottom flange. The results indicate a strongly linear dependence of the critical load value on the change in the location of beam support points.
This is corroborated by the graphs shown in Figure 14, Figure 15, Figure 16, Figure 17, Figure 18, Figure 19, Figure 20, Figure 21 and Figure 22. The graphs show the relationship between the critical load and a change in the location of support points. The latter shift from the top flange to the bottom flange and apply to the prismatic beam with the P-P loading diagram. A sharp fall in the critical load when the support points shift from the top flange to the centre of the web (more precisely to a point located in its neighbourhood) and small changes in the critical load in the second part of the graph (the support points shift from the centre of the web to the bottom flange) are visible.

7. Conclusions

The following conclusions emerge from the above analyses:
  • The model presented in this paper accurately describes the geometry of the rod and its displacements and, even with a small approximation base, yields accurate results (agreeing with FEM results). The FEM computer programs for the analysis of thin-walled rod structures known to the authors do not contain thin-walled nonprismatic elements. The FEM model is a certain simplification as prismatic finite elements are used to model a nonprismatic system.
  • The location of the load has a significant effect on the critical load value, and the lower the load location, the higher the critical load value.
  • In the case of the P-P beam, a change in the location of the support point along the height of the cross section leads to significant differences in the critical load. This occurs on each load application level. This phenomenon is strongly nonlinear (as the graphs show), and a significant increase in critical load is observed for support points located above the centre of the web. In such a beam, a considerable axial tension force is generated. The force acts eccentrically, stabilizing the beam and preventing its warping. In the case of a structure capable of transmitting such a considerable horizontal support reaction, this can significantly increase the load bearing capacity of the beam with no need to change its cross section. In some cases, this can be a solution for increasing the critical load capacity of existing buildings through a slight intervention in their structure.
  • One can notice that in the case of the I-beam with a smaller top flange, FEM yields a slightly lower critical load value than the method presented in this paper, whereas in the case of the cross section with a smaller bottom flange it is the other way round.
  • The support of the P-P beam on the top flange level results in a strongly nonlinear character of the change in critical load when the load shifts along the whole depth of the beam.
  • In the case of the P-P beam, the lowest critical load value is obtained when the beam is supported at one fourth of the web’s depth.

Author Contributions

Writing—original draft, J.S. and P.R. All authors have read and agreed to the published version of the manuscript.

Funding

This research received no external funding.

Institutional Review Board Statement

Not applicable.

Informed Consent Statement

Not applicable.

Data Availability Statement

Dataset available on request from the authors. The raw data supporting the conclusions of this article will be made available by the authors on request.

Conflicts of Interest

The authors declare no conflicts of interest.

References

  1. Nguyen, N.D.; Nguyen, T.K.; Vo, T.P.; Nguyen, T.N.; Lee, S. Vibration and buckling behaviours of thin-walled composite and functionally graded sandwich I-beams. Compos. Part B Eng. 2019, 166, 414–427. [Google Scholar] [CrossRef]
  2. Andrade, A.; Camotim, D. Lateral-torsional buckling of singly symmetric tapered beams: Theory and applications. J. Eng. Mech. 2005, 131, 586–597. [Google Scholar] [CrossRef]
  3. Benyamina, A.B.; Meftah, S.A.; Mohri, F.; Daya, E.M. Analytical solutions attempt for lateral torsional buckling of doubly symmetric web-tapered I-beams. Eng. Struct. 2013, 56, 1207–1219. [Google Scholar] [CrossRef]
  4. Andrade, A.; Camotim, D.; Dinis, P.B. Lateral-torsional buckling of singly symmetric web-tapered thin-walled I-beams: 1D model vs. shell FEA. Comput. Struct. 2007, 85, 1343–1359. [Google Scholar] [CrossRef]
  5. Asgarian, B.; Soltani, M.; Mohri, F. Lateral-torsional buckling of tapered thin-walled beams with arbitrary cross-sections. Thin-Walled Struct. 2013, 62, 96–108. [Google Scholar] [CrossRef]
  6. Branford, M.A. Inelastic buckling of tapered monosymmetric I-beams. Eng. Struct. 1989, 11, 119–126. [Google Scholar] [CrossRef]
  7. Challamel, N.; Andrade, A.; Camotim, D. An analytical study on the lateral-torsional buckling of linearly tapered cantilever strip beams. Int. J. Struct. Stab. Dyn. 2007, 7, 441–456. [Google Scholar] [CrossRef]
  8. Gupta, P.; Wang, S.T.; Blandford, G.E. Lateral-torsional buckling of nonprismatic I-beams. J. Struct. Eng. 1996, 122, 748–755. [Google Scholar] [CrossRef]
  9. Kitipornchai, S.; Trahair, N.S. Elastic stability of tapered I-beams. J. Struct. Div. 1972, 98, 713–728. [Google Scholar] [CrossRef]
  10. Kitipornchai, S.; Trahair, N.S. Elastic behavior of tapered monosymmetric I-beams. J. Struct. Div. 1975, 101, 1661–1678. [Google Scholar] [CrossRef]
  11. Kuś, J. Stability of Beams with Tapered Cross Sections. Doctoral Dissertation, Opole University of Technology, Opole, Poland, 2012. (In Polish). [Google Scholar]
  12. Kuś, J. Lateral-torsional buckling steel beams with simultaneously tapered flanges and web. Steel Compos. Struct. 2015, 19, 897–916. [Google Scholar] [CrossRef]
  13. Kuś, J. Critical moments in the lateral torsional buckling of steel I-beams with linearly variable web depth and flange width. Sci. Pap. Rzesz. Univ. Technol. Constr. Environ. Eng. 2012, 59, 217–224. (In Polish) [Google Scholar]
  14. Mohri, F.; Brouki, A.; Roth, J.C. Theoretical and numerical stability analyses of unrestrained, mono-symmetric thin-walled beams. J. Constr. Steel Res. 2003, 59, 63–90. [Google Scholar] [CrossRef]
  15. Osmani, A.; Meftah, S.A. Lateral buckling of tapered thin walled bi-symmetric beams under combined axial and bending loads with shear deformations allowed. Eng. Struct. 2018, 165, 76–87. [Google Scholar] [CrossRef]
  16. Polyzois, D.; Raftoyiannis, I.G. Lateral-torsional stability of steel web-tapered I-beams. J. Struct. Eng. 1998, 124, 1208–1216. [Google Scholar] [CrossRef]
  17. Raftoyiannis, I.G.; Adamakos, T. Critical Lateral-Torsional Buckling Moments of Steel Web-Tapered I-beams. Open Constr. Build. Technol. J. 2010, 4, 105–112. [Google Scholar] [CrossRef]
  18. Rezaiee-Pajand, M.; Masoodi, A.R.; Alepaighamrod, A. Lateral-torsional buckling of functionally graded tapered I-beams considering lateral bracing. Steel Compos. Struct. 2018, 28, 403–414. [Google Scholar] [CrossRef]
  19. Soltani, M. A novel approach for lateral buckling assessment of double tapered thin-walled laminated composite I-beams. Mech. Adv. Compos. Struct. 2022, 9, 11–23. [Google Scholar] [CrossRef]
  20. Soltani, M.; Asgarian, B. Exact stiffness matrices for lateral–torsional buckling of doubly symmetric tapered beams with axially varying material properties. Iran. J. Sci. Technol. Trans. Civ. Eng. 2021, 45, 589–609. [Google Scholar] [CrossRef]
  21. Soltani, M.; Asgarian, B. Lateral-torsional stability analysis of a simply supported axially functionally graded beam with a tapered I-section. Mech. Compos. Mater. 2020, 56, 39–54. [Google Scholar] [CrossRef]
  22. Soltani, M.; Asgarian, B.; Mohri, F. Improved finite element model for lateral stability analysis of axially functionally graded nonprismatic I-beams. Int. J. Struct. Stab. Dyn. 2019, 19, 1950108. [Google Scholar] [CrossRef]
  23. Soltani, M.; Gharebaghi, S.A.; Mohri, F. Lateral stability analysis of steel tapered thin-walled beams under various boundary conditions. J. Numer. Methods Civ. Eng. 2018, 3, 13–25. [Google Scholar] [CrossRef]
  24. Zhang, L.; Tong, G.S. Lateral buckling of web-tapered I-beams: A new theory. J. Constr. Steel Res. 2008, 64, 1379–1393. [Google Scholar] [CrossRef]
  25. Giżejowski, M. The lateral torsional buckling of steel beams with limited ability to rotate on their supports. Eng. Constr. 2001, 10, 589–594. (In Polish) [Google Scholar]
  26. Kim, S.B.; Kim, M.Y. Improved formulation for spatial stability and free vibration of thin-walled tapered beams and space frame. Eng. Struct. 2000, 22, 446–458. [Google Scholar] [CrossRef]
  27. Nguyen, T.T.; Thang, P.T.; Lee, J. Flexural-torsional stability of thin-walled functionally graded open-section beams. Thin-Walled Struct. 2017, 110, 88–96. [Google Scholar] [CrossRef]
  28. Nguyen, T.T.; Thang, P.T.; Lee, J. Lateral buckling analysis of thin-walled functionally graded open-section beams. Compos. Struct. 2017, 160, 952–963. [Google Scholar] [CrossRef]
  29. Pasquino, M.; Marotti de Sciarra, F. Buckling of thin-walled beams with open and generically variable section. Comput. Struct. 1992, 44, 843–849. [Google Scholar] [CrossRef]
  30. Soltani, M.; Atoufi, F.; Mohri, F.; Dimitri, R. Nonlocal elasticity theory for lateral stability analysis of tapered thin-walled nanobeams with axially varying materials. Thin-Walled Struct. 2021, 159, 107268. [Google Scholar] [CrossRef]
  31. Soltani, M.; Atoufi, F.; Mohri, F.; Dimitri, R.; Tornabene, F. Nonlocal analysis of the flexural-torsional stability for FG tapered thin-walled beam-columns. Nanomaterials 2021, 11, 1936. [Google Scholar] [CrossRef]
  32. Yang, Y.B.; Yau, J.D. Stability of beams with tapered I-sections. J. Eng. Mech. 1987, 113, 1337–1357. [Google Scholar] [CrossRef]
  33. Latalski, J.; Zulli, D. Generalized Beam Theory for Thin-Walled Beams with Curvilinear Open Cross-Sections. Appl. Sci. 2020, 10, 7802. [Google Scholar] [CrossRef]
  34. Iandiorio, C.; Salvini, P. A geometrically nonlinear shell theory for thin-walled tubes and beams subjected to large displacements and cross-section deformation. Thin-Walled Struct. 2025, 216, 113583. [Google Scholar] [CrossRef]
  35. Ruta, P. Application of Chebyshev series to solution of non-prismatic beam vibration problems. J. Sound Vib. 1999, 227, 449–467. [Google Scholar] [CrossRef]
  36. Ruta, P. Dynamic stability problem of non-prismatic rod. J. Sound Vib. 2002, 250, 445–464. [Google Scholar] [CrossRef]
  37. Ruta, P.; Szybiński, J. Lateral stability of bending non-prismatic thin-walled beams using orthogonal series. Procedia Eng. 2015, 111, 694–701. [Google Scholar] [CrossRef]
  38. Szybiński, J.; Ruta, P. An analysis of the effect of a change in the support point location on the vibration of thin-walled beams. Int. J. Struct. Stab. Dyn. 2021, 21, 2150125. [Google Scholar] [CrossRef]
  39. Szybiński, J.; Ruta, P. Analysis of thin-walled beams with variable monosymmetric cross section by means of Legendre polynomials. Stud. Geotech. Et Mech. 2019, 41, 1–12. [Google Scholar] [CrossRef]
  40. Szybiński, J.; Ruta, P. Effect of a “slight” curvature of the axis of a thin-walled nonprismatic beam on its free vibration. Int. J. Struct. Stab. Dyn. 2022, 22, 2250041. [Google Scholar] [CrossRef]
  41. Wilde, P. The torsion of thin-walled rods with variable cross-section. Arch. Mech. 1968, 4, 431–443. [Google Scholar]
  42. Lewanowicz, S. Construction of a recurrence relation of the lowest order for coefficients of the Gegenbauer series. Appl. Math. 1976, 15, 345–396. [Google Scholar] [CrossRef]
  43. Paszkowski, S. The Numerical Application of Chebyshev Polynomials and Series; Polish Scientific Publishers: Warsaw, Poland, 1975. (In Polish) [Google Scholar]
  44. Wolfram. Mathematica 12. Wolfram Research ©Copyright 1988–2019. Available online: https://www.wolfram.com/mathematica/ (accessed on 2 September 2025).
Figure 1. Coordinate system and local basis vectors for a thin-walled nonprismatic beam.
Applsci 15 10774 g001
Figure 2. Description of cross section displacements.
Applsci 15 10774 g002
Figure 3. Cross sections of analysed beams.
Applsci 15 10774 g003
Figure 4. Analysed static beam schemes: P-P, C-C, C-F.
Applsci 15 10774 g004
Figure 5. Bisymmetric I-beam: support on top flange.
Applsci 15 10774 g005
Figure 6. Bisymmetric I-beam: support in centre of web.
Applsci 15 10774 g006
Figure 7. Bisymmetric I-beam: support under bottom flange.
Applsci 15 10774 g007
Figure 8. Monosymmetric I-beam “⏊”: support on top flange.
Applsci 15 10774 g008
Figure 9. Monosymmetric I-beam “⏊”: support in centre of web.
Applsci 15 10774 g009
Figure 10. Monosymmetric I-beam “⏊”: support under bottom flange.
Applsci 15 10774 g010
Figure 11. Monosymmetric I-beam “⏉”: support on top flange.
Applsci 15 10774 g011
Figure 12. Monosymmetric I-beam “⏉”: support in centre of web.
Applsci 15 10774 g012
Figure 13. Monosymmetric I-beam “⏉”: support under bottom flange.
Applsci 15 10774 g013
Figure 14. Bisymmetric I-beam: load on top flange.
Applsci 15 10774 g014
Figure 15. Bisymmetric I-beam: load in centre of web.
Applsci 15 10774 g015
Figure 16. Bisymmetric I-beam: load under bottom flange.
Applsci 15 10774 g016
Figure 17. Monosymmetric I-beam “⏊”: load on top flange.
Applsci 15 10774 g017
Figure 18. Monosymmetric I-beam “⏊”: load in centre of web.
Applsci 15 10774 g018
Figure 19. Monosymmetric I-beam “⏊”: load under bottom flange.
Applsci 15 10774 g019
Figure 20. Monosymmetric I-beam “⏉”: load on top flange.
Applsci 15 10774 g020
Figure 21. Monosymmetric I-beam “⏉”: load in centre of web.
Applsci 15 10774 g021
Figure 22. Monosymmetric I-beam “⏉”: load under bottom flange.
Applsci 15 10774 g022
Table 1. Changes in load location: pinned-pinned bisymmetric I-beam.
Taper ParameterProposed Method—Load Application Points [kN/m]FEM—Load Application Points [kN/m]
Bottom FlangeCentre of the WebTop FlangeBottom FlangeCentre of the WebTop Flange
1.0196.97163.33135.41196.74163.17135.30
0.8178.44148.11122.91177.92147.70122.59
0.6159.81132.79110.31158.26131.49109.22
0.4140.98117.3197.59137.34114.1994.91
0.2121.75101.5684.69114.3295.0579.00
Table 2. Changes in load location: clamped-clamped bisymmetric I-beam.
Taper ParameterProposed Method—Load Application Points [kN/m]FEM—Load Application Points [kN/m]
Bottom FlangeCentre of the WebTop FlangeBottom FlangeCentre of the WebTop Flange
1.01425.94695.36333.531412.50691.15332.77
0.81292.40631.77303.661277.97626.72302.36
0.61167.26570.72274.041146.45561.85270.66
0.41053.37513.24244.891019.22496.30237.06
0.2958.45462.12216.92901.96430.24200.24
Table 3. Changes in load location: bisymmetric cantilever I-beam.
Taper ParameterProposed Method—Load Application Points [kN/m]FEM—Load Application Points [kN/m]
Bottom FlangeCentre of the WebTop FlangeBottom FlangeCentre of the WebTop Flange
1.0110.3363.8821.14110.3763.7921.14
0.8111.9266.2622.43104.3462.4523.09
0.6113.5169.5825.2797.9461.0325.65
0.4114.9273.9231.1091.0759.5129.07
0.2115.8679.2243.1683.4857.8633.65
Table 4. Changes in load location: pinned-pinned monosymmetric I-beam (smaller top flange).
Taper ParameterProposed Method—Load Application Points [kN/m]FEM—Load Application Points [kN/m]
Bottom FlangeShear CentreCentre of GravityCentre of the WebTop FlangeBottom FlangeShear CentreCentre of GravityCentre of the WebTop Flange
1.078.1370.7161.4960.0547.5677.2469.9360.8659.4547.15
0.872.6965.7557.2855.8644.2471.6264.8356.5355.1343.73
0.667.6361.1353.3651.9441.1065.8959.6052.0850.7040.21
0.463.3057.1449.9748.5138.3260.0854.2847.5546.1836.59
0.260.7154.6847.8846.2936.3954.5449.1643.1541.7733.00
Table 5. Changes in load location: clamped-clamped monosymmetric I-beam (smaller top flange).
Taper ParameterProposed Method—Load Application Points [kN/m]FEM—load application points [kN/m]
Bottom FlangeShear CentreCentre of GravityCentre of the WebTop FlangeBottom FlangeShear CentreCentre of GravityCentre of the WebTop Flange
1.0427.09316.43200.47185.9797.94412.29304.93193.97180.1596.00
0.8392.49291.84187.01172.7291.13378.22280.62180.47166.8989.12
0.6362.33270.92175.96161.6085.11347.20258.71168.39154.8782.59
0.4339.54256.18169.26154.2980.56321.53241.10159.16145.2776.85
0.2334.59256.61174.04156.9479.89309.88235.11158.21142.7273.52
Table 6. Changes in load location: monosymmetric cantilever I-beam (smaller top flange).
Taper ParameterProposed Method—Load Application Points [kN/m]FEM—Load Application Points [kN/m]
Bottom FlangeShear CentreCentre of GravityCentre of the WebTop FlangeBottom FlangeShear CentreCentre of GravityCentre of the WebTop Flange
1.074.5663.8940.0835.6712.2174.4662.9938.3334.0111.86
0.880.0569.6946.6241.3514.1071.3160.9540.1235.8613.39
0.685.9576.0154.7448.8917.2568.0458.8541.9137.8615.56
0.492.0282.5364.1158.2022.9164.6056.6843.5739.9518.79
0.297.7188.6273.5868.6234.2860.9654.4144.9642.0223.77
Table 7. Changes in load location: pinned-pinned monosymmetric I-beam (smaller bottom flange).
Taper ParameterProposed Method—Load Application Points [kN/m]FEM—Load Application Points [kN/m]
Bottom FlangeCentre of the WebCentre of GravityShear CentreTop FlangeBottom FlangeCentre of the WebCentre of GravityShear CentreTop Flange
1.0120.99104.51102.9393.9687.93121.42104.99103.4294.4688.43
0.8108.5794.1592.6784.8979.56108.8394.4893.0185.2579.93
0.695.9383.5882.2375.6471.0095.7183.4982.1575.6271.02
0.482.8772.6771.4566.0762.1781.7671.7970.6065.3561.52
0.268.7660.9559.9255.8552.7466.2258.7657.7753.9050.94
Table 8. Changes in load location: clamped-clamped monosymmetric I-beam (smaller bottom flange).
Taper ParameterProposed Method—Load Application Points [kN/m]FEM—Load Application Points [kN/m]
Bottom FlangeCentre of the WebCentre of GravityShear CentreTop FlangeBottom FlangeCentre of the WebCentre of GravityShear CentreTop Flange
1.01117.93574.95530.35321.42228.581127.56588.78543.95331.62235.65
0.81005.83518.46476.05291.91208.341013.21531.26488.65301.45214.95
0.6883.68455.74416.22258.49185.49885.09467.21427.62267.37191.58
0.4736.76382.76347.55219.55159.10730.89392.39357.34227.34164.22
0.2524.28287.12260.23170.51126.58520.49294.89267.97176.11129.70
Table 9. Changes in load location: monosymmetric cantilever I-beam (smaller bottom flange).
Taper ParameterProposed Method—Load Application Points [kN/m]FEM—Load Application Points [kN/m]
Bottom FlangeCentre of the WebCentre of GravityShear CentreTop FlangeBottom FlangeCentre of the WebCentre of GravityShear CentreTop Flange
1.040.5929.4127.7717.9913.2441.0930.0328.4318.5913.63
0.840.1328.6226.8717.9213.4838.9328.3626.8018.5014.03
0.639.7027.8626.0318.1614.0636.6226.6625.1818.3914.48
0.439.2327.2125.4218.8215.1234.0824.9423.5818.2814.98
0.238.5426.8325.1920.0916.9131.2023.2022.0418.1715.54
Table 10. Changes in support point: pinned-pinned bisymmetric I-beam with load on top flange.
Taper ParameterProposed Method
Support Point–Critical Load [kN/m]
FEM
Support Point–Critical Load [kN/m]
Bottom FlangeCentre of the WebTop FlangeBottom FlangeCentre of the WebTop Flange
1.0118.51135.41345.86118.36135.30345.14
0.8107.27122.91314.07107.02122.59313.29
0.695.72110.31282.6195.06109.22281.32
0.483.6597.59252.2282.1694.91249.66
0.270.4584.69225.8367.5879.00220.87
Table 11. Changes in support point: pinned-pinned bisymmetric I-beam with load in centre of web.
Taper ParameterProposed Method
Support Point–Critical Load [kN/m]
FEM
Support Point–Critical Load [kN/m]
Bottom FlangeCentre of the WebTop FlangeBottom FlangeCentre of the WebTop Flange
1.0126.27163.33830.16126.08163.17825.78
0.8114.30148.11746.18114.04147.70743.79
0.6101.88132.79663.21101.31131.49665.85
0.488.74117.31584.3187.54114.19595.66
0.274.04101.56524.0971.8695.05550.95
Table 12. Changes in support point: pinned-pinned bisymmetric I-beam with load under bottom flange.
Taper ParameterProposed Method
Support Point–Critical Load [kN/m]
FEM
Support Point–Critical Load [kN/m]
Bottom FlangeCentre of the WebTop FlangeBottom FlangeCentre of the WebTop Flange
1.0131.74196.973606.90131.52196.743570.45
0.8119.28178.443145.39119.01177.923132.98
0.6106.24159.812683.88105.75158.262725.48
0.492.30140.982266.5391.35137.342362.06
0.276.52121.752002.1374.84114.322103.04
Table 13. Changes in support point: pinned-pinned monosymmetric I-beam (smaller top flange) with load on top flange.
Taper ParameterProposed Method
Support Point–Critical Load [kN/m]
FEM
Support Point–Critical Load [kN/m]
Bottom FlangeCentre of the WebTop FlangeBottom FlangeCentre of the WebTop Flange
1.042.3447.56108.1642.0747.15105.77
0.838.8944.24100.2438.5743.7397.77
0.635.4641.1093.2534.9440.2190.13
0.432.0738.3288.0231.1336.5983.43
0.228.6536.3987.4727.0333.0080.14
Table 14. Changes in support point: pinned-pinned monosymmetric I-beam (smaller top flange) with load in centre of web.
Taper ParameterProposed method
Support Point–Critical Load [kN/m]
FEM
Support Point–Critical Load [kN/m]
Bottom FlangeCentre of the WebTop FlangeBottom FlangeCentre of the WebTop Flange
1.048.7260.05239.3548.4359.45229.30
0.844.5955.86219.9544.2655.13210.38
0.640.4651.94203.0939.9350.70193.29
0.436.2848.51191.1635.3846.18180.11
0.231.8846.29193.1530.4141.77180.32
Table 15. Changes in support point: pinned-pinned monosymmetric I-beam (smaller top flange) with load under bottom flange.
Taper ParameterProposed Method
Support Point–Critical Load [kN/m]
FEM
Support Point–Critical Load [kN/m]
Bottom FlangeCentre of the WebTop FlangeBottom FlangeCentre of the WebTop Flange
1.054.8878.13945.9754.5877.24895.97
0.850.0772.69836.8649.7471.62795.13
0.645.1967.63731.0844.7165.89700.63
0.440.1863.30644.9839.3860.08618.28
0.234.7360.71625.7733.5054.54572.97
Table 16. Changes in support point: pinned-pinned monosymmetric I-beam (smaller bottom flange) with load on top flange.
Taper ParameterProposed Method
Support Point–Critical Load [kN/m]
FEM
Support Point–Critical Load [kN/m]
Bottom FlangeCentre of the WebTop FlangeBottom FlangeCentre of the WebTop Flange
1.086.0787.93235.0886.1088.43241.56
0.877.9679.56214.2677.9179.93220.81
0.669.5471.00192.1569.2171.02199.94
0.460.6262.17168.7959.7461.52179.13
0.250.4752.74144.7548.8450.94159.73
Table 17. Changes in support point: pinned-pinned monosymmetric I-beam (smaller bottom flange) with load in centre of web.
Taper ParameterProposed Method
Support Point–Critical Load [kN/m]
FEM
Support Point–Critical Load [kN/m]
Bottom FlangeCentre of the WebTop FlangeBottom FlangeCentre of the WebTop Flange
1.089.15104.51683.1089.07104.99716.89
0.880.7594.15612.3680.6294.48647.01
0.671.9283.58536.8171.5983.49580.59
0.462.3872.67457.7061.6971.79520.34
0.251.2960.95379.5450.1358.76479.26
Table 18. Changes in support point: pinned-pinned monosymmetric I-beam (smaller bottom flange) with load under bottom flange.
Taper ParameterProposed Method
Support Point–Critical Load [kN/m]
FEM
Support Point–Critical Load [kN/m]
Bottom FlangeCentre of the WebTop FlangeBottom FlangeCentre of the WebTop Flange
1.090.59120.993930.2890.46121.424093.74
0.882.08108.573401.0981.93108.833572.79
0.673.0595.932840.9672.7695.713103.10
0.463.2182.872298.5262.6581.762677.16
0.251.6768.761848.4650.7766.222329.79
Table 19. Change of support point–pinned-pinned bisymmetric I-beam with load on top flange. Critical load values for different sizes of the approximation base.
Size of the Approximation BaseProposed Method
Support Point–Critical Load [kN/m]
Size of the Approximation BaseFEM
Support Point–Critical Load [kN/m]
Bottom FlangeCentre of the WebTop FlangeBottom FlangeCentre of the WebTop Flange
1076.0590.08230.232567.6179.10221.45
1570.4584.69225.835067.5879.00220.87
2070.4884.72225.737567.5778.98220.76
Err10
[%]
Err15
[%]
7.900.046.330.041.990.04Err25
[%]
Err50
[%]
0.060.010.150.030.310.05
Table 20. Change of support point–pinned-pinned bisymmetric I-beam with load in centre of web. Critical load values for different sizes of the approximation base.
Size of the Approximation BaseProposed Method
Support Point–Critical Load [kN/m]
Size of the Approximation BaseFEM
Support Point–Critical Load [kN/m]
Bottom FlangeCentre of the WebTop FlangeBottom FlangeCentre of the WebTop Flange
1080.36109.11536.672571.8795.15552.44
1574.04101.56524.095071.8695.05550.95
2074.08101.61523.377571.8695.03550.67
Err10
[%]
Err15
[%]
8.480.057.380.052.540.14Err25
[%]
Err50
[%]
0.010.000.130.020.320.05
Table 21. Change of support point–pinned-pinned bisymmetric I-beam with load under bottom flange. Critical load values for different sizes of the approximation base.
Size of the Approximation BaseProposed Method
Support Point–Critical Load [kN/m]
Size of the Approximation BaseFEM
Support Point–Critical Load [kN/m]
Bottom FlangeCentre of the WebTop FlangeBottom FlangeCentre of the WebTop Flange
1083.25131.991986.532574.84114.412104.55
1576.52121.752002.135074.84114.322103.04
2076.56121.831973.757574.84114.302102.76
Err10
[%]
Err15
[%]
8.740.058.340.070.651.44Err25
[%]
Err50
[%]
0.000.000.100.020.090.01
Table 22. Change of support point–pinned-pinned monosymmetric I-beam (smaller top flange) with load on top flange—critical load values for different sizes of the approximation base.
Size of the Approximation BaseProposed Method
Support Point–Critical Load [kN/m]
Size of the Approximation BaseFEM
Support Point–Critical Load [kN/m]
Bottom FlangeCentre of the WebTop FlangeBottom FlangeCentre of the WebTop Flange
1030.7838.3888.212527.0533.0480.35
1528.6536.3987.475027.0333.0080.14
2028.6736.4187.477527.0332.9980.10
Err10
[%]
Err15
[%]
7.360.075.410.050.850.00Err25
[%]
Err50
[%]
0.070.000.150.030.310.05
Table 23. Change of support point–pinned-pinned monosymmetric I-beam (smaller top flange) with load in centre of web. Critical load values for different sizes of the approximation base.
Size of the Approximation BaseProposed Method
Support Point–Critical Load [kN/m]
Size of the Approximation BaseFEM
Support Point–Critical Load [kN/m]
Bottom FlangeCentre of the WebTop FlangeBottom FlangeCentre of the WebTop Flange
1034.5549.26193.942530.4341.81180.89
1531.8846.29193.155030.4141.77180.32
2031.9046.32193.057530.4141.76180.21
Err10
[%]
Err15
[%]
8.310.066.350.060.460.05Err25
[%]
Err50
[%]
0.070.000.120.020.380.06
Table 24. Change of support point–pinned-pinned monosymmetric I-beam (smaller top flange) with load under bottom flange. Critical load values for different sizes of the approximation base.
Size of the Approximation BaseProposed Method
Support Point–Critical Load [kN/m]
Size of the Approximation BaseFEM
Support Point–Critical Load [kN/m]
Bottom FlangeCentre of the WebTop FlangeBottom FlangeCentre of the WebTop Flange
1037.8765.16618.942533.5154.59574.60
1534.7360.71625.775033.5054.54572.97
2034.7660.77614.447533.5054.54572.67
Err10
[%]
Err15
[%]
8.950.097.220.100.731.84Err25
[%]
Err50
[%]
0.030.000.090.000.340.05
Table 25. Change of support point–pinned-pinned monosymmetric I-beam (smaller bottom flange) with load on top flange. Critical load values for different sizes of the approximation base.
Size of the Approximation BaseProposed Method
Support Point–Critical Load [kN/m]
Size of the Approximation BaseFEM
Support Point–Critical Load [kN/m]
Bottom FlangeCentre of the WebTop FlangeBottom FlangeCentre of the WebTop Flange
1054.8056.77149.422548.8550.99160.10
1550.4752.74144.755048.8450.94159.73
2050.4952.76144.487548.8450.93159.66
Err10
[%]
Err15
[%]
8.540.047.600.043.420.19Err25
[%]
Err50
[%]
0.020.000.120.020.280.04
Table 26. Change of support point–pinned-pinned monosymmetric I-beam (smaller bottom flange) with load in centre of web. Critical load values for different sizes of the approximation base.
Size of the Approximation BaseProposed Method
Support Point–Critical Load [kN/m]
Size of the Approximation BaseFEM
Support Point–Critical Load [kN/m]
Bottom FlangeCentre of the WebTop FlangeBottom FlangeCentre of the WebTop Flange
1055.8766.25389.862550.1258.79480.21
1551.2960.95379.545050.1358.76479.26
2051.3160.97377.307550.1358.75479.07
Err10
[%]
Err15
[%]
8.890.048.660.033.330.59Err25
[%]
Err50
[%]
0.020.000.070.020.240.04
Table 27. Change of support point–pinned-pinned monosymmetric I-beam (smaller bottom flange) with load under bottom flange. Critical load values for different sizes of the approximation base.
Size of the Approximation BaseProposed Method
Support Point–Critical Load [kN/m]
Size of the Approximation BaseFEM
Support Point–Critical Load [kN/m]
Bottom FlangeCentre of the WebTop FlangeBottom FlangeCentre of the WebTop Flange
1056.3375.211805.572550,7666,252326,48
1551.6768.761848.465050,7766,222329,79
2051.6968.791816.037550,7766,222330,42
Err10
[%]
Err15
[%]
8.980.049.330.040.581.79Err25
[%]
Err50
[%]
0.020.000.050.000.170.03
Table 28. Critical load proportions depending on loading diagram and load location.
Cross SectionBisymmetric“⏊”“⏉”
DiagramP-PC-CC-FP-PC-CC-FP-PC-CC-F
N s N d N s N d N s N d N s N d N s N d N s N d N s N d N s N d N s N d N s N d N s N d N s N d N s N d N s N d N s N d N s N d N s N d N s N d
μ [kN]0.8310.6910.4870.2320.6220.2520.7670.6060.4490.2340.5800.2280.8730.7430.5230.2160.7060.368
σ [kN]0.0020.0030.0020.0030.0380.0660.0020.0030.0120.0030.0800.0680.0080.0140.0130.0130.0120.041
σ [%]0.20.40.51.46.126.40.30.62.61.513.829.80.91.92.46.21.611.1
Table 29. Critical load proportions depending on support point for P-P beam.
Cross SectionBisymmetric“⏊”“⏉”
LoadG–Top FlangeS–Web CentreD–Bottom FlangeG–Top FlangeS–Web CentreD–Bottom FlangeG–Top FlangeS–Web CentreD–Bottom Flange
N ^ s N ^ d N ^ s N ^ d N ^ s N ^ d N ^ s N ^ d N ^ s N ^ d N ^ s N ^ d N ^ s N ^ d N ^ s N ^ d N ^ s N ^ d N ^ s N ^ d N ^ s N ^ d N ^ s N ^ d N ^ s N ^ d N ^ s N ^ d N ^ s N ^ d N ^ s N ^ d N ^ s N ^ d N ^ s N ^ d
μ [kN]1.1623.0041.3176.6551.52325.9461.1772.7121.3125.2391.53916.8401.0272.7791.1717.4891.32339.170
σ [kN]0.0200.0970.0260.1950.0330.8830.0480.1670.0720.3920.1060.6610.0080.0440.0090.1080.0092.658
σ [%]1.73.22.02.92.23.44.16.25.57.56.93.90.81.60.71.40.76.8
Disclaimer/Publisher’s Note: The statements, opinions and data contained in all publications are solely those of the individual author(s) and contributor(s) and not of MDPI and/or the editor(s). MDPI and/or the editor(s) disclaim responsibility for any injury to people or property resulting from any ideas, methods, instructions or products referred to in the content.