Abstract
This study investigates the effects of alcoholic (AB) and non-alcoholic beer (NAB) consumption on blood pressure and the activity of enzymes regulating the renin–angiotensin system (RAS) in Wistar–Kyoto (WKY) and spontaneously hypertensive rats (SHRs), with WKY rats used as normotensive controls for SHRs. The RAS is crucial for long-term blood pressure regulation, with angiotensin II (AngII) being a potent vasoconstrictor. The aim was to explore the biochemical mechanisms by which beer might influence cardiovascular health. WKY and SHRs were divided into groups receiving tap water (TW), non-alcoholic beer (NAB), alcoholic beer (AB), TW or NAB and TW or AB for 12 weeks. Systolic blood pressure (SBP), body weight, and biochemical parameters (electrolytes, glucose, renal and liver function, lipid profile) were monitored, and the RAS enzyme activity in serum and various tissues was analyzed. Beer consumption, regardless of alcohol content, did not significantly affect SBP or body weight. However, NAB and AB altered the serum electrolyte levels in both strains. AB consumption increased liver enzyme activity. Significant changes were observed in the RAS enzyme activity across tissues, varying by strain, beer type, and tissue. Moderate beer consumption did not elevate blood pressure in WKY or SHRs. Nevertheless, beer modulated RAS-regulating enzyme activities, indicating potential impacts on cardiovascular homeostasis.
1. Introduction
Blood pressure depends on the interaction of several factors, integrated and coordinated through the central nervous system. These factors include peripheral vascular resistance [1], the circulating blood volume [2,3], blood viscosity [4], and the elasticity of arterial walls [5,6]. The circulatory system has an extensive mechanism for controlling blood pressure. For instance, if at any given time the pressure significantly deviates from its normal mean value, nervous reflexes are triggered within seconds, causing changes that restore the pressure to normal levels [7,8].
Over longer periods, the kidneys play a crucial role in pressure control by secreting hormones that regulate it. The renin–angiotensin system (RAS) is perhaps the most important and powerful endocrine system affecting blood pressure control. It is an automatic feedback mechanism that helps maintain blood pressure at a normal or near-normal level. It is considered the potential pathway for the synthesis of angiotensin II (AngII), which is responsible for both the short-term and long-term control of blood pressure [9,10,11,12,13,14].
In this system, renin, an enzymatic protein secreted by the kidney into the bloodstream when one’s blood pressure drops too low, helping to increase blood pressure in several ways, acts on the peptide chain of its substrate, angiotensinogen, producing angiotensin I (AngI), an inactive decapeptide that has only weak vasoconstrictive properties, which are insufficient to cause significant functional alterations in circulatory function. Therefore, AngI serves primarily as a precursor to AngII. AngI is further processed by angiotensin-converting enzyme (ACE), which generates one of the most active peptides of the system, AngII, as blood passes through the endothelium of the pulmonary vessels. AngII induces arteriolar constriction and increases blood pressure. It is one of the most potent vasoconstrictors known, but its pressor activity is diminished in individuals with sodium depletion and in patients with cirrhosis and other diseases [15,16]. In these cases, circulating AngII increases, but its activity is regulated by a reduction in AngII receptors in vascular smooth muscle, resulting in a diminished response to AngII. AngII is rapidly destroyed, with a half-life of one to two minutes. The enzymes that degrade AngII are collectively referred to as angiotensinases. They include aminopeptidase A (APA) and aspartyl aminopeptidase (ASAP), which form a heptapeptide known as angiotensin III (AngIII), which also possesses biological activity. AngIII is further processed by other enzymes, such as aminopeptidase N and/or B (APN, APB), yielding angiotensin IV (AngIV), which also has biological activity [11,13,17,18,19,20,21].
Although RAS functions as an endocrine system that regulates blood pressure by acting on peripheral resistance and sodium excretion, it also functions as an autocrine-paracrine system with important local tissue effects. The current understanding is that circulating RAS is not directly responsible for increased blood pressure in essential hypertension. In fact, many hypertensive patients have low levels of renin and AngII, and drugs that block the RAS are not particularly effective in such cases. However, there is growing evidence supporting the role of local tissue RAS in controlling blood pressure. Studies have shown that, in addition to systemic AngII production, many tissues have the ability to generate AngII locally, apparently for local use. Tissue RAS components have been identified in the walls of blood vessels, the adrenal cortex, testicles, the anterior and intermediate lobes of the pituitary gland, the brain, kidneys, and other organs. The role of these tissue RAS systems is not yet fully understood; however, it is known that tissue-derived renin contributes very little to the pool of circulating renin, as plasma renin activity nearly disappears when the kidneys are removed [8,18,19,20,21].
Maintaining adequate blood pressure levels is highly important because even a moderate elevation can reduce life expectancy [22,23]. At high pressures, a person may not expect to live more than a few years for three main reasons. First, the excessive workload for the heart leads to the development of diseases such as congestive heart failure, ischemic heart disease [24,25,26,27], or both, which frequently result in death due to a heart attack. Second, elevated pressure frequently causes a major blood vessel in the brain to rupture, leading to a stroke [28]. Depending on which part of the brain is affected, a stroke may cause paralysis, dementia, blindness, or multiple other brain disorders [29]. Lastly, a high blood pressure almost always causes multiple hemorrhages in the kidneys, resulting in widespread renal destruction and, ultimately, renal failure, uremia, and death. Therefore, it is necessary to prevent hypertension through various mechanisms, among which dietary approaches are gaining increasing importance [8].
Beer is an ancient beverage that has long been part of the Mediterranean diet. This natural beverage, obtained by the alcoholic fermentation of a malted barley extract, has been the subject of numerous studies in recent years, demonstrating that moderate beer consumption is beneficial to health [30,31,32,33,34,35,36,37,38,39,40,41]. Beer is a significant source of nutrients and health-promoting elements, including B vitamins (folic acid, riboflavin, niacin, thiamine, pantothenic acid, biotin, and vitamin B12), minerals (magnesium, calcium), carbohydrates (soluble fiber), natural antioxidants, and other substances derived from its primary ingredients (malted barley, hops, water, and yeast) [30,31,32,33,34,35,36,37,38,39]. Numerous studies indicate that moderate beer consumption in healthy adults is compatible with a balanced diet and that it protects the body from oxidation and cellular aging, potentially preventing or delaying cardiovascular diseases, among others [9,30,31,32,33,34,35,36,37,38,39,42,43].
Thus, beer consumption has been proposed as a dietary factor capable of reducing the incidence of cardiovascular diseases and hypertension [30,31,32,33,34,35,36,37,38,39,44,45,46]. However, the mechanisms underlying this effect remain unknown. Therefore, the use and/or recommendation of beer in a diet must be based on a thorough understanding of both its benefits and risks [47]. Here, we analyze the effect of the consumption of alcoholic beer (AB) and non-alcoholic beer (NAB) on heart rate, blood pressure, serum biochemistry (electrolytes, glucose and non-protein nitrogenous compounds, protein and enzymes and lipid profile) and the activity of RAS-regulating proteolytic enzymes in serum and the tissues involved in blood pressure regulation in healthy Wistar–Kyoto rats (WKY) and spontaneous hypertensive rats (SHRs). As more studies suggest that beer consumption positively influences cardiovascular health, it is crucial to understand the biochemical mechanisms by which these beneficial effects are exerted. Therefore, we hypothesize that beer consumption, both alcoholic and non-alcoholic, influences blood pressure regulation through the modulation of the activity of enzymes that regulate the RAS, as well as affecting other metabolic and functional parameters. This study will provide valuable information regarding the ability of AB and NAB to influence blood pressure regulation.
2. Materials and Methods
2.1. Animals and Treatments
Forty male SHRs (SHR/NHsd animals) and forty male WKY (WKY/NHsd animals) (10 weeks old, weight 200–220 g) rats were obtained from Charles River Laboratories España S.A. (Barcelona, Spain). Animals were housed in a temperature (20–25 °C) and humidity (50 ± 5%)-controlled environment with a 12 h light/dark cycle and had free access to food and beverage. All experimental protocols strictly complied with international ethical experimental procedures for animal use and care, in accordance with European Communities Council Directive 2010/63/UE and Spanish regulation RD 53/2013, and the study was approved by the Institutional Animal Care and Use Committee of the University of Jaén (code number 31-01-2019/011).
Animals were randomly assigned to one of five experimental groups according to their beverage: tap water (TW), alcohol-free beer (NAB), tap water or alcohol-free beer at their discretion (TW/NAB), alcoholic beer (AB), or tap water and alcoholic beer at their discretion (TW/AB). Each group consisted of eight animals, and they were provided with their respective beverages over 12 weeks, with unrestricted access to food and drink. The beverage and food intake of each group was measured during the full experimental period. Alcoholic (5% ethanol) and non-alcoholic (0.0% ethanol) commercially available lager beer was used in this study. Experimental groups where rats could choose between TW, AB or NAB were included in the study to investigate how voluntary preference for beer might affect the parameters studied. Thus, these groups seek to determine whether the animal’s free choice influences consumption, body weight, blood pressure and RAS enzyme activity compared to groups where only one type of beverage was provided.
2.2. Systolic Blood Pressure, Food and Beverage Intake
The systolic blood pressure (SBP) measurement was performed in unanesthetized animals, using the “tail-cuff” pneumatic plethysmography method [48]. The animals were placed in a plastic holder and warmed to 37 °C for 15–20 min. Air was blown into the occlusion cuff until 250 mmHg was reached, the reference value for occlusion of the caudal artery. The occlusion cuff was then abruptly deflated until an indicator light on the meter was signaled, corresponding to the SBP value and indicating the appearance of increased and turbulent blood flow as a result of hyperemia. At least seven measurements of SBP were carried out in each session, considering the mean of the three lowest values within a range of 5 mmHg as the SBP value. All measurements were performed during the same period of the day (10 a.m.–12 a.m.), considering that SBP has diurnal variations.
Individual metabolism cages were used to obtain the values of food and beverage intake.
2.3. Serum Samples Acquisition
At the end of the experimental period, animals were anaesthetized under Equithensin anesthesia (2 mL/kg body weight), which was intraperitoneally administered. Blood samples were obtained in tubes without anticoagulants, through the left cardiac ventricle, and centrifuged for ten minutes at 3000× g at 4 °C to obtain the serum. These samples were frozen and stored at 80 °C until use.
2.4. Blood Serum Chemistry Measurements
Electrolytes (sodium, potassium and chloride) were assayed using selective ion electrodes, according to Shibata [49]. The results are expressed in mEq/L; calcium was assayed by colorimetric assay, according to Farrell [50], and phosphorus was assayed by colorimetric assay, according to Tietz [51]. The results are expressed in mg/dL. The non-protein nitrogenous compounds uric acid, urea, creatinine, and glucose in the serum samples were assessed using commercial kits (Boehringer Mannheim) with the automated Roche-Hitachi 917 system, according to the methods described by Praetorius and Poulsen [52], Talke and Schubert [53], Bartels [54] and Peterson and Young [55], respectively. Total cholesterol, high-density lipoprotein (HDL) cholesterol and triglycerides were assayed with the use of standard enzymatic colorimetric methods using commercially available kits, according to Roeschlau [56], Sugiuchi [57] and Siedel [58]. The low-density lipoprotein (LDL) cholesterol level was calculated according to the Friedewald formula [59]. The results are expressed in mg/mL. The serum activities of aspartate aminotransferase (AST) and alanine aminotransferase (ALT) were estimated by quantitative enzymatic colorimetric end-point methods using commercially available kits, according to Tietz [60] and Bergmeyer [61,62]. The results are expressed in UI/L. The serum alkaline phosphatase (ALP) was determined by a colorimetric end-point method using commercially available kits, according to Belfield and Goldberg [63]. The results are expressed in UI/L. The serum albumin content was determined by the colorimetric method using a commercial kit according to Doumas [64]. The results are expressed in g/dL. The serum total protein was estimated by the colorimetric method of Bradford [65], using bovine serum albumin (BSA) as a standard. The results are expressed in mg/mL.
2.5. Tissue Samples Acquisition
After obtaining blood samples, the anaesthetized animals were perfused with a saline solution (9‰) through the left cardiac ventricle. Samples from the hypothalamus, anterior and posterior pituitary gland, lung, kidney (renal cortex and medulla), adrenal gland (cortex and medulla) and testis were quickly removed and frozen at −80 °C until use.
2.6. Angiotensin-Converting Enzyme (ACE) Assay
Tissue and circulating ACE activity measurements were performed as described by Alves et al. [66], with minor modifications. In short, cleavage of the quenched fluorescent substrate (Abz-FRK(Dnp)P-OH was used to measure the activity in a kinetic assay. The measurement mixture contained 100 mM of TRIS-HCl, pH 7.0, 50 mM of NaCl, 10 µM of ZnCl2, 10 µM of Abz-FRK(Dnp)P-OH for the corresponding amount of sera/tissue sample. The ACE activity was measured at 37 °C. The ACE activity measurements were performed with a plate reader at λex 340 nm and λem 405 nm (Genios Tecan Plus, Madrid, Spain). The ACE activity was calculated based on the rate of the observed increase in fluorescence intensity (UI/min), based on a calibration curve with the Abz fluorophore.
2.7. Aminopeptidase Activities Assay
In order to obtain the soluble fraction, the tissue samples were homogenized with 0.5 mL of 10 mM Tris-HCl buffer (pH 7.4) and ultracentrifuged at 100,000× g for 30 min at 4 °C. The resulting supernatants were used to measure the enzymatic activities corresponding to the soluble fraction, and the protein content. To solubilize the membrane proteins, the pellets were rehomogenized in 10 mM of Tris-HCl buffer (pH 7.4) with 1% Triton-X-100, and ultracentrifuged at 100,000× g for 30 min at 4 °C. The supernatants were kept for at least 4 h at 4 °C and shaken with SM-2 biobeads, in order to remove the detergent used to solubilize the membrane proteins. The resulting samples were used to measure the enzymatic activities of the membrane-bound fraction, and the protein content [67,68,69].
The enzymatic activities of the soluble and membrane-bound fractions of APA, ASAP, APN and APB were measured by a fluorimetry assay using, as substrates, the aminoacyl-β-Naphthylamides (aa-β-NA) L-Asp-β-NA, L-Glu-β-NA, L-Ala-β-NA and L-Arg-β-NA, respectively, according to the methods previously described by us. Then, 96-well black plates were used, and 10 µL of the supernatant sample was pipetted into each well and incubated for 30 min at 37 °C in 100 µL of the substrate solutions. After 30 min of incubation, the enzymatic reactions were stopped by adding 100 µL of 0.1 M acetate buffer (pH 4.2). The β-NA released as a result of the enzymatic activity was quantified fluorometrically at a 412 nm emission with an excitation of 345 nm. Each determination was made in triplicate. The soluble and membrane-bound activities were expressed as pmoles of the corresponding aa-ß-NA hydrolyzed per minute and per mg of protein (pmol aa-β-NA/min/mg protein). Figure 1 summarizes the experimental design and procedures.
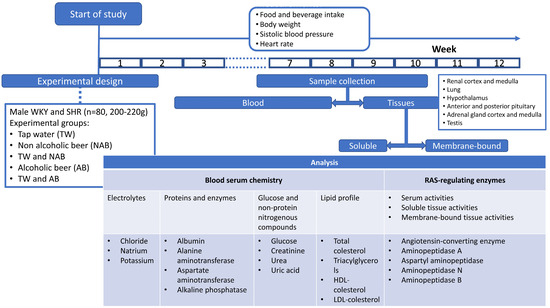
Figure 1.
Experimental design scheme and specific experimental procedures.
2.8. Statistical Analysis
Statistical analysis was performed using one-way ANOVA, followed by Tukey’s post hoc test for multiple comparisons. When the normality test failed, Kruskal–Wallis One Way Analysis of Variance on Ranks was performed. Significant differences were estimated with Sigmaplot v11.0 software (Systat Software, Inc., San José, CA, USA), and p-values below 0.05 were considered statistically significant. All data are presented as mean ± standard error of the mean (SEM).
3. Results
3.1. Food and Beverage Intake
Figure 2 shows the food and beverage intake in both WKY and SHRs over the period of study. In WKY (Figure 2A), both food and water intake remained relatively stable throughout the study, with minor fluctuations. In contrast, SHRs (Figure 2B) exhibited a slightly more variable pattern of TW and food intake, but with no major deviations. Figure 2C,D illustrate the intake of non-alcoholic beer (NAB) and food in WKY and SHRs. In WKY, NAB intake increased after day 26, while food intake slightly fluctuated but remained consistent. SHRs also showed a pronounced increase in NAB intake after day 26, with a sharp rise after day 50, accompanied by noticeable fluctuations in food intake. Figure 2E,F combine the intake of both TW and NAB, along with food consumption. In WKY, both TW and NAB remained relatively stable, with major increases in NAB intake after day 21 to decreases after day 20, while food intake was largely steady. In SHRs, NAB intake showed a sharp increase after day 21 to return to lower values after day 20, while TW intake stayed relatively low; food consumption showed minor fluctuations. Figure 2G,H depict alcohol-containing beer (AB) and food intake in WKY and SHRs. In WKY, AB intake slightly increased with fluctuations over time, with food intake remaining relatively stable. SHRs also demonstrated a pronounced fluctuation in AB intake, particularly after day 40, and food consumption varied slightly throughout the study. Finally, Figure 2I,J combine AB and TW intake with food consumption. In WKY, both AB and TW intake remained stable, with minimal changes, while food intake was constant. In SHRs, a similar trend of steady TW intake with slight AB fluctuations was observed, and food intake remained consistent throughout the 100-day period.
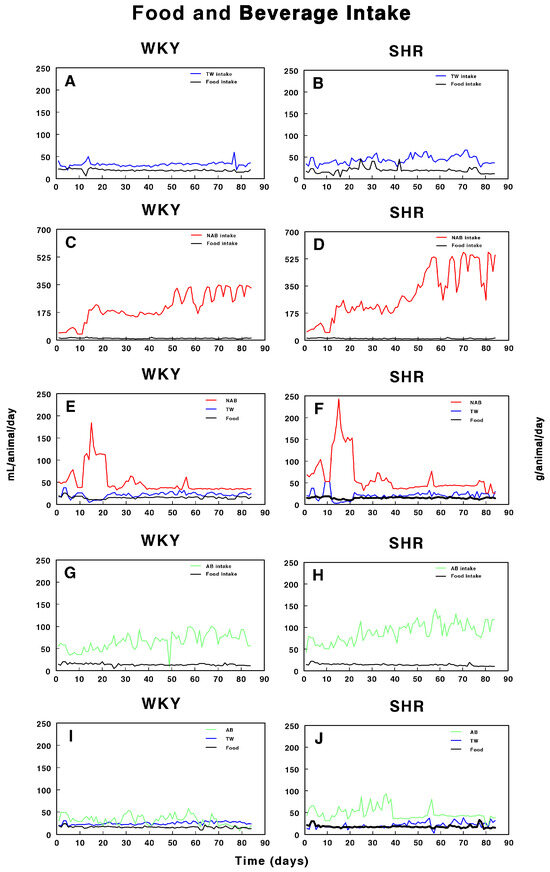
Figure 2.
Intake of tap water (TW), alcohol-free beer (NAB), alcoholic beer (A,B), and food in Wistar–Kyoto rats (WKY) and spontaneously hypertensive rats (SHRs). Experimental groups included animals provided with (A, B) tap water (TW), (C,D) alcohol-free beer (NAB), (E,F) tap water or alcohol-free beer at their discretion (TW/NAB), (G,H) alcoholic beer (AB), or (I,J) tap water and alcoholic beer at their discretion (TW/AB). Results are expressed as milliliters of liquid and grams of food consumed per day (mean ± SEM; n = 8).
3.2. Body Weight
Figure 3 depicts the body weight progression over 11 weeks in WKY and SHRs under the different beverage conditions. Figure 3A shows the body weight of WKY animals, where all groups, including those consuming TW, NAB, a combination of TW/NAB, AB, and TW/AB, display a steady and consistent increase in body weight over time. No significant differences between the groups are evident throughout the 11-week period, indicating that beverage type did not notably affect the body weight trajectory in WKY animals. Figure 3B illustrates the body weight progression in SHRs, where a similar trend is observed, with all groups showing a gradual increase in body weight. However, slight variations are noted between the groups, with TW/AB showing a slightly higher increase compared to the other groups. Overall, the body weight gain in SHRs appears more variable than in WKY rats, but there is no substantial divergence among the different beverage groups.
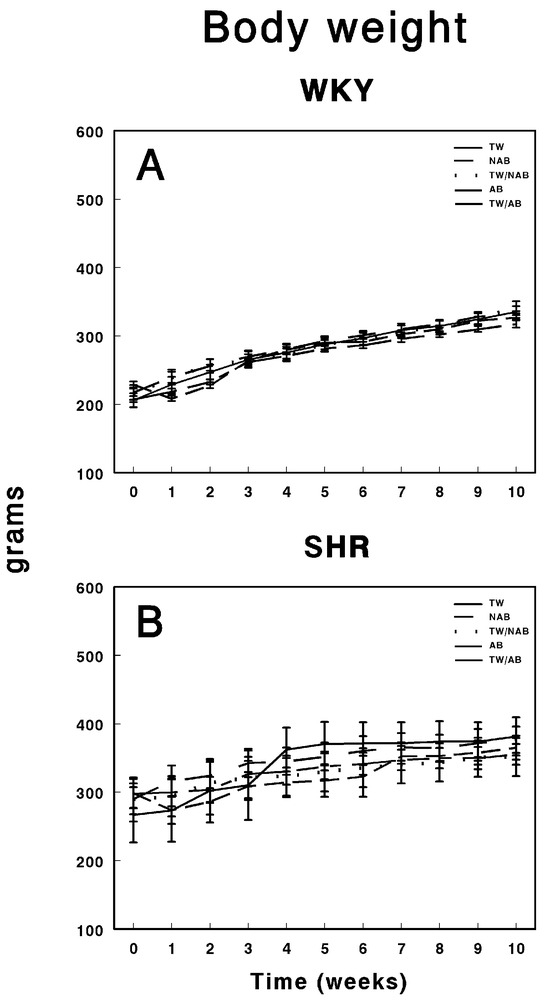
Figure 3.
Body weight of (A) Wistar–Kyoto rats (WKY) and (B) spontaneously hypertensive rats (SHRs). Experimental groups included animals provided with tap water (TW), alcohol-free beer (NAB), tap water or alcohol-free beer at their discretion (TW/NAB), alcoholic beer (AB), or tap water and alcoholic beer at their discretion (TW/AB). Results are expressed in grams as mean body weight ± SEM (n = 8).
3.3. Systolic Blood Pressure
Figure 4 illustrates the evolution of systolic blood pressure in WKY and SHRs over 11 weeks under different beverage treatments. In WKY animals (Figure 4A), their blood pressure remained relatively stable across the groups consuming TW, NAB, combined TW/NAB, AB and combined TW/AB. While small fluctuations are observed, none of the groups display significant blood pressure elevations at the end of the experimental period, suggesting that the beverage treatments had no substantial impact on systolic blood pressure in this normotensive strain. Figure 4B shows the systolic blood pressure in SHRs, where considerable variability is noted among the different treatment groups. Notably, all groups show an elevated baseline pressure, which is characteristic of this hypertensive model. Over the 11-week period, transient spikes and declines in blood pressure are observed, particularly in the groups receiving NAB and AB, though no clear, sustained differences among the beverage groups emerge at the end of the experimental period. Overall, while WKY animals maintained a consistent blood pressure, SHRs displayed typical hypertension with occasional fluctuations that were not strongly associated with the type of beverage consumed.
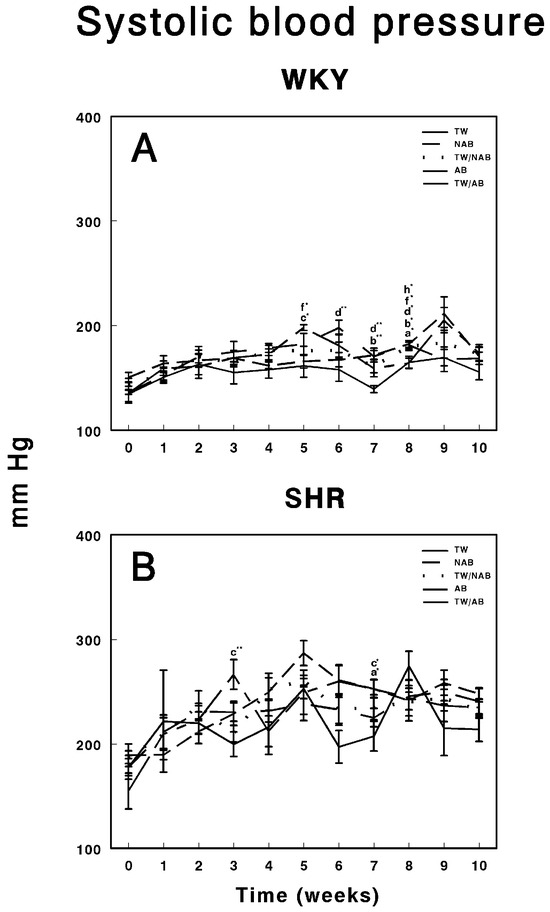
Figure 4.
Systolic blood pressure measurements in (A) Wistar–Kyoto rats (WKY) and (B) spontaneously hypertensive rats (SHR). Experimental groups included animals provided with tap water (TW), alcohol-free beer (NAB), tap water or alcohol-free beer at their discretion (TW/NAB), alcoholic beer (AB), or tap water and alcoholic beer at their discretion (TW/AB). Results are presented in mm Hg as mean systolic blood pressure ± SEM (n = 8; * p < 0.05; ** p < 0.01).
3.4. Heart Rate
Figure 5 illustrates the effects of various beverage treatments on the heart rate of WKY animals and SHRs over a 11-week experimental period. In Figure 5A, the heart rate progression in WKY animals is presented. These animals exhibit relatively stable heart rate trends across the different treatment groups. Throughout the 11-week period, the groups show minor fluctuations in heart rate, particularly around weeks 3 to 5, but these variations are not marked by significant deviations from baseline. The heart rate remains within the range of approximately 370 to 550 beats per minute (BPM). The absence of notable differences between the treatment groups suggests that neither the alcohol content nor beer consumption led to significant cardiovascular alterations in the WKY animals, maintaining their physiological stability. Figure 5B focuses on the heart rate response in SHRs. Compared to the WKY group, SHRs show greater variability in heart rate throughout the experimental timeline. All treatment groups display fluctuations, which are more pronounced and irregular compared to the WKY animals. Despite these inherent oscillations, characteristic of the hypertensive phenotype, none of the treatment groups—TW, NAB, TW/NAB, AB, and TW/AB—exhibited consistent or sustained differences over the 11-week period. The heart rate measurements in SHRs ranged broadly from 350 to 550 BPM.
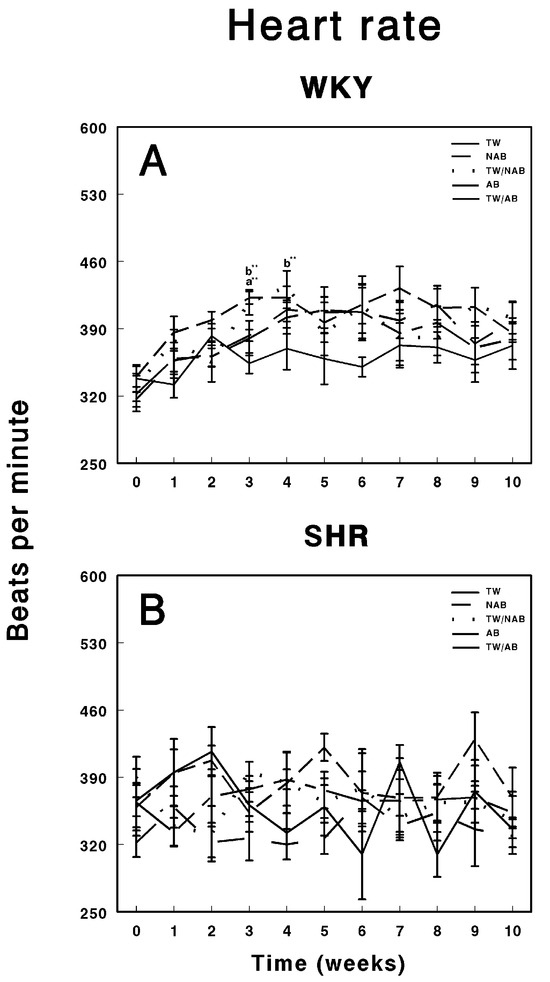
Figure 5.
Heart rate measurements in (A) Wistar–Kyoto rats (WKY) and (B) spontaneously hypertensive rats (SHRs). Experimental groups included animals provided with tap water (TW), alcohol-free beer (NAB), tap water or alcohol-free beer at their discretion (TW/NAB), alcoholic beer (AB), or tap water and alcoholic beer at their discretion (TW/AB). Results are presented in beats per minute ± SEM (n = 8; ** p < 0.01).
3.5. Serum Biochemistry Parameters
3.5.1. Electrolytes
Figure 6 depicts the serum electrolyte concentrations—chloride (A), sodium (B), and potassium (C)—in WKY and SHRs following treatment with various beverages over the experimental period.
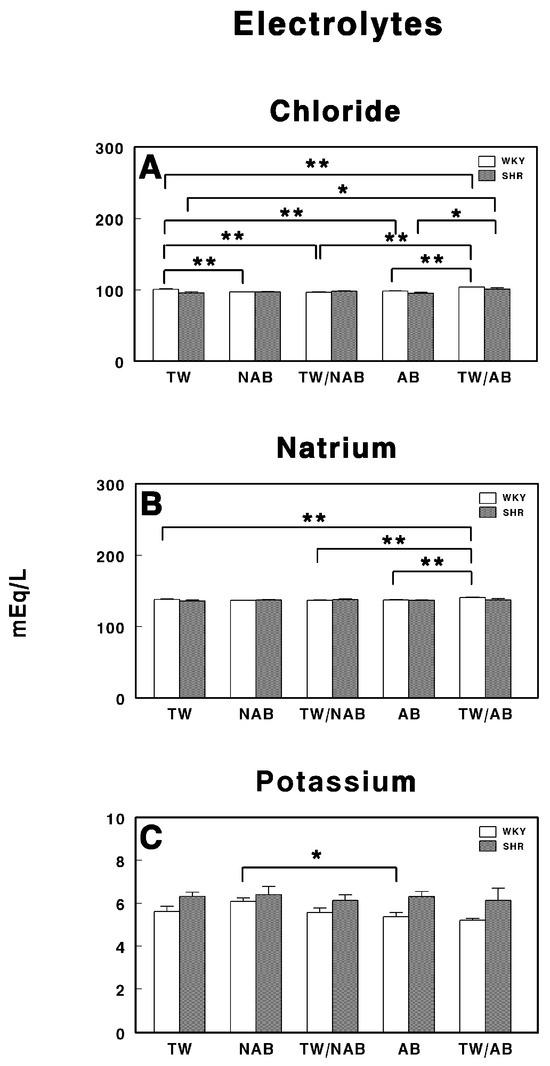
Figure 6.
Serum electrolyte levels in Wistar–Kyoto rats (WKY) and spontaneously hypertensive rats (SHR): (A) chloride (Cl−), (B) sodium (Na+), and (C) potassium (K+). Experimental groups included animals provided with tap water (TW), alcohol-free beer (NAB), tap water or alcohol-free beer at their discretion (TW/NAB), alcoholic beer (AB), or tap water and alcoholic beer at their discretion (TW/AB). Results are expressed in milliequivalents per liter (mEq/L) as mean ± SEM (n = 8; * p < 0.05; ** p < 0.01).
In Figure 6A, chloride concentrations are shown for both the WKY and SHR groups across the different treatment conditions (TW, NAB, TW/NAB combination, AB and TW/AB combination). There is a significant difference in chloride levels between the different treatment groups. The chloride levels in the NAB, TW/NAB and AB groups were significantly lower than in the TW group in WKY rats, but increased in the TW/AB group. On the contrary, in SHRs, the chloride levels are increased in the NAB, TW/NAB, and TW/AB groups, without changes in the AB group.
Figure 6B presents the sodium concentrations in both the WKY and SHR groups under the same five treatment conditions. As observed, the sodium levels are significantly higher in the TW/AB group compared to the other groups in WKY rats, except the NAB group. No significant differences are present in the SHRs between groups.
Figure 6C shows the potassium concentrations across the same treatment groups. A statistically significant decrease in potassium levels is noted between the AB and NAB groups in WKY, whereas no differences were found in SHRs.
3.5.2. Proteins and Enzymes
Figure 7 depicts the effects of different treatment conditions on specific protein and enzyme levels in WKY and SHRs receiving TW, NAB, TW/NAB, AB and TW/AB. Regarding albumin (Figure 7A), the analysis of serum levels shows a significant difference (** p < 0.01) between the TW/NAB and TW/AB groups in WKY, whereas no differences were found in SHRs. Rats in the TW/AB group exhibit higher albumin levels compared to those in the TW/NAB group. The ALT activity (Figure 7B) reveals significant intergroup differences. The TW/AB group shows a significant elevation (* p < 0.05) in ALT levels compared to the TW, TW/NAB and AB groups in WKY. Borderline non-significant increases appears in SHRs after the intake of TW/NAB or TW/AB. In the case of AST (Figure 7C), there is a trend towards increased enzyme activity in the WKY receiving TW/AB and in SHRs receiving TW/NAB, but without significant differences. There are no significant differences observed in the ALP levels among the treatment groups in either WKY or SHRs (Figure 7D).
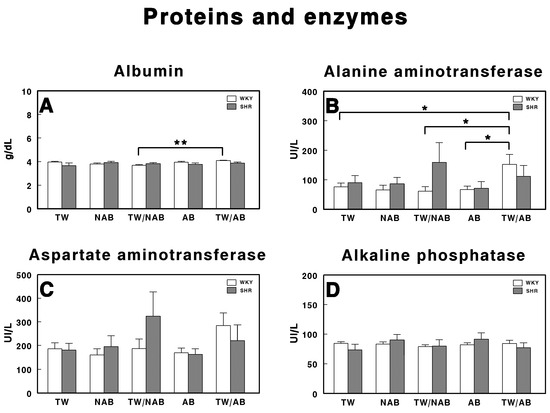
Figure 7.
Serum levels of (A) albumin, (B) alanine aminotransferase, (C) aspartate aminotransferase, and (D) alkaline phosphatase in Wistar–Kyoto rats (WKY) and spontaneously hypertensive rats (SHRs). Experimental groups included animals provided with tap water (TW), alcohol-free beer (NAB), tap water or alcohol-free beer at their discretion (TW/NAB), alcoholic beer (AB), or tap water and alcoholic beer at their discretion (TW/AB). Results are expressed in international units per liter (IU/L) for GOT, GPT, and ALP, and in grams per deciliter (g/dL) for albumin (mean ± SEM; n = 8; * p < 0.05; ** p < 0.01).
3.5.3. Glucose and Non-Protein Nitrogenous Compounds
Figure 8 presents the concentrations of glucose (A), creatinine (B), urea (C), and uric acid (D) in WKY and SHRs, following treatment with TW, NAB, TW/NAB, AB and TW/AB.
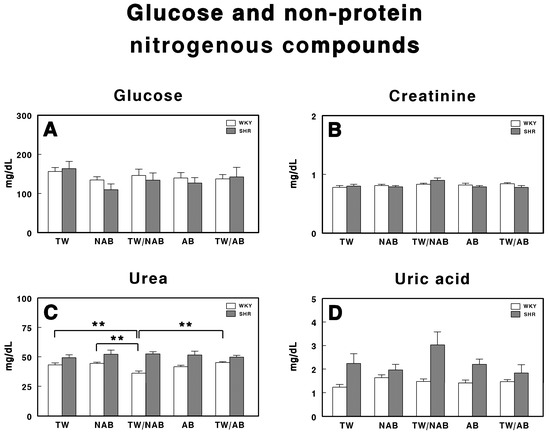
Figure 8.
Serum levels of (A) glucose, (B) creatinine, (C) urea, and (D) uric acid in Wistar–Kyoto rats (WKY) and spontaneously hypertensive rats (SHR). Experimental groups included animals provided with tap water (TW), alcohol-free beer (NAB), tap water or alcohol-free beer at their discretion (TW/NAB), alcoholic beer (AB), or tap water and alcoholic beer at their discretion (TW/AB). Results are expressed in milligrams per deciliter (mg/dL) for glucose, creatinine, urea, and uric acid (mean ± SEM; n = 8; ** p < 0.01).
The glucose levels in both WKY and SHRs show no statistically significant differences across all treatment groups for both strains, although there is a tendency for the glucose levels to be slightly decreased in those animals that did not exclusively drink TW.
Regarding creatinine (Figure 8B), no statistically significant differences are observed between treatment groups in both WKY and SHRs, with their concentrations maintained within a narrow range for all treatment conditions.
Figure 8C shows the urea levels, where statistically significant differences are observed only in WKY rats receiving TW/NAB, which showed lower urea concentrations compared to the TW, NAB, AB and TW/AB groups.
Finally, Figure 8D presents the levels of uric acid. Although there are no statistically significant differences between the treatment groups, SHRs exhibit higher uric acid concentrations across all conditions compared to WKY animals.
3.5.4. Lipid Profile
Figure 9 represents the serum lipid profile in WKY and SHRs receiving TW, NAB, TW/NAB, AB and TW/AB. The lipid parameters analyzed include total cholesterol, triglyceride, HDL-cholesterol and LDL-cholesterol.
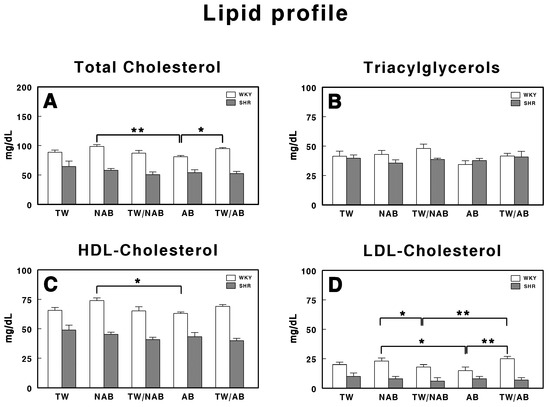
Figure 9.
Serum lipid profile in Wistar–Kyoto rats (WKY) and spontaneously hypertensive rats (SHR): (A) total cholesterol, (B) triglyceride, (C) high-density lipoprotein cholesterol (HDL), and (D) low-density lipoprotein cholesterol (LDL). Experimental groups included animals provided with tap water (TW), alcohol-free beer (NAB), tap water or alcohol-free beer at their discretion (TW/NAB), alcoholic beer (AB), or tap water and alcoholic beer at their discretion (TW/AB). Results are expressed in milligrams per deciliter (mg/dL) (mean ± SEM; n = 8; * p < 0.05; ** p < 0.01).
The total cholesterol levels (Figure 9A) show significant differences between treatment groups but only in WKY animals, with the AB group showing a statistically significant decrease (p < 0.01) when compared with the NAB group and TW/AB group (p < 0.05).
Regarding triacylglycerol levels (Figure 9B), no significant differences were found across all treatment groups.
The HDL-cholesterol levels, shown in Figure 9C, show a significant increase in the NAB group (p < 0.05) in WKY animals. No significant differences appear in SHRs.
Finally, in Figure 9D, the LDL-cholesterol levels show significant differences between groups only in WKY animals, with higher values in the NAB group and the lowest values in the AB group. As in the whole lipid profile, SHRs showed lower concentrations than WKY animals for all the parameters.
3.6. Serum RAS-Regulating Enzyme Activities
The serum activities of enzymes involved in the regulation of the RAS were assessed in WKY and SHRs across the different experimental groups (TW, NAB, TW/NAB, AB and TW/AB. The enzymes analyzed were ACE, APA, ASAP, APN and APB. Figure 10A shows that there were no significant differences in the ACE activity between WKY and SHRs across all experimental groups. Regarding APA activity (Figure 10B), it was undetectable (ND) in WKY animals for all groups, with the lowest values being found in SHRs receiving NAB. Regarding ASAP (Figure 10C), a significant decrease was found in WKY animals receiving AB (p < 0.01) and in SHRs across several experimental groups. Furthermore, in SHRs, the ASAP levels were higher than those found in WKY, except those receiving NAB. Regarding APN activity (Figure 10D), no significant differences were found between the groups, either in the WKY or SHRs. Finally, Figure 10E shows significant differences in the APB activity for both WKY and SHRs. In SHRs, APB activity was significantly elevated in the TW/NAB compared to the TW/AB group (p < 0.05). In WKY animals, the NAB and TW/NAB groups showed significant higher values compared to both the TW (p < 0.05), AB (p < 0.05) and TW/AB groups (p < 0.01).
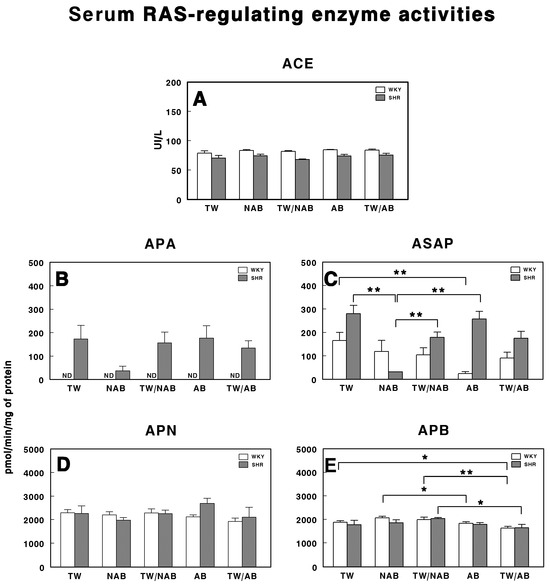
Figure 10.
(A) Angiotensin-converting enzyme (ACE) activity, and specific activities of aminopeptidase A (APA) (B), aspartyl aminopeptidase (ASAP) (C), aminopeptidase N (APN) (D), and aminopeptidase B (APB) (E) in the serum of Wistar–Kyoto rats (WKY) and spontaneously hypertensive rats (SHRs). Experimental groups included animals provided with tap water (TW), alcohol-free beer (NAB), tap water or alcohol-free beer at their discretion (TW/NAB), alcoholic beer (AB), or tap water and alcoholic beer at their discretion (TW/AB). Results are presented as ACE activity in IU/L, and for APA, ASAP, APN and APB, in picomoles of the corresponding aminoacyl-β-naphthylamide hydrolyzed per minute per milligram of protein (mean ± SEM; n = 8; * p < 0.05; ** p < 0.01).
3.7. Tissue RAS-Regulating Enzyme Activities
3.7.1. Renal Cortex
Figure 11 illustrates the specific activities of soluble and membrane-bound RAS-regulating enzymes in the renal cortex of the different groups in WKY and SHRs. Figure 11A shows the ACE activity, where a significant increase (p < 0.05) is observed in the TW/NAB group in WKY animals and a significant decrease (p < 0.05) is observed in the TW/NAB group in SHRs. In Figure 11B,C, the APA activity is presented in soluble and membrane-bound forms, respectively. Soluble APA shows a significant increase (p < 0.01) in the NAB group compared to TW, with a similar rise (p < 0.01) in the TW/NAB group in SHRs. In WKY animals, increased APA activity was also found in the NAB group, whereas a decrease occurs in the AB group (p < 0.01). In the membrane-bound form, the TW/AB group shows a significant increase (p < 0.01) in APA activity compared to the TW and TW/NAB groups in SHRs. No significant changes were observed in WKY animals.
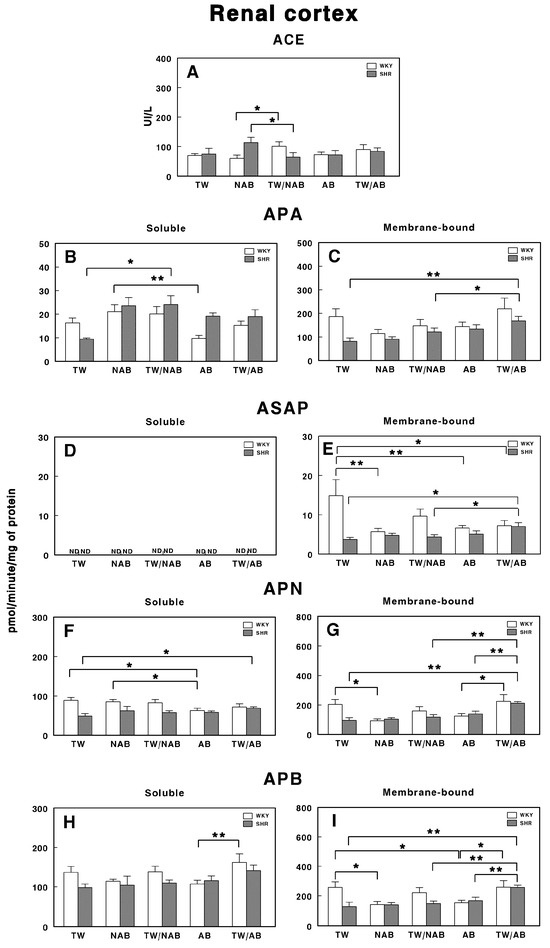
Figure 11.
(A) Angiotensin-converting enzyme (ACE) activity, and specific activities of soluble (B) and membrane-bound (C) aminopeptidase A (APA), soluble (D) and membrane-bound (E) aspartyl aminopeptidase (ASAP), soluble (F) and membrane-bound (G) aminopeptidase N (APN), and soluble (H) and membrane-bound (I) aminopeptidase B (APB) in the renal cortex of Wistar–Kyoto rats (WKY) and spontaneously hypertensive rats (SHRs). Experimental groups included animals provided with tap water (TW), alcohol-free beer (NAB), tap water or alcohol-free beer at their discretion (TW/NAB), alcoholic beer (AB), or tap water and alcoholic beer at their discretion (TW/AB). Results are presented as ACE activity in IU/L, and for APA, ASAP, APN and APB, in picomoles of the corresponding aminoacyl-β-naphthylamide hydrolyzed per minute per milligram of protein (mean ± SEM; n = 8; * p < 0.05; ** p < 0.01).
Figure 11D shows that ASAP activity in its soluble form is not detectable (ND) across all groups. However, in the membrane-bound form (Figure 11E), there is a significant elevation of ASAP activity in the TW/AB group (p < 0.01) compared to the TW and TW/NAB groups in SHRs, whereas in WKY animals, a significant decrease occurs after receiving NAB, AB and TW/AB (p < 0.05 and p < 0.01, respectively).
The APN activity, shown in Figure 11, demonstrates significant differences in both its soluble and membrane-bound forms. In the soluble form (Figure 11F), a significant increase (p < 0.05) is observed in the TW/AB group in SHR, whereas a significant decrease (p < 0.05) occurs in the AB group of WKY animals. In the membrane-bound form (Figure 11G), significant decreased levels appear in the NAB (p < 0.05), TW/NAB (p < 0.01) and AB groups (p < 0.05) in WKY animals, whereas the highest levels of APN occur in the TW/AB group in SHRs.
Finally, Figure 11H,I show the APB activity. In the soluble form, a significant increase (p < 0.01) is observed in the TW/AB group compared to the AB group, only in WKY animals. In the membrane-bound form, significant decreases are seen in the NAB (p < 0.05) and AB groups (p < 0.01) in WKY animals, whereas a significant increase in the TW/AB group (p < 0.01) occurs in SHRs.
3.7.2. Renal Medulla
Figure 12 illustrates the specific enzymatic activity of various peptidases involved in RAS regulation in the renal medulla of WKY and SHRs under the different beverage treatments (TW, NAB, TW/NAB, AB and TW/AB).
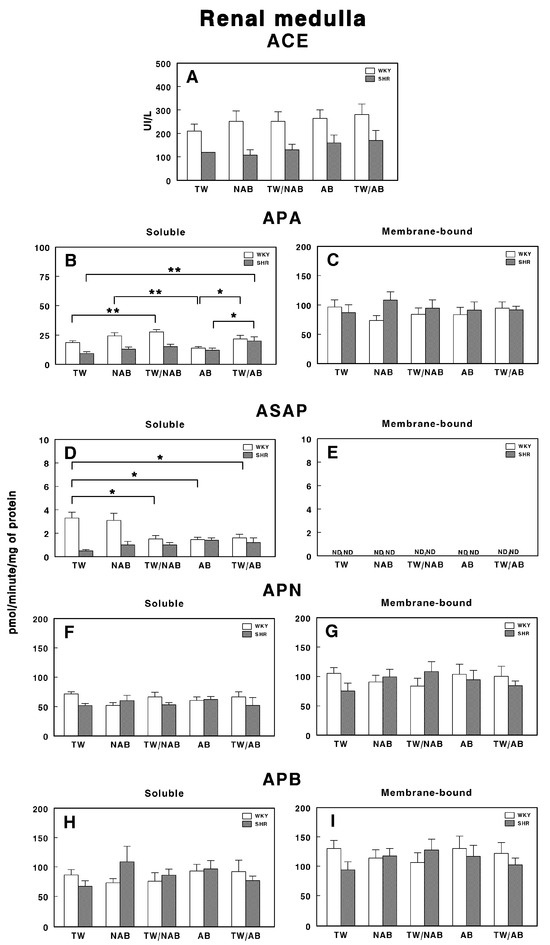
Figure 12.
(A) Angiotensin-converting enzyme (ACE) activity, and specific activities of soluble (B) and membrane-bound (C) aminopeptidase A (APA), soluble (D) and membrane-bound (E) aspartyl aminopeptidase (ASAP), soluble (F) and membrane-bound (G) aminopeptidase N (APN), and soluble (H) and membrane-bound (I) aminopeptidase B (APB) in the renal medulla of Wistar–Kyoto rats (WKY) and spontaneously hypertensive rats (SHRs). Experimental groups included animals provided with tap water (TW), alcohol-free beer (NAB), tap water or alcohol-free beer at their discretion (TW/NAB), alcoholic beer (AB), or tap water and alcoholic beer at their discretion (TW/AB). Results are presented as ACE activity in IU/L, and for APA, ASAP, APN and APB, in picomoles of the corresponding aminoacyl-β-naphthylamide hydrolyzed per minute per milligram of protein (mean ± SEM; n = 8; * p < 0.05; ** p < 0.01).
Regarding ACE activity (Figure 12A), no statistically significant differences are observed between treatment groups for either WKY or SHRs, although higher levels of ACE activity are found in WKY animals compared to SHRs.
Regarding soluble and membrane-bound APA specific activities, Figure 12B shows significant differences between treatment groups. Notably, SHRs treated with TW/NAB and TW/AB show a significant increase in soluble APA activity compared to those receiving TW, NAB or AB alone. In WKY rats, a similar trend is observed, where APA activity is significantly higher in the TW/NAB and TW/AB-treated groups relative to the TW-treated ones. Conversely, in the membrane-bound fraction (Figure 12C), no significant differences in APA activity are found between treatment groups in either WKY or SHRs.
Regarding ASAP activity in the soluble fraction (Figure 12D), WKY and SHRs exhibit contrary trends. Significant decreases in ASAP activity are observed in both WKY animals when treated with TW/NAB, AB and TW/AB compared to TW alone. On the contrary, no significant changes were observed in SHRs. In the membrane-bound fraction (Figure 12E), all activities remain undetectable (ND).
Regarding APN and APB, no significant changes were found in the soluble or membrane-bound activities after the different treatments, either in WKY or SHRs (Figure 12F–I).
3.7.3. Lung
Figure 13 illustrates the enzymatic activity of RAS-regulating peptidases in the lung of WKY and SHRs after the different beverage treatments.
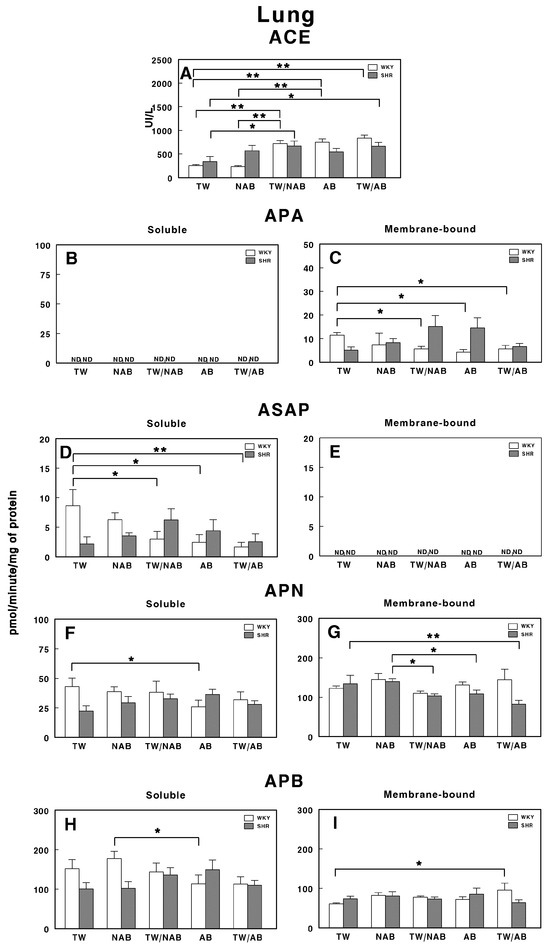
Figure 13.
(A) Angiotensin-converting enzyme (ACE) activity, and specific activities of soluble (B) and membrane-bound (C) aminopeptidase A (APA), soluble (D) and membrane-bound (E) aspartyl aminopeptidase (ASAP), soluble (F) and membrane-bound (G) aminopeptidase N (APN), and soluble (H) and membrane-bound (I) aminopeptidase B (APB) in the lung of Wistar–Kyoto rats (WKY) and spontaneously hypertensive rats (SHRs). Experimental groups included animals provided with tap water (TW), alcohol-free beer (NAB), tap water or alcohol-free beer at their discretion (TW/NAB), alcoholic beer (AB), or tap water and alcoholic beer at their discretion (TW/AB). Results are presented as ACE activity in IU/L, and for APA, ASAP, APN and APB, in picomoles of the corresponding aminoacyl-β-naphthylamide hydrolyzed per minute per milligram of protein (mean ± SEM; n = 8; * p < 0.05; ** p < 0.01).
Notably, the ACE activity in SHRs is significantly increased with the NAB and TW/NAB treatments compared to TW (p < 0.01). WKY animals also show significant increases in ACE activity under the TW/NAB, AB and TW/AB treatments compared to TW and NAB (p < 0.01; Figure 13A).
Regarding the soluble APA activity, it remains undetectable (ND) across all treatment groups for both WKY and SHRs (Figure 13B). In contrast, Figure 13C highlights significant changes in the membrane-bound APA activity, where, in WKY animals, the TW/NAB, AB and TW/AB treatments lead to a significant decrease (p < 0.05) compared to the TW group. In SHRs, a borderline non-significant increase appears in both the TW/NAB and AB groups compared to TW, NAB and TW/AB.
The soluble ASAP activity is significantly decreased in WKY animals receiving TW/NAB, AB and TW/AB (p < 0.05 and 0.01, respectively), whereas significant increases are seen in SHRs treated with NAB and TW/NAB compared to TW (p < 0.05). However, ASAP activity remains undetectable (ND) in the membrane-bound fraction across all treatment groups in both rat strains (Figure 13E).
Regarding soluble APN activity, only WKY animals showed a significant decrease after receiving AB, whereas in SHRs, no significant changes were observed across treatments (Figure 13F). The membrane-bound APN shows no significant changes with treatments in WKY animals, but decreases in membrane-bound APN activity occur in SHRs treated with TW/NAB, AB and TW/AB compared to TW (p < 0.05 and 0.01) (Figure 13G). Finally, regarding APB, a significant decrease (p < 0.05) appears in WKY animals treated with AB compared to NAB, whereas no significant changes occur in SHRs with the treatments (Figure 13H). Similarly, the membrane-bound APB increases significantly (p < 0.05) only in WKY animals receiving TW/AB and no changes appear in SHRs with the treatments (Figure 13I).
3.7.4. Hypothalamus
Figure 14 presents the effects of the various beverage treatments on the RAS-regulating specific enzymatic activities in the hypothalamus of WKY and SHRs. In Figure 14A, the ACE activity shows significant differences between WKY and SHRs across several treatments. The ACE activity is significantly elevated in WKY animals treated with TW/NAB and AB compared to TW and NAB (p < 0.05 and 0.01), but decreased in WKY animals treated with TW/AB (p < 0.01). On the contrary, no significant differences appear in SHRs.
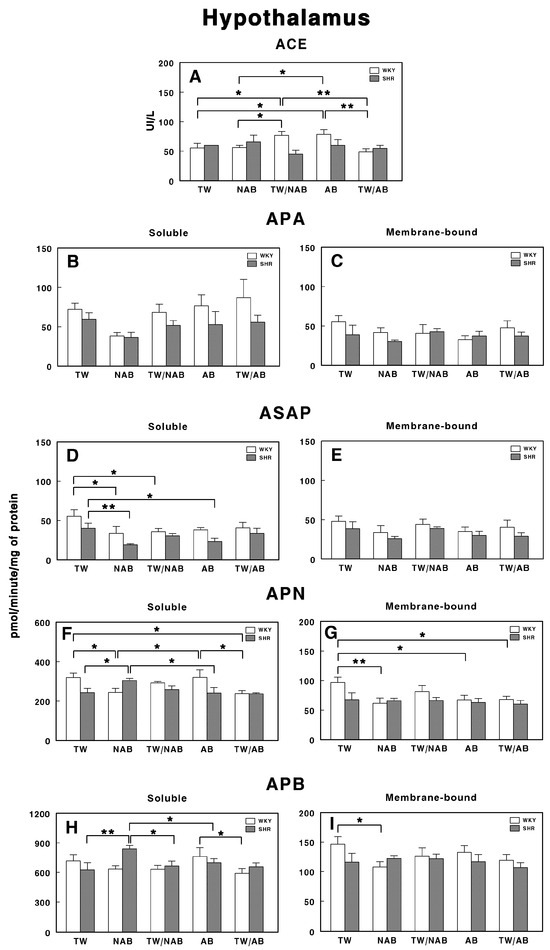
Figure 14.
(A) Angiotensin-converting enzyme (ACE) activity, and specific activities of soluble (B) and membrane-bound (C) aminopeptidase A (APA), soluble (D) and membrane-bound (E) aspartyl aminopeptidase (ASAP), soluble (F) and membrane-bound (G) aminopeptidase N (APN), and soluble (H) and membrane-bound (I) aminopeptidase B (APB) in the hypothalamus of Wistar–Kyoto rats (WKY) and spontaneously hypertensive rats (SHRs). Experimental groups included animals provided with tap water (TW), alcohol-free beer (NAB), tap water or alcohol-free beer at their discretion (TW/NAB), alcoholic beer (AB), or tap water and alcoholic beer at their discretion (TW/AB). Results are presented as ACE activity in IU/L, and for APA, ASAP, APN and APB, in picomoles of the corresponding aminoacyl-β-naphthylamide hydrolyzed per minute per milligram of protein (mean ± SEM; n = 8; * p < 0.05; ** p < 0.01).
For APA, no significant differences are observed either in the soluble or membrane-bound fractions either in WKY or SHRs (Figure 14B,C).
Only soluble ASAP activities showed significant differences between groups. Thus, WKY animals receiving NAB or TW/NAB had significantly decreased soluble ASAP specific activities (p < 0.05), whereas SHRs receiving NAB or AB also showed a significant decrease (p < 0.01 and 0.05) (Figure 14D).
Regarding soluble APN (Figure 14F), its specific activity was significantly increased or decreased in both rat strains depending on the beverage received. In WKY animals, NAB and TW/AB decrease the activity, whereas in SHRs, NAB increases it (p< 0.05 in all cases). In the membrane-bound fraction, the specific APN activity was only modified in WKY animals, where a significant decrease (p < 0.05 or 0.01) occurs with NAB, AB, and TW/AB (Figure 14G).
3.7.5. Anterior Pituitary
Figure 15 demonstrates the effects of the various treatments on RAS-regulating specific enzymatic activities in the anterior pituitary of WKY and SHRs after receiving TW, NAB, TW/NAB, AB and TW/AB.
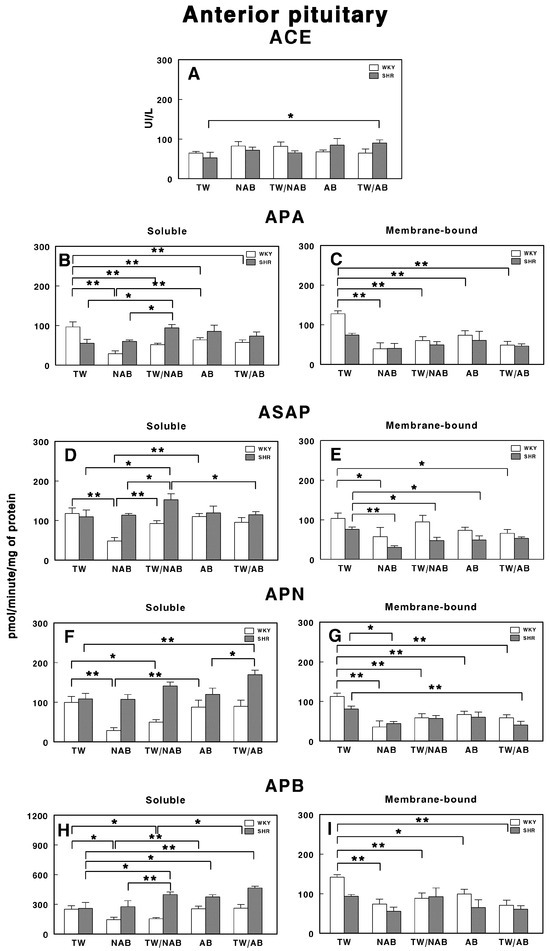
Figure 15.
(A) Angiotensin-converting enzyme (ACE) activity, and specific activities of soluble (B) and membrane-bound (C) aminopeptidase A (APA), soluble (D) and membrane-bound (E) aspartyl aminopeptidase (ASAP), soluble (F) and membrane-bound (G) aminopeptidase N (APN), and soluble (H) and membrane-bound (I) aminopeptidase B (APB) in the anterior pituitary of Wistar–Kyoto rats (WKY) and spontaneously hypertensive rats (SHRs). Experimental groups included animals provided with tap water (TW), alcohol-free beer (NAB), tap water or alcohol-free beer at their discretion (TW/NAB), alcoholic beer (AB), or tap water and alcoholic beer at their discretion (TW/AB). Results are presented as ACE activity in IU/L, and for APA, ASAP, APN and APB, in picomoles of the corresponding aminoacyl-β-naphthylamide hydrolyzed per minute per milligram of protein (mean ± SEM; n = 8; * p < 0.05; ** p < 0.01).
ACE activity only shows a significant increase in SHRs in the TW/AB treatment (p > 0.05). However, the differences between WKY and SHRs across treatments are minimal (Figure 15A).
The APA activity shows significant changes in both soluble and membrane-bound fractions. Soluble APA activity (Figure 15B) decreases significantly in all beverage groups when compared with TW in WKY animals (p < 0.01), with the lower value being in rats receiving NAB. On the contrary, in SHRs, only animals receiving TW/NAB have significant increases in their APA activity when compared with the NAB group (p < 0.05). Membrane-bound APA only showed significant differences in WKY animals (p < 0.01), with a similar trend to that seen in the soluble form (Figure 15C).
For the soluble ASAP specific activity, WKY animals receiving NAB showed the lowest significant difference (p < 0.01) compared to animals receiving TW and TW/NAB. In SHRs, animals receiving TW/NAB showed the highest values compared to the other treatments (p < 0.05; Figure 15D). In the membrane-bound fraction, WKY animals showed significantly decreased levels of ASAP after receiving NAB and TW/AB (p < 0.05 in both cases). On the contrary, in SHRs, membrane-bound ASAP significantly decreased in animals receiving NAB (p < 0.01), TW/NAB (p < 0.05) and AB (p < 0.05), but not TW/AB (Figure 15E).
The APN activity also shows substantial variability. In WKY animals, the soluble specific APN activity significantly decreased in animals receiving NAB (p < 0.01) and TW/NAB (p < 0.05) (Figure 15F). In SHRs, animals receiving TW/AB showed the highest values, with significant differences (p < 0.01 and p < 0.05, respectively) compared to animals receiving TW or AB. In the membrane-bound fraction, both WKY and SRHs showed significantly decreased values of APN specific activity in all groups when compared to animals receiving TW (Figure 15G).
The soluble APB specific activity showed substantial changes across treatments in both WKY and SHRs. Thus, in WKY animals, significant decreases were found in rats receiving NAB and TW/NAB (p < 0.05 in both cases). In SHRs, on the contrary, the soluble specific APB activity increased significantly in animals receiving TW/NAB, AB and TW/AB (p < 0.05 and p < 0.01) compared to those receiving TW (Figure 15H). For the membrane-bound specific APB activity, significant changes only appeared in WKY animals receiving NAB (p < 0.01), TW/NAB (p < 0.01), AB (p < 0.05) and TW/AB (p < 0.01) when compared to animals receiving TW alone (Figure 15I).
3.7.6. Posterior Pituitary
Figure 16 presents the soluble and membrane-bound forms of RAS-regulating specific enzyme activities in the posterior pituitary in WKY and SHRs receiving TW, NAB, TW/NAB, AB and TW/AB. The ACE activity remains largely unchanged across treatments and between the rat strains, suggesting that the treatment does not significantly influence this enzyme in the posterior pituitary (Figure 16A).
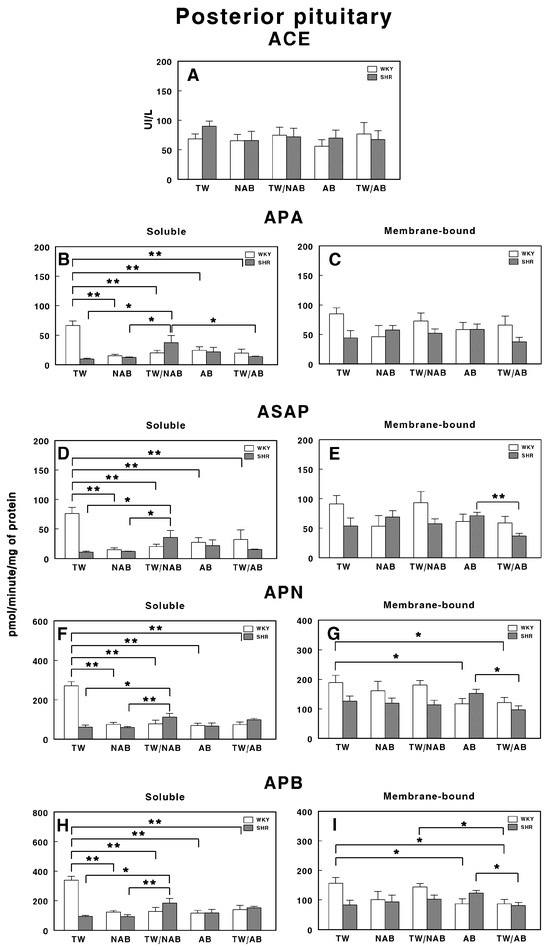
Figure 16.
(A) Angiotensin-converting enzyme (ACE) activity, and specific activities of soluble (B) and membrane-bound (C) aminopeptidase A (APA), soluble (D) and membrane-bound (E) aspartyl aminopeptidase (ASAP), soluble (F) and membrane-bound (G) aminopeptidase N (APN), and soluble (H) and membrane-bound (I) aminopeptidase B (APB) in the posterior pituitary of Wistar–Kyoto rats (WKY) and spontaneously hypertensive rats (SHRs). Experimental groups included animals provided with tap water (TW), alcohol-free beer (NAB), tap water or alcohol-free beer at their discretion (TW/NAB), alcoholic beer (AB), or tap water and alcoholic beer at their discretion (TW/AB). Results are presented as ACE activity in IU/L, and for APA, ASAP, APN and APB, in picomoles of the corresponding aminoacyl-β-naphthylamide hydrolyzed per minute per milligram of protein (mean ± SEM; n = 8; * p < 0.05; ** p < 0.01).
In contrast, the APA activity displays pronounced changes, particularly in the soluble fraction. The soluble APA activity decreases significantly in WKY rats after all treatments (p < 0.01) compared to TW, while SHRs show relatively low activity across all treatments, with an important significant increase (p <0.05) in animals receiving TW/NAB (Figure 16B). Membrane-bound APA exhibits no significant changes across treatments and between the two rat strains (Figure 16C).
The ASAP activity in the soluble fraction is also influenced by the treatments in a similar way to APA, decreasing significantly in WKY rats after all treatments (p < 0.01) compared to TW; meanwhile, SHRs show relatively low activity across all treatments, with an important significant increase (p <0.05) in animals receiving TW/NAB (Figure 16D). Membrane-bound ASAP exhibits also no significant changes across treatments and between the two rat strains, excepting a significant decrease in SHRs receiving TW/AB compared to animals receiving AB only (p < 0.01; Figure 16E).
The APN activity also shows significant treatment-dependent changes in a similar way to APA and ASAP. The soluble APN activity decreases significantly in WKY rats after all treatments (p < 0.01) compared to TW, while SHRs show relatively low activity across all treatments, with an important significant increase (p < 0.01) in animals receiving TW/NAB (Figure 16F). Membrane-bound APN exhibits significant decreased levels in WKY animals receiving AB or TW/AB (p < 0.05) or in SHRs receiving TW/AB compared to animals receiving AB only (p < 0.05; Figure 16G).
A similar pattern of changes is found for soluble APB-specific activities in both WKY and SHRs (Figure 16H). The membrane-bound form showed decreased levels of specific activity in WKY animals receiving AB (p <0.05) or TW/AB (p < 0.05) and, in a similar way to other membrane-bound activities, a significant decrease (p < 0.05) in SHRs receiving TW/AB compared to animals receiving AB only (Figure 16I).
3.7.7. Adrenal Cortex
Figure 17 presents the soluble and membrane-bound forms of RAS-regulating specific enzyme activities in the adrenal cortex in WKY and SHRs receiving TW, NAB, TW/NAB, AB and TW/AB. The ACE activity remains largely unchanged across treatments and between both rat strains (Figure 17A).
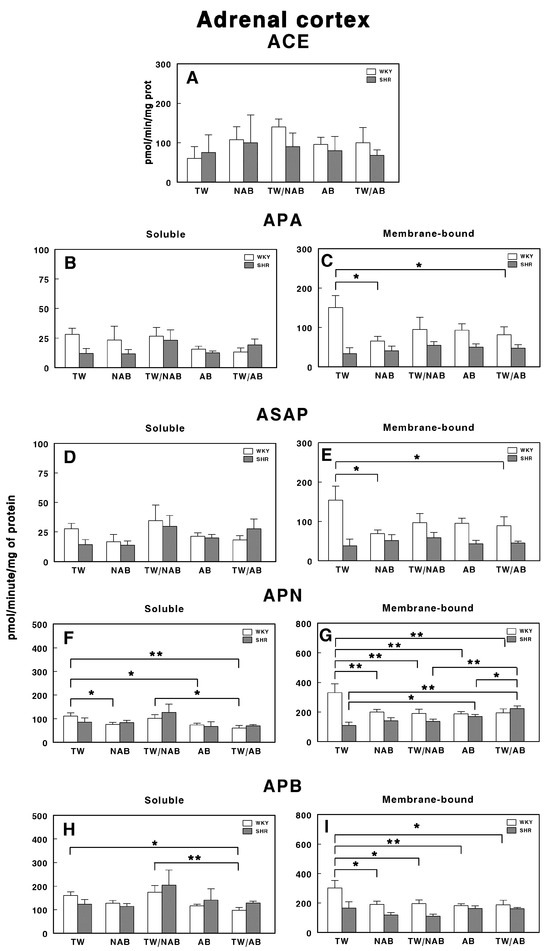
Figure 17.
(A) Angiotensin-converting enzyme (ACE) activity, and specific activities of soluble (B) and membrane-bound (C) aminopeptidase A (APA), soluble (D) and membrane-bound (E) aspartyl aminopeptidase (ASAP), soluble (F) and membrane-bound (G) aminopeptidase N (APN), and soluble (H) and membrane-bound (I) aminopeptidase B (APB) in the adrenal cortex of Wistar–Kyoto rats (WKY) and spontaneously hypertensive rats (SHRs). Experimental groups included animals provided with tap water (TW), alcohol-free beer (NAB), tap water or alcohol-free beer at their discretion (TW/NAB), alcoholic beer (AB), or tap water and alcoholic beer at their discretion (TW/AB). Results are presented as ACE activity in IU/L, and for APA, ASAP, APN and APB, in picomoles of the corresponding aminoacyl-β-naphthylamide hydrolyzed per minute per milligram of protein (mean ± SEM; n = 8; * p < 0.05; ** p < 0.01).
In the same way, the soluble specific APA activity showed no significant changes across beverage treatments in WKY or SHRs (Figure 17B). Regarding the membrane-bound APA activity, significant changes were only observed in WKY animals receiving NAB (p < 0.05) or TW/AB (p < 0.05; Figure 17C).
The soluble ASAP activity (Figure 17D) showed significant changes in neither WKY or SHRs across treatments, and the membrane-bound form, as for APA, showed significant changes only in WKY animals receiving NAB (p < 0.05) or TW/AB (p < 0.05; Figure 17E).
More pronounced changes appear for APN-specific activities. The soluble form was significantly decreased in WKY animals receiving NAB (p < 0.05), AB (p < 0.05) and TW/AB (p < 0.01; Figure 17F). The membrane-bound APN specific activity also decreased significantly in WKY animals with all beverage treatments (p < 0.01 in all cases); however, in SHRs, significant increases were found (p < 0.05 and p < 0.01) with AB and TW/AB beverage intake (Figure 17G).
The soluble APB specific activity decreased significantly only in WKY animals treated with TW/AB (p < 0.05 compared to TW and p < 0.01 compared to TW/NAB) (Figure 17H), whereas no significant changes were found in SHRs. In the same way, the membrane-bound APB (Figure 17I) significantly decreased in WKY animals in all beverage groups (p <0.05 and p < 0.01) but no significant changes were observed in SHRs (Figure 17I).
3.7.8. Adrenal Medulla
Figure 18 depicts the effects of consuming different beverages on RAS-regulating specific enzymatic activities in the adrenal medulla of WKY and SHRs after receiving TW, NAB, TW/NAB, AB and TW/AB.
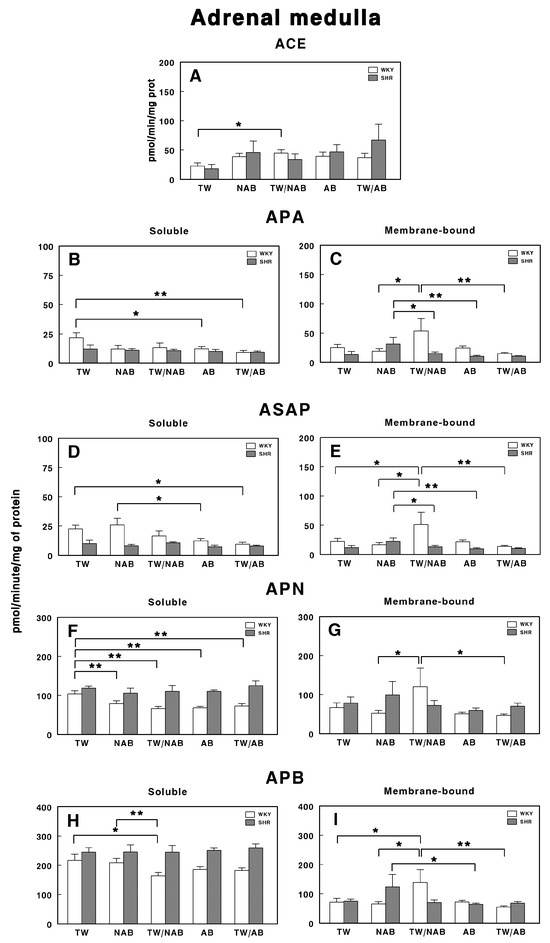
Figure 18.
(A) Angiotensin-converting enzyme (ACE) activity, and specific activities of soluble (B) and membrane-bound (C) aminopeptidase A (APA), soluble (D) and membrane-bound (E) aspartyl aminopeptidase (ASAP), soluble (F) and membrane-bound (G) aminopeptidase N (APN), and soluble (H) and membrane-bound (I) aminopeptidase B (APB) in the adrenal medulla of Wistar–Kyoto rats (WKY) and spontaneously hypertensive rats (SHRs). Experimental groups included animals provided with tap water (TW), alcohol-free beer (NAB), tap water or alcohol-free beer at their discretion (TW/NAB), alcoholic beer (AB), or tap water and alcoholic beer at their discretion (TW/AB). Results are presented as ACE activity in IU/L, and for APA, ASAP, APN and APB, in picomoles of the corresponding aminoacyl-β-naphthylamide hydrolyzed per minute per milligram of protein (mean ± SEM; n = 8; * p < 0.05; ** p < 0.01).
ACE activity only shows a significant increase in WKY animals receiving TW/NAB compared with TW (p > 0.05). No significant changes were observed in SHRs across treatments (Figure 18A).
The specific soluble APA activity was also modified in WKY rats, with a significant decrease found after AB (p < 0.05) and TW/AB intake (Figure 18B). SHRs did not show significant changes. Regarding the membrane-bound APA specific activity, significant changes were found in both WKY and SHRs. In WKY animals, this activity increased in animals receiving TW/NAB (p < 0.05), whereas in SHRs, the increase was found in animals receiving NAB (p < 0.05; Figure 18C).
Similar results were found for the soluble ASAP specific activity, with the lowest values found in WKY animals receiving TW/NAB, AB and TW/AB. No significant changes were observed for SHRs (Figure 18D). In the same way, for the membrane-bound specific ASAP activity, significant changes were found in both WKY and SHRs. In WKY animals, this activity increased in animals receiving TW/NAB (p < 0.05), whereas in SHRs, the increase was found in animals receiving NAB (p < 0.05; Figure 18E).
The soluble APN activity was significantly decreased in all groups of beverages compared to TW (p < 0.01) in WKY animals, whereas no significant changes were observed for SHRs (Figure 18F). No changes in the APN membrane-bound specific activity were observed in SHRs, although WKY animals showed significantly higher activity (p < 0.05) after the ingestion of WT/NAB (Figure 18G).
Regarding the APB specific activities, the soluble form was only significantly decreased in WKY animals receiving TW/NAB compared to TW (p < 0.05) or NAB (p < 0.01). SHRs did not show significant changes in soluble APB (Figure 18H). In contrast, the specific membrane-bound APB activity showed a significant increase in WKY animals receiving WT/NAB (p < 0.05), while SHRs receiving NAB also showed significantly higher values of membrane-bound APB activity (p < 0.05; Figure 18I).
3.7.9. Testis
Figure 19 presents the enzymatic activities of the RAS in the testis of WKY and SHRs under the different experimental conditions, that is, receiving TW, NAB, TW/NAB, AB or TW/AB.
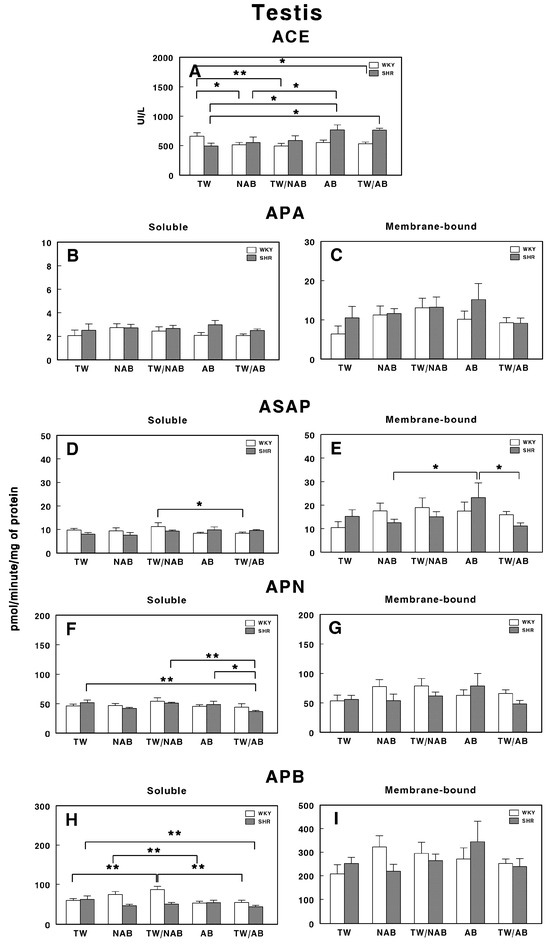
Figure 19.
(A) Angiotensin-converting enzyme (ACE) activity, and specific activities of soluble (B) and membrane-bound (C) aminopeptidase A (APA), soluble (D) and membrane-bound (E) aspartyl aminopeptidase (ASAP), soluble (F) and membrane-bound (G) aminopeptidase N (APN), and soluble (H) and membrane-bound (I) aminopeptidase B (APB) in the testis of Wistar–Kyoto rats (WKY) and spontaneously hypertensive rats (SHRs). Experimental groups included animals provided with tap water (TW), alcohol-free beer (NAB), tap water or alcohol-free beer at their discretion (TW/NAB), alcoholic beer (AB), or tap water and alcoholic beer at their discretion (TW/AB). Results are presented as ACE activity in IU/L, and for APA, ASAP, APN and APB, in picomoles of the corresponding aminoacyl-β-naphthylamide hydrolyzed per minute per milligram of protein (mean ± SEM; n = 8; * p < 0.05; ** p < 0.01).
In WKY animals, the ACE activity is significantly decreased in animals receiving NAB (p < 0.05), TW/NAB (p < 0.01) and TW/AB (p < 0.05). In SHRs, significant ACE activity was found in animals receiving AB (p < 0.05) or TW/AB (p < 0.05; Figure 19A).
For APA-specific activities, both the soluble (Figure 19B) and membrane-bound (Figure 19C) forms showed no significant differences between WKY and SHRs across all groups.
The soluble ASAP activity (Figure 19D) only showed significant differences in WKY animals receiving TW/NAB compared to animals receiving TW/AB (p < 0.05), whereas SHRs did not show significant changes. On the contrary, the membrane-bound ASAP activity did not change in WKY animals, but significantly increased in SHRs receiving AB (p < 0.05; Figure 19E).
APN only showed significant changes in its soluble form and in SHRs, but not in the membrane-bound form or WKY animals. Thus, a significant decrease in the soluble specific APN activity (p < 0.05) was found in SHRs receiving TW/AB (Figure 19F).
Similar results were found for APB activity. While no significant changes were observed in the membrane-bound specific activity either in WKY or SHRs (Figure 19I), a significant increase was found in WKY animals receiving TW/NAB (p < 0.01) or AB compared to NAB (p < 0.01; Figure 19H). Regarding SHRs, a significant decrease in the soluble APB specific activity was also found after TW/AB intake (p < 0.01).
4. Discussion
4.1. Food and Drink Intake
The results obtained in all the experimental groups considered in this study show that the highest beverage intake occurred in the group of animals that drank NAB non-moderately, resulting in lower food intake compared to the other groups. Our results confirm previous studies showing that in experimental animals, drink intake increases in individuals consuming beer while food intake decreases [70,71]. However, this is not reflected in a significant difference in animal weight. Here, we include groups where the rats had unlimited access to beer (AB or NAB). This suggests that intake in these groups could be considered ‘unmoderated’, as the animals could consume as much as they wished. The inclusion of groups where rats could choose between TW and beer (TW/AB and TW/NAB) allowed the exploration of a range of intakes that could be considered ‘more moderate’ than that of the groups with unrestricted access. In any case, recommendations regarding moderate alcohol consumption in humans are not directly applicable to animal studies.
4.2. Body Weight
Throughout the study period, weight followed the normal growth pattern of the strain to which they belonged, WKY or SHRs, without significant modifications. As previously described [71], although no significant difference was observed between groups, a lower weight gain was noted in the group of animals that drank NAB. These results also support studies conducted by Rowland et al., suggesting that beer consumption is not associated with obesity [70].
4.3. Blood Pressure and Heart Rate
We have shown that beer consumption does not modify blood pressure levels or heart rate. Thus, both the blood pressure and heart rate levels of hypertensive animals are not decreased, nor are they increased in normotensive animals. Several factors can explain this phenomenon, such as the presence of compensatory mechanisms or differences between the systemic and local regulation of RAS. The circulatory system uses an extensive mechanism to control blood pressure. If the pressure deviates from its normal mean value, nerve reflexes are activated within seconds, triggering changes that restore the pressure to normal levels. This may include adjustments to the extracellular fluid volume, and thus blood volume, to increase or decrease blood pressure. The observed changes in RAS regulatory enzyme activities, which vary according to the type of beer ingested and the group of animals, could be the result of these compensatory mechanisms acting to maintain stable blood pressure. Individual variability and genetic predisposition must also be considered: WKY and SHRs showed distinct patterns of RAS modulation in response to beer consumption. This suggests that genetic predisposition, such as the hypertensive phenotype in SHRs, plays a role in determining how beer consumption influences regulatory systems such as RAS. It is plausible that the lack of significant changes in blood pressure and heart rate is due, in part, to the resistance to developing hypertension in WKY rats, even in the face of RAS modulation. Finally, we should not lose sight of the possible long-term effects, and that the effects of beer consumption on blood pressure and heart rate may be manifested in the longer term. Additionally, the occasional modifications found could be due to phenomena related to animal handling, as they did not change throughout the study period. Therefore, beer seems to exert a positive effect on cardiovascular disease [30,31,32,33,34,35,36,37,38,39,71,72,73,74,75,76,77,78] and our results support that beer, alcoholic or non-alcoholic, does not produce negative effects on the development of hypertension.
4.4. Serum Biochemical Parameters
4.4.1. Chloride, Sodium, and Potassium Ions
In the present study, it was shown that the sodium and potassium ion levels were only modified in WKY animals. In the case of sodium, higher levels were observed with moderate AB intake. AB intake shows higher potassium levels than NAB intake. In WKY animals, the chloride ion levels decreased with beer intake, except with moderate AB intake, which increased these levels. Similarly, in SHRs, moderate AB intake showed higher chloride ion levels.
Chloride and sodium ions are important in regulating electrolyte balance, hydration, and osmotic pressure. The importance of sodium lies in its role in regulating the distribution of body fluids among various compartments. Potassium, when increased, indicates circulatory failure and renal insufficiency, and can also act as a vasodilator [5,12,79,80]. The results obtained, which are not associated with the absence of changes in blood pressure, may be due to the mechanisms of fluid and electrolyte balance regulation that occur to counteract the changes in body fluid volume that take place when intaking drinks from the different experimental groups considered in this study, as previously mentioned. It is worth noting that these compensatory mechanisms do not occur in hypertensive animals, which is likely one of the causes of hypertension itself, and are not affected by beer consumption.
4.4.2. Lipid Profile
AB intake causes a decrease in total cholesterol levels in WKY animals, although it has no effect on SHRs. Analyzing HDL and LDL values, we observe that the decrease in both lipoproteins is responsible for the decrease in total cholesterol. The effect of high alcohol consumption on increasing blood pressure and other vascular damage through various mechanisms is well known [74,77,81,82,83,84,85]. On the other hand, moderate alcohol consumption reduces this risk [39,86,87,88] as it helps to increase HDL cholesterol levels [89]. This so-called “good cholesterol” is higher than that in abstainers or heavy drinkers [90]. Other authors have found that beer improves the lipid profile by increasing HDL cholesterol and not modifying triglycerides [66,84,88,89,91]. Additionally, its components provide other benefits, such as phenolic compounds that act as antioxidants [92], and other vitamins that help prevent cardiovascular diseases [30,93,94,95]. Thus, authors [73,91,96] have found that beer has a protective effect compared to other types of beverages, providing more satisfactory blood pressure values. These data are supported by our results to a certain degree, showing that AB consumption has the ability to prevent the increase in serum cholesterol levels, both in its LDL and HDL components. It is interesting to note that both AB and NAB have the ability to decrease LDL levels, known as “bad cholesterol,” thus reinforcing the preventive role of beer in preventing the cerebrovascular problems associated with increased blood cholesterol.
4.4.3. Renal Function
Serum renal function parameters (urea, creatinine, and urate) are not modified by beer intake, except for urea, which is decreased with NAB intake. This change may be a temporary modification of renal function due to the high fluid intake that occurs, supporting the results of other authors [71], where these levels are not modified.
4.4.4. Hepatic Function
Serum hepatic function parameters (GOT, GPT, and alkaline phosphatase) are not modified by beer intake, except for GPT, which is increased with moderate AB intake. These results may reflect the hepatic hyperactivity needed to metabolize alcohol. However, this does not occur in SHRs even with moderate AB intake, leaving the exact mechanism causing this alteration unresolved. In fact, an increase in albumin levels has been observed in this group, which would contradict the existence of hepatic dysfunctions. Therefore, these occasional changes in hepatic function may be due to other mechanisms that, as indicated, would require further investigation.
4.5. RAS-Regulatory Enzymes
The identification of factors involved in the development of hypertension could improve therapeutic choices and suggest further research on the biological bases of hypertension. As already seen, angiotensin-related peptides play a key role in the development of hypertension. However, little attention has been paid to the proteolytic enzymes responsible for regulating the activity of these angiotensins. Therefore, in the present work, the behavior of these enzymes involved in RAS regulation, which have not yet been studied under the influence of beer, has been analyzed. However, there is previous knowledge about the effect of ethyl alcohol on these enzyme activities in the brain [97,98,99,100,101,102,103].
On the other hand, hypertension affects the body by impacting its renal function, the hypothalamic–pituitary–adrenal axis, and hepatic function, among others. This can lead to changes in metabolic function [104], resulting in the modification of enzyme activities. Since RAS-regulating enzymes are important in regulating the function of various peptide hormones, their modification due to the conditions of hypertension could reflect the functional state of the hormones and peptides they metabolize. Therefore, to evaluate the role of these enzymes in hypertension, the activities of several RAS regulatory enzymes (ACE, APA, ASAP, APN and APB) were determined in the serum, kidneys, lungs, hypothalamic–pituitary–adrenal axis, and testis of normotensive (WKY) and hypertensive (SHR) animals.
4.5.1. On the Regulatory Enzymes of the RAS in Serum
The present study shows changes in the serum activities of APB and ASAP. However, no changes are shown in the activities of ACE, APA, and APN. APB activity is modified after AB intake, both in WKY and SHRs. Finally, ASAP activity is modified with AB in WKY animals and with NAB in SHRs animals.
The circulating RAS is not considered the direct cause of increased blood pressure, with local or tissue RAS becoming increasingly important. However, the circulatory system uses an extensive system to control blood pressure; if it is modified above or below its normal value, a series of nervous reflexes are triggered in seconds; these lead to changes that return the pressure to normal, such as increasing or decreasing the volume of extracellular fluid, and therefore blood volume, to increase or decrease blood pressure [7,8,9,10,11,12,13,14].
It is thought that these actions of the RAS involve the coordinated action of the different peptides of the system, the Ang; since no sustained changes in blood pressure have been detected in any of the experimental groups considered in this study, the results obtained, which would imply alterations in the levels of angiotensin II, III, and IV, may be the response mechanisms of the body aimed precisely at avoiding changes in blood pressure, which are supposedly induced by NAB intake (which involves a high volume ingested in SHRs) and AB (which involves the hypertensive role of alcohol in WKY animals). The absence of changes in the opposite direction probably implies that the mechanisms of blood pressure regulation in WKY and SHRs are not the same.
4.5.2. On the Regulatory Enzymes of the RAS in the Hypothalamic-Pituitary-Adrenal Axis
The hypothalamic–pituitary–adrenal (HPA) axis is an important regulator of blood pressure and fluid and electrolyte homeostasis. In addition to the circulating RAS, local systems have been described in the brain, pituitary, and adrenal glands. These local RASs have been implicated in the central regulation of the cardiovascular system and body water balance, the secretion of pituitary hormones, and the secretion of aldosterone by the adrenal glands. However, it has been shown that their function is very different in males and females [19,66,69,105,106]. In any case, all the animals used in the present study were males.
In the hypothalamus, changes in ACE activity are observed in WKY animals with moderate NAB intake and non-moderate AB intake. These results are not repeated in SHRs. On the other hand, alterations in the ASAP, APB, and APN activities are observed in different directions depending on the experimental group and whether they are WKY or SHRs. Meanwhile, there are no changes in APA activity. The existence of many hypothalamic nuclei involved in neuroendocrine regulation through the RAS is well known [18,19,66,107,108,109]. With these data, the existence of compensatory mechanisms for maintaining blood pressure is shown; on the one hand, this is to regulate the high volume of liquid ingested with NAB, and on the other, to regulate the alcohol ingested with AB. It can be said that these mechanisms are different in WKY and SHRs, or that SHRs do not have them, which would be responsible for the hypertension shown by these animals. Beer does not decrease blood pressure levels in SHRs, and it does not increase levels in WKY animals.
At the pituitary level, both anterior and intermediate posterior, the most notable changes occur in the APA, ASAP, APB, and APN activities, while the ACE activity does not show significant alterations. Regarding the ASAP and APA activities, a decrease is observed with NAB in WKY animals and an increase is observed in SHRs with moderate NAB intake. Likewise, the mechanisms that regulate the body fluid volume differ in both groups, with beer not having the capacity to modify blood pressure in any of the groups. The APB and APN activities are similar, with small variations in SHRs, where the activities increase with both NAB and AB. These changes in RAS regulatory activities would imply alterations in different directions in the levels of the different angiotensins. It should be noted that pituitary angiotensins are involved in the processes that regulate the synthesis and release of a wide variety of hormones, such as vasopressin or antidiuretic hormone [18,19,106,110], also involved in the regulation of blood pressure. Therefore, beer consumption will modify these regulatory mechanisms at the pituitary level, which, as we have noted, will act differently in WKY and SHRs, probably with the same purpose but through different mechanisms. This is in order to avoid the increase in blood pressure in WKY and SHRs induced by the increase in blood volume or alcohol consumption. Beer also does not have the necessary capacity to decrease blood pressure with the modifications that take place at the level of pituitary hormonal regulation.
In the adrenal glands, the pattern of RAS regulatory enzyme activity is similar. Thus, no changes are observed in ACE activity, and few are observed in the APA and ASAP activities at the adrenal cortex level; meanwhile, significant changes appear in the APB and APN activities, both at the cortex and adrenal medulla levels, and in ASAP and APA at the medulla level. These changes consist of a decrease with AB intake in WKY animals in the soluble fraction and an increase with NAB intake in WKY animals in the membrane fraction. No modifications are observed in the soluble fraction in SHRs, but they are in the membrane fraction and in the same direction as the previous ones. As for APN, it is decreased in WKY animals with AB or NAB intake and increased in SHRs with AB. APB is decreased in the membrane fraction of WKY animals in the adrenal cortex, occurring oppositely in the adrenal medulla. In SHRs, there are no significant changes. The adrenal gland shows, as observed at different levels of the axis, alterations in the different Ang, occurring preferentially in WKY animals and not in SHRs. There is little doubt that the circulating and intra-adrenal RAS can stimulate aldosterone secretion, with angiotensin II being the main regulator of its secretion in adult animals [18,19,66]. Through this mechanism, they actively participate in blood pressure control. Once again, it is shown how compensatory mechanisms are much more active, or at least different, in WKY and SHRs. Evidently, these changes in the HPA axis, which occur in WKY animals and not in SHRs, may be responsible for the adequate control of blood pressure, which does not occur in SHRs; hence, they show hypertension. It is reiterated that beer does not have the capacity to decrease blood pressure in SHRs, but it does have the capacity to prevent an increase in pressure in WKY animals.
It can be concluded that the effects of beer on blood pressure may be mediated by changes in the regulatory activities of the RAS at different levels of the HPA axis.
4.5.3. On the Regulatory Enzymes of the RAS in the Kidney
At the renal level, limited changes in ACE activity are observed both at the cortical and medullary levels. Regarding cortical or medullary ASAP activity, the intake of alcoholic or non-alcoholic beer causes a decrease in this activity in WKY animals, while in SHRs, it causes an increase. APA activity shows a decrease in WKY animals with alcoholic beer and an increase with non-alcoholic beer. On the other hand, in SHRs, it increases with the intake of either type of beer. The APN and APB activities are only affected at the cortical level, where they increase with alcoholic beer and decrease with non-alcoholic beer in WKY animals; meanwhile, in SHRs, they increase with alcoholic beer.
Again, there are changes in the angiotensin levels at the renal level, which varies depending on the type of beer ingested and the group of animals considered. It has been previously mentioned that in the long term, most actions leading to hypertension may be balanced or compensated by the renal and body fluid systems. Thus, if pressure increases, the renal excretion of water doubles, and sodium excretion occurs. It is more likely that pressure increases due to salt intake rather than water, as water is excreted almost as it is ingested. Therefore, if the regulatory mechanisms of water and sodium excretion maintain the balance of fluids and sodium, normal blood pressure can be maintained [111,112,113,114].
The modifications in RAS regulatory enzymes in the present study, which vary depending on the type of beer ingested and the group of animals considered, are related to the absence of modifications in blood pressure levels. This, again, confirms or supports the idea that all changes produced in the regulatory enzymes of the RAS after beer intake are the result of compensation and the balance of fluids and electrolytes to maintain the pressure levels in each group through different mechanisms.
4.5.4. On the Regulatory Enzymes of the RAS in the Lung
Although the alterations described so far in ACE have been minimal, the pulmonary activity of this enzyme is profoundly affected in the different experimental groups considered in this study. Thus, ACE increases with the intake of alcoholic or non-alcoholic beer in both WKY and SHRs. However, both APA and ASAP activity decrease only in WKY animals with the intake of either type of beer, while in SHRs, the APN activity is altered, and also decreased.
This implies that ACE in the lung is the main factor responsible for maintaining blood pressure in these groups of animals and responds in the same direction to the different agents that induce hypertension. As mentioned, it is the conversion of angiotensin I to angiotensin II that occurs in the pulmonary vessels [115]. However, ACE is an enzyme that also has an affinity for other substrates, such as bradykinin (vasodilator) [116], and the resulting activity will be the consequence of the combined actions on its different substrates [105]. On the other hand, as in other tissues, the existing differences in other enzymatic activities between WKY and SHRs demonstrate the existence of mechanisms that act differently in both groups of animals to control blood pressure.
To summarize the results concerning the modulation of the RAS, significant changes in RAS enzyme activity have been found in several tissues, including the hypothalamic-pituitary–adrenal (HPA) axis, the kidneys and the lungs. Changes in the HPA axis indicate that beer consumption may influence neuroendocrine regulation. Changes in the kidneys suggest that beer consumption may affect the renal mechanisms involved in long-term blood pressure control. In the lungs, changes in angiotensin-converting enzyme (ACE) activity suggest that beer may influence the conversion of AngI to AngII. Some future clinical implications that could be explored are the effects of beer consumption in individuals with a genetic predisposition to hypertension. Given that significant differences in the response to beer consumption occur between WKY and SHRs, it is possible to investigate whether beer consumption, even in moderate amounts, might have a different impact on individuals with a genetic predisposition to hypertension. The impact of beer consumption on long-term kidney function may also be considered. Longitudinal studies in humans could assess whether regular beer consumption is associated with changes in kidney function or an increased risk of chronic kidney disease.
4.5.5. On the Regulatory Enzymes of the RAS in the Testis
The RAS is also involved in the regulation of testicular function, as several of its components occur in this tissue. Thus, the testicular RAS is involved in the regulation of testosterone production through AngII, which inhibits the function of Leydig cells through their AT1 receptor, responsible for testosterone production [111]. This process inhibits adenylate cyclase activity and reduces cAMP production, which in turn decreases testosterone production. Some researchers suggest that Ang III, generated from AngII by the action of APA or ASAP, may be the main effector of RAS in the testis. However, very little is known about the effect of beer on testicular function. One study found that rats that consumed beer for 4 weeks showed a decrease in the plasma levels of follicle-stimulating hormone (FSH) and 17β-estradiol (E2) compared to rats that consumed a 10% ethanol solution or water. The authors suggest that this effect could be due to the intake of the phenolic compounds present in beer, such as phytoestrogens, which have hormonal activity [117].
The same study also observed the lower expression of cleaved caspase-3 in the Leydig cells of rats that consumed beer for 4 weeks compared to those that consumed the ethanol solution. Caspase-3 is a key enzyme in cell apoptosis, so this finding suggests that beer consumption may protect Leydig cells from ethanol-induced cell death [117].
Another study found that drinking beer with alcohol led to an increase in P21 protein and gene expression and a decrease in cyclin D1 expression, as well as a reduction in superoxide dismutase (SOD) and catalase (CAT) levels, an increase in malondialdehyde (MDA) levels and subsequent tissue damage in testicular tissue in a time-dependent manner [118]. The seminiferous tubule diameter and germinal epithelial thickness were also reduced in a time-dependent manner, and the percentage of seminiferous tubules with tubular differentiation, replacement and negative spermiogenesis coefficients increased significantly, which in turn reduced sperm production and quality [118]. Overall, beer consumption can have both positive and negative effects on testicular function. Further research is necessary to understand the effects of beer on testicular functions through the RAS.
4.6. Limitations of the Study
Our study has some limitations that should be considered when interpreting the results. On the one hand, there is its duration. The 12-week intervention period may be considered too short to fully assess the long-term effects of beer consumption on cardiovascular health. Changes in blood pressure and RAS enzyme activity may be more pronounced or different with longer exposure to beer. Another limitation is the relatively small sample size, which may limit the statistical power of the study and the ability to detect significant differences between groups. There are also limitations in the measurement of blood pressure. The measurement of systolic blood pressure using the ‘tail-cuff’ method in non-anaesthetized animals may be prone to variability and stress. This may have introduced biases in the measurements and made it difficult to detect subtle changes in blood pressure. Finally, the results obtained in rats cannot be directly extrapolated to humans. Differences in the metabolism, physiology and patterns of alcohol consumption between species may affect how beer influences cardiovascular health.
It must be also considered that beer contains a variety of bioactive components, such as B vitamins, including folic acid, riboflavin, niacin, thiamine, pantothenic acid, biotin, and vitamin B12; minerals, including magnesium and calcium; and soluble fiber, natural antioxidants and other substances derived from malted barley, hops, water and yeast. Although our study does not specifically analyze the impact of these bioactive components, some possible effects are antioxidant effects, anti-inflammatory effects, effects on lipid metabolism or interactions with the endocrine system. Antioxidants may neutralize free radicals, which are known to be involved in the development of hypertension; some components of beer, such as polyphenols, have anti-inflammatory properties. Inflammation also plays a role in the development of hypertension. The B vitamins and soluble fiber present in beer may have contributed to the observed changes in lipid profile. Finally, some components of beer may interact with the endocrine system, including the RAS, through mechanisms not yet fully understood.
5. Conclusions
This study aimed to investigate the effects of alcoholic (AB) and non-alcoholic beer (NAB) consumption on blood pressure regulation and the activity of key enzymes involved in the renin–angiotensin system (RAS) in Wistar–Kyoto (WKY) rats and spontaneously hypertensive rats (SHR). The RAS plays a crucial role in maintaining blood pressure homeostasis through mechanisms that involve both systemic and local tissue regulation. The modulation of this system by dietary components, such as beer, presents a potential avenue for exploring how moderate alcohol or alcohol-free beer consumption might affect cardiovascular health.
The results demonstrated that beer consumption, regardless of its alcohol content, did not significantly affect systolic blood pressure or body weight in either rat strain. This finding is significant, as it suggests that moderate beer consumption, as tested in this study, does not contribute to the onset of hypertension in normotensive WKY rats, nor does it exacerbate the pre-existing hypertension characteristic of SHRs. These observations align with previous research indicating that moderate alcohol consumption does not necessarily lead to adverse cardiovascular outcomes.
While the lack of impact on systolic blood pressure was consistent across all experimental groups, both AB and NAB consumption resulted in notable alterations in the serum electrolyte levels, particularly sodium, potassium, and chloride. These changes were observed in both the WKY and SHR strains. The modulation of the electrolyte balance by beer consumption highlights its potential influence on cardiovascular health, as electrolyte homeostasis is intimately linked to blood pressure regulation and fluid balance. The observed alterations in serum electrolytes suggest that even non-alcoholic beer can affect physiological systems related to cardiovascular function, emphasizing the importance of understanding the broader metabolic consequences of regular beer intake, independent of alcohol content.
A key finding of this study was the significant modulation of RAS enzyme activity in various tissues, including the hypothalamus–pituitary–adrenal (HPA) axis, kidneys, and lungs. The changes in RAS enzymatic activity varied according to the rat strain, the type of beer consumed, and the specific tissue being analyzed. In particular, the HPA axis exhibited significant alterations in RAS enzyme activities, indicating that beer consumption may influence neuroendocrine regulation, which is critical for maintaining cardiovascular and fluid–electrolyte homeostasis. The kidney, a central organ in blood pressure regulation, due to its role in fluid and sodium balance, also showed significant changes in RAS enzyme activity, further supporting the hypothesis that beer consumption may impact the renal mechanisms involved in long-term blood pressure control. In the lungs, changes in angiotensin-converting enzyme (ACE) activity suggest that beer may influence the conversion of angiotensin I to angiotensin II, a key step in the RAS that contributes to blood pressure regulation through vasoconstriction.
Additionally, the study highlighted strain-specific differences in the response to beer consumption. WKY and SHRs displayed distinct patterns of RAS modulation and physiological responses to AB and NAB, underscoring the importance of considering individual variability when assessing the effects of dietary factors on cardiovascular health. These findings suggest that genetic predisposition, such as the hypertensive phenotype in SHRs, plays a role in determining how beer consumption influences key regulatory systems like the RAS.
Therefore, this study provides valuable insights into the complex interactions between beer consumption, RAS modulation, and cardiovascular health. While moderate beer consumption did not lead to significant changes in blood pressure in either WKY or SHRs, it did modulate RAS enzymatic activity in various tissues, suggesting potential implications for cardiovascular homeostasis. The differential effects observed between the two strains further emphasize the need for individualized approaches when assessing dietary impacts on health. Future research should aim to elucidate the specific mechanisms underlying the interaction between beer consumption and the RAS, as well as the long-term implications of these findings for human cardiovascular health.
Author Contributions
Conceptualization, M.D.M., C.C.-U., M.J.R.-E. and J.M.M.-M.; Formal analysis, C.C.-U., M.J.R.-E., M.D.M. and J.M.M.-M.; Investigation, M.D.M., C.C.-U., M.J.R.-E. and J.M.M.-M.; Methodology, M.D.M., C.C.-U., M.J.R.-E. and J.M.M.-M.; Resources, J.M.M.-M.; Supervision, M.J.R.-E. and J.M.M.-M.; Writing—original draft, M.D.M., C.C.-U., M.J.R.-E. and J.M.M.-M.; Writing—review & editing, M.J.R.-E. and J.M.M.-M. All authors have read and agreed to the published version of the manuscript.
Funding
This research received no external funding.
Institutional Review Board Statement
The animal study protocol was approved by the Ethics Committee of UNIVERSITY OF JAÉN (protocol code 31-01-2019/011).
Data Availability Statement
The data that support the findings of this study are available from the corresponding author, [J.M.M.-M.], upon reasonable request.
Conflicts of Interest
The authors declare no conflicts of interest.
References
- Schiffrin, E.L. Remodeling of resistance arteries in essential hypertension and effects of antihypertensive treatment. Am. J. Hypertens. 2004, 17, 1192–1200. [Google Scholar] [CrossRef] [PubMed]
- Guyenet, P.G. The sympathetic control of blood pressure. Nat. Rev. Neurosci. 2006, 7, 335–346. [Google Scholar] [CrossRef] [PubMed]
- Safar, M.E.; Asmar, R.; Benetos, A.; Blacher, J.; Boutouyrie, P.; Lacolley, P.; Laurent, S.; London, G.; Pannier, B.; Protogerou, A.; et al. Interaction Between Hypertension and Arterial Stiffness. Hypertension 2018, 72, 796–805. [Google Scholar] [CrossRef] [PubMed]
- Fowkes, F.G.; Lowe, G.D.; Rumley, A.; Lennie, S.E.; Smith, F.B.; Donnan, P.T. The relationship between blood viscosity and blood pressure in a random sample of the population aged 55 to 74 years. Eur. Heart J. 1993, 14, 597–601. [Google Scholar] [CrossRef] [PubMed]
- Kohan, D.E.; Rossi, N.F.; Inscho, E.W.; Pollock, D.M. Regulation of blood pressure and salt homeostasis by endothelin. Physiol. Rev. 2011, 91, 1–77. [Google Scholar] [CrossRef] [PubMed]
- Mitchell, G.F. Effects of central arterial aging on the structure and function of the peripheral vasculature: Implications for end-organ damage. J. Appl. Physiol. 2008, 105, 1652–1660. [Google Scholar] [CrossRef]
- Kelly, D.M.; Rothwell, P.M. Blood pressure and the brain: The neurology of hypertension. Pract. Neurol. 2020, 20, 100–108. [Google Scholar] [CrossRef]
- Botzer, A.; Finkelstein, Y.; Unger, R. Blood Pressure Regulation Evolved from Basic Homeostatic Components. Biomedicines 2021, 9, 469. [Google Scholar] [CrossRef]
- Munoz-Durango, N.; Fuentes, C.A.; Castillo, A.E.; Gonzalez-Gomez, L.M.; Vecchiola, A.; Fardella, C.E.; Kalergis, A.M. Role of the Renin-Angiotensin-Aldosterone System beyond Blood Pressure Regulation: Molecular and Cellular Mechanisms Involved in End-Organ Damage during Arterial Hypertension. Int. J. Mol. Sci. 2016, 17, 797. [Google Scholar] [CrossRef] [PubMed]
- Byars, S.G.; Prestes, P.R.; Suphapimol, V.; Takeuchi, F.; De Vries, N.; Maier, M.C.; Melo, M.; Balding, D.; Samani, N.; Allen, A.M.; et al. Four-week inhibition of the renin-angiotensin system in spontaneously hypertensive rats results in persistently lower blood pressure with reduced kidney renin and changes in expression of relevant gene networks. Cardiovasc. Res. 2024, 120, 769–781. [Google Scholar] [CrossRef]
- Coulson, T.G.; Miles, L.F.; Zarbock, A.; Burrell, L.M.; Patel, S.K.; von Groote, T.; Pilcher, D.; Weinberg, L.; Landoni, G.; Bellomo, R. Renin-angiotensin-aldosterone system dynamics after targeted blood pressure control using angiotensin II or norepinephrine in cardiac surgery: Mechanistic randomised controlled trial. Br. J. Anaesth. 2023, 131, 664–672. [Google Scholar] [CrossRef]
- Kalupahana, N.S.; Moustaid-Moussa, N. Beyond blood pressure, fluid and electrolyte homeostasis—Role of the renin angiotensin aldosterone system in the interplay between metabolic diseases and breast cancer. Acta Physiol. 2024, 240, e14164. [Google Scholar] [CrossRef]
- Martyniak, A.; Drozdz, D.; Tomasik, P.J. Classical and Alternative Pathways of the Renin-Angiotensin-Aldosterone System in Regulating Blood Pressure in Hypertension and Obese Adolescents. Biomedicines 2024, 12, 620. [Google Scholar] [CrossRef] [PubMed]
- Park, C.H.; Kim, H.W.; Park, J.T.; Chang, T.I.; Yoo, T.H.; Lee, J.; Sung, S.; Jung, J.Y.; Hyun, Y.Y.; Oh, K.H.; et al. Intrarenal Renin-Angiotensin System Activation Alters Relationship Between Systolic Blood Pressure and Progression of Chronic Kidney Disease. Hypertension 2023, 80, 1024–1034. [Google Scholar] [CrossRef] [PubMed]
- Baltatu, O.C.; Campos, L.A.; Bader, M. Local renin-angiotensin system and the brain--a continuous quest for knowledge. Peptides 2011, 32, 1083–1086. [Google Scholar] [CrossRef]
- Pan, H.; She, X.; Wu, H.; Ma, J.; Ren, D.; Lu, J. Long-Term Regulation of the Local Renin-Angiotensin System in the Myocardium of Spontaneously Hypertensive Rats by Feeding Bioactive Peptides Derived from Spirulina platensis. J. Agric. Food Chem. 2015, 63, 7765–7774. [Google Scholar] [CrossRef] [PubMed]
- Crowley, S.D.; Gurley, S.B.; Oliverio, M.I.; Pazmino, A.K.; Griffiths, R.; Flannery, P.J.; Spurney, R.F.; Kim, H.S.; Smithies, O.; Le, T.H.; et al. Distinct roles for the kidney and systemic tissues in blood pressure regulation by the renin-angiotensin system. J. Clin. Investig. 2005, 115, 1092–1099. [Google Scholar] [CrossRef]
- Garcia, M.J.; Martinez-Martos, J.M.; Mayas, M.D.; Carrera, M.P.; De la Chica, S.; Cortes, P.; Ramirez-Exposito, M.J. Hormonal status modifies renin-angiotensin system-regulating aminopeptidases and vasopressin-degrading activity in the hypothalamus-pituitary-adrenal axis of female mice. Med. Chem. 2008, 4, 336–347. [Google Scholar] [CrossRef] [PubMed]
- Garcia, M.J.; Martinez-Martos, J.M.; Mayas, M.D.; Carrera, M.P.; Ramirez-Exposito, M.J. Hormonal status modifies renin-angiotensin system-regulating aminopeptidases and vasopressin-degrading activity in the hypothalamus-pituitary-adrenal axis of male mice. Life Sci. 2003, 73, 525–538. [Google Scholar] [CrossRef]
- Illan-Cabeza, N.A.; Jimenez-Pulido, S.B.; Ramirez-Exposito, M.J.; Garcia-Garcia, A.R.; Pena-Ruiz, T.; Martinez-Martos, J.M.; Moreno-Carretero, M.N. Structural and theoretical studies on rhodium and iridium complexes with 5-nitrosopyrimidines. Effects on the proteolytic regulatory enzymes of the renin-angiotensin system in human tumoral brain cells. J. Inorg. Biochem. 2015, 143, 20–33. [Google Scholar] [CrossRef] [PubMed]
- Martinez-Martos, J.M.; Ramirez-Exposito, M.J. Dietary fat and hypertension: A novel approach through the proteolytic regulatory enzymes of the renin-angiotensin-system. Cardiovasc. Hematol. Agents Med. Chem. 2006, 4, 263–276. [Google Scholar] [CrossRef] [PubMed]
- He, R.; Wei, F.; Hu, Z.; Huang, A.; Wang, Y. Self-management in young and middle-aged patients with hypertension: A systematic review and meta-synthesis of qualitative studies. Syst. Rev. 2024, 13, 254. [Google Scholar] [CrossRef] [PubMed]
- Rodrigues, P.; Santos-Ribeiro, S.; Teodoro, T.; Gomes, F.V.; Leal, I.; Reis, J.P.; Goff, D.C., Jr.; Goncalves, A.; Lima, J.A.C. Association Between Alcohol Intake and Cardiac Remodeling. J. Am. Coll. Cardiol. 2018, 72, 1452–1462. [Google Scholar] [CrossRef] [PubMed]
- Eidelman, R.S.; Vignola, P.; Hennekens, C.H. Alcohol consumption and coronary heart disease: A causal and protective factor. Semin. Vasc. Med. 2002, 2, 253–256. [Google Scholar] [CrossRef] [PubMed]
- Rosenkranz, S.; Gibbs, J.S.; Wachter, R.; De Marco, T.; Vonk-Noordegraaf, A.; Vachiery, J.L. Left ventricular heart failure and pulmonary hypertension. Eur. Heart J. 2016, 37, 942–954. [Google Scholar] [CrossRef] [PubMed]
- Zimmermann, A.J.; Conen, D. How Does Alcohol Intake Relate to the Risk of Atrial Fibrillation? J. Atr. Fibrillation 2012, 5, 433. [Google Scholar] [CrossRef] [PubMed]
- Hatley, M.; Lam, T.; Ekeruo, I.; Taegtmeyer, H. Alcohol and Atrial Fibrillation: An Update and New Perspectives. Am. J. Med. 2024, 137, 1042–1048. [Google Scholar] [CrossRef]
- Reynolds, K.; Lewis, B.; Nolen, J.D.; Kinney, G.L.; Sathya, B.; He, J. Alcohol consumption and risk of stroke: A meta-analysis. JAMA 2003, 289, 579–588. [Google Scholar] [CrossRef]
- Jagla, F.; Pechanova, O. Age-Related Cognitive Impairment as a Sign of Geriatric Neurocardiovascular Interactions: May Polyphenols Play a Protective Role? Oxid. Med. Cell. Longev. 2015, 2015, 721514. [Google Scholar] [CrossRef]
- Arranz, S.; Chiva-Blanch, G.; Valderas-Martinez, P.; Medina-Remon, A.; Lamuela-Raventos, R.M.; Estruch, R. Wine, beer, alcohol and polyphenols on cardiovascular disease and cancer. Nutrients 2012, 4, 759–781. [Google Scholar] [CrossRef] [PubMed]
- de Gaetano, G.; Di Castelnuovo, A.; Rotondo, S.; Iacoviello, L.; Donati, M.B. A meta-analysis of studies on wine and beer and cardiovascular disease. Pathophysiol. Haemost. Thromb. 2002, 32, 353–355. [Google Scholar] [CrossRef]
- Di Castelnuovo, A.; Rotondo, S.; Iacoviello, L.; Donati, M.B.; De Gaetano, G. Meta-analysis of wine and beer consumption in relation to vascular risk. Circulation 2002, 105, 2836–2844. [Google Scholar] [CrossRef] [PubMed]
- Kondo, K. Beer and health: Preventive effects of beer components on lifestyle-related diseases. Biofactors 2004, 22, 303–310. [Google Scholar] [CrossRef]
- Marcos, A.; Serra-Majem, L.; Perez-Jimenez, F.; Pascual, V.; Tinahones, F.J.; Estruch, R. Moderate Consumption of Beer and Its Effects on Cardiovascular and Metabolic Health: An Updated Review of Recent Scientific Evidence. Nutrients 2021, 13, 879. [Google Scholar] [CrossRef] [PubMed]
- Osorio-Paz, I.; Brunauer, R.; Alavez, S. Beer and its non-alcoholic compounds in health and disease. Crit. Rev. Food Sci. Nutr. 2020, 60, 3492–3505. [Google Scholar] [CrossRef]
- Padro, T.; Munoz-Garcia, N.; Vilahur, G.; Chagas, P.; Deya, A.; Antonijoan, R.M.; Badimon, L. Moderate Beer Intake and Cardiovascular Health in Overweight Individuals. Nutrients 2018, 10, 1237. [Google Scholar] [CrossRef] [PubMed]
- Redondo, N.; Nova, E.; Diaz-Prieto, L.E.; Marcos, A. Effects of moderate beer consumption on health. Nutr. Hosp. 2018, 35, 41–44. [Google Scholar] [CrossRef] [PubMed]
- Sacanella Angles, I.; Casas Rodriguez, R.; Vinas Esmel, E.; Castro Barquero, S.; Sacanella Meseguer, E. Prevention of cardiovascular disease and fermented alcoholic beverages. Reality or fiction? Nutr. Hosp. 2019, 36, 58–62. [Google Scholar] [CrossRef] [PubMed]
- Spaggiari, G.; Cignarelli, A.; Sansone, A.; Baldi, M.; Santi, D. To beer or not to beer: A meta-analysis of the effects of beer consumption on cardiovascular health. PLoS ONE 2020, 15, e0233619. [Google Scholar] [CrossRef]
- Pedrera-Zamorano, J.D.; Lavado-Garcia, J.M.; Roncero-Martin, R.; Calderon-Garcia, J.F.; Rodriguez-Dominguez, T.; Canal-Macias, M.L. Effect of beer drinking on ultrasound bone mass in women. Nutrition 2009, 25, 1057–1063. [Google Scholar] [CrossRef]
- Zhang, S.; Jin, S.; Zhang, C.; Hu, S.; Li, H. Beer-gut microbiome alliance: A discussion of beer-mediated immunomodulation via the gut microbiome. Front. Nutr. 2023, 10, 1186927. [Google Scholar] [CrossRef] [PubMed]
- Imhof, A.; Blagieva, R.; Marx, N.; Koenig, W. Drinking modulates monocyte migration in healthy subjects: A randomised intervention study of water, ethanol, red wine and beer with or without alcohol. Diab. Vasc. Dis. Res. 2008, 5, 48–53. [Google Scholar] [CrossRef] [PubMed]
- Matsumoto, C.; Miedema, M.D.; Ofman, P.; Gaziano, J.M.; Sesso, H.D. An expanding knowledge of the mechanisms and effects of alcohol consumption on cardiovascular disease. J. Cardiopulm. Rehabil. Prev. 2014, 34, 159–171. [Google Scholar] [CrossRef] [PubMed]
- Maisch, B. Alcoholic cardiomyopathy: The result of dosage and individual predisposition. Herz 2016, 41, 484–493. [Google Scholar] [CrossRef] [PubMed]
- Manolis, T.A.; Apostolopoulos, E.J.; Manolis, A.A.; Melita, H.; Manolis, A.S. The proarrhythmic conundrum of alcohol intake. Trends Cardiovasc. Med. 2022, 32, 237–245. [Google Scholar] [CrossRef] [PubMed]
- Puddey, I.B.; Beilin, L.J.; Rakic, V. Alcohol, hypertension and the cardiovascular system: A critical appraisal. Addict. Biol. 1997, 2, 159–170. [Google Scholar] [CrossRef]
- Bell, R.A.; Mayer-Davis, E.J.; Martin, M.A.; D’Agostino, R.B., Jr.; Haffner, S.M. Associations between alcohol consumption and insulin sensitivity and cardiovascular disease risk factors: The Insulin Resistance and Atherosclerosis Study. Diabetes Care 2000, 23, 1630–1636. [Google Scholar] [CrossRef] [PubMed]
- Liptak, B.; Kaprinay, B.; Gasparova, Z. A rat-friendly modification of the non-invasive tail-cuff to record blood pressure. Lab Anim. 2017, 46, 251–253. [Google Scholar] [CrossRef] [PubMed]
- Shibata, Y.; Maruizume, T.; Miyage, H. Chemistry and industrial chemistry. J. Chem. Soc. Jpn. 1992, 9, 961–967. [Google Scholar]
- Farrel, E.C. Calxium. In Methods in Clinical Chemistry; Pesce, A.J., Kaplan, L.A., Eds.; Mosby: Maryland Heights, MO, USA, 1987; pp. 865–869. [Google Scholar]
- Tietz, N.W. Clinical Guide to Laboratory Tests; Saunders Company: Philadelphia, PA, USA, 1995. [Google Scholar]
- Praetorius, E.; Poulsen, H. Enzymatic determination of uric acid; with detailed directions. Scand. J. Clin. Lab. Investig. 1953, 5, 273–280. [Google Scholar] [CrossRef]
- Talke, H.; Schubert, G.E. Enzymatic Urea Determination in the Blood and Serum in the Warburg Optical Test. Klin. Wochenschr. 1965, 43, 174–175. [Google Scholar] [CrossRef] [PubMed]
- Bartels, H.; Bohmer, M.; Heierli, C. Serum creatinine determination without protein precipitation. Clin. Chim. Acta Int. J. Clin. Chem. 1972, 37, 193–197. [Google Scholar] [CrossRef] [PubMed]
- Peterson, J.I.; Young, D.S. Evaluation of the hexokinase-glucose-6-phosphate dehydrogenase method of determination of glucose in urine. Anal. Biochem. 1968, 23, 301–316. [Google Scholar] [CrossRef]
- Roeschlau, P.; Bernt, E.; Gruber, W. Enzymatic determination of total cholesterol in serum. Z. Fur Klin. Chem. Und Klin. Biochem. 1974, 12, 226. [Google Scholar]
- Sugiuchi, H.; Uji, Y.; Okabe, H.; Irie, T.; Uekama, K.; Kayahara, N.; Miyauchi, K. Direct measurement of high-density lipoprotein cholesterol in serum with polyethylene glycol-modified enzymes and sulfated alpha-cyclodextrin. Clin. Chem. 1995, 41, 717–723. [Google Scholar] [CrossRef]
- Siedel, J.; Schmuck, R.; Staepels, J. Long term stable liquid ready-to-use monoreagent for the enzymatic assay of serum and plasma triglycerides (GPO-PAD method). Clin. Chem. 1993, 39, 1127. [Google Scholar]
- Friedewald, W.T.; Levy, R.I.; Fredrickson, D.S. Estimation of the concentration of low-density lipoprotein cholesterol in plasma, without use of the preparative ultracentrifuge. Clin. Chem. 1972, 18, 499–502. [Google Scholar] [CrossRef] [PubMed]
- Tietz, N.W.; Rinker, A.D.; Shaw, L.M. International Federation of Clinical Chemistry. IFCC methods for the measurement of catalytic concentration of enzymes. Part 5. IFCC method for alkaline phosphatase (orthophosphoric-monoester phosphohydrolase, alkaline optimum, EC 3.1.3.1). IFCC Document Stage 2, Draft 1, 1983–03 with a view to an IFCC Recommendation. Clin. Chim. Acta Int. J. Clin. Chem. 1983, 135, 339F–367F. [Google Scholar]
- Bergmeyer, H.U.; Horder, M.; Rej, R. International Federation of Clinical Chemistry (IFCC) Scientific Committee, Analytical Section: Approved recommendation (1985) on IFCC methods for the measurement of catalytic concentration of enzymes. Part 2. IFCC method for aspartate aminotransferase (L-aspartate: 2-oxoglutarate aminotransferase, EC 2.6.1.1). J. Clin. Chem. Clin. Biochem. 1986, 24, 497–510. [Google Scholar]
- Bergmeyer, H.U.; Horder, M.; Rej, R. International Federation of Clinical Chemistry (IFCC) Scientific Committee, Analytical Section: Approved recommendation (1985) on IFCC methods for the measurement of catalytic concentration of enzymes. Part 3. IFCC method for alanine aminotransferase (L-alanine: 2-oxoglutarate aminotransferase, EC 2.6.1.2). J. Clin. Chem. Clin. Biochem. 1986, 24, 481–495. [Google Scholar] [PubMed]
- Belfield, A.; Goldberg, D.M. Revised assay for serum phenyl phosphatase activity using 4-amino-antipyrine. Enzyme 1971, 12, 561–573. [Google Scholar] [CrossRef] [PubMed]
- Doumas, B.T.; Watson, W.A.; Biggs, H.G. Albumin standards and the measurement of serum albumin with bromcresol green. Clin. Chim. Acta Int. J. Clin. Chem. 1971, 31, 87–96. [Google Scholar] [CrossRef]
- Bradford, M.M. A rapid and sensitive method for the quantitation of microgram quantities of protein utilizing the principle of protein-dye binding. Anal. Biochem. 1976, 72, 248–254. [Google Scholar] [CrossRef] [PubMed]
- Alves, M.F.; Araujo, M.C.; Juliano, M.A.; Oliveira, E.M.; Krieger, J.E.; Casarini, D.E.; Juliano, L.; Carmona, A.K. A continuous fluorescent assay for the determination of plasma and tissue angiotensin I-converting enzyme activity. Braz. J. Med. Biol. Res. 2005, 38, 861–868. [Google Scholar] [CrossRef] [PubMed]
- Arechaga, G.; Sanchez, B.; Alba, F.; de Dios Luna, J.; Luttenauer, L.; Martinez, J.M.; Ramirez, M. Subcellular distribution of soluble and membrane-bound Arg-beta-naphthylamide hydrolyzing activities in the developing and aged rat brain. Cell. Mol. Biol. Res. 1995, 41, 369–375. [Google Scholar]
- Arechaga, G.; Sanchez, B.; Alba, F.; Luna, J.D.; Prieto, I.; Martinez, J.M.; Ramirez, M. Developmental changes of soluble and membrane-bound aspartate aminopeptidase activities in rat brain. Rev. Esp. Fisiol. 1996, 52, 149–154. [Google Scholar]
- Ramirez-Exposito, M.J.; Martinez, J.M.; Prieto, I.; Alba, F.; Ramirez, M. Comparative distribution of glutamyl and aspartyl aminopeptidase activities in mouse organs. Horm. Metab. Res. 2000, 32, 161–163. [Google Scholar] [CrossRef]
- Rowland, N.E.; Nasrallah, N.; Robertson, K.L. Accurate caloric compensation in rats for electively consumed ethanol-beer or ethanol-polycose mixtures. Pharmacol. Biochem. Behav. 2005, 80, 109–114. [Google Scholar] [CrossRef]
- Diaz Prieto, L.E.; Gomez-Martinez, S.; Nova, E.; Marcos, A. Do we know what moderate alcohol consumption is? The particular case of beer. Nutr. Hosp. 2022, 39, 12–16. [Google Scholar] [CrossRef] [PubMed]
- Buemann, B.; Dyerberg, J.; Astrup, A. Alcohol drinking and cardiac risk. Nutr. Res. Rev. 2002, 15, 91–121. [Google Scholar] [CrossRef] [PubMed]
- Klatsky, A.L. Alcohol and cardiovascular health. Integr. Comp. Biol. 2004, 44, 324–328. [Google Scholar] [CrossRef] [PubMed]
- Sancen, M.; Leniz, A.; Macarulla, M.T.; Gonzalez, M.; Milton-Laskibar, I.; Portillo, M.P. Features of Non-Alcoholic Beer on Cardiovascular Biomarkers. Can It Be a Substitute for Conventional Beer? Nutrients 2023, 15, 173. [Google Scholar] [CrossRef]
- Seiler, C. Alcohol, the heart and cardiovascular system. Ther. Umsch. 2000, 57, 200–204. [Google Scholar] [CrossRef] [PubMed]
- Trius-Soler, M.; Marhuenda-Munoz, M.; Laveriano-Santos, E.P.; Martinez-Huelamo, M.; Sasot, G.; Storniolo, C.E.; Estruch, R.; Lamuela-Raventos, R.M.; Tresserra-Rimbau, A. Moderate Consumption of Beer (with and without Ethanol) and Menopausal Symptoms: Results from a Parallel Clinical Trial in Postmenopausal Women. Nutrients 2021, 13, 2278. [Google Scholar] [CrossRef] [PubMed]
- Trius-Soler, M.; Martinez-Carrasco, P.; Tresserra-Rimbau, A.; Moreno, J.J.; Estruch, R.; Lamuela-Raventos, R.M. Effect of moderate beer consumption (with and without ethanol) on cardiovascular health in postmenopausal women. J. Sci. Food Agric. 2023, 103, 7506–7516. [Google Scholar] [CrossRef] [PubMed]
- Vilahur, G.; Casani, L.; Mendieta, G.; Lamuela-Raventos, R.M.; Estruch, R.; Badimon, L. Beer elicits vasculoprotective effects through Akt/eNOS activation. Eur. J. Clin. Investig. 2014, 44, 1177–1188. [Google Scholar] [CrossRef] [PubMed]
- Castro-Sepulveda, M.; Johannsen, N.; Astudillo, S.; Jorquera, C.; Alvarez, C.; Zbinden-Foncea, H.; Ramirez-Campillo, R. Effects of Beer, Non-Alcoholic Beer and Water Consumption before Exercise on Fluid and Electrolyte Homeostasis in Athletes. Nutrients 2016, 8, 345. [Google Scholar] [CrossRef] [PubMed]
- Rasoul, D.; Ajay, A.; Abdullah, A.; Mathew, J.; Lee Wei En, B.; Mashida, K.; Sankaranarayanan, R. Alcohol and Heart Failure. Eur. Cardiol. 2023, 18, e65. [Google Scholar] [CrossRef] [PubMed]
- Baumgartner, C.; Zeiler, K.; Auff, E.; Dal Bianco, P.; Holzner, F.; Lesch, O.M.; Deecke, L. Does alcohol consumption promote the manifestation of strokes? Considerations on pathophysiology. Wien. Klin. Wochenschr. 1988, 100, 99–107. [Google Scholar] [PubMed]
- Cecchini, M.; Filippini, T.; Whelton, P.K.; Iamandii, I.; Di Federico, S.; Boriani, G.; Vinceti, M. Alcohol Intake and Risk of Hypertension: A Systematic Review and Dose-Response Meta-Analysis of Nonexperimental Cohort Studies. Hypertension 2024, 81, 1701–1715. [Google Scholar] [CrossRef]
- Kelbaek, H.S. Alcohol and the heart. Ugeskr. Laeger 1995, 157, 1505–1509. [Google Scholar] [PubMed]
- Pardell, H.; Armario, P.; Hernandez, R. [Pathogenesis and epidemiology of arterial hypertension]. Drugs 1998, 56 (Suppl. 2), 1–10. [Google Scholar] [CrossRef]
- Husain, K.; Ansari, R.A.; Ferder, L. Alcohol-induced hypertension: Mechanism and prevention. World J. Cardiol. 2014, 6, 245–252. [Google Scholar] [CrossRef]
- Cerrillo, I.; Escudero-Lopez, B.; Ortega, A.; Martin, F.; Fernandez-Pachon, M.S. Effect of daily intake of a low-alcohol orange beverage on cardiovascular risk factors in hypercholesterolemic humans. Food Res. Int. 2019, 116, 168–174. [Google Scholar] [CrossRef]
- Daimiel, L.; Mico, V.; Diez-Ricote, L.; Ruiz-Valderrey, P.; Istas, G.; Rodriguez-Mateos, A.; Ordovas, J.M. Alcoholic and Non-Alcoholic Beer Modulate Plasma and Macrophage microRNAs Differently in a Pilot Intervention in Humans with Cardiovascular Risk. Nutrients 2021, 13, 69. [Google Scholar] [CrossRef] [PubMed]
- Cleophas, T.J. Wine, beer and spirits and the risk of myocardial infarction: A systematic review. Biomed. Pharmacother. 1999, 53, 417–423. [Google Scholar] [CrossRef] [PubMed]
- Bobak, M.; Skodova, Z.; Marmot, M. Effect of beer drinking on risk of myocardial infarction: Population based case-control study. BMJ 2000, 320, 1378–1379. [Google Scholar] [CrossRef] [PubMed][Green Version]
- Sherk, A.; Gilmore, W.; Churchill, S.; Lensvelt, E.; Stockwell, T.; Chikritzhs, T. Implications of Cardioprotective Assumptions for National Drinking Guidelines and Alcohol Harm Monitoring Systems. Int. J. Environ. Res. Public Health 2019, 16, 4956. [Google Scholar] [CrossRef]
- Hoffmeister, H.; Schelp, F.P.; Mensink, G.B.; Dietz, E.; Bohning, D. The relationship between alcohol consumption, health indicators and mortality in the German population. Int. J. Epidemiol. 1999, 28, 1066–1072. [Google Scholar] [CrossRef] [PubMed][Green Version]
- Chiva-Blanch, G.; Magraner, E.; Condines, X.; Valderas-Martinez, P.; Roth, I.; Arranz, S.; Casas, R.; Navarro, M.; Hervas, A.; Siso, A.; et al. Effects of alcohol and polyphenols from beer on atherosclerotic biomarkers in high cardiovascular risk men: A randomized feeding trial. Nutr. Metab. Cardiovasc. Dis. 2015, 25, 36–45. [Google Scholar] [CrossRef]
- Martinez Alvarez, J.R.; Belles, V.V.; Lopez-Jaen, A.B.; Marin, A.V.; Codoner-Franch, P. Effects of alcohol-free beer on lipid profile and parameters of oxidative stress and inflammation in elderly women. Nutrition 2009, 25, 182–187. [Google Scholar] [CrossRef] [PubMed]
- Martinez-Gomez, A.; Caballero, I.; Blanco, C.A. Phenols and Melanoidins as Natural Antioxidants in Beer. Structure, Reactivity and Antioxidant Activity. Biomolecules 2020, 10, 400. [Google Scholar] [CrossRef] [PubMed]
- Hernandez-Quiroz, F.; Nirmalkar, K.; Villalobos-Flores, L.E.; Murugesan, S.; Cruz-Narvaez, Y.; Rico-Arzate, E.; Hoyo-Vadillo, C.; Chavez-Carbajal, A.; Pizano-Zarate, M.L.; Garcia-Mena, J. Influence of moderate beer consumption on human gut microbiota and its impact on fasting glucose and beta-cell function. Alcohol 2020, 85, 77–94. [Google Scholar] [CrossRef] [PubMed]
- Klatsky, A.L.; Friedman, G.D.; Armstrong, M.A.; Kipp, H. Wine, liquor, beer, and mortality. Am. J. Epidemiol. 2003, 158, 585–595. [Google Scholar] [CrossRef] [PubMed]
- Mayas, M.D.; Martinez-Martos, J.M.; Ramirez-Exposito, M.J.; Garcia, M.J.; Tsuboyama, G.K.; Prieto, I.; Arechaga, G.; Ramirez, M. In vitro study of the effect of ethanol on pyroglutamyl aminopeptidase activity in mouse synaptosomes under basal and stimulated conditions. Rev. Neurol. 2000, 30, 128–131. [Google Scholar] [PubMed]
- Mayas, M.D.; Ramirez-Exposito, M.J.; Garcia, M.J.; Carrera, M.P.; Cobo, M.; Camacho, B.; Martinez Martos, J.M. Chronic ethanol intake modifies renin-angiotensin system-regulating aminopeptidase activities in mouse cerebellum. Neuropeptides 2005, 39, 67–72. [Google Scholar] [CrossRef]
- Mayas, M.D.; Ramirez-Exposito, M.J.; Garcia, M.J.; Carrera, M.P.; Martinez-Martos, J.M. Influence of chronic ethanol intake on mouse synaptosomal aspartyl aminopeptidase and aminopeptidase A: Relationship with oxidative stress indicators. Alcohol 2012, 46, 481–487. [Google Scholar] [CrossRef]
- Mayas, M.D.; Ramirez-Exposito, M.J.; Garcia, M.J.; Carrera, P.; Martinez-Martos, J.M. Ethanol modulates neuropeptide-degrading aminopeptidases at synapse level in calcium-dependent conditions. Alcohol Alcohol. 2004, 39, 393–405. [Google Scholar] [CrossRef]
- Mayas, M.D.; Ramirez-Exposito, M.J.; Garcia, M.J.; Ramirez, M.; Martinez-Martos, J.M. Ethanol modifies differently aspartyl- and glutamyl-aminopeptidase activities in mouse frontal cortex synaptosomes. Brain Res. Bull. 2002, 57, 195–203. [Google Scholar] [CrossRef]
- Mayas, M.D.; Ramirez-Exposito, M.J.; Garcia, M.J.; Tsuboyama, G.; Ramirez, M.; Martinez-Martos, J.M. Calcium-dependent modulation by ethanol of mouse synaptosomal pyroglutamyl aminopeptidase activity under basal and K(+)-stimulated conditions. Neurosci. Lett. 2000, 293, 199–202. [Google Scholar] [CrossRef]
- Mayas, M.D.; Ramirez-Exposito, M.J.; Garcia-Lopez, M.J.; Carrera, M.P.; Martinez-Martos, J.M. Chronic ethanol intake modifies pyrrolidon carboxypeptidase activity in mouse frontal cortex synaptosomes under resting and K+ -stimulated conditions: Role of calcium. Neurosci. Lett. 2008, 439, 75–78. [Google Scholar] [CrossRef]
- Fujita, N.; Takei, Y. Alcohol consumption and metabolic syndrome. Hepatol. Res. 2011, 41, 287–295. [Google Scholar] [CrossRef] [PubMed]
- Ramirez-Exposito, M.J.; Martinez-Martos, J.M.; Prieto, I.; Alba, F.; Ramirez, M. Angiotensinase activity in mice fed an olive oil-supplemented diet. Peptides 2001, 22, 945–952. [Google Scholar] [CrossRef] [PubMed]
- Ramirez-Exposito, M.J.; Mayas, M.D.; Garcia, M.J.; Ramirez, M.; Martinez-Martos, J.M. Pituitary aminopeptidase activities involved in blood-pressure regulation are modified by dietary cholesterol: Sex differences. Regul. Pept. 2001, 102, 87–92. [Google Scholar] [CrossRef] [PubMed]
- de la Chica-Rodriguez, S.; Cortes-Denia, P.; Ramirez-Exposito, M.J.; Martinez-Martos, J.M. Effects of alpha1-adrenergic receptor blockade by doxazosin on renin-angiotensin system-regulating aminopeptidase and vasopressin-degrading activities in male and female rat thalamus. Horm. Metab. Res. 2007, 39, 813–817. [Google Scholar] [CrossRef] [PubMed]
- Daimon, M.; Kamba, A.; Murakami, H.; Mizushiri, S.; Osonoi, S.; Matsuki, K.; Sato, E.; Tanabe, J.; Takayasu, S.; Matsuhashi, Y.; et al. Dominance of the hypothalamus-pituitary-adrenal axis over the renin-angiotensin-aldosterone system is a risk factor for decreased insulin secretion. Sci. Rep. 2017, 7, 11360. [Google Scholar] [CrossRef]
- Pan, S.; Worker, C.J.; Feng Earley, Y. The hypothalamus as a key regulator of glucose homeostasis: Emerging roles of the brain renin-angiotensin system. Am. J. Physiol. Cell Physiol. 2023, 325, C141–C154. [Google Scholar] [CrossRef]
- Ramirez-Exposito, M.J.; Martinez-Martos, J.M.; Canton-Habas, V.; Carrera-Gonzalez, M.D.P. Moderate Beer Consumption Modifies Tumoral Growth Parameters and Pyrrolidone Carboxypeptidase Type-I and Type-II Specific Activities in the Hypothalamus-Pituitary-Mammary Gland Axis in an Animal Model of Breast Cancer. Nutr. Cancer 2021, 73, 2695–2707. [Google Scholar] [CrossRef] [PubMed]
- de la Chica-Rodriguez, S.; Cortes-Denia, P.; Ramirez-Exposito, M.J.; de Saavedra, J.M.; Sanchez-Agesta, R.; Perez Mdel, C.; Martinez-Martos, J.M. In vivo administration of doxazosin in rats highly decreases serum circulating levels of testosterone through a mechanism involving the testicular renin-angiotensin system. Int. J. Androl. 2008, 31, 364–370. [Google Scholar] [CrossRef] [PubMed]
- Ramirez-Exposito, M.J.; Arrazola, M.; Carrera-Gonzalez, M.P.; Arias de Saavedra, J.M.; Sanchez-Agesta, R.; Mayas, M.D.; Martinez-Martos, J.M. Serum specific vasopressin-degrading activity is related to blood total cholesterol levels in men but not in women. Med. Chem. 2012, 8, 749–752. [Google Scholar] [CrossRef] [PubMed]
- Ramirez-Exposito, M.J.; Martinez-Martos, J.M. Hypertension, RAS, and gender: What is the role of aminopeptidases? Heart Fail. Rev. 2008, 13, 355–365. [Google Scholar] [CrossRef] [PubMed]
- Sanchez-Agesta Ortega, R.; Arias de Saavedra-Alias, J.M.; Liebana-Canada, A.; Sanchez-Munoz, B.; Martinez-Martos, J.M.; Ramirez-Exposito, M.J. Circulating aminopeptidase activities in men and women with essential hypertension. Curr. Med. Chem. 2013, 20, 4935–4945. [Google Scholar] [CrossRef]
- Aydin, F.; Turkoglu, V.; Bas, Z. Purification and characterization of angiotensin-converting enzyme (ACE) from sheep lung. Mol. Biol. Rep. 2021, 48, 4191–4199. [Google Scholar] [CrossRef] [PubMed]
- Wosten-van Asperen, R.M.; Lutter, R.; Haitsma, J.J.; Merkus, M.P.; van Woensel, J.B.; van der Loos, C.M.; Florquin, S.; Lachmann, B.; Bos, A.P. ACE mediates ventilator-induced lung injury in rats via angiotensin II but not bradykinin. Eur. Respir. J. 2008, 31, 363–371. [Google Scholar] [CrossRef] [PubMed]
- Oczkowski, M.; Rembiszewska, A.; Dziendzikowska, K.; Wolinska-Witort, E.; Kolota, A.; Malik, A.; Stachon, M.; Lachowicz, K.; Gromadzka-Ostrowska, J. Beer consumption negatively regulates hormonal reproductive status and reduces apoptosis in Leydig cells in peripubertal rats. Alcohol 2019, 78, 21–31. [Google Scholar] [CrossRef] [PubMed]
- Zamir-Nasta, T.; Abbasi, A.; Amini, K.; Mohammadi, E.; Jalili, C. Alcoholic beer consumption permutes P21 and cyclin D1 expression, oxidative stress factors, and histomorphometric parameters in rat testis. Alcohol 2024, 117, 21–26. [Google Scholar] [CrossRef]


Disclaimer/Publisher’s Note: The statements, opinions and data contained in all publications are solely those of the individual author(s) and contributor(s) and not of MDPI and/or the editor(s). MDPI and/or the editor(s) disclaim responsibility for any injury to people or property resulting from any ideas, methods, instructions or products referred to in the content. |
© 2025 by the authors. Licensee MDPI, Basel, Switzerland. This article is an open access article distributed under the terms and conditions of the Creative Commons Attribution (CC BY) license (https://creativecommons.org/licenses/by/4.0/).