Abstract
The Top App Bar (TAB) seamlessly integrates essential elements such as app titles, navigation icons, action buttons, and search fields without creating visual clutter. However, designing a well-structured TAB presents a challenge, particularly for novice UI designers, due to the need to balance aesthetics, functionality, usability, and user experience within a limited space. This study introduces an auxiliary design method to address this challenge. It proposes the sequence representation learning technique to cluster TABs in software repositories based on their structure. A novice designer can input their preconceptualized structure to retrieve design examples from the software repository’s TAB clusters that have structures identical or similar to their concepts. Experimental results demonstrate the method’s effectiveness, achieving an accuracy of 66.7% and an F-1 score of 0.717, highlighting its alignment with human clustering. This method not only enhances the design efficiency of novice designers but also helps them understand successful design practices in various contexts. By avoiding common pitfalls and design errors, designers can adapt and innovate based on existing solutions. The dataset used in this study, containing approximately 4228 TABs, is available on Zenodo.
1. Introduction
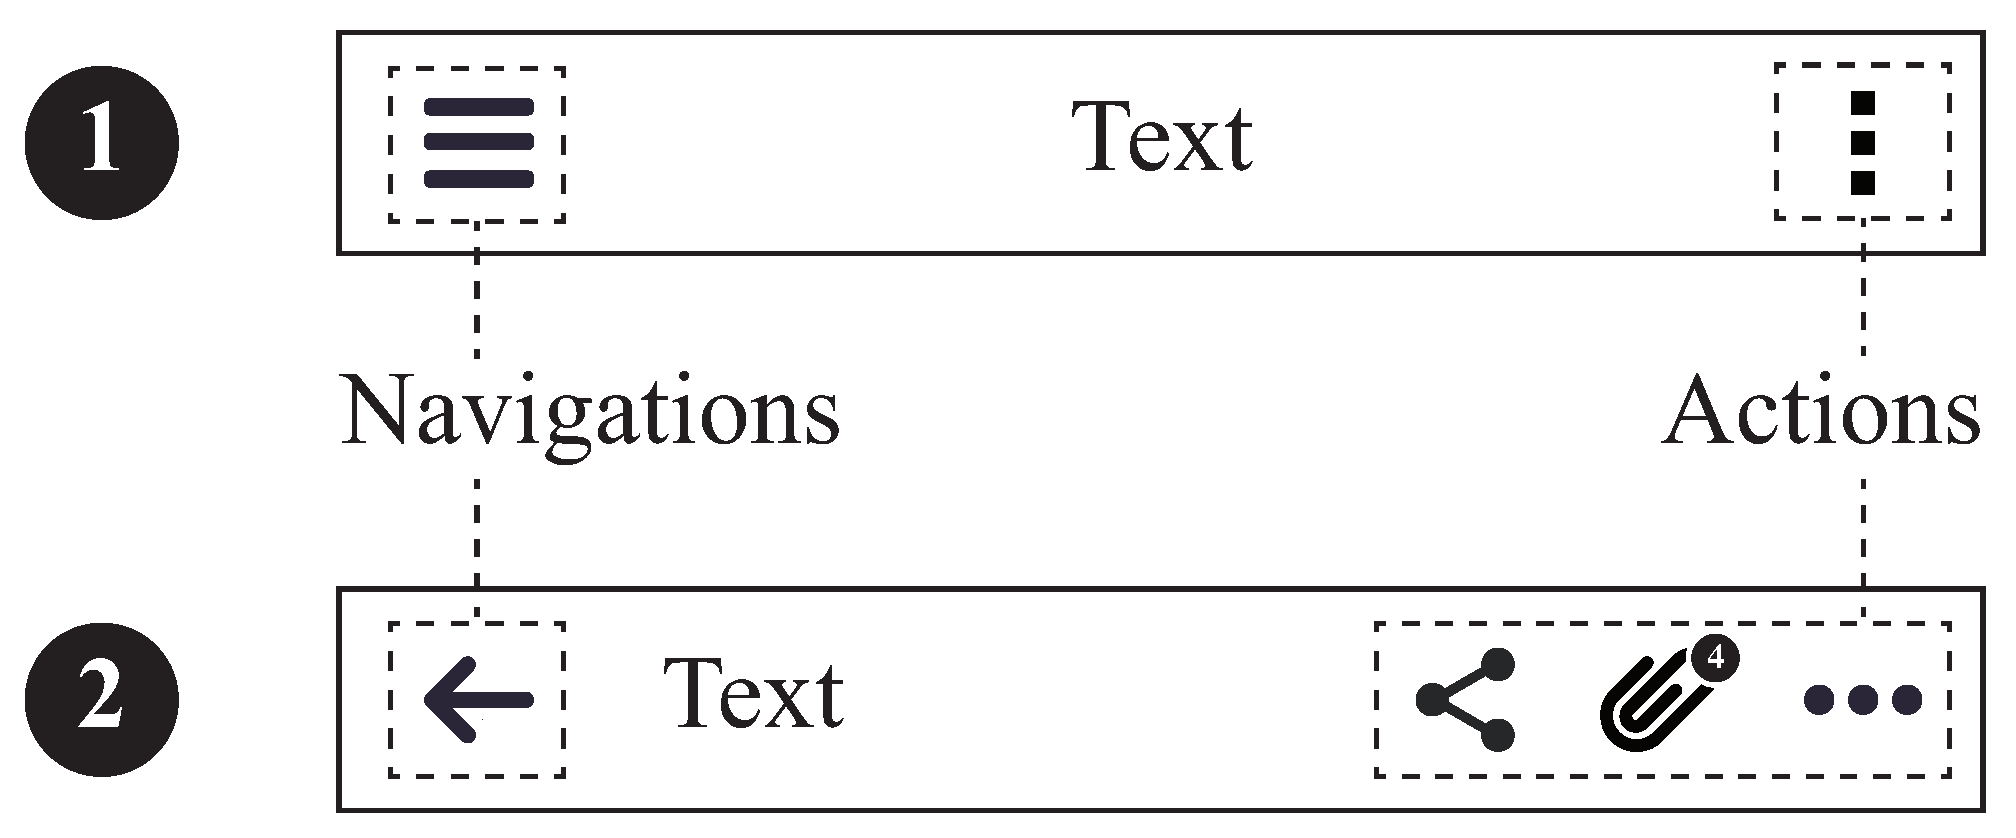
The Top App Bar (TAB) at the top of a mobile app screen is essential for navigation, text display, and actions [1] (see Figure 1). It allows users to access different pages and shows their current location within the app. The TAB includes important buttons and status information like search, settings, and notifications, enhancing user efficiency, and experience. It often displays the brand logo, reinforcing brand recognition and trust [2]. A well-designed TAB improves an app’s usability and accessibility, creating a sense of order and professionalism that increases user satisfaction and retention [3,4].
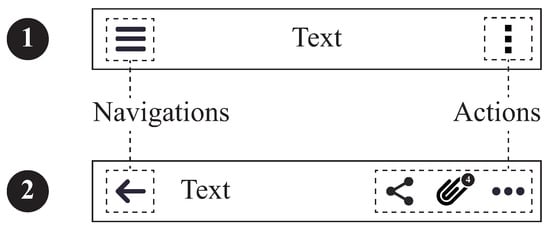
Figure 1.
The two types of TABs, as outlined in the Android Material Design guidelines.
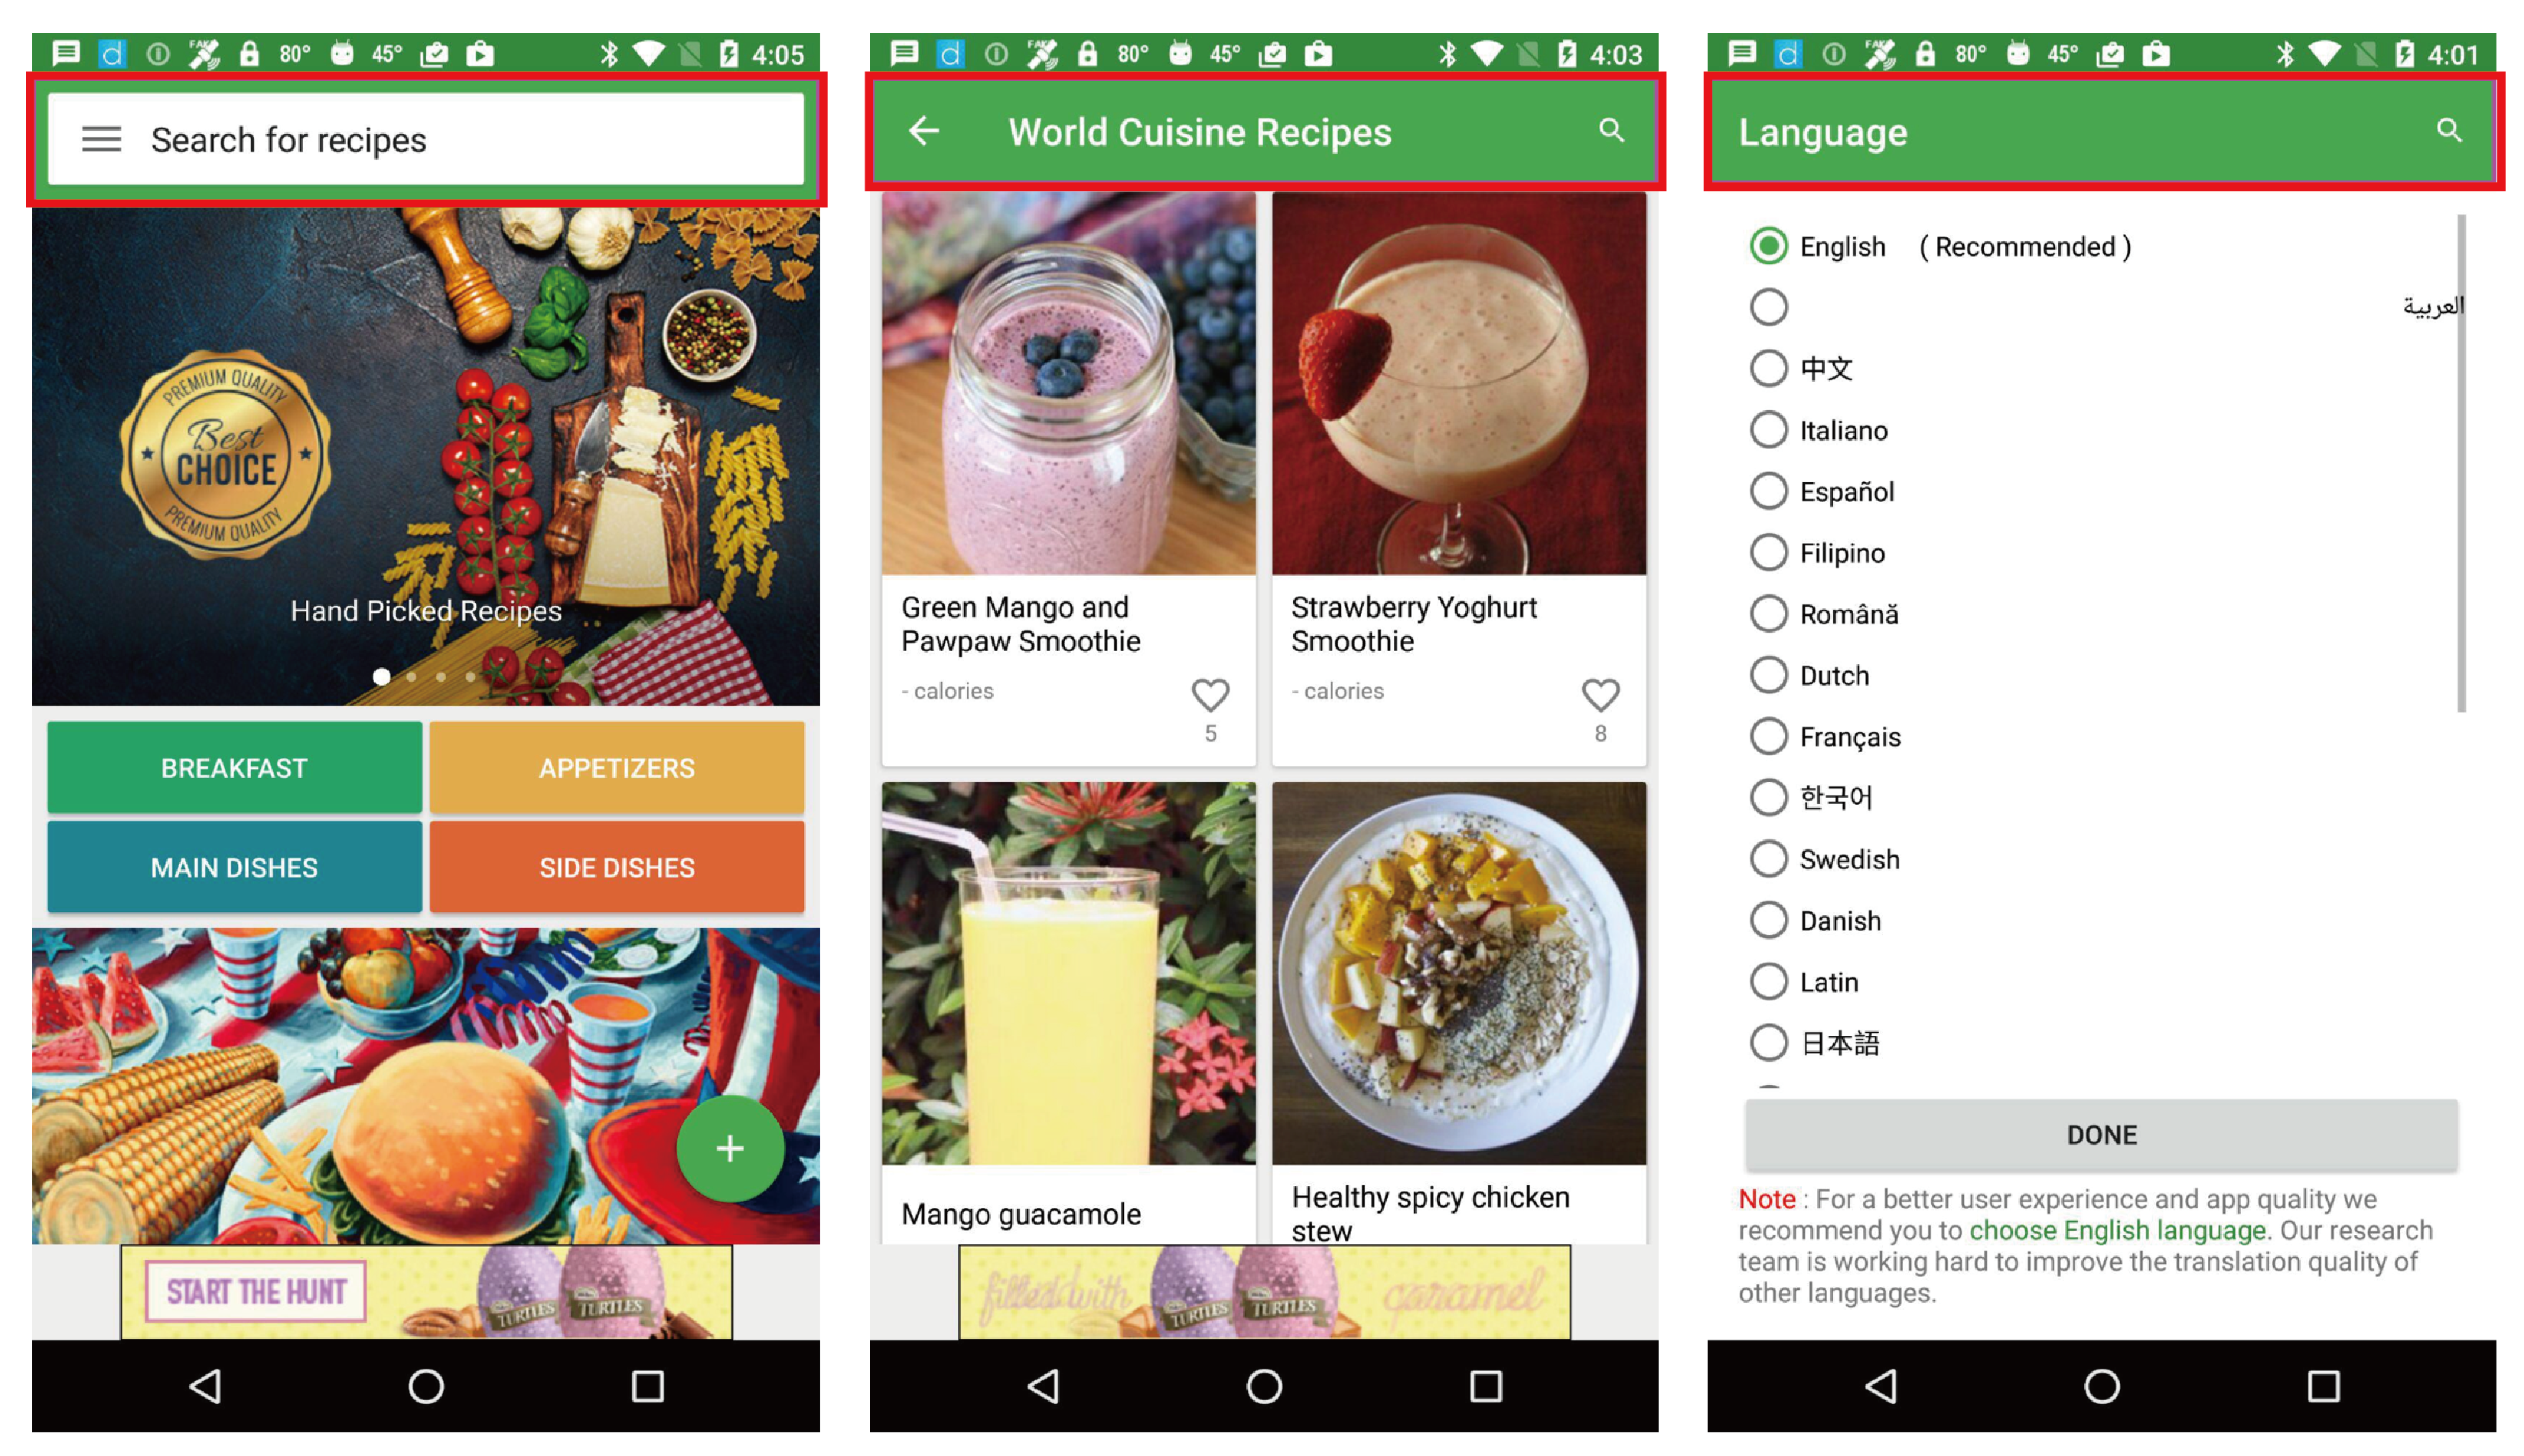
Designing a well-crafted TAB (see Figure 2 and Figure 3) is particularly challenging for novice designers. Beginners often struggle to understand current design trends and practices. A rigid design might not align with the page’s functionality and content, making it difficult to create an intuitive and aesthetically pleasing layout. The limited space of the TAB necessitates careful selection and prioritization of elements, which can lead to overcrowding or the omission of essential components. Providing sufficient information and functionality within this confined space while maintaining simplicity and usability requires meticulous planning. Novice designers might also struggle to create a TAB that is accessible and user-friendly for most users. Achieving a design that meets user behavior patterns and expectations often involves substantial experience, trial and error, and user feedback [5]. Therefore, designing a TAB demands strategic thinking, user-centered design principles, and technical proficiency, presenting a significant challenge for novices.

Figure 2.
There are many variants of TABs.
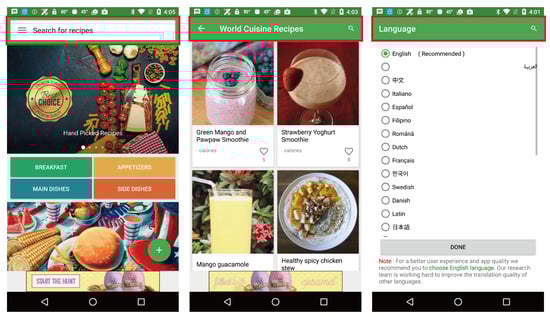
Figure 3.
Diverse TABs (in red boxes) across the same application.
In Human–Computer Interaction (HCI), UI design patterns are templates that offer solutions to common design problems [6]. Despite their widespread use, current design patterns do not effectively assist novice designers in creating TABs. While these patterns provide abstract solutions to common design issues and help identify appropriate navigation types, such as side or top navigation, they often lack detailed guidance for designing specific elements within a TAB. Traditional design patterns might not offer adequate support on which components to include in the TAB or the optimal arrangement of these elements.
Software repositories provide a valuable resource for designers, offering rich examples of design. Accessing various existing designs helps novices understand design elements in different contexts, forming a strong foundation for their projects. By studying successful examples, beginners can learn essential principles of layout, functionality, and aesthetics, avoiding common mistakes. Additionally, reviewing diverse designs can inspire creativity among novice designers, allowing them to adapt and innovate. This reduces time and effort spent on repetitive tasks, enabling designers to focus on customization and enhancement.
This paper proposes a proof-of-concept method for the automated extraction of design patterns for TABs from software repositories. Sequential tokenization that captures the linear characteristics of TABs has been developed. The tokenized sequences of the TABs are then represented as vectors by a self-supervised learning framework. Clustering techniques are then applied to these vectors to reveal inherent design patterns. To guide our experiment design, we focus on the following research questions:
- RQ1: What is the performance of our representation learning model in capturing the design characteristics of TABs?
- RQ2: What clustering algorithm is most suitable for grouping the learned representations of TABs?
- RQ3: How does the clustering outcome compare to human judgment in identifying TAB design patterns?
Experimental results indicate the potential of this approach, with an accuracy of 66.7% and a high degree of similarity to human clustering, with an F-1 score of 0.717. This preliminary method offers novice designers a tool for understanding and designing effective TAB designs, enhancing the overall mobile app design process.
In summary, the paper makes the following contributions.
- A prove-of-concept approach for mining design patterns of the TABs, extendable to support diverse design pattern types.
- A representation and learning strategy for TABs, pivotal in UI design pattern mining.
- An open dataset on TABs, fostering research endeavors and advancing UI design practices within the community [7].
In the rest of the paper, we first review the related literature, including design patterns, UI representation learning, and UI repositories, in Section 2. We then introduce the proposed sequence representation learning method and clustering approach in Section 3. The experimental design, including dataset preparation and methodology, is detailed in Section 4, followed by the evaluation results in Section 5. Finally, we discuss the implications, limitations, and potential directions for future research in Section 6, and conclude the paper in Section 7.
2. Related Work
2.1. Design Patterns
The concept of design patterns originated with architect Alexander [8], and Beck et al. [9] introduced this idea to software engineering to promote the reuse of successful design solutions. Gamma et al. [10] further popularized design patterns in software engineering. UI design patterns began to take shape during the 1997 CHI conference, aligning closely with Alexander’s user-centered design principles [11,12].
In HCI, various definitions of design patterns exist. Borchers et al. [13] described UI design patterns as “successful HCI design solutions among professionals, offering best practices for anyone involved in interactive system design, development, evaluation, or use”. We adopt this definition, emphasizing that UI design patterns benefit most stakeholders in the design process.
UI design patterns usually come in three forms: natural language, structured language, and gallery-based.
Natural language, often unstructured or semi-structured, is the primary form of UI design patterns. Many patterns have been advanced and disseminated across various textual mediums [14,15,16]. The challenge in using natural language for UI design patterns is to encapsulate design phenomena at a clear and appropriate level of abstraction [17]. Excessive brevity makes patterns impractical, while excessive detail hampers reusability. Scholars have created bespoke linguistic frameworks with varying terminologies and taxonomies. However, natural language UI design patterns rely heavily on human intervention, differing from our focus.
Structured representation integrates pattern-driven and model-based paradigms within UI design [18]. Subsequent research advocated using ontology models to encapsulate UI design patterns [19]. Despite computational tractability, structured representation mainly serves as an adjunct to UI adaptation or code generation, limiting its broader applicability in representing UI design patterns.
The term “gallery” denotes a repository housing many UI design instances. Neil first used the concept of a gallery as a repository for UI design patterns [16]. Unlike conventional UI design case repositories, a UI design pattern repository organizes instances according to the patterns instantiated within the UI. Our focus is on constructing a gallery-based UI design pattern repository using data mining methodologies.
2.2. UI Representation Learning
UI representation learning transforms UI images into machine-readable vectors, enabling machines to understand and process UI designs. This research area includes two main approaches: task-specific and general task-oriented representation learning.
Task-specific UI representation learning captures features relevant to a particular task. Deep learning models excel by learning feature extraction directly from task-specific annotations. This approach’s effectiveness is evident in studies on screen classification [20,21] and component detection [22], where models yield representations closely aligned with specific UI tasks. However, these tailored representations often overfit training data, limiting their general applicability.
To address the need for more generalized representations, researchers have pursued two main directions. The first involves autoencoders that favor UI-structured representations. Deka et al. [23] pioneered this approach by using autoencoders to convert UIs into vectors, initially representing UIs as layout images highlighting text and non-text regions. Liu et al. [24] expanded this by including component categories in the layout image. This approach underwent further refinement [20,25,26], with Li et al. [26] introducing the Screen2Vec model, which combines component text, categories, and application descriptions into a single representation. Similarly, Choi et al. [27,28] employed multiple visual autoencoders to generate fused vector representations, leveraging a seq2seq autoencoder to include UI code. While these methods capture various UI features, they fail to account for the structural characteristics of TABs.
The second direction draws inspiration from generic pretraining models popular in natural image processing. He et al. [29] developed the ActionBert architecture, which processes the ResNet-derived visual features of UI components using a Transformer model to predict operational accessibility between UIs. Similarly, Feiz et al. [30] used this concept to predict UI similarity, emphasizing relationships between multiple UIs. In contrast, Bai et al. [31] introduced UIBert, converting a single UI image into a sequence of objects, encapsulating various visual and textual properties. Their unique masking prediction algorithm aids in obtaining a comprehensive representation of the UI. Banerjee et al. [32] also utilized visual and textual features of all UI elements. Although these studies use sequential modeling of UIs or UI components, their methodologies differ significantly from ours.
Our approach diverges from these methods by focusing on the structural characteristics of the TAB. We employ autoregressive techniques to reconstruct the TAB structure, enhancing our modeling of non-visual features. This improvement facilitates downstream tasks that require a deep understanding of TAB design patterns.
2.3. UI Repositories
While numerous websites (such as Welie (https://www.oreilly.com/, accessed on 4 April 2024) and UI Patterns (https://ui-patterns.com/, accessed on 18 January 2025)) showcase UI design patterns, their data often become outdated quickly, posing challenges for maintaining these knowledge-intensive platforms. Websites such as Dribbble (https://dribbble.com/tags/ui-library, accessed on 18 January 2025) and UXArchive (https://uxarchive.com/, accessed on 18 January 2025) act as central spaces for UI designers to share ideas and find creative stimulation. However, their focus tends to be on showcasing UI screenshots rather than providing accompanying code.
Despite GitHub’s (https://github.com, accessed on 18 January 2025) prominence as an open-source repository, housing vast amounts of programs, it was not chosen as our data source. Many polished commercial apps remain proprietary and are not available on GitHub.
In Automation Software Engineering (ASE), various studies focus on Android application repositories primarily for testing and security research [33,34]. These studies commonly provide APK packages but often lack UI images.
While there has been research [35,36] that has focused on UI designs furnished datasets brimming with UI images, they are not suitable for our task due to the lack of UI code.
Deka et al.’s proposal for a data-driven UI design direction [23,37], emphasizing UI layout code, aligns closely with our research objectives. Their dataset, offering automatically captured UI images and code, aligns best with our needs.
3. The Proposed Approach
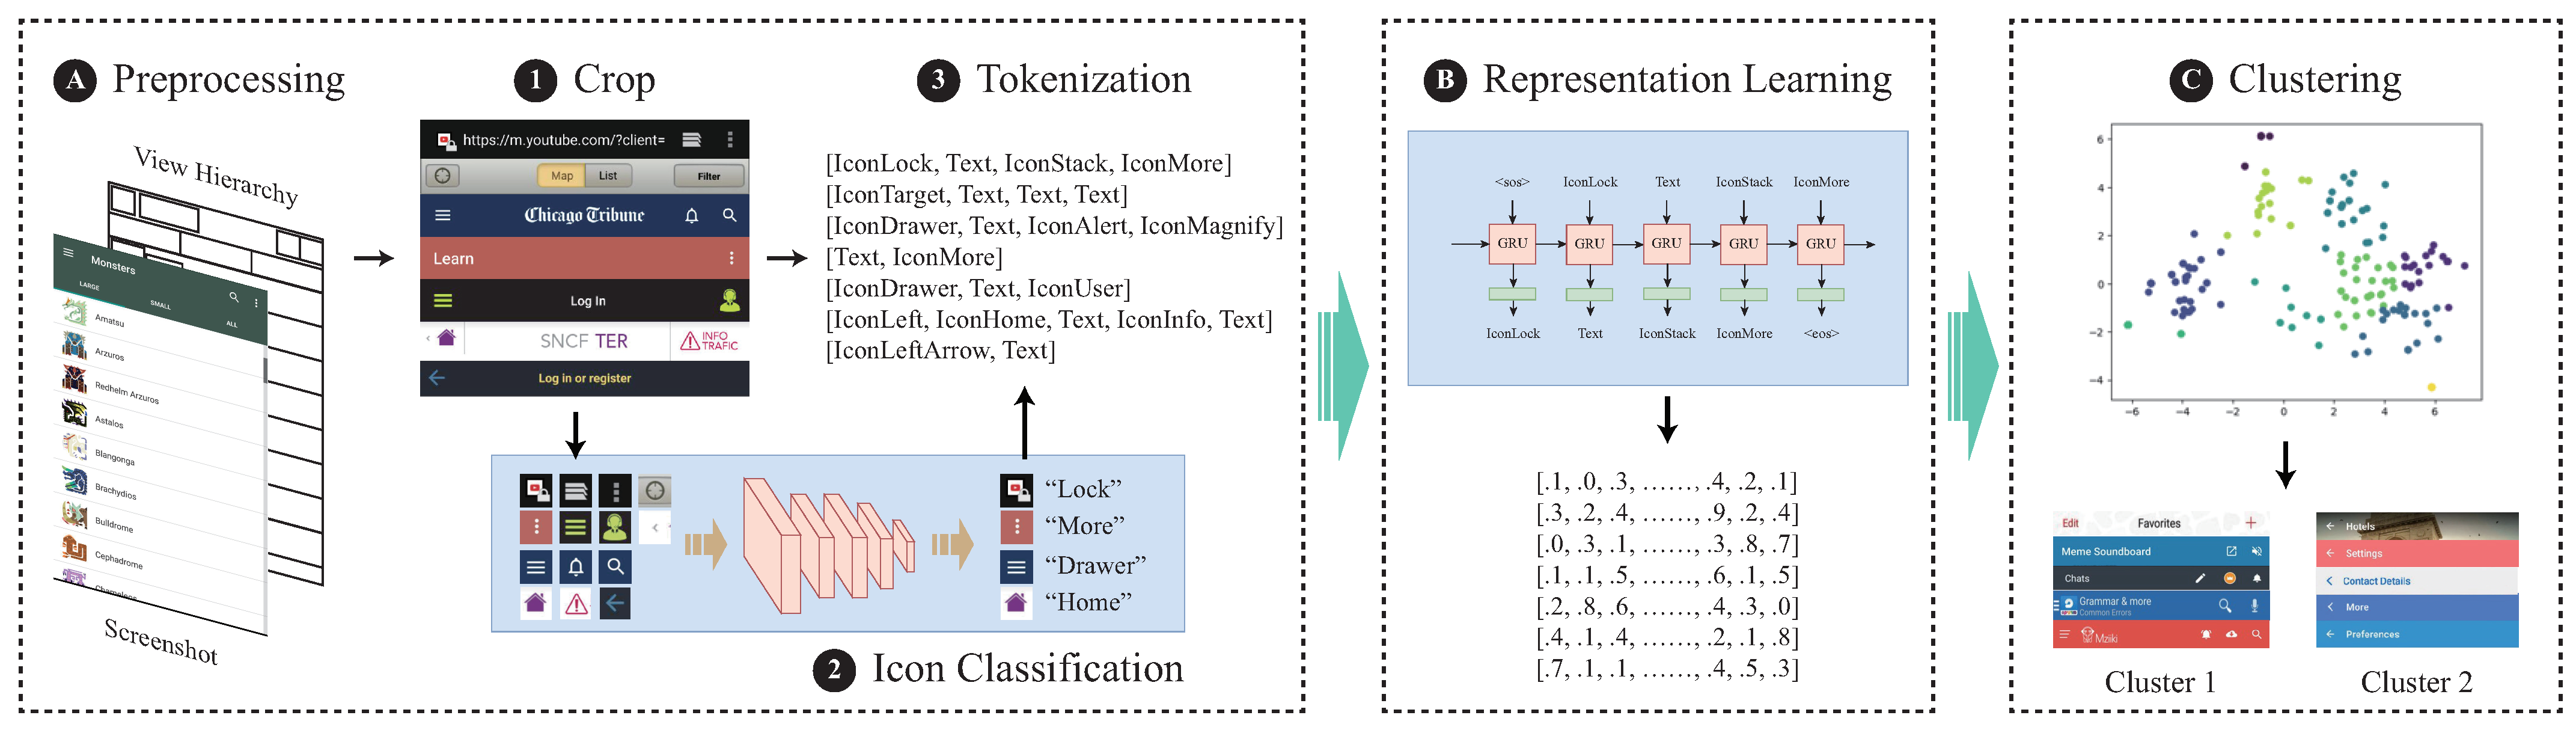
The overall architecture of our proposed method is shown in Figure 4. We begin by preprocessing the UIs to construct TAB sequences. Following data preprocessing, we employ self-supervised learning methods to learn vector representations of the TAB sequences. Once the vector representations are obtained, we apply clustering algorithms to group similar representations together.

Figure 4.
An overview of our proposed approach.
Our approach is underpinned by principles of self-supervised learning, a paradigm where models learn representations from data without relying on manual annotations, as described in [38]. Specifically, we leverage word embedding techniques, such as Word2Vec [39] and FastText [40], which are designed to capture semantic and contextual relationships between elements in a sequence. These techniques allow us to encode the structure and semantic information of TAB sequences into dense vector representations.
For clustering, our approach aligns with principles of unsupervised learning and distributional semantics [39], where similar representations are grouped to uncover latent structures within the dataset. This design is inspired by the underlying theory of representation learning, which posits that learning compact, high-dimensional embeddings can improve downstream tasks, such as clustering or classification.
3.1. Preprocessing
Dataset. We propose a pipeline to obtain TAB images and corresponding layout codes from the RICO repository [23]. RICO is a large open repository (http://www.interactionmining.org/rico.html, accessed on 18 January 2025), with data from over 9.3k free mobile applications across 27 application categories on Google Play. Each dataset entry includes a screenshot paired with its corresponding view hierarchy.
The view hierarchy represents the UI layout code structure during rendering, depicted as a tree. Each node in this tree encapsulates various attributes of UI elements, such as resource ID, implementation class, inheritance relationship, bounding box, and state attributes like visibility and clickability.
Crop. Utilizing a breadth-first traversal strategy, we navigate this tree employing heuristic rules to pinpoint the TAB within the UI page. Specifically, we identify UI elements instantiated from android.support.v7.widget.Toolbar and eliminate those intersected by other elements. Furthermore, UIs lacking a TAB are omitted from our dataset. Subsequently, we extract and store the subtree representing the TAB from the view hierarchy. Employing the bounding box of this subtree, we crop and extract the TAB image from the UI screenshot.
Icon Classification. The icons within the TAB carry functional significance and communicate extensive semantic details. Based on the research conducted by Liu et al. [24], we employ their suggested Convolutional Neural Network (CNN) to categorize icons into 99 semantic groups. This enables us to depict icons through concise word bags, maintaining a high degree of abstraction.
Tokenization. We organize the leaf nodes within the TAB subtree by arranging them in a sequence based on their x-coordinate, from smallest to largest. To distinguish between text and images, we employ heuristic rules. Text nodes are identified by checking if their implementation class contains “Text” or if they inherit from the TextView class, while image nodes are determined by inspecting if their implementation classes contain “Image” or if they inherit something from the ImageView class.
Images are processed through the icon classification network to obtain distinct semantic tokens. Text nodes are treated as a single token, without further division, since the text within the TAB typically pertains to application names or page content.
Additionally, our corpus includes three special tokens, i.e., start of sequence (), end of sequence (), and padding (), resulting in a total corpus size of 103.
3.2. Learning Vector Representations
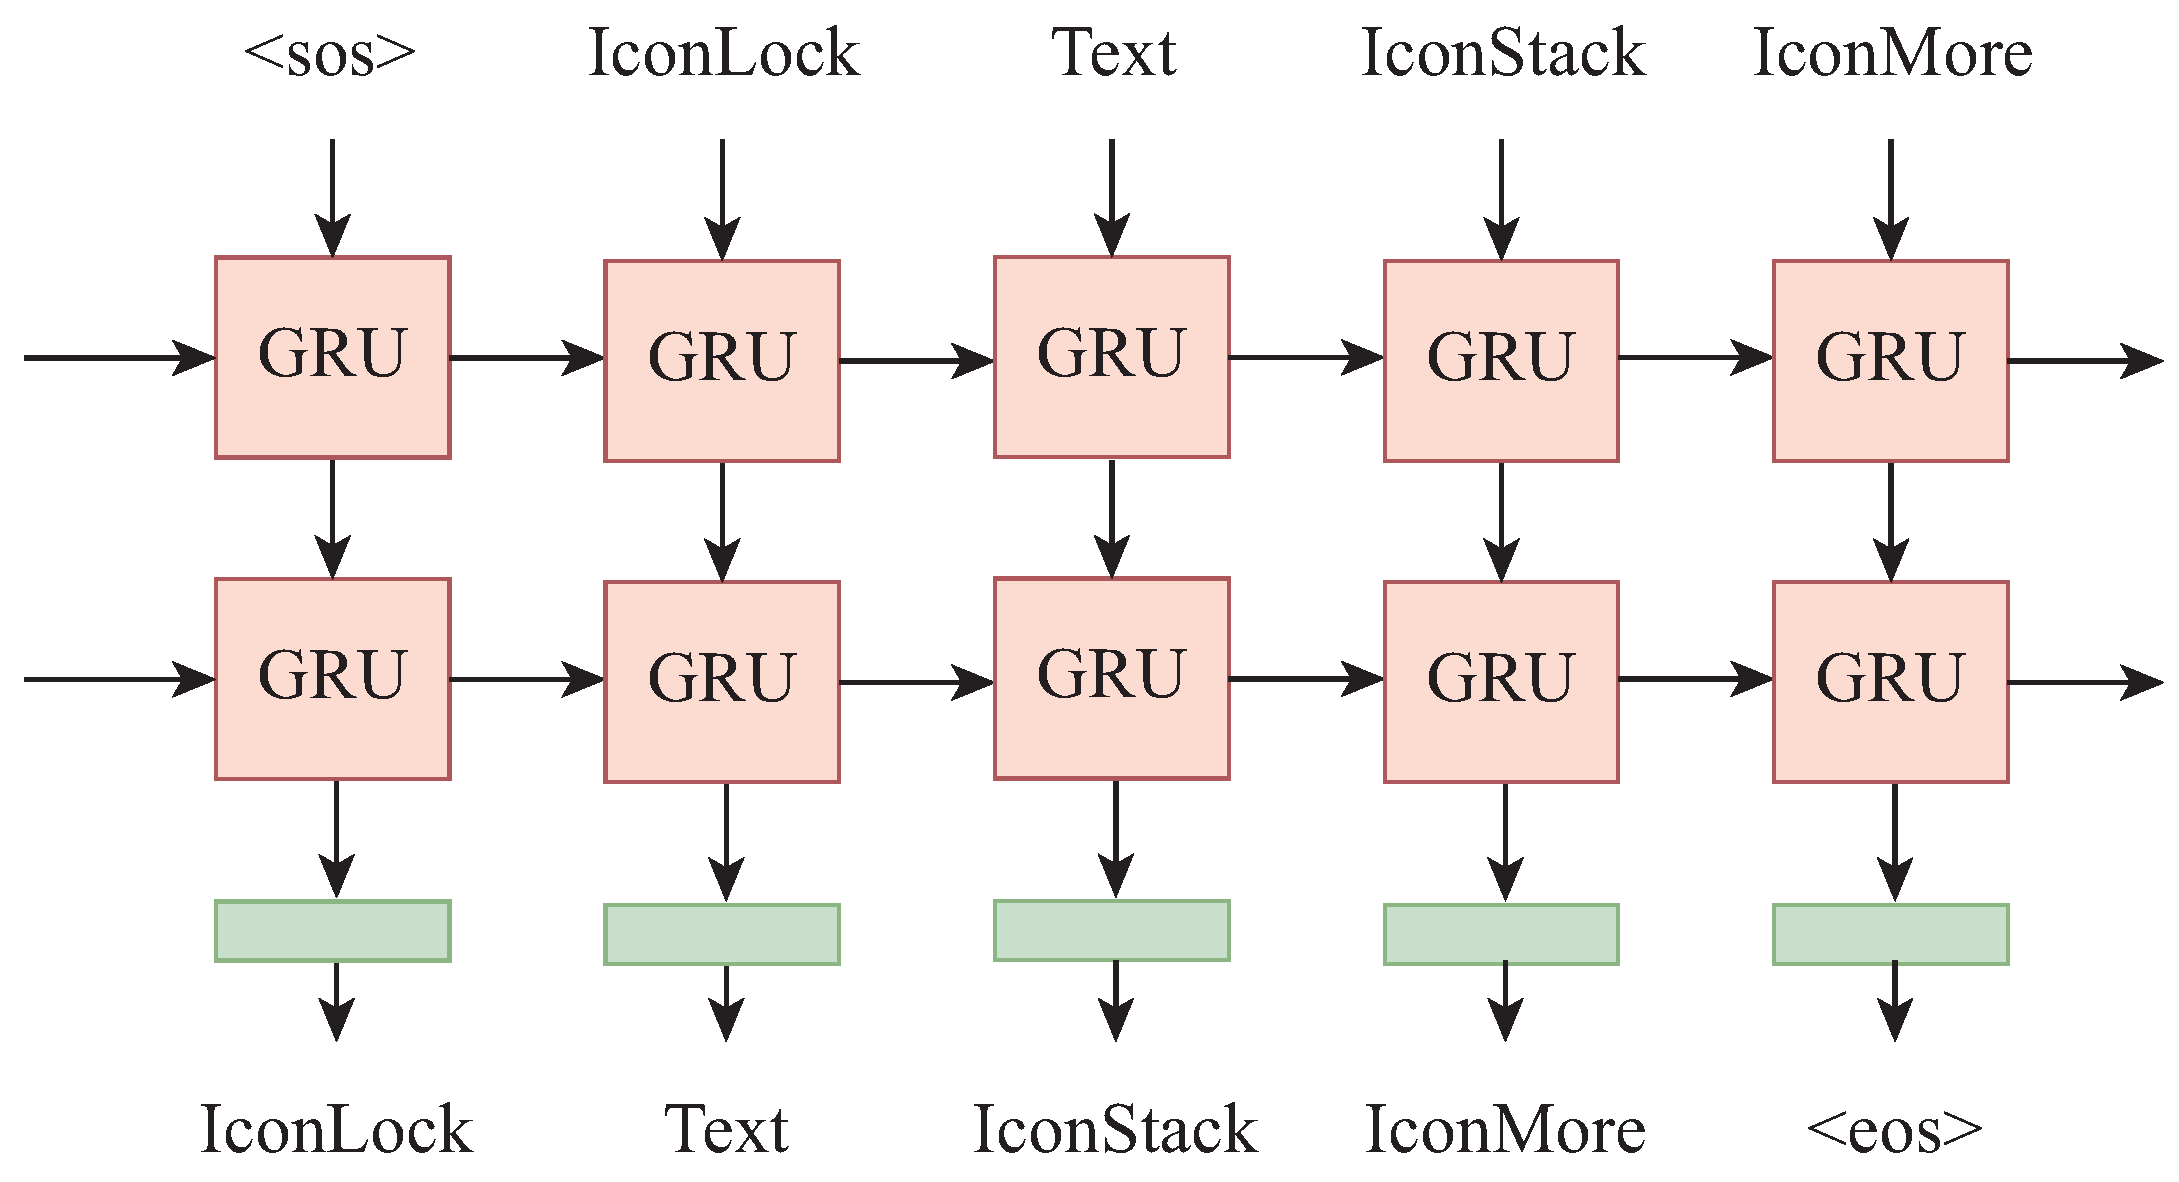
Here, we present the autoregressive training approach. In each training step, the model utilizes the initial tokens from the sequence as input and is tasked with predicting the type of the n-th token. Employing this method, we forecast the subsequent element in the sequence based on the preceding ones, effectively capturing linear spatial correlations within TAB structures. This training technique eliminates the need for extra data annotation and finds extensive application in natural language training, including GPT models [41].
We introduce a two-layer Gate Recurrent Unit (GRU) architecture to capture the contextual relationships within TAB sequences, as shown in Figure 5. GRU, a variant of Long-Short Term Memory (LSTM) Recurrent Neural Network (RNN), employs gating mechanisms to mimic memory functions, allowing for the selective retention and replacement of information [42].
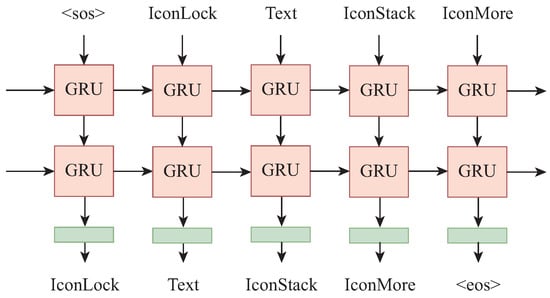
Figure 5.
The network architecture for representation learning.
At each step, the current token and the previous hidden state are utilized to compute the updated hidden state after accounting for forgetting (1) and (2). The and Tanh serve as the activation functions, while the ⊙ denotes the Hadamard product. W and U are trainable hyperparameters:
Following this, the current token and the preceding hidden state are employed simultaneously to compute an adjusted weight factor (3). This factor is then utilized to weigh and integrate both the historical hidden state and the remaining state , resulting in the generation of the current hidden state (4):
Afterward, the updated hidden state is employed to forecast the token in the subsequent time step. This involves utilizing a multi-layer perceptron (MLP) head along with a softmax layer to derive the likelihood of the next token (5):
We train the model by reducing the average cross-entropy of each sequence, as shown in (6), where n represents the length of the sequence and c represents the corpus size. Upon completing training, we input the sequence of the TAB into the model sequentially, resulting in the extraction of the intermediate state from the model, serving as the representation of the TAB:
3.3. Clustering Design Patterns
Once the vector representations are obtained, we apply a variety of clustering algorithms to group similar representations together, enabling the identification of potential design patterns within the TAB. The choice of clustering algorithm plays a crucial role in the effectiveness of pattern identification. Here, we introduce several commonly used clustering algorithms: K-means, Gaussian Mixture Models (GMM), Balanced Iterative Reducing and Clustering using Hierarchies (BIRCH), and Spectral Clustering.
K-means. K-means is a widely used clustering algorithm that partitions data into K clusters by iteratively optimizing cluster centroids to minimize the sum of squared distances between data points and their nearest centroids.
GMM. GMM assumes that the data are generated from a mixture of several Gaussian distributions. Unlike K-means, which assigns each data point to a single cluster, GMM assigns probabilities to each data point belonging to each cluster.
BIRCH. BIRCH is a hierarchical clustering algorithm that is particularly well-suited for large datasets. It incrementally builds a hierarchical clustering structure by clustering small subsets of data points called micro-clusters and merging them to form larger clusters.
Spectral. Spectral clustering is a graph-based clustering technique that partitions data based on the eigenvectors of a similarity matrix derived from the data. Unlike traditional clustering algorithms that operate directly on the data space, spectral clustering considers the pairwise relationships between data points, making it effective for capturing non-linear and non-convex clusters.
4. Experimental Design
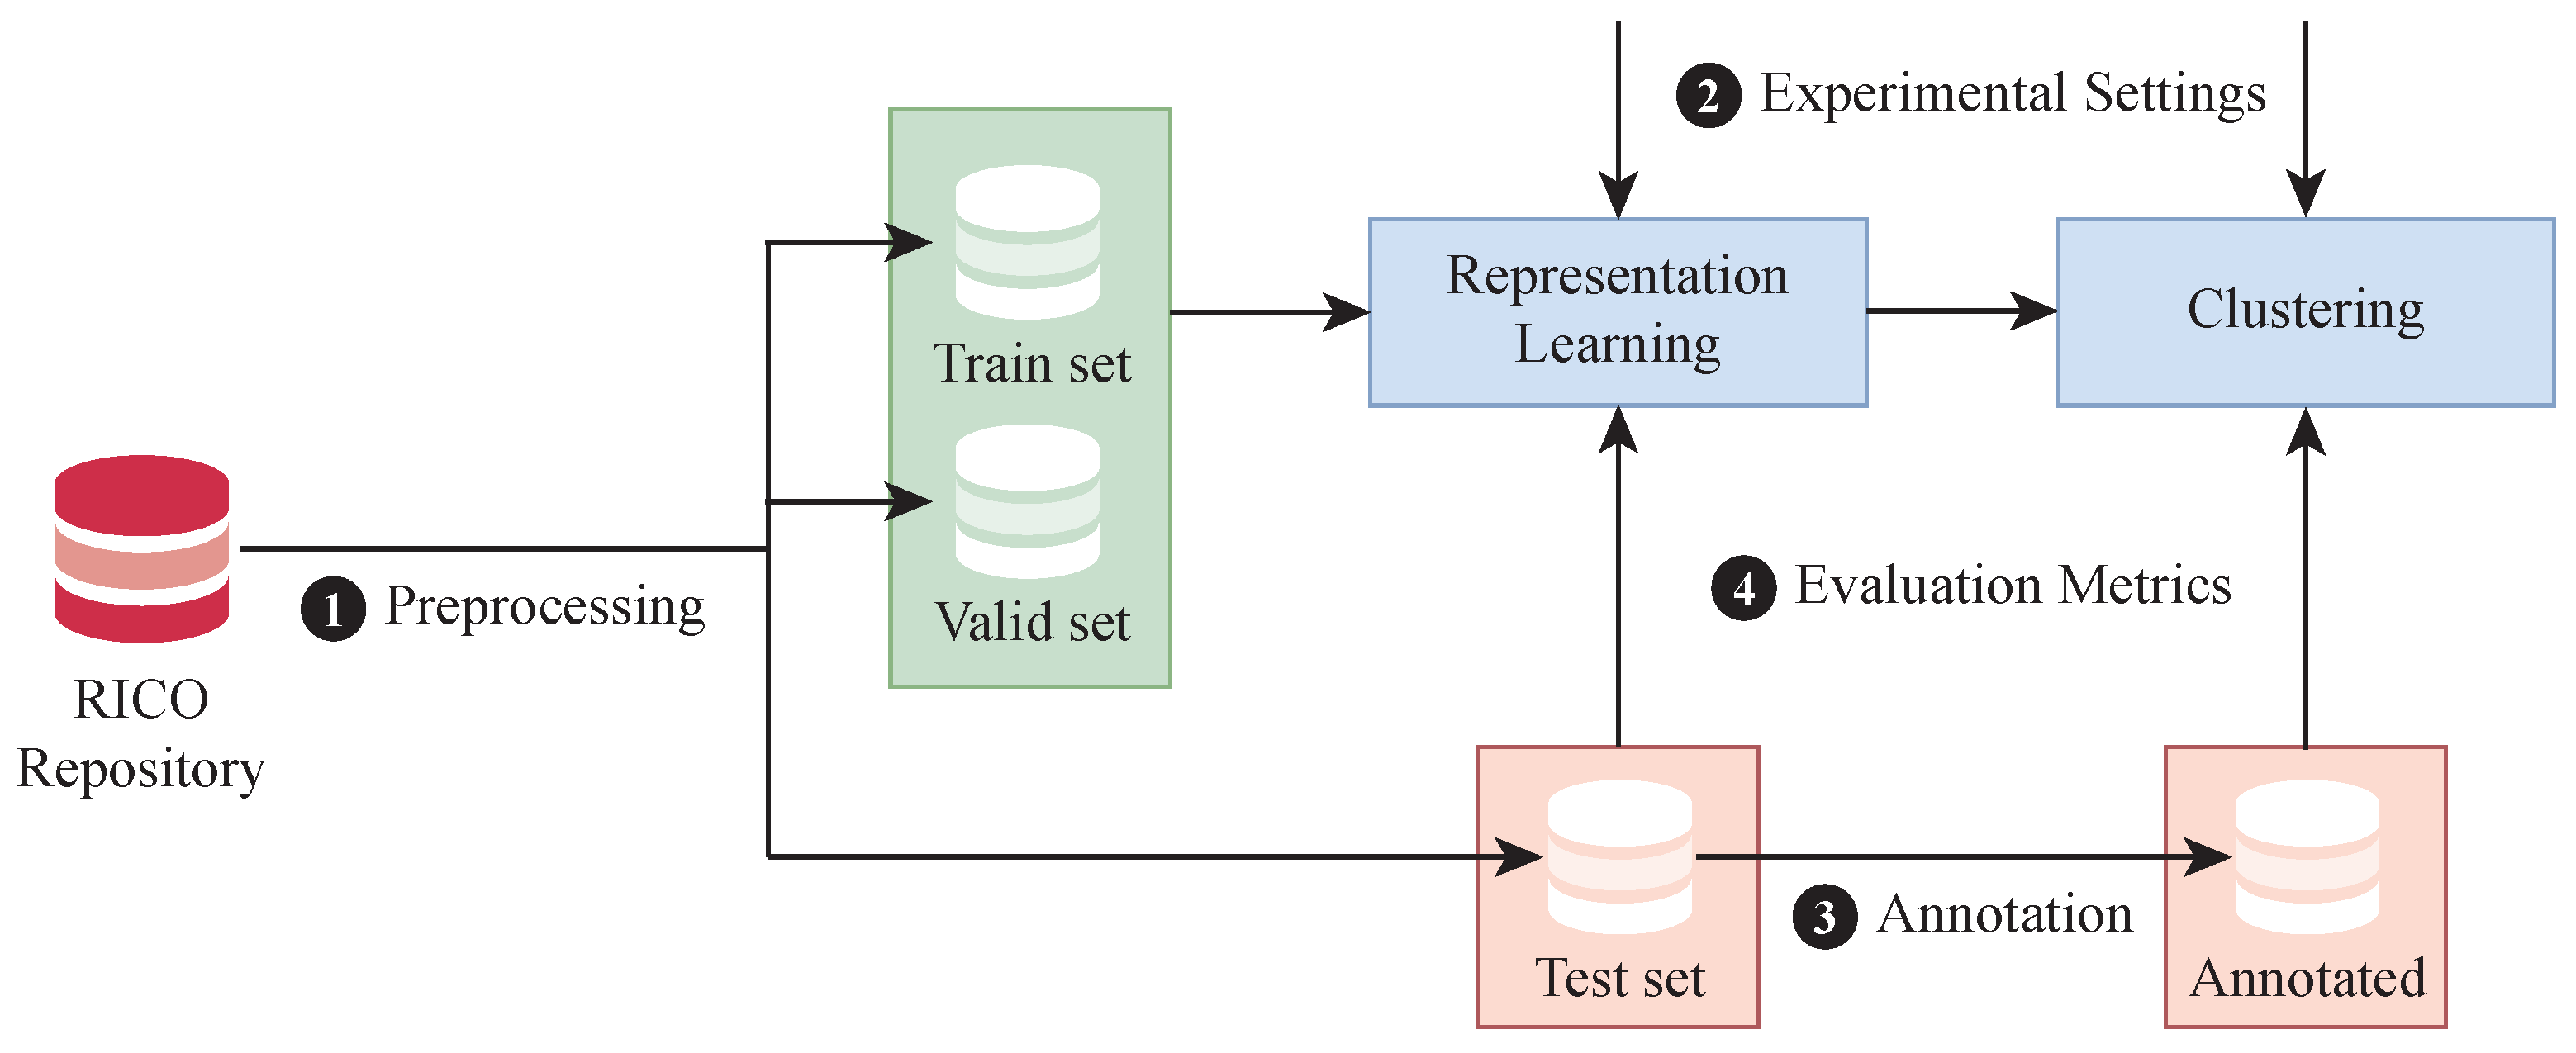
Figure 6 presents the workflow of the experimental design, detailing the steps for data preprocessing, experimental setup, annotation, and the formulation of evaluation metrics.
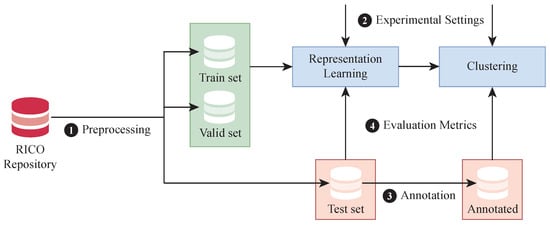
Figure 6.
Overview of the experimental design.
4.1. Preprocessed Datasets
We manually filtered out UI pages from RICO that were not conducive to mining, such as those with drawers, blank pages, or landscape orientation. Drawers, in particular, tended to obstruct the TAB. This process yielded a dataset of 4228 TAB sequences. The experimental data were then split into a training set (80%), a validation set (10%), and a testing set (10%), comprising 3382, 423, and 423 sequences, respectively.
4.2. Experimental Settings
In configuring the representation learning model, we designated a batch size of 128 and established a learning rate of 0.001, along with a step size of 200 for the learning rate adjustment strategy, featuring a gamma of 0.5. Throughout the training phase encompassing 10,000 epochs, we diligently utilized validation sets every 1000 rounds to fine-tune hyperparameters and safeguard against overfitting. For clustering, we empirically determined the K value to be 10.
4.3. Annotation
We utilized a semi-structured categorization method to organize the TABs from the test set of our dataset. The classification involved two volunteers from our laboratory who had backgrounds in UI design and development but were not previously familiar with the findings of this research. We asked them to classify the TABs into 10 categories. To ensure consistency in classification, the volunteers regularly discussed their categorizations until they reached a consensus.
4.4. Evaluation Metrics
4.4.1. Evaluation Metrics for Representation Learning
For representation learning tasks, we employed accuracy metrics. Accuracy gauges the proportion of correctly predicted tokens by the model, calculated as (7), where represents the correct number of tokens and denotes the total number of tokens:
4.4.2. Evaluation Metrics for Clustering
For clustering assessments, we employ both Internal and External Evaluation methodologies. The Internal Evaluation method operates without data annotation, relying on the assumption of compactness within a class and dispersion between classes. Conversely, the External Evaluation method necessitates data annotation and gauges the alignment between clustering outcomes and human cognition.
We utilized three metrics for Internal Evaluation: the Silhouette Score, Calinski Harabasz Index (CH Index), and Davies Bouldin Index (DB Index).
Let N denote the total number of samples and K represent the number of clusters after clustering.
The Silhouette Score gauges the similarity (cohesion) of each sample within the clustering outcome to its corresponding cluster, alongside its distinctiveness from other clusters. As shown in (8), a signifies the intra-cluster cohesion, while b denotes the inter-cluster separation. The Silhouette Score ranges from −1 to 1, with values closer to 1 indicating superior clustering outcomes:
The CH Index also termed the variance ratio criterion, evaluates clustering effectiveness by contrasting within-cluster compactness with between-cluster separation (9). Here, signifies the matrix trace, is the inter-cluster distance difference matrix, and is the intra-cluster distance difference matrix. A higher CH Index suggests tighter clusters and greater cluster dispersion, indicating improved clustering outcomes:
The DB Index assesses intra-cluster similarity relative to inter-cluster similarity, with smaller values indicating superior clustering performance (10). Here, s denotes the average distance between samples within a cluster, and d represents the distance of cluster centroids:
In our external evaluation experiment, we utilized five indicators: the Jaccard Coefficient (JC), Follows and Mallors Index (FMI), Rand Index (RI), Purity, and the F-1 score. To support these evaluations, the confusion matrix for clustering was defined, as shown in Table 1. In this matrix, the terms True Positive (TP), False Negative (FN), False Positive (FP), and True Negative (TN) are analogous to their usage in binary classification.

Table 1.
The confusion matrix for clustering.
The Jaccard similarity coefficient serves as a standard measure for assessing the similarity and dissimilarity between finite sample sets. Higher values of the Jaccard coefficient indicate greater sample similarity, calculated as (11):
The FMI is determined as the geometric mean of pairwise precision and recall, represented by (12):
The Rand index is a metric gauging the similarity between two clustering assignments, accommodating permutations, given by (13):
The F-1 value computation follows (14):
In contrast to the aforementioned metrics, Purity assesses the percentage of correct clustering by dividing the highest frequency sample category within each cluster by the total number of samples in the cluster (15), where denotes the annotated cluster and c signifies the clustered cluster:
5. Evaluation
5.1. RQ1: What Is the Performance of Our Representation Learning Model?
We evaluated the performance of our representation learning model by assessing its top-1 prediction accuracy on the entire test set, as detailed in Table 2. The top-1 accuracy was determined by considering the token with the highest prediction probability as the model’s output, as defined by the Formula (7). Overall, our model demonstrates proficiency in autoregressive learning within the sequence representation of TABs. This suggests that the designed representation effectively captures the TAB design patterns.
Table 2.
The results of representation learning model.
To delve deeper into understanding the performance dynamics of our model, we analyzed prediction accuracies across sequences of varying lengths. Notably, our model exhibits strong predictive capability for short sequences of length 2, achieving an accuracy of 68.71%. However, there is a noticeable decline in performance for sequences of length 3, indicating potentially less significant regularity in TAB sequences of this length.
In contrast, as sequences extend to medium lengths (4–8), the model demonstrates an improvement trend. Particularly noteworthy is the model’s peak accuracy of 92.31% when handling sequences of length 6, highlighting its robust predictive ability for medium-length sequences.
Remarkably, when confronted with longer sequences, notably those of lengths 9 and 10, the model showcases exceptionally high accuracy. This aligns with the notion that as contextual information accumulates, the task of predicting subsequent tokens becomes increasingly manageable.
5.2. RQ2: What Algorithm Is Suitable for Clustering Learned Representations?
The comparison of clustering algorithms using internal metrics reveals that the K-means algorithm consistently outperforms GMM, BIRCH, and Spectral clustering across all evaluated indicators, as shown in Table 3. The Silhouette score, Calinski–Harabasz Index (CH Index), and Davies–Bouldin Index (DB Index), calculated using Formulas (8)–(10), respectively, highlight this performance. With a higher Silhouette score, lower Davies–Bouldin Index, and a higher Calinski–Harabasz Index, K-means demonstrates superior performance in clustering quality, compactness, and separation of clusters. This suggests that K-means is the most suitable choice among the evaluated algorithms, offering better overall performance in partitioning TABs into meaningful clusters.
Table 3.
Comparison of clustering algorithms on different internal metrics.
5.3. RQ3: How Does the Clustering Outcome Compare to Human Judgment?
To delve deeper into the disparities in clustering performance between these models and human perceptions, we present the outcomes of these models across external indicators, as shown in Table 4. Metrics such as JC, FMI, RI, F-1, and Purity are computed using Formulas (11), (12), (13), (14), and (15), respectively. Overall, the K-means algorithm demonstrates superior performance. It outperforms other models across all indicators except Purity. This suggests that the K-means algorithm effectively balances inter-class dissimilarity and intra-class similarity in clustering TAB sequences, yielding results consistent with real labels. It is noteworthy that the GMM model, while achieving success in Purity, falls short in other metrics.
Table 4.
Comparison of clustering algorithms on different external metrics.
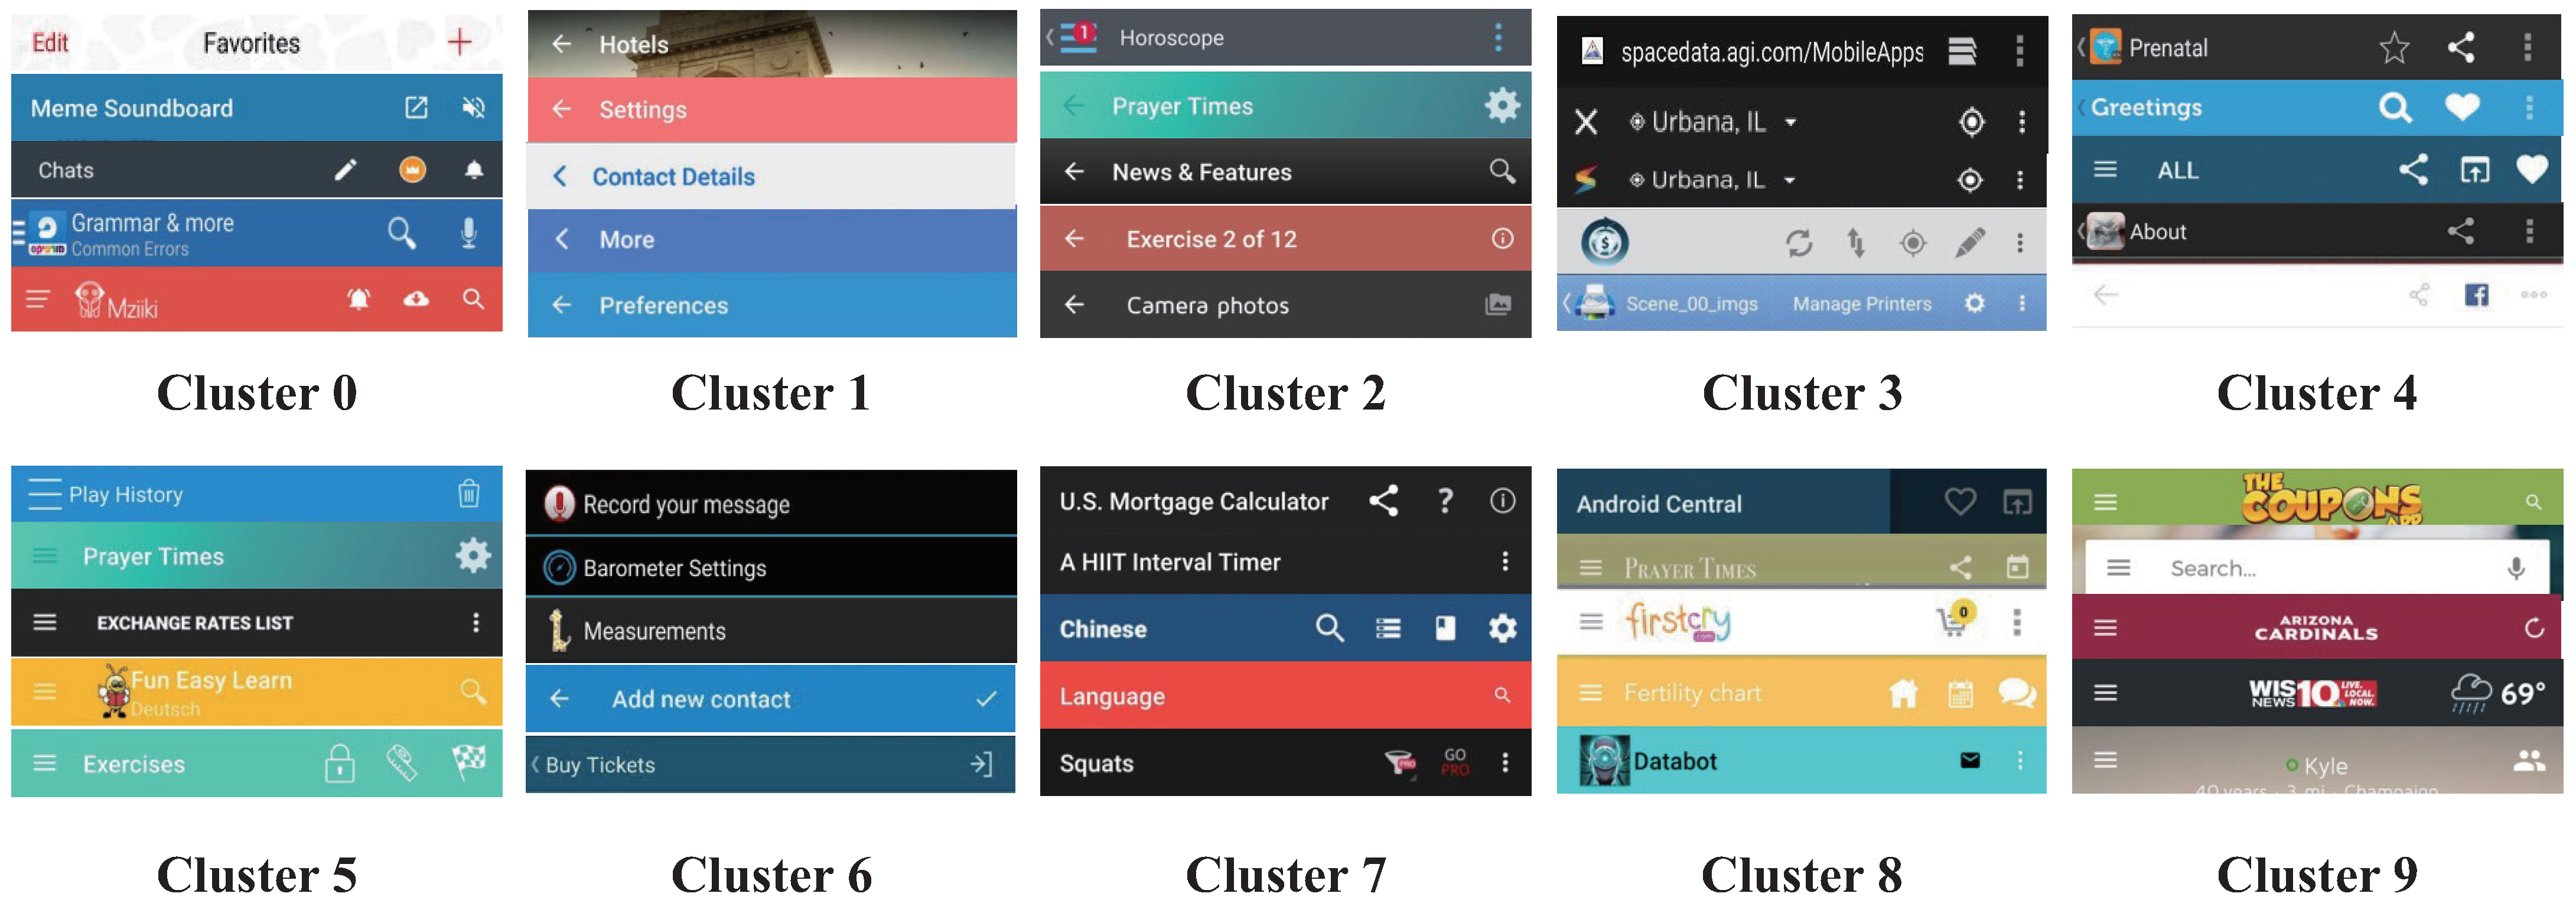
Figure 7 showcases the TAB sequence patterns derived from the method introduced in this paper. Each cluster upholds a consistent sequence arrangement and semantic roles. For instance, cluster 0 encompasses attributes pertinent to content management and operations, featuring options like Add, Edit, Microphone, and Volume. Clusters 1, 2, 5, 6, 7, and 9 display diverse structural compositions in their sequences. Cluster 3 predominantly houses location-based functions associated with geographic services and navigation. Social interaction-centric semantics, such as Share, Facebook, and Favorite, dominate Cluster 4. Similarly, Cluster 8 encompasses a range of features like Cart, Chat, and Facebook, highlighting data exchange among users. These findings underscore the efficacy of clustering methods in discerning and categorizing ten distinct design patterns.
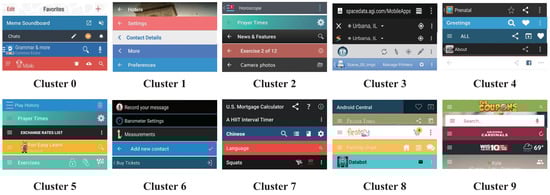
Figure 7.
The clustered patterns of TABs.
6. Discussion
6.1. Clustering Methods
Early studies on UI representation learning [20,23,24,25,26] primarily relied on qualitative analyses to interpret their results. Some also used subjective validation methods, such as evaluating a limited number of retrieval outcomes in downstream tasks. These approaches make it difficult to objectively compare results across studies. More recently, Choi et al. [27,28] reported external evaluation metrics for clustering results in representation learning for activity (page) clustering. Our discussion will primarily compare our findings with their results.
K-means effectively identifies clusters of similar TAB designs based on their vector representations and consistently outperforms other clustering models across most evaluation metrics. This is consistent with the findings of Choi et al. [27], who demonstrated that K-means achieved significantly better clustering performance across multiple indicators. Its success can be attributed to its alignment with the Euclidean properties of vector representations, which influence its distance-based calculations. However, K-means has notable limitations, including sensitivity to the initial selection of centroids and a tendency to form spherical clusters [43].
GMM, a soft clustering method, offers greater flexibility by accommodating complex cluster shapes and data distributions. In theory, GMM should perform comparably to K-means, as suggested by Choi et al.’s findings [27]. However, in our results, while GMM achieved the highest Purity score among external evaluation metrics, its performance on the JC and F-1 score was significantly lower. This suggests that GMM may not be well-suited for our specific task. As Choi et al. did not report JC or F-1 scores, it is unclear whether similar issues arose in their study. Furthermore, their representation model differs fundamentally from ours. They employed a hybrid approach combining visual and textual features derived from multiple autoencoders, whereas our model is based on an autoregressive text representation. This fundamental difference may account for the observed variations in performance.
BIRCH and Spectral clustering methods might face challenges due to data bias and have shown mixed results. This does not mean that they are not suitable for mining the TAB. BIRCH demonstrates efficiency in memory usage and computational complexity, which enhances its suitability for extracting TAB design patterns from extensive datasets. Additionally, BIRCH can effectively manage noise and outliers, a crucial aspect in real-world data scenarios. Spectral clustering can uncover underlying structures in the data that may not be apparent in the original feature space, enabling the discovery of intricate design patterns.
In summary, each clustering algorithm offers unique advantages and considerations, and the choice of algorithm depends on the specific characteristics of the data and the desired outcome of the pattern mining process. Future research should explore advanced and interpretable clustering methods for pattern mining in TAB designs. Advanced algorithms can handle complex data and uncover intricate patterns [44], while interpretable methods provide clearer insights into the clusters [45]. Combining these approaches can enhance the accuracy, depth, and understanding of pattern extraction.
6.2. Application Scenarios
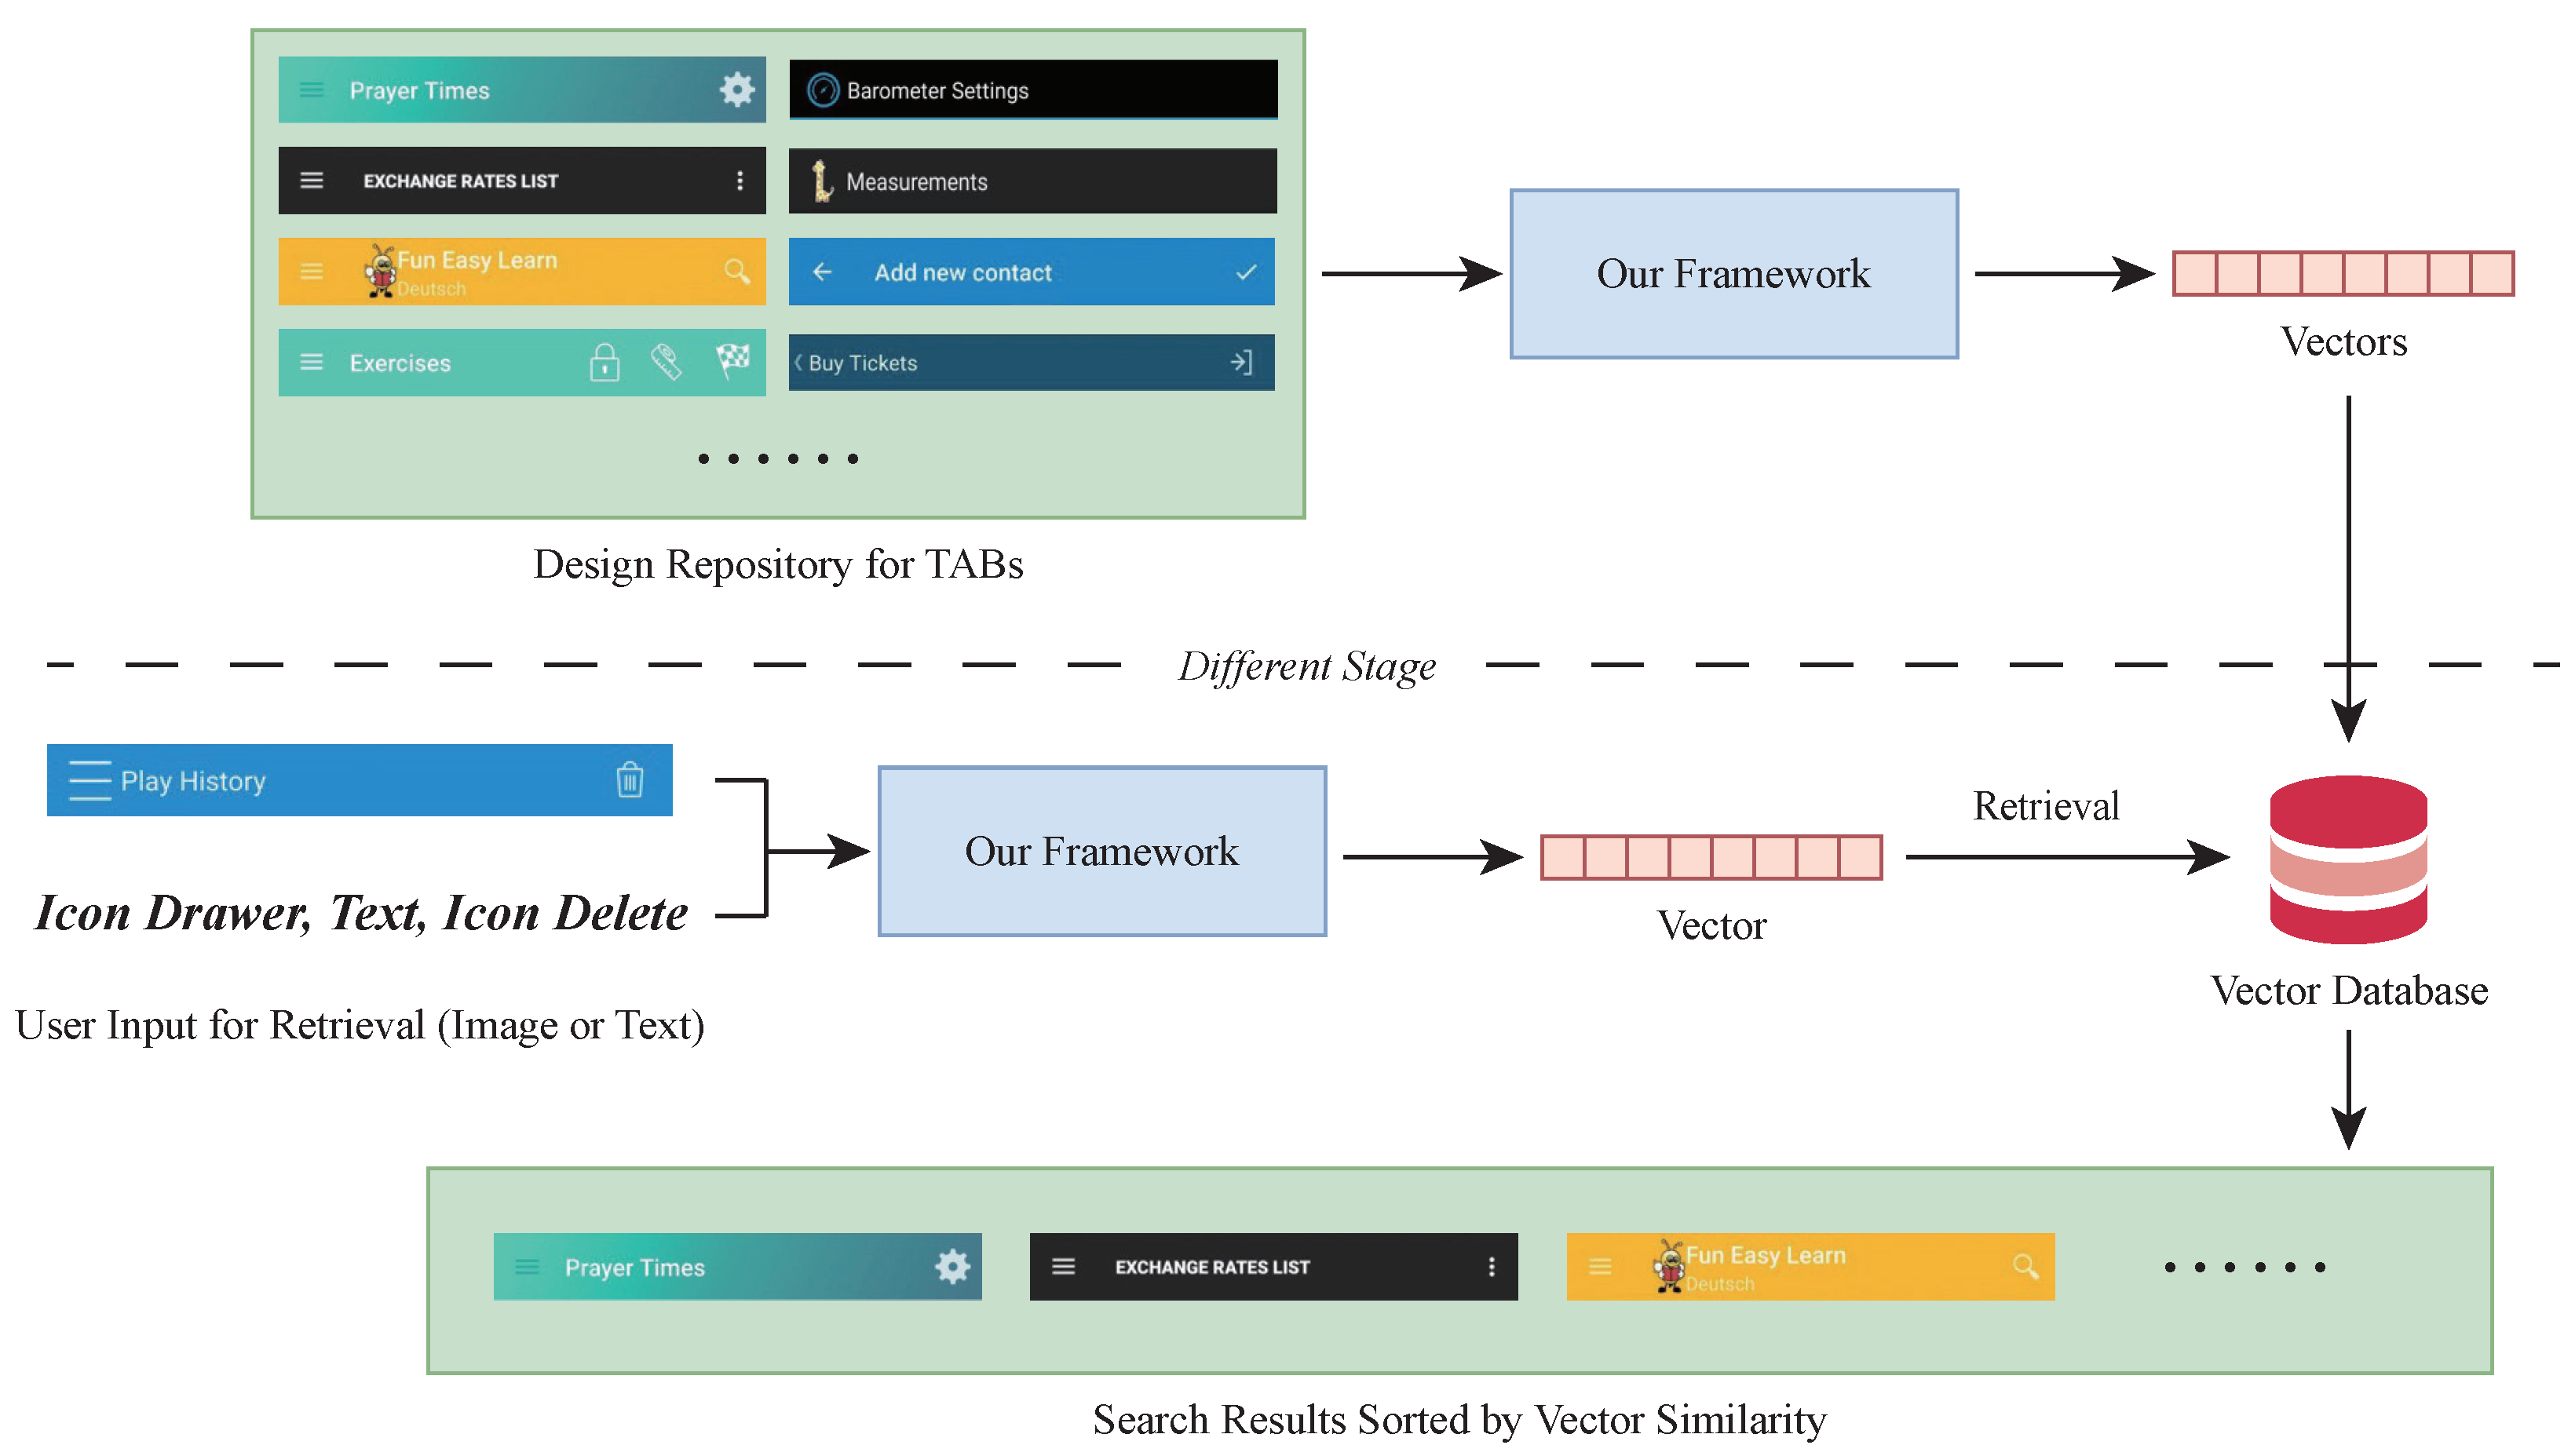
Design search. The primary application scenario is searching TAB designs, aiding designers in finding inspirational examples. Our approach facilitates example-based retrieval [46], transforming design examples into vectors and retrieving them based on similarity measures, as illustrated in Figure 8. When designers input an image or a structured format of a TAB, our method converts it into a vector and calculates the cosine similarity with existing design examples. The search results then display the most similar examples. This process significantly enhances designers’ efficiency and creativity by providing a quick and easy way to access and refine existing TAB designs for use in new or enhanced projects.

Figure 8.
The architecture for TAB design search.
Unlike traditional keyword-based search methods and advanced natural language-based retrieval techniques [47], our framework does not rely on manually crafted labels or descriptions for each UI image. Instead, it uses a domain-specific intermediate representation derived directly from the original code in UI repositories. This approach enables our framework to scale more effectively to large data repositories.
Design recommendation. Another application scenario is design recommendation, which assists designers in finding suitable examples based on the page content. This scenario is a classification task where a model predicts the appropriate TAB design category for a UI screenshot, as shown in Figure 9. The category is determined by clustering results from our method, and the page topic serves as a feature for the classifier. Designers then receive multiple TAB samples from the relevant cluster, enabling swift and informed design choices that enhance design coherence and user experience.
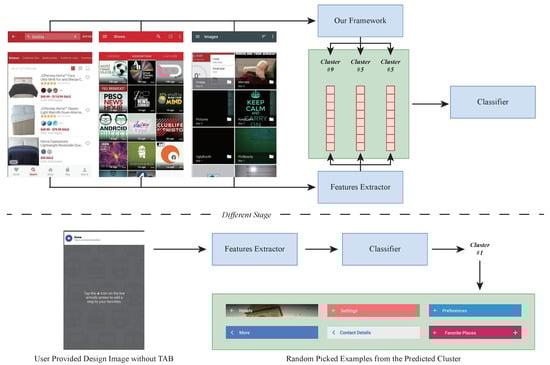
Figure 9.
The architecture for TAB design recommendation.
In contrast to traditional rule-based systems, which are rigid and labor-intensive to update, our framework dynamically generates recommendations using clustering and contextual features. This automated approach reduces manual intervention while providing more personalized and relevant suggestions.
Design generation. Our method’s generative capabilities offer another application in design generation. When designers provide content for a page, our method can produce a suitable TAB design skeleton [48], as illustrated in Figure 10. This approach is inspired by recent advances in computer vision, where skeleton-based frameworks have shown significant potential in generating rich visual images from simple layouts [49,50]. Designers can use these skeletons as a foundation to develop comprehensive visual designs or apply advanced deep rendering techniques to reverse-engineer code into visual representations [51].
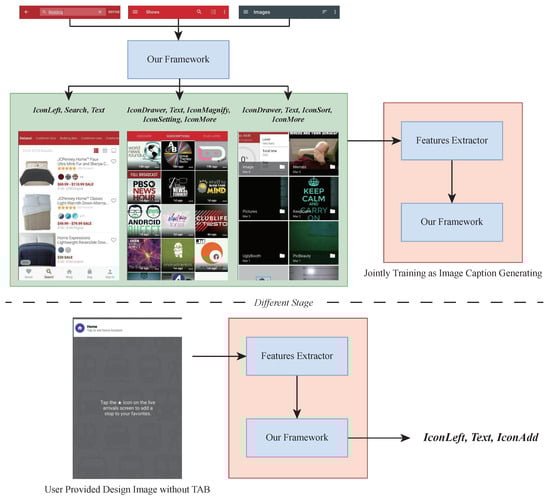
Figure 10.
The architecture for TAB design generation.
Unlike existing methods that struggle with the complexity of real-world UI code generation, our approach simplifies the task by focusing on creating structured TABs. These abstracted sequential representations reduce the complexity of the generative process, making it more practical and adaptable across various applications.
6.3. Threats to Validity
Sparse dataset bias, a significant concern in data-driven research, arises from the disparity between the distribution of experimental data and the underlying data distribution [52]. In our study, the dataset used for training and evaluating TABs may manifest different forms of bias.
Firstly, the dataset might lean towards specific application types, resulting in an imbalance, where certain design patterns are overly represented while others receive less attention. For instance, within the RICO dataset, there is a substantial presence of Entertainment applications, surpassing 500 in number. This abundance might inadvertently bias the derived design patterns towards navigation structures typically found in the Entertainment category, potentially neglecting patterns relevant to other categories like Art & Design (less than 100).
Secondly, there could be a selection bias present in the dataset. Certain TABs might be overrepresented or underrepresented due to how the data were collected. RICO only includes free applications, excluding many well-crafted paid ones. This omission may impact the observed design patterns, favoring less mainstream trends.
Moreover, the data preprocessing method we propose could also introduce biases. Our dataset is limited due to the partial automation of our process. The RICO dataset contains considerable layout noise [53], necessitating manual determination of layout occlusion. Furthermore, the heuristic rules we devise may lack domain-specific knowledge. For instance, there might be unofficial implementations of TABs that do not derive from android.support.v7.widget.Toolbar.
6.4. Limitations
While our study achieves promising results, several limitations warrant consideration.
First, our approach simplifies TABs into a linear sequence structure. However, not all TABs follow a linear format. For instance, dual-line text layouts, as seen in the Knicks application (see Figure 2), are common. We believe this simplification is essential to the success of our method. However, it may limit the representation of more complex TAB structures, which could be a direction for future research.
Second, our method treats all text as a single type of token, disregarding the semantic meaning of the text itself. While this simplification works well for most page titles on TABs, it may result in a loss of critical functional semantics when handling text buttons. Although Google’s Material Design guidelines [1] primarily recommend icon-based TAB action buttons, they do not explicitly prohibit the use of text buttons on TABs. Future work could incorporate text semantics to enhance the model’s overall performance.
7. Conclusions
In this study, we proposed a framework for mining TAB design patterns using autoregressive self-supervised learning and clustering techniques. Our approach addresses key challenges in understanding TAB designs by encoding their linear structures in a sequential manner. The results demonstrate the effectiveness of our methods in extracting meaningful insights from TAB representations.
The representation learning model achieved high predictive accuracy, particularly for medium and long sequences. Its ability to capture complex relationships within TAB designs underscores the robustness of the method for encoding structural and contextual information. This highlights the model’s potential for analyzing intricate design components in practical scenarios.
Clustering the learned representations revealed coherent and meaningful patterns, with K-means outperforming other algorithms in clustering quality. By categorizing TAB designs based on functional and semantic roles, such as content management, navigation, and social interaction, the analysis provides valuable insights into the diversity and organization of TAB design practices.
The potential applications of this work are significant for both design and development processes. The proposed framework enables efficient retrieval and recommendation of TAB designs, offering practical support for creating user-friendly UIs with minimal effort. Additionally, the ability to generate TAB design skeletons based on page context highlights its utility in streamlining UI development.
This research also contributes to the broader field of data mining by demonstrating effective methods for analyzing complex and diverse UI design data. The success of this approach suggests its potential applicability to other UI components, extending its utility beyond TAB designs.
Future work could build on this foundation by incorporating more diverse datasets to mitigate potential biases and exploring advanced clustering techniques to identify more nuanced design patterns. Additionally, applying this framework in real-world UI design assistance scenarios could further demonstrate its practical value, as illustrated in our examples of potential applications.
Author Contributions
Conceptualization, M.L. and T.L.; methodology, M.L. and Z.Z.; software, Z.Z.; validation, M.L. and Z.Z.; formal analysis, Z.Z.; investigation, T.L.; resources, T.L.; data curation, M.L. and Z.Z.; writing—original draft preparation, Z.Z. and M.L.; writing—review and editing, M.L.; visualization, M.L. and Z.Z.; supervision, T.L.; project administration, T.L.; funding acquisition, T.L. All authors have read and agreed to the published version of the manuscript.
Funding
This research was funded by the Sichuan Science and Technology Program, grant number 2024NSFSC0499.
Data Availability Statement
The data presented in this study are available at Zenodo at https://zenodo.org/records/13207361, accessed on 18 January 2025 (DOI: 10.5281/zenodo.13207361). These data were derived from the following resources available in the public domain: http://www.interactionmining.org/rico.html, accessed on 18 January 2025.
Conflicts of Interest
The authors declare no conflicts of interest.
References
- Material Design. Top App Bar—Material Design 3. Available online: https://m3.material.io/components/top-app-bar/guidelines (accessed on 4 April 2024).
- Dong, Y.; Xue, C.; Peng, N.; Niu, Y. The Effect of LOGO Location in Navigation Bar on Web Brand Recognition Based on Event-Related Potential. In Proceedings of the HCI in Business, Government, and Organizations: 5th International Conference, HCIBGO 2018, Las Vegas, NV, USA, 15–20 July 2018. [Google Scholar]
- Johnson, J. GUI Bloopers 2.0: Common User Interface Design Do Nots and Dos; Morgan Kaufmann: San Francisco, CA, USA, 2007. [Google Scholar]
- Cooper, A.; Reimann, R.; Cronin, D.; Noessel, C. About Face: The Essentials of Interaction Design; John Wiley & Sons: Indianapolis, IN, USA, 2014. [Google Scholar]
- dos Santos, E.P.; de Lara, S.M.; Watanabe, W.M.; Filho, M.C.; Fortes, R.P. Usability evaluation of horizontal navigation bar with drop-down menus by middle aged adults. In Proceedings of the 29th ACM International Conference on Design of Communication, Pisa, Italy, 3–5 October 2011. [Google Scholar]
- Van Welie, M.; Van Der Veer, G.C.; Eliëns, A. Patterns as tools for user interface design. In Tools for Working with Guidelines: Annual Meeting of the Special Interest Group; Springer: London, UK, 2001. [Google Scholar]
- Ming, L. Streamlining Visual UI Design: Mining UI Design Patterns for Top App Bars. Zenodo. 2024. Available online: https://zenodo.org/records/13207361 (accessed on 18 January 2025).
- Alexander, C. A Pattern Language: Towns, Buildings, Construction; Oxford University Press: New York, NY, USA, 1977. [Google Scholar]
- Beck, K. Using pattern languages for object-oriented programs. In Proceedings of the OOPSLA-87 workshop on the Specification and Design for Object-Oriented Programming, Orlando, FL, USA, 4–8 October 1987. [Google Scholar]
- Gamma, E.; Helm, R.; Johnson, R.; Vlissides, J. Design Patterns: Elements of Reusable Object-Oriented Software; Addison-Wesley: Reading, MA, USA, 1995. [Google Scholar]
- Bayle, E.; Bellamy, R.; Casaday, G.; Erickson, T.; Fincher, S.; Grinter, B.; Gross, B.; Lehder, D.; Marmolin, H.; Moore, B.; et al. Putting it all together: Towards a pattern language for interaction design: A CHI 97 workshop. ACM SIGCHI Bull. 1998, 30, 17–23. [Google Scholar] [CrossRef]
- Seffah, A. The evolution of design patterns in HCI: From pattern languages to pattern-oriented design. In Proceedings of the 1st International Workshop on Pattern-Driven Engineering of Interactive Computing Systems, Berlin, Germany, 19–23 June 2010. [Google Scholar]
- Borchers, J.O. A pattern approach to interaction design. In Proceedings of the 3rd Conference on Designing Interactive Systems: Processes, Practices, Methods, and Techniques, New York, NY, USA, 17–19 August 2000. [Google Scholar]
- Tidwell, J. Designing Interfaces: Patterns for Effective Interaction Design; O’Reilly Media, Inc.: Sebastopol, CA, USA, 2010. [Google Scholar]
- Nudelman, G. Android Design Patterns: Interaction Design Solutions for Developers; John Wiley & Sons: Indianapolis, IN, USA, 2013. [Google Scholar]
- Neil, T. Mobile Design Pattern Gallery: UI Patterns for Smartphone Apps; O’Reilly Media, Inc.: Sebastopol, CA, USA, 2014. [Google Scholar]
- Dearden, A.; Finlay, J. Pattern languages in HCI: A critical review. Hum.-Comput. Interact. 2006, 21, 49–102. [Google Scholar] [CrossRef]
- Seffah, A. Patterns of HCI Design and HCI Design of Patterns: Bridging HCI Design and Model-Driven Software Engineering; Springer: Cham, Switzerland, 2015. [Google Scholar]
- Braham, A.; Buendía, F.; Khemaja, M.; Gargouri, F. User interface design patterns and ontology models for adaptive mobile applications. Pers. Ubiquitous Comput. 2022, 26, 1395–1411. [Google Scholar] [CrossRef]
- Leiva, L.A.; Hota, A.; Oulasvirta, A. Enrico: A Dataset for Topic Modeling of Mobile UI Designs. In Proceedings of the 22nd International Conference on Human–Computer Interaction with Mobile Devices and Services, Oldenburg, Germany, 5–8 October 2020; MobileHCI. ACM: Oldenburg, Germany, 2020; pp. 1–4. [Google Scholar] [CrossRef]
- Wu, J.; Wang, S.; Shen, S.; Peng, Y.H.; Nichols, J.; Bigham, J.P. WebUI: A Dataset for Enhancing Visual UI Understanding with Web Semantics. In Proceedings of the 2023 CHI Conference on Human Factors in Computing Systems, Hamburg, Germany, 23–28 April 2023; CHI. Association for Computing Machinery: New York, NY, USA, 2023. [Google Scholar] [CrossRef]
- Chen, J.; Xie, M.; Xing, Z.; Chen, C.; Xu, X.; Zhu, L.; Li, G. Object Detection for Graphical User Interface: Old Fashioned or Deep Learning or a Combination? In Proceedings of the 28th ACM Joint Meeting on European Software Engineering Conference and Symposium on the Foundations of Software Engineering, ESEC/FSE 2020, Virtual, 8–13 November 2020; pp. 1202–1214. [Google Scholar] [CrossRef]
- Deka, B.; Huang, Z.; Franzen, C.; Hibschman, J.; Afergan, D.; Li, Y.; Nichols, J.; Kumar, R. Rico: A Mobile App Dataset for Building Data-Driven Design Applications. In Proceedings of the 30th Annual ACM Symposium on User Interface Software and Technology, UIST, Québec City, QC, Canada, 22–25 October 2017; ACM: Québec City, QC, Canada, 2017; pp. 845–854. [Google Scholar] [CrossRef]
- Liu, T.F.; Craft, M.; Situ, J.; Yumer, E.; Mech, R.; Kumar, R. Learning Design Semantics for Mobile Apps. In Proceedings of the 31st Annual ACM Symposium on User Interface Software and Technology, UIST, Berlin, Germany, 14–17 October 2018; ACM: Berlin, Germany, 2018; pp. 569–579. [Google Scholar] [CrossRef]
- Chen, J.; Chen, C.; Xing, Z.; Xia, X.; Zhu, L.; Grundy, J.; Wang, J. Wireframe-Based UI Design Search through Image Autoencoder. ACM Trans. Softw. Eng. Methodol. ToSEM 2020, 29, 1–31. [Google Scholar] [CrossRef]
- Li, T.J.J.; Popowski, L.; Mitchell, T.; Myers, B.A. Screen2Vec: Semantic Embedding of GUI Screens and GUI Components. In Proceedings of the 2021 CHI Conference on Human Factors in Computing Systems, CHI, Yokohama Japan, 8–13 May 2021; pp. 1–15. [Google Scholar] [CrossRef]
- Choi, S.; Seo, H.T.; Han, Y.S. An Empirical Study on Multimodal Activity Clustering of Android Applications. IEEE Access 2023, 11, 53598–53614. [Google Scholar] [CrossRef]
- Choi, S.; Seo, H.T.; Han, Y.S. JIDECA: Jointly Improved Deep Embedded Clustering for Android activity. In Proceedings of the 2023 IEEE International Conference on Big Data and Smart Computing (BigComp), Jeju, Republic of Korea, 13–16 February 2023; pp. 105–112. [Google Scholar] [CrossRef]
- He, Z.; Sunkara, S.; Zang, X.; Xu, Y.; Liu, L.; Wichers, N.; Schubiner, G.; Lee, R.; Chen, J. ActionBert: Leveraging User Actions for Semantic Understanding of User Interfaces. Proc. AAAI Conf. Artif. Intell. 2021, 35, 5931–5938. [Google Scholar] [CrossRef]
- Feiz, S.; Wu, J.; Zhang, X.; Swearngin, A.; Barik, T.; Nichols, J. Understanding Screen Relationships from Screenshots of Smartphone Applications. In Proceedings of the 27th International Conference on Intelligent User Interfaces, IUI, Helsinki, Finland, 22–25 March 2022; ACM: Helsinki, Finland, 2022; pp. 447–458. [Google Scholar] [CrossRef]
- Bai, C.; Zang, X.; Xu, Y.; Sunkara, S.; Rastogi, A.; Chen, J. UIBert: Learning Generic Multimodal Representations for UI Understanding. arXiv 2021, arXiv:2107.13731. [Google Scholar]
- Banerjee, P.; Mahajan, S.; Arora, K.; Baral, C.; Riva, O. Lexi: Self-Supervised Learning of the UI Language. arXiv 2023, arXiv:2301.10165. [Google Scholar]
- Viennot, N.; Garcia, E.; Nieh, J. A measurement study of google play. ACM Sigmetrics Perform. Eval. Rev. 2014, 42, 221–233. [Google Scholar] [CrossRef]
- Frank, M.; Dong, B.; Felt, A.P.; Song, D. Mining permission request patterns from android and facebook applications. In Proceedings of the 2012 IEEE 12th International Conference on Data Mining, Brussels, Belgium, 10–13 December 2012. [Google Scholar]
- Alharbi, K.; Yeh, T. Collect, decompile, extract, stats, and diff: Mining design pattern changes in Android apps. In Proceedings of the 17th International Conference on Human–Computer Interaction with Mobile Devices and Services MobileHCI, Copenhagen, Denmark, 24–27 August 2015. [Google Scholar]
- Sahami Shirazi, A.; Henze, N.; Schmidt, A.; Goldberg, R.; Schmidt, B.; Schmauder, H. Insights into layout patterns of mobile user interfaces by an automatic analysis of Android apps. In Proceedings of the 5th ACM SIGCHI Symposium on Engineering Interactive Computing Systems EICS, London, UK, 24–27 June 2013. [Google Scholar]
- Deka, B.; Huang, Z.; Kumar, R. ERICA: Interaction mining mobile apps. In Proceedings of the 29th Annual Symposium on User Interface Software and Technology, UIST, Tokyo, Japan, 16–19 October 2016. [Google Scholar]
- Liu, X.; Zhang, F.; Hou, Z.; Mian, L.; Wang, Z.; Zhang, J.; Tang, J. Self-supervised learning: Generative or contrastive. IEEE Trans. Knowl. Data Eng. 2021, 35, 857–876. [Google Scholar] [CrossRef]
- Mikolov, T.; Sutskever, I.; Chen, K.; Corrado, G.S.; Dean, J. Distributed representations of words and phrases and their compositionality. In Proceedings of the Advances in Neural Information Processing Systems 26, Lake Tahoe, NA, USA, 5–8 December 2013. [Google Scholar]
- Bojanowski, P.; Grave, E.; Joulin, A.; Mikolov, T. Enriching word vectors with subword information. Trans. Assoc. Comput. Linguist. 2017, 5, 135–146. [Google Scholar] [CrossRef]
- Radford, A.; Narasimhan, K.; Salimans, T.; Sutskever, I. Improving Language Understanding by Generative Pre-Training. 2018, unpublished. Available online: https://cdn.openai.com/research-covers/language-unsupervised/language_understanding_paper.pdf (accessed on 18 January 2025).
- Cho, K.; Van Merriënboer, B.; Gulcehre, C.; Bahdanau, D.; Bougares, F.; Schwenk, H.; Bengio, Y. Learning Phrase Representations Using RNN Encoder-Decoder for Statistical Machine Translation. arXiv 2014, arXiv:1406.1078. [Google Scholar]
- Morissette, L.; Chartier, S. The k-means clustering technique: General considerations and implementation in Mathematica. Tutorials Quant. Methods Psychol. 2013, 9, 15–24. [Google Scholar] [CrossRef]
- Oyewole, G.J.; Thopil, G.A. Data clustering: Application and trends. Artif. Intell. Rev. 2023, 56, 6439–6475. [Google Scholar] [CrossRef] [PubMed]
- Saisubramanian, S.; Galhotra, S.; Zilberstein, S. Balancing the tradeoff between clustering value and interpretability. In Proceedings of the AAAI/ACM Conference on AI, Ethics, and Society, New York, NY, USA, 7–9 February 2020. [Google Scholar]
- Huang, F.; Canny, J.F.; Nichols, J. Swire: Sketch-Based User Interface Retrieval. In Proceedings of the 2019 CHI Conference on Human Factors in Computing Systems, CHI, Glasgow, UK, 4–9 May 2019; ACM: Glasgow, UK, 2019; pp. 1–10. [Google Scholar] [CrossRef]
- Wei, J.; Courbis, A.L.; Lambolais, T.; Xu, B.; Bernard, P.L.; Dray, G.; Maalej, W. GUing: A Mobile GUI Search Engine using a Vision-Language Model. arXiv 2024, arXiv:2405.00145. [Google Scholar] [CrossRef]
- Chen, C.; Su, T.; Meng, G.; Xing, Z.; Liu, Y. From UI Design Image to GUI Skeleton: A Neural Machine Translator to Bootstrap Mobile GUI Implementation. In Proceedings of the 2018 IEEE/ACM 40th International Conference on Software Engineering (ICSE), ICSE, Gothenburg, Sweden, 27 May–3 June 2018; pp. 665–676. [Google Scholar]
- Li, J.; Yang, J.; Hertzmann, A.; Zhang, J.; Xu, T. Layoutgan: Generating graphic layouts with wireframe discriminators. arXiv 2019, arXiv:1901.06767. [Google Scholar]
- Qin, C.; Zhang, S.; Yu, N.; Feng, Y.; Yang, X.; Zhou, Y.; Wang, H.; Niebles, J.C.; Xiong, C.; Savarese, S.; et al. Unicontrol: A unified diffusion model for controllable visual generation in the wild. arXiv 2023, arXiv:2305.11147. [Google Scholar]
- Shao, Z.; Gao, F.; Xing, H.; Zhu, Z.; Yu, Z.; Bu, J.; Zheng, Q.; Yao, C. WebRPG: Automatic Web Rendering Parameters Generation for Visual Presentation. In European Conference on Computer Vision; Springer: Cham, Switzerland, 2024. [Google Scholar]
- Dixit, R.; Chinnam, R.B.; Singh, H. Artificial Intelligence and Machine Learning in Sparse/Inaccurate Data Situations. In Proceedings of the 2020 IEEE Aerospace Conference, Big Sky, MT, USA, 7–14 March 2020; pp. 1–8. [Google Scholar] [CrossRef]
- Li, G.; Baechler, G.; Tragut, M.; Li, Y. Learning to Denoise Raw Mobile UI Layouts for Improving Datasets at Scale. In Proceedings of the 2022 CHI Conference on Human Factors in Computing Systems, CHI, New York, NY, USA, 29 April–5 May 2022; Association for Computing Machinery: New York, NY, USA, 2022. [Google Scholar] [CrossRef]


Disclaimer/Publisher’s Note: The statements, opinions and data contained in all publications are solely those of the individual author(s) and contributor(s) and not of MDPI and/or the editor(s). MDPI and/or the editor(s) disclaim responsibility for any injury to people or property resulting from any ideas, methods, instructions or products referred to in the content. |
© 2025 by the authors. Licensee MDPI, Basel, Switzerland. This article is an open access article distributed under the terms and conditions of the Creative Commons Attribution (CC BY) license (https://creativecommons.org/licenses/by/4.0/).