Article

Causal Factors in Elderly Pedestrian Traffic Injuries Based on Association Analysis

1
Hubei Key Laboratory of Advanced Technology of Automotive Components, Wuhan University of Technology, Wuhan 430070, China
2
Hubei Collaborative Innovation Center for Automotive Components Technology, Wuhan University of Technology, Wuhan 430070, China
*
Author to whom correspondence should be addressed.
Appl. Sci. 2025, 15(3), 1170; https://doi.org/10.3390/app15031170
Submission received: 3 January 2025 / Revised: 22 January 2025 / Accepted: 23 January 2025 / Published: 24 January 2025

Abstract

:
In traffic accidents, elderly individuals face a significantly higher risk of mortality compared with other age groups. To investigate the factors contributing to elderly pedestrian accidents and their impact on injury severity, 1420 motor vehicle/elderly pedestrian collisions from the 2019–2023 Chinese Traffic Accident Deep Investigation Database were analyzed using the FP-growth algorithm. This analysis identified 5594 association rules across 28 types of variables within 4 categories of influencing factors. Logistic regression results indicate that pedestrian age, collision speed, time of occurrence, and accident location are significant factors affecting the mortality rate of elderly pedestrians in traffic accidents. Specifically, pedestrian age and collision speed significantly influence mortality rates. As collision speed increases, the mortality rate rises markedly. For elderly pedestrians aged 60 and above, the mortality rate increases by 3.7% with each additional year of age. Moreover, accidents occurring at night, in suburban areas, or in villages are associated with a higher mortality rate. This study offers scientific support for the formulation of safety measures aimed at improving the traffic safety of elderly pedestrians.

1. Introduction

In 2024, 11.5% of the global population was aged 65 and over, while the corresponding proportion in China was 15.4% [1]. Elderly individuals are more vulnerable to accidents in road traffic due to physical limitations such as reduced dexterity, impaired vision, and hearing loss. Moreover, with the decline in physical resilience associated with aging, elderly individuals face a significantly higher risk of mortality compared with other age groups [2,3,4]. Consequently, research on the causes of injuries and preventive strategies for elderly individuals involved in traffic accidents is of critical importance.
Current research on pedestrian safety primarily focuses on specific injury locations in pedestrian accidents, with an emphasis on vulnerable areas such as the head [5], chest [6], and lower limbs [7]. Among these, head injuries are associated with the highest fatality rates [8]. Rella, Hafeez, Schuurman, and Roberts et al. [9,10,11,12] identified that factors related to the road, environment, vehicle, driver, and pedestrian are all linked to fatal pedestrian accidents. Sadeghi and Zeng et al. [13,14] conducted further studies on the impact of road attributes on accidents. They discovered that for every 1.0 m/km increase in the international roughness index (IRI) of the road surface, the logarithmic values of accidents on two-lane undivided highways and highways without central barriers increased by 0.048 and 0.013, respectively. Resurfacing the road to improve surface conditions led to a 26% reduction in fatal and injury accidents. Additionally, the driving environment influenced the likelihood of accidents. Wang, Yan, and Alogaili et al. [15,16,17] analyzed the probabilities of traffic accidents under various environmental conditions and found that adverse weather conditions (e.g., rainy or snowy weather) or poor visibility (e.g., unlit nights) increased the likelihood of accidents by 15.3% and 11.6%, respectively, compared with conditions with favorable weather and visibility. However, studies by Kaplan and Fugiglando et al. [18,19] indicate that, under adverse driving conditions, drivers tend to adopt more cautious driving behaviors, resulting in a 25.7% reduction in the probability of accidents within a driving duration of two hours, with less severe consequences. In vehicle/pedestrian collisions, the human body is subjected to a severe impact from the front of the vehicle within a short time, and the structure of the vehicle’s front end significantly influences the severity of pedestrian injuries [20]. Liu and Mo et al. [21,22] investigated the impact of vehicle front-end geometry on pedestrian injury outcomes. Their findings indicated that, when the vehicle’s front-end height exceeded 80 cm, the pedestrian head injury criterion (HIC) values were approximately 35–50% higher than those for traditional sedans. Additionally, when the vehicle type changed from a compact car to a large SUV or light truck, the overall pedestrian fatality rate increased by approximately 15–25%. Additionally, driver behavior plays a predominant role in influencing accidents [23,24]. Elif and Zhu et al. [25,26] identified distracted driving, alcohol consumption, lane changes, and speeding violations as the most critical factors contributing to traffic accidents. More than 35% of speeding-related accidents resulted in fatalities, with elderly pedestrians facing an even higher mortality rate after collisions with motor vehicles [27]. The aforementioned studies highlight that multiple factors, including road conditions, the environment, vehicles, and drivers, significantly affect the occurrence and severity of pedestrian accidents. However, few studies specifically address the causes of accidents involving elderly pedestrians, with most research only including the elderly as a subgroup in age-related classifications.
Currently, the primary methods for analyzing the causal factors of injuries in road traffic accidents include discrete choice models [28], decision tree algorithms [29], Bayesian networks [30], and association rule mining [31]. Among these, association rule algorithms are frequently used due to their ability to uncover relationships between multiple factors and reveal the underlying mechanisms behind accidents [32]. Association rule algorithms, such as the Apriori algorithm [33] and FP-growth algorithm [34], are capable of mining hidden relationships and patterns from large complex datasets. By identifying frequent itemsets and association rules, these methods can uncover the factor combinations most likely to lead to accidents and their severity under specific conditions. When integrated with other methods for visualization analysis, these techniques further enhance their application in accident analysis and have become one of the main research approaches for investigating the causes and influencing factors of traffic accidents. Rella et al. [9] combined the FP-growth algorithm with the mixed logit model to identify collision-related factors contributing to pedestrian fatalities, such as collision angle, collision speed, and the pedestrian’s condition. Xi et al. [35] developed an association rule mining process based on the Apriori algorithm and data visualization mining techniques to analyze the causes of traffic accidents. They proposed a two-level analysis model, and the results demonstrated that the improved algorithm outperformed traditional algorithms in both accuracy and mining speed. Seyed et al. [36] proposed a new genetic rule based on the Apriori algorithm to predict the severity of traffic accident injuries, which can provide traffic safety risk warnings under specific conditions. Cai [37] identified the key causal factors of urban road traffic accidents using an improved Apriori algorithm combined with multi-level multi-dimensional data mining techniques. Koramati et al. [38] identified multiple association rules using the Apriori algorithm, categorizing risk factors into six specific levels, thereby providing a clearer understanding of highway accident causation and more precisely identifying accident risk factors. Existing studies demonstrate that association rule algorithms have made notable progress in analyzing the causation of injuries in road traffic accidents. However, there is a notable gap in the real data analysis of injury causation in traffic accidents involving elderly pedestrians in China. Given China’s large elderly population and the substantial number of elderly individuals injured or killed in traffic accidents annually, conducting research on injury causation for elderly pedestrian accidents based on such data is of paramount importance.
In conclusion, association rule analysis based on the Apriori and FP-growth algorithms effectively uncovers hidden relationships and patterns, making it a crucial method for injury causation analysis in traffic accidents. With the aggravation of population aging in China, the traffic risks faced by elderly individuals have become increasingly prominent, making it essential to investigate their specific vulnerabilities. However, studies focusing on the causes of accidents involving elderly pedestrians in China remain scarce. This study employs association rule algorithms and logistic regression models to conduct a comprehensive analysis of a nationwide dataset of real-world cases involving elderly casualties. The reliability of the model and the representativeness of the dataset ensure accurate identification of key factors influencing the occurrence of accidents and the severity of injuries among the elderly. Compared with existing studies, this paper proposes methods and strategies to address the challenges of elderly pedestrian traffic safety from a novel perspective. It provides a scientific basis for formulating targeted traffic safety measures, aiming to enhance the travel safety of elderly pedestrians and reduce their casualties in traffic accidents.

2. Materials and Methods

2.1. Data Preprocessing

According to the World Health Organization’s age classification, individuals aged 60 and above are considered elderly. The China Traffic Accident Deep Investigation System (CIDAS) is led by key governmental agencies, including the Ministry of Transport and the Traffic Management Bureau of the Ministry of Public Security. Drawing on both domestic and international best practices in traffic accident investigation, it enjoys strong governmental backing and policy support. Its data are widely recognized for their high credibility and research value in the field of road traffic safety in China. Data related to motor vehicle accidents involving elderly pedestrians nationwide were extracted from the China Traffic Accident Deep Investigation Database (https://www.nais.org.cn (accessed on 20 January 2025)). Using Pandas, the dataset was cleaned and missing values were addressed for cases involving elderly casualties. Ultimately, 1420 car/pedestrian accident cases involving elderly pedestrians were selected. To explore the relationship between the severity of injuries to elderly pedestrians and factors such as people, vehicles, roads, and the environment, 28 categorical variables were selected from these 4 dimensions and categorized into intervals, as shown in Table 1.

2.2. FP-Growth Association Rule Mining Method

The FP-growth (frequent pattern growth) algorithm is an efficient method for discovering frequent itemsets in data mining. The FP-growth algorithm compresses data records by constructing a tree structure, allowing the mining of frequent itemsets with only two scans of the data records. Additionally, this algorithm does not require the generation of candidate sets, which significantly improves efficiency. Therefore, this paper employs the FP-growth algorithm to mine and analyze the association rules between the injury severity of elderly pedestrians and data on people, vehicles, roads, and the environment.
Association rules are a common concept in data mining, used to discover associations and patterns among items in a dataset. In association rules, support, confidence, and lift are three important metrics used to measure the validity and strength of the rules.
(1)
Support
Support measures the frequency of an itemset appearing in the dataset. It is defined as the ratio of the number of accident records containing the itemset to the total number of accident records.
Support ( A B ) = P ( A B ) ,
where A represents the antecedent of the association rule, and B represents the consequent of the association rule.
(2)
Confidence
Confidence measures the reliability of the association rule. For the rule AB, confidence is defined as the ratio of the number of accident records that contain both A and B to the number of accident records that contain A.
Confidence ( A B ) = S u p p o r t ( A B ) S u p p o r t ( B )
(3)
Lift
Lift measures the degree of association between the two items in the rule. For the rule AB, lift is defined as the confidence of AB divided by the support of B. A lift greater than 1 indicates a positive correlation between A and B, a lift equal to 1 indicates no association, and a lift less than 1 indicates a negative correlation between A and B.
Lift ( A B ) = C o n f i d e n c e ( A B ) S u p p o r t ( B )

2.3. Logistic Regression Model

Logistic regression is a classification model commonly used for binary classification problems. To further investigate the impact of the aforementioned variables on the mortality rate of elderly pedestrians, this paper constructs a binary logistic regression model concerning the injury severity (injury, death) of elderly pedestrians. The model’s output is the mortality rate.
P ( Y ) = 1 1 + e ( b 0 + b 1 X 1 + b 2 X 2 + b n X n )
where Y is the predicted variable, X1, X2, and Xn are the input variables, b0 is the constant, and b1, b2, and bn are the regression coefficients.

3. Results

The influencing factors of traffic accidents are divided into four dimensions: people, vehicles, roads, and environment. The association rule mining for each dimension and the severity of accident injuries was conducted. The results of the association rules are shown in Table 2.

3.1. Association Rules Between Pedestrian Factors, Vehicle Factors, and Injury Severity

In studies analyzing traffic accident data using the FP-growth algorithm, the support value is typically set within the range of 0.03 to 0.1, depending on the dataset size and target patterns [34]. According to Bao et al. [39], setting the support value at 0.05 ensures that important rules are not overlooked while reducing the interference of irrelevant rules. This approach maintains a balance between capturing significant but infrequent rules and practical rules. Therefore, this study adopts a minimum support value of 0.05 in the FP-growth algorithm, resulting in the extraction of 5594 association rules. Subsequently, injury severity was considered as the consequent in the association rules, with 187 rules for minor injuries, 107 for serious injuries, and 692 for fatalities. The factors related to the pedestrian and the driver are more frequently associated with fatal accidents.
Collision speed is a critical factor contributing to fatalities among elderly pedestrians. The first two association rules indicate that, when the antecedent remains unchanged and the “initial speed” item is removed from the consequent, the lift value decreases by 2.77. The fourth association rule reveals that the confidence level of the driver realizing the collision only after it occurs is nearly 50%. Furthermore, a relatively high proportion of drivers either fail to notice elderly pedestrians or, upon noticing them, do not apply the brakes in time. Comparing the fourth and final rows in the table, from the perspective of collision anticipation, the driver’s awareness of the elderly pedestrian has a greater impact on the severity of the injury compared with the pedestrian’s awareness of the vehicle. This is primarily due to the fact that drivers are able to take effective control and evasive measures in emergency situations. The vehicle’s kinetic energy and safety features offer better protection, while the driver’s vision and anticipation skills enable them to take proactive actions to avoid collisions. As a result, these combined factors make the driver’s timely recognition of elderly pedestrians far more effective in reducing injury severity than the pedestrian’s awareness of the vehicle. Furthermore, both driving experience and pedestrian height influence injury severity to some extent. Novice drivers with less than 6 years of experience are more prone to severe accidents, while shorter pedestrians are at higher risk of colliding with vital areas, resulting in more serious injuries. Furthermore, clothing thickness, gender, and collision direction exhibit a lift value close to 1 in fatal accidents, suggesting that these three factors have a minimal direct effect on injury severity.

3.2. Association Rules Between Road Factors and Injury Severity

Road surface information encompasses the road environment at the accident site, including factors such as precipitation, fog conditions, traffic volume on the accident segment, traffic control measures, speed bumps, distance from speed limit signs to the collision point, the maximum allowable speed on the road, legal driving restrictions, and the road’s classification. The frequent itemsets are arranged in descending order of confidence, with light injury, severe injury, and death as the filtering criteria for backward selection.
In the association rules regarding precipitation, fog, and traffic volume, there is no significant change in confidence or lift concerning elderly pedestrian injury severity, suggesting that these three factors have minimal influence on the severity of injuries. Vehicle speed and road conditions have a considerable impact on injury severity, with intersections more strongly associated with fatal accidents, while injury accidents are more strongly correlated with regular road sections. Additionally, the presence of speed limit signs and speed bumps is correlated with accident severity, with the confidence for fatal accidents reaching 0.6, which is significantly higher than that for injury accidents. Traffic volume is also correlated with injury severity, with fatal accidents occurring more frequently on road segments with lower traffic volume and no speed limit signs. In contrast, road segments with high traffic volume are associated with less severe accidents. This may be because traffic volume directly impacts vehicle speed and driver attention, which in turn influences the severity of accidents.

3.3. Association Rules Between Environmental Factors and Injury Severity

Environmental factors include the time and location of the accident, the type of collision, the type of street lighting at the time of the accident, and its operational status. First, using a minimum confidence threshold of 0.2, a total of 1012 association rules were mined. Then, the rules were sorted in descending order of confidence, with death, severe injury, and light injury as filtering conditions for the consequent items in the association rules.
From a temporal perspective, fatal accidents are more likely to occur during dusk and night, with the highest occurrence at 18:00 during the evening rush hour. “Nighttime, road crossing, and visual obstacles” are high-risk scenarios for fatal accidents involving elderly pedestrians, with a confidence of 0.68. When the “nighttime” factor is removed, the association between “road crossing” and “visual obstacles” becomes stronger for severe injuries, with a confidence of 0.29. Regarding the accident location, “suburbs” and “villages” are more likely to be associated with fatal accidents, with confidence values of 0.67 and 0.64, respectively. In contrast, urban areas are more commonly associated with severe and light injuries. From the perspective of accident causation, crossing intersections is a key factor in accident occurrence, while road crossing and visual obstacles are significant contributors to the severity of injuries.

4. Discussion

Logistic regression is a classification model widely used for binary classification problems, capable of revealing the specific effects of variables on the target outcome. In logistic regression analysis, metrics such as standard error, p-value, Exp(B), and log likelihood are commonly used to assess model fit, variable significance, and predictive capability, aiding in the evaluation of model stability and reliability.
Standard error: measures the variability of the estimated regression coefficients, reflecting the precision of the regression model.
p-value: Assesses the statistical significance of each factor. A smaller p-value (typically < 0.05) indicates stronger evidence against the null hypothesis.
Exp(B): represents the odds ratio, quantifying the likelihood of a change in the dependent variable for every unit increase in the independent variable.
Log likelihood: Indicates the measure of model fit. A higher log likelihood (or a less negative value) suggests a better model fit.
Based on the aforementioned result, the input variables include elderly pedestrian height, driver’s years of experience, driver’s awareness of the elderly pedestrian, collision speed, time of accident, road type, and accident location/environment. Height, age, and collision speed are continuous variables, while the remaining variables are categorical and encoded as dummy variables. Height, elderly pedestrian age, driver’s years of experience, collision speed, and time of day meet the significance criterion (p-value < 0.1), while the other factors are not significant, as shown in Table 3.
The results indicate that height has a significant impact on the mortality rate of elderly pedestrians (p-value = 0.063), with Exp(B) = 0.98. For each unit increase in elderly pedestrian height, the mortality rate decreases by 2%. The likely explanation for this result is that a higher pedestrian collision point is above the vehicle’s bumper and hood, preventing direct impact to the head and chest, thereby reducing fatal injuries. Additionally, taller pedestrians are more likely to be thrown in a trajectory that avoids secondary impacts from the vehicle’s rigid parts. To further reduce the mortality rate among elderly pedestrians, the design of vehicle fronts should be optimized, pedestrian protection measures should be strengthened, traffic safety education for elderly pedestrians should be conducted, and intelligent transportation systems should be promoted to improve protection and accident response capabilities.
Age significantly influences the mortality rate of elderly pedestrians (p-value = 0.004), with an Exp(B) value of 1.037, meaning that for each additional year, the mortality rate increases by 3.7%. This is due to the decline in reaction time, flexibility, and recovery ability with age, which makes elderly pedestrians more susceptible to fatal injuries in traffic accidents. Furthermore, elderly pedestrians are more likely to have chronic conditions, which increases their vulnerability and results in higher mortality rates following injury. To mitigate this risk, measures such as traffic safety education, improved road infrastructure, the promotion of advanced driver assistance systems, regular health monitoring, and enhanced medication management should be implemented to safeguard elderly pedestrians.
The mortality rate of elderly pedestrians caused by drivers with 6–15 years of driving experience is significantly lower, with Exp(B) of 0.275. Similarly, drivers with over 15 years of experience also cause a significantly lower mortality rate, with Exp(B) of 0.271, representing a reduction of approximately 73% compared with drivers with fewer than 6 years of experience. This is primarily due to the fact that as driving experience increases, drivers accumulate more expertise, allowing them to better navigate complex road conditions and respond to unforeseen situations. Their risk perception and psychological maturity improve, and their proficiency in vehicle control and adherence to traffic rules enable them to effectively avoid accidents and reduce pedestrian injury risks. Therefore, measures such as enhancing driver training, encouraging knowledge transfer, strengthening traffic law awareness, employing simulation-based training, and implementing ongoing education can assist drivers in rapidly accumulating experience and improving their safe driving proficiency.
The driver’s awareness of the elderly pedestrian did not significantly impact the mortality rate (p-value = 0.914), with Exp(B) equal to 1.02, indicating that this factor has a minimal effect on mortality. This suggests that, once a collision occurs, the severity of the accident is more influenced by the collision speed and environmental conditions than by the driver’s ability to notice the elderly pedestrian beforehand.
Collision speed significantly affects elderly pedestrian mortality (p-value = 0.00), with Exp(B) = 1.024, indicating that, for each unit increase in collision speed, the mortality rate rises by 2.4%. The increase in speed significantly amplifies the kinetic energy during a collision, leading to greater impact forces and more severe injuries. Additionally, higher speeds reduce the driver’s reaction time and braking distance, making collision avoidance more difficult. Furthermore, the effectiveness of vehicle safety systems decreases at higher speeds, and the human body—particularly of elderly individuals—has limited capacity to withstand high-energy impacts, thereby increasing the risk of serious injury and death. To mitigate this risk, a combination of measures such as speed limits, enhanced traffic law education, improved road design, promotion of intelligent driving assistance systems, and the enhancement of vehicle safety should be implemented to effectively reduce the impact of high-speed collisions on mortality.
The type of road does not significantly affect elderly pedestrian mortality (with high significance), but at intersections, cross junctions, and ramp junctions, pedestrian mortality is higher at cross junctions and ramp junctions, with Exp(B) values of 1.328 and 1.43, respectively. These road sections have complex traffic flow, and the frequent interaction between elderly pedestrians and vehicles makes collisions more likely. Both elderly pedestrians and vehicles face more traffic conflict points on these sections, which increases the likelihood of accidents.
The time of day significantly affects elderly pedestrian mortality (p-value = 0.00). The mortality rate during the day significantly decreases, with Exp(B) of 0.245, and the mortality rate during dusk also significantly decreases, with Exp(B) of 0.425. This is because visibility is better during the day and at dusk, which allows drivers to see the road conditions more clearly and take evasive actions earlier. Additionally, during these periods, drivers are typically more awake and alert, with better concentration and stronger decision-making abilities. Additionally, during the day and at dusk, traffic flow is heavier and vehicle speeds are lower, which results in less impact and less severe accidents. However, at night, traffic flow decreases and vehicle speeds increase, making the injuries more severe. Inadequate road lighting and unclear signs also increase the difficulty of driving at night. To reduce the nighttime traffic accident mortality rate, improvements should be made in road lighting, increased traffic enforcement at night, driver training for nighttime driving, the promotion of night vision assistance systems, and the provision of convenient and safe public transport services at night.
The location of the accident significantly affects the mortality rate of elderly pedestrians (p-value = 0.005). The mortality rate is slightly higher in villages and suburban areas, with Exp(B) = 1.13. The higher mortality rate of traffic accidents in villages and suburban areas may be attributed to poorer road conditions, inadequate nighttime lighting, and more frequent interactions between pedestrians and vehicles, all of which contribute to a higher risk of accidents.
Based on the above analysis, it is clear that the age, collision speed, and height of elderly pedestrians significantly influence the mortality rate. The ROC (receiver operating characteristic) curve for each factor in relation to the mortality rate is shown in Figure 1. The ROC curve for collision speed is clearly above the reference line, indicating that collision speed plays a major role in predicting traffic accident mortality, with the highest impact on mortality and an AUC (area under the curve) value of 0.64. The ROC curve for pedestrian age is also above the reference line, although slightly lower than that for collision speed, it still shows good predictive power, with an AUC value of 0.56.
The collision speed, age, and mortality rate are fit to obtain Figure 2. The analysis shows that, at low collision speeds (0–30 km/h), the mortality rate remains low and increases gradually. However, when the speed reaches 50 km/h, there is a noticeable increase in mortality, and when the speed exceeds 90 km/h, the mortality rate surpasses 80%. As age increases, the mortality rate gradually rises. While the fluctuations in mortality rate due to age are relatively small, the starting rate is high, reflecting the elevated risk of death for elderly pedestrians in traffic accidents.

5. Conclusions

(1)
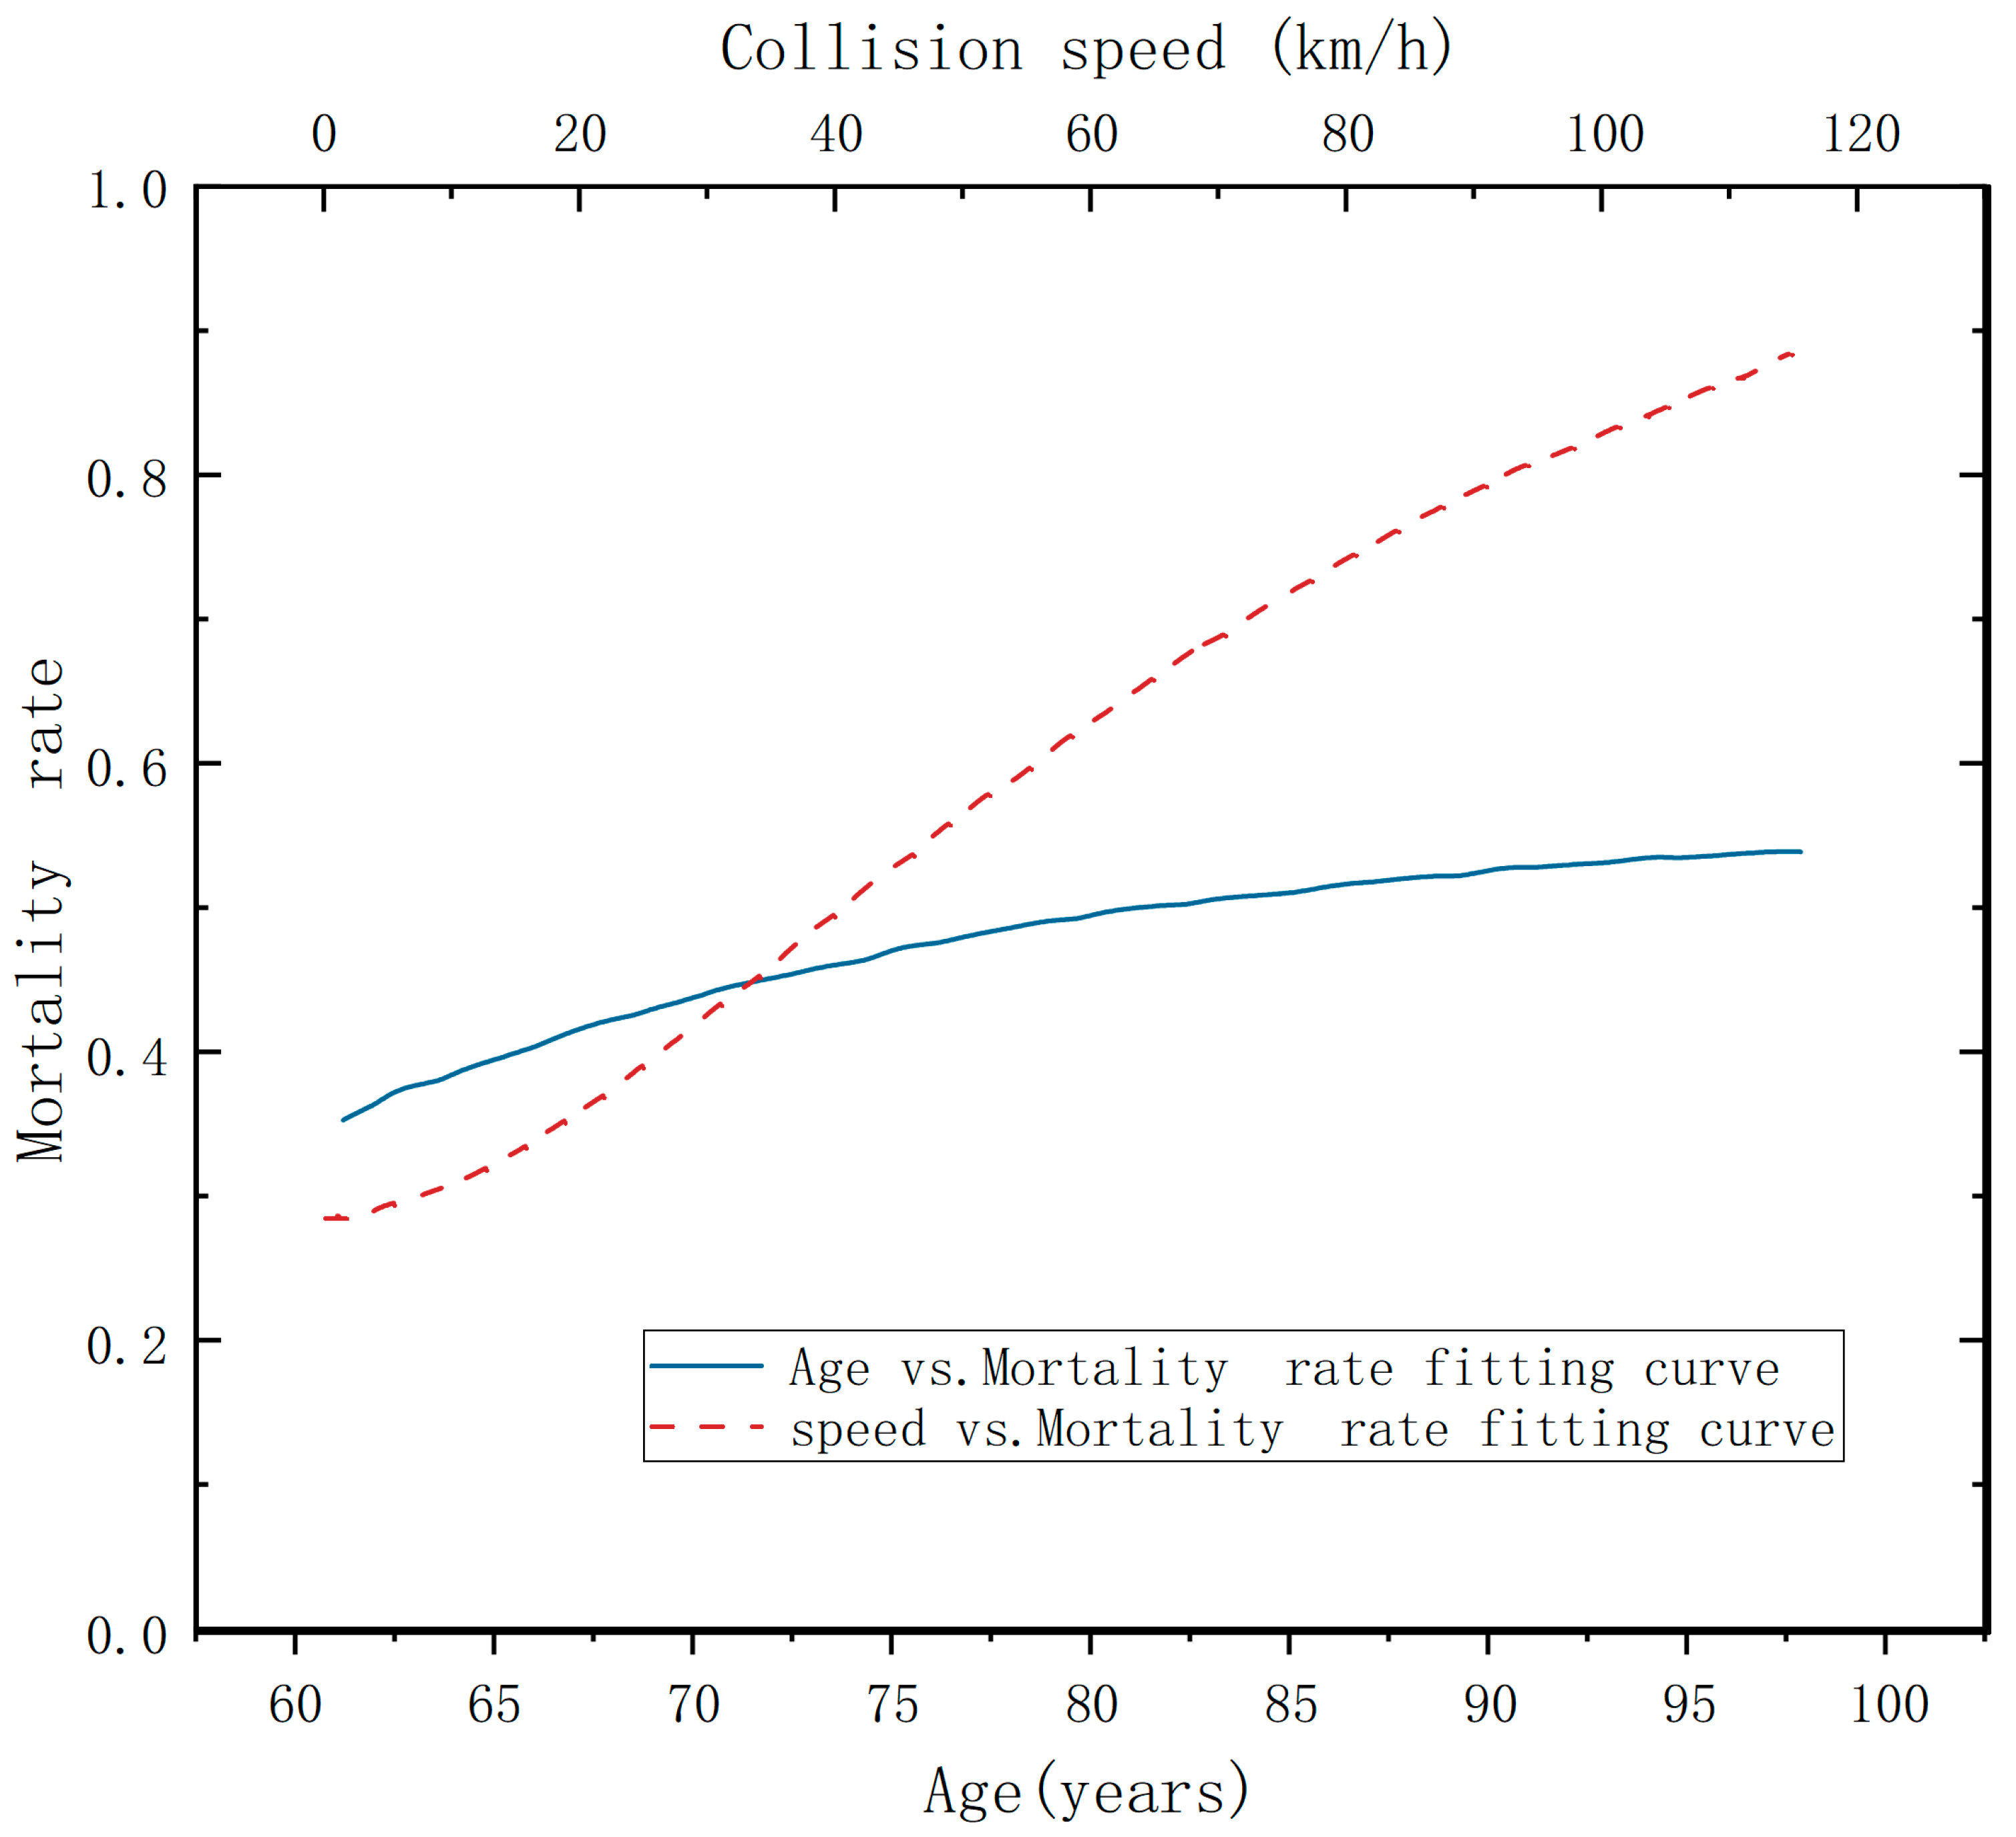
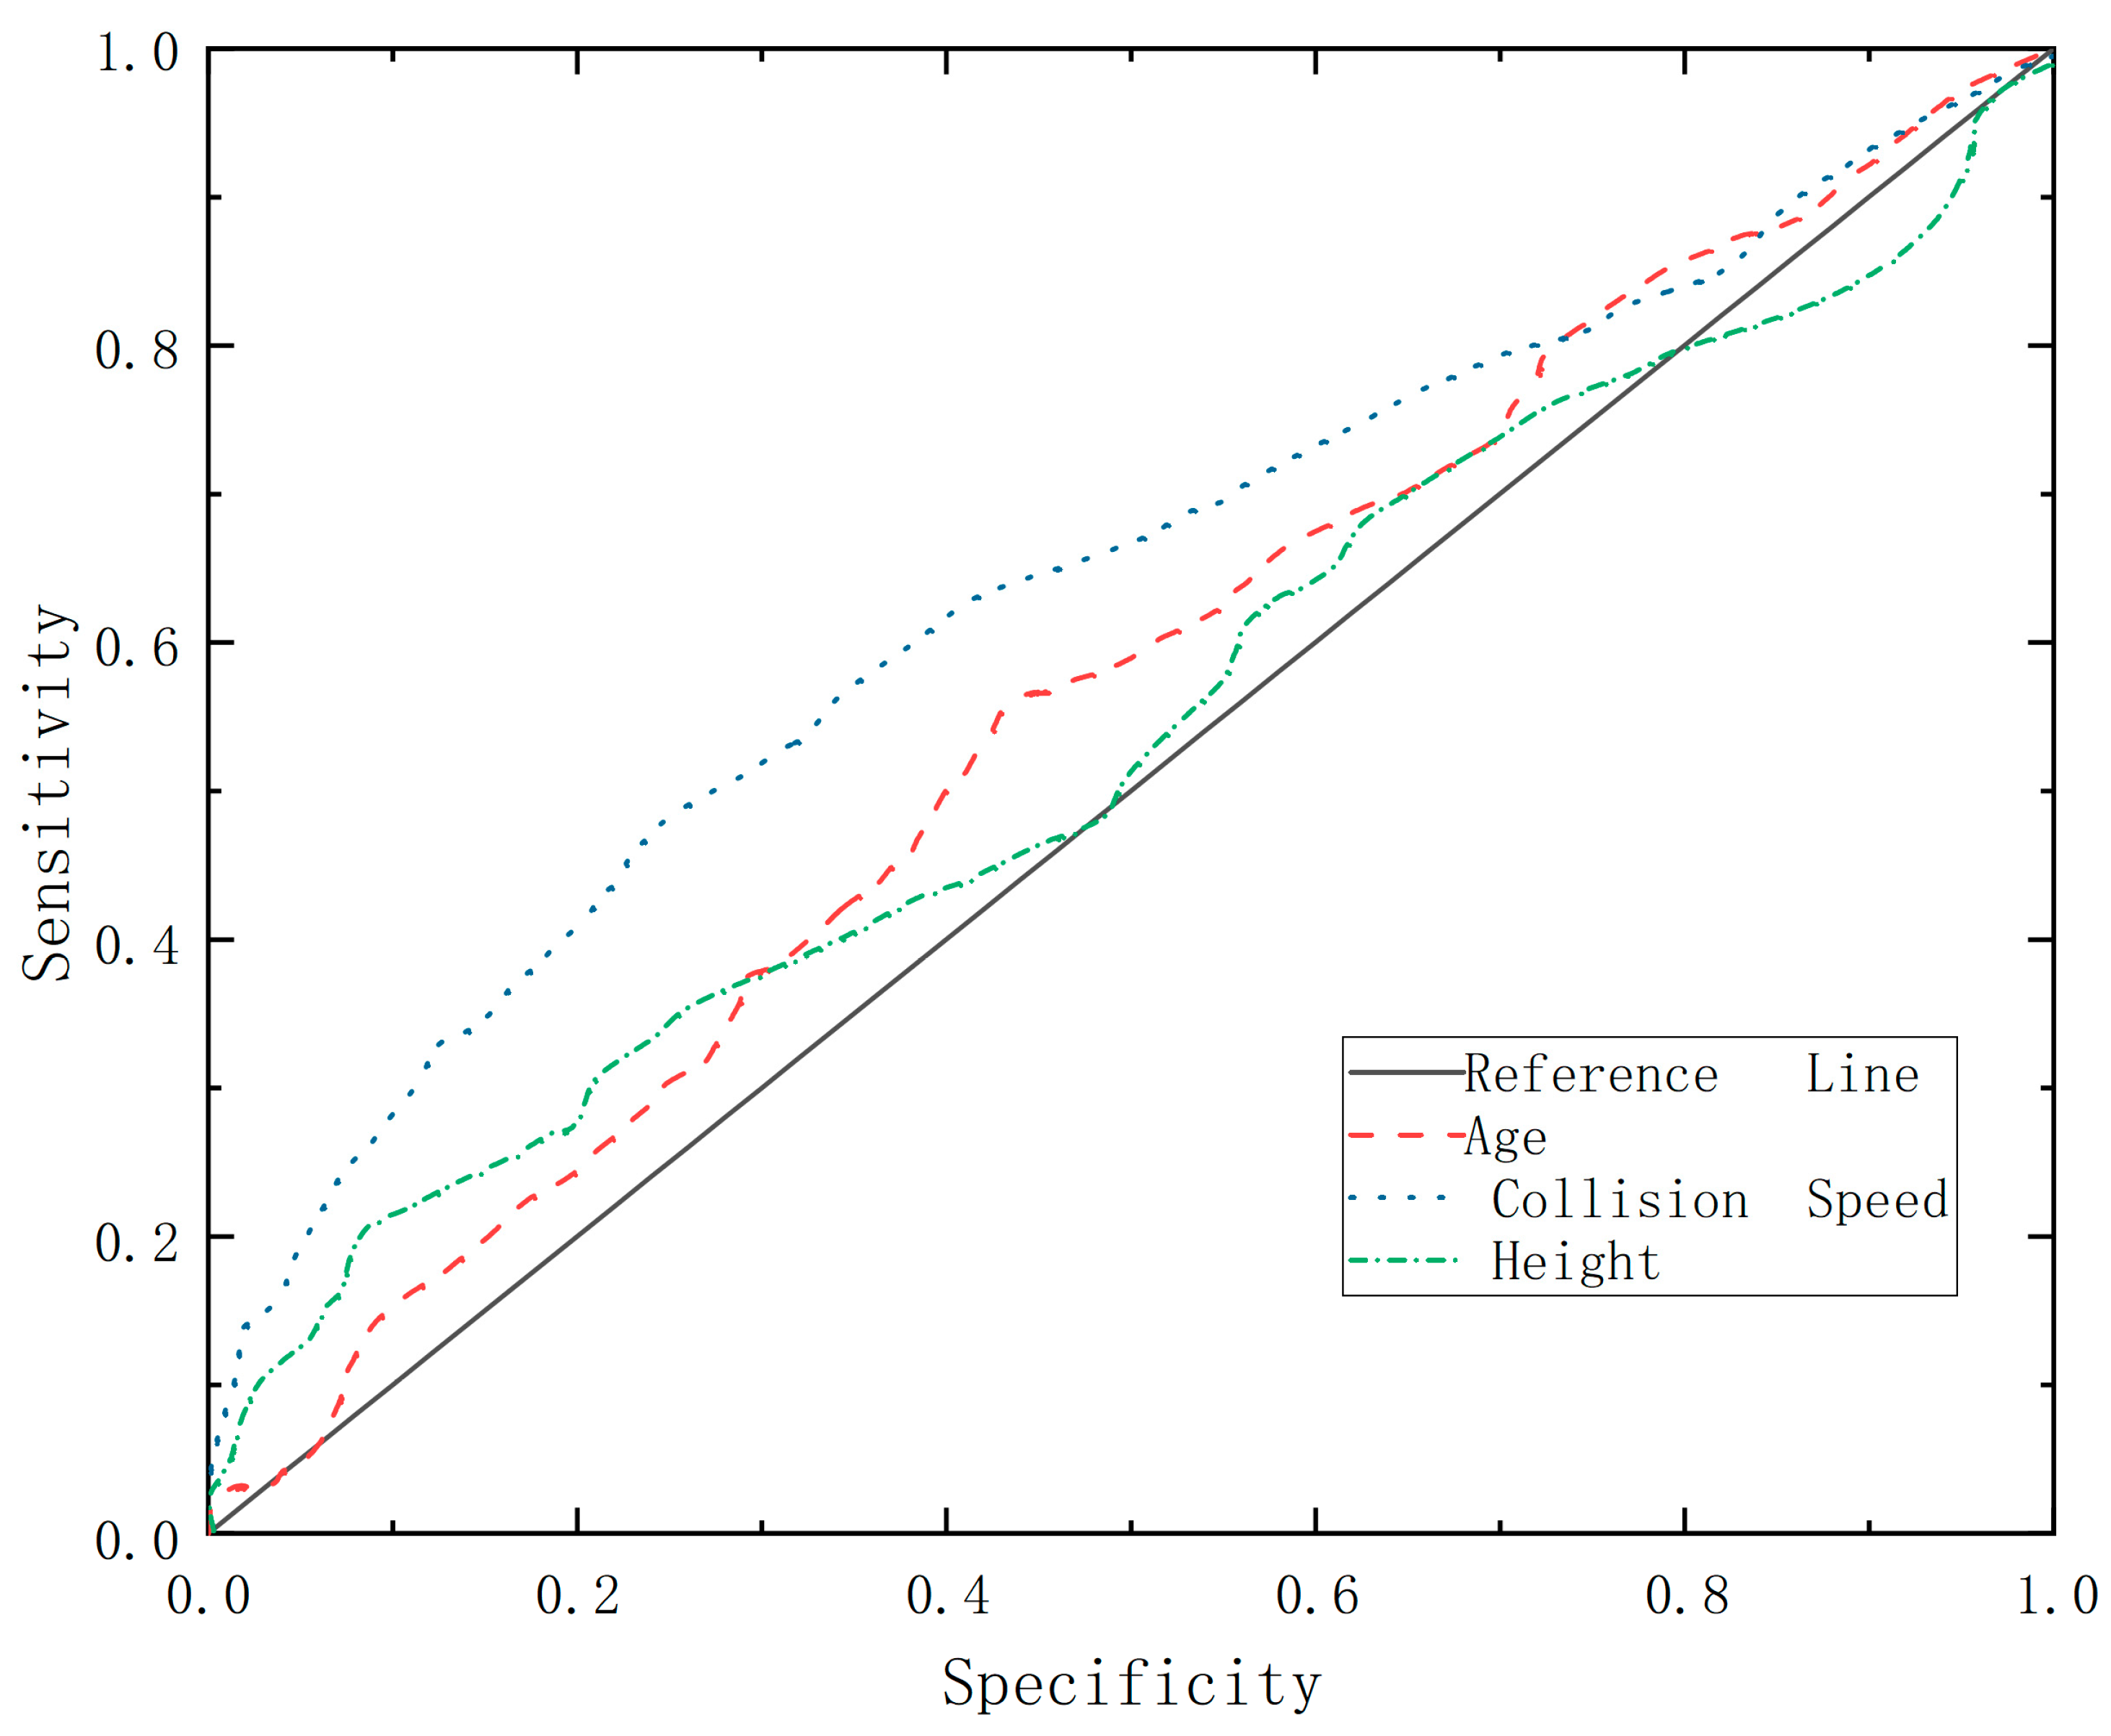
The Impact of Age and Collision Speed on Elderly Pedestrian Mortality Rates
The age of elderly pedestrians and the collision speed in traffic accidents are key factors influencing their mortality rate. For elderly pedestrians aged 60 and above, the mortality risk increases by 3.7% for each additional year. As people age, the decline in physical resilience and recovery capacity increases the mortality rate in elderly individuals. Furthermore, for each unit increase in collision speed (km/h), the mortality rate rises by 2.4%, indicating that higher speed increases the collision energy and impact force, resulting in more severe injuries. This finding is crucial for understanding the risks that elderly pedestrians face in traffic accidents and offers key data to support the development of more effective traffic safety measures. By lowering driving speeds and implementing targeted safety measures for elderly pedestrians, such as safe crossing facilities and speed limits, the mortality rate in accidents can be effectively reduced.
(2)
The Impact of Accident Time and Location on Elderly Pedestrian Safety
The time and location of an accident significantly affect the safety of elderly pedestrians. Specifically, accidents occurring at night, in suburban areas, or in villages result in higher mortality rates for elderly pedestrians. This may be attributed to insufficient lighting, unclear traffic signs, and inadequate traffic management in these areas. Poor visibility and changing traffic flow at night, combined with poor road conditions and mixed pedestrian/vehicle traffic in suburban areas and villages, further elevate the risk of accidents. Therefore, traffic safety measures targeting these specific areas and time periods are crucial to improving the safety of elderly pedestrians. For instance, improving nighttime lighting, adding reflective and speed limit signs, enhancing nighttime traffic enforcement, and ensuring the effectiveness and comprehensiveness of traffic management, all contribute to reducing accident rates in high-risk time periods and locations.
(3)
Recommendations for Policy and Future Research Based on Study Results
The findings of this study provide scientific evidence for the formulation of traffic safety policies, emphasizing the importance of addressing the specific needs and risks of elderly pedestrians in policy development. This includes implementing targeted protection measures, improving road design, and enhancing nighttime lighting and traffic signal systems. However, the data in this study originate from China and are influenced by the country’s unique cultural, social, and regulatory environment, which may impose certain limitations on the findings. Nevertheless, existing studies have shown that the key factors influencing the severity of injuries in collisions involving elderly individuals and vehicles are primarily related to vehicle and human attributes, with minimal correlation with geographic factors [40]. Additionally, the analytical methods employed in this study (association rule mining and logistic regression models) exhibit strong generalizability and can be repeatedly applied to datasets from other geographic regions. Future research should incorporate multi-regional and diversified datasets to validate the conclusions of this study, thereby further extending the applicability of the findings.

Author Contributions

Conceptualization, T.F.; formal analysis, T.F.; funding acquisition, F.X.; investigation, Z.Z.; methodology, T.F. and F.X.; writing—original draft, T.F.; writing—review and editing, F.X. and Z.Z. All authors have read and agreed to the published version of the manuscript.

Funding

This research was funded by the National Natural Science Foundation of China, grant number 52475277 and the APC was funded by Fengxiang Xu.

Institutional Review Board Statement

Ethical review and approval were waived for this study due to its use of anonymized secondary data that does not involve sensitive personal information or proprietary commercial interests, poses no harm to humans, and does not involve direct experiments or interventions on humans or animals.

Informed Consent Statement

Not applicable.

Data Availability Statement

The data presented in this study are available on request from the corresponding author due to the fact that the data are sourced from the Vehicle Evidence Identification Center at Chang’an University and involve personal privacy, making them unsuitable for public disclosure.

Acknowledgments

We would like to express our sincere gratitude to the School of Automotive Engineering at Wuhan University of Technology and Chang’an University for providing the data and hardware support that made this research possible.

Conflicts of Interest

The authors declare no conflicts of interest.

References

  1. Jayawardhana, T.; Jayathilaka, R.; Anuththara, S.; Nimnadi, T.; Karadanaarachchi, R.; Galappaththi, K. Exploring the Dynamics of the Elderly Population and Economic Growth: A Comparative Analysis Across Continents. Soc. Indic. Res. 2024, 173, 543–568. [Google Scholar] [CrossRef]
  2. Maltese, M.R.; Eran, A.; Gazit, B.; Safir, O. Performance of a novel head neck support system in nearside and farside impacts. Traffic Inj. Prev. 2022, 23, S233–S235. [Google Scholar] [CrossRef]
  3. Phillips, J.; Walford, N.; Hockey, A.; Foreman, N.; Lewis, M. Older people and outdoor environments: Pedestrian anxieties and barriers in the use of familiar and unfamiliar spaces. Geoforum 2013, 47, 113–124. [Google Scholar] [CrossRef]
  4. Wilmut, K.; Purcell, C. Why are older adults more at risk as pedestrians? A systematic review. Hum. Factors 2022, 64, 1269–1291. [Google Scholar] [CrossRef]
  5. Zhou, G.; Zhao, W.Z.; Li, Q.Q.; Shen, W.Q.; Wang, C.Y. Multi-objective robust design optimization of a novel NPR energy absorption structure for vehicles front ends to enhance pedestrian lower leg protection. Struct. Multidiscip. Optim. 2017, 56, 1215–1224. [Google Scholar] [CrossRef]
  6. Shi, X.; Xiao, S.; Qie, Y. Analysis of chest injury characteristics in frontal vehicle collision under three typical overlaps. Proc. Inst. Mech. Eng. Part D-J. Automob. Eng. 2021, 235, 580–588. [Google Scholar] [CrossRef]
  7. Siu, B.W. Assessment of physical environment factors for mobility of older adults: A case study in Hong Kong. Res. Transp. Bus. Manag. 2019, 30, 100370. [Google Scholar] [CrossRef]
  8. Rashid, M.M.; Farzaneh, F.; Seyedi, M.; Jung, S. Evaluation of risk injury in pedestrians’ head and chest region during collision with an autonomous bus. Int. J. Crashworthiness 2024, 29, 367–377. [Google Scholar] [CrossRef]
  9. Rella Riccardi, M.; Mauriello, F.; Scarano, A.; Montella, A. Analysis of contributory factors of fatal pedestrian crashes by mixed logit model and association rules. Int. J. Inj. Control Saf. Promot. 2023, 30, 195–209. [Google Scholar] [CrossRef]
  10. Hafeez, F.; Sheikh, U.U.; Al-Shammari, S.; Hamid, M.; Khakwani, A.B.K.; Arfeen, Z.A. Comparative analysis of influencing factors on pedestrian road accidents. Bull. Electr. Eng. Inform. 2023, 12, 257–267. [Google Scholar] [CrossRef]
  11. Schuurman, N.; Cinnamon, J.; Crooks, V.A.; Hameed, S.M. Pedestrian injury and the built environment: An environmental scan of hotspots. BMC Public Health 2009, 9, 233. [Google Scholar] [CrossRef] [PubMed]
  12. Roberts, I.; Norton, R.; Jackson, R.; Dunn, R.; Hassall, I. Effect of environmental factors on risk of injury of child pedestrians by motor vehicles: A case-control study. BMJ 1995, 310, 91–94. [Google Scholar] [CrossRef]
  13. Sadeghi, P.; Goli, A. Investigating the impact of pavement condition and weather characteristics on road accidents. Int. J. Crashworthiness 2024, 29, 973–989. [Google Scholar] [CrossRef]
  14. Zeng, H.; Fontaine, M.D.; Smith, B.L. Estimation of the safety effect of pavement condition on rural, two-lane highways. Transp. Res. Rec. 2014, 2435, 45–52. [Google Scholar] [CrossRef]
  15. Wang, Y.; Zhang, W. Analysis of roadway and environmental factors affecting traffic crash severities. Transp. Res. Procedia 2017, 25, 2119–2125. [Google Scholar] [CrossRef]
  16. Yan, X.; He, J.; Zhang, C.; Wang, C.; Ye, Y.; Qin, P. Temporal instability and age differences of determinants affecting injury severities in nighttime crashes. Anal. Methods Accid. Res. 2023, 38, 100268. [Google Scholar] [CrossRef]
  17. Alogaili, A.; Mannering, F. Differences between day and night pedestrian-injury severities: Accounting for temporal and unobserved effects in prediction. Anal. Methods Accid. Res. 2022, 33, 100201. [Google Scholar] [CrossRef]
  18. Kaplan, S.; Guvensan, M.A.; Yavuz, A.G.; Karalurt, Y. Driver behavior analysis for safe driving: A survey. IEEE Trans. Intell. Transp. Syst. 2015, 16, 3017–3032. [Google Scholar] [CrossRef]
  19. Fugiglando, U.; Massaro, E.; Santi, P.; Milardo, S.; Abida, K.; Stahlmann, R.; Netter, F.; Ratti, C. Driving behavior analysis through CAN bus data in an uncontrolled environment. IEEE Trans. Intell. Transp. Syst. 2018, 20, 737–748. [Google Scholar] [CrossRef]
  20. Han, Y.; Yang, J.; Mizuno, K.; Matsui, Y. Effects of vehicle impact velocity, vehicle front-end shapes on pedestrian injury risk. Traffic Inj. Prev. 2012, 13, 507–518. [Google Scholar] [CrossRef]
  21. Liu, X.; Yang, J. Effects of vehicle impact velocity and front-end structure on dynamic responses of child pedestrians. Traffic Inj. Prev. 2003, 4, 337–344. [Google Scholar] [CrossRef] [PubMed]
  22. Mo, F.; Arnoux, P.J.; Avalle, M.; Scattina, A.; Semino, E.; Masson, C. Incidences of various passenger vehicle front-end designs on pedestrian lower limb injuries. Int. J. Crashworthiness 2015, 20, 337–347. [Google Scholar] [CrossRef]
  23. Singh, H.; Kathuria, A. Analyzing driver behavior under naturalistic driving conditions: A review. Accid. Anal. Prev. 2021, 150, 105908. [Google Scholar] [CrossRef]
  24. Yang, J.; Du, F.; Qu, W.; Gong, Z.; Sun, X. Effects of personality on risky driving behavior and accident involvement for Chinese drivers. Traffic Inj. Prev. 2013, 14, 565–571. [Google Scholar] [CrossRef] [PubMed]
  25. Cicek, E.; Akin, M.; Uysal, F.; Topcu Aytas, R. Comparison of traffic accident injury severity prediction models with explainable machine learning. Transp. Lett. 2023, 15, 1043–1054. [Google Scholar] [CrossRef]
  26. Zhu, L.; Zhang, Z.; Song, D.; Chen, B. Analysis of traffic accident causes based on data augmentation and ensemble learning with high-dimensional small-sample data. Expert Syst. Appl. 2024, 237, 121782. [Google Scholar] [CrossRef]
  27. Etehad, H.; Yousefzadeh-Chabok, S.; Davoudi-Kiakalaye, A.; Moghadam, D.A.; Hemati, H.; Mohtasham-Amiri, Z. Impact of road traffic accidents on the elderly. Arch. Gerontol. Geriatr. 2015, 61, 489–493. [Google Scholar] [CrossRef]
  28. Aloulou, F. The application of discrete choice models in transport. In Statistics-Growing Data Sets and Growing Demand for Statistics; InTech Open: London, UK, 2018; pp. 85–104. [Google Scholar]
  29. Abellán, J.; López, G.; De OñA, J. Analysis of traffic accident severity using decision rules via decision trees. Expert Syst. Appl. 2013, 40, 6047–6054. [Google Scholar] [CrossRef]
  30. Hongguo, X.; Huiyong, Z.; Fang, Z. Bayesian network-based road traffic accident causality analysis. In Proceedings of the 2010 WASE International Conference on Information Engineering, Beidai, China, 14–15 August 2010; pp. 413–417. [Google Scholar]
  31. Xu, C.; Bao, J.; Wang, C.; Liu, P. Association rule analysis of factors contributing to extraordinarily severe traffic crashes in China. J. Saf. Res. 2018, 67, 65–75. [Google Scholar] [CrossRef]
  32. Gutierrez-Osorio, C.; Pedraza, C. Modern data sources and techniques for analysis and forecast of road accidents: A review. J. Traffic Transp. Eng. Engl. Ed. 2020, 7, 432–446. [Google Scholar] [CrossRef]
  33. John, M.; Shaiba, H. Apriori-based algorithm for dubai road accident analysis. Procedia Comput. Sci. 2019, 163, 218–227. [Google Scholar] [CrossRef]
  34. Yang, Y.; Tian, N.; Wang, Y.; Yuan, Z. A parallel FP-growth mining algorithm with load balancing constraints for traffic crash data. Int. J. Comput. Commun. Control 2022, 17, 4806. [Google Scholar] [CrossRef]
  35. Xi, J.; Gao, Z.; Niu, S.; Ding, T.; Ning, G. A hybrid algorithm of traffic accident data mining on cause analysis. Math. Probl. Eng. 2013, 2013, 302627. [Google Scholar] [CrossRef]
  36. Hasheminejad, S.H.-A.; Zahedi, M.; Hasheminejad, S.M.H. A hybrid clustering and classification approach for predicting crash injury severity on rural roads. Int. J. Inj. Control Saf. Promot. 2018, 25, 85–101. [Google Scholar] [CrossRef] [PubMed]
  37. Cai, Q. Cause analysis of traffic accidents on urban roads based on an improved association rule mining algorithm. IEEE Access 2020, 8, 75607–75615. [Google Scholar] [CrossRef]
  38. Koramati, S.; Majumdar, B.B.; Pani, A.; Sahu, P.K. A registry-based investigation of road traffic fatality risk factors using police data: A case study of Hyderabad, India. Saf. Sci. 2022, 153, 105805. [Google Scholar] [CrossRef]
  39. Bao, C.; Tang, Y.; Yang, B.; Wang, X.; Chen, J.; Xiong, H.; Lou, B.; Zhou, S.; Cao, X.; Gu, G. Mining analysis of traffic accident features based on Fp-growth algorithm and Apriori algorithm. In Proceedings of the Fourth International Conference on Computer Vision, Application, and Algorithm (CVAA 2024), Chengdu, China, 30 August–1 September 2024; pp. 859–863. [Google Scholar]
  40. Zhang, J.; Lindsay, J.; Clarke, K.; Robbins, G.; Mao, Y. Factors affecting the severity of motor vehicle traffic crashes involving elderly drivers in Ontario. Accid. Anal. Prev. 2000, 32, 117–125. [Google Scholar] [CrossRef] [PubMed]
Figure 1. Single factor ROC curve.
Applsci 15 01170 g001
Figure 2. Velocity, age, and mortality fitting curve.
Applsci 15 01170 g002
Table 1. Accident variable data.
Variable SourceCode/VariableCoding and Variable Classification
Pedestrian FactorsA: AgeA1: 60–64 years; A2: 65–69 years; A3: 70–74 years; A4: 75–79 years; A5: 80 years and older
B: HeightB1: less than 150 cm; B2: 150–154 cm; B3: 155–159 cm; B4: 160–164 cm; B5: 165–169 cm; B6: 170–174 cm; B7: 175 cm and above
C: WeightC1: less than 40 kg; C2: 41–45 kg; C3: 46–50 kg; C4: 51–55 kg; C5: 56–60 kg; C6: 61–65 kg; C7: 66–70 kg; C8: 71–80 kg
D: Clothing ThicknessD1: spring/autumn clothing; D2: summer clothing; D3: winter clothing
E: GenderE1: male; E2: female
F: AwarenessF1: aware after collision; F2: aware before collision; F3: unknown awareness (including fatalities)
Pedestrian InjuriesG: Injury SeverityG1: minor injuries; G2: serious injuries; G3: fatalities
Vehicle FactorsH: Initial SpeedH1: initial speed ≤ 10 km/h; H2: initial speed ≤ 20 km/h; H3: initial speed ≤ 30 km/h; H4: initial speed ≤ 40 km/h; H5: initial speed ≤ 50 km/h; H6: initial speed ≤ 60 km/h; H7: initial speed ≤ 70 km/h; H8: initial speed ≤ 80 km/h; H9: initial speed > 80 km/h
I: Collision SpeedI1: collision speed ≤ 10 km/h; I2: collision speed ≤ 20 km/h; I3: collision speed ≤ 30 km/h; I4: collision speed ≤ 40 km/h; I5: collision speed ≤ 50 km/h; I6: collision speed ≤ 60 km/h; I7: collision speed ≤ 70 km/h; I8: collision speed ≤ 80 km/h; I9: collision speed > 80 km/h
J: Collision DirectionJ1: front collision; J2: side collision; J3: rear collision
K: AwarenessK1: aware before collision; K2: aware after collision; K3: unaware
L: Driving ExperienceL1: within 6 years; L2: 6–15 years; L3: more than 15 years; L4: no driver’s license
Road FactorsM: PrecipitationM1: with precipitation; M2: without precipitation
N: Fog ConditionN1: no fog; N2: fog
O: Traffic Flow on Accident SectionO1: very high traffic flow; O2: high traffic flow; O3: moderate traffic flow; O4: low traffic flow
P: Traffic ControlP1: no traffic control; P2: traffic signals; P3: pedestrian crossing; P4: other warning signs
Q: Speed LimitQ1: 10 km/h; Q2: 20 km/h; Q3: 30 km/h; Q4: 40 km/h; Q5: 50 km/h; Q6: 60 km/h; Q7: 70 km/h; Q8: 80 km/h; Q9: 90 km/h; Q10: 100 km/h; Q11: 110 km/h; Q12: 120 km/h
R: Speed BumpR1: with speed bump; R2: without speed bump
S: Speed Limit SignS1: no speed limit sign; S2: within 25 m; S3: within 50 m; S4: within 200 m; S5: within 1000 m; S6: beyond 1000 m
T: Legal Travel RestrictionT1: no restriction; T2: legal travel restriction; T3: prohibited for motor vehicles
U: Road LevelU1: highway; U2: national road; U3: ordinary road; U4: provincial road; U5: county road; U6: township road
V: Road TypeV1: straight road; V2: curved road; V3: intersection; V4: crossroad; V5: ramp entrance
Environmental FactorsW: Time PeriodW1: daytime; W2: nighttime; W3: dusk
X: Day of the WeekX1: Monday; X2: Tuesday; X3: Wednesday; X4: Thursday; X5: Friday; X6: Saturday; X7: Sunday
Y: Accident LocationY1: urban area; Y2: village; Y3: industrial area; Y4: suburban area; Y5: other
Z: Accident TypeZ1: reversing collision; Z2: crossing the road without visibility obstruction; Z3: crossing the road with visibility obstruction; Z4: crossing at an intersection without visibility obstruction; Z5: walking along the roadside; Z6: crossing after the intersection without visibility obstruction; Z7: crossing before the intersection without visibility obstruction
AB: Streetlight TypeAB1: rows of streetlights; AB2: few streetlights; AB3: no streetlights
AC: Streetlight StatusAC1: streetlights on; AC2: streetlights off; AC3: no streetlights
Explanation of Selected Variables: D1: suitable for lightweight or moderately thick clothing in temperatures ranging from 10 °C to 20 °C; D2: suitable for lightweight clothing in temperatures above 20 °C; D3: suitable for heavy clothing in temperatures below 10 °C. F1: the pedestrian did not notice the vehicle prior to the collision; F2: the pedestrian noticed the vehicle before the collision but failed to avoid it in time. G1: injuries classified as “minor” include superficial wounds, contusions, abrasions, or single fractures that do not significantly impair function or require extended hospitalization. G2: injuries classified as “serious” include conditions such as multiple fractures, internal organ damage, or other injuries that result in significant functional impairment or require prolonged medical intervention. W1: defined as the time period from 06:00 to 16:59. W2: defined as the time period from 19:00 to 05:59 the following day. W3: defined as the time period from 17:00 to 18:59. AB1: refers to areas with continuous streetlight distribution and good illumination. AB2: refers to areas with sparse streetlight distribution and discontinuous lighting, resulting in low visibility.
Table 2. Influence factors and injury association rules.
Variable TypeAntecedentConsequentSupportConfidenceLift
Pedestrian and
Vehicle Factors
I6, J1, H6G30.052110.420454.26461
I6, J1G30.074650.602271.49515
H9, K2, J1, I9G30.050630.514294.57071
K2, J1, F3, E1G30.059150.494121.76293
L1, F3, E1G30.071830.614462.19229
B1, E2G30.063380.671641.37822
D3G30.111270.493751.01319
E1G30.280280.523681.07461
D1, J1, E2G30.084510.521741.07062
E1, F1, B5G10.056340.512821.79361
K1, J1, F1G10.063380.343511.20144
Road FactorsS1, U3, R1, M2, O3G30.052260.627121.29070
Q6, T1, V3, S1, M2G30.052260.616671.26919
Q6, T1, V3, R2, M2G30.059320.608701.25278
N1, T1, V3, R2, M2, O3G30.052260.606561.24838
T1, V3, R2, M2, O3G30.060730.597221.22917
U3, T1, N1, V1, P1, M2G20.057910.325401.43094
U3, T1, N1, V1, P1G20.057910.322831.41967
U3, T1, N1, V1, P1, R2, M2G20.055080.317071.39433
O2, U3, T1, R2, M2G10.050850.391301.36475
S1, O2, N1G10.050850.371131.29440
R2, O2, U3, T1G10.055080.386141.34673
Environmental FactorsW3, AB1G30.052260.804351.65546
W2, Z3G30.056500.689661.41941
W2, Y4G30.053670.678571.39659
W2, AB3G30.063560.652171.34226
Y2, W2G30.052260.649121.33599
W1, AC2, AB1G20.115820.289751.27419
Z2, AB1G20.050850.288001.26648
Y1, W1, AC2, AB1G20.079100.284261.25006
Z4G10.064970.597402.08355
W1, Z4G10.053670.567161.97809
W1, AC2, Z4G10.052260.587302.04832
Table 3. Regression result.
Influencing FactorsStandard Errorp-ValueExp(B)Log Likelihood
B: Height0.0110.0630.98−374.408
A: Age0.0130.0041.037−376.682
L: Driver experience 0.133
L2: 6–15 years0.730.0770.275−374.705
L3: More than 15 years0.730.0740.271−376.542
K: Awareness0.1840.9141.02−372.574
I: Collision speed0.0050.001.024−385.484
V: Road type 0.89
V3: Intersection0.590.6311.328−370.656
V4: Crossroad0.60.7581.203−371.264
V5: Ramp entrance0.6190.5641.43−373.574
W: Time of day 0.00
W1: Daytime0.3350.000.245−386.412
W3: Dusk0.3480.0140.425−383.576
Y: Accident location 0.005
Y2 and Y4: Village and suburban0.2670.6471.13−372.641
Disclaimer/Publisher’s Note: The statements, opinions and data contained in all publications are solely those of the individual author(s) and contributor(s) and not of MDPI and/or the editor(s). MDPI and/or the editor(s) disclaim responsibility for any injury to people or property resulting from any ideas, methods, instructions or products referred to in the content.

