Article

Healthier Indoor Environments for Vulnerable Occupants: Analysis of Light, Air Quality, and Airborne Disease Risk

by
Guillermo García-Martín
1,
Fátima Romero-Lara
1,
Miguel Ángel Campano
2,
Ignacio Acosta
2,* and
Pedro Bustamante
2
1
Escuela Técnica Superior de Arquitectura, Universidad de Sevilla, 41012 Seville, Spain
2
Instituto Universitario de Arquitectura y Ciencias de la Construcción, Universidad de Sevilla, 41012 Seville, Spain
*
Author to whom correspondence should be addressed.
Appl. Sci. 2025, 15(3), 1217; https://doi.org/10.3390/app15031217
Submission received: 31 December 2024 / Revised: 16 January 2025 / Accepted: 21 January 2025 / Published: 24 January 2025
(This article belongs to the Special Issue Air Quality in Indoor Environments, 3rd Edition)

Abstract

:
This study evaluates indoor environmental quality (IEQ) in childcare facilities, focusing on air quality and lighting—key factors affecting children’s health and development. The analysis examines a nursery in Seville, Spain, where continuous monitoring revealed challenges in maintaining suitable indoor conditions. Carbon dioxide (CO2) levels often surpassed Spanish standards (770 ppm) and stricter thresholds (550 ppm) for sensitive groups, peaking at nearly 1900 ppm. These concentrations are linked to possible cognitive impairments and increased airborne pathogen risks, with Attack Rates (ARs) exceeding 70%. Passive ventilation strategies, such as window openings, proved insufficient, emphasizing the need for Controlled Mechanical Ventilation (CMV) systems to ensure consistent air renewal while maintaining thermal comfort. Lighting assessments identified insufficient circadian stimulus during key periods. Excessive lighting during nap times disrupted rest, while morning daylight levels failed to provide adequate circadian stimulation. These findings stress the importance of integrating solar protection and dynamic daylight and electric lighting systems to align with children’s biological rhythms. This research highlights the urgent need for comprehensive IEQ strategies in childcare settings, combining advanced ventilation, hygrothermal management, and circadian-friendly lighting to create safer and healthier environments for young children.

1. Introduction

1.1. State of the Art

Indoor environmental conditions are critical in safeguarding the health and well-being of building occupants, especially in settings designed for vulnerable populations such as childcare facilities. Children, especially those under the age of five, are especially susceptible to environmental stressors due to their still-developing immune and respiratory systems. This vulnerability is compounded by the prolonged hours they usually spend indoors, where poor air quality and inadequate ventilation [1] can significantly heighten the relative risk of airborne pathogen transmission [2,3,4] and increase the time of exposure to indoor pollutants [5,6], exacerbating pre-existing health conditions [7,8].
Ventilation efficiency plays a pivotal role in mitigating these risks, with CO2 concentrations serving as a widely recognized proxy for assessing air exchange rates and pathogen transmission risks [9,10,11,12]. Elevated CO2 levels, often resulting from inadequate ventilation, have been linked to temporary cognitive impairments [13,14] and decision-making performance [15,16], fatigue, and respiratory issues [17]. At excessively high concentrations, symptoms such as headaches, throat irritation [18], and mucous membrane damage can occur [19,20], while even moderate elevations may impair decision-making and focus [16,21]. Research has consistently shown that maintaining CO2 concentrations below 1000 ppm in educational settings is essential to minimize health risks and support cognitive performance [22,23], particularly in young children who spend prolonged hours in these environments [1,24,25].
The role of CO2 in airborne pathogen transmission is another critical aspect of indoor air quality, considering that its concentration itself can also increase viral aerostability [26]. Studies leveraging models such as Wells–Riley and subsequent adaptations [10,27,28,29] have demonstrated that CO2 levels can act as indicators for estimating infection risks in poorly ventilated spaces [30,31] in conjunction with the conditions of air temperature and relative humidity of the space [32,33,34]. This model can estimate the Attack Rate (AR) of a given disease by calculating the minimum number of viral aerosol doses inhaled by individuals in an indoor space [12,35,36]. These methodologies have been applied in educational settings across various age groups, including preschools, to assess and improve ventilation strategies [12,36].
In addition to air quality, lighting conditions significantly influence the physiological and developmental health of young children, particularly through their impact on circadian rhythms [37,38]. Circadian rhythms regulate essential biological processes [39,40] such as sleep–wake cycles [41,42,43] and health [44], hormonal secretion, and cognitive functioning [45,46]. In early childhood, these rhythms are highly malleable, with light exposure acting as a primary synchronizer [38]. Natural daylight, characterized by its dynamic intensity and spectral composition, has been identified as the optimal source for supporting circadian alignment [47]. However, many nurseries face challenges related to insufficient daylight exposure and inappropriate electric lighting, which can disrupt circadian rhythms and negatively affect sleep, cognitive performance, and overall health.
Disruptions to circadian lighting rhythms in young children have been associated with neurological development [39], potentially increasing the risk of brain disorders [48] and the future development of Autism Spectrum Disorder [49,50]. Short-wavelength blue light (~460 nm) has been shown to strongly influence melatonin suppression, making the spectral composition and timing of light exposure critical factors in lighting design for childcare facilities [44,51].
To address these challenges, well-integrated daylighting and electric lighting systems are essential [52,53]. Metrics such as Daylight Autonomy (DA) [54] and Circadian Stimulus Autonomy (CSA) [55,56] have been employed to evaluate lighting adequacy, taking into account architectural factors like spatial layout, window placement, and local climatic conditions. Despite advancements in understanding circadian lighting, gaps remain in translating research into practical nursery applications. While studies have explored circadian lighting in hospitals [55,57], educational facilities [58], and workplaces [59], research focusing specifically on nurseries is comparatively sparse. Future research should focus on the integration of dynamic circadian-friendly lighting systems with architectural design principles [60] to create holistic environments that support both the health and developmental needs of children and the functional requirements of caregivers. By bridging advancements in air-quality monitoring, ventilation strategies, and circadian lighting design, childcare facilities can evolve into environments that not only minimize health risks but actively promote the physical and cognitive development of children. Long-term studies and the refinement of simulation tools will be instrumental in achieving this goal, enabling evidence-based interventions that optimize indoor environmental quality in nurseries.

1.2. Motivations of the Study

This study evaluates indoor environmental conditions in childcare centers, with a focus on air quality and lighting, two essential factors in children’s health and development. Key indoor parameters, including air temperature (Ta), relative humidity (RH), and CO2 levels, are monitored to assess both ventilation efficiency and minimize airborne disease transmission. CO2 is used as a reliable indicator of both ventilation performance and the risk of airborne contagion, supporting the development of targeted ventilation strategies that promote safer and healthier classroom environments. Additionally, the study evaluates the adequacy of existing lighting conditions in supporting children’s circadian rhythms, which are critical for regulating sleep patterns and promoting overall well-being.

2. Materials and Methods
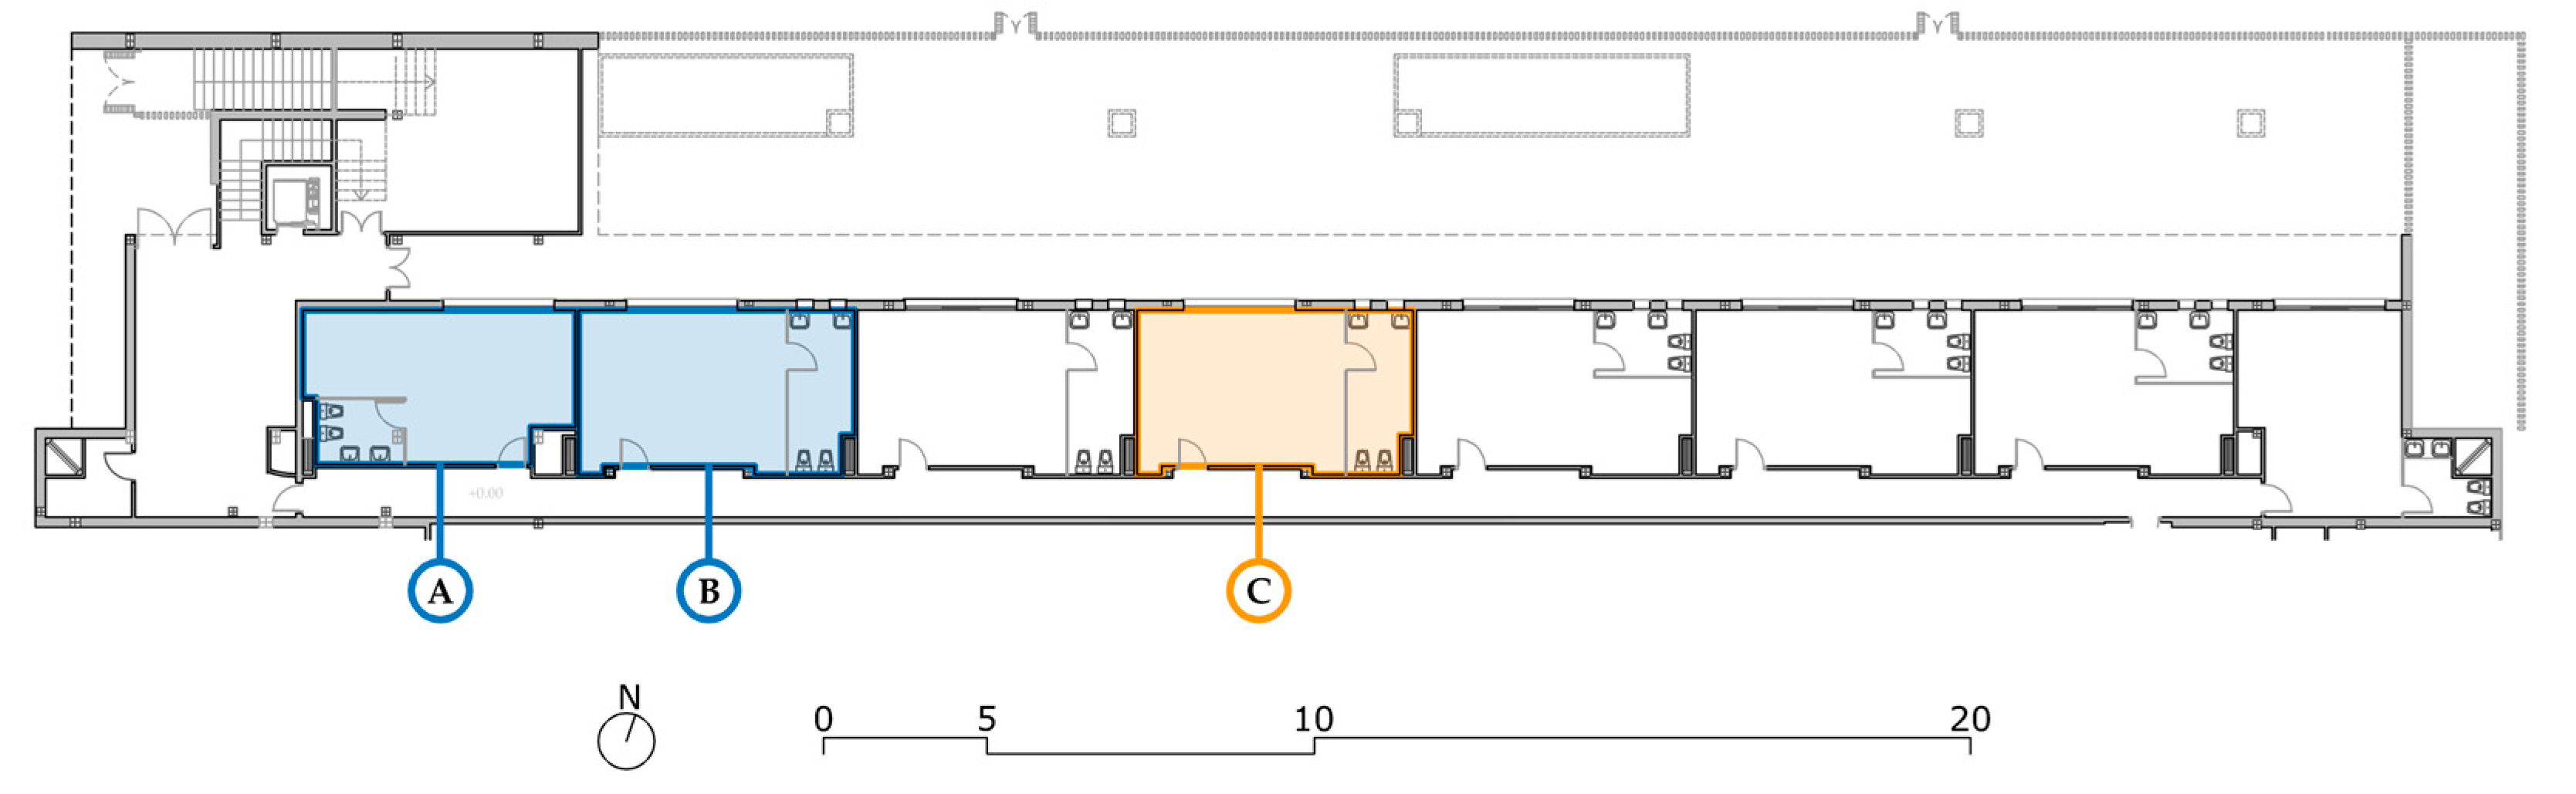
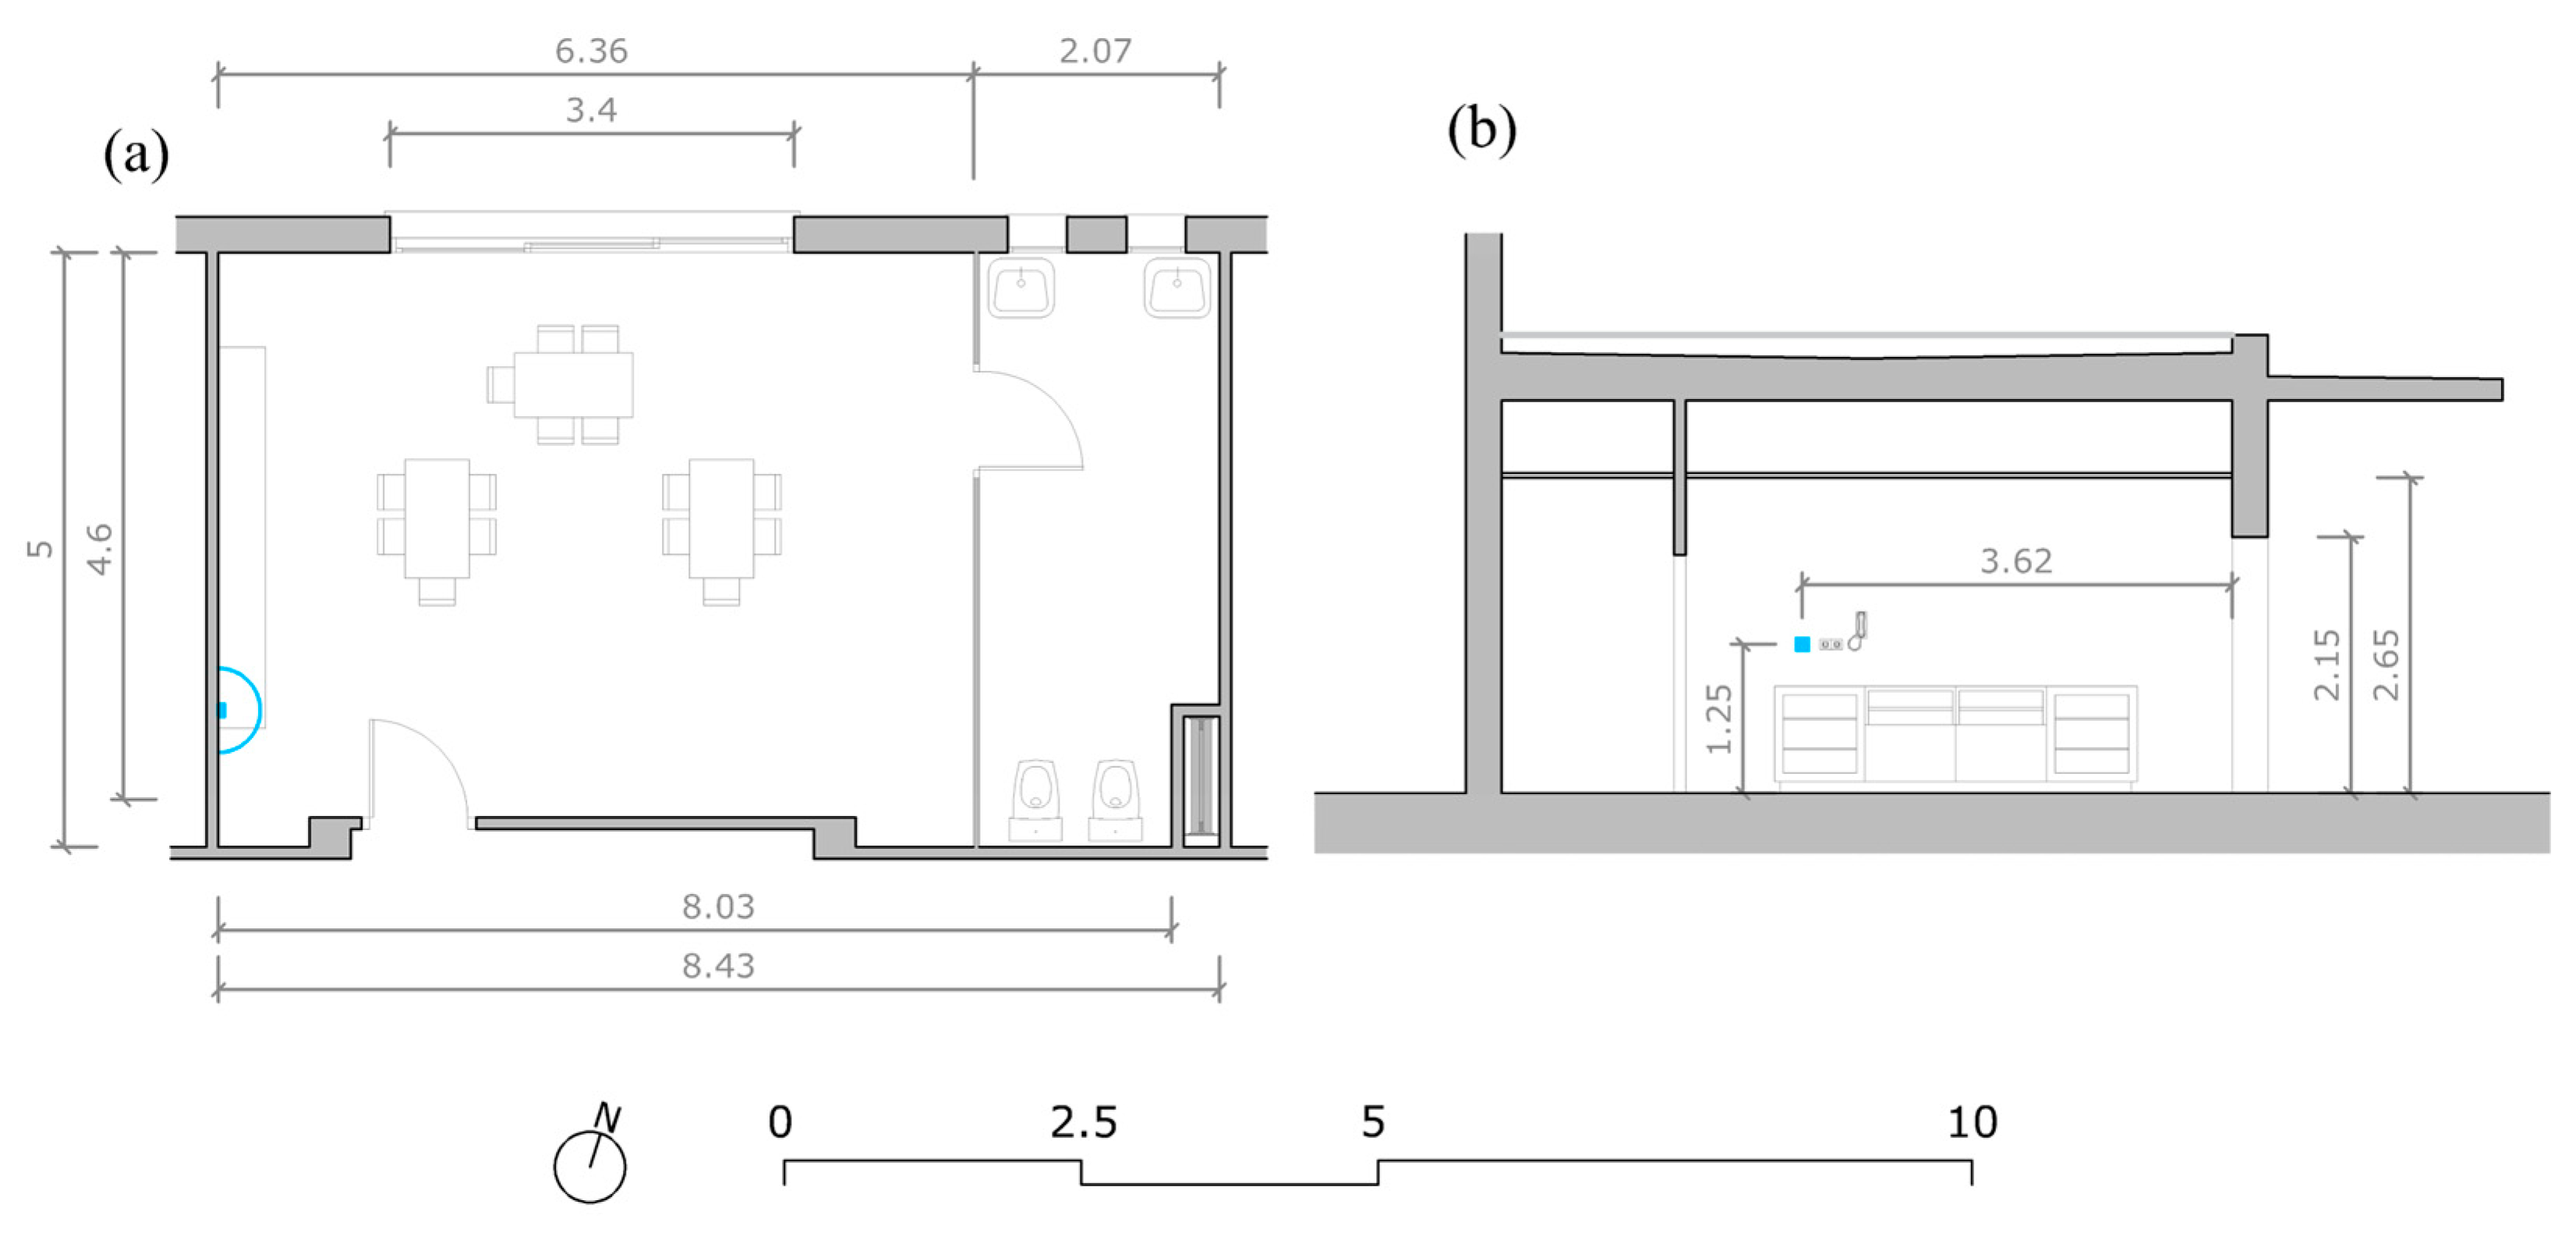
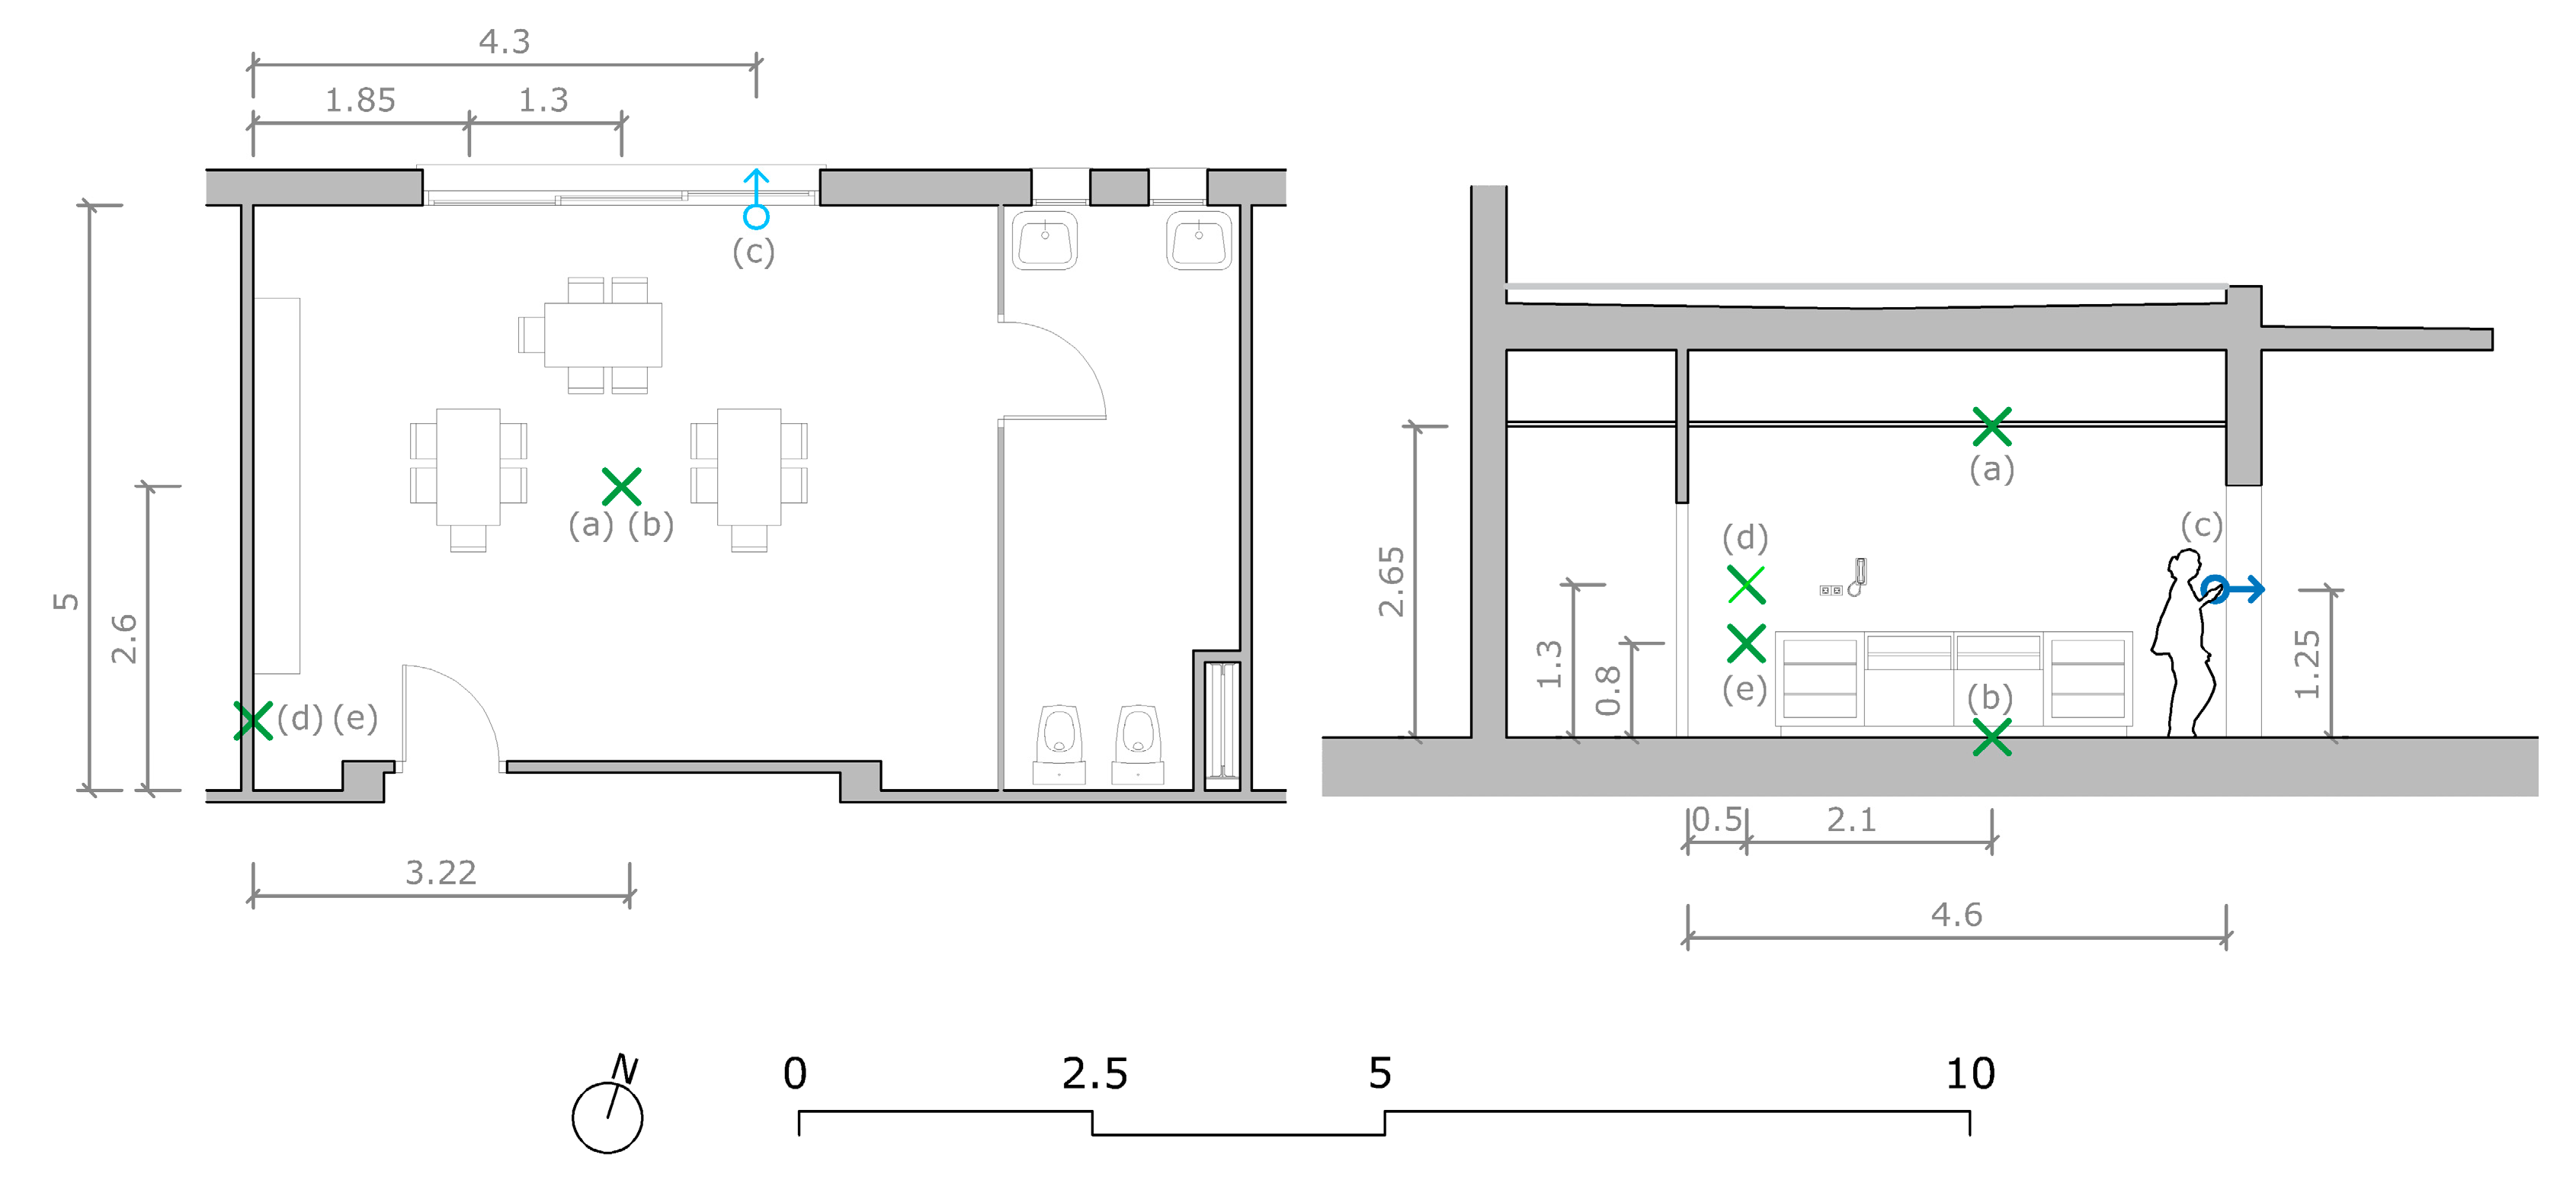
2.1. Case Study

The study was conducted in a childcare center affiliated with the Universidad de Sevilla in Seville, Spain. Constructed in 2013, this facility was selected due to its representative architectural design, compliant with the standards set by the Spanish Technical Building Code (CTE) [61] and typical of similar childcare centers, and its relatively isolated location, which reduces the influence of external urban factors such as heavy traffic. The nursery’s floor plan is shown in Figure 1.
The classrooms (Figure 2) have nearly identical layouts, each measuring 8.43 × 5.00 m—an approximate air volume of 96.2 m3. Each room features a large north-facing window (2.15 × 3.40 m), providing daylight and ventilation. Adjacent to the classrooms, there is a small bathroom cubicle (2.75 × 3.00 m) with two additional windows (0.50 × 0.50 m each). Notably, the facility does not include a solar control system for the windows, which the administration views as beneficial for enabling visual supervision of the playground from within the classrooms.
The building is equipped with a direct expansion “Variable Refrigerant Flow” (VRF) thermal treatment system, featuring ducted indoor units for each classroom located within the bathroom’s false ceiling, which distribute conditioned air through linear grilles. Although the facility was constructed in compliance with the standards outlined in the Spanish Regulation on Thermal Installations in Buildings (RITE) [62,63,64], it lacks a Controlled Mechanical Ventilation (CMV) system.

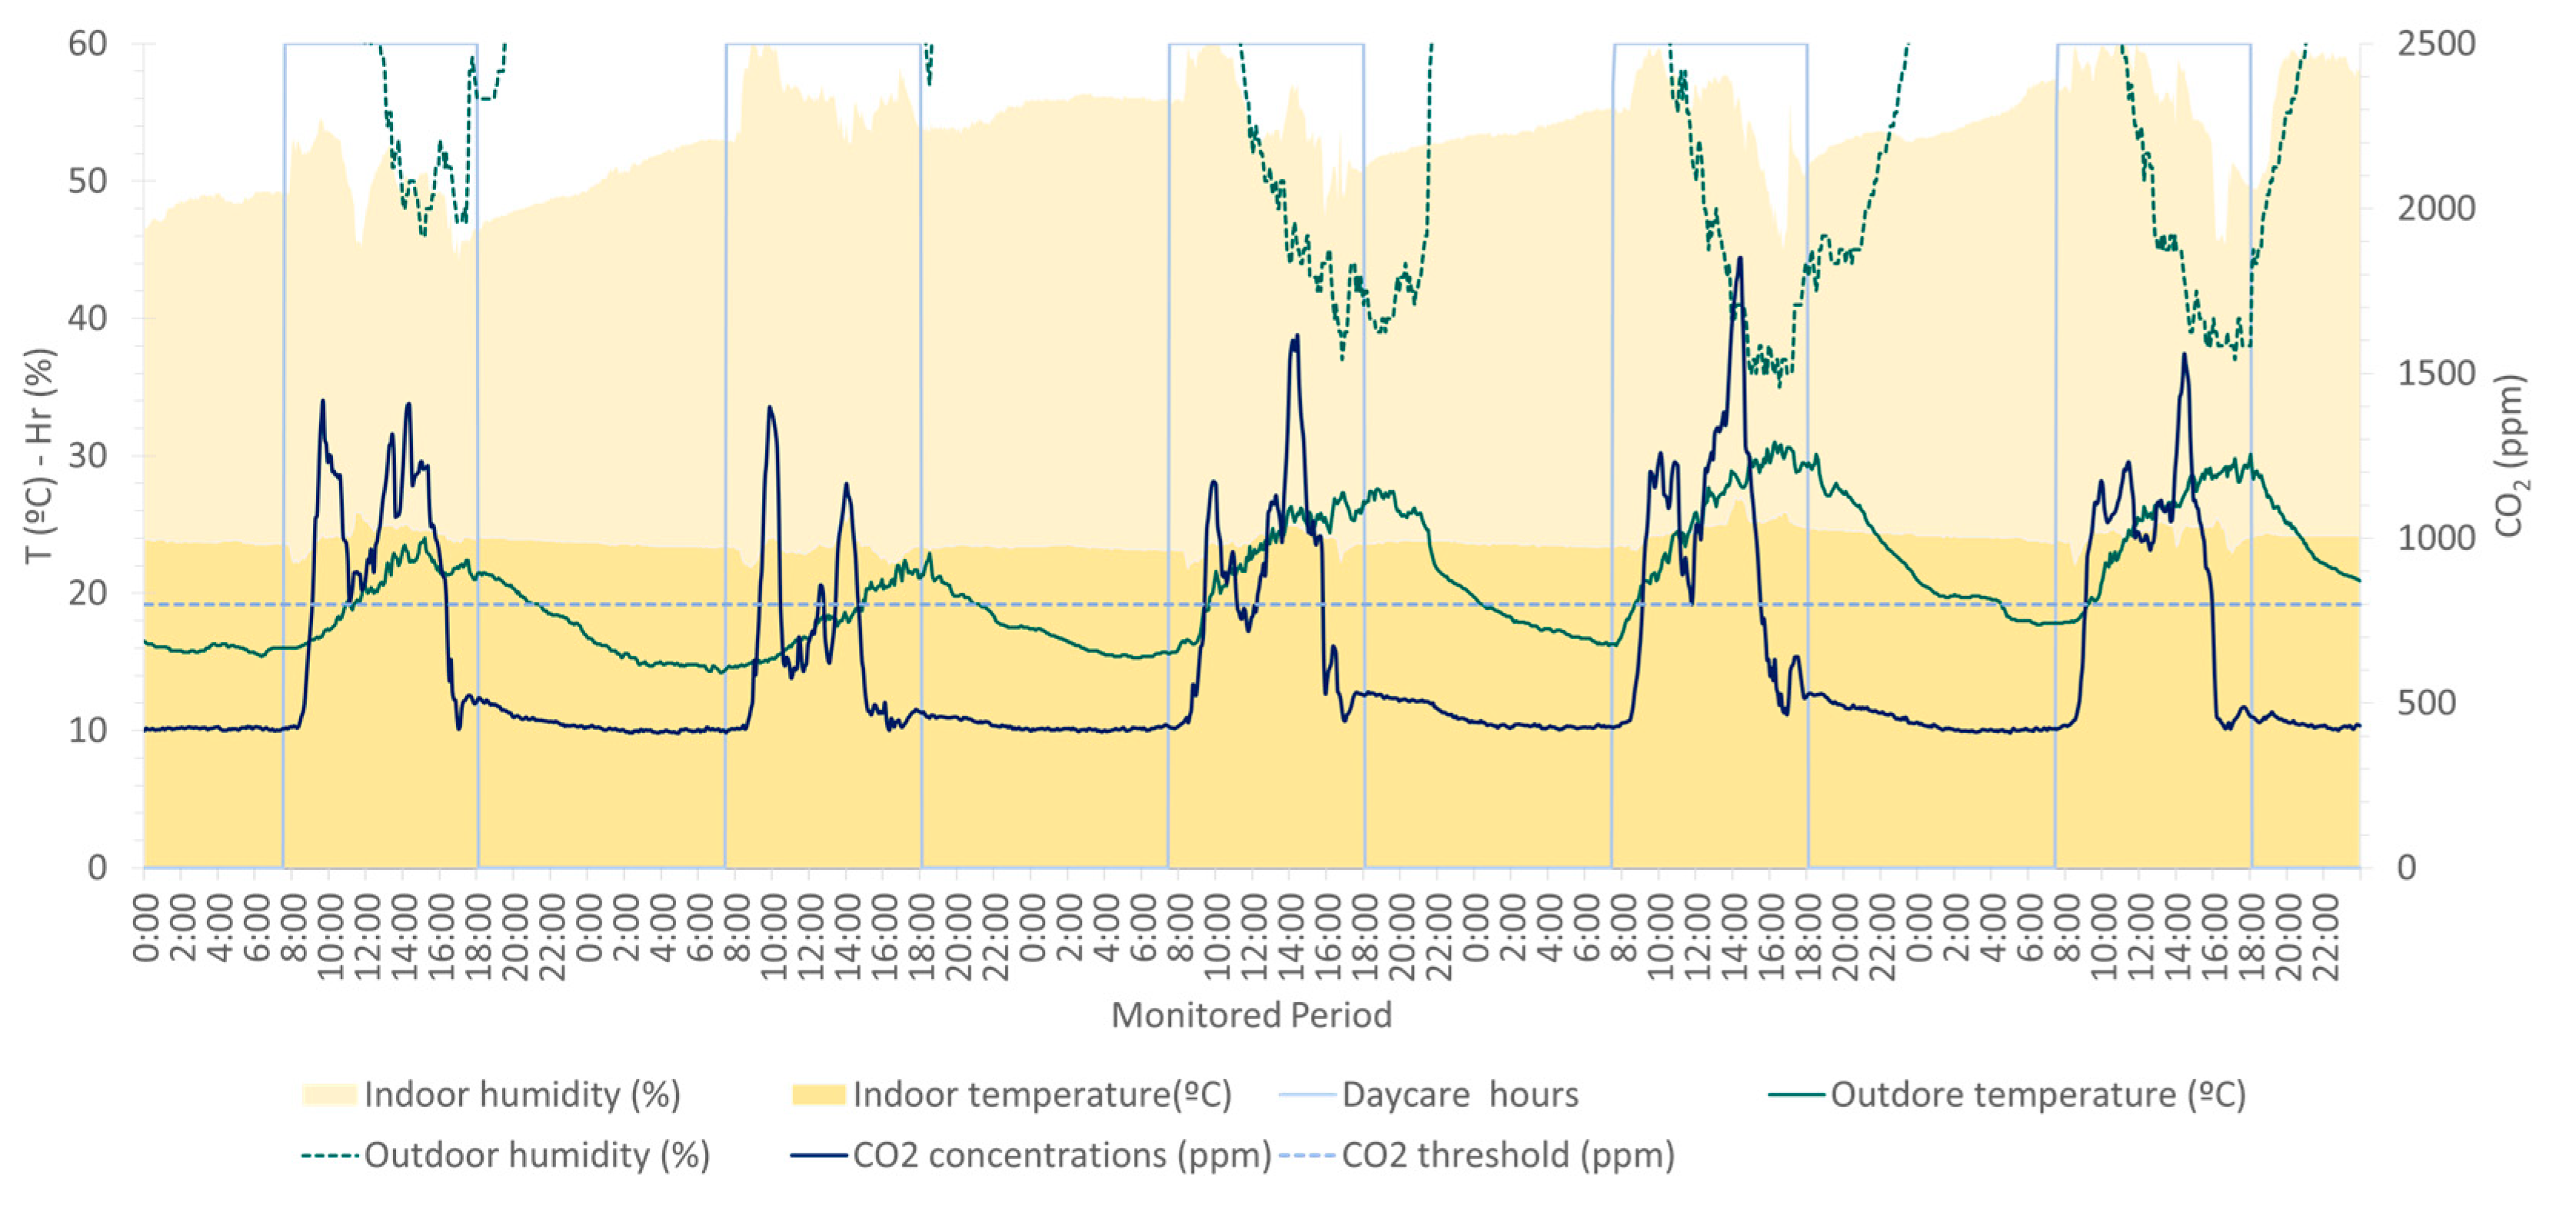
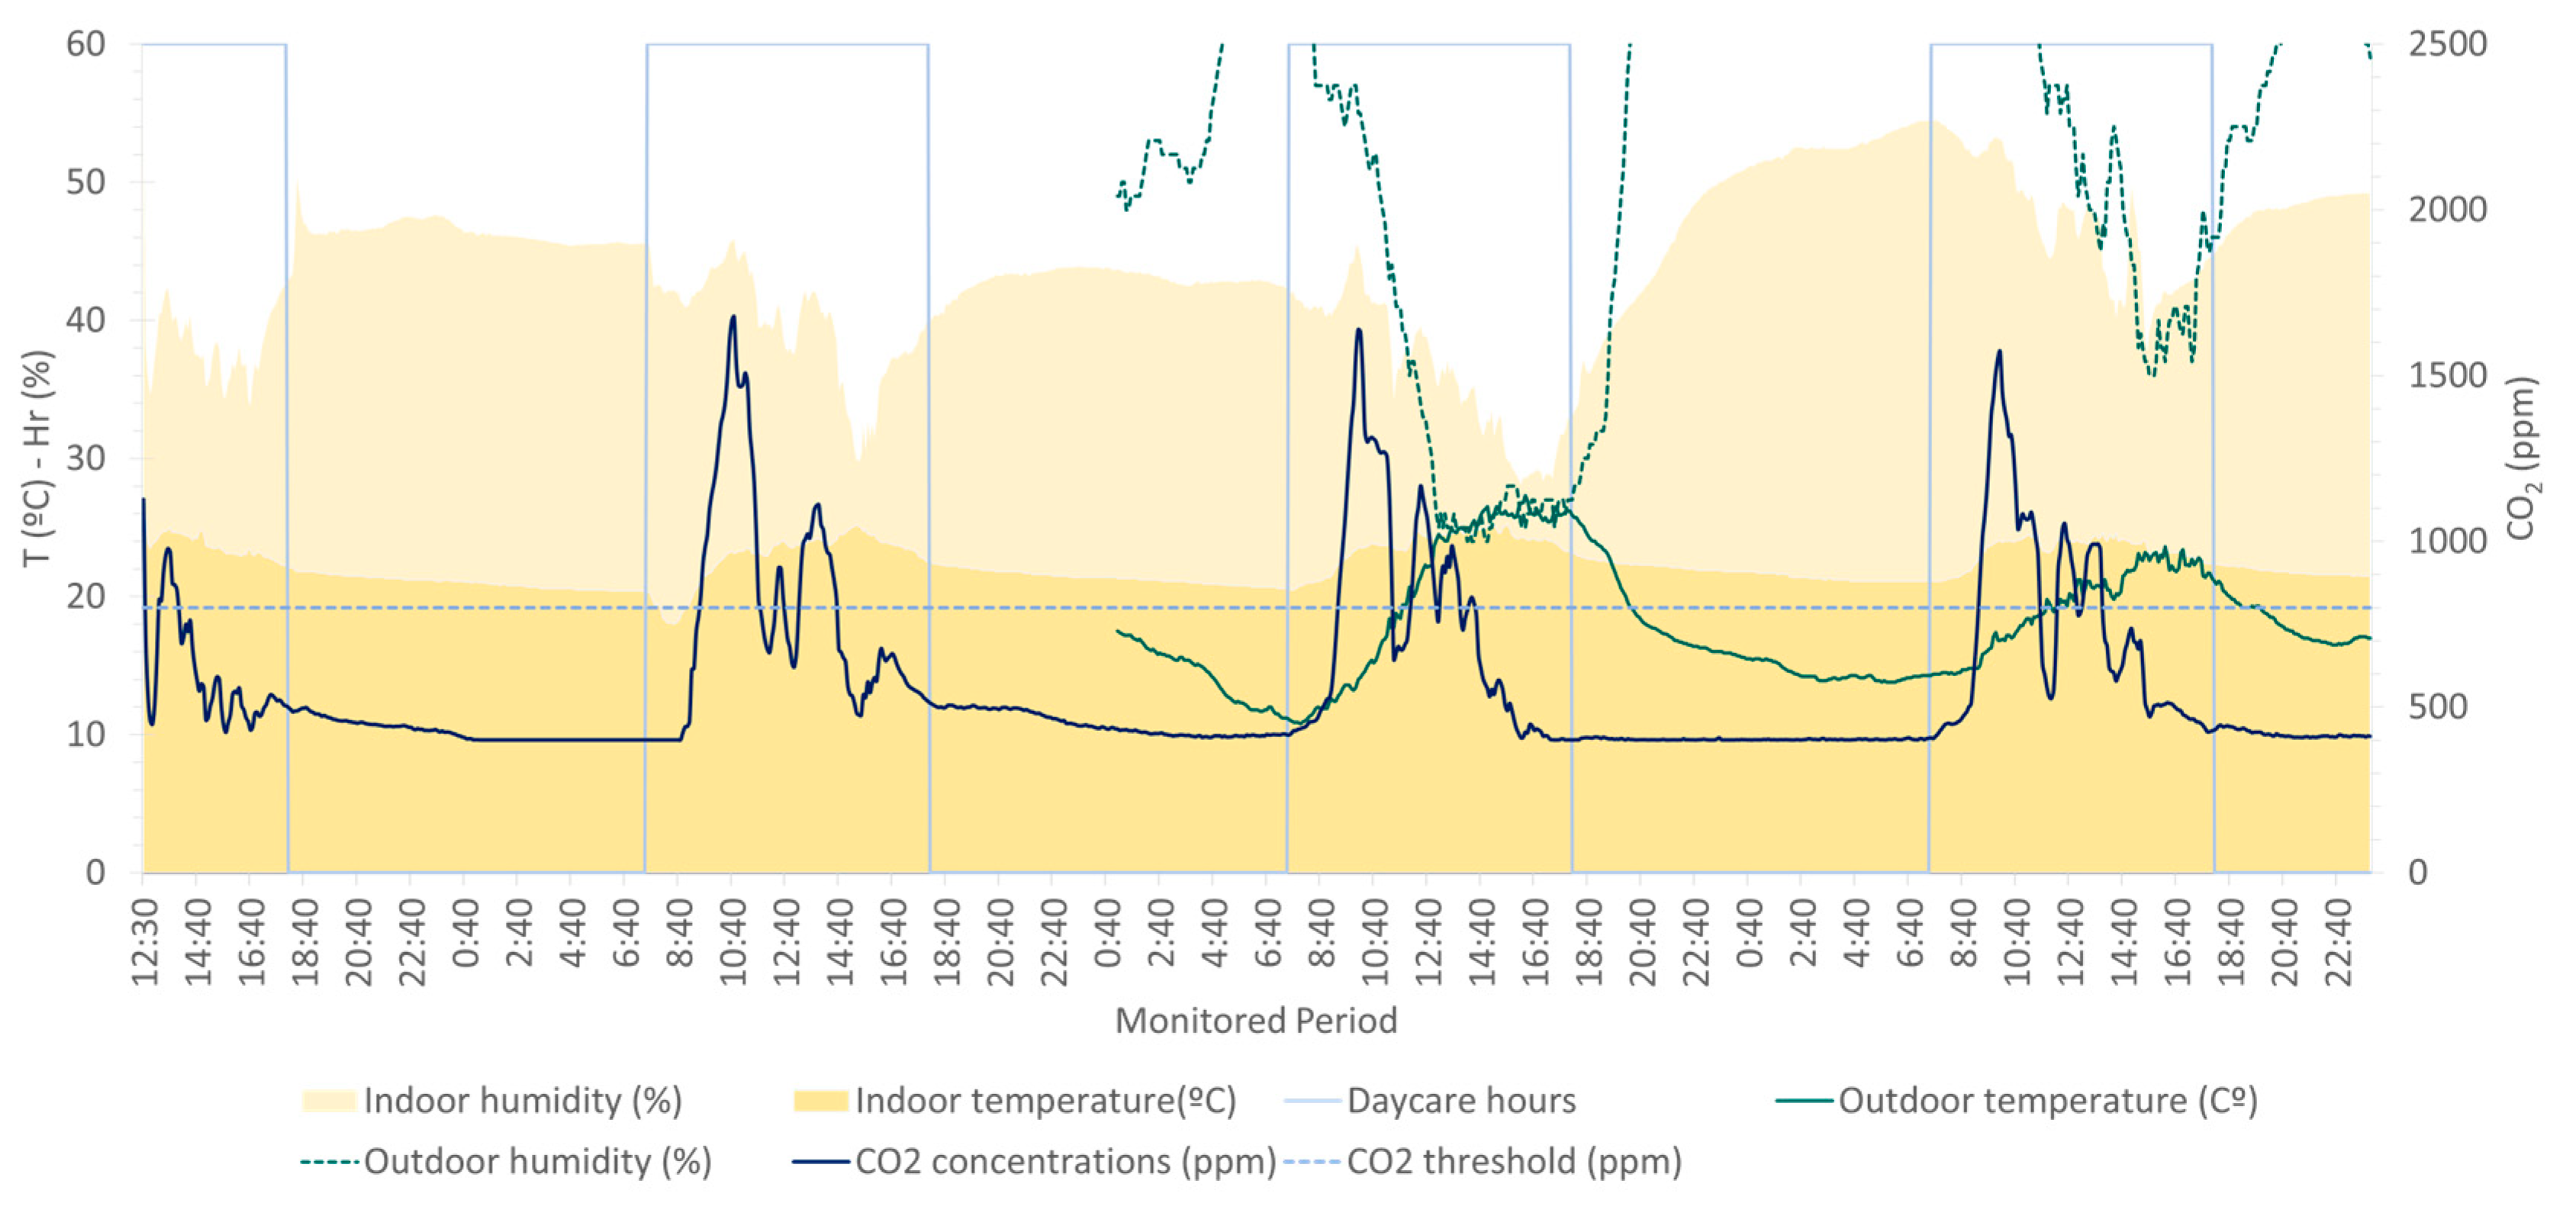
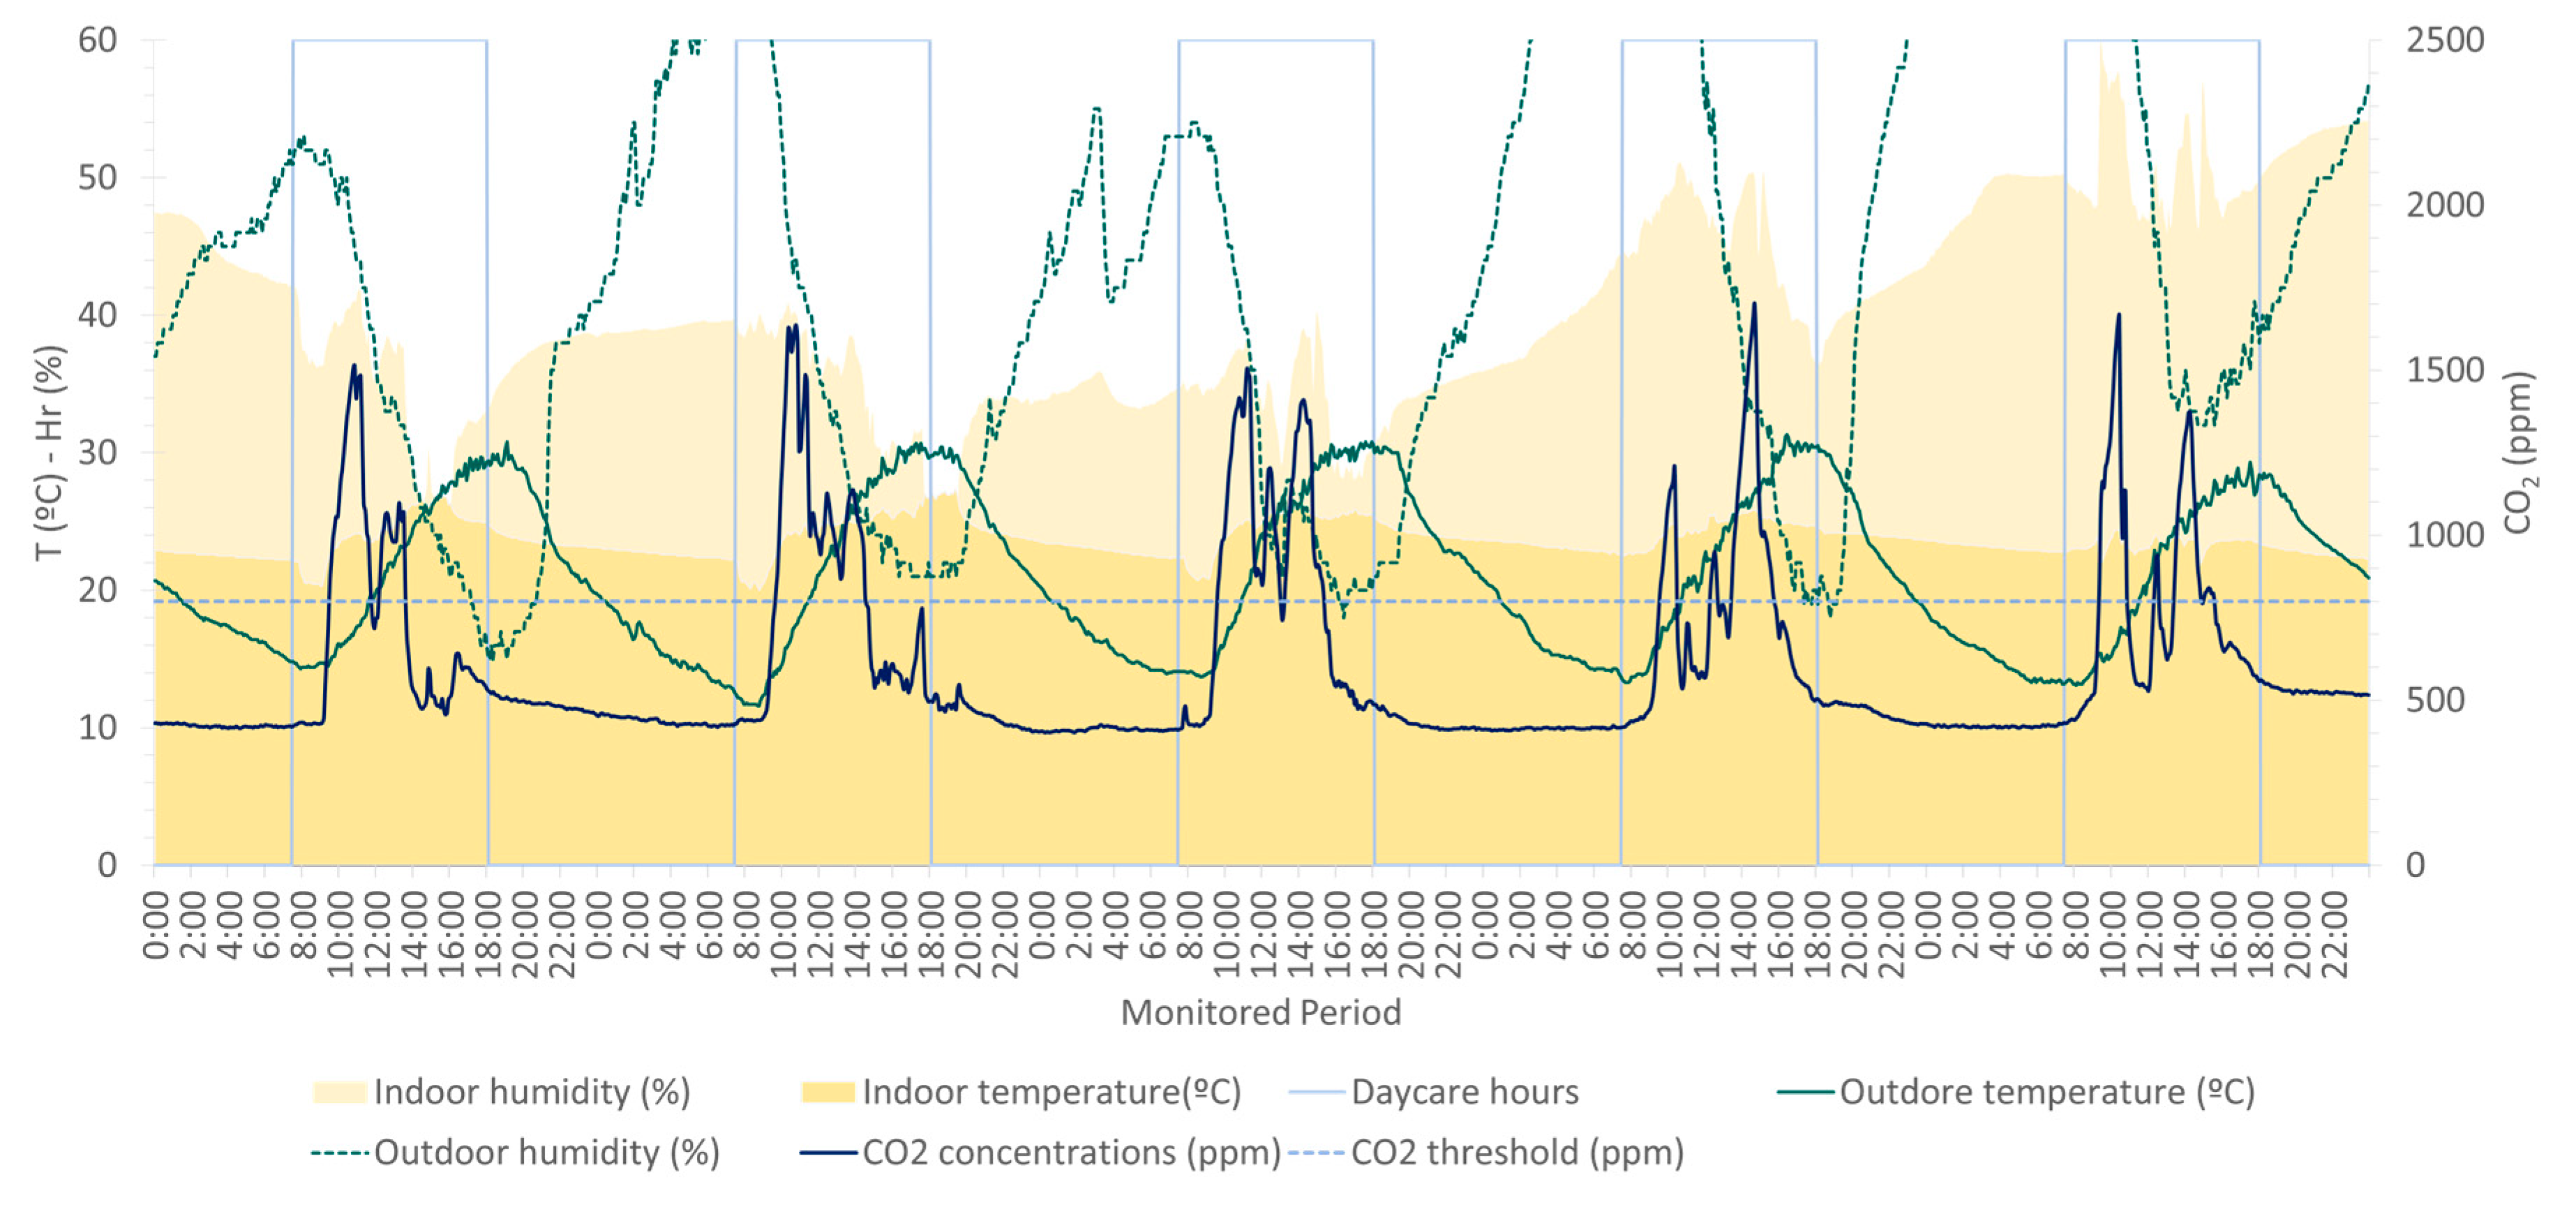
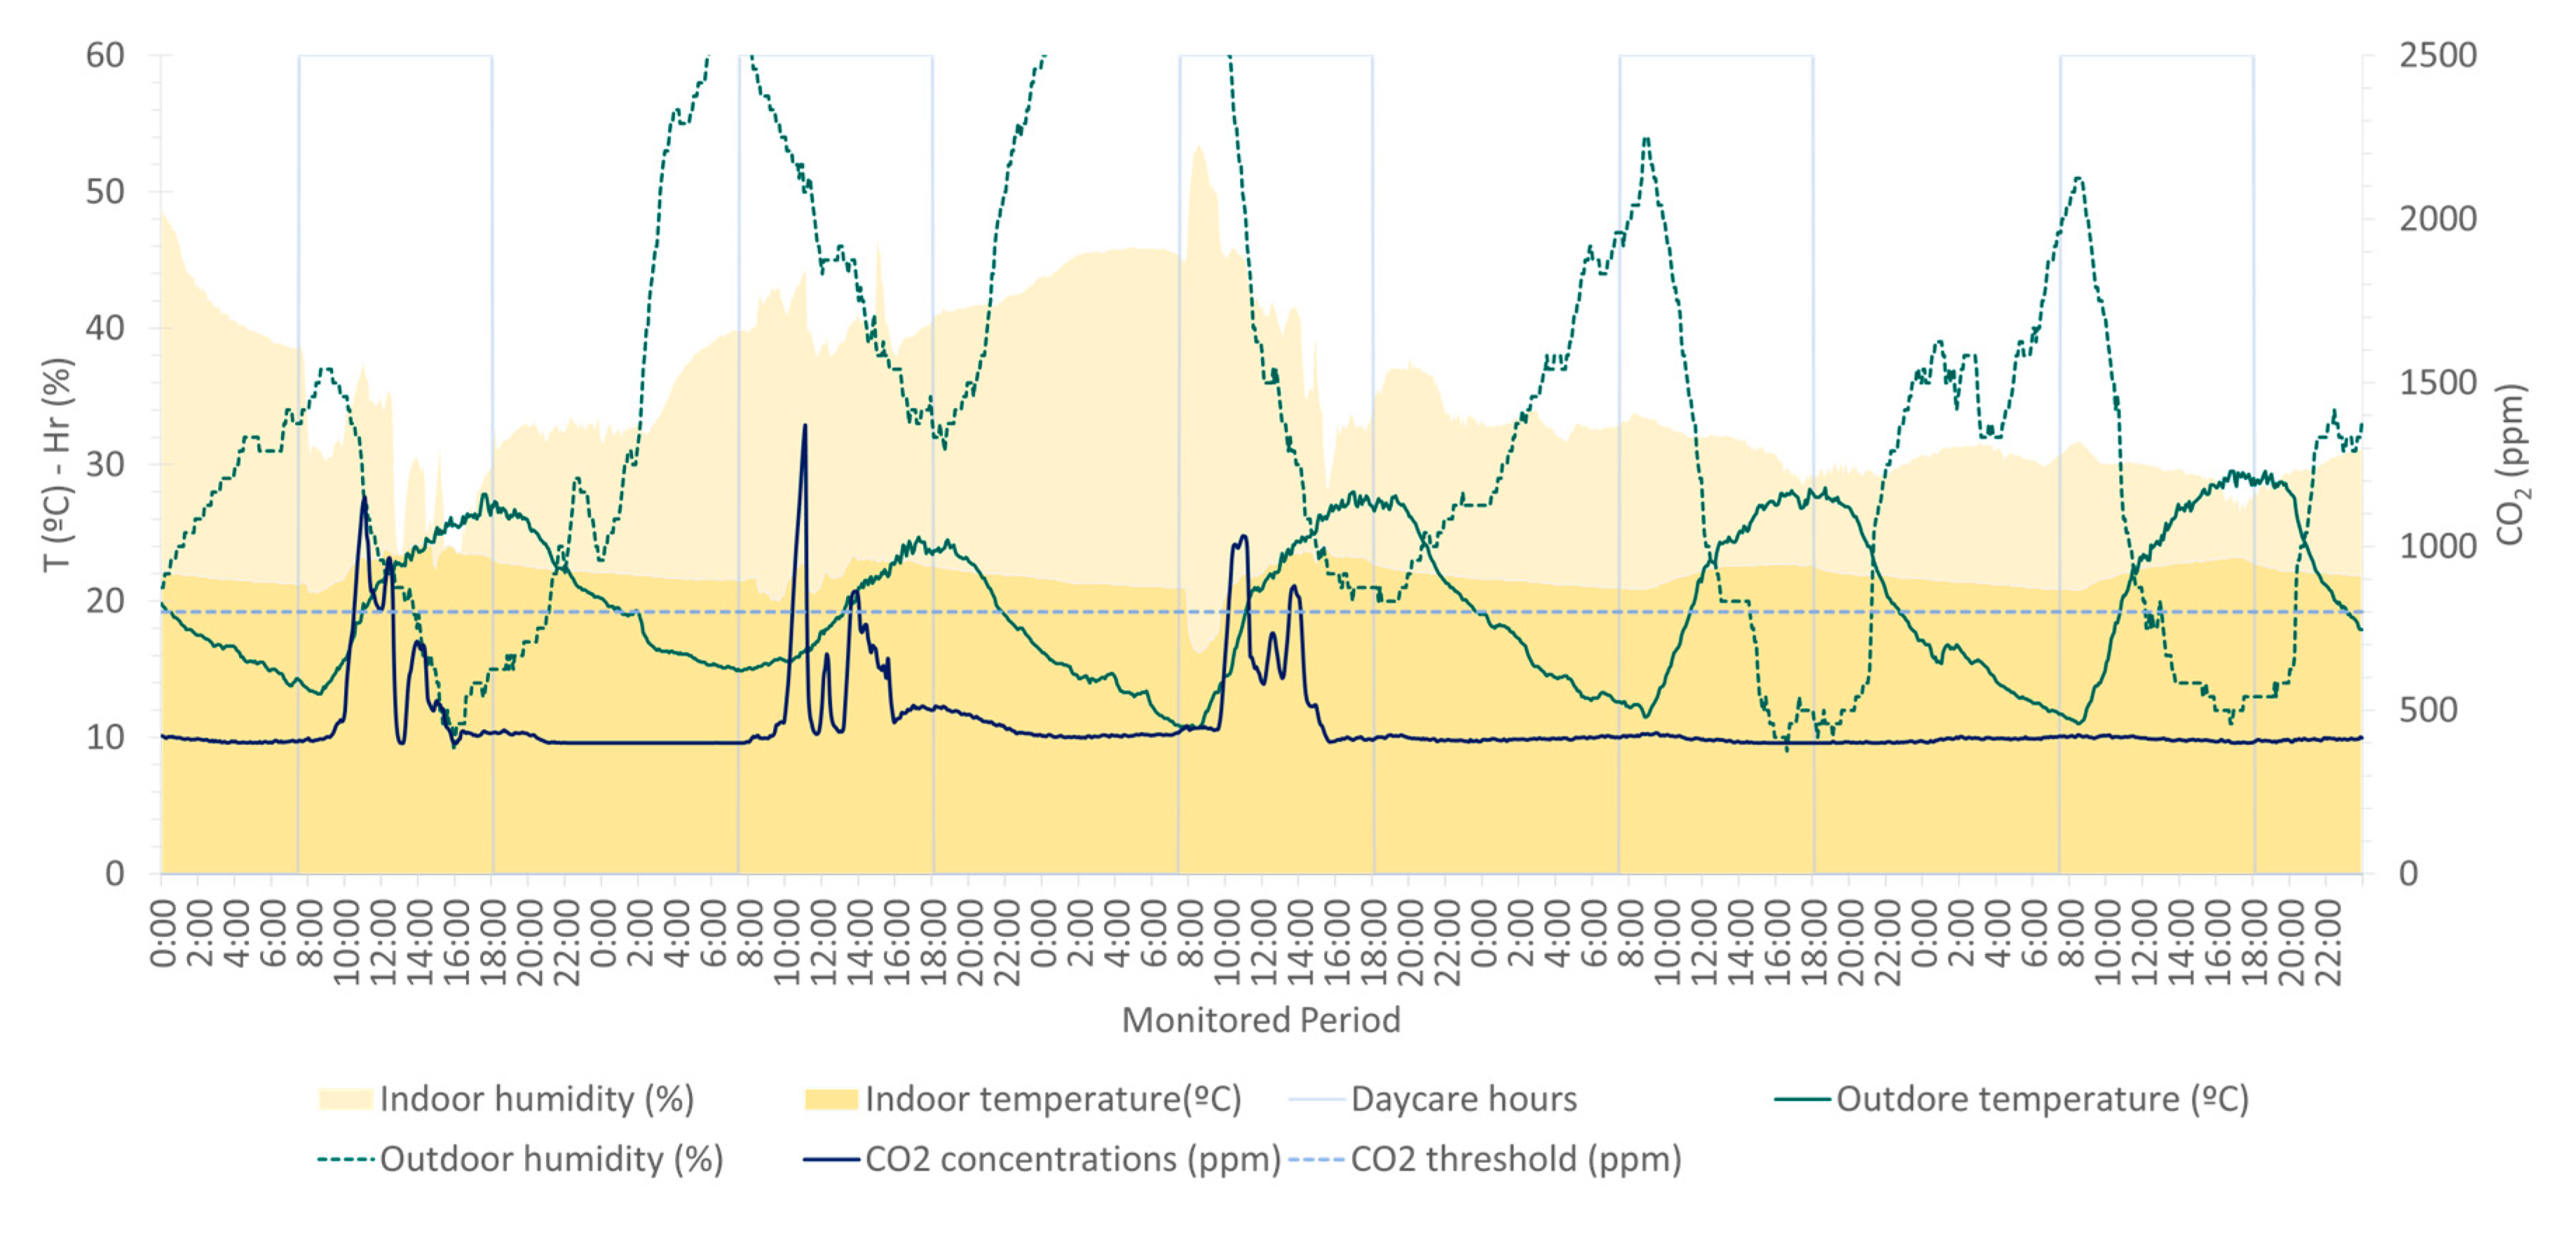
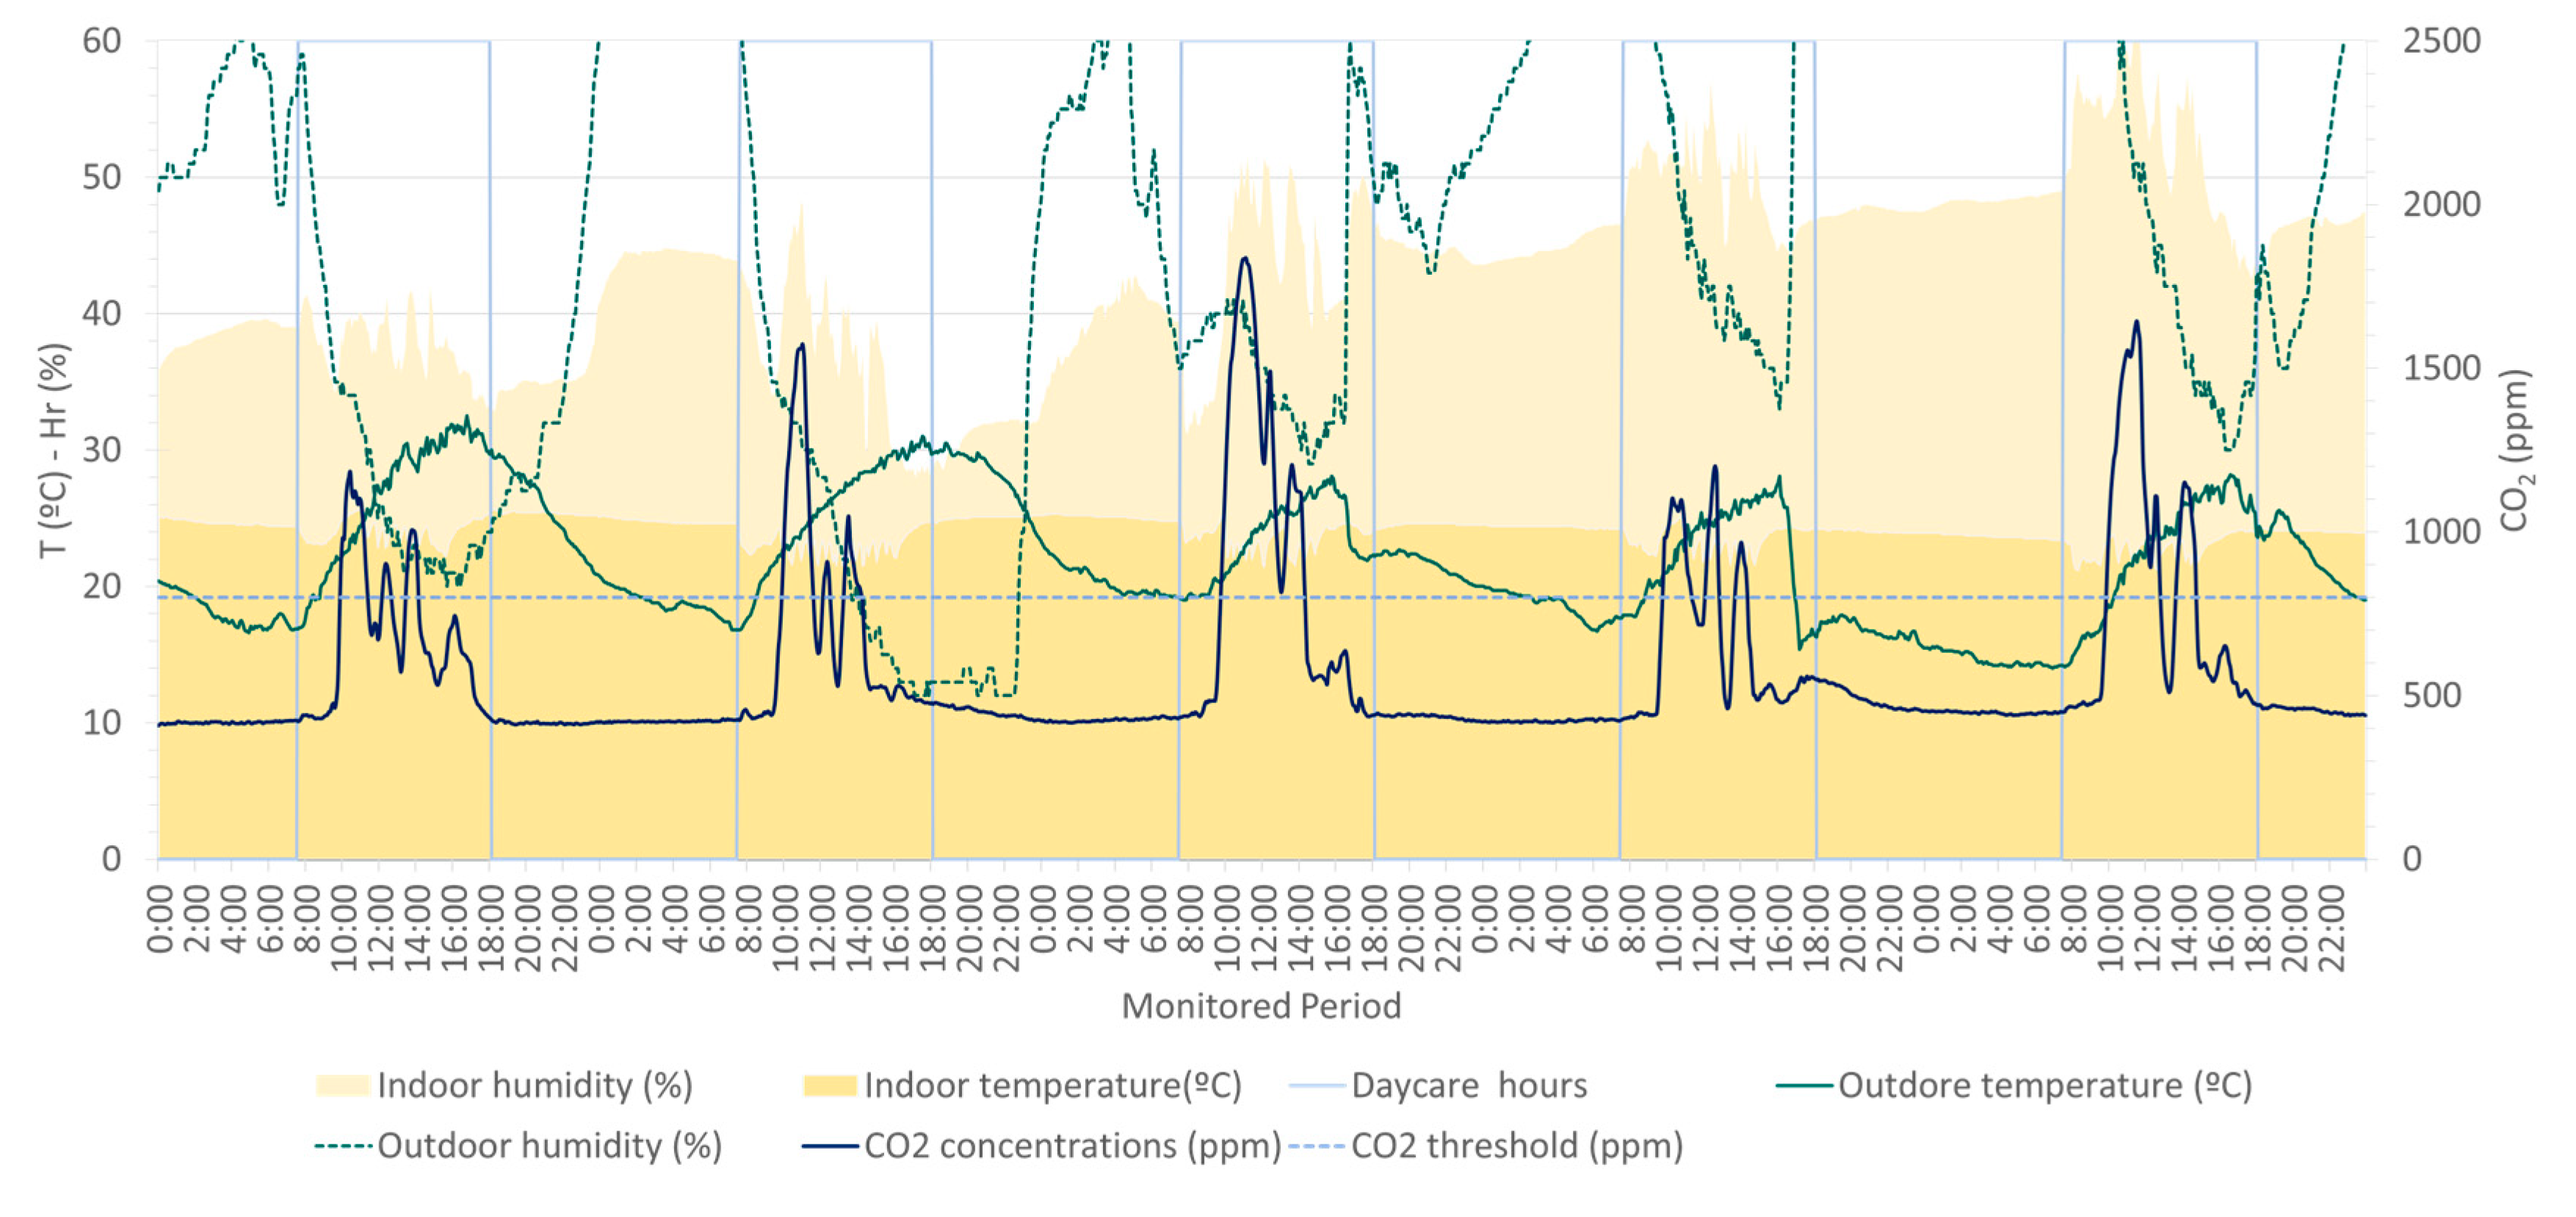
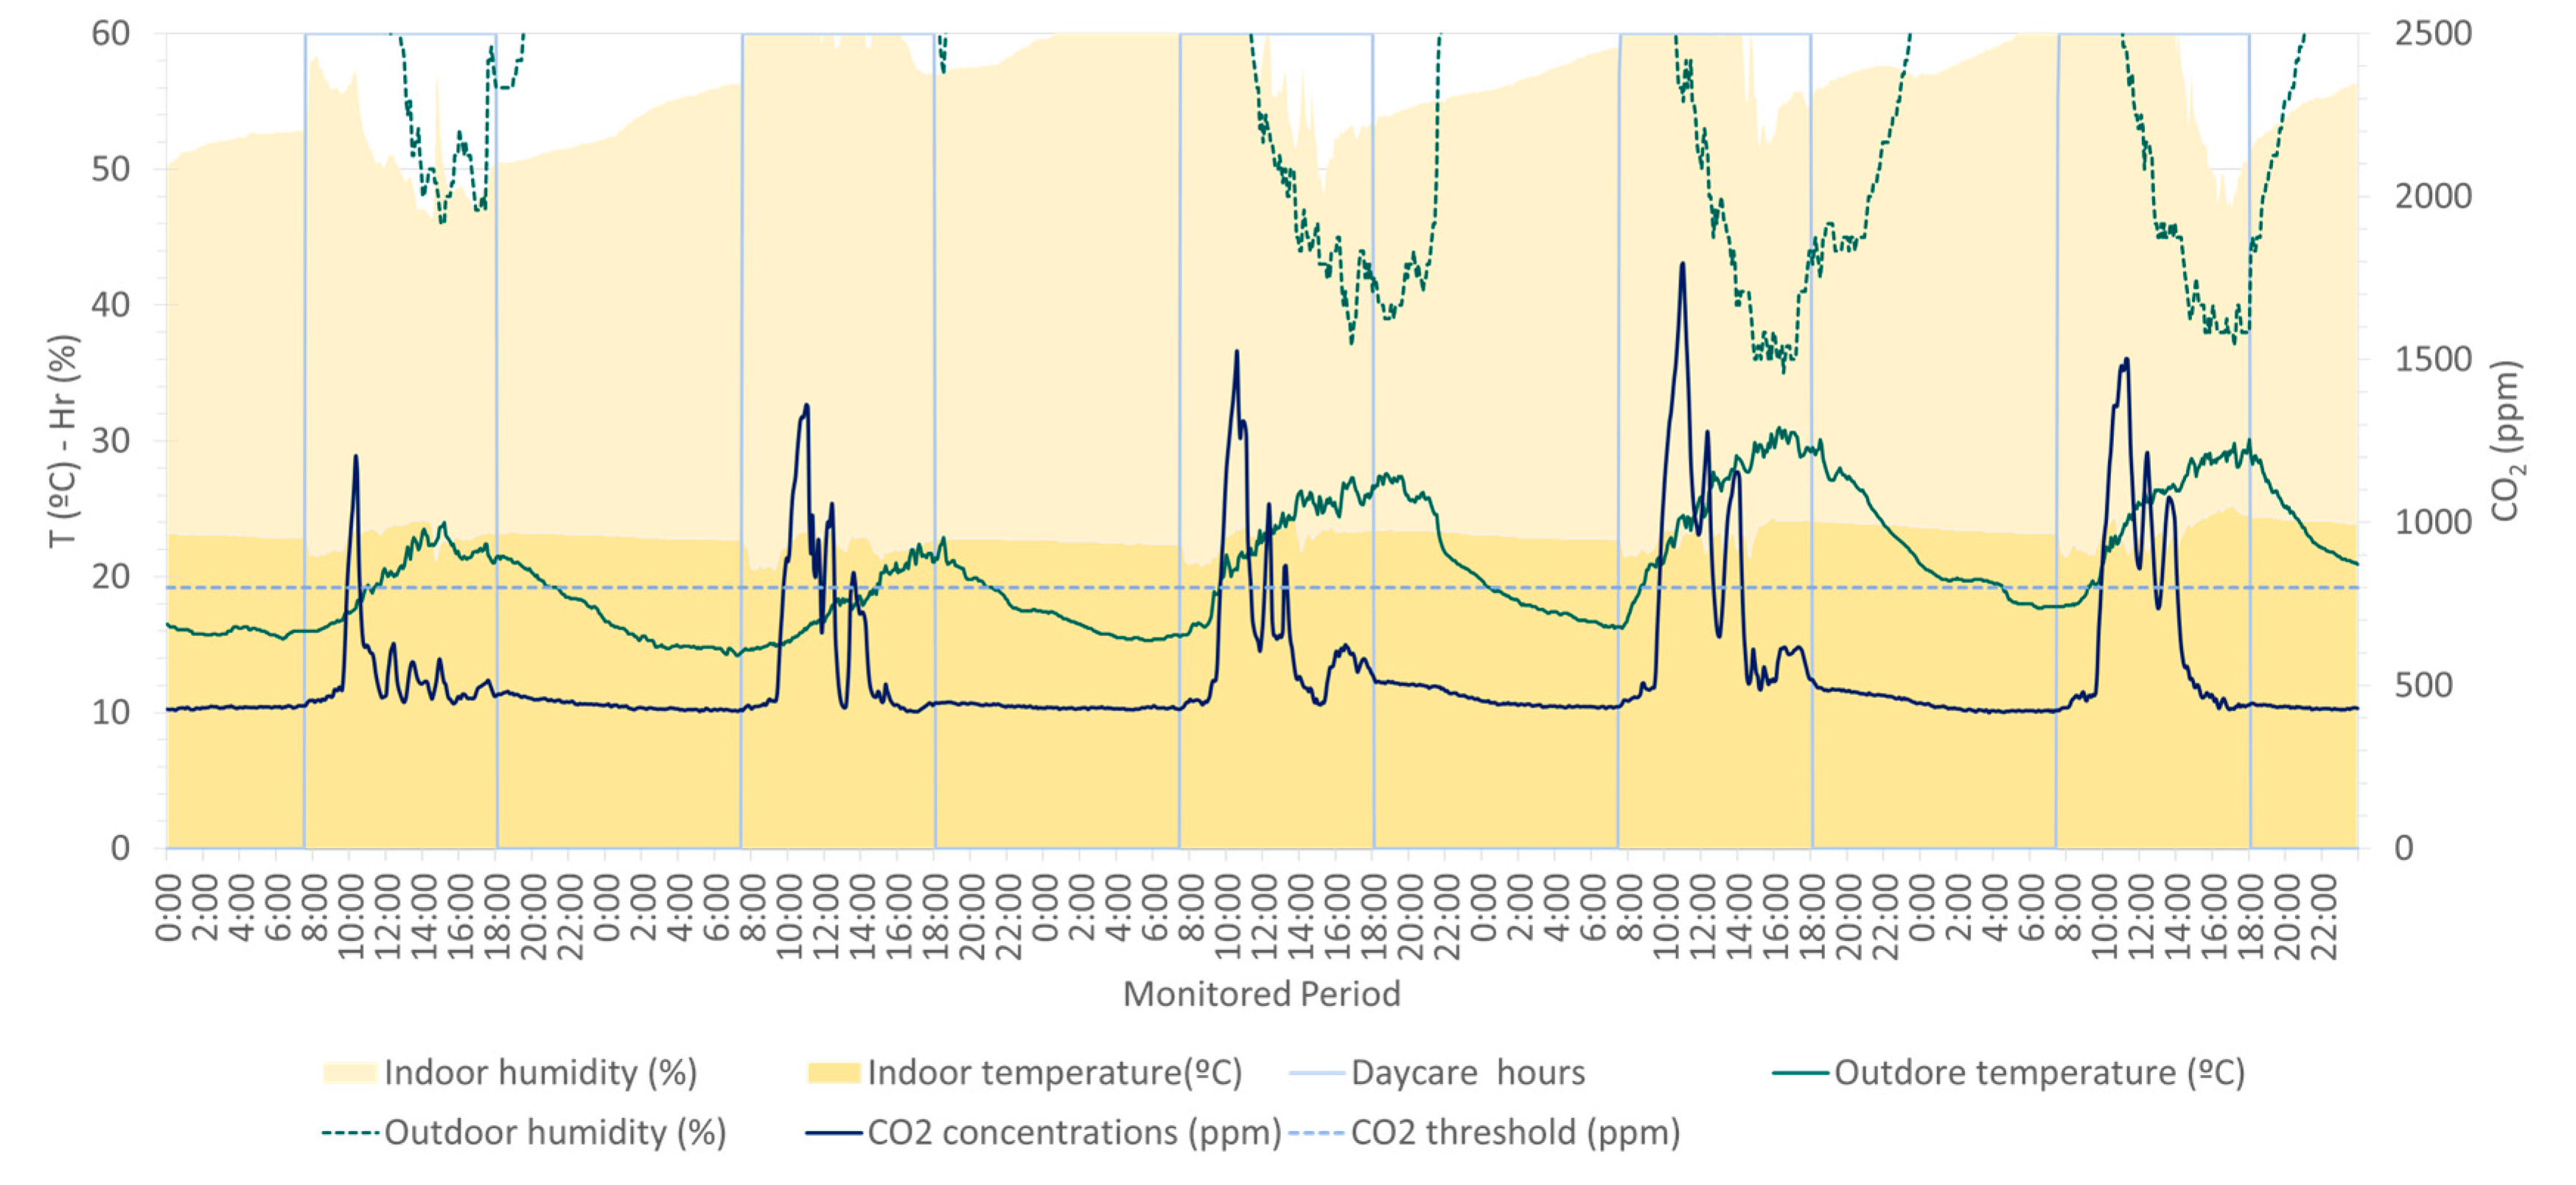
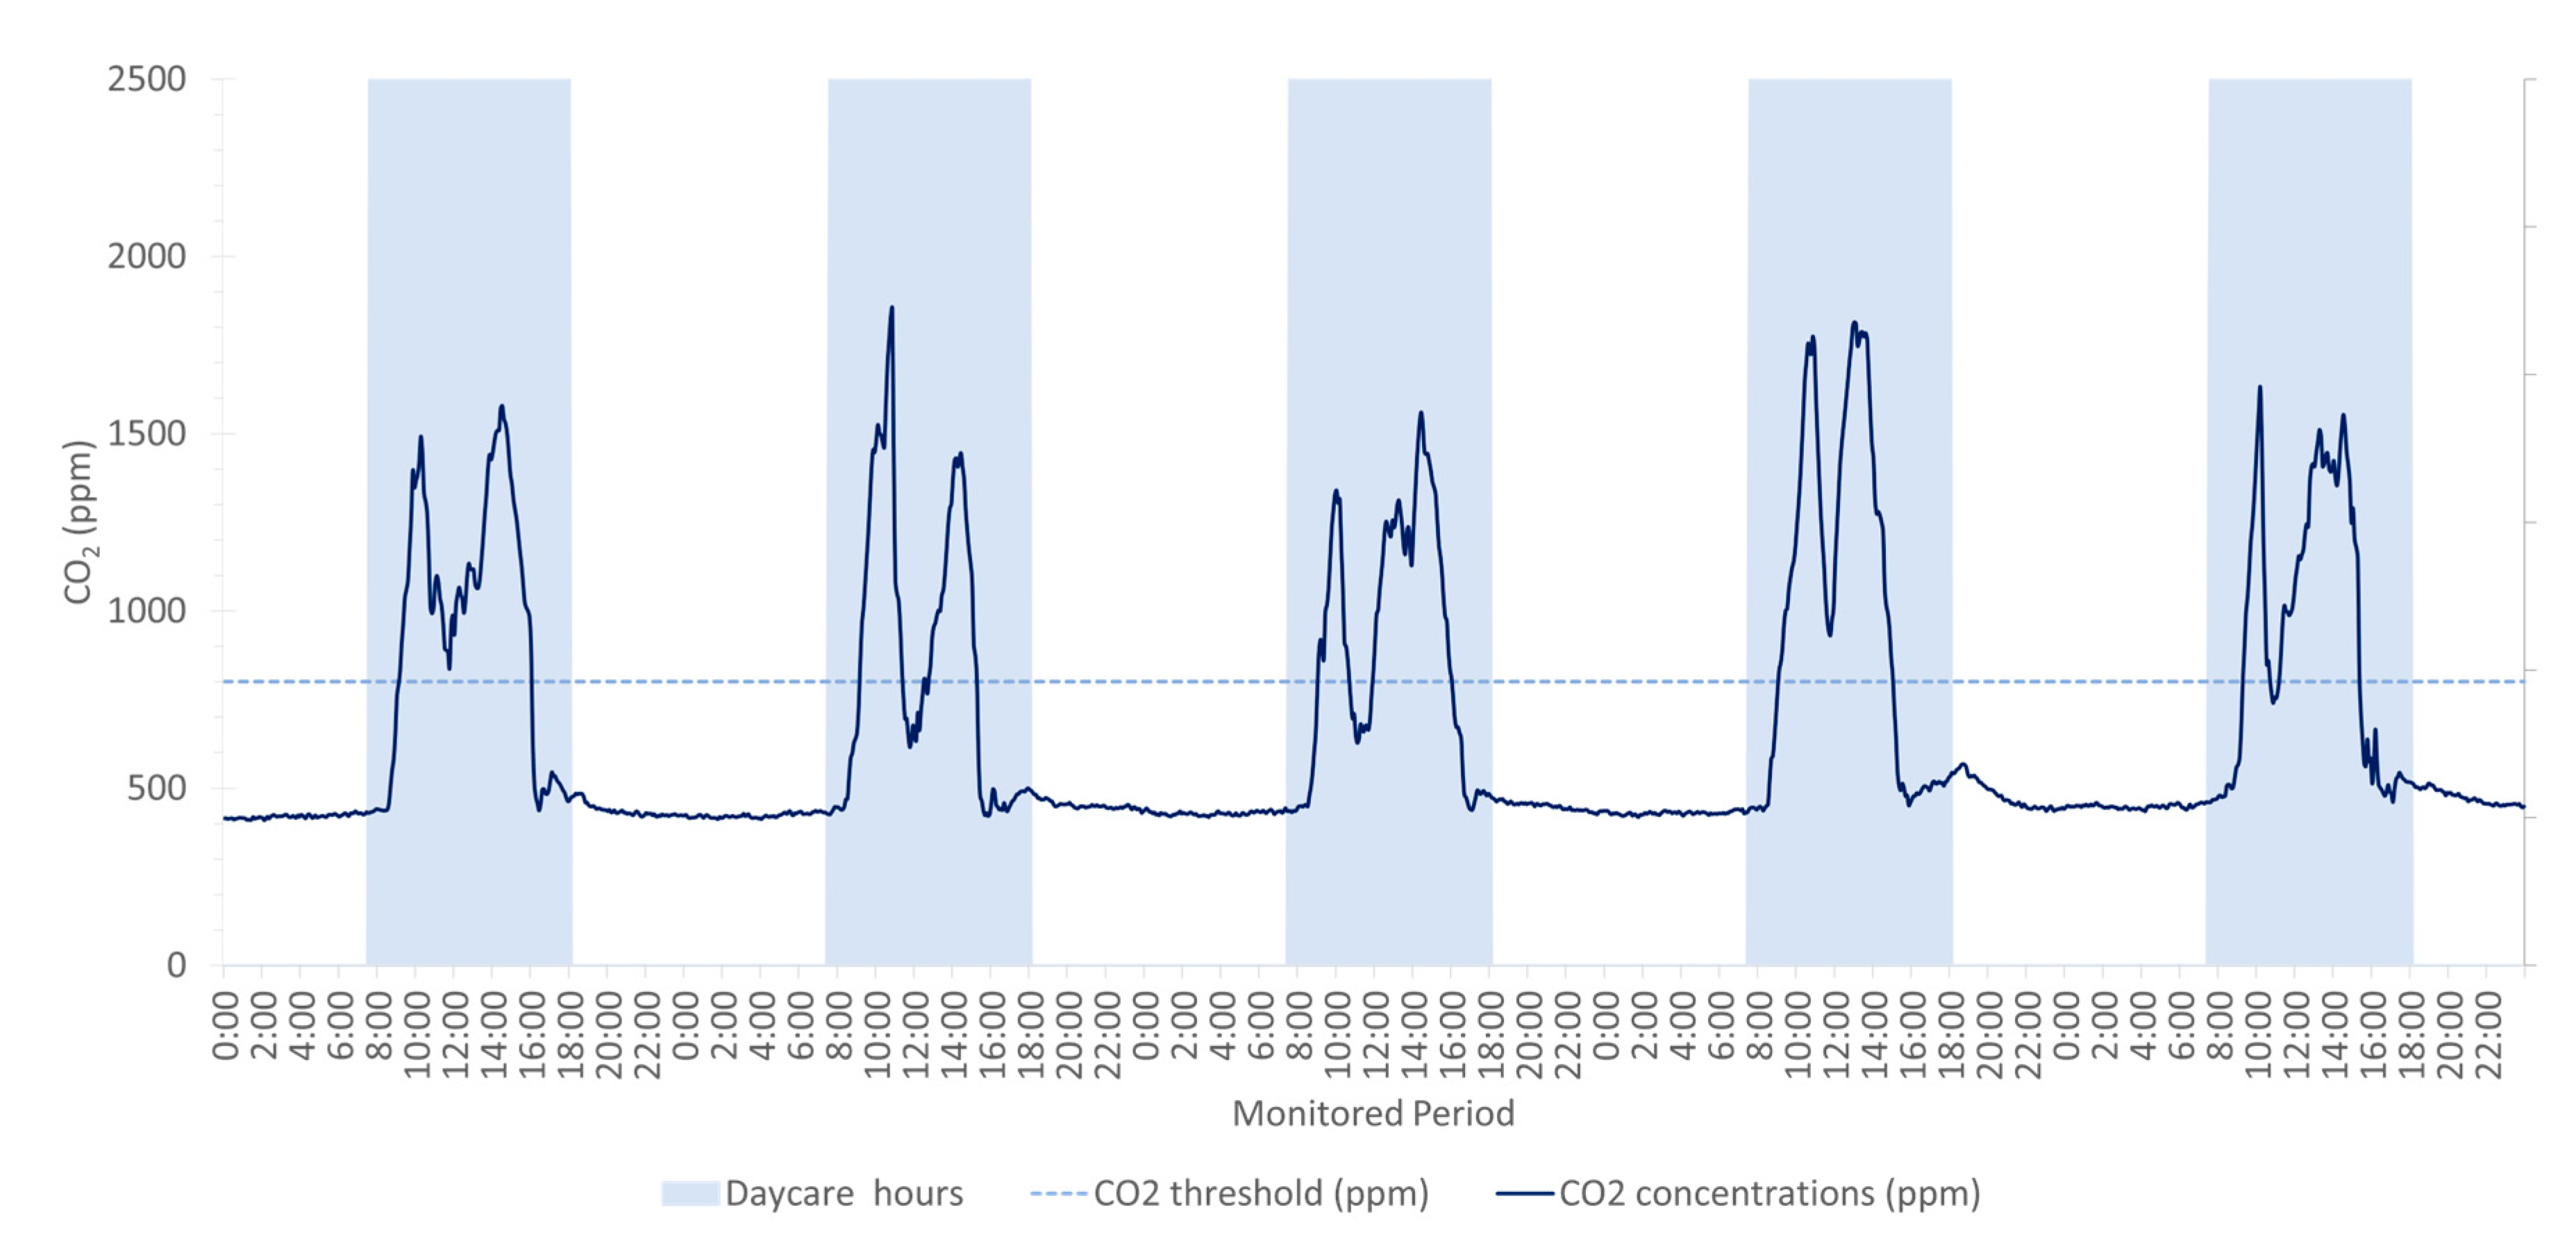
2.2. Air Quality and Thermal Comfort

To evaluate the environmental conditions of the nursery, a monitoring campaign was conducted from 14 March to 26 May—two months in Spring 2023—by installing sensors in two classrooms. Classroom A, designated for infants aged 4 to 12 months, and Classroom B, for toddlers aged 1 to 2 years, were selected for monitoring due to the heightened vulnerability of their occupants. The underdeveloped respiratory and immune systems of these age groups make them particularly susceptible to airborne diseases and poor environmental conditions. Monitoring devices were installed 1.25 m above the floor level, cantered on the wall opposite the window (Figure 2), following established protocols to ensure accurate measurements while preventing tampering by children [1,24].
The monitoring used “Awair Omni” devices (Awair Inc., CA, USA), equipped with a Non-Dispersive Infrared Detector (NDIR) for measuring CO2 concentrations with a range of 400–5000 ppm and a precision of ±75 ppm. Additionally, the device includes a CMOS Sensor for measuring RH (0 to 100%, accuracy of ±2%) and Ta (−40 to 125 °C, accuracy of ±0.2 °C).
The mean value of occupants’ hygrothermal comfort can be assessed using the Predicted Mean Vote (PMV) indicator [65], which applies thermophysiological parameters to predict the thermal perception of a theoretical occupant on a seven-point scale ranging from −3 (cold) to +3 (hot). This index is suitable as a preliminary approach for naturally ventilated Mediterranean spaces, particularly in educational buildings, provided that minor adjustments are made to align it with the Predicted Percentage of Dissatisfied (PPD) [66,67,68,69]. Additionally, the predicted thermal comfort of the infants was calculated by considering the age of the occupants, which was used to estimate the corrected skin surface [70] area and metabolic rate [71], along with a mean value of clothing insulation of 0.6 clo [66].

2.3. Relative Airborne Pathogen Risk Transmission

Given that the analyzed spaces are continuously occupied by sensitive individuals (children aged 0 to 2 years), the relative risk of airborne disease transmission is assessed, using SARS-CoV-2 as a representative infectious pathogen. To this end, the methodology outlined by Rodríguez et al. [12] is applied, utilizing the Covid Riskairborne tool (https://www.covidairbornerisk.com/, accessed on 13 June 2024) developed by Campano et al. [72]. This tool is based on the probabilistic model adapted from Wells–Riley [10,27,28,29], which statistically predicts the airborne transmission of pathogens among individuals during a given event, transmitted via aerosols (both medium and long distances) [73].
This method employs the concept of a “quantum”, defined as the “dose of airborne droplet nuclei required to cause infection in 63% of susceptible occupants” [27]. Thus, the risk of transmission during a given event depends on the number of quanta inhaled by susceptible individuals. Since the emission of infectious particles occurs simultaneously with the respiratory process, it is possible to correlate this emission with the monitoring of the average excess CO2 levels relative to outdoor concentrations.
To estimate the average emission rate of infectious particles from a potentially infectious subject, the concept of the Quanta Emission Rate (ERq) is utilized. The emission rate established by Morawska et al. for SARS-CoV-2 [28,74] is adopted, incorporating the Monte Carlo Method [27] with an enhancement factor of 3.3 for the “Omicron” BA.2 variant relative to the original virus [75,76]. Additionally, it is assumed that the infectious individual has an emission capacity at the 85th percentile. Consequently, the basic quanta exhalation rate (Ep0) is set at 18.6 q·h−1.
To assess the relative infection risk, three scenarios were analyzed based on varying levels of vocalization and metabolic activities by one-year-old occupants (Table 1).
  • Case 1: normal breathing, representing periods of minimal vocalization and relative quiet.
  • Case 2: regular speaking, simulating typical days when infants intermittently cry, babble, or laugh.
  • Case 3: loud speaking, representing scenarios with increased vocalization, which are less common given the age of the children.
The relative risk of contagion is evaluated using the Attack Rate (AR) indicator, which is epidemiologically defined as the “ratio of infection cases (C) to the total number of susceptible individuals (S) exposed to a quantifiable concentration of infectious quanta”, considering that n is the “infectious dose inhaled by a susceptible person present in the premise during the event (quanta)”. This metric can also represent the individual infection risk (R) during a specific event, as expressed in Equation (1).
A R = C S = R 100 · 1 e n
The calculation of n, detailed extensively in [12,77], is influenced by various factors. These include the Quanta Emission Rate (ERq), which varies depending on the infectious agent and specific characteristics of the infectious individual, such as age, metabolic activity, and vocalization intensity. Additional determinants are the event duration, the room volume, the infectious agent’s airborne decay rate (affected by air velocity, ta, and RH), and the aerosol deposition rate on surfaces. Air-cleaning measures, such as filtration, UV light, ventilation efficiency, and potential mask usage, are also integral to this calculation.

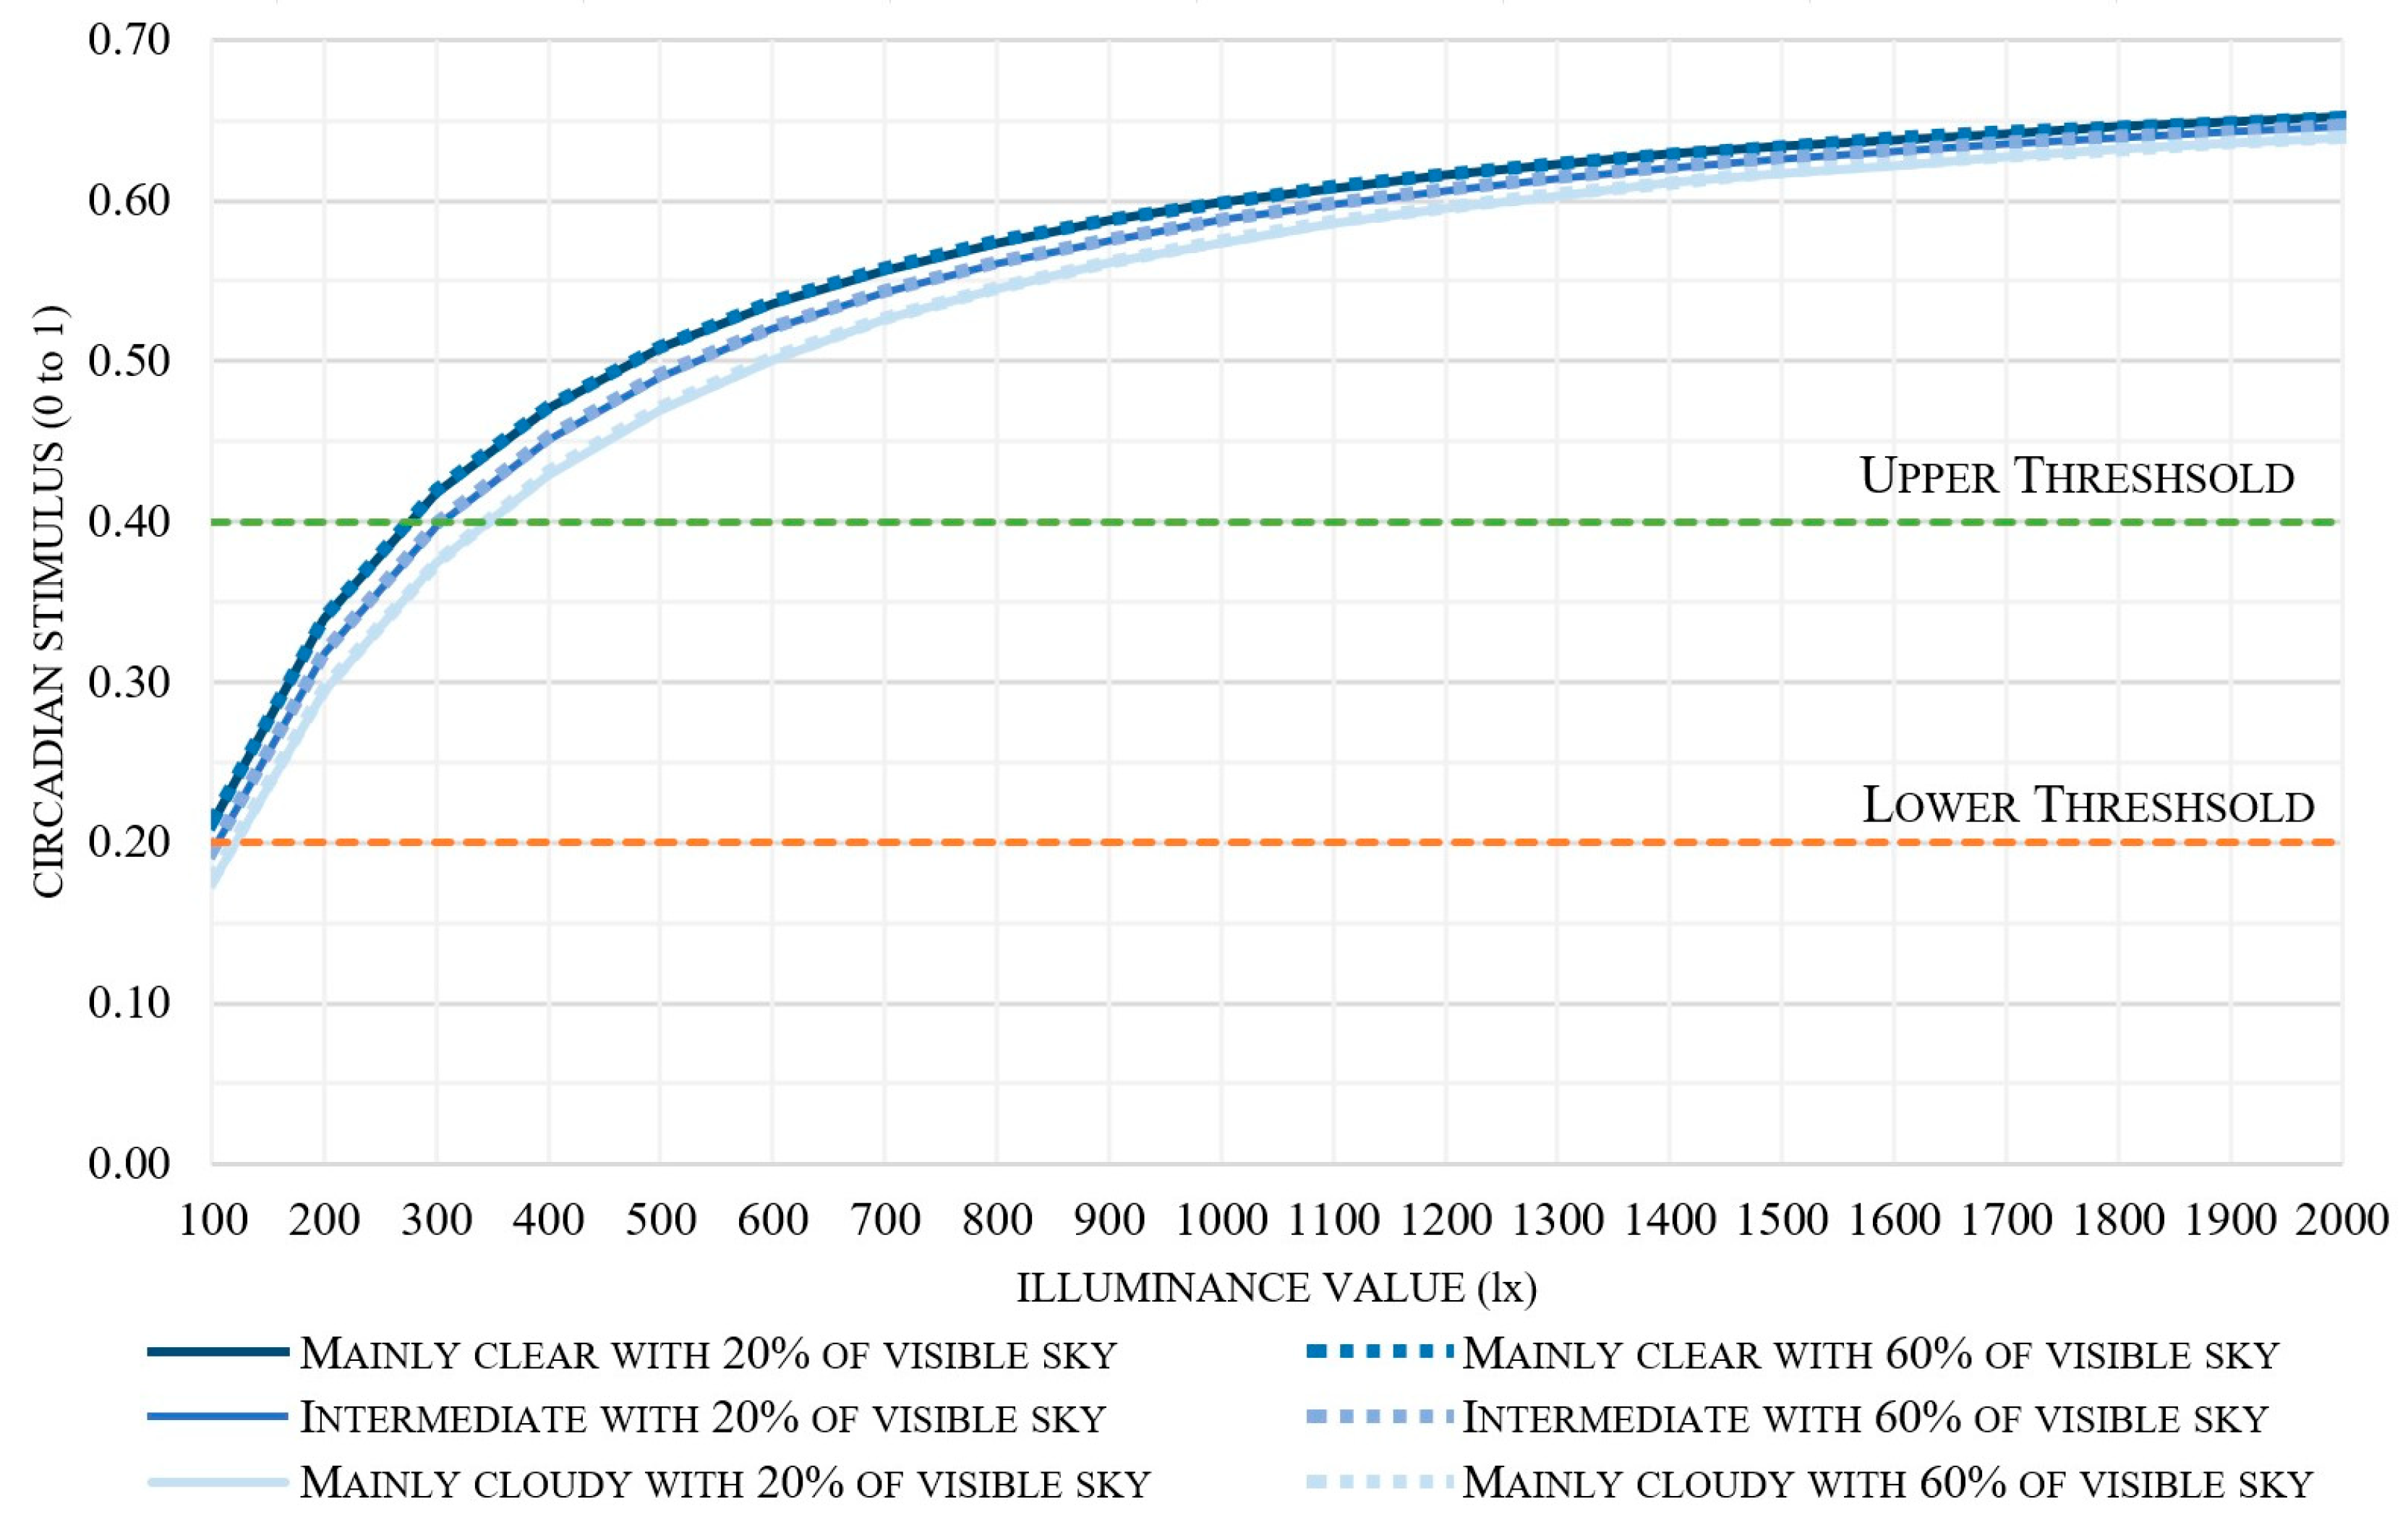
2.4. Circadian Stimulus

2.4.1. Calculation Metrics of Illumination

To ensure the well-being of children and proper circadian entrainment—facilitating adequate sleep and activity patterns throughout the day—the lighting metrics are based on circadian response. Consequently, the circadian stimulus (CS) is the chosen metric to evaluate the potential of daylight to support sufficient circadian entrainment during both play and sleep periods.
Brainard et al. developed a sophisticated mathematical model of human circadian phototransduction grounded in the current understanding of retinal neuroanatomy and neurophysiology [78].
This model, which quantifies non-visual responses to light, particularly focuses on light-induced nocturnal melatonin suppression.
The model incorporates several key elements:
  • Spectral sensitivity: it characterizes the spectral sensitivity of the retinal circuit, defining “circadian light” (CL) as a single, instantaneous photometric quantity.
  • Empirical data: the model utilizes published psychophysical studies of nocturnal melatonin suppression using lights of different spectral power distributions.
  • Neurophysiological basis: it accounts for the participation of intrinsically photosensitive retinal ganglion cells (ipRGCs), as well as rods and cones, in circadian phototransduction via neural connections in the retina.
  • Spectral opponency: the model includes spectral opponent mechanisms in the distal retina that provide synaptic connections to the ipRGCs.
This comprehensive approach allows the model to characterize both the spectral and absolute sensitivities of the human circadian system to light, represented as circadian light (CLA). The model’s ability to predict responses to complex light environments makes it a valuable tool for understanding and designing lighting in various contexts, such as architectural spaces, workplaces, and treatment of circadian rhythm disorders.
Recent research has further refined our understanding of the spectral sensitivity of human circadian responses. Studies have shown that the spectral sensitivity of circadian phase resetting and melatonin suppression changes dynamically with light duration. This suggests that the relative contributions of different photoreceptors may vary over the course of light exposure, with cones potentially playing a significant role in the initial response, followed by a dominant melanopsin contribution over longer durations [79].
The mathematical development of CS is expressed in Equation (2):
C S = 0.7 · 1 1 1 + C L A 355.7 1.1026
The value ranges from 0.0, which indicates no suppression, to 0.7, representing the saturation point where further increases in light intensity or spectral quality no longer result in a significant enhancement of melatonin suppression. This prediction assumes that the typical observer is exposed to the given lighting conditions for one hour, with a standard pupil diameter of 2.3 mm. For effective circadian entrainment, a CS value of 0.4 is typically considered sufficient, as this threshold is enough to support biological alignment and maintain healthy circadian rhythms.
The assessment of melatonin suppression levels (CS) is determined based on the specific illuminance (E) and the spectral composition of light reaching the occupants’ eyes. Data gathered during both phases underwent systematic processing and analysis using multiple tools. Microsoft Excel (v2412) [80] was employed to structure and examine the recorded measurements in spreadsheet format, while the CS Calculator 2.0 software [45,81,82,83,84] was used to model the circadian stimulus (CS) under various lighting conditions.
CS calculations correspond to the minimum light exposure required by the human eye to achieve adequate melatonin suppression—equating to a CS value of 0.4 during daytime activities [59] and 0.2 during the sleep period. This CS value is derived from the combined SPD of the light, which includes the natural light SPD modified by reflections on the room’s interior surfaces as well as the received light flux. Consequently, an illuminance threshold that ensures the appropriate CS can be identified, considering the resulting SPD influenced by the architectural environment and prevailing climatic conditions.
Figure 3 depicts the average spectral irradiance distribution derived from the SPD of each sky type, factoring in the indoor reflections within the venue. This distribution served as the basis for determining the appropriate illuminance threshold. Notably, all the analyzed SPDs displayed a marked reduction in the short-wavelength fraction, attributed to the lower spectral reflectance values of the room’s interior surfaces for these wavelengths.
Using the resulting SPDs shown in Figure 3 and the selected CS values, the minimum illuminance thresholds were calculated using Equation (2), as illustrated in Figure 4. As observed in Figure 4, clear skies require lower illuminance levels to achieve a specific CS value compared to overcast skies. Additionally, it is notable that an illuminance of 300 lx corresponds to a CS value near 0.4, depending on the prevailing climate conditions, while an illuminance of approximately 100 lx produces a CS of around 0.2. Based on these findings, the study establishes two illuminance thresholds that are independent of climate conditions and rely solely on the spectral reflections within the indoor environment.

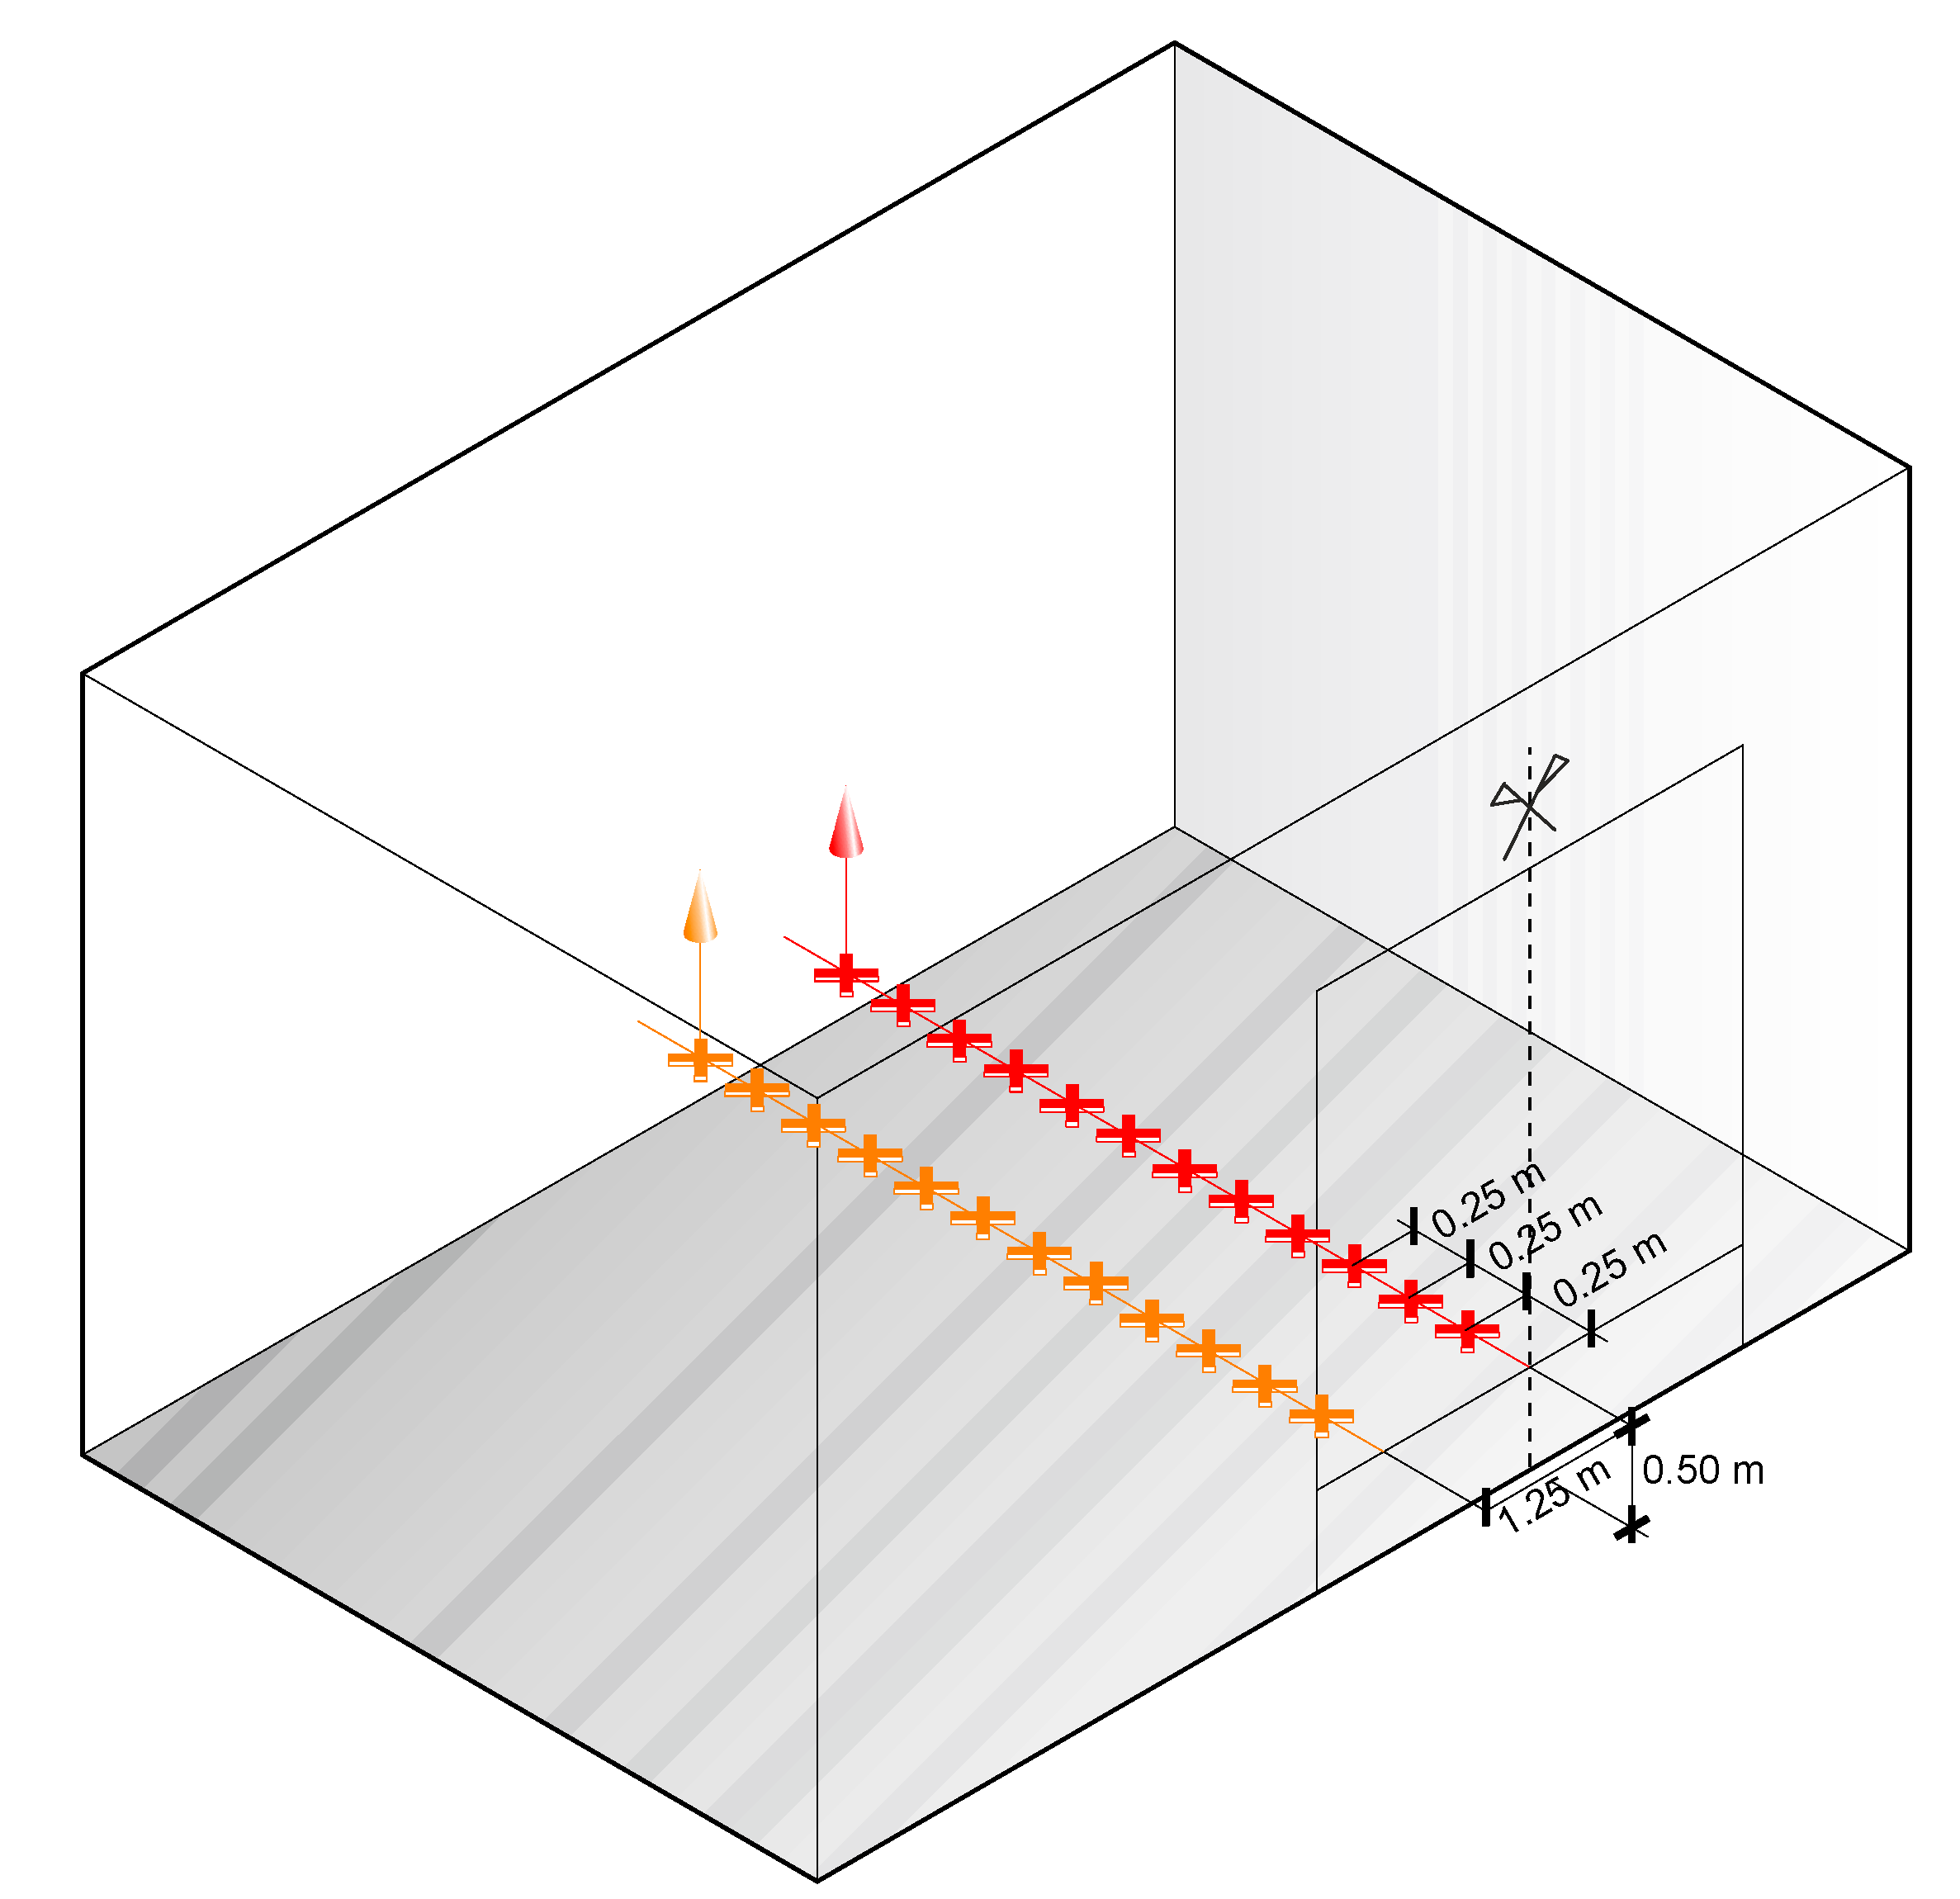
2.4.2. Measuring Campaign

As noted in the introductory section, circadian rhythms typically begin developing at around six months of age. Consequently, the classroom for infants younger than six months was excluded from this research. Therefore, classroom B was analyzed to represent their respective categories.
The methodology for analyzing the circadian stimulus was divided into two distinct phases. The first phase involved monitoring the current lighting conditions in the selected classrooms over 11 weeks. To collect the necessary data, specialized equipment was deployed. The PCE-CSM 8 Spectrophotometer (400 to 700 nm, accuracy of ΔE·ab 0.2) by PCE Ibérica S.L, Spain) was used to analyze the color properties of the classroom facades (RGB values, points a, b, d, e), while the L-100 Lux Meter by PCE Ibérica S.L, Spain (0.1 lx to 3000 lx/10 lx to 300 klx, accuracy of ≤2.5% ±1 LSB) was employed to determine the glass transmissivity of the windows (point c) and to perform a set of measurements in the ground of the room (point b), as can be seen in Figure 5. These values were then incorporated into a detailed model of the classroom using Velux Daylight Visualizer (v2.8.4), a lighting simulation software designed for precise daylight analysis. Measurements were used to validate the simulation model produced with this tool.
The façade of the Faculty of Education building, attached to the nursery in the courtyard area (north-facing—azimuth of 7°) and arranged parallel to it, is located at 12.18 m and has a height of 17 m. The facade’s surface color, quantified using its RGB values, was determined to be 195, 193, and 187, reflecting its light-grey tone. Similarly, the reflectance properties of the outdoor surfaces in the adjacent courtyards were analyzed. The first courtyard ground exhibited RGB values of 117, 117, and 113, indicating a medium-grey surface, while the second courtyard ground showed darker tones with RGB values of 79, 78, 71. These reflectance data points were integrated into the simulation to ensure an accurate representation of the interplay between external reflected light and the interior lighting environment of the classroom.
The glass used in the classroom windows was measured to have a transmissivity of 0.758. The interior wall surfaces were also analyzed for their reflective properties. The upper portion of the wall exhibited RGB values of 239, 238, and 185. In contrast, the lower portion of the wall was found to have RGB values of 156, 182, and 185.

2.4.3. Virtual Model

The second phase of the study focused on simulating the classrooms under varying lighting conditions to propose feasible improvements. To ensure the simulation model accurately reflected real-world conditions, the values shown by the model were first contrasted with the measurements on-site. The calculation of illuminance level is conducted using Velux 2.8.4. Two longitudinal arrays of points were utilized, both positioned horizontally along the tow axis perpendicular to the façade plane, as can be seen in Figure 6. One array was centrally positioned relative to the window opening, while the other was located 1.5 m from the right jamb of the same opening. These points, spaced at 0.25 m intervals, were set at a height of 0.5 m above the floor in both cases, corresponding to the height of the heads of lying children, and were oriented vertically toward the ceiling.
The proposed hypotheses analyze the current state of the building—specifically, the natural light entering through the existing opening. To this end, the calculation of the point matrices was carried out under different temporal scenarios: during the solstices and equinoxes, at 10:00 solar time (aiming to maximize the circadian response, targeting a circadian stimulus (CS) of at least 0.4) and at 14:00 solar time (nap time, aiming for a CS equal to or below 0.2). The model was calculated under standard sky types 1 (standard overcast) and 12 (standard clear sky, low turbidity) [85,86], as extreme cases of sky types.

3. Results

3.1. Thermal Comfort

Appendix A (Classroom 1) and Appendix B (Classroom 2) provide detailed data on the evolution of indoor and outdoor Ta as well as indoor and outdoor RH throughout the monitoring period. An example of the thermal comfort results is presented in Figure 7. The grey-striped sections indicate the hours when the classroom is occupied, while the white-striped sections represent unoccupied periods. The results of Ta and RH measurements are plotted on the primary vertical axis, whereas the PMV is displayed on the secondary vertical axis.

3.2. Air Renewal Efficiency

Appendix A (Classroom 1) and Appendix B (Classroom 2) present the evolution of CO2 concentrations throughout the monitoring period. An example of the trend in CO2 concentration during classroom hours (8:00 to 18:00) from 16 May to 18 May is illustrated in Figure 8.
Figure 9 includes a comparative analysis of CO2 concentration ranges across different classrooms over three separate weeks (weeks 8, 10, and 11). This comparison highlights compliance with the Spanish regulatory threshold of 770 ppm (RITE [62]) and identifies instances where concentrations surpassed the “not admissible” category for IDA 3 environments, as defined by UNE 171380:2024 [87].

3.3. Relative Airborne Pathogen Risk Transmission

Figure 10 illustrates the estimated AR values for the three scenarios under consideration alongside the daily average CO2 concentrations recorded throughout the monitoring period (two months). Additionally, the graph includes three vertical reference lines: a proposed 550 ppm limit based on UNE 171380 [87] and the current permitted threshold of 770 ppm (absolute, considering 420 ppm outdoor levels) specified for IDA1 environments (sensitive occupants) in the RITE [60,61,62,63,64,78]. The latter value reflects the average CO2 level achievable if the existing mechanical ventilation system in the classroom was fully operational. The dots along the curves represent the daily averages observed during the monitoring campaign.
Figure 10 also includes a vertical line representing the CO2 concentration that would result from continuously operating the exhaust fan (air extractor) located in the bathroom. This fan has a capacity of 50 L/s, and its effect is calculated based on the average CO2 levels in the classroom. Activating the fan creates a negative air pressure in the bathroom, which increases the air exchange rate in the classroom through infiltration via the building envelope and air transfer through the bathroom door.

3.4. Circadian Stimulus

The illuminance results for the central and lateral arrays displayed in Figure 6 can be seen in Figure 11.
The central array is represented with a continuous line, while the lateral array is represented with a dotted line. To compare the results obtained at 10:00 and 13:00 (solar time), the first one is displayed in red while the second one is displayed in green. Each resulting graph has been overlaid on top of the section of the classroom to better illustrate the illuminance decay in relation to the distance to the window. Pale blue areas represent zones below 100 lx for 10:00 and dark blue areas show the same illuminance interval for 13:00 (solar time).

4. Discussion

4.1. Thermal Comfort

The hygrothermal comfort levels observed during the monitored period, during which the facility’s thermal conditioning system was operational, generally fall within Category B of thermal comfort. This thermal category corresponds to a PMV range of −0.5 to +0.5, ensuring that no more than 10% of occupants should be dissatisfied. The recorded PMV values ranged between −0.2 and 0.6, suggesting that infants would be unlikely to feel excessively cold and may only occasionally perceive slight warmth. These results align with expectations, given the consistent indoor Ta and RH levels, which rarely drop below 30% or exceed 60%.
It is noteworthy that the indoor Ta data (depicted by the continuous grey curve in Figure 7) remain consistently stable, not only during the classroom’s active use hours but also throughout unoccupied periods. From 18:00 to 7:30, when the childcare center is presumed closed, the indoor Ta holds steady at approximately 25 °C (or around 20 °C at the start of the campaign, when external conditions were cooler) until the first occupants arrive the following morning. This stability indicates that, in addition to the building envelope’s high thermal insulation, which effectively retains accumulated thermal energy, the air conditioning system appears to remain operational even after staff members leave the facility. Similar patterns are observed during weekends and public holidays.

4.2. Air Renewal Efficiency

The evolution of CO2 concentration increased steadily as the children arrived and remained consistently elevated throughout the day. Concentration levels only dropped during short ventilation periods, when windows were partially opened, or after the classrooms were vacated at the end of the day. Ventilation primarily relied on uncontrolled air infiltration through the building envelope, with an estimated air exchange rate (Air changes per hour, ACH) of 0.3–0.5. This rate, indirectly calculated using the CO2 decay method, is typical for classroom structures of this kind in Andalusia [24].
The monitoring campaign highlighted significant findings in Classroom A. For instance, during the 10th week (refer to Figure 9), CO2 concentrations consistently exceeded both the recommended threshold of 550 ppm for spaces with vulnerable, unmasked occupants [36,87] and the regulatory limit of 770 ppm established for childcare centers in Spain [64,88,89]. On the worst days, the CO2 level peaked at or above 1900 ppm, significantly surpassing acceptable safety standards.
To contextualize these findings, CO2 levels were classified into three distinct categories: “Below the standards threshold” (<770 ppm), “Above the Spanish standard threshold” (770–1220 ppm), and “Not admissible” (>1220 ppm). A comparative analysis focusing on weeks 8, 10, and 11 (Figure 9) highlighted significant concerns. In Week 8, indoor air quality was notably poor, with infants exposed to air CO2 levels exceeding 1220 ppm for over one-third of their time in the classroom. Week 10, which represented average conditions of the monitored period, showed slight improvements but still failed to meet health standards for a significant portion of the day.
Despite the presence of a mechanical extractor in the bathroom, it was not utilized during the monitored period. Combined with the inefficient operation of the air conditioning system, this suggests that automatic systems integrated with monitoring devices would be more effective than user-controlled systems in improving both energy efficiency and air quality.
In Week 11, a new ventilation protocol was introduced, instructing staff to leave the main classroom window open by 5 cm throughout the day and fully open the small bathroom windows, providing a total opening area of 0.61 m2. While this intervention led to modest improvements in CO2 concentrations, the levels still exceeded the regulatory safe range for over 75% of the classroom’s occupied time. Further increasing the window openings and installing transfer grilles in the doors to promote cross-ventilation and thereby enhance airflow would have compromised thermal comfort and energy efficiency. This underscores the inherent limitations of relying solely on natural ventilation, which cannot ensure a minimum air renewal rate with adequate filtration.

4.3. Relative Airborne Pathogen Risk Transmission

The relative airborne pathogen transmission risk analysis is based on the AR indicator according to CO2 concentrations. This metric is categorized into three levels—low, medium, and high—based on prior research [12,29]. Outbreaks are considered unlikely when the AR remains below 0.5% (the threshold between low and medium levels). However, the risk escalates to high when the AR reaches or exceeds 5%.
Using the high-risk threshold as an outbreak criterion in classrooms, the analysis of AR reveals a significant increase in the risk of SARS-CoV-2 transmission, particularly under the second and third scenarios (speaking occupants and shouting occupants). The 5% AR high-risk threshold is reached at CO2 concentrations as low as 525 ppm. In both the second and third scenarios, this threshold is exceeded even at CO2 concentrations close to those found outdoors. As expected, the third scenario presents the most concerning results due to the elevated vocalization levels, with an initial AR starting at approximately 27%.
However, the most concerning findings come from the second hypothesis, as it most accurately represents the current conditions in Classroom A. In this scenario, the AR exceeds the 5% threshold almost immediately and continues to rise, reaching over 80% at CO2 concentrations of 1200 ppm. Based on the data presented in Figure 10, infants in Classroom A may spend up to 50% of their time exposed to AR levels exceeding 70%.
It is noteworthy that only a handful of the monitored days show average CO2 concentrations below the current permitted threshold. Using the already existing mechanical extraction system in the bathroom, which has a capacity of 50 L/s, could significantly improve the indoor conditions. This would reduce the relative risk indicated by the AR, bringing it down to 20% and 62% in scenarios 1 and 2, respectively.
Moreover, these findings strongly suggest that the current regulatory CO2 threshold of 770 ppm is inadequate during periods of high respiratory infection incidence. At this threshold, the AR exceeds 20% under the first scenario and approaches 70% under the second, highlighting the limitations of relying on this standard alone. Lowering the threshold to 550 ppm, as suggested by Campano et al. [36] and UNE 171380:2024 [87], could significantly decrease infection risk in spaces with vulnerable, unmasked occupants. However, achieving this lower threshold would require the implementation of CMV systems capable of guaranteeing sufficient air exchange without compromising thermal comfort for both infants and caregivers.

4.4. Circadian Stimulus

As illustrated in Figure 11, the circadian stimulus experienced by inhabitants is strongly influenced by the architectural design. This design should be adapted to daylight conditions to ensure sufficient circadian entrainment by providing an appropriate quantity and spectral quality of light. Based on the analysis of the nursery design, a static architectural approach that cannot optimize daylight utilization in interior spaces often results in inadequate illuminance levels under certain circumstances, thereby disrupting proper circadian rhythms.
As detailed in Figure 4 and illustrated in Figure 11, two scenarios are analyzed for the nursery classrooms. The first scenario examines the peak of melatonin suppression, occurring at 11 a.m. local time (10 a.m. solar time), which corresponds to a circadian stimulus of 0.4. This value is approximately equivalent to an illuminance of 300 lx or higher, considering only daylight conditions. The second scenario focuses on the peak of melatonin secretion, observed at 2 p.m. local time (1 p.m. solar time), with a circadian stimulus value of 0.2, approximately equivalent to 100 lx or lower based on daylight spectra. This second scenario corresponds to the children’s rest time. Both scenarios are discussed in relation to the architectural design and boundary conditions of the nursery.
Given that the classrooms in the nursery are oriented toward the north—resulting in no direct solar incidence within the interior spaces, with most daylight originating from externally reflected components—optimal conditions for children’s rest occur only on cloudy days near the winter solstice, when most of the room is adequately illuminated. Under clear-sky conditions during the same period, the area suitable for children’s naps is limited to within 1.25 m from the back of the room, indicating suboptimal performance for rest time. Furthermore, when examining the peak of melatonin suppression (around 11 a.m. local time), the winter solstice fails to provide any zone capable of supporting adequate circadian entrainment.
During the equinoxes (21 March and 21 September), the area of the classroom suitable for children’s naps is confined to a zone far from the window, ranging between 1.25 and 2.00 m from the back of the room, depending on weather conditions. Consequently, most of the classroom does not provide adequate circadian entrainment during rest time, highlighting the need for architectural adaptations, such as slats or shading devices, to effectively reduce daylight. Furthermore, during the melatonin suppression period (at 11 a.m. local time, 10 a.m. solar time), it is not possible to achieve an illuminance level above 300 lx—except in the area near the window—necessitating reliance on the electric lighting system to stimulate children during their alert phase.
During the summer solstice, under the scenario of children’s rest, only the area farthest from the window—between 0.75 and 1.25 m from the back of the room—is suitable, regardless of weather conditions. This observation underscores the necessity of active shading systems, such as slats, blinds, or curtains, to optimize the functionality of the interior space during children’s nap times. In the scenario of melatonin suppression (at 11 a.m. local time, 10 a.m. solar time), only the area near the window provides sufficient stimulation for children’s circadian entrainment, particularly under overcast sky conditions, where the higher luminance of the cloud layer contrasts with the relatively lower luminance of a clear blue sky without direct solar incidence. Consequently, there is a strong dependence on the building’s electric lighting system, which must deliver not only functional task lighting but also an appropriate circadian stimulus. This entails modifying both the luminous flux and spectral characteristics to support a healthy chronobiological rhythm.

5. Conclusions

This study underscores the pressing need to improve indoor environmental conditions in childcare facilities to protect the health and development of young children. Hygrothermal monitoring revealed stable temperature (Ta) and relative humidity (RH) levels, largely falling within the recommended ranges for thermal comfort. The Predicted Mean Vote (PMV) predominantly stayed within acceptable limits, although occasionally indicated slight warmth, especially during the warmer periods of the campaign. Despite compliance with thermal comfort standards, this stability came at the expense of energy inefficiency, as the air conditioning system remained active even outside operational hours.
Air quality analysis revealed consistently high CO2 concentrations, often exceeding 1200 ppm and peaking at nearly 1900 ppm. These levels significantly surpass both the Spanish standard of 770 ppm and the stricter recommendation of 550 ppm for vulnerable occupants of UNE 171380:2024. The implications range from possible temporary learning difficulties to a significantly increased risk of airborne pathogen transmission, as demonstrated by an Attack Rate (AR) frequently exceeding 70% for SARS-CoV-2, used here as an example. Passive ventilation strategies, such as partial window openings, proved inadequate to address these issues, emphasizing the need for Controlled Mechanical Ventilation (CMV) systems. These systems can ensure consistent air exchange rates, reduce infection risks, and maintain thermal comfort without compromising energy efficiency.
As discussed in the preceding sections, the architectural design must be tailored to daylight conditions to ensure adequate circadian entrainment, achieved by providing the appropriate quantity and spectral quality of light. The analysis of the nursery design reveals that static architectural approaches, which fail to optimize daylight utilization in interior spaces, often lead to inadequate illuminance levels under specific conditions, thereby disrupting circadian rhythms.
This conclusion underscores the importance of incorporating active shading systems, such as slats, blinds, or curtains, to enhance the functionality of interior spaces during children’s nap times. These systems are essential to reducing illuminance levels below 100 lx during rest periods, promoting sufficient melatonin secretion. Additionally, during periods requiring stimulation, when melatonin suppression is necessary, a significant reliance on the building’s electric lighting system is evident. This system must not only provide functional task lighting but also deliver a suitable circadian stimulus, achieved through adjustments to both luminous flux and spectral composition, to support optimal chronobiological rhythms.
These findings suggest deficiencies in circadian lighting, further supporting the call for integrated design solutions that combine advanced ventilation, hygrothermal control, and lighting systems tailored to the specific needs of children in early development. These holistic strategies are critical for fostering safe, healthy, and supportive environments in childcare settings.
In future research, the investigation of the implementation of programmable daylight protections will be proposed, activated by time programmers and solar sensors. These protections could include blinds, shutters, or thick curtains. This innovative approach aims to optimize the circadian rhythm of children and staff by regulating exposure to daylight. By adjusting the levels of light entering the rooms, they can either stimulate or suppress melatonin production, thereby enhancing alertness during activity hours and promoting better sleep patterns in rest time. This study will explore the potential benefits of such systems in creating a healthier and more productive learning environment.

Author Contributions

Conceptualization, G.G.-M., F.R.-L., M.Á.C., I.A. and P.B.; methodology, G.G.-M., F.R.-L., M.Á.C., I.A. and P.B.; software, G.G.-M., F.R.-L., M.Á.C., I.A. and P.B.; validation, M.Á.C., G.G.-M., I.A. and P.B.; formal analysis, M.Á.C., G.G.-M., I.A. and P.B.; investigation, G.G.-M., F.R.-L. and I.A.; resources, M.Á.C., I.A., and P.B.; data curation, G.G.-M., F.R.-L., M.Á.C., I.A. and P.B.; writing—original draft preparation, G.G.-M., F.R.-L., M.Á.C., M.Á.C., I.A. and P.B.; writing—review and editing, G.G.-M., F.R.-L., M.Á.C., I.A. and P.B.; visualization, G.G.-M., F.R.-L. and I.A.; supervision, M.Á.C., I.A. and P.B.; project administration, M.Á.C., I.A. and P.B.; funding acquisition, M.Á.C., I.A. and P.B. All authors have read and agreed to the published version of the manuscript.

Funding

The outcomes of this study were financially supported through Grant GA-101057497, funded by Horizon Europe/EU, and Grant PID2023-151631OA-I00, funded by MICIU/AEI/10.13039/501100011033 and ERDF/EU.

Institutional Review Board Statement

Not applicable.

Informed Consent Statement

Not applicable.

Data Availability Statement

All data used in this work can be found in this document, including Appendix A and Appendix B.

Acknowledgments

The authors express their sincere appreciation to Blas-Lezo and the Aireamos Platform for providing valuable moral support. We would also like to extend our gratitude to the management team and staff of the “Nido del Paraguas” childcare center, affiliated with Universidad de Sevilla, for allowing us to conduct this study on their premises.

Conflicts of Interest

The authors declare no conflict of interest.

Appendix A

Appendix A includes weekly evolution graphs for Classroom 1 (from 14 March 2023 to 26 May 2023), providing detailed information on outdoor and indoor Ta and RH values as well as indoor CO2 concentrations. These graphs also indicate the periods during which the space was occupied.
Figure A1. Evolution of Ta, RH, and CO2 concentrations in classroom 1 during week 1.
Applsci 15 01217 g0a1
Figure A2. Evolution of Ta, RH, and CO2 concentrations in classroom 1 during week 2.
Applsci 15 01217 g0a2
Figure A3. Evolution of Ta, RH, and CO2 concentrations in classroom 1 during week 3.
Applsci 15 01217 g0a3
Figure A4. Evolution of Ta, RH, and CO2 concentrations in classroom 1 during week 4.
Applsci 15 01217 g0a4
Figure A5. Evolution of Ta, RH, and CO2 concentrations in classroom 1 during week 5.
Applsci 15 01217 g0a5
Figure A6. Evolution of Ta, RH, and CO2 concentrations in classroom 1 during week 6.
Applsci 15 01217 g0a6
Figure A7. Evolution of Ta, RH, and CO2 concentrations in classroom 1 during week 7.
Applsci 15 01217 g0a7
Figure A8. Evolution of Ta, RH, and CO2 concentrations in classroom 1 during week 8.
Applsci 15 01217 g0a8
Figure A9. Evolution of Ta, RH, and CO2 concentrations in classroom 1 during week 9.
Applsci 15 01217 g0a9
Figure A10. Evolution of Ta, RH, and CO2 concentrations in classroom 1 during week 10.
Applsci 15 01217 g0a10
Figure A11. Evolution of Ta, RH, and CO2 concentrations in classroom 1 during week 11.
Applsci 15 01217 g0a11

Appendix B

Appendix B includes weekly evolution graphs for Classroom 2 (from 14 March 2023 to 26 May 2023), providing detailed information on outdoor and indoor Ta and RH values as well as indoor CO2 concentrations. These graphs also indicate the periods during which the space was occupied.
Figure A12. Evolution of Ta, RH, and CO2 concentrations in classroom 2 during week 1.
Applsci 15 01217 g0a12
Figure A13. Evolution of Ta, RH, and CO2 concentrations in classroom 2 during week 2.
Applsci 15 01217 g0a13
Figure A14. Evolution of Ta, RH, and CO2 concentrations in classroom 2 during week 3.
Applsci 15 01217 g0a14
Figure A15. Evolution of Ta, RH, and CO2 concentrations in classroom 2 during week 4.
Applsci 15 01217 g0a15
Figure A16. Evolution of Ta, RH, and CO2 concentrations in classroom 2 during week 5.
Applsci 15 01217 g0a16
Figure A17. Evolution of Ta, RH, and CO2 concentrations in classroom 2 during week 6.
Applsci 15 01217 g0a17
Figure A18. Evolution of Ta, RH, and CO2 concentrations in classroom 2 during week 7.
Applsci 15 01217 g0a18
Figure A19. Evolution of Ta, RH, and CO2 concentrations in classroom 2 during week 8.
Applsci 15 01217 g0a19
Figure A20. Evolution of Ta, RH, and CO2 concentrations in classroom 2 during week 9.
Applsci 15 01217 g0a20
Figure A21. Evolution of Ta, RH, and CO2 concentrations in classroom 2 during week 10.
Applsci 15 01217 g0a21
Figure A22. Evolution of Ta, RH, and CO2 concentrations in classroom 2 during week 11.
Applsci 15 01217 g0a22

References

  1. Fernández-Agüera, J.; Campano, M.Á.; Domínguez-Amarillo, S.; Acosta, I.; Sendra, J.J. CO2 Concentration and Occupants’ Symptoms in Naturally Ventilated Schools in Mediterranean Climate. Buildings 2019, 9, 197. [Google Scholar] [CrossRef]
  2. Qian, H.; Miao, T.; Liu, L.; Zheng, X.; Luo, D.; Li, Y. Indoor Transmission of SARS-CoV-2. Indoor Air 2021, 31, 639–645. [Google Scholar] [CrossRef]
  3. Morawska, L.; Cao, J. Airborne Transmission of SARS-CoV-2: The World Should Face the Reality. Environ. Int. 2020, 139, 105730. [Google Scholar] [CrossRef] [PubMed]
  4. Wang, C.C.; Prather, K.A.; Sznitman, J.; Jimenez, J.L.; Lakdawala, S.S.; Tufekci, Z.; Marr, L.C. Airborne Transmission of Respiratory Viruses. Science 2021, 373, eabd9149. [Google Scholar] [CrossRef] [PubMed]
  5. Annesi-Maesano, I.; Hulin, M.; Lavaud, F.; Raherison, C.; Kopferschmitt, C.; De Blay, F.; Charpin, D.A.; Denis, C. Poor Air Quality in Classrooms Related to Asthma and Rhinitis in Primary Schoolchildren of the French 6 Cities Study. Thorax 2012, 67, 682–688. [Google Scholar] [CrossRef] [PubMed]
  6. Almeida, S.M.; Canha, N.; Silva, A.; Do Carmo Freitas, M.; Pegas, P.; Alves, C.; Evtyugina, M.; Pio, C.A. Children Exposure to Atmospheric Particles in Indoor of Lisbon Primary Schools. Atmos. Environ. 2011, 45, 7594–7599. [Google Scholar] [CrossRef]
  7. Ismail, I.F.; Adnan, A.I.Z.; Al-Mekhlafi, A.M.Q.; Mohamed, B.A.M.A.; Nasir, N.F.; Hariri, A.; Isa, N.M. Indoor Air Quality (IAQ) in Educational Institutions: A Review on Risks of Poor IAQ, Sampling Strategies, and Building-Related Health Symptoms. J. Saf. Health Ergon. 2020, 2, 1–9. [Google Scholar]
  8. Wolkoff, P.; Azuma, K.; Carrer, P. Health, Work Performance, and Risk of Infection in Office-like Environments: The Role of Indoor Temperature, Air Humidity, and Ventilation. Int. J. Hyg. Environ. Health 2021, 233, 113709. [Google Scholar] [CrossRef]
  9. ASHRAE Board of Directors. ASHRAE Position Document on Indoor Carbon Dioxide; ASHRAE Board of Directors: Peachtree Corners, GA, USA, 2022. [Google Scholar]
  10. Peng, Z.; Jimenez, J.L. Exhaled CO2 as a COVID-19 Infection Risk Proxy for Different Indoor Environments and Activities. Environ. Sci. Technol. Lett. 2021, 8, 392–397. [Google Scholar] [CrossRef]
  11. Fantozzi, F.; Lamberti, G.; Leccese, F.; Salvadori, G. Monitoring CO2 Concentration to Control the Infection Probability Due to Airborne Transmission in Naturally Ventilated University Classrooms. Arch. Sci. Rev. 2022, 65, 306–318. [Google Scholar] [CrossRef]
  12. Rodríguez, D.; Urbieta, I.R.; Velasco, Á.; Campano-Laborda, M.Á.; Jiménez, E. Assessment of Indoor Air Quality and Risk of COVID-19 Infection in Spanish Secondary School and University Classrooms. Build. Environ. 2022, 226, 109717. [Google Scholar] [CrossRef] [PubMed]
  13. Allen, J.G.; MacNaughton, P.; Satish, U.; Santanam, S.; Vallarino, J.; Spengler, J.D. Associations of Cognitive Function Scores with Carbon Dioxide, Ventilation, and Volatile Organic Compound Exposures in Office Workers: A Controlled Exposure Study of Green and Conventional Office Environments. Environ. Health Perspect. 2016, 124, 805–812. [Google Scholar] [CrossRef] [PubMed]
  14. Wargocki, P.; Wyon, D. The Effects of Moderately Raised Classroom Temperatures and Classroom Ventilation Rate on the Performance of Schoolwork by Children. HVAC&R Res. 2007, 13, 193–220. [Google Scholar] [CrossRef]
  15. Satish, U.; Mendell, M.J.; Shekhar, K.; Hotchi, T.; Sullivan, D. Is CO2 an Indoor Pollutant? Direct Effects of Low-to-Moderate CO2 Concentrations on Human Decision-Making Performance. Environ. Health Perspect. 2012, 120, 1671–1678. [Google Scholar] [CrossRef]
  16. Bakó-Biró, Z.; Clements-Croome, D.J.; Kochhar, N.; Awbi, H.B.; Williams, M.J. Ventilation Rates in Schools and Pupils’ Performance. Build. Environ. 2012, 48, 215–223. [Google Scholar] [CrossRef]
  17. Simoni, M.; Annesi-Maesano, I.; Sigsgaard, T.; Norback, D.; Wieslander, G.; Nystad, D.; Cancianie, M.; Sestini, P.; Viegi, G. School Air Quality Related to Dry Cough, Rhinitis and Nasal Patency in Children. Eur. Respir. J. 2010, 35, 742–749. [Google Scholar] [CrossRef]
  18. Wargocki, P.; Wyon, D.P.; Sundell, J.; Clausen, G.; Fanger, P.O. The Effects of Outdoor Air Supply Rate in an Office on Perceived Air Quality, Sick Building Syndrome (SBS) Symptoms and Productivity. Indoor Air 2001, 10, 222–236. [Google Scholar] [CrossRef]
  19. Burge, P.S. Sick Building Syndrome. Occup. Environ. Med. 2004, 61, 185–190. [Google Scholar] [CrossRef]
  20. Erdmann, C.A.; Apte, M.G. Mucous Membrane and Lower Respiratory Building Related Symptoms in Relation to Indoor Carbon Dioxide Concentrations in the 100-Building BASE Dataset. Indoor Air 2004, 14, 127–134. [Google Scholar] [CrossRef]
  21. Azuma, K.; Kagi, N.; Yanagi, U.; Osawa, H. Effects of Low-Level Inhalation Exposure to Carbon Dioxide in Indoor Environments: A Short Review on Human Health and Psychomotor Performance. Environ. Int. 2018, 121, 51–56. [Google Scholar] [CrossRef]
  22. Seppänen, O.A.; Fisk, W.J.; Mendell, M.J. Association of Ventilation Rates and CO2 Concentrations with Health and Other Responses in Commercial and Institutional Buildings. Indoor Air 1999, 9, 226–252. [Google Scholar] [CrossRef] [PubMed]
  23. Domínguez-Amarillo, S.; Fernández-Agüera, J.; González, M.M.; Cuerdo-Vilches, T. Overheating in Schools: Factors Determining Children’s Perceptions of Overall Comfort Indoors. Sustainability 2020, 12, 5772. [Google Scholar] [CrossRef]
  24. Campano, M.A. Confort Térmico y Eficiencia Energética en Espacios Con Alta Carga Interna Climatizados: Aplicación a Espacios Docentes No Universitarios en Andalucía. Doctoral Thesis, Universidad de Sevilla, Seville, Spain, 2015. [Google Scholar]
  25. Campano-Laborda, M.Á.; Domínguez-Amarillo, S.; Fernández-Agüera, J.; Acosta, I. Indoor Comfort and Symptomatology in Non-University Educational Buildings: Occupants’ Perception. Atmosphere 2020, 11, 357. [Google Scholar] [CrossRef]
  26. Haddrell, A.; Oswin, H.; Otero-Fernandez, M.; Robinson, J.F.; Cogan, T.; Alexander, R.; Mann, J.F.S.; Hill, D.; Finn, A.; Davidson, A.D.; et al. Ambient Carbon Dioxide Concentration Correlates with SARS-CoV-2 Aerostability and Infection Risk. Nat. Commun. 2024, 15, 3487. [Google Scholar] [CrossRef]
  27. Buonanno, G.; Morawska, L.; Stabile, L. Quantitative Assessment of the Risk of Airborne Transmission of SARS-CoV-2 Infection: Prospective and Retrospective Applications. Environ. Int. 2020, 145, 106112. [Google Scholar] [CrossRef]
  28. Buonanno, G.; Stabile, L.; Morawska, L. Estimation of Airborne Viral Emission: Quanta Emission Rate of SARS-CoV-2 for Infection Risk Assessment. Environ. Int. 2020, 141, 105794. [Google Scholar] [CrossRef]
  29. Peng, Z.; Rojas, A.L.P.; Kropff, E.; Bahnfleth, W.; Buonanno, G.; Dancer, S.J.; Kurnitski, J.; Li, Y.; Loomans, M.G.L.C.; Marr, L.C.; et al. Practical Indicators for Risk of Airborne Transmission in Shared Indoor Environments and Their Application to COVID-19 Outbreaks. Environ. Sci. Technol. 2022, 56, 1125–1137. [Google Scholar] [CrossRef]
  30. Lorthe, E.; Bellon, M.; Michielin, G.; Berthelot, J.; Zaballa, M.E.; Pennacchio, F.; Bekliz, M.; Laubscher, F.; Arefi, F.; Perez-Saez, J.; et al. Epidemiological, Virological and Serological Investigation into a SARS-CoV-2 Outbreak (Alpha Variant) in a Primary School: A Prospective Longitudinal Study. PLoS ONE 2022, 17, e0272663. [Google Scholar] [CrossRef]
  31. Lorthe, E.; Bellon, M.; Berthelot, J.; Michielin, G.; L’Huillier, A.G.; Posfay-Barbe, K.M.; Azman, A.S.; Guessous, I.; Maerkl, S.J.; Eckerle, I.; et al. A SARS-CoV-2 Omicron (B.1.1.529) Variant Outbreak in a Primary School in Geneva, Switzerland. Lancet 2022, 22, 767–768. [Google Scholar] [CrossRef]
  32. Božič, A.; Kanduč, M. Relative Humidity in Droplet and Airborne Transmission of Disease. J. Biol. Phys. 2021, 47, 1–29. [Google Scholar] [CrossRef]
  33. Raines, K.S.; Doniach, S.; Bhanot, G. The Transmission of SARS-CoV-2 Is Likely Comodulated by Temperature and by Relative Humidity. PLoS ONE 2021, 16, e0255212. [Google Scholar] [CrossRef] [PubMed]
  34. Ahlawat, A.; Wiedensohler, A.; Mishra, S.K. An Overview on the Role of Relative Humidity in Airborne Transmission of Sars-Cov-2 in Indoor Environments. Aerosol Air Qual. Res. 2020, 20, 1856–1861. [Google Scholar] [CrossRef]
  35. Aganovic, A.; Bi, Y.; Cao, G.; Drangsholt, F.; Kurnitski, J.; Wargocki, P. Estimating the Impact of Indoor Relative Humidity on SARS-CoV-2 Airborne Transmission Risk Using a New Modification of the Wells-Riley Model. Build. Environ. 2021, 205, 108278. [Google Scholar] [CrossRef] [PubMed]
  36. Campano, M.Á.; Fernández-Agüera, J.; Domínguez-Amarillo, S.; Acosta, I.; Sendra, J.J. Covid Riskairborne, a Tool to Test the Risk of Aerosol Transmission of SARS-CoV-2 under Different Scenarios: A Pre-School Classroom Case Study. In Proceedings of the 3rd International Conference on Comfort at the Extremes: Covid, Climate Change and Ventilation, Comfort at the Extremes, Edinburgh, UK, 5 September 2022; pp. 22–34. [Google Scholar]
  37. Westwood, E.; Smith, S.; Mann, D.; Pattinson, C.; Allan, A.; Staton, S. The Effects of Light in Children: A Systematic Review. J. Environ. Psychol. 2023, 89, 102062. [Google Scholar] [CrossRef]
  38. Wong, S.D.; Wright, K.P.; Spencer, R.L.; Vetter, C.; Hicks, L.M.; Jenni, O.G.; LeBourgeois, M.K. Development of the Circadian System in Early Life: Maternal and Environmental Factors. J. Physiol. Anthr. 2022, 41, 22. [Google Scholar] [CrossRef]
  39. Ángeles-Castellanos, M.; Vázquez Ruiz, S.; Palma, M.; Ubaldo, L.; Cervantes, G.; Rojas-Granados, A.; Escobar, C. Development of Biological Rhythms in the Newborn Child. Rev. Fac. Med. (México) 2023, 56, 26–35. [Google Scholar]
  40. Akacem, L.D.; Wright, K.P.; LeBourgeois, M.K. Sensitivity of the Circadian System to Evening Bright Light in Preschool-Age Children. Physiol. Rep. 2018, 6, e13617. [Google Scholar] [CrossRef]
  41. Medic, G.; Wille, M.; Hemels, M. Short- and Long-Term Health Consequences of Sleep Disruption. Nat. Sci. Sleep 2017, 9, 151–161. [Google Scholar] [CrossRef]
  42. Figueiro, M.G.; Pedler, D. Cardiovascular Disease and Lifestyle Choices: Spotlight on Circadian Rhythms and Sleep. Prog. Cardiovasc. Dis. 2023, 77, 70–77. [Google Scholar] [CrossRef]
  43. LeBourgeois, M.K.; Hartstein, L.E.; Wong, S.D.; Ricker, A.A. Optimal Sleep and Circadian Habits in Infants and Children. In Encyclopedia of Sleep and Circadian Rhythms; Elsevier: Amsterdam, The Netherlands, 2023; pp. 102–109. [Google Scholar]
  44. Pauley, S.M. Lighting for the Human Circadian Clock: Recent Research Indicates That Lighting Has Become a Public Health Issue. Med. Hypotheses 2004, 63, 588–596. [Google Scholar] [CrossRef]
  45. Rea, M.S.; Figueiro, M.G.; Bierman, A.; Bullough, J.D. Circadian Light. J. Circadian Rhythm. 2010, 8, 2. [Google Scholar] [CrossRef] [PubMed]
  46. Gradisar, M.; Dohnt, H.; Gardner, G.; Paine, S.; Starkey, K.; Menne, A.; Slater, A.; Wright, H.; Hudson, J.L.; Weaver, E.; et al. A Randomized Controlled Trial of Cognitive-Behavior Therapy Plus Bright Light Therapy for Adolescent Delayed Sleep Phase Disorder. Sleep 2011, 34, 1671–1680. [Google Scholar] [CrossRef]
  47. Rodríguez, P.; Campano, M.A.; Domníguez-Amarillo, S.; Acosta, I.J. Optimization of Window Design in Hospital Rooms for Effective Access to Daylight. E3S Web of Conferences 2024, 487, 02002. [Google Scholar] [CrossRef]
  48. Logan, R.W.; McClung, C.A. Rhythms of Life: Circadian Disruption and Brain Disorders across the Lifespan. Nat. Rev. Neurosci. 2019, 20, 49–65. [Google Scholar] [CrossRef]
  49. Miike, T.; Oniki, K.; Toyoura, M.; Tonooka, S.; Tajima, S.; Kinoshita, J.; Saruwatari, J.; Konishi, Y. Disruption of Circadian Sleep/Wake Rhythms in Infants May Herald Future Development of Autism Spectrum Disorder. Clocks Sleep 2024, 6, 170–182. [Google Scholar] [CrossRef]
  50. Martinez-Cayuelas, E.; Gavela-Pérez, T.; Rodrigo-Moreno, M.; Losada-Del Pozo, R.; Moreno-Vinues, B.; Garces, C.; Soriano-Guillén, L. Sleep Problems, Circadian Rhythms, and Their Relation to Behavioral Difficulties in Children and Adolescents with Autism Spectrum Disorder. J. Autism Dev. Disord. 2024, 54, 1712–1726. [Google Scholar] [CrossRef]
  51. Bullough, J.D.; Rea, M.S.; Figueiro, M.G. Of Mice and Women: Light as a Circadian Stimulus in Breast Cancer Research. Cancer Causes Control 2006, 17, 375–383. [Google Scholar] [CrossRef]
  52. Wong, I.L. A Review of Daylighting Design and Implementation in Buildings. Renew. Sustain. Energy Rev. 2017, 74, 959–968. [Google Scholar] [CrossRef]
  53. Ghisi, E.; Tinker, J.A. An Ideal Window Area Concept for Energy Efficient Integration of Daylight and Artificial Light in Buildings. Build. Environ. 2005, 40, 51–61. [Google Scholar] [CrossRef]
  54. Reinhart, C.F.; Mardaljevic, J.; Rogers, Z. Dynamic Daylight Performance Metrics for Sustainable Building Design. LEUKOS-J. Illum. Eng. Soc. N. Am. 2006, 3, 7–31. [Google Scholar] [CrossRef]
  55. Acosta, I.; Leslie, R.P.; Figueiro, M.G. Analysis of Circadian Stimulus Allowed by Daylighting in Hospital Rooms. Light. Res. Technol. 2017, 49, 49–61. [Google Scholar] [CrossRef]
  56. Acosta, I.; Campano, M.Á.; Leslie, R.; Radetsky, L. Daylighting Design for Healthy Environments: Analysis of Educational Spaces for Optimal Circadian Stimulus. Sol. Energy 2019, 193, 584–596. [Google Scholar] [CrossRef]
  57. Campano, M.Á.; García-Martín, G.; Acosta, I.; Bustamante, P. Designing Intensive Care Unit Windows in a Mediterranean Climate: Efficiency, Daylighting, and Circadian Response. Appl. Sci. 2024, 14, 9798. [Google Scholar] [CrossRef]
  58. Sendra Salas, J.J.; Acosta García, I.J.; Domínguez Amarillo, S. Luz, Salud y Bienestar En La Arquitectura Hospitalaria: La Iluminación Biodinámica Para Fomentar La Regulación Del Ritmo Circadiano. In Inhabiting Hospitals: Welfare Beyond Comfort. New Trends in Healthcare Design; Chías Navarro, P., Abad Balboa, T., Eds.; Editorial Universidad de Alcalá: Alcalá de Henares, Spain, 2021; pp. 112–127. ISBN 9788418254307. [Google Scholar]
  59. Figueiro, M.G.; Steverson, B.; Heerwagen, J.; Kampschroer, K.; Hunter, C.M.; Gonzales, K.; Plitnick, B.; Rea, M.S. The Impact of Daytime Light Exposures on Sleep and Mood in Office Workers. Sleep Health 2017, 3, 204–215. [Google Scholar] [CrossRef]
  60. Jalali, M.S.; Jones, J.R.; Tural, E.; Gibbons, R.B. Human-Centric Lighting Design: A Framework for Supporting Healthy Circadian Rhythm Grounded in Established Knowledge in Interior Spaces. Buildings 2024, 14, 1125. [Google Scholar] [CrossRef]
  61. BOE-A-2006-5515; Ministerio de Fomento del Gobierno de España Real Decreto 314/2006, de 17 de Marzo, Por El Que Se Aprueba El Código Técnico de La Edificación. Ministerio de Fomento del Gobierno de España: Madrid, Spain, 2006.
  62. Ministerio de la Presidencia del Gobierno de España. Ministerio de la Presidencia del Gobierno de España Real Decreto 1027/2007, de 20 de Julio, Por El Que Se Aprueba El Reglamento de Instalaciones Térmicas En Los Edificios. In BOE no 207, 2007 29th August; Ministerio de la Presidencia del Gobierno de España: Madrid, Spain, 2021; pp. 35931–35984. [Google Scholar]
  63. Ministerio de la Presidencia del Gobierno de España. Gobierno de España Real Decreto 1826/2009, de 11 de Diciembre, Por El Que Se Modifica El Reglamento de Instalaciones Térmicas En Los Edificios, Aprobado Por El Real Decreto 1027/2007. In Boletín Oficial del Estado; Ministerio de la Presidencia del Gobierno de España: Madrid, Spain, 2009; Volume 298, pp. 104924–104927. [Google Scholar]
  64. Ministerio de la Presidencia, Relaciones con las Cortes y Memoria Democrática del Gobierno de España. Real Decreto 178/2021, de 23 de Marzo, Por El Que Se Modifica El Real Decreto 1027/2007, De 20 De Julio, Por El Que Se Aprueba El Reglamento de Instalaciones Térmicas En Los Edificios. In BOE no 71, 2021 24th March; Ministerio, Relaciones con las Cortes y Memoria Democrática de la Presidencia del Gobierno de España: Madrid, Spain, 2021; pp. 33748–33793. ISBN 8428332320. [Google Scholar]
  65. Fanger, P. Thermal Comfort: Analysis and Applications in Environmental Engineering; Copenhagen Danish Technical Press: Copenhagen, Denmark, 1970. [Google Scholar]
  66. ISO 7730:2005; Ergonomics of the Thermal Environment—Analytical Determination and Interpretation of Thermal Comfort Using Calculation of the PMV and PPD Indices and Local Thermal Comfort Criteria. International Organization for Standardization: Geneva, Switzerland, 2005.
  67. Campano, M.Á.; Domínguez-Amarillo, S.; Fernández-Agüera, J.; Sendra, J.J. Thermal Perception in Mild Climate: Adaptive Thermal Models for Schools. Sustainability 2019, 11, 3948. [Google Scholar] [CrossRef]
  68. Guedes, M.C.; Matias, L.; Santos, C.P. Thermal Comfort Criteria and Building Design: Field Work in Portugal. Renew. Energy 2009, 34, 2357–2361. [Google Scholar] [CrossRef]
  69. Matias, L. Desenvolvimento de um Modelo Adaptativo Para Definição das Condições de Conforto Térmico em Portugal; Universidade Técnica de Lisboa: Lisboa, Portugal, 2010. [Google Scholar]
  70. Du Bois, D.; Du Bois, E.F. A Formula to Estimate the Approximate Surface Area If Height and Weight Be Known. 1916. Nutrition 1989, 5, 303–311. [Google Scholar]
  71. ISO 8996:2021; Ergonomics of the Thermal Environment–Determination of Metabolic Rate. International Organization for Standardization: Geneva, Switzerland, 2021.
  72. Campano-Laborda, M.Á.; Domínguez-Amarillo, S.; Acosta García, I.; Fernández-Agüera, J.J.; Bustamante Rojas, P.; Sendra Salas, J.J.; Jiménez Palacios, J.L.; Velarde Rodríguez, J.D.; Acosta García, I.; Bustamante Rojas, P.; et al. COVID Risk Airborne. Available online: www.covidairbornerisk.com (accessed on 15 December 2021).
  73. Rudnick, S.N.; Milton, D.K. Risk of Indoor Airborne Infection Transmission Estimated from Carbon Dioxide Concentration. Indoor Air 2003, 13, 237–245. [Google Scholar] [CrossRef]
  74. Morawska, L.; Johnson, G.R.; Ristovski, Z.D.; Hargreaves, M.; Mengersen, K.; Corbett, S.; Chao, C.Y.H.; Li, Y.; Katoshevski, D. Size Distribution and Sites of Origin of Droplets Expelled from the Human Respiratory Tract during Expiratory Activities. J. Aerosol Sci. 2009, 40, 256–269. [Google Scholar] [CrossRef]
  75. Lyngse, F.P.; Kirkeby, C.T.; Denwood, M.; Christiansen, L.E.; Mølbak, K.; Møller, C.H.; Skov, R.L.; Krause, T.G.; Rasmussen, M.; Sieber, R.N.; et al. Household Transmission of SARS-CoV-2 Omicron Variant of Concern Subvariants BA.1 and BA.2 in Denmark. Nat. Commun. 2022, 13, 5760. [Google Scholar] [CrossRef] [PubMed]
  76. Du, Z.; Hong, H.; Wang, S.; Ma, L.; Liu, C.; Bai, Y.; Adam, D.C.; Tian, L.; Wang, L.; Lau, E.H.Y.; et al. Reproduction Number of the Omicron Variant Triples That of the Delta Variant. Viruses 2022, 14, 4–8. [Google Scholar] [CrossRef] [PubMed]
  77. Campano-Laborda, M.Á.; Jiménez, J.-L.; Fernández-Agüera, J.; Bustamante, P. Estimación Del Riesgo Relativo de Transmisión de Enfermedades Aéreas Mediante El Modelo de Wells-Riley. In Calidad del Aire en los Edificios Para el Bienestar: Estrategias de Aplicación Práctica; Campano, M.Á., Fernández-Agüera, J., Sendra, J.J., Eds.; Octaedro: Madrid, Spain, 2023; p. 180. ISBN 978-84-19506-74-0. [Google Scholar]
  78. Brainard, G.C.; Hanifin, J.P.; Greeson, J.M.; Byrne, B.; Glickman, G.; Gerner, E.; Rollag, M.D. Action Spectrum for Melatonin Regulation in Humans: Evidence for a Novel Circadian Photoreceptor. J. Neurosci. 2001, 21, 6405–6412. [Google Scholar] [CrossRef]
  79. St Hilaire, M.A.; Ámundadóttir, M.L.; Rahman, S.A.; Rajaratnam, S.M.W.; Rüger, M.; Brainard, G.C.; Czeisler, C.A.; Andersen, M.; Gooley, J.J.; Lockley, S.W. The Spectral Sensitivity of Human Circadian Phase Resetting and Melatonin Suppression to Light Changes Dynamically with Light Duration. Proc. Natl. Acad. Sci. USA 2022, 119, e2205301119. [Google Scholar] [CrossRef]
  80. Microsoft Corporation Microsoft Excel (v. Office 365); Microsoft Corporation: Redmond (Washington), USA. 2024. Available online: https://www.office.com/ (accessed on 5 December 2023).
  81. Icahn School of Medicine at Mount Sinai. Light and Health Research Center CS Calculator (2.0). Available online: https://cscalc.light-health.org/ (accessed on 28 October 2024).
  82. Rea, M.S.; Nagare, R.; Figueiro, M.G. Modeling Circadian Phototransduction: Retinal Neurophysiology and Neuroanatomy. Front. Neurosci. 2021, 14, 615305. [Google Scholar] [CrossRef]
  83. Rea, M.S.; Nagare, R.; Figueiro, M.G. Modeling Circadian Phototransduction: Quantitative Predictions of Psychophysical Data. Front. Neurosci. 2021, 15, 615322. [Google Scholar] [CrossRef]
  84. Rea, M.S.; Figueiro, M.G.; Bullough, J.D.; Bierman, A. A Model of Phototransduction by the Human Circadian System. Brain Res. Rev. 2005, 50, 213–228. [Google Scholar] [CrossRef]
  85. Darula, S.; Kittler, R. CIE General Sky Standard Defining Luminance Distributions. In Proceedings of the International Building Performance Simulation Association (IBPSA), Montreal, QC, Canada, 11–13 September 2002; pp. 11–13. [Google Scholar]
  86. ISO 15469:2004; Spatial Distribution of Daylight-CIE Standard General Sky. Commission Internationale de l’Éclairage, Ed.; International Organization for Standardization: Geneva, Switzerland, 2004.
  87. UNE 171380:2024; Medición en Continuo de CO2 en Interiores Para la Prevención en Salud y Mejora del Bienestar. AENOR-Asociación Española de Normalización y Certificación: Madrid, Spain, 2024.
  88. Muelas, Á.; Remacha, P.; Pina, A.; Tizné, E.; El-Kadmiri, S.; Ruiz, A.; Aranda, D.; Ballester, J. Analysis of Different Ventilation Strategies and CO2 Distribution in a Naturally Ventilated Classroom. Atmos. Environ. 2022, 283, 119176. [Google Scholar] [CrossRef]
  89. Muelas, Á.; Pina, A.; Remacha, P.; Tizné, E.; Aranda, D.; Ruiz, A.; Ballester, J. Guía Práctica de Ventilación en Aulas: Ya Tengo el Analizador de CO2… ¿Y Ahora Qué? LIFTEC/Univ. Zaragoza/CSIC: Zaragoza, Spain, 2020; Available online: https://drive.google.com/file/d/1o1qElJ7qijQA85eyvgn_TvyJlDgwirjf/view (accessed on 3 September 2024).
Figure 1. Childcare center’s floor plan: (A) Classroom A, designated for sleeping and daily activities of infants aged 4 to 12 months; (B) Classroom B, designated for daily activities of toddlers aged 1 to 2 years; (C) Classroom C, designated for sleeping and daily activities of toddlers aged 1 to 2 years.
Applsci 15 01217 g001
Figure 2. (a) Classrooms A and B’s floor plan; (b) Section of classrooms A and B. AWAIR Omni sensor (Awair Inc., San Francisco, CA, USA) marked in blue.
Applsci 15 01217 g002
Figure 3. Resulting SPD according to different sky types (clear, intermediate, and overcast), considering the spectral reflections of the inner surfaces.
Applsci 15 01217 g003
Figure 4. Circadian stimulus according to illuminance values and the resulting SPDs.
Applsci 15 01217 g004
Figure 5. Location of the measuring points during the monitoring campaign: (a) ceiling; (b) floor; (c) glass transmissivity; (d) inner partition (linoleum); (e) inner partition (plaster). The green cross has been used to indicate the points in which the PCE-CSM 8 Spectrophotometer (400 to 700 nm, accuracy of ΔE·ab 0.2) by PCE Ibérica S.L, Spain has been used. The blue arrow indicates the point and direction towards which the L-100 Lux Meter by PCE Ibérica S.L, Spain (0.1 lx to 3000 lx/10 lx to 300 klx, accuracy of ≤2.5% ±1 LSB) was employed to determine the glass transmissivity of the windows.
Applsci 15 01217 g005
Figure 6. Location of the longitudinal array of calculating points of the virtual model, each point being shown as an X. For each line an arrow is included indicating their vertical orientation toward the ceiling. The central array of points is shown in red while the one positioned towards the right jam is displayed in orange.
Applsci 15 01217 g006
Figure 7. Graphical analysis of the evolution of Ta, RH, and PMV during 1–5 May 2023 in Classroom A.
Applsci 15 01217 g007
Figure 8. Graphical analysis of the evolution of CO2 during 16–18 May 2023, Classroom A.
Applsci 15 01217 g008
Figure 9. Graphical comparison of percentage of time during which Classroom A exceeds the limits established by Spanish regulations in weeks 8, 10, and 11. Green indicates the percentage of time spent below 770 ppm (IDA 1-RITE), yellow represents the time exceeding 770 ppm, and red shows the time exceeding 1220 ppm.
Applsci 15 01217 g009
Figure 10. Graphical comparison of the correlation between the Attack Rate and the CO2 concentrations in classroom 1. The standard deviation for all the CO2 measurements registered during the monitoring campaign is shown as a pink surface. Additionally, the green cross indicates the specific Attack Rate value for the threshold in which it appears (UNE, Air extractor, RITE) at the corresponding CO2 value.
Applsci 15 01217 g010
Figure 11. Illuminance results for the solstices and equinoxes at 10:00 in red and 13:00 in green (solar time), calculated under sky types 1 (overcast) and 12 (clear). Pale blue areas represent zones below 100 lx for 10:00 and dark blue areas show the same illuminance interval for 13:00. Areas left in white represent zones above 100 lux both at 10:00 and 13:00.
Applsci 15 01217 g011
Table 1. Boundary conditions for the risk assessment of the three scenarios with Omicron BA.2.
Exhalation of Infectious OccupantInhalation of Susceptible Occupant
ScenarioActivityERq—85th Percentile
(q/h)
ActivityInhaled Flow Rate (m3/h)
Case 1Resting, oral breathing41.4 (1 year-old)Resting0.28
Case 2Resting, speaking194.7 (1 year-old)Resting0.28
Case 3Resting, speaking loudly1255.4 (1 year-old)Resting0.28
Disclaimer/Publisher’s Note: The statements, opinions and data contained in all publications are solely those of the individual author(s) and contributor(s) and not of MDPI and/or the editor(s). MDPI and/or the editor(s) disclaim responsibility for any injury to people or property resulting from any ideas, methods, instructions or products referred to in the content.

