Article

Enhancing Colony Detection of Microorganisms in Agar Dishes Using SAM-Based Synthetic Data Augmentation in Low-Data Scenarios

Research and Transfer Center CeMOS, Mannheim University of Applied Sciences, 68163 Mannheim, Germany
*
Author to whom correspondence should be addressed.
Appl. Sci. 2025, 15(3), 1260; https://doi.org/10.3390/app15031260
Submission received: 19 December 2024 / Revised: 16 January 2025 / Accepted: 21 January 2025 / Published: 26 January 2025
(This article belongs to the Special Issue Research on Machine Learning in Computer Vision)

Abstract

:

Featured Application

This work introduces a data augmentation strategy leveraging synthetic images to automate microbial colony detection for hygiene monitoring, providing efficient and accurate analysis of agar dishes while minimizing the need for large real-world datasets.

Abstract

In many medical and pharmaceutical processes, continuous hygiene monitoring relies on manual detection of microorganisms in agar dishes by skilled personnel. While deep learning offers the potential for automating this task, it often faces limitations due to insufficient training data, a common issue in colony detection. To address this, we propose a simple yet efficient SAM-based pipeline for Copy-Paste data augmentation to enhance detection performance, even with limited data. This paper explores a method where annotated microbial colonies from real images were copied and pasted into empty agar dish images to create new synthetic samples. These new samples inherited the annotations of the colonies inserted into them so that no further labeling was required. The resulting synthetic datasets were used to train a YOLOv8 detection model, which was then fine-tuned on just 10 to 1000 real images. The best fine-tuned model, trained on only 1000 real images, achieved an mAP of 60.6 , while a base model trained on 5241 real images achieved 64.9. Although far fewer real images were used, the fine-tuned model performed comparably well, demonstrating the effectiveness of the SAM-based Copy-Paste augmentation. This approach matches or even exceeds the performance of the current state of the art in synthetic data generation in colony detection and can be expanded to include more microbial species and agar dishes.

1. Introduction

Regulatory bodies like the European Medicines Agency (EMA) and the U.S. Food and Drug Administration (FDA) enforce strict guidelines for continuous hygiene monitoring in industries such as pharmaceuticals, cosmetics, and food production. As a result, a vast number of agar plates must be analyzed daily by skilled biologists to detect and count microbial colonies—a process that is not only time-consuming but also error-prone and costly.
Automating this task presents several challenges. One of the main difficulties is the need for high resolution images of the agar plates to accurately detect small colonies. Additionally, colonies often vary in size and shape and frequently overlap, which complicates the detection process. Several open-source tools [1,2] use classical computer vision methods, such as image filters and intensity-based variations, to distinguish colonies from the agar medium. However, these approaches rely heavily on manually crafted features, making them labor-intensive and difficult to use.
Neural networks, such as Faster R-CNN and Cascade R-CNN [3,4], offer a more promising solution for automated colony detection due to their higher accuracy and robustness compared to traditional methods. More recently, transformer networks [5,6] have surpassed convolutional models in various computer vision tasks, including colony detection [7,8]. For colony segmentation, techniques such as U-Net [9] and Mask R-CNN [10] are also used. While these deep learning models offer considerable advantages, they require large amounts of training data to reach state-of-the-art performance.
Despite their potential, the lack of sufficient training data poses a significant challenge in implementing deep learning for colony detection. One of the biggest obstacles to collecting additional training data is the high cost of expert personnel required for accurate data labeling, which is considerably more expensive than in other fields like autonomous driving. Another complication arises when new bacterial contaminants emerge that were not present during the network’s initial training, posing unknown challenges for the model.
To overcome the shortage of training data, traditional data augmentation techniques, such as image manipulation [11], are frequently employed. Additionally, generative models like GANs [12,13] are used to produce synthetic images that enlarge the dataset. However, the generation of synthetic data can sometimes introduce artifacts into the artificial images, which may affect the performance of the subsequent trained detection model.
In this work, we propose using a SAM-based Copy-Paste technique [14] as a straightforward yet effective data augmentation method for colony detection. The method is based on real colonies that are cut out of existing images using the Segment Anything Model (SAM) [15] and inserted into new, empty agar dish images. To avoid artifacts and increase data quality, quality assurance is carried out on the excised colonies. The proposed method increases the representation of rare colony instances in the dataset, expands the training dataset artificially, and introduces greater variability and diversity. This in turn helps the model to generalize more effectively across different scenarios.
To evaluate our method, we generated fully annotated datasets of synthetic agar dish images containing microbial colonies, which were then used to pre-train a neural network (NN) for colony detection. Subsequently, a brief fine-tuning to a small subset of real data was conducted. The performance of this NN was compared to a network trained on real images from the AGAR dataset [4] and the current state-of-the-art methods.

2. Related Works

2.1. Colony Detection and Segmentation

Interest in automated colony counting dates back to the late 1950s [16,17] and since then, several tools have been developed to support microorganism detection using traditional computer vision methods [1,2]. However, these tools often rely on handcrafted features, which limits their level of automation and still demands expert knowledge for effective colony detection, similar to manual counting methods.
More recently, machine learning-based techniques have become increasingly popular in medical applications, providing more advanced automation options. Researchers have explored convolutional neural networks (CNNs) for bacterial classification [18] and methods for foreground–background segmentation [19], enabling either classification or direct colony counting. Many approaches [9,20] have adapted U-Net architectures [21] for colony segmentation, while Mask-RCNN [22] has been leveraged for microorganism detection and segmentation in agar dishes [10,23].
Majchrowska et al. [4] introduced a patch-based method, dividing high-resolution images into smaller, overlapping sections to detect individual colonies using RCNN models [24,25], later merging the resulting bounding boxes. This method was extended by Pawłowski et al. [3], who applied synthetic image augmentation to train similar models on limited data.
However, most approaches focus on either low-resolution images or small image patches, which reduces the accuracy for detecting small colonies or increases computational requirements. By contrast, the AttnPAFPN framework [8] uses a transformer-enhanced version of the Path Aggregation Feature Pyramid Network (PAFPN) [26], allowing for accurate detection even in high-resolution images. With advanced backbones [7] and detection heads [25,27], AttnPAFPN delivers state-of-the-art performance in high-resolution colony detection benchmarks [4]. However, despite their potential, transformer-based architectures require large datasets due to their extensive parameters and lack of local inductive bias.

2.2. Addressing Data Scarcity in Medical Deep Learning Applications
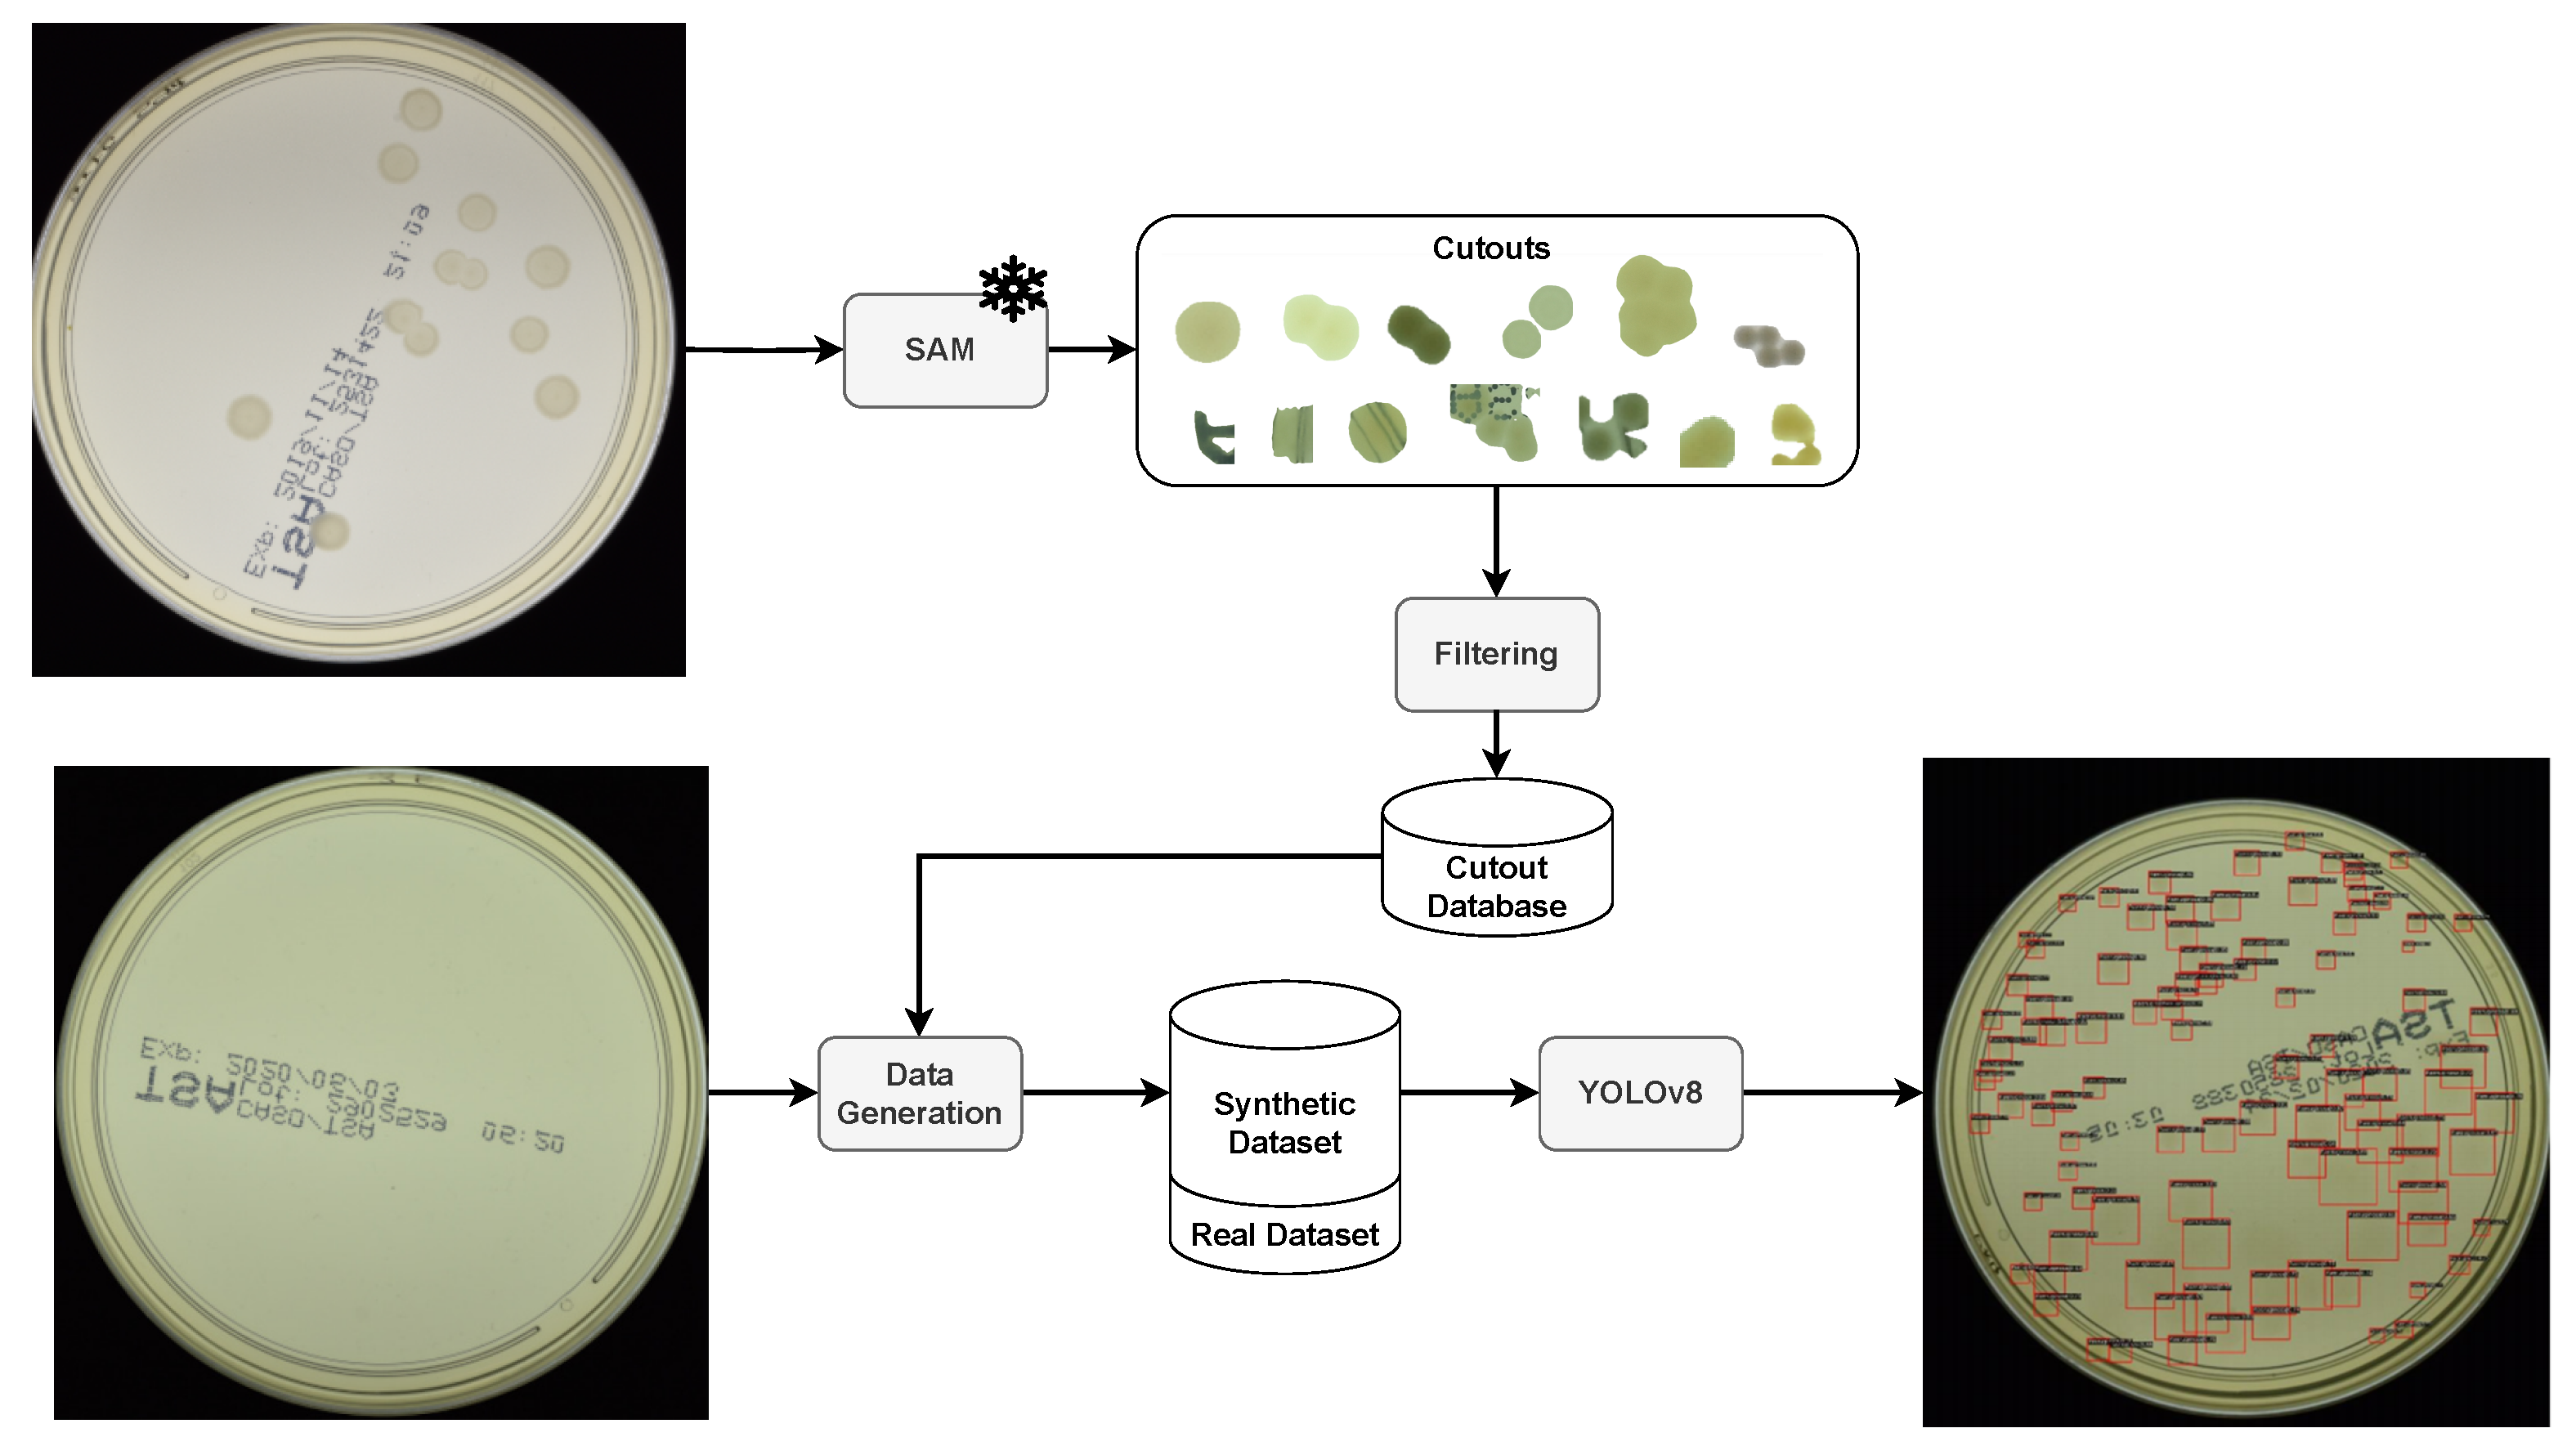
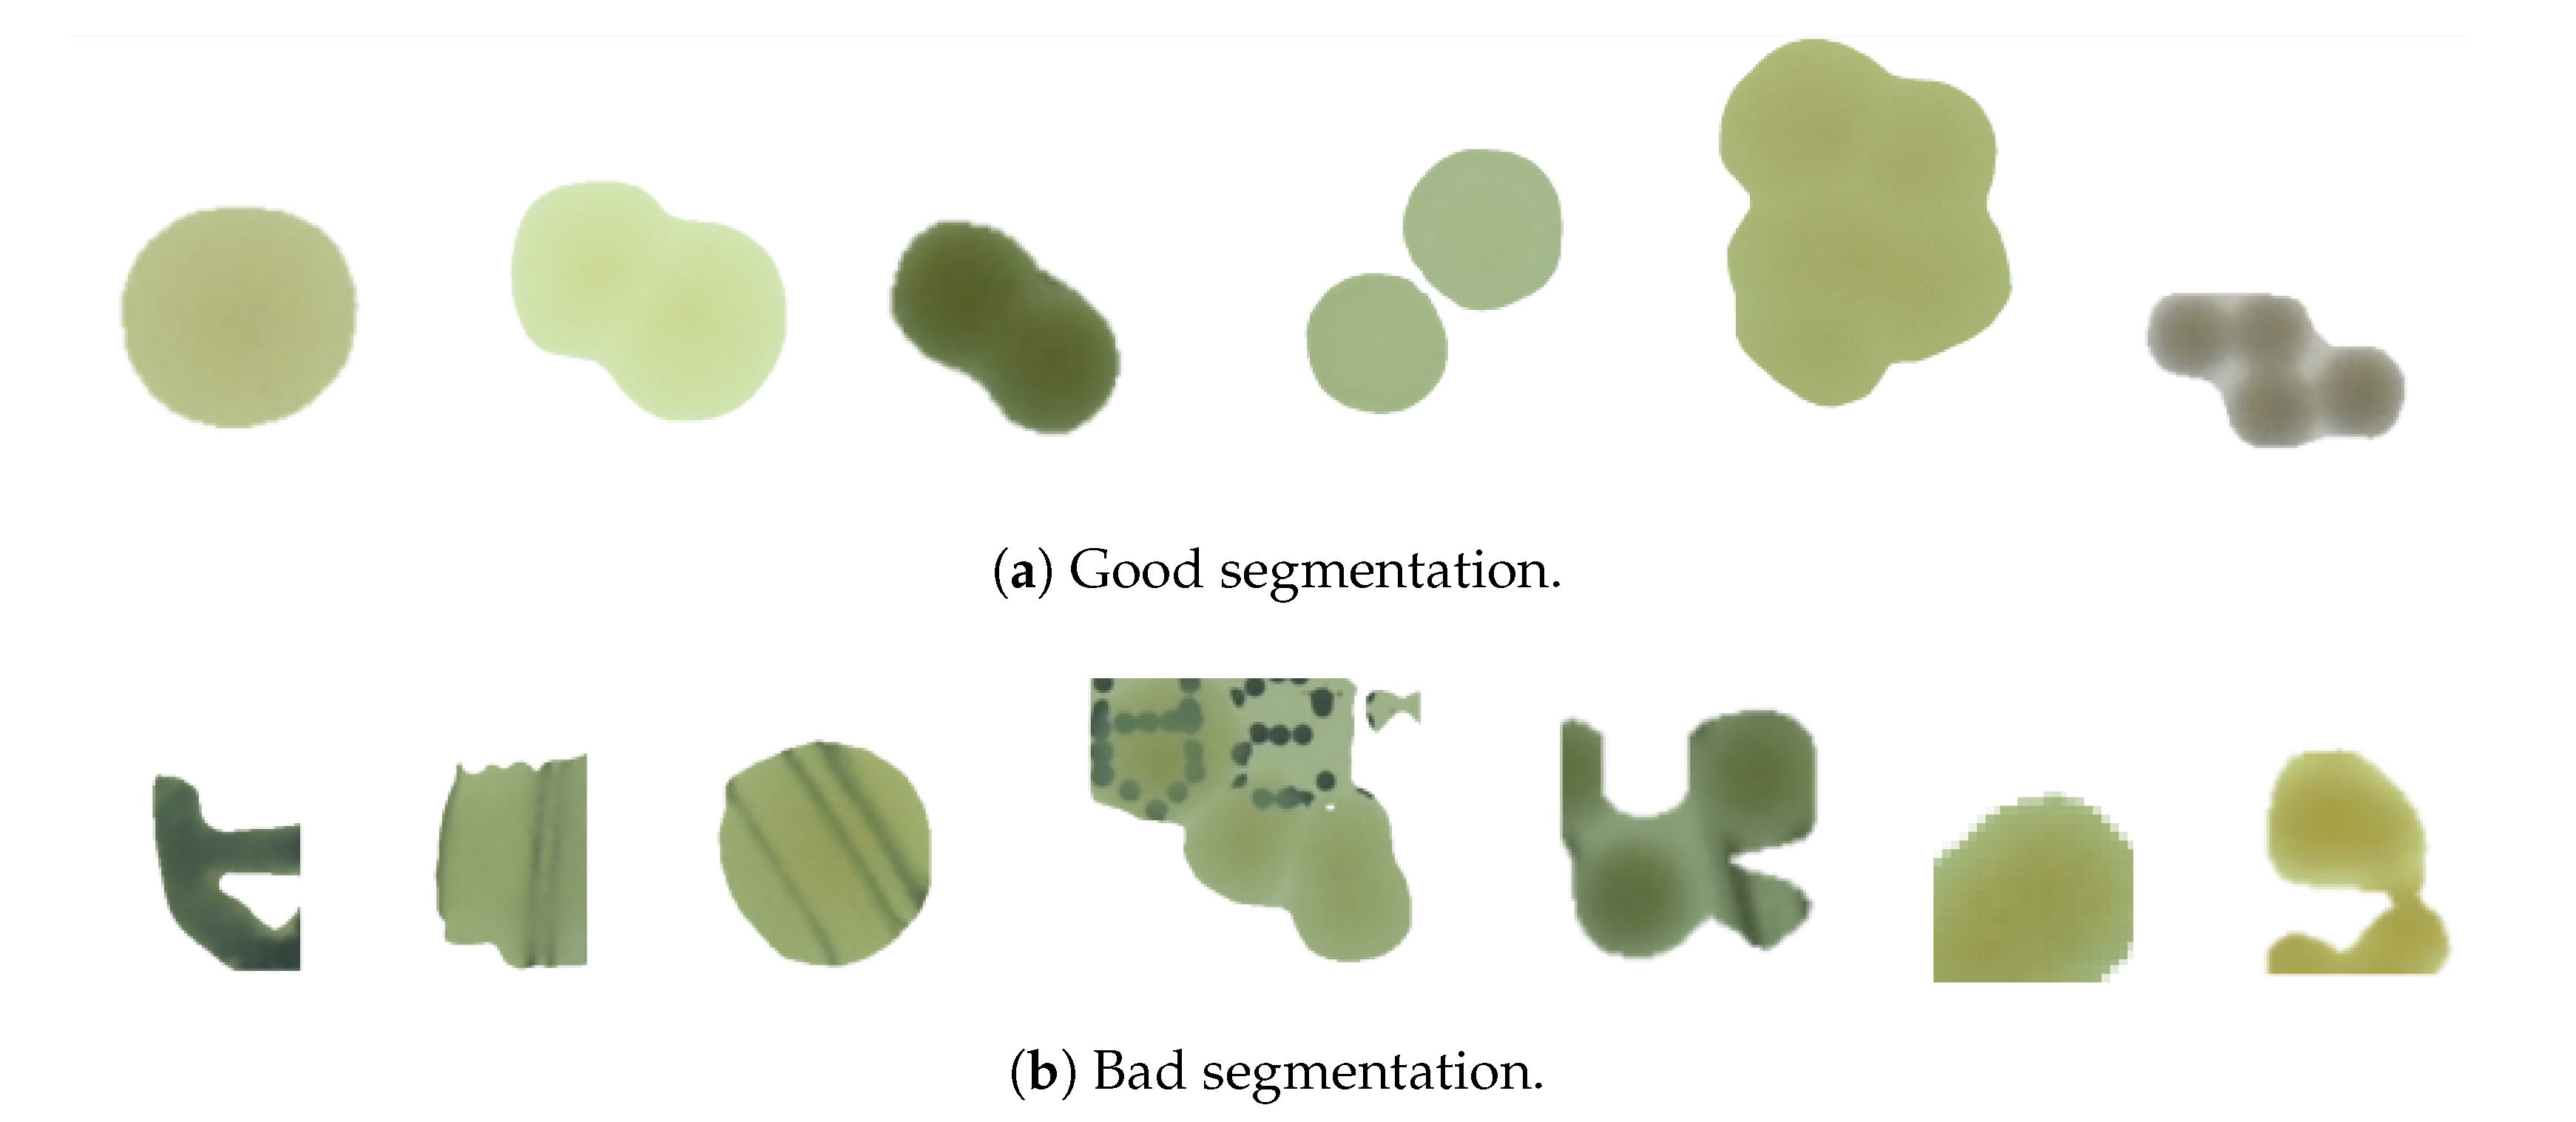
Training modern deep learning models increasingly requires large datasets, which are expensive to collect. Common strategies for handling limited training data rely on classical data augmentation techniques [11,28], including geometric transformations (e.g., flipping, rotation) and color adjustments (e.g., channel shuffling, contrast enhancement). Automated approaches, such as RandAugment [29] and AugMix [30], dynamically apply a wide range of augmentations in a controlled and randomized manner, optimizing the augmentation process without requiring manual tuning of individual transformations. Image mixing methods, such as Mixup [31], CutMix [32], and Mosaic Augmentation [33], increase data diversity by combining multiple images according to predefined rules, further boosting the robustness of the model. Ghiasi et al. [14] extend image-wise mixing by extracting individual objects from one image and inserting them into another, thereby specifically increasing the variability of object classes.
In addition to conventional data augmentation strategies, there is a growing interest in synthetic data generation across various domains, such as natural image processing [34,35] or autonomous driving [36]. In the medical field, numerous studies leverage generative adversarial networks (GANs) [37] to generate synthetic data for various applications, such as breast cancer detection using synthetic X-ray images [38,39,40], and brain [13,41,42] and skin cancer [43,44] classification and segmentation. Recently, diffusion-based models have gained attention in the medical field, with the first methods developed for generating training data [34,45,46] for multiple tasks.
In the context of colony detection and segmentation, synthetic data have been leveraged to alleviate the shortage of labeled training data. For example, Andreini et al. [12] used a GP-WGAN [47] to generate synthetic bacterial colony patches, which were then overlaid onto background images for binary segmentation. While this approach enhanced realism through style transfer, it was limited by its inability to distinguish between different colony types.
Similarly, Pawłowski et al. [3] utilized traditional computer vision techniques to segment colonies from real agar dish images, applying a Copy-Paste method to place colonies onto empty dishes. Afterwards, they performed a style transfer to generate more realistic images. Although this approach showed potential, it resulted in a lot of artifacts caused by inaccurate background textures and imprecise colony segmentation. Moreover, their method did not incorporate fine-tuning on real datasets, missing an opportunity for further model refinement.
In summary, existing methods for colony generation are limited by artifact-prone generated images and the absence of fine-tuning on real data to improve model performance. Scalability also remains a challenge, as approaches using GANs or style transfer require significant computing resources. Our proposed SAM-based [15] Copy-Paste approach addresses these gaps by significantly reducing artifacts, improving realism, and providing a more computationally efficient alternative. Unlike previous methods, our approach is easily scalable for generating large datasets while also incorporating fine-tuning on real data, thereby achieving superior detection accuracy and bridging critical gaps in both performance and efficiency.

3. Method

The aim of our work is a simple yet efficient SAM-based Copy-Paste data augmentation pipeline (see Figure 1) for the generation of synthetic training data for colony detection. The first step of the proposed pipeline involves segmenting and cutting out microbial colonies from real images to inpaint them onto new, empty agar dish images.
To isolate individual colonies, we use the Segment Anything Model (SAM) [15]. The SAM is provided with the bounding box coordinates from the dataset annotations and is prompted to segment the region of the image within each bounding box. To ensure accurate class assignments for the cutout colonies, the extracted colonies are automatically sorted based on background brightness, colony class, and the intensity and color of the cutout. Colonies with artifacts (as can be seen in Figure 2b), such as visible background textures or poor segmentations, are discarded to maintain the quality of samples used for inpainting.
For microbial clusters containing more than one colony, an overlap analysis is performed. The bounding boxes are processed sequentially, with each one checked for overlap with subsequent boxes. If overlap is detected, the overlapping boxes are merged into a single, larger bounding box. These new coordinates are then used to prompt SAM to segment the entire microbial cluster. The segmented clusters are sorted using the same criteria as the individual colonies to ensure consistency in quality.
To create a synthetic agar dish, several parameters are randomly selected to ensure variability. These include the type of the background B, the color intensity I, and the hue H of the dish. Based on this, pre-sorted cutouts c of the colonies are selected from all the cutouts C so that they perfectly match the selected background for a realistic appearance. Figure 3 (center) provides an example where the colony blends seamlessly with the background, in contrast to Figure 3 (right), where there is a clear mismatch. To highlight the importance of adjusting the colony from the agar dish, Figure 3 (left) displays a real image for comparison.
For each synthetic image, a random empty agar dish e is selected from a collection of multiple dishes E. In the real dataset [4], typically up to two microbial species are inoculated on a dish. Therefore, a microbial species class is chosen at random, with a 50% chance that a second random species will be added to each dish for generation. Next, the number of microbial colonies to be generated (N) is randomly selected from a range of 1 to 100. If more than 100 colonies are used for data generation, there is a risk that the agar dish will be overfilled and unrealistic results will be obtained because there is not enough space for larger colonies.
Microbial colony samples for pasting are randomly selected based on the color and intensity of the agar dish. Both the pseudo-annotations (bounding boxes) and the corresponding cutouts are used for further processing, with the bounding box dimensions matching the size of the cutout. For each microbial colony cutout c n , random coordinates are generated within the boundaries of the agar dish. Only coordinates that ensure no overlap with the bounding boxes of previously placed colonies are selected. The next step is to paste the colony cutout onto the empty agar dish at the chosen coordinates, applying the designated opacity level. This process is repeated for all selected cutouts, after which the final image with the colonies is saved, along with its corresponding annotation file. A visualization of the generation process is given in Algorithm 1. All information on our synthetic datasets is given in Section 4.
Algorithm 1 Synthetic Agar Dish Generation
1:Initialization
2:     B: List of different backgrounds
3:     I: List of color intensities of the colonies
4:     H: List of hues of the colonies
5:     Cl: List of colony classes
6:
7:Input:
8:     C: Pre-sorted colony cutouts
9:     E: Images of empty agar dishes
10:
11:for each synthetic image do:
12:     P = Randomly selected from [B, I, H, Cl]
13:     e = Randomly selected form E based on P
14:     N = Randomly select from range(1,100)
15:     for n in range(N) do:
16:          c n = randomly seceded from C based on P
17:          Find viable regions in e without overlap
18:          Create annotation (bounding box) for c n
19:     Save the final synthetic image
20:     Save the corresponding annotation file with bounding box information
21:
22:Output:
23:     Synthetic dataset with annotations

4. Results and Discussion

Our comprehensive evaluation is divided into various sections. Section 4.1 first provides a detailed overview of the data and metrics used for the experiments. Next, in Section 4.2, we conduct an extensive study to analyze the impact of our SAM-based Copy-Paste data generation method. Finally, in Section 4.3, we compare our results to the current state-of-the-art approaches in colony detection.

4.1. Dataset and Metrics

All experiments involving our simple yet efficient SAM-based Copy-Paste data generation were conducted using the publicly available AGAR dataset [4]. This dataset consists of high-resolution images (approximately 4000 × 4000 pixels) featuring five bacterial species, S. aureus, B. subtilis, P. aeruginosa, E. coli, and C. albicans, cultured on agar plates with two distinct background types (bright and dark). The dataset includes approximately 5241 training images and 1747 validation images. To evaluate our model on a limited number of real images, we further divided the dataset into a smaller subset of 1000 images for fine-tuning the neural network. To analyze the effect of varying dataset sizes for network fine-tuning, additional subsets containing {10, 25, 50, 75, 100, 200, 500} real images were also created.
For the evaluation of the colony detection tasks, we used mean Average Precision (mAP) across the ten standard IoU thresholds between 0.5 and 0.95, following the convention of the COCO Challenge [49] for object detection. Additionally, we report mAP at an IoU threshold of 0.5 (AP50), as precise localization is less critical in the context of colony detection. The key goal is to ensure all colonies are detected without any omission.

4.2. Data Generation Configuration

To evaluate the quality of the generated images, we establish two baseline models for comparison, both using the YOLOv8-Nano object detection model [48]. We train both models for 20 epochs on different subsets from the train set of the AGAR dataset, using an input size of 800 × 800 pixels. Furthermore, we utilized the comprehensive data augmentation pipeline developed by Jocher et al. [48] for training our models. This approach was essential for mitigating overfitting, particularly with limited data. The pipeline integrates RandAugment [29], applying a range of geometric transformations (horizontal flips, rotations, and translations) and color adjustments (HSV modifications), alongside Mosaic augmentation [33]. This augmentation strategy was consistently employed in all subsequent YOLOv8 trainings throughout this work.
The first baseline, trained on all 5241 images from the train set, achieved an AP50 of 93.7 and an mAP of 64.9 , considering only microbial species. For our second baseline, we trained YOLOv8 using a fine-tuning subset of only 1000 real images. This subset was later used to fine-tune models that were previously trained on various synthetic datasets. When trained exclusively on this smaller subset, the overall mAP dropped to 56.4 . In the later sections of this paper, we aim to mitigate this performance decrease by introducing synthetic data into the training process. All results of our baseline evaluation can be found in Table 1.

4.2.1. Ablation Study

In our first experiment, we evaluated different configurations of our data generation pipeline. In each configuration, we generated a synthetic dataset of 3000 images, which were then used to train YOLOv8-Nano. Every model was pre-trained for 20 epochs using the synthetic images with a resolution of 800 × 800 pixels. Training was capped at 20 epochs, as we observed no significant improvement in mean Average Precision (mAP) beyond this point. Extending the pre-training to 50 epochs, which doubled the training time, resulted in a 3.6 % decrease in AP50 and a 0.4 % decrease in mAP, suggesting overfitting to the dataset’s specific characteristics with prolonged training.
After pre-training the model on our generated dataset, we performed a brief fine-tuning on 1000 real images to achieve further improvements. All models were evaluated using the validation set provided in the AGAR dataset [4]. Table 2 offers an overview of the ablation studies conducted. Initially, our data generation was limited to synthetic images featuring a single colony per agar plate, without differentiating between colonies of the same class that appeared in different colors due to varying backgrounds. Each step in our ablation study is labeled with consecutive Roman numerals, with the corresponding adjustments and findings discussed in detail in the following sections. The final approach, resulting from these studies, is outlined in Section 3.
(I) Raw data: First, the detection model was trained using synthetic agar dish images directly generated from cutouts created by the SAM [15] without quality assurance. These cutouts were not filtered, resulting in many of them being poor representations of microbial colonies. For instance, some cutouts included artifacts such as agar dish lettering instead of actual colonies, while others captured colonies that were part of a cluster, causing unnatural edges and harsh lines where the colonies were cut apart, rather than realistic colony boundaries.
A direct comparison with our second baseline model, trained exclusively on the fine-tuning set of 1000 real images (see Table 1), demonstrates that even artifact-rich representations of colonies in generated images can enhance detection performance. By pre-training our model on additional Copy-Paste data before fine-tuning on real data, we were able to achieve an mAP of 58.9 and an AP50 of 91.2 , outperforming the baseline by + 2.5 and + 2.2 , respectively. However, the results were significantly below the baseline trained on the full train set of real images, with an AP50 of 93.7 and an mAP of 64.9 . Therefore, further refinement of the augmentation method is needed to improve it.
(II) No overlapping colonies: To improve the generated images, a number of cutouts of singular microbial colonies were manually selected. These cutouts featured realistic-looking colonies with minimal artifacts from the agar dish and mostly clear, well-defined edges. Based on these filtered colonies, we generated a synthetic dataset for pre-training.
As the generated images lacked overlapping colonies, the model could only learn the concept of colony overlap during the fine-tuning. Pre-training on this dataset, followed by fine-tuning, resulted in an AP50 of 90.6 and an mAP of 58.4 . These values were slightly lower than the model trained on raw SAM data. These results suggest that for optimal learning, the synthetic dataset must contain examples of overlapping microbial colonies, as these also occur in large numbers in real images.
(III) Pairs of overlapping colonies: To further improve the quality of the synthetic images, we included manually pre-selected pairs (clusters of two overlapping colonies) with only minimal artifacts in the generation process. Larger clusters are addressed in step (VI), but for now, we aim to assess the impact on detection accuracy when only two connected colonies are considered.
The model pre-trained on this dataset and subsequently fine-tuned achieved an AP50 of 91.9 and an mAP of 60.5 . This represents an improvement of + 1.3 and + 2.1 , respectively, compared to the fine-tuned model trained on raw SAM data. These results underscore the importance of incorporating overlapping microbial colonies in the augmentation process, although additional refinements are still needed for optimal performance.
(IV) Color differentiation: To enhance the realism of the synthetic images, microbial colonies were categorized based on intensity (dark, medium, light) and color (brown, green, yellow) to better match the appearance of the agar dish, making the images look more natural. At this stage, we still relied on the basic subdivision of agar plates with bright and dark backgrounds (see Section 4.1) provided by the original AGAR dataset. A more refined subdivision is introduced in step (VII).
To assess the impact of this visual refinement, a model was trained using the updated dataset. The new images depicted agar dishes containing either single colonies or colony pairs. These colonies were assigned to the two types of agar dishes according to color and intensity. This ensures that each dish features microbial colonies of a consistent color and intensity, improving visual coherence.
The pre-trained and fine-tuned model achieved an AP50 of 91.9 and an mAP of 60.1 , as shown in Table 2. These results indicate that incorporating color differentiation had no significant impact on the model’s performance. However, the visual enhancement resulting from color differentiation improves the appearance of the synthetic images.
(V) Two classes max: The next improvement to add to the augmentation method is to use at most two microbial species per agar dish. This reflects the real AGAR dataset [4], as at most two species of colonies were inoculated on each agar dish. The pre-trained and fine-tuned model (see Table 2) showed an AP50 of 92.1 and an mAP of 60.6 .
(VI) Big clusters of colonies: To further diversify the generated images, clusters of microbial colonies with more than two colonies are used for data generation. This experiment serves the purpose to see if bigger clusters of colonies are detected better if there are more training examples of bigger clusters.
The pre-trained and fine-tuned model (see Table 2) had an AP50 of 92.1 and an mAP of 60.6 , showing no improvement compared to the former fine-tuned model.
(VII) Dish color differentiation: To further improve the visual realism of the generated agar dishes, we also differentiated the colors of the agar dishes into specific color categories. While this adjustment was not expected to significantly improve the performance of the model, especially as the more informative experiment differentiating the colors of the microbial colonies only provided marginal benefits, it does help to make the synthetic images appear more realistic.
(VIII) Opacity 90%: To make the synthetic images look more realistic, the microbial colonies were given a certain amount of transparency in order to let the lettering and other artifacts of the agar dish shine through the colonies.
An experiment was conducted to see which transparency value saw the most improvement while training the neural network. For this, images were generated with a set transparency value for all colonies. Ten different values were tested at an interval of 10%, ranging from 10% to 100%. Figure 4 presents the mAP values for all the classes in the dataset following the fine-tuning of these pre-trained models with real images. The figure shows that a transparency value of 90% gives the best results.
Based on the findings from steps (I) to (VIII), the configuration of the best performing model was used in all further experiments.

4.2.2. Domain Adaption

The AGAR dataset comprises two types of agar dish images, featuring bright and dark backgrounds. To evaluate the augmentation method for domain adaptation, we generated two separate datasets, one containing only dark background images and the other containing only bright background images. For validation, we still used both backgrounds. For this purpose, we utilized the best-performing augmentation method discussed earlier for pre-training.
The model pre-trained and fine-tuned exclusively on images with dark backgrounds achieved an AP50 of 92.1 and an mAP of 60.6 , which was on par with our baseline trained on both colors (see Table 3). It is possible that this fine-tuned model overfitted to dark background images, as the validation set contained a higher number of such images, which may account for this improvement. In contrast, the model trained solely on bright background images achieved an AP50 of 90.6 and an mAP of 57.6 . These results were slightly lower than those of the model trained on mixed backgrounds and the model trained on dark backgrounds, which was likely due to the uneven distribution of background colors in the dataset, as mentioned earlier.

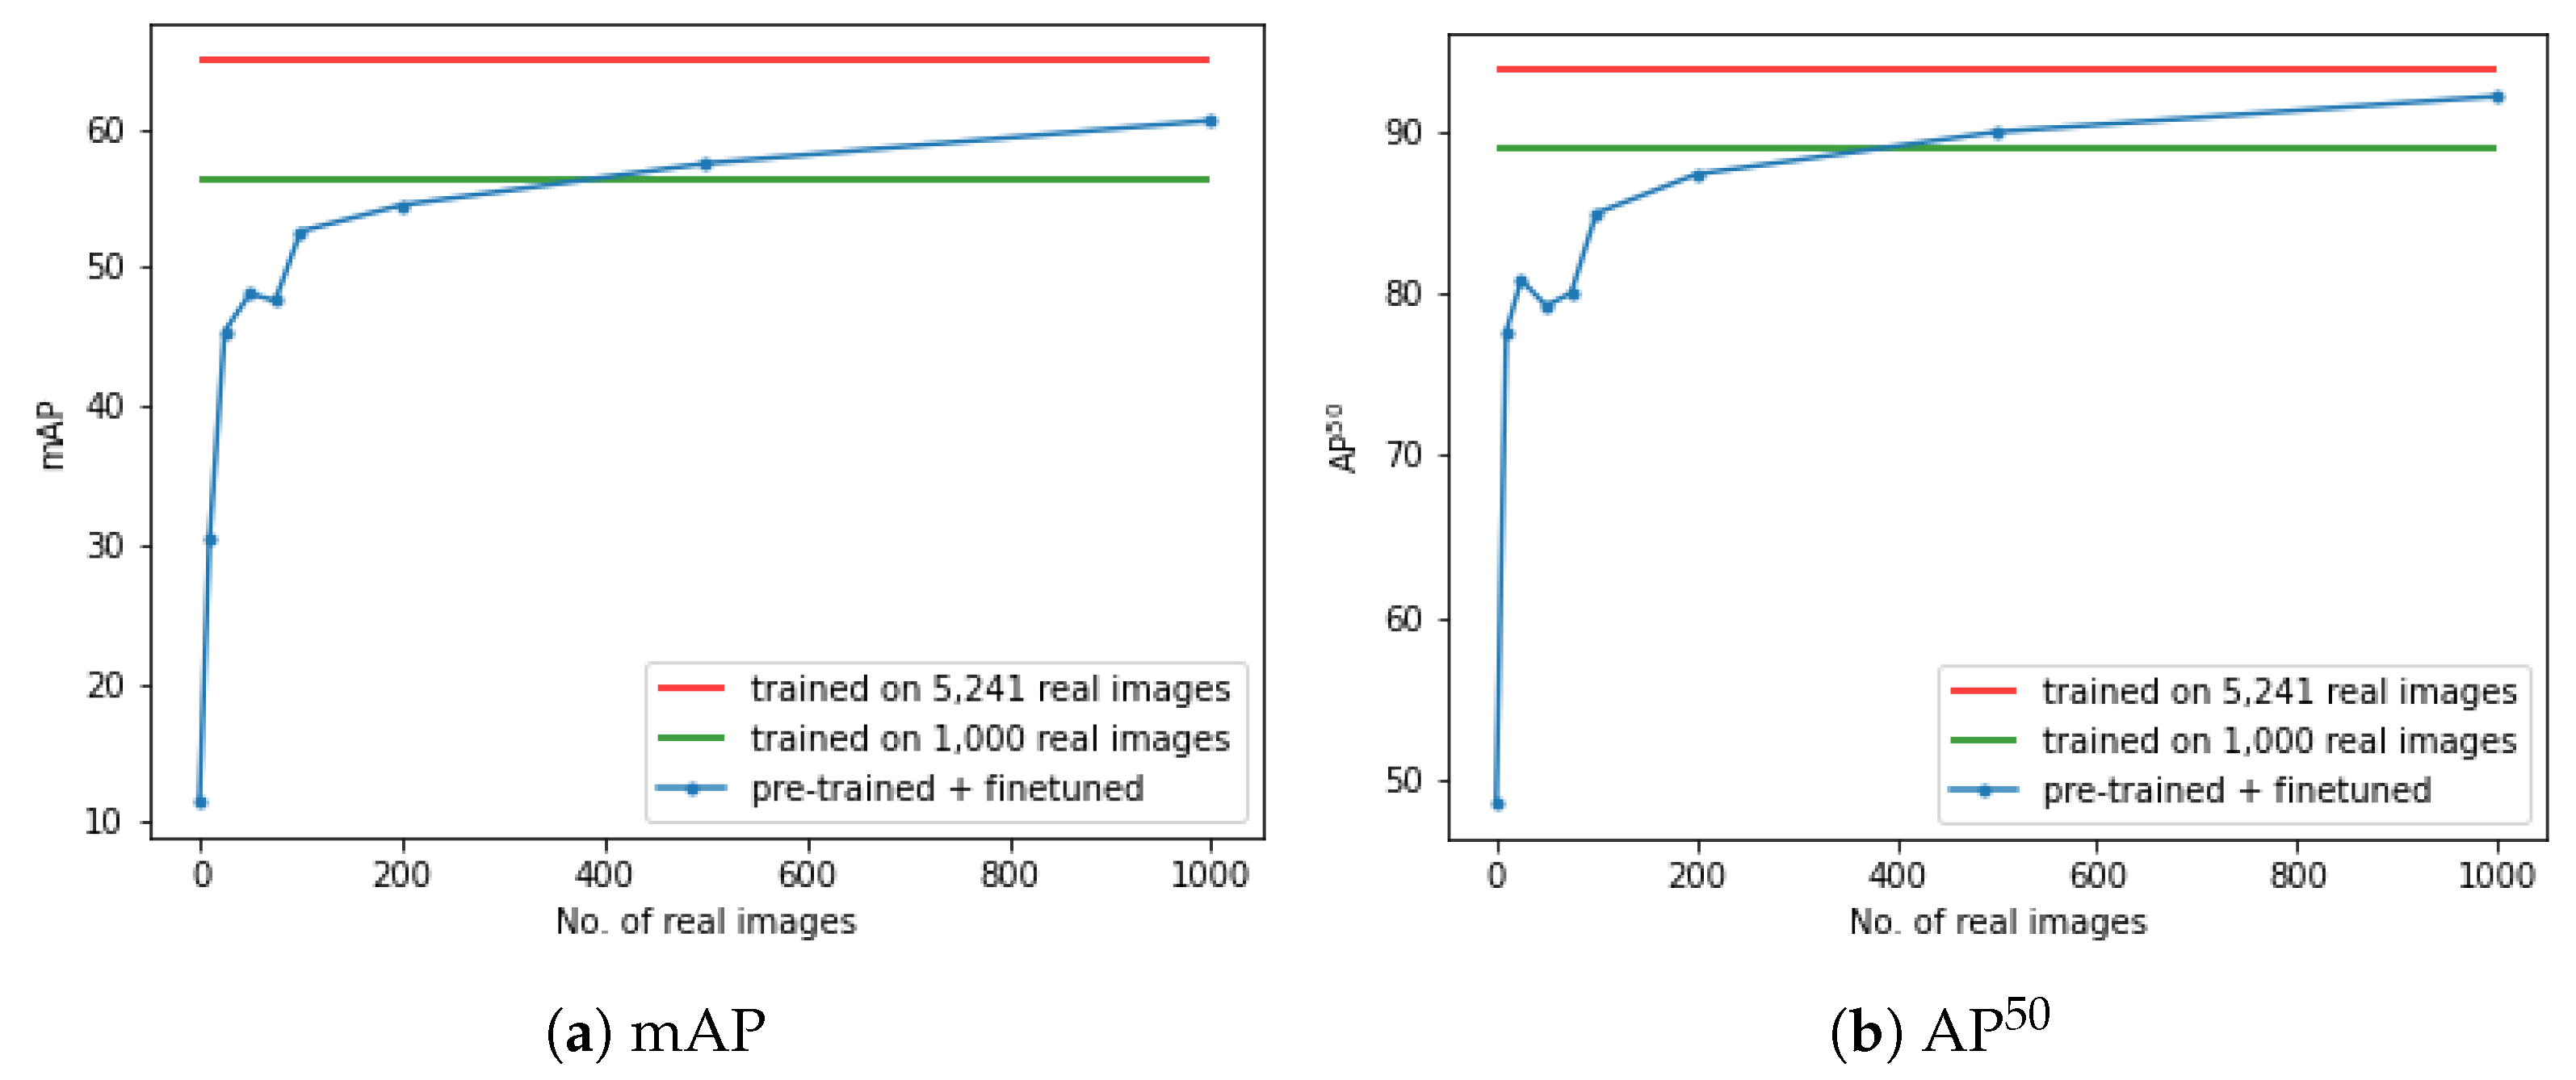
4.2.3. Evaluation of the Minimal Number of Real Images

To evaluate the impact of different subset sizes (see Figure 5) of real images on model performance, we fine-tuned a model trained on synthetic images with varying amounts of real data. These subsets were carefully generated, considering background brightness, class distribution, and colony counts, and were drawn from the train set of the AGAR dataset [4].
When fine-tuning on just 10 real images, the model achieved a significant boost with an AP50 of 77.6 and mAP of 30.5 , representing improvements of + 28.9 and + 18.9 , respectively, compared to the model trained solely on synthetic data. Fine-tuning with 25 real images further improved performance, yielding an AP50 of 80.8 and mAP of 45.4 , with a notable + 14.9 increase in mAP compared to the 10-image model. This suggests that additional real data enhance detection accuracy, particularly at higher IoU thresholds. However, fine-tuning with 50 real images showed a slight decline in AP50 ( 79.2 ), though the mAP continued to improve, indicating better generalization across IoU thresholds. Adding more images did not always lead to proportional gains. The model fine-tuned with 75 images showed no significant overall improvement, and its AP50 fell behind the 25-image model. However, using 100 real images resulted in a marked improvement, reaching an AP50 of 84.9 and mAP of 52.6 , approaching the performance of the model trained on exclusively 1000 real images, with a small accuracy gap of only 4.1 in AP50 and 3.8 in mAP. Fine-tuning with 200 images brought further gains, achieving 87.3 AP50 and 54.5 mAP, closing the gap to the 1000-image model by 1.9 in both metrics. Finally, the model fine-tuned with 500 images reached an AP50 of 89.9 and an mAP of 57.5 , surpassing the model trained on 1000 real images, albeit by a small margin that can be attributed to variations in the dataset. These results demonstrate that 500 real images are sufficient to fine-tune a model pre-trained on synthetic data, achieving near-parity with models trained on larger real datasets.

4.3. State-of-the-Art Comparison

Table 4 presents a comparison of various object detection [3,4,8,48] models based on their performance across different datasets sizes, specifically focusing on how the inclusion of synthetic data affects their results. The mAP and AP50 results presented in the table are partially derived from the original publications.
In the section of Table 4 detailing the full AGAR dataset performance, we observe that YOLOv8, which was trained in the same way as described in Section 4.2, achieved commendable results, with an AP50 of 93.7 and an mAP of 64.9 , despite having a relatively small parameter count of 3.2 million. This indicates that YOLOv8 is both efficient and effective in detecting colonies. However, AttnPAFPN [8] outperformed all others on this dataset, achieving an impressive AP50 of 96.3 and an mAP of 68.2 , suggesting that self-attention mechanisms significantly enhance detection accuracy. However, the parameter count and complexity is much higher compared to YOLOv8.
When evaluating the performance with approximately 500 real images, AttnPAFPN consistently outperformed, achieving an AP50 of 92.3 and an mAP of 62.9 . In comparison, YOLOv8 combined with our synthetic data generation strategy attained an AP50 of 89.9 and an mAP of 57.5 , while YOLOv8 without synthetic data only reached an AP50 of 84.7 and an mAP of 53.0 . Notably, incorporating synthetic data improved the AP50 by + 5.2 and the mAP by + 4.5 for YOLOv8, demonstrating that synthetic data augmentation significantly enhances performance, even with a limited set of real images.
In the scenario with only 100 real images of the AGAR dataset, the advantages of synthetic data became even more pronounced. YOLOv8 with our augmentation method achieved an AP50 of 84.9 and an mAP of 52.6 , significantly outperforming models like the Faster-RCNN and Cascade-RCNN, which achieved mAPs of only 40.1 and 41.6 , respectively. This highlights the effectiveness of the synthetic data generation approach, particularly in low-data situations. It also highlights the importance of fine-tuning on real data, as Pawłowski et al. [3] utilize the 100 real images to generate the synthetic data without any fine-tuning.
Finally, when the dataset was reduced to only 50 real images, all models exhibited decreased performance, but the synthetic data still provided a critical advantage. YOLOv8 with our method for data generation led this group with an AP50 of 79.2 and an mAP of 48.1 , while the performance of the Faster-RCNN, AttnPAFPN, and YOLOv8, which did not utilize synthetic data, dropped to an mAP of 41.2 , 42.8 , and 36.0 , respectively.
In summary, this table illustrates the significant impact of synthetic data on enhancing model performance, particularly in scenarios with limited real data. YOLOv8 with our augmentation strategy consistently demonstrated strong performance across different dataset sizes, showcasing its robustness and efficiency. Meanwhile, the AttnPAFPN model, although the top performer on the full dataset, encountered challenges when real data were scarce, underscoring the importance of synthetic data in achieving reliable object detection outcomes.

5. Conclusions

This work explores a SAM-based Copy-Paste data augmentation method for agar dish images to address the challenges of gathering and annotating large datasets for training neural networks. By using the Segment Anything Model (SAM) to cut out microbial colonies and generate synthetic images, the method enables rapid dataset expansion with automatic annotations. However, the SAM struggles with blurry objects, often requiring manual sorting to ensure accurate colony cutouts.
Our comprehensive experiments highlight the substantial impact of enhancements in synthetic data generation. Beginning with unfiltered SAM-generated cutouts, pre-training solely on synthetic data raised AP50 from 89.0 to 91.2 and mAP from 56.4 to 58.9 , demonstrating significant gains compared to models trained exclusively on 1000 real images. Introducing overlapping colony pairs further boosted the mAP to 60.5 , emphasizing the importance of capturing realistic colony interactions. The final augmentation process also included color differentiation to make synthetic images appear more realistic. While this improved visual quality, it did not significantly impact model performance.
Our best-performing fine-tuned model, utilizing only 1000 real images, achieved an mAP of 60.6 , a mere 4.3 behind the baseline trained on 5241 real images. This result underscores the efficiency of the SAM-based Copy-Paste augmentation in achieving near-parity performance with a fraction of the labeled data. Furthermore, our method outperformed a substantially larger model, yielding a + 5.0 mAP improvement with just 50 real images. This demonstrates that a strategic combination of synthetic data augmentation and lightweight models can significantly enhance both detection accuracy and computational efficiency. These findings illustrate the potential of our SAM-based Copy-Paste techniques for scalable, automated dataset generation in colony detection, providing a foundation for future refinements such as dynamic opacity, enhanced style transfer techniques, and adaptive augmentation strategies tailored to specific microbial morphologies.
In this work, our primary focus was colony detection in the context of hygiene monitoring, where the main objective was to identify all potential contaminations to evaluate environmental purity. Although characteristics such as colony shape, color, and viability are important in other applications, they are secondary considerations for this specific use case. Future research could enhance our approach by incorporating advanced morphological analyses, enabling more comprehensive colony characterization and expanding the applicability of our method to a wider range of microbiological and industrial scenarios.

Author Contributions

Conceptualization, K.M., N.E. and O.W.; methodology, K.M. and N.E.; software, K.M.; validation, K.M., N.E. and O.W.; formal analysis, K.M.; investigation, K.M.; resources, K.M.; data curation, K.M. and N.E.; writing—original draft preparation, N.E. and L.R.; writing—review and editing, N.E., L.R. and O.W.; visualization, N.E., L.R. and O.W.; supervision, N.E., L.R. and O.W.; project administration, N.E. and O.W.; funding acquisition, O.W. All authors have read and agreed to the published version of the manuscript.

Funding

This work was supported by funding from the Federal Ministry of Education and Research Germany in the project M2Aind-DeepLearning (13FH8I08IA). Additional funding was provided by the German Research Foundation under grant number INST874/9-1 and by the Albert and Anneliese Konanz Foundation.

Institutional Review Board Statement

Not applicable.

Informed Consent Statement

Not applicable.

Data Availability Statement

Restrictions apply to the availability of these data. AGAR-data were obtained from [4] and are available at https://agar.neurosys.com/ (accessed on 12 December 2024).

Conflicts of Interest

The authors declare no conflicts of interest.

References

  1. Geissmann, Q. OpenCFU, a new free and open-source software to count cell colonies and other circular objects. PLoS ONE 2013, 8, e54072. [Google Scholar] [CrossRef] [PubMed]
  2. Khan, A.U.M.; Torelli, A.; Wolf, I.; Gretz, N. AutoCellSeg: Robust automatic colony forming unit (CFU)/cell analysis using adaptive image segmentation and easy-to-use post-editing techniques. Sci. Rep. 2018, 8, 7302. [Google Scholar] [CrossRef] [PubMed]
  3. Pawłowski, J.; Majchrowska, S.; Golan, T. Generation of microbial colonies dataset with deep learning style transfer. Sci. Rep. 2022, 12, 5212. [Google Scholar] [CrossRef] [PubMed]
  4. Majchrowska, S.; Pawłowski, J.; Guła, G.; Bonus, T.; Hanas, A.; Loch, A.; Pawlak, A.; Roszkowiak, J.; Golan, T.; Drulis-Kawa, Z. AGAR a microbial colony dataset for deep learning detection. arXiv 2021, arXiv:2108.01234. [Google Scholar]
  5. Vaswani, A.; Shazeer, N.; Parmar, N.; Uszkoreit, J.; Jones, L.; Gomez, A.N.; Kaiser, Ł.; Polosukhin, I. Attention is all you need. Adv. Neural Inf. Process. Syst. (NeurIPS) 2017, 30, 6000. [Google Scholar]
  6. Dosovitskiy, A.; Beyer, L.; Kolesnikov, A.; Weissenborn, D.; Zhai, X.; Unterthiner, T.; Dehghani, M.; Minderer, M.; Heigold, G.; Gelly, S.; et al. An Image is Worth 16 × 16 Words: Transformers for Image Recognition at Scale. In Proceedings of the International Conference on Learning Representations (ICLR), Virtual, 26 April–1 May 2020. [Google Scholar]
  7. Ebert, N.; Stricker, D.; Wasenmüller, O. PLG-ViT: Vision Transformer with Parallel Local and Global Self-Attention. Sensors 2023, 23, 3447. [Google Scholar] [CrossRef]
  8. Ebert, N.; Stricker, D.; Wasenmüller, O. Transformer-based Detection of Microorganisms on High-Resolution Petri Dish Images. In Proceedings of the International Conference on Computer Vision Workshops (ICCVW), Paris, France, 2–6 October 2023. [Google Scholar]
  9. Falk, T.; Mai, D.; Bensch, R.; Çiçek, Ö.; Abdulkadir, A.; Marrakchi, Y.; Böhm, A.; Deubner, J.; Jäckel, Z.; Seiwald, K.; et al. U-Net: Deep learning for cell counting, detection, and morphometry. Nat. Methods 2019, 16, 67–70. [Google Scholar] [CrossRef]
  10. Naets, T.; Huijsmans, M.; Smyth, P.; Sorber, L.; de Lannoy, G. A Mask R-CNN approach to counting bacterial colony forming units in pharmaceutical development. arXiv 2021, arXiv:2103.05337. [Google Scholar]
  11. Goceri, E. Medical image data augmentation: Techniques, comparisons and interpretations. Artif. Intell. Rev. 2023, 56, 12561–12605. [Google Scholar] [CrossRef]
  12. Andreini, P.; Bonechi, S.; Bianchini, M.; Mecocci, A.; Scarselli, F. Image generation by GAN and style transfer for agar plate image segmentation. Comput. Methods Programs Biomed. 2020, 184, 105268. [Google Scholar] [CrossRef]
  13. Deepak, S.; Ameer, P. MSG-GAN based synthesis of brain MRI with meningioma for data augmentation. In Proceedings of the International Conference on Electronics, Computing and Communication Technologies (CONECCT), Bangalore, India, 2–4 July 2020. [Google Scholar]
  14. Ghiasi, G.; Cui, Y.; Srinivas, A.; Qian, R.; Lin, T.Y.; Cubuk, E.D.; Le, Q.V.; Zoph, B. Simple copy-paste is a strong data augmentation method for instance segmentation. In Proceedings of the Conference on Computer Vision and Pattern Recognition (CVPR), Nashville, TN, USA, 20–25 June 2021. [Google Scholar]
  15. Kirillov, A.; Mintun, E.; Ravi, N.; Mao, H.; Rolland, C.; Gustafson, L.; Xiao, T.; Whitehead, S.; Berg, A.C.; Lo, W.Y.; et al. Segment anything. In Proceedings of the International Conference on Computer Vision (ICCV), Paris, France, 2–6 October 2023. [Google Scholar]
  16. Alexander, N.; Glick, D. Automatic counting of bacterial cultures—A new machine. IRE Trans. Med. Electron. 1958, PGME-12, 89–92. [Google Scholar] [CrossRef]
  17. Mansberg, H. Automatic particle and bacterial colony counter. Science 1957, 126, 3278. [Google Scholar] [CrossRef] [PubMed]
  18. Ferrari, A.; Lombardi, S.; Signoroni, A. Bacterial colony counting with convolutional neural networks in digital microbiology imaging. Pattern Recognit. 2017, 61, 629–640. [Google Scholar] [CrossRef]
  19. Andreini, P.; Bonechi, S.; Bianchini, M.; Mecocci, A.; Scarselli, F. A deep learning approach to bacterial colony segmentation. In Proceedings of the International Conference on Artificial Neural Networks (ICANN), Rhodes, Greece, 4–7 October 2018. [Google Scholar]
  20. Ramesh, N.; Tasdizen, T. Cell segmentation using a similarity interface with a multi-task convolutional neural network. J. Biomed. Health Inform. 2018, 23, 1457–1468. [Google Scholar] [CrossRef]
  21. Ronneberger, O.; Fischer, P.; Brox, T. U-net: Convolutional networks for biomedical image segmentation. In Proceedings of the International Conference on Medical Image Computing and Computer-Assisted Intervention (MICCAI), Munich, Germany, 5–9 October 2015; Springer: Berlin/Heidelberg, Germany, 2015. [Google Scholar]
  22. He, K.; Gkioxari, G.; Dollár, P.; Girshick, R. Mask r-cnn. In Proceedings of the International Conference on Computer Vision (ICCV), Venice, Italy, 22–29 October 2017. [Google Scholar]
  23. Liu, S.J.; Huang, P.C.; Liu, X.S.; Lin, J.J.; Zou, Z. A two-stage deep counting for bacterial colonies from multi-sources. Appl. Soft Comput. 2022, 130, 109706. [Google Scholar] [CrossRef]
  24. Cai, Z.; Vasconcelos, N. Cascade r-cnn: Delving into high quality object detection. In Proceedings of the Conference on Computer Vision and Pattern Recognition (CVPR), Salt Lake City, UT, USA, 18–22 June 2018. [Google Scholar]
  25. Ren, S.; He, K.; Girshick, R.; Sun, J. Faster R-CNN: Towards Real-Time Object Detection with Region Proposal Networks. Trans. Pattern Anal. Mach. Intell. 2017, 39.6, 1137. [Google Scholar] [CrossRef]
  26. Liu, S.; Qi, L.; Qin, H.; Shi, J.; Jia, J. Path aggregation network for instance segmentation. In Proceedings of the Conference on Computer Vision and Pattern Recognition (CVPR), Salt Lake City, UT, USA, 18–22 June 2018. [Google Scholar]
  27. Feng, C.; Zhong, Y.; Gao, Y.; Scott, M.R.; Huang, W. Tood: Task-aligned one-stage object detection. In Proceedings of the International Conference on Computer Vision (ICCV), Montreal, QC, Canada, 10–17 October 2021. [Google Scholar]
  28. Shorten, C.; Khoshgoftaar, T.M. A survey on image data augmentation for deep learning. J. Big Data 2019, 6, 60. [Google Scholar] [CrossRef]
  29. Cubuk, E.D.; Zoph, B.; Shlens, J.; Le, Q.V. Randaugment: Practical automated data augmentation with a reduced search space. In Proceedings of the Conference on Computer Vision and Pattern Recognition Workshops (CVPRW), Seattle, WA, USA, 13–19 June 2020. [Google Scholar]
  30. Hendrycks, D.; Mu, N.; Cubuk, E.D.; Zoph, B.; Gilmer, J.; Lakshminarayanan, B. AugMix: A Simple Data Processing Method to Improve Robustness and Uncertainty. In Proceedings of the International Conference on Learning Representations (ICLR), Virtual, 26 April–1 May 2020. [Google Scholar]
  31. Zhang, H.; Cisse, M.; Dauphin, Y.N.; Lopez-Paz, D. mixup: Beyond Empirical Risk Minimization. In Proceedings of the International Conference on Learning Representations, Vancouver, BC, Canada, 30 April–3 May 2018. [Google Scholar]
  32. Yun, S.; Han, D.; Oh, S.J.; Chun, S.; Choe, J.; Yoo, Y. Cutmix: Regularization strategy to train strong classifiers with localizable features. In Proceedings of the International Conference on Computer Vision (ICCV), Seoul, Republic of Korea, 27 October–2 November 2019. [Google Scholar]
  33. Bochkovskiy, A.; Wang, C.Y.; Liao, H.Y.M. Yolov4: Optimal speed and accuracy of object detection. arXiv 2020, arXiv:2004.10934. [Google Scholar]
  34. Oehri, S.; Ebert, N.; Abdullah, A.; Stricker, D.; Wasenmüller, O. GenFormer—Generated Images are All You Need to Improve Robustness of Transformers on Small Datasets. In Proceedings of the International Conference on Pattern Recognition (ICPR), Kolkata, India, 1–5 December 2024. [Google Scholar]
  35. Sarıyıldız, M.B.; Alahari, K.; Larlus, D.; Kalantidis, Y. Fake it till you make it: Learning transferable representations from synthetic ImageNet clones. In Proceedings of the Conference on Computer Vision and Pattern Recognition (CVPR), Vancouver, BC, Canada, 17–24 June 2023. [Google Scholar]
  36. Reichardt, L.; Uhr, L.; Wasenmüller, O. Text3DAug – Prompted Instance Augmentation for LiDAR Perception. In Proceedings of the International Conference on Intelligent Robots and Systems (IROS), Abu Dhabi, United Arab Emirates, 14–18 October 2024. [Google Scholar]
  37. Goodfellow, I.; Pouget-Abadie, J.; Mirza, M.; Xu, B.; Warde-Farley, D.; Ozair, S.; Courville, A.; Bengio, Y. Generative adversarial networks. Commun. ACM 2020, 63, 139–144. [Google Scholar] [CrossRef]
  38. Alyafi, B.; Diaz, O.; Marti, R. DCGANs for realistic breast mass augmentation in x-ray mammography. In Proceedings of the Medical Imaging 2020: Computer-Aided Diagnosis, Houston, TX, USA, 15–20 February 2020. [Google Scholar]
  39. Desai, S.D.; Giraddi, S.; Verma, N.; Gupta, P.; Ramya, S. Breast cancer detection using gan for limited labeled dataset. In Proceedings of the International Conference on Computational Intelligence and Communication Networks (CICN), Bhimtal, India, 25–26 September 2020. [Google Scholar]
  40. Shen, T.; Hao, K.; Gou, C.; Wang, F.Y. Mass image synthesis in mammogram with contextual information based on GANs. Comput. Methods Programs Biomed. 2021, 202, 106019. [Google Scholar] [CrossRef]
  41. Li, Q.; Yu, Z.; Wang, Y.; Zheng, H. TumorGAN: A multi-modal data augmentation framework for brain tumor segmentation. Sensors 2020, 20, 4203. [Google Scholar] [CrossRef]
  42. Neelima, G.; Chigurukota, D.R.; Maram, B.; Girirajan, B. Optimal DeepMRSeg based tumor segmentation with GAN for brain tumor classification. Biomed. Signal Process. Control 2022, 74, 103537. [Google Scholar] [CrossRef]
  43. Bissoto, A.; Perez, F.; Valle, E.; Avila, S. Skin lesion synthesis with generative adversarial networks. In Proceedings of the OR 2.0 Context-Aware Operating Theaters, Computer Assisted Robotic Endoscopy, Clinical Image-Based Procedures, and Skin Image Analysis, Granada, Spain, 16–20 September 2018. [Google Scholar]
  44. Ghorbani, A.; Natarajan, V.; Coz, D.; Liu, Y. Dermgan: Synthetic generation of clinical skin images with pathology. In Proceedings of the Machine Learning for Health Workshop, Virtual, 11 December 2020. [Google Scholar]
  45. Dar, S.U.H.; Ghanaat, A.; Kahmann, J.; Ayx, I.; Papavassiliou, T.; Schoenberg, S.O.; Engelhardt, S. Investigating data memorization in 3d latent diffusion models for medical image synthesis. arXiv 2023, arXiv:2307.01148. [Google Scholar]
  46. Sagers, L.W.; Diao, J.A.; Melas-Kyriazi, L.; Groh, M.; Rajpurkar, P.; Adamson, A.S.; Rotemberg, V.; Daneshjou, R.; Manrai, A.K. Augmenting medical image classifiers with synthetic data from latent diffusion models. arXiv 2023, arXiv:2308.12453. [Google Scholar]
  47. Gulrajani, I.; Ahmed, F.; Arjovsky, M.; Dumoulin, V.; Courville, A.C. Improved training of wasserstein gans. Adv. Neural Inf. Process. Syst. (NeurIPS) 2017, 360, 5769. [Google Scholar]
  48. Jocher, G.; Chaurasia, A.; Qiu, J. Ultralytics YOLOv8. 2023. Available online: https://github.com/ultralytics/ultralytics (accessed on 16 December 2024).
  49. Lin, T.Y.; Maire, M.; Belongie, S.; Hays, J.; Perona, P.; Ramanan, D.; Dollár, P.; Zitnick, C.L. Microsoft coco: Common objects in context. In Proceedings of the European Conference on Computer Vision (ECCV), Zurich, Switzerland, 6–12 September 2014. [Google Scholar]
Figure 1. Overview of the proposed pipeline. First, colonies are segmented using a pre-trained and frozen Segment Anything Model [15]. Next, poor segmentations are filtered out to avoid introducing artifacts into the synthetic images. The segmented colonies are then inserted onto new, empty agar plates. Finally, YOLOv8 [48] is pre-trained on the synthetic data and fine-tuned on real data to achieve optimal accuracy.
Applsci 15 01260 g001
Figure 2. Examples of good and bad segmentations of colonies from the AGAR dataset [4] with SAM [15].
Applsci 15 01260 g002
Figure 3. Examples of generated data (f.l.t.r.): real image from the AGAR dataset, generated image where the colonies match the background, and generated image where the colonies do not match the background.
Applsci 15 01260 g003
Figure 4. Comparison of the mAP of YOLOv8-Nano [48] after pre-training on synthetic images and fine-tuning on real images across all classes in the AGAR dataset [4]. The synthetic images utilize various opacity values for the inpainted colonies.
Applsci 15 01260 g004
Figure 5. Comparison of different sizes of fine-tuning datasets of YOLOv8-Nano [48] on the AGAR dateset [4]. (a) Mean Average Precision (mAP). (b) Average Precision at an IoU-threshold at 0.5 (AP50).
Applsci 15 01260 g005
Table 1. Baseline evaluation with YOLOv8-Nano [48] on the AGAR dataset [4] using the entire dataset (Full Set) and the fine-tuning subsets of 1000 images (FT-Set).
ClassFull SetFT-Set
AP50mAPAP50mAP
S. aureus94.962.089.254.6
B. subtilis97.972.195.064.5
P. aeruginosa96.267.093.159.7
E. coli97.774.294.265.8
C. albicans81.949.273.437.3
Mean93.764.989.056.4
Table 2. Ablation studies for optimizing the Copy-Paste data generation pipeline on the AGAR dataset [4] using YOLOv8-Nano [48]. The best results are highlighted in bold; the second-best results are underlined.
S. aureusB. subtilisP. aeruginosaE. coliC. albicansMean
AP50mAPAP50mAPAP50mAPAP50mAPAP50mAPAP50mAP
Baseline89.254.695.064.593.159.794.265.873.437.389.056.4
(I) Raw data92.356.996.766.594.461.895.468.277.141.091.258.9
(II) No overlapping colonies91.655.795.566.194.561.795.267.976.340.890.658.4
(III) Pairs of overlapping colonies93.158.996.767.294.762.895.969.678.943.991.960.5
(IV) Color differentiation92.958.496.967.094.862.996.169.378.642.791.960.1
(V) Two classes max93.359.097.168.294.963.196.269.379.243.392.160.6
(VI) Big clusters of colonies93.659.297.167.794.863.696.070.178.942.692.160.6
(VII) Dish color differentiation92.657.696.966.994.662.396.069.077.540.591.559.3
(VIII) Opacity 90%93.257.897.267.395.062.996.169.878.241.391.959.8
Table 3. Evaluation of our dataset augmentation for domain adaptation. The baseline is YOLOv8-Nano [48], which has been trained on both backgrounds (dark and bright) of the AGAR dataset [4]. This is in contrast to models that are trained only on bright or dark backgrounds.
ClassBothDarkBright
APmAPAPmAPAPmAP
S. aureus93.659.293.759.791.256.1
B. subtilis97.167.797.267.796.465.9
P. aeruginosa94.863.695.063.394.661.1
E. coli96.070.196.270.195.768.1
C. albicans78.942.678.442.375.137.0
Mean92.160.692.160.690.657.9
Table 4. Performance comparison of various object detection models [3,4,8,48] on different sizes of the AGAR dataset [4], showcasing the impact of synthetic data. The results are categorized by the size of the real image datasets, illustrating how model performance varies with the amount of available real data and the incorporation of synthetic data.
MethodParamsSynth. DataMetric
AP50mAP
Full Dataset
Faster-RCNN * [4]41.5 M 76.749.3
Cascade-RCNN * [4]69.2 M 79.251.6
Faster-RCNN * [8]41.5 M 80.256.0
AttnPAFPN * [8]32.8 M 96.368.2
YOLOv8 [48]3.2 M 93.764.9
500 real images
Faster-RCNN * [8]41.5 M 78.853.4
AttnPAFPN * [8]32.8 M 92.362.9
YOLOv8 [48]3.2 M 84.753.0
YOLOv8 + Ours3.2 M89.957.5
100 real images
Faster-RCNN * [3]41.5 M-40.1
Cascade-RCNN * [3]69.2 M-41.6
YOLOv8 [48]3.2 M 73.444.6
YOLOv8 + Ours3.2 M84.952.6
50 real images
Faster-RCNN * [8]41.5 M 70.641.2
AttnPAFPN * [8]32.8 M 72.542.8
YOLOv8 [48]3.2 M 60.836.0
YOLOv8 + Ours3.2 M79.248.1
* Results are taken from the original publication.
Disclaimer/Publisher’s Note: The statements, opinions and data contained in all publications are solely those of the individual author(s) and contributor(s) and not of MDPI and/or the editor(s). MDPI and/or the editor(s) disclaim responsibility for any injury to people or property resulting from any ideas, methods, instructions or products referred to in the content.

