Article

A Comprehensive Analysis of Environmental Emissions from Trenchless CIPP and Excavation Technologies for Sanitary Sewers

Civil Engineering Department, The University of Texas at Arlington, P.O. Box 19308, Arlington, TX 76019, USA
*
Author to whom correspondence should be addressed.
Appl. Sci. 2025, 15(3), 1268; https://doi.org/10.3390/app15031268
Submission received: 31 December 2024 / Revised: 22 January 2025 / Accepted: 23 January 2025 / Published: 26 January 2025
(This article belongs to the Special Issue Advances in Underground Pipeline Technology, 2nd Edition)

Abstract

:
The renewal of underground infrastructure is an emerging challenge for most municipalities in the United States. As compared to trenchless cured-in-place pipes (CIPPs), excavation technologies (ETs) have adverse impacts on the environment. Due to its lower ecological impact, trenchless technology is preferred in comparison to conventional pipe replacement. The selection of the most appropriate method depends on factors such as the existing sewer network, traffic disruption, soil conditions, and environmental safety. Recent concerns pertaining to environmental impact have increased the demand for reduced carbon footprints. The objectives of this paper are the following: (1) to present a comprehensive review on the achievements achieved over the years in understanding the factors influencing environmental emissions from the use of CIPP and ETs and (2) to analyze and compare the environmental emissions produced from CIPPs and ETs for 8-inch-, 10-inch-, and 12-inch-diameter pipes. Published papers from 1990 through 2024 have been included, which reported emissions from both alternatives. A comparison of total environmental emissions produced from both the processes is presented. The literature review and analysis suggest that higher emissions are a result of higher fuel consumption, material use, and input allocation. The emissions of pipeline renewal methods were evaluated using USEPA’s TRACI 2.1 methodology within SimaPro software. The analysis showed that CIPP renewal greatly reduced carbon emissions when compared with ET. CIPPs exhibited approximately 70% less ecological impact, 75% less impact on human health, and 60% less depletion of resources. CIPPs reduced carbon emissions by 78–100% in comparison to ETs. The recycling materials used in CIPPs potentially reduce the environmental impact by 10%, making them highly sustainable. The installation phase should therefore be carefully analyzed for factors like the pipe material and the pipes’ external diameter in view of achieving the greatest sustainability of these methods, as these characteristics affect emissions. It can be inferred that the comparison of the emissions of both alternatives is extremely vital for sustainable underground infrastructure development.

1. Introduction and Background

Underground infrastructure primarily consists of sewer pipeline systems. The U.S. has approximately 1.2 million miles of water supply mains. Each mile of interstate highway typically has an equivalent length of sewer pipes. Over time, these systems can experience structural failures, blockages, and overflows. According to the United States Environmental Protection Agency (USEPA), there are 860 combined sewer systems across the country. Growing environmental and health concerns highlight the need for rehabilitation of these systems [1]. Pipeline renewal and replacement are essential to minimize external flow and address structural issues. The selection of an appropriate rehabilitation method involves considering pipe characteristics and soil and groundwater conditions, as these factors can influence structural integrity, installation, and overall performance of the sewer system.
Excavation technologies (ETs) are the most commonly used method for sewer rehabilitation, involving trenching to install or replace pipes. They are expensive due to the removal and backfilling of soil. This leads to increased soil erosion, carbon emissions, and human toxicity. The carbon footprint of ETs is much higher than that of trenchless technologies [2]. These issues can be mitigated by adopting trenchless pipe rehabilitation techniques like cured-in-place pipe (CIPP), pipe bursting, and slip lining [3]. CIPP is a popular and innovative trenchless pipeline rehabilitation method, where a resin-saturated tube is inserted into the damaged pipe, then inflated and cured using hot water, steam, or UV light [4]. This technique reduces ground disruption and minimizes environmental impact [5,6]. However, research has shown that the CIPP process can release harmful substances, such as styrene, which contribute to aquatic toxicity among other chemical pollutants that persist for over four weeks [7], indicating that CIPP also has environmental downsides. Both the CIPP and ET methods have distinct advantages and limitations. To better understand the type and quantity of emissions produced and select the most suitable method accordingly, it is crucial to evaluate and compare the emissions produced by both methods [8].
The carbon footprint represents the total greenhouse gas emissions resulting from human activities, primarily composed of carbon dioxide (CO2) but also including methane (CH4), nitrous oxide (N2O), black carbon (BC), and various fluorinated gases. While these other gases are present in smaller amounts, they significantly contribute to heat retention in the atmosphere. Calculating the carbon footprint is essential for addressing climate change, as it measures both direct and indirect CO2 emissions associated with specific activities and throughout the life cycles of products or processes. This includes contributions from individuals, businesses, populations, and governments, necessitating a comprehensive accounting of all emissions [9].
To measure these contributions, an Ecological Impact Assessment (EIA) of CIPPs and ETs was conducted. EIA is a structured approach used to evaluate the environmental effects of a product, service, or process throughout its life cycle. This methodology supports compliance with environmental regulations and promotes sustainable decision-making. For this research, EIA was conducted using USEPA’s TRACI 2.1 methodology, through SimaPro software. TRACI 2.1 (Tool for Reduction and Assessment of Chemicals and Other Environmental Impacts) is a framework developed by the USEPA to evaluate the environmental impacts of products, processes, and systems by providing characterization factors for Life Cycle Impact Assessment (LCIA) across multiple impact categories [4,10]. By normalizing results against average annual impacts of U.S. or Canadian citizens, TRACI 2.1 enables meaningful comparisons across categories, facilitating informed decision-making for sustainability and environmental performance improvements.
The construction industry is the largest contributor to carbon emissions, responsible for nearly 30% of global greenhouse gas (GHG) emissions. From 2010 to 2019, global net GHG emissions increased by 12%, with the United States being the second-largest emitter. Research indicates that pipeline materials significantly influence emissions, with Polyvinyl Chloride (PVC) pipes generating the least carbon compared to other materials like Prestressed Concrete Cylinder Pipes (PCCPs), High-Density Polyethylene (HDPE) pipes, and Ductile Iron Pipes (DIPs) [9,11]. Additionally, factors such as pipe diameter, rehabilitation methods, pipeline type (sewer or water), installation techniques, and the length of the pipeline being replaced affect the environmental impact of pipeline rehabilitation. Therefore, choosing the right method for pipeline renewal and replacement is essential for minimizing the overall carbon footprint [4]. This paper reviews previous literature on CIPP and ET and analyses and compares their environmental emissions. An analysis of research published from 1990 to 2024, detailing the emissions from both methods, is presented. The objectives are the following: (1) to provide an in-depth literature review on the progress made in understanding the factors affecting emissions from CIPP and ET and (2) to analyze and compare the total emissions of both methods for small-diameter (8-inch, 10-inch, and 12-inch) sewer pipes based on the data available from industry sources and case studies. This comprehensive analysis provides an understanding of the environmental advantages and disadvantages pertaining to CIPP and ET, leading to an effective and sustainable decision-making process for upcoming underground infrastructure rehabilitation projects in the construction industry.

2. Cured-in-Place Pipe

The CIPP method, first implemented in California in 1976, has gained wide acceptance in sewer rehabilitation processes because of its adaptability to varying pipe geometries and also because it allows for localized repairs. In 1971, Eric Wood developed the first CIPP technique, named “Insituform”, which was designed to repair a damaged pipe under his London garage without excavation. This technology, wherein resin-saturated fabric tubes were inserted into pipes and cured in place, was first used on Hackney’s sewers, and the company Insituform Pipes and Structures Ltd. was formed. Once Wood patented the technology in the U.S. in 1977, the company, Insituform, enjoyed market monopoly until the patent expired in 1994, which sparked competition for the technology [4,12]. The CIPP process involves the insertion of a resin-impregnated flexible tube into the host pipe, which is then cured with heat or UV light. Its success depends on factors such as pipeline geometry, material compatibility, and the mechanical properties of the materials, including tensile strength and corrosion resistance [13,14,15].
Field exposure measurements sites of CIPP installations in Virginia determined relatively high levels of styrene during installation exceeding maximum contamination levels, although the overall concentrations remained for 44 days post-installation. Aquatic toxicity levels were surpassed, as indicated by algal blooms that can cause fish kills [16]. However, another measurement survey observed no incidence of fish kills. It has been also observed that the styrene concentration decreased by 99% in 20 days showing rapid volatilization [17]. Comparative studies in the issue of dust generation indicated that CIPP emits less Respirable Suspended Particulate Matter (RSPM) than OCPR, even at high temperatures, increased humidity, and higher production rates [18]. A questionnaire on the American Association of Highway and Transportation Officials (AASHTO) committee members in 14 states in the U.S reported that air emissions of styrene during CIPP installations were an issue, with potential impacts on water quality, especially in New York, Virginia, and Oregon [19].
The studies on Life Cycle Assessment (LCA) have concluded that CIPP has a lower environmental impact than OCPR in 14 out of 18 categories, even when considering reduced input allocations [20,21]. However, though CIPP is generally considered a greener option compared with OCPR, it also emits harmful VOCs and styrene, which present several risks to human health and the environment [12,14,22]. Advanced chemical monitoring techniques like Gas Chromatography–Mass Spectrometry (GC-MS) and Nuclear Magnetic Resonance (NMR) spectroscopy have detected the presence of both styrene and non-styrene compounds. This poses the need for better resin formulations, different post-curing treatments, and more stringent emission controls to the fore [23].
Field measurements have shown that water-filled P-traps could mitigate styrene emissions in CIPP installations, while the use of a Worker Monitoring System (WMS) may be effective as a tool for health exposure assessment, though further validation is necessary. Indoor air quality research demonstrated that the level of exposure to styrene varied among factors such as ventilation and leakage, hence requiring further investigation into the health hazards of indoor pollution [24]. The concentrations emanating from styrene due to CIPP installations are temporary in nature and decrease quickly to minimize risks outside the immediate safety perimeters; further studies are required to develop models for emissions considering variable environmental conditions [25]. Research has also found that non-styrene polyester resins and styrene emissions from CIPP installations are within safe exposure limits, prompting calls for further exploration of alternative resins and curing methods to improve safety [26].

3. Excavation Technologies

Excavation technologies (ETs) are commonly used installation or replacement techniques that involves digging trenches, laying pipes, and restoring the surface of the ground. They are mainly used to rehabilitate collapsed or damaged pipelines. ET is highly disruptive both environmentally and socially, requiring closing roads to traffic, reducing road capacity and increasing congestion, increasing pollution, and limiting access to homes and business [4]. As the ground becomes more crowded, ET is becoming less feasible. In the last twenty years, technological improvements in trenchless methods have provided more environmentally friendly alternatives to ET, demonstrating less environmental impact and increased efficiency for the latter [27].
Many publications have cited that ET has more carbon dioxide emissions compared to trenchless methods. ET produces large emissions through excavation and refilling processes, as well as by causing traffic congestion. For instance, for one project in New Mexico, it was calculated that ET resulted in 79% more emissions than pipe bursting, and yet ET required double the time to finish [2]. On the same note, carbon emissions from ET during the installation phase were found to be 72.6% higher compared to pipe bursting [28]. Another study showed that ET emitted six times the amount of carbon emissions than tunnel boring machines (TBM), which can be considered a greener technology in place of ET [29].
In addition to emissions, ET creates broader ecological impacts. A comparative evaluation of ET and horizontal directional drilling (HDD) techniques found evidence that HDD techniques reduced ecological impacts by 66.2% [30]. LCAs consistently report greater environmental damage from ET in all categories, including higher greenhouse gas emissions, energy consumption, and waste production. For instance, ET consumes the most energy during backfilling and paving phases, increasing its ecological footprint compared to CIPP and TBM methods [9]. Moreover, a case study in Pasadena found that ETs’ environmental costs were 75% higher than those of trenchless CIPP, further emphasizing its unsustainable nature [4].
The consistent findings across studies underscore the need to shift from ET to trenchless methods, which provide more sustainable and environmentally friendly solutions. Tools such as LCA and Environmental Value Engineering (EVE) can be of use in making decisions on pipeline installation and rehabilitation projects to minimize ecological and social impacts. The use of trenchless technologies can secure major reductions in energy consumption, carbon emission, and environmental costs in construction operations, with the potential to deliver more sustainable infrastructure development.

4. Greenhouse Gas Emissions

As the construction industry has come under increasing scrutiny for its GHG emissions, interest in evaluating pipeline projects has increased. Several studies in the past decade have documented and quantified GHG emissions, and different models have been developed to estimate the emissions of pipeline construction activities. Some of the most widely recognized models are those developed by the EPA’s Nonroad model in 2010 and the California Off-Road model [31].
A study used the Environmental Protection Agency (EPA) Nonroad model for the quantification of emissions from equipment and transportation involved in a utility installation using HDD. An emissions calculator, implemented based on the EPA model, was employed whereby site-specific information and equipment operating hours were used as inputs to calculate overall emissions. This model thus acts as a useful tool by policymakers in weighing different construction methods based on estimated emissions and thus aiding in minimizing airborne pollution from future pipeline installations. [31,32,33].
The USEPA also provided a standard formula to estimate the quantity of GHG emitted by construction equipment. It is given by Equation (1) below:
Emissionsx = EFx × HRS × HP × LF
where:
Emissionsx means total emissions for pollutant x in gallons;
EFx represents the emission factor for pollutant x in grams per hp-hr;
HRS denotes the number of hours the equipment is used;
HP denotes the average rated horsepower of the equipment;
LF represents the load factor or operating hp/maximum rated HP.
This equation provides an accurate quantification of GHGs for the specific pollutants such as CO2, sulfur dioxide (SO2), nitrogen oxides (NOx), carbon monoxide (CO), particulate matter (PM), and high hydrocarbon (HC) by the amount described in the equations of the emission factor [33]. This provides a systematic approach to identifying and mitigating environmental impacts in construction activities [31].
The transportation footprint for pipeline construction projects can be quantified using a standardized Equation (2), which estimates emissions from transportation activities. This methodology has been presented as follows:
Emissionstx = EFx × n × (DO + DR)
where:
Emissionstx is the transportation emissions for pollutant x, grams/mile;
EFx represents the emission factor (EF) for pollutant x, g/mi;
n is the number of trips needed to move materials and equipment;
DO is the one-way distance to the site;
DR is the return distance from the site.
The USEPA has given complete sets of EF formulas, transportation-based, which are specifically designed for CO2, SO2, NOx, PM, and HC. These EF values are the keys to quantifying transportation emissions properly. This formula can be utilized for evaluating and potentially reducing the environmental consequences of material and equipment transportation at a construction site [31,34,35].
Pipeline installation (PI) activities contribute to the increasing atmospheric concentration of CO2 and other GHGs, which are major drivers of global warming [31,36]. The phenomenon, commonly referred to as the “greenhouse effect”, makes Earth habitable by trapping heat. However, human activities have altered the chemical composition of the atmosphere, primarily through the accumulation of greenhouse gases. These gases act just like the glass of a greenhouse, allowing sunlight in while prohibiting the heat from escaping back out [31,36]. In the U.S., CO2 comprised 82% of all human-caused GHG emissions in 2013 [31,37]. Most of these are the result of burning fossil fuels—coal, oil, and natural gas—used in producing electricity, in transportation, and in industrial processes. Other important GHGs are CH4, N2O, BC, and a suite of fluorinated gases. While these gases are only emitted in trace amounts compared to CO2 emissions, they have a high heat-trapping potential, hence increasing their overall impact on global warming [31,37].
From an environmental perspective, by far the most common criterion employed to assess sustainability efforts is the carbon footprint. Although GHGs occur naturally in the atmosphere, their growing concentrations have come to be associated with climate change. In order to make comparisons and analysis easier, GHG emission levels or carbon footprint (CFs) are often reported in terms of carbon dioxide equivalents (CO2 EQ) [31,38]. This measure standardizes a common understanding of emissions and what those emissions mean to climate and sustainability studies [31].

5. Data Collection for GHG Emissions

GHG emissions from PI can be measured directly onsite or estimated using EFs and models, with the choice depending on the purpose, cost, and feasibility. EFs and models, which use data like fuel consumption, are commonly employed for GHG data collection [12,31,39], and organizations like the Intergovernmental Panel on Climate Change (IPCC) and USEPA develop these factors for accurate emissions estimation. While direct measurements are precise, alternative data sources, such as global CO2 emission databases and national inventories, are also used [31,39,40]. Advanced systems like Geographic Information System (GIS), remote sensing (RS), and optical measurements are increasingly integrated for comprehensive monitoring [31,41]. Satellites and projects like NASA’s “Vulcan” are improving accuracy for tracking GHG sources [31,42,43]. For efficient GHG data collection in PI projects, accuracy, reproducibility, and verifiability are crucial. Since trenchless technologies were introduced in the 1980s, they have resolved many issues of traditional ETs [31].

5.1. Carbon Footprint

The carbon footprint (CF) is a measure of the total amount of GHG emissions, usually expressed in terms of CO2 equivalents, that are produced during the year by an individual, organization, product, or process. These emissions fall into either direct or indirect categories. A direct emission is one that is under the control of an individual or entity. Examples include emissions from personal vehicle use or residential heating through the use of natural gas. Indirect emissions, in turn, are derived from activities that may be influenced by the individual—such as electricity consumption—where the usage, although controlled, would depend on the method of energy generation applied by the provider [4,44].
The framework for CF estimation in PI projects involves selecting GHGs, setting boundaries, and collecting emission data [31,39]. GHG selection depends on the construction activity and guidelines. For example, ETs primarily emit CO2, while some studies include all six Kyoto gases for a more comprehensive analysis [31,45,46]. A study in Indianapolis included CO2 and CH4 emissions in CF calculations [31,47]. Boundary setting identifies the scope of CF estimation, which may include direct emissions and emissions from purchased energy (Tier I and Tier II) and other indirect emissions such as transportation and disposal (Tier III). Although Tier III is broader, it is generally excluded because of its complexity. In most studies, Tier I and Tier II are considered for practical estimation, while Tier III is reserved for advanced evaluations only [31,39].
CF can be categorized into basic CF, covering direct emissions and purchased energy, and full CF, which includes all direct and indirect emissions. Expanding CF estimation may provide deeper insights into sustainability efforts, though advancements in emissions tracking are necessary for accurate implementation [31,39,48]. The CF or carbon profile of a commodity or service comprises the summation of CO2 and other GHG emissions, such as methane and nitrous oxide, over its entire life cycle. This includes stages like production, use, and disposal, measured in kilograms of CO2 equivalents [4,49]. In essence, a CF analysis captures more of the general environmental impact of activities or products.
Comparative carbon emissions studies from various pipeline rehabilitation methods elevate trenchless technologies as environmentally superior to ET. For example, one researched the CF for asbestos cement water main rehabilitation using CIPP and pipe bursting methods. The range of the emissions per 100 m of pipe calculated using NASTT, E-Calc, and NASTT BC was between 2.66 and 3.11 tons, showing the relatively low emissions of these trenchless methods [4]. Similarly, the carbon footprint comparison of SP and PCCP on large-diameter water pipelines showed that SP had a 64% higher carbon footprint due to its energy-intensive manufacturing process, while PCCP produced greater emissions during transportation due to its weight [50]. Another study compared the carbon emissions of ET with trenchless tunnelling methods in rural settings. It quantified emissions from construction equipment and soil hauling along a 25-mile route in Texas. The results showed that trenchless methods generated significantly fewer emissions—887 tons of CO2 compared to 5379 tons from ET—underscoring the environmental advantages of trenchless technologies in reducing carbon footprints [29]. These findings emphasize the importance of adopting sustainable methods to minimize the ecological impacts of pipeline infrastructure projects.

5.2. Case Study

The wastewater basins in urban areas are typically interconnected, allowing sewage to flow to the nearest wastewater treatment plant (WWTP). In large cities with multiple treatment facilities, sewage is directed to the closest WWTP, whereas in smaller cities, all wastewater is generally routed to a single plant. This study focuses on a case in South Pasadena, a city spanning 3.42 square miles in the West Gabriel Valley of Los Angeles County, California, situated between Pasadena and Los Angeles. To address aging infrastructure, South Pasadena initiated a sewer renewal and replacement project funded by the Clean Water State Revolving Fund [4,12].
The project involved the rehabilitation of 390 sewer mains, totaling 116,000 feet of pipeline, primarily using the CIPP method, while 4000 feet of severely damaged pipes were replaced by implementing ET. Data from [12] indicate that 58 sanitary sewer pipes, extending 13,516 feet, were addressed in this project. Of these, 22 pipes were designated for CIPP lining, 36 for ET, and 7 for both spot repair and CIPP lining. Approximately 6561 feet of pipelines were scheduled for CIPP rehabilitation, while 6955 feet were rehabilitated through ET. The pipes, with diameters ranging from 8 to 12 inches, were originally installed between 1908 and 1957, buried at depths of 7 to 16 feet below ground level [4,12].

5.3. Ecological Impact Assessment

Ecological Impact Assessment (EIA), also known as LCA, is a scientific methodology for identifying and assessing the environmental impacts of any process, product, or activity in its whole life cycle. It provides a very useful tool for predicting future changes that may occur in the environment and helps to comply with legislation on environmental issues. LCA is executed in four phases: (1) parameter definition, (2) inventory analysis, (3) impact assessment, and (4) results interpretation [4]. It involves establishing system boundaries and quantifying inputs and outputs in the first stage. The second step sets the goals and scope of the assessment, followed by the collection of data on energy and material usage in the inventory analysis phase. In the impact assessment step, the data from the inventory are used to estimate resource use and emissions, and their likely consequences upon the environment. The final step interprets such results to help in decision-making for processes to reduce environmental impacts through changing resources or processes [4,51].

6. SimaPro Software

The SimaPro Software (v.9.6) embeds Life Cycle Inventory (LCI) databases and standardized impact assessment methods that allow the user to perform LCA and Environmental Product Declarations (EPDs). It serves to create models for waste treatment scenarios, such as landfilling, incineration, composting, and recycling during the end-of-life phase, in addition to developing personalized evaluation scenarios. The software collects data on materials, energy, fuel consumption, and emissions to air, soil, and water for each type of waste, converting emissions into chemical equivalents for impact assessment. Results are presented in bar charts, making it easy to compare various impact categories [4,52].
In addition to the predefined waste treatment scenarios, SimaPro allows for user-defined inputs and emissions proportional to the mass of treated waste. Emissions of materials and fuels are transformed into equivalents of substances for specified impact categories, for example, transformation of emissions to CO2 equivalents when assessing global warming potential. Results are then represented in the form of bar charts where the scenario that has the most impact is scaled up to 100 for ease of comparison with other scenarios [4].

7. Tool for Reduction and Assessment of Chemicals and Other Environmental Impacts

The Tool for Reduction and Assessment of Chemicals and Other Environmental Impacts (TRACI 2.1), developed by the U.S. EPA, is a publicly available framework that allows the analysis of environmental impacts, providing characterization factors for Life Cycle Impact Assessment (LCIA), industrial ecology, and sustainability indicators. It is used to assess products, processes, facilities, organizations, and communities [10]. Impact categories included in TRACI 2.1 are as follows:
  • Ozone depletion (kg CFC-11 equivalents);
  • Global warming (kg CO2 equivalents);
  • Smog (kg O3 equivalents);
  • Acidification (kg SO2 equivalents);
  • Eutrophication (kg N equivalents);
  • Carcinogenics (Comparative Toxic Units for morbidity);
  • Non-carcinogenics (CTUh);
  • Respiratory effects (kg particulate matter 2.5 equivalents);
  • Ecotoxicity (CTUs for aquatic toxicity and fossil fuel depletion in MJ).
TRACI utilizes normalization factors to enable comparisons across impact categories, dividing calculated outputs by the average impact values of a U.S. or Canadian citizen per year. This scaling provides a relative measure of impact, where taller bars indicate higher negative impacts and shorter bars indicate lesser impacts. This normalization allows for qualitative comparisons between impact categories like global warming and smog [4].

8. Comparative Review of CIPP and ET

Table 1 shows a comprehensive comparative review of CIPP and ET with a list of author(s), year of publication, impact parameter(s), focused area method, analysis method used, key findings, and research gaps.

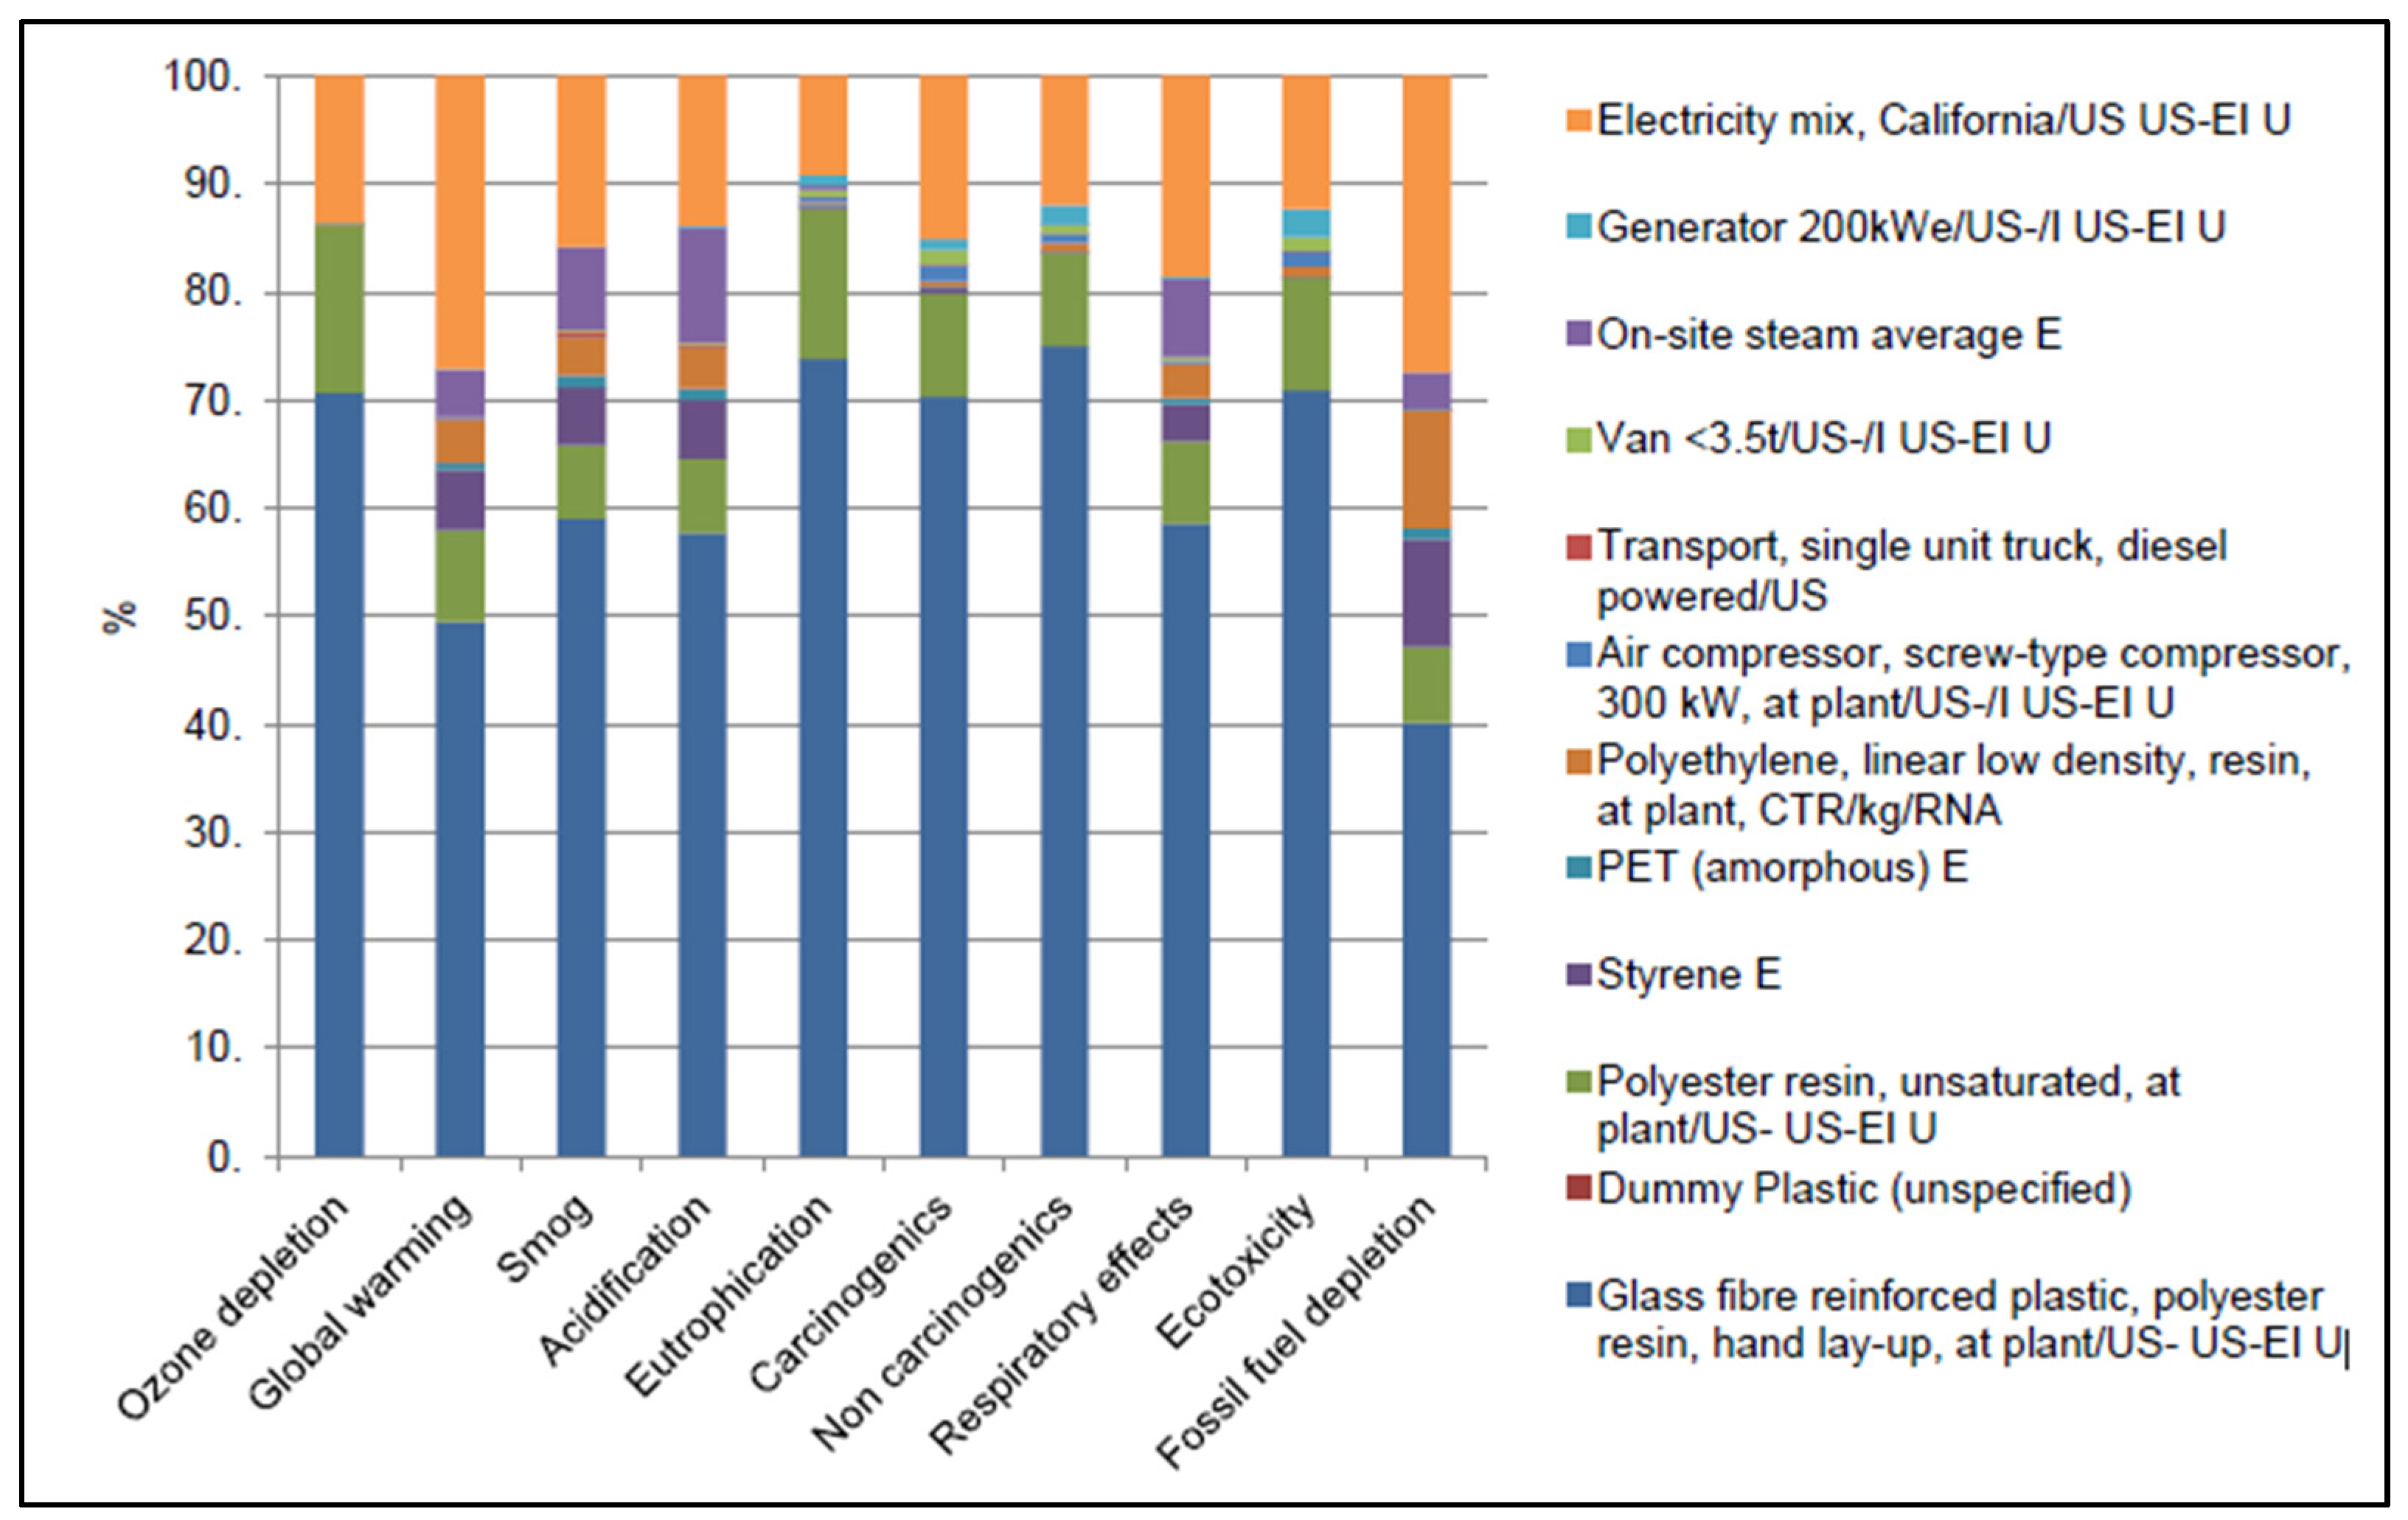
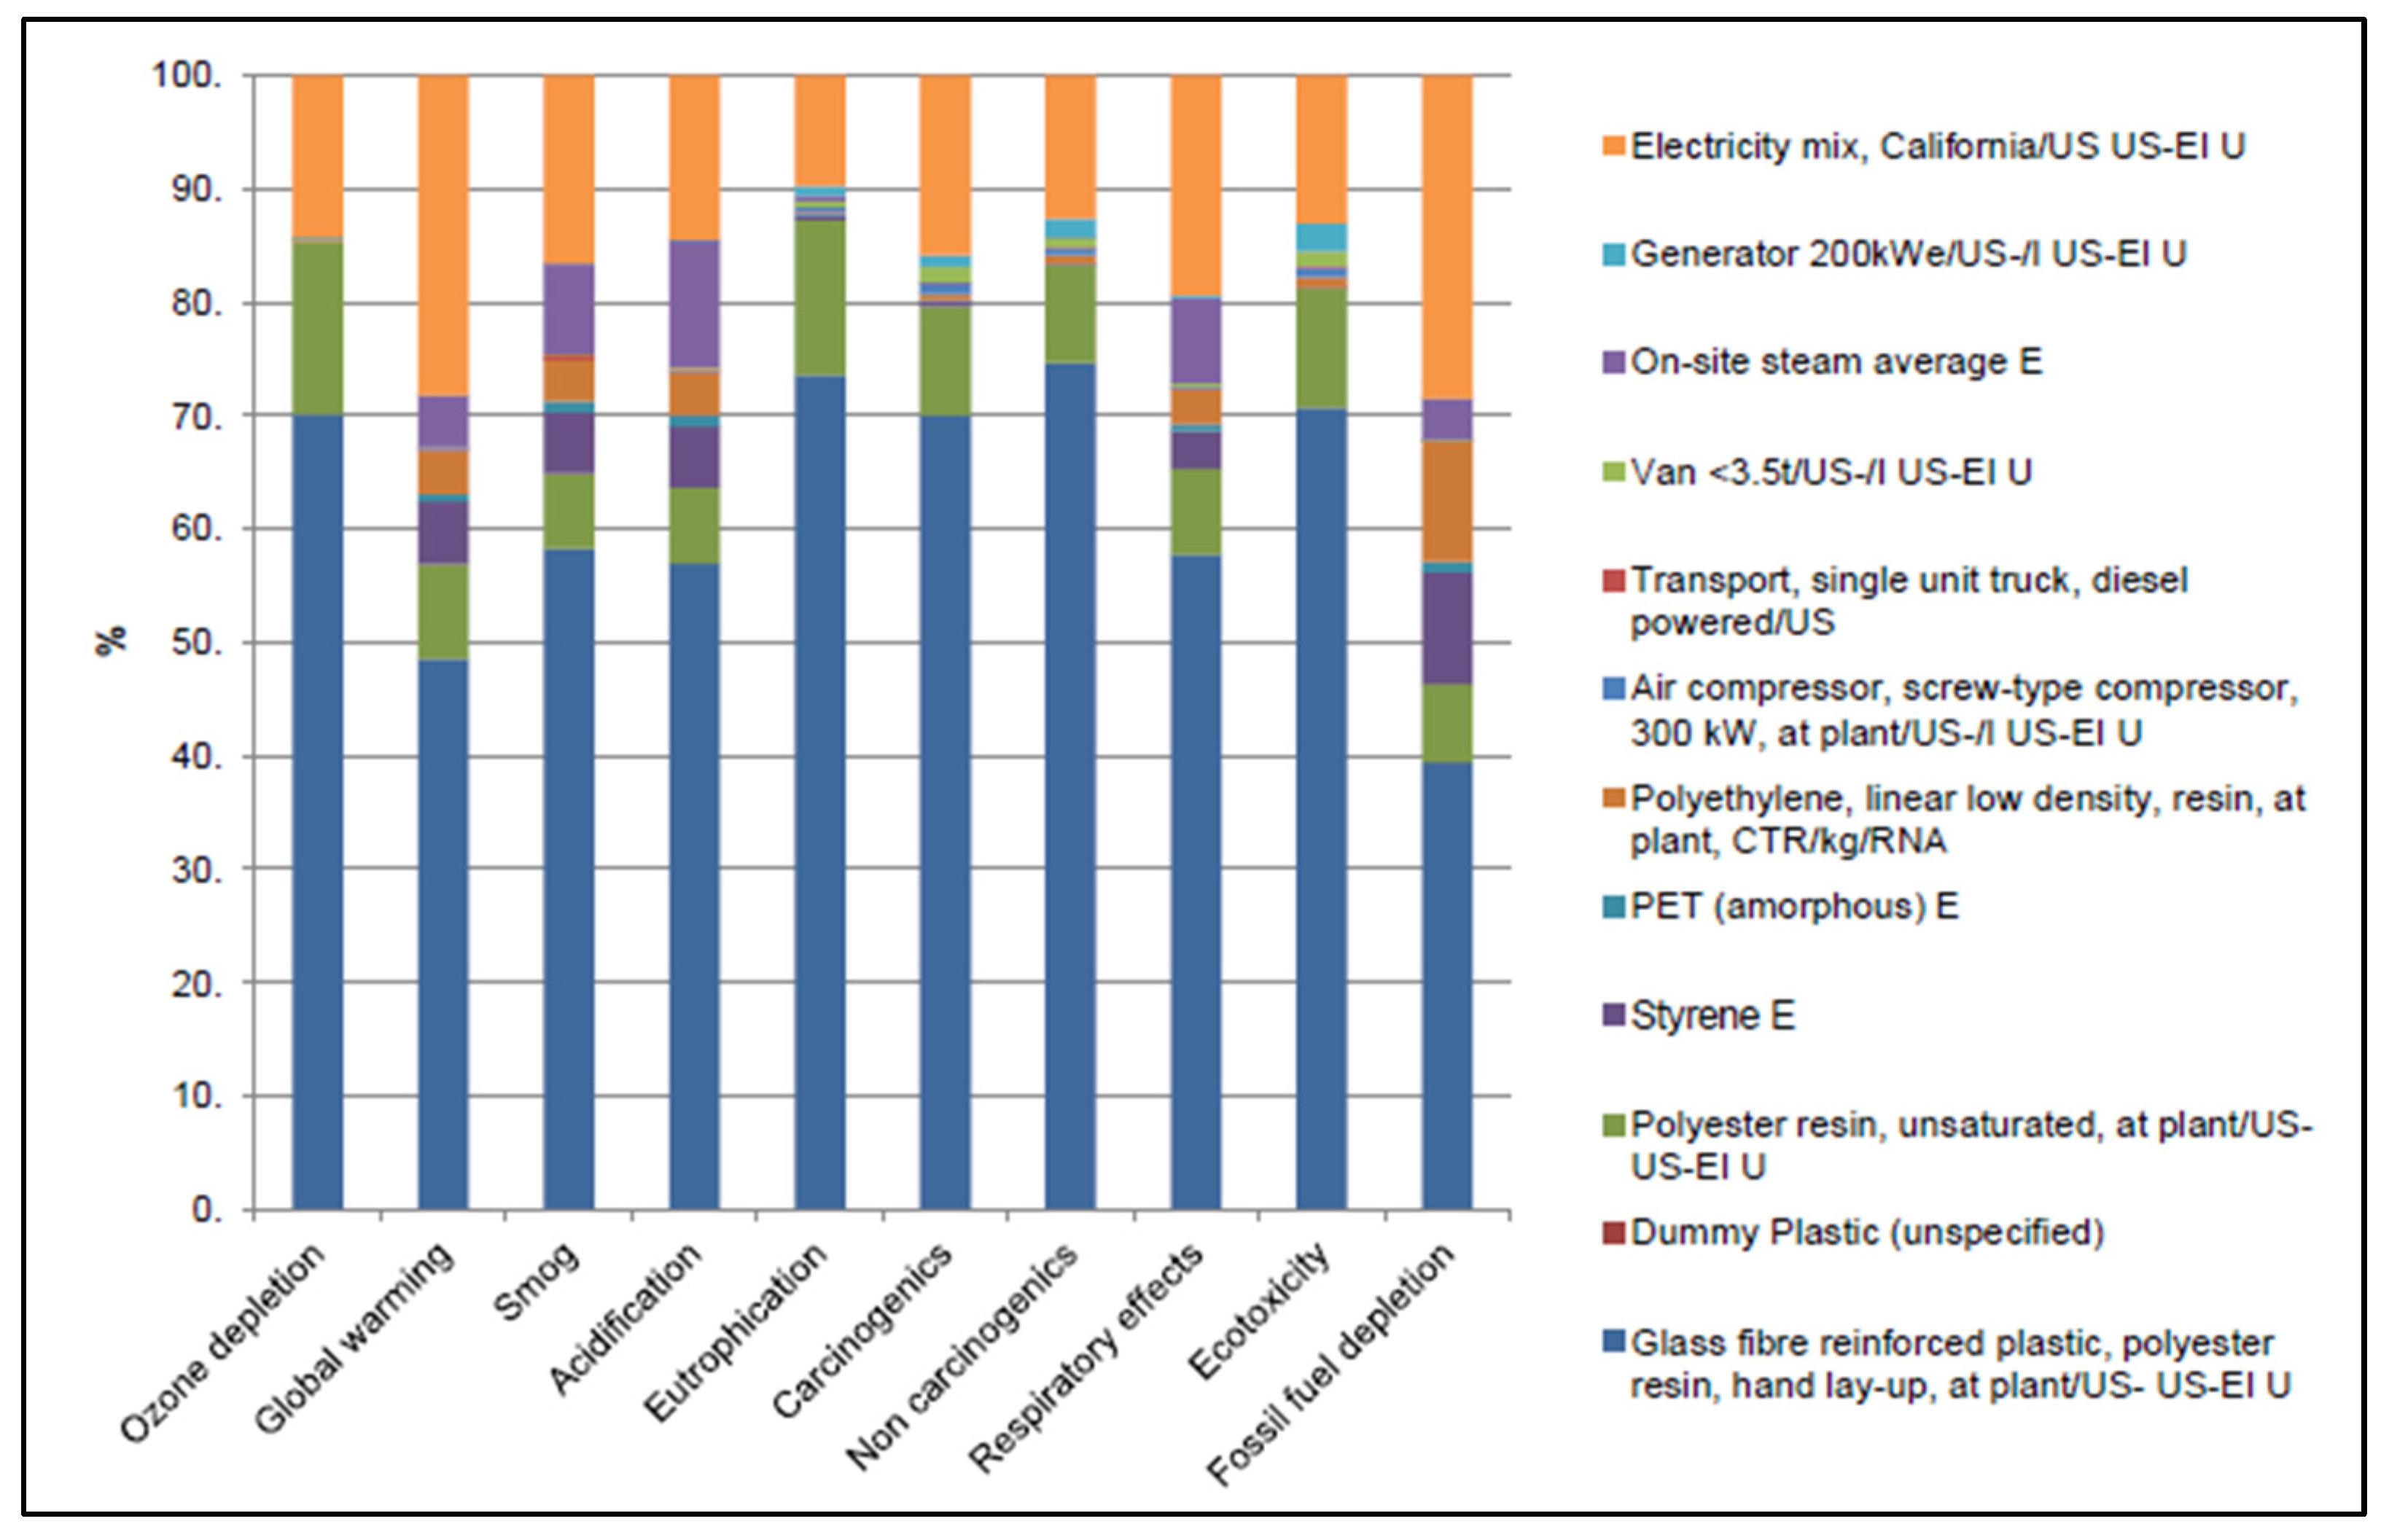
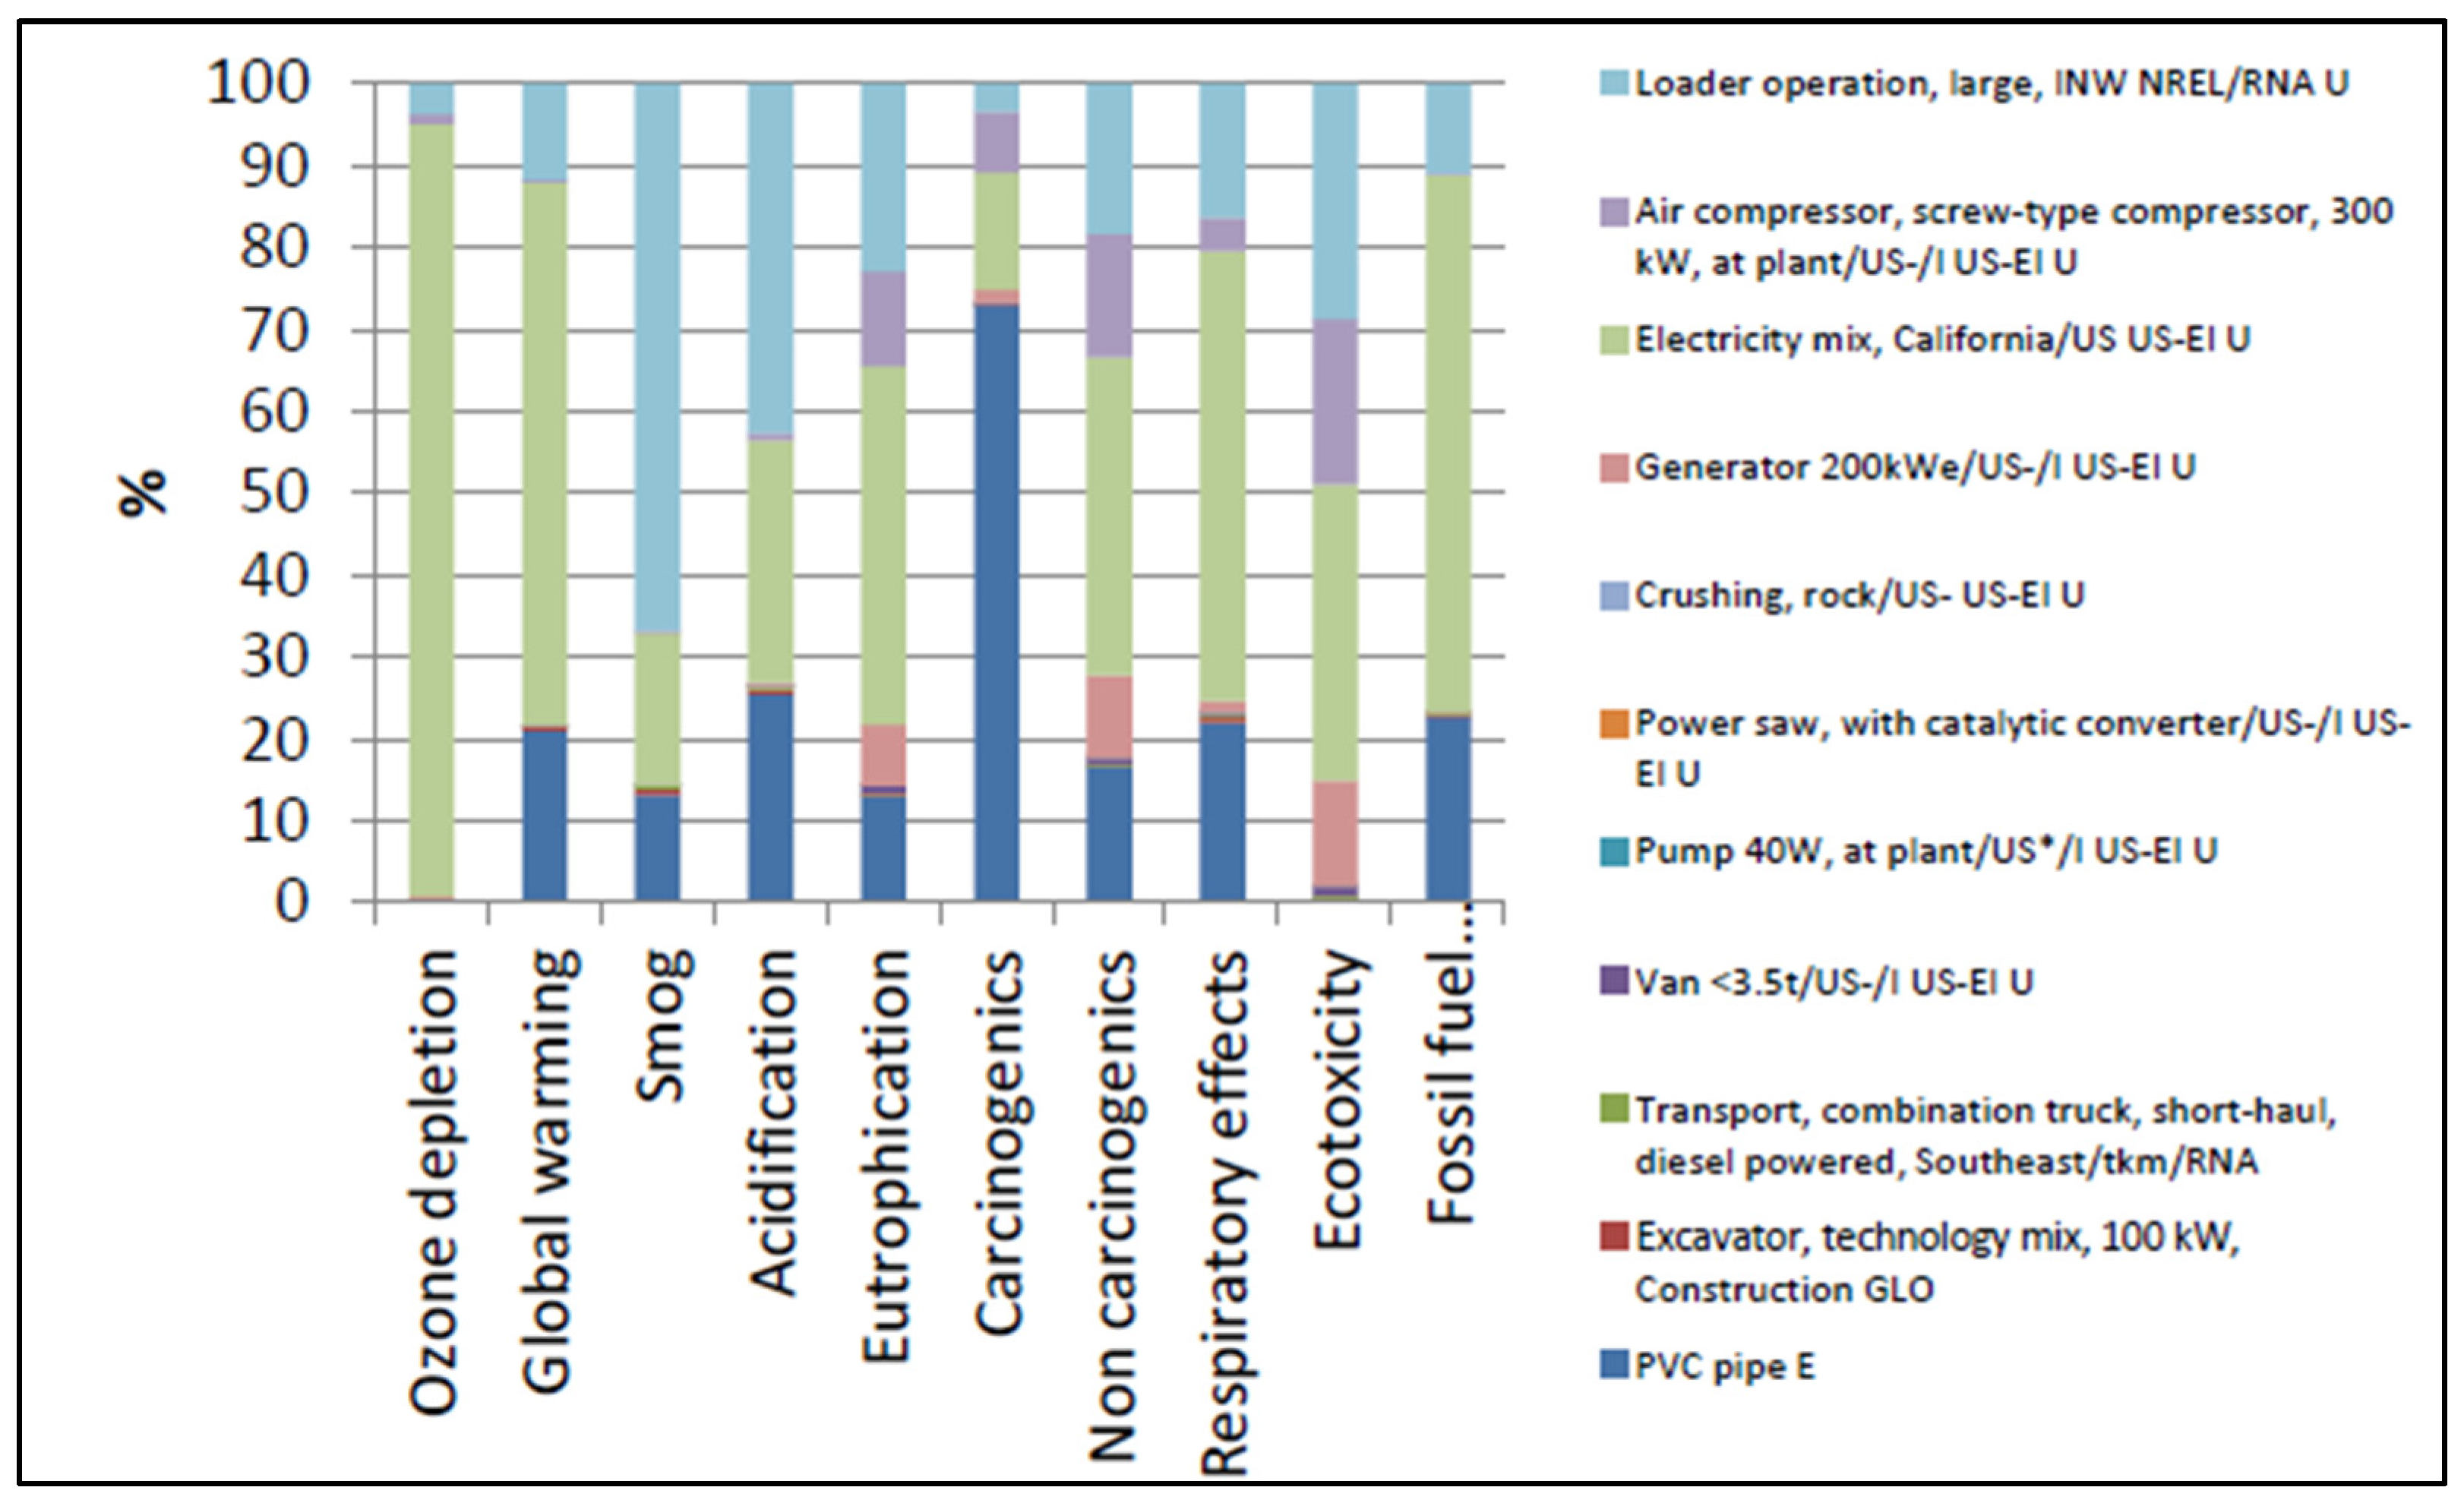
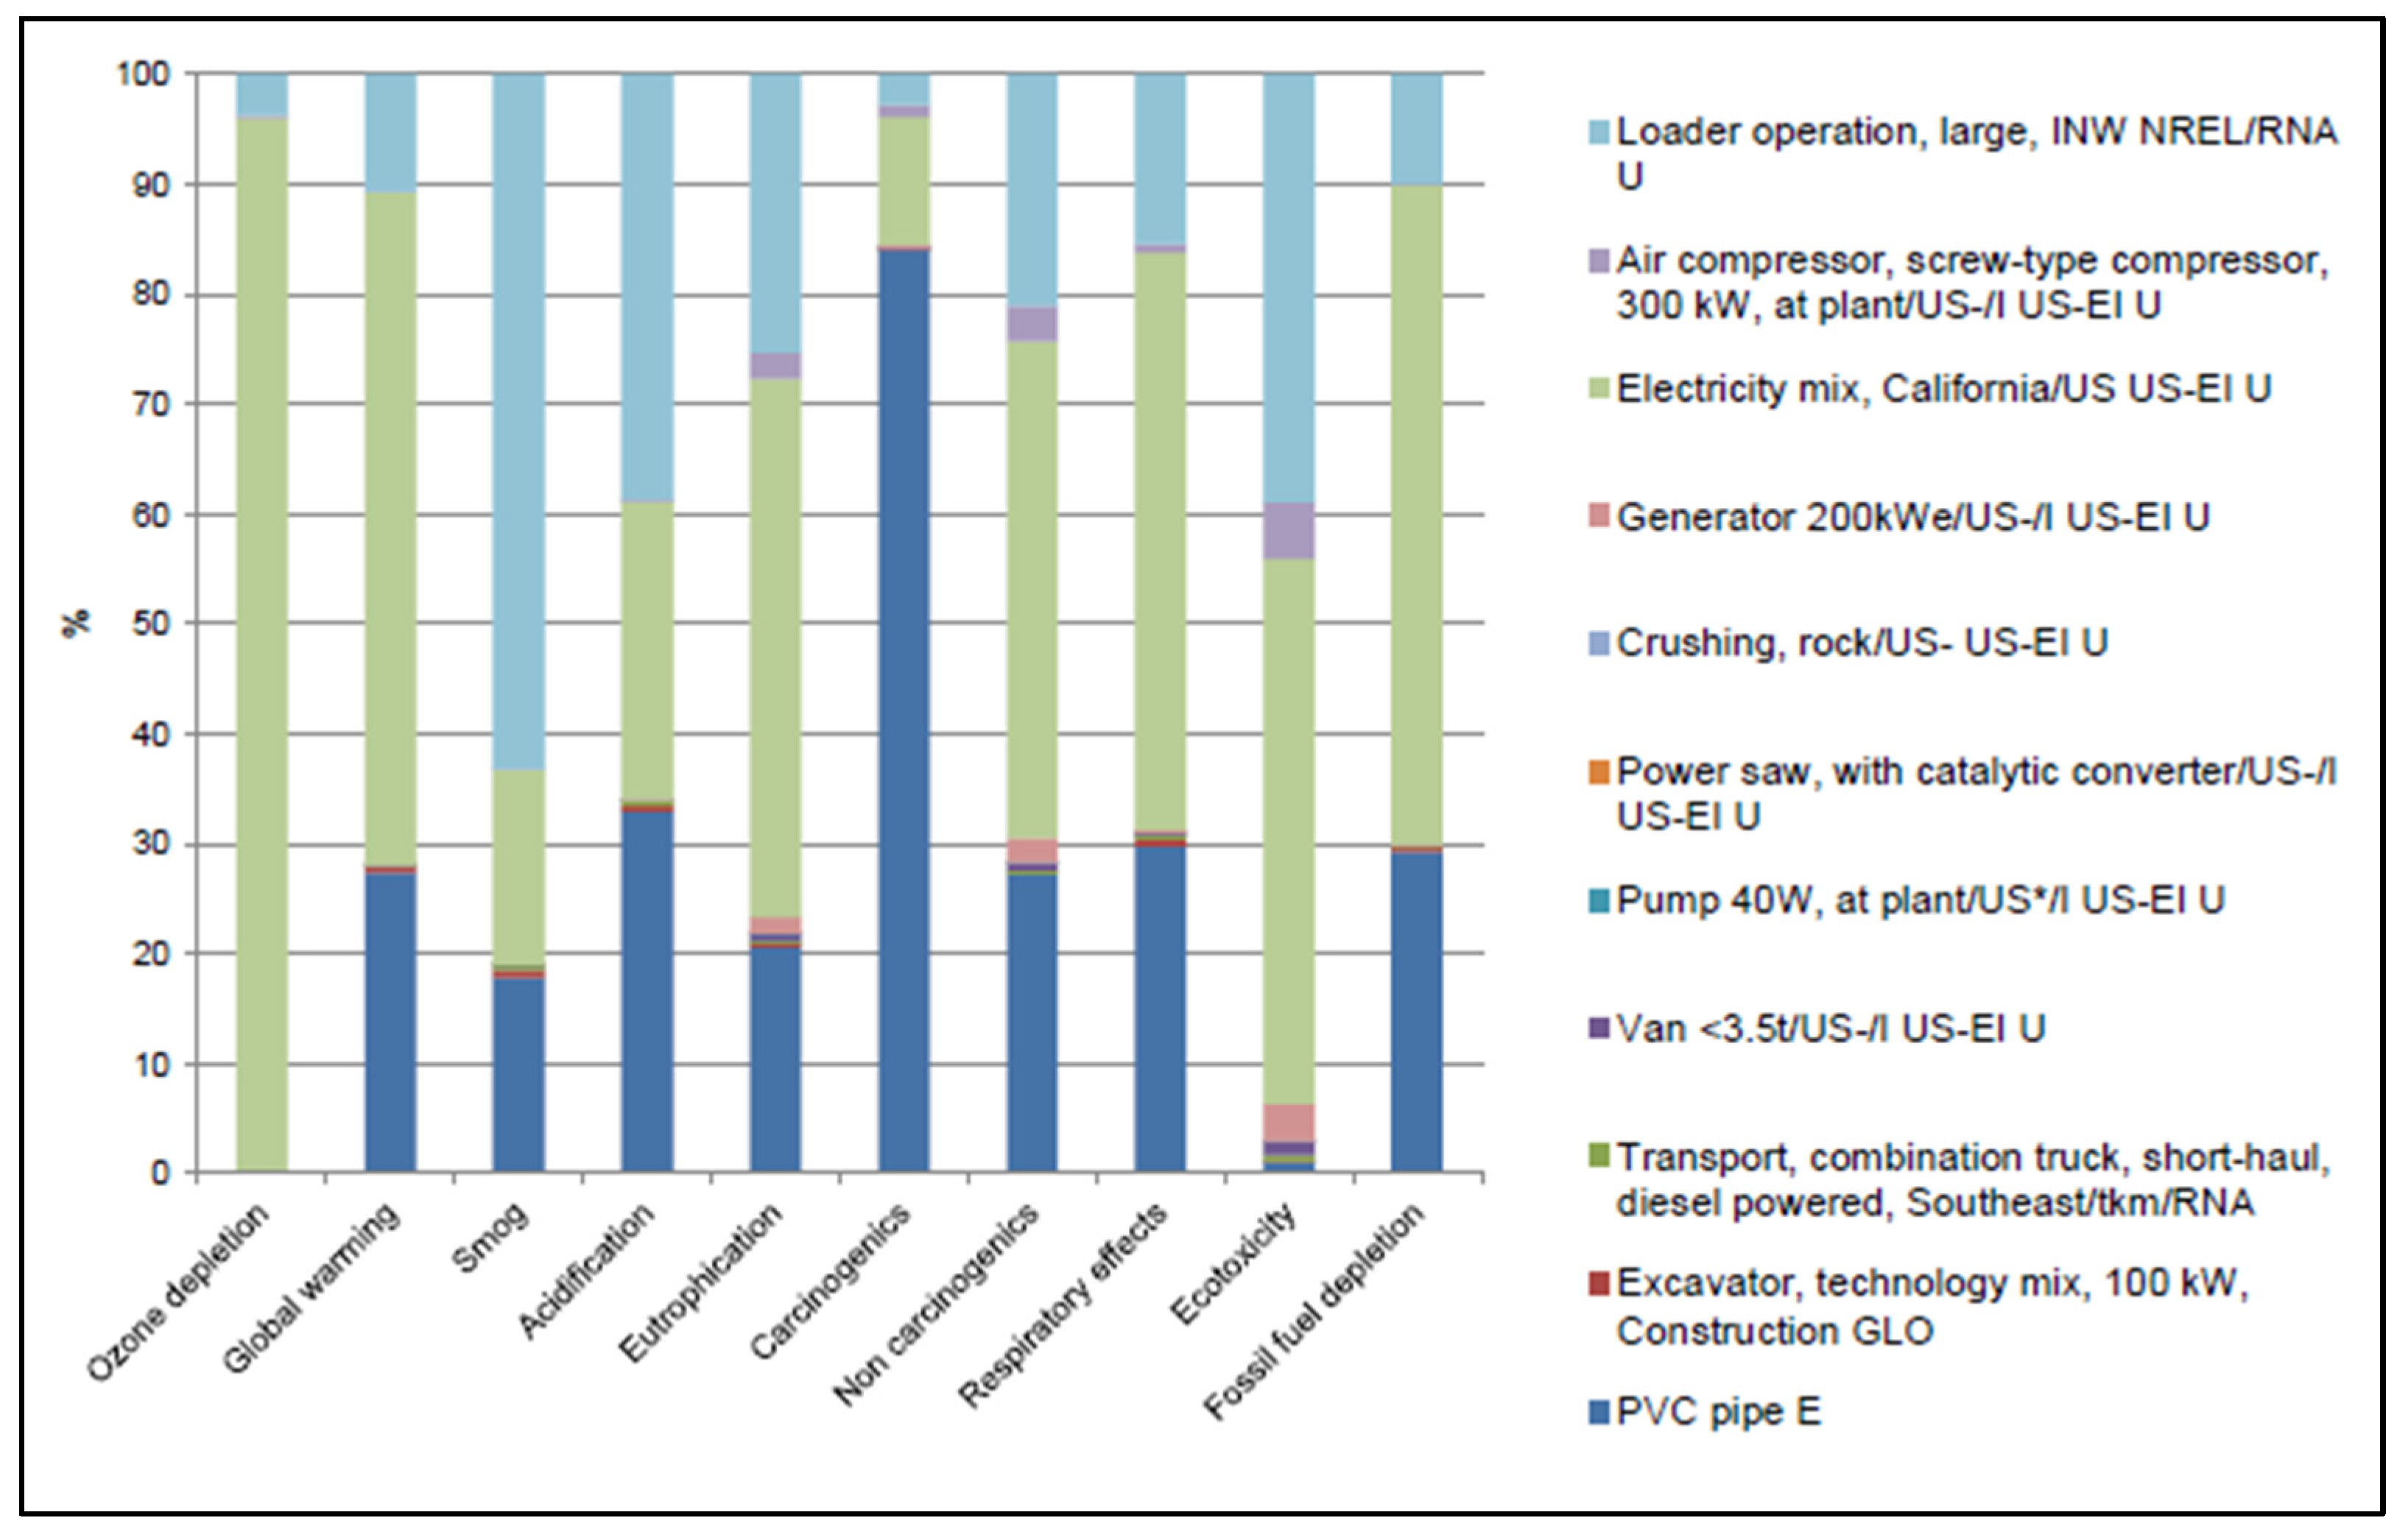
8.1. Emissions from CIPP and ET

Table 2, Table 3 and Table 4 represent the analysis of total emissions from the CIPP Renewal method for 8-inch-, 10-inch-, and 12-inch-diameter pipes. Similarly, Table 5, Table 6 and Table 7 provide the total emissions associated with ET for 8-inch-, 10-inch-, and 12-inch-diameter pipes, respectively, based on the data available from industry sources and case studies.

8.2. Ecological Impact Assessment Processes for CIPP and ET

Figure 1, Figure 2 and Figure 3 illustrate the ecological impacts associated with the CIPP Renewal method for 8-inch-, 10-inch-, and 12-inch-diameter pipes, as determined through SimaPro analysis. Similarly, Figure 4, Figure 5 and Figure 6 present the ecological impacts associated with ETs for 8-inch-, 10-inch-, and 12-inch-diameter pipes, based on SimaPro analysis. The analysis is based on the data available from industry sources and case studies.

9. Discussion and Conclusions

This study presents a comprehensive literature review and analysis to understand the factors influencing environmental emissions from CIPP and ETs. It analyzes and compares the emissions produced from both alternatives for 8-inch-, 10-inch-, and 12-inch-diameter sewer pipes. The comparative analysis highlights the substantial environmental and economic advantages of CIPP over ET. CIPP is more cost-effective and environmentally sustainable, generating 70% fewer ecological impacts, 75% fewer human health risks, and 60% less resource depletion. Moreover, it achieves a 78-100% reduction in carbon emissions compared to ET, which produces 77% more greenhouse gases and 80% more pollutants. The reduced environmental emissions from CIPP will potentially decrease future risks of global warming, environmental pollution, and help in mitigating health risks. Moreover, CIPP consumes less time as compared to ET, due to lower input allocation, less fuel consumption, and minimum surface disruption, thereby decreasing the overall cost of underground infrastructure rehabilitation projects. These benefits make CIPP the greener option for pipeline rehabilitation.
CIPP offers additional advantages, including better worker safety, improved productivity, and superior structural outcomes. In contrast, ET is better suited for challenging geological conditions but comes with significant drawbacks. It involves extensive dewatering, higher project complexity, and greater surface disturbance. ET also produces more greenhouse gas emissions due to its longer project durations and greater resource consumption, further exacerbating its environmental impact. Despite its advantages, CIPP emits styrene, VOCs, and other hazardous chemicals during the curing process. Potential health risks of these chemicals include headache, dizziness, fatigue, and irritation to the eyes and nose, with styrene being carcinogenic to humans. However, these emissions are generally low, dissipate quickly, and rarely result in long-term environmental harm. Recycling materials used in CIPP can reduce its environmental impacts by approximately 10%, further enhancing its sustainability. Conversely, ET’s reliance on large-scale excavation, higher fuel consumption, and significant pollutant emissions leads to greater ecological degradation and a less sustainable profile overall.
In conclusion, CIPP is the more environmentally preferable method, offering significant reductions in greenhouse gas emissions and resource depletion while minimizing health risks. Meanwhile, ET’s higher carbon footprint and environmental costs make it a less sustainable alternative. Improvements in resin technology and emission-reduction practices can further enhance the ecological performance of CIPP, ensuring its continued relevance in sustainable infrastructure projects.

10. Future Research Recommendations

For better understanding of the advantages and disadvantages of both methods, this research can be extended to develop life-cycle cost analysis of the alternatives. The study is limited to carbon footprint analysis and ecological impacts of the methods under specific working conditions. Varying working environments should be incorporated to understand their effects on carbon and other emissions. This paper focuses on analysis for sewer pipes with small diameters (8-inch-, 10-inch-, and 12-inch-diameter pipes). To delve deeper into the ecological effects of sewer rehabilitation, further research should include sewer pipes with medium or large diameters. Additionally, different resin types, liner materials, and curing methods should be taken into consideration for impact assessment of CIPP renewal. As suggested by preliminary studies, advanced testing methods should be implemented to detect harmful substances emitted during the CIPP process, and which remain unexplored. These chemical substances should additionally be identified and studied for potential health risks to workers and surrounding communities, for better mitigation of long-term effects on health. This research can be extended to develop mitigation strategies on reducing styrene and other harmful chemical emissions, which directly reduce impacts on worker and community health. In addition to CIPP, other trenchless methods should also be compared with ETs and assessed based on their carbon emissions and ecological impacts.

Author Contributions

Conceptualization, E.K. and V.K.; Methodology, E.K., V.K., G.T. and M.N.; Investigation, V.K. and M.N.; Resources, G.T.; Writing—original draft, E.K.; Writing—review & editing, V.K., G.T. and M.N.; Supervision, V.K. All authors have read and agreed to the published version of the manuscript.

Funding

This research received no external funding.

Data Availability Statement

The raw data supporting the conclusions of this article will be made available by the authors on request.

Conflicts of Interest

The authors declare no conflict of interest.

References

  1. ASCE. A Comprehensive Assessment of America’s Infrastructure. 2021. Available online: https://wastewater-infrastructure/ (accessed on 2 November 2024).
  2. Ariaratnam, S.T.; Sihabuddin, S.S. Comparison of Emitted Emissions Between Trenchless Pipe Replacement and Open Cut Utility Construction. J. Green Build. 2009, 4, 126–140. [Google Scholar] [CrossRef]
  3. Pipe Spy Inc. What Are Trenchless Sewer Pipe Repair Methods? 2024. Available online: https://www.pipespy.com/blog/what-are-trenchless-sewer-pipe-repair-methods (accessed on 20 May 2024).
  4. Kaushal, V. Comparison of Environmental and Social Costs of Trenchless Cured-in-Place Pipe Renewal Method with Open-Cut Pipeline Replacement for Sanitary Sewers. Ph.D. Thesis, Department of Civil Engineering, University of Texas, Arlington, TX, USA, 2019. [Google Scholar]
  5. Fu, G.; Shannon, B.; Rathnayaka, S.; Deo, R.; Kodikara, J. State of the Art Literature Review on CIPP Liners; CRC Project: Smart Lining for Pipe and Infrastructure; Monash University: Melbourne, VIC, Australia, 2020. [Google Scholar]
  6. Chadalawada, R. Innovative Trenchless Technologies for Installing Underground Fiber Optic Cables are Improving Efficiency while Minimizing Environmental Impact. Eur. J. Adv. Eng. Technol. 2024, 11, 85–98. [Google Scholar]
  7. Tabor, M.; Newman, D.; Whelton, A. Stormwater Chemical Contamination Caused by Cured-in-Place Pipe (CIPP) Infrastructure Rehabilitation Activities. J. Environ. Sci. Technol. 2014, 58, 10938–10947. [Google Scholar] [CrossRef]
  8. Alsadi, A.A.; Matthews, J.C. Evaluation of Carbon Footprint of Pipeline Materials during Installation, Operation, and Disposal Phases. J. Pipeline Syst. Eng. Pract. 2020, 11, 04020005. [Google Scholar] [CrossRef]
  9. Alsadi, A. Evaluation of Carbon Footprints During the Life-Cycle of Four Different Pipe Materials. Ph.D. Thesis, Department of Civil Engineering, Louisiana Tech University, Ruston, LA, USA, 2019. [Google Scholar]
  10. USESPA. Tool for Reduction and Assessment of Chemicals and Other Environmental Impacts (TRACI). 2024. Available online: https://www.epa.gov/traci (accessed on 25 October 2024).
  11. Parvez, J. Life Cycle Assessment of PVC Water and Sewer Pipe and Comparative Sustainability Analysis of Pipe Materials. Proc. Water Environ. Fed. 2018, 2018, 5493–5518. [Google Scholar] [CrossRef]
  12. Ajdari, E. Volatile Organic Compound (VOC) Emission During Cured-in-Place-Pipe (CIPP) Sewer Pipe Rehabilitation. Ph.D. Thesis, Department of Civil Engineering, University of New Orleans, New Orleans, LA, USA, 2016. [Google Scholar]
  13. Das, S. Evaluation of Cured-in-Place Pipe Lining Installations. Master’s Thesis, University of Alberta, Edmonton, AB, Canada, 2016. [Google Scholar]
  14. Ra, K. Chemicals Released from In-Situ Pipe Lining Installations: Current Practices and Water Quality Impacts. Master’s Thesis, Purdue University, West Lafayette, IN, USA, 2017. [Google Scholar]
  15. Kaushal, V.; Najafi, M. Comparative Assessment of Environmental Impacts from Open-Cut Pipeline Replacement and Trenchless Cured-in-Place Pipe Renewal Method for Sanitary Sewers. Infrastructures 2020, 5, 48. [Google Scholar] [CrossRef]
  16. Donaldson, B.M. Environmental Implications of Cured-in-Place Pipe Rehabilitation Technology. Transp. Res. Rec. 2009, 2123, 172–179. [Google Scholar] [CrossRef]
  17. Kampbell, E. Understanding Environmental Implications of CIPP Rehab Technology. Rehabilitation Technology, Underground Technology Cutting Edge Technical Information for Utility Construction and Rehabilitation; FHWA/VTRC 08-R16. 2009. Available online: https://undergroundinfrastructure.com/magazine/2009/april-2009-vol-64-no-4/features/understanding-environmental-implications-of-cipp-rehab-technology (accessed on 22 January 2025).
  18. Kamat, S.M. Comparison of Dust Generation from Open Cut and Trenchless Technology Methods for Utility Construction. Master’s Thesis, The University of Texas, Arlington, TX, USA, 2011. [Google Scholar]
  19. Penders, S.; Melendrez, D. Environmental Effects of Cured-in-Place Pipe Repairs. Caltrans Division of Research and Innovation-Preliminary Investigation; CTC & Associates LLC: Lincoln, NE, USA, 2012. [Google Scholar]
  20. Berglund, D. Life Cycle Assessment Comparison of CIPP-Lining and Traditional Pipe Replacement. Master’s Thesis, Royal Institute of Technology (KTH), Stockholm, Sweden, 2015. [Google Scholar]
  21. Berglund, D.; Kharazmi, P.; Miliutenko, S.; Björk, F.; Malmqvist, T. Comparative life-cycle assessment for renovation methods of waste water sewerage systems for apartment buildings. J. Build. Eng. 2018, 19, 98–108. [Google Scholar] [CrossRef]
  22. Sendesi, S.M.T.; Noh, Y.; Nuruddin, M.; Boor, B.E.; Howarter, J.A.; Youngblood, J.P.; Jafvert, C.T.; Whelton, A.J. An emerging mobile air pollution source: Outdoor plastic liner manufacturing sites discharge VOCs into urban and rural areas. Environ. Sci. Process. Impacts 2020, 22, 1828–1841. [Google Scholar] [CrossRef]
  23. Sendesi, S.M. Improving Worker Safety and Environmental Protection by Understanding Chemical Emissions from Plastic Composites During Manufacture and Use. Ph.D. Thesis, Purdue University, West Lafayette, IN, USA, 2021. [Google Scholar]
  24. Noh, Y.; Boor, B.E.; Shannahan, J.H.; Troy, C.D.; Jafvert, C.T.; Whelton, A.J. Emergency responder and public health considerations for plastic sewer lining chemical waste exposures in indoor environments. J. Hazard. Mater. 2021, 422, 126832. [Google Scholar] [CrossRef]
  25. Matthews, E.; Kraft, J.; Hossain, G.; Bednar, A.; Laber, C.; Alam, S.; Manzur, T.; Matthews, J.; Howell, J.; Eklund, S. Air Quality Dispersion Modelling to Evaluate CIPP Installation Styrene Emissions. Int. J. Environ. Res. Public Health 2022, 19, 13800. [Google Scholar] [CrossRef] [PubMed]
  26. Bavilinezhad, S.; Elledge, W.; Kaynak, B.; Najafi, M.; Kaushal, V.; Hamidzadeh, P. Equipment and Methods for Measuring Volatile Organic Compound Emissions During CIPP Renewal. In Proceedings of the NASTT No Dig 2024 Conference, Providence, RI, USA, 14–18 April 2024. [Google Scholar]
  27. Loss, A.; Toniolo, S.; Mazzi, A.; Manzardo, A.; Scipioni, A. LCA comparison of traditional open cut and pipe bursting systems for relining water pipelines. Resour. Conserv. Recycl. 2018, 128, 458–469. [Google Scholar] [CrossRef]
  28. Joshi, A. A Carbon Dioxide Comparison of Open Cut and Pipe Bursting. Master’s Thesis, College of Technology, Architecture, and Applied Engineering, Bowling Green State University, Bowling Green, OH, USA, 2012. [Google Scholar]
  29. Tavakoli, R.; Najafi, M.; Tabesh, A.; Ashoori, T. Comparison of Carbon Footprint of Trenchless and Open-Cut Methods for Underground Freight Transportation. In Pipelines 2017; ASCE: Reston, VA, USA, 2017. [Google Scholar] [CrossRef]
  30. Onsarigo, L.; Atalah, A.; Roudebush, W. An Introduction to Environmental Value Engineering (EVE) and the EVE Assessment of Horizontal Directional Drilling (HDD) versus Open-Cut Construction. In Pipelines 2014: From Underground to the Forefront of Innovation and Sustainability; American Society of Civil Engineers: Reston, VA, USA, 2014. [Google Scholar] [CrossRef]
  31. Kaushal, V.; Najafi, M.; Serajiantehrani, R. Environmental Impacts of Conventional Open-Cut Pipeline Installation and Trenchless Technology Methods: State-of-the-Art Review. J. Pipeline Syst. Eng. Pract. 2020, 11, 03120001. [Google Scholar] [CrossRef]
  32. Sihabuddin, S.; Ariaratnam, S.T. Quantification of carbon footprint on underground utility projects. In Proceedings of the Construction Research Congress 2009: Building a Sustainable Future, ASCE, Reston, VA, USA, 5–7 April 2009; pp. 618–627. [Google Scholar]
  33. Mohit, S.; Monfared, M.A.N.; Kang, C.; Bayat, A. Comparative study of greenhouse gas emissions from hand tunneling and pilot tube method underground construction methods. J. Green Build. 2017, 12, 54–69. [Google Scholar] [CrossRef]
  34. USEPA. Exhaust and Crankcase Emission Factors for Nonroad Engine Modelling Compression Ignition; EPA-420-R-10-018; USEPA: Washington, DC, USA, 2010. [Google Scholar]
  35. USEPA. Median Life, Annual Activity, and Load Factor Values for Nonroad Engine Emissions Modeling; EPA-420-R-10-016; USEPA: Washington, DC, USA, 2010. [Google Scholar]
  36. Latake, P.T.; Pawar, P.; Ranveer, A.C. The greenhouse effect and its impacts on environment. Int. J. Innov. Res. Creat. Technol. 2015, 1, 333–337. [Google Scholar]
  37. Rudolph, L.; Harrison, C. A Physician’s Guide to Climate Change, Health and Equity; Public Health Institute: Oakland, CA, USA, 2016. [Google Scholar]
  38. ASCE. Guidelines for the Sustainable Design of Pipelines; ASCE: Reston, VA, USA, 2019. [Google Scholar]
  39. Pandey, D.; Agrawal, M.; Pandey, J.S. Carbon footprint: Current methods of estimation. Environ. Monit. Assess. 2010, 178, 135–160. [Google Scholar] [CrossRef]
  40. Dimaranan, B.V. Global Trade, Assistance, and Production: The GTA P6 Database; Center for Global Trade Analysis: West Lafayette, IN, USA, 2006. [Google Scholar]
  41. USCCTP (US Climate Change Technology Program). Technology Options for Near and Long-Term Future; USCCTP: Washington, DC, USA, 2005. [Google Scholar]
  42. Haag, A. Earth Monitoring: The crucial measurement. Nature 2007, 450, 785–786. [Google Scholar] [CrossRef]
  43. Gurney, K.R.; Mendoza, D.L.; Zhou, Y.; Fischer, M.L.; Miller, C.C.; Geethakumar, S.; Can, S.d.l.R.d. High Resolution Fossil Fuel Combustion CO2 Emission Fluxes for the United States. Environ. Sci. Technol. 2009, 43, 5535–5541. [Google Scholar] [CrossRef]
  44. Chilana, L. Carbon Footprint Analysis of a Large Diameter Water Transmission Pipeline Installation. Master’s Thesis, The University of Texas, Arlington, TX, USA, 2011. Available online: https://mavmatrix.uta.edu/civilengineering_theses/62 (accessed on 10 December 2024).
  45. Patel, J. Green sky thinking. Environ. Bus. 2006, 122, 32. [Google Scholar]
  46. Wiedmann, T.; Minx, J. A Definition of Carbon Footprint; ISAUK Research Rep. No. 07-01; ISAUK Research & Consulting: Durham, UK, 2007. [Google Scholar]
  47. Kelly, L.M.; Shepson, P.B.; Strim, B.P.; Karion, A.; Sweeney, C.; Gurney, K.R. Aircraft-based measurements of the carbon footprint of Indianapolis. Environ. Sci. Technol. 2009, 43, 7816–7823. [Google Scholar] [CrossRef]
  48. Carbon Trust. Carbon Footprinting: An Introduction for Organizations. London: Carbon Trust. CE Delft. Handbook Environmental Prices; Carbon Trust: London, UK, 2007. [Google Scholar]
  49. EPLCA. Life Cycle Assessment (LCA). 2007. Available online: https://eplca.jrc.ec.europa.eu/lifecycleassessment.html (accessed on 2 November 2024).
  50. Chilana, L.; Bhatt, A.H.; Najafi, M.; Sattler, M. Comparison of carbon footprints of steel versus concrete pipelines for water transmission. J. Air Waste Manag. Assoc. 2016, 66, 518–527. [Google Scholar] [CrossRef] [PubMed]
  51. ISO 14040:2006; Environmental Management—Life Cycle Assessment—Principles and Framework. International Organization for Standardization (ISO): Geneva, Switzerland, 2006.
  52. Pre-Sustainability. LCA Software for Informed Change-Makers. 2016. Available online: https://network.simapro.com/pre/ (accessed on 16 November 2024).
  53. Jung, Y.J.; Sinha, S.K. Evaluation of Trenchless Technology Methods for Municipal Infrastructure System. J. Infrastruct. Syst. 2007, 13, 144–156. [Google Scholar] [CrossRef]
  54. Rehan, R.; Knight, M. Do Trenchless Pipeline Construction Methods Reduce Greenhouse Gas Emission? University of Waterloo: Waterloo, ON, Canada, 2007. [Google Scholar]
  55. Woodroffe, N.J.; Ariaratnam, S.T. Cost and Risk Evaluation for Horizontal Directional Drilling versus Open Cut in an Urban Environment. Pract. Period. Struct. Des. Constr. 2008, 13, 85–92. [Google Scholar] [CrossRef]
  56. Donaldson, B. Water Quality Implications of Culvert Repair Options: Vinyl Ester Based and Ultraviolet Cured-in-Place Pipe Liners; Virginia Center for Transportation Innovation & Research: Richmond, VA, USA, 2012. [Google Scholar]
  57. Currier, B. Water Quality of Flow Through Cured-in-Place Pipe (CIPP); Final Report; Office of Water Programs, California State University: Sacramento, CA, USA, 2017. [Google Scholar]
  58. Sendesi, S.M.T.; Ra, K.; Conkling, E.N.; Boor, B.E.; Nuruddin, M.; Howarter, J.A.; Youngblood, J.P.; Kobos, L.M.; Shannahan, J.H.; Jafvert, C.T.; et al. Worksite Chemical Air Emissions and Worker Exposure During Sanitary Sewer and Stormwater Pipe Rehabilitation Using Cured-in-Place-Pipe (CIPP). Environ. Sci. Technol. Lett. 2017, 4, 325–333. [Google Scholar] [CrossRef]
  59. Monfared, M.A.N. Comparison of Trenchless Technologies and Open Cut Methods in New Residential Land Development. Master’s Thesis, Department of Civil Engineering, University of Alberta, Edmonton, AB, Canada, 2018. [Google Scholar]
  60. Knight, M.A.; Ioannidis, M.A.; Salim, F.; Górecki, T.; Pivin, D. Health Risks Assessment from Cured-in-Place Pipe Lining Fugitive Styrene Emissions in Laterals. J. Pipeline Syst. Eng. Pract. 2022, 14, 04022056. [Google Scholar] [CrossRef]
  61. Chorazy, T.; Hlavínek, P.; Raček, J.; Pietrucha-Urbanik, K.; Tchórzewska-Cieślak, B.; Keprdová, Š.; Dufek, Z. Comparison of Trenchless and Excavation Technologies in the Restoration of a Sewage Network and Their Carbon Footprints. Resources 2024, 13, 12. [Google Scholar] [CrossRef]
Figure 1. EIA processes for 8-inch-diameter CIPP Renewal.
Applsci 15 01268 g001
Figure 2. EIA processes for 10-inch-diameter CIPP Renewal.
Applsci 15 01268 g002
Figure 3. EIA processes for 12-inch-diameter CIPP Renewal.
Applsci 15 01268 g003
Figure 4. EIA processes for 8-inch-diameter ET.
Applsci 15 01268 g004
Figure 5. EIA processes for 10-inch-diameter ET.
Applsci 15 01268 g005
Figure 6. EIA processes for 12-inch-diameter ET.
Applsci 15 01268 g006
Table 1. Comprehensive literature review of CIPP and ET.
Author(s)YearImpact Parameter(s)Focused Area MethodAnalysis Method UsedKey FindingsResearch Gaps
Jung and Sinha [53]2007Worker Safety, Human Toxicity, Dust Generation, Land Deterioration, Aquatic ToxicityCIPPSewer Scanner and Evaluation Technology
  • CIPP is more economically favorable.
  • CIPP offers greater productivity, improved worker safety, and better structural outcomes.
  • CIPP is more cost-effective for broader societal concerns.
  • There is need for a more comprehensive cost evaluation of trenchless technology.
  • A decision-support system is required to guide method selection.
  • Further research into long-term societal impacts is needed.
Rehan and Knight [54]2007Carbon EmissionsETTraffic Control Plan,
RS Means
CIPP significantly reduces CO2 emissions. Case studies show a 78–100% reduction in greenhouse gas emissions.
  • It focuses only on short pipe lengths and small diameters.
  • Investigating different trenchless methods, road types, and developing a more rigorous analytical model would improve precision.
  • CO2 production, transportation, and second-order effects, such as pavement service life loss, should be considered for a more comprehensive analysis.
Woodroffe and Arairatnam [55]2008Worker Safety, Human Toxicity, Land DeteriorationETInterviewing Various Contractors
  • ET method is effective in challenging geological conditions.
  • This method requires extensive dewatering and support during excavation, increasing project complexity.
  • It causes more surface disruption leading to greater environmental concerns.
  • A detailed study is lacking for ET to determine its effectiveness across various working environments and utility types.
  • A life-cycle analysis encompassing the entire lifespan of the installed utilities would highlight the long-term benefits and limitations of the method.
Arairatnam and Sihabuddin [2]2009Carbon Emissions, Non-Styrene EmissionsETe-Calc Emission Calculator ToolET generates 77% more greenhouse gases and 80% more pollutants.
  • More data are required for precise emission calculations.
  • Research is required to define acceptable emission levels for ET method.
  • Comparative research between ET and other trenchless methods is required.
Kampbell [17] 2009Styrene Emissions, Aquatic ToxicityCIPPSample Collection at CIPP Installation Sites, Styrene Concentration Monitoring
  • No environmental impacts or fish kills due to styrene.
  • Styrene volatized rapidly and is not bioaccumulative. Concentration reduced by 99% within 20 days.
  • Lack of upstream sampling limits styrene emissions to new CIPP installations.
  • Additional research is required to evaluate the impacts of CIPP on aquatic life.
  • Lack of analysis on the economic and environmental costs of the CIPP method.
Donaldson [16]2009Styrene Emissions, Uncured ResinCIPPWater Samples Taken at 7 CIPP Installation Sites,
Observations Taken over the Course of 1 Year.
  • Styrene concentrations crossed the maximum contaminant level at 5 out of 7 sites for drinking water, remained elevated for up to 71 days post installation.
  • Algal blooms observed at multiple sites within a week of CIPP installation.
  • High styrene concentrations in effluent discharges and uncured resin residues were documented.
  • Insufficient data on long-term effects of styrene on the environment.
  • Pre- and post-installation impacts need to be monitored to identify sources contributing to styrene leaching.
Kamat [18]2011Dust GenerationCIPP, ETPersonal Exposure Sampler
  • CIPP produces less RSPM than ET.
  • RSPM produced by CIPP remains lower than that of ET, after increases in temperature, humidity, and production rate.
  • Additional research is needed to understand the safety hazards associated with CIPP and ET due to RSPM dispersion.
  • Research on RSPM minimization pertaining to both methods is required.
Donaldson [56]2012Aquatic Toxicity,
Styrene Emissions, Non-Styrene Emissions
CIPPFlowing Water Test, Immersion Test of Liner Section
  • Vinylic monomer concentrations were higher than toxicity thresholds.
  • Styrene concentrations were below toxicity thresholds.
  • Comparative studies are needed to understand the long-term ecological impacts of styrene-based and styrene-free CIPP.
  • Further testing is required to identify non-styrene chemicals.
Joshi [28]2012Carbon EmissionsETRS MeansTotal CO2 emissions from ET are higher than those from pipe bursting technology.
  • Future research should include pipes of varying lengths, depths and diameters to broaden the scope.
  • CF generated by producing a particular material should be considered, as it can vary.
Penders and Melendrez [19]2012Styrene Emissions, Aquatic Toxicity, Human ToxicityCIPPSurvey and Interviews by the Department of Transportation (DOT) of Virginia
  • Styrene from CIPP was identified in New York, Oregon, and Virginia.
  • Water quality issues were reported in Washington.
  • High styrene emissions in Oregan lead to use of respirators.
  • Research is required to establish an ecological safety threshold, as there is no scientific basis for the current limit.
  • Study highlighting the effect of air inversion over water inversion could optimize ecological safety.
  • Additional data on curing under various temperatures and pipe characteristics is required to determine safe styrene levels.
Onsarigo et al. [30]2014Environmental Impact, Land DeteriorationETEVEET has a 66.2% higher environmental impact as compared to HDD.
  • Other trenchless methods should be compared with ET method for better decision-making process across industries.
  • Further research on minimizing the ecological footprint of ET is required.
Tabor et al. [7]2014Styrene Emissions, Non-Styrene EmissionsCIPPSample Collection, Water Quality Analysis, Solid-Phase Microextraction (SPME) GC−MS, Liquid–Liquid Extraction (LLE) GC-MS, Daphnia Magna Toxicity Testing, Statistical Analysis
  • Styrene emissions were higher at the culvert outlet.
  • The condensate released during curing process was toxic to Daphna magnia.
  • Chemical contaminants were detectable for about 35 days after installation.
  • Elevated levels of heavy metals were present.
Environmental monitoring is mainly focused on styrene. There should be additional research to study the implications of non-styrene compounds.
Berglund [20]2015Ozone Depletion, Human Toxicity, Dust Generation, Land Deterioration, Aquatic ToxicityCIPP, ETLCA through SimaPro modelling, ReCiPe(H) Midpoint Impact Assessment
  • CIPP-lining method is environmentally preferable.
  • Liner materials account for half the impact in CIPP lining and bathroom reconstruction materials in ET.
  • Recycling CIPP liners can reduce environmental impacts by roughly 10%, which favors the use of recyclable materials.
  • The comparative LCA of this study does not consider the total environmental impacts from these Essential Climate Variables (ECVs) since some life cycle stages were omitted, not to mention shared inputs and outputs.
  • Impacts from transportation were not considered.
  • Minor categories of impact might have underestimated the long-term environmental risk.
Ajdari [12]2016Volatile Organic Compound (VOC) Emissions, Carbon Emissions,
Other Emissions
CIPP, ETMethod 8260B for Chemical AnalysisThe CO2 equivalent generated as GHG emissions were higher from ETs than those from CIPP.
  • Further research is required to understand the health and environmental risks of emissions produced during CIPP installation.
  • More research is required to compare waste generation of CIPP and ETs.
  • A comprehensive LCA of both methods is required, which includes GHG and pollutant emissions for environmental impact comparison.
Currier [57]2017VOC Emissions,
Styrene Emissions, Aquatic Toxicity
CIPPField and Simulation Field Water Quality Tests, Sample Collection
  • Styrene concentrations from both field and simulated field tests were low.
  • VOC concentrations were below reporting limits for most water quality tests.
  • Forced heated air curing for UV, styrene-based and styrene-free resin protects aquatic organisms.
  • More studies are required to analyze the VOC behavior across varying soil conditions.
  • Diverse scenarios for CIPP, such as various soil and environmental conditions, should be considered for improved water quality protection.
Ra [14]2017VOC Emissions,
Styrene Emissions, Other Emissions
CIPPDimensions, Imaging and Thermogravimetry analysis
  • Styrene was detected in non-styrene cured resin, indicating cross-contamination.
  • Steam exposure, resin type, and air flow impact chemical residue.
  • Additional studies should highlight equipment cleaning and material handling practices that must be carried out on site.
  • More analytical methods are needed to identify and quantify other compounds.
  • Further study of chemicals used in and created during CIPP installation is required.
Sendesi et al. [58]2017Styrene Emissions, Other EmissionsCIPPPhotoionization Detectors (PIDs), GC-MS, Thermogravimetric Analysis (TGA), Different Scanning Calorimetry (DSC), Proton NMR Spectroscopy
  • Styrene was detected in non-styrene CIPP.
  • Compounds other than styrene were identified.
  • Type and amount of chemicals emitted differed.
  • Further research is needed to characterize chemical emissions, and to determine their ecological impacts.
  • Phases and exposure durations of the emissions should be studied to understand their effect on workers and ecology.
Tavakoli et al. [55]2017Carbon EmissionsETCarbon Footprint Analysis using Statistical Data Carbon footprint produced by ET is very high.Parameters other than carbon emissions must be considered to assess the overall ecological impact of the method.
Berglund et al. [21]2018Ozone Depletion, Human Toxicity, Dust Generation, Land Deterioration, Aquatic ToxicityCIPP, ETLCA through SimaPro modelling, ReCiPe(H) Midpoint Impact AssessmentCIPP method is more environmentally friendly due to lower ecological impacts.Aspects related to impact on workers and occupants’ health due to dust and the process itself were not considered.
Loss et al. [27]2018Ozone Depletion, Human Toxicity, Dust Generation, Land Deterioration, Aquatic ToxicityETLCA through SimaPro modelling, ReCiPe 2008 H/H Europe Midpoint Impact Assessment
  • ET has higher impacts due to excavation of larger soil volumes.
  • It generates more GHG emissions.
  • It leads to more fuel consumption.
  • Environmental assessment and comparison with trenchless technologies is lacking.
  • Production processes of various materials used will be helpful in better assessment of the environmental impacts.
  • The research is limited to urban environments and could be expanded to extra-urban context.
  • Indirect effects of underground deposition of the old pipe remain unexplored.
Monfared [59]2018Carbon Emissions, Other EmissionsETEmission FactorGHG emissions produced by ET are high due to longer project durations and greater resource allocation.
  • More trenchless methods should be assessed for their benefits.
  • Comparative studies between ET and trenchless methods should be conducted to understand their environmental impacts.
Kaushal [4]2019Ozone Depletion, Human Toxicity, Land Deterioration, Aquatic ToxicityCIPP, ETLCA through SimaPro modelling, TRACI 2.1 Impact Assessment Tool
  • CIPP reduces ecological impacts by 68%, human health impacts by 75%, and resource depletion by 62%, as compared to ET.
  • Liner, felt, and resin contribute towards 70% of the impact for CIPP, whereas 68% of the impact caused by ET is due to equipment power consumption and pipe material use.
  • CIPP resulted in lower ozone depletion, human toxicity, aquatic toxicity and land deterioration.
  • For better analysis of the ecological impacts of CIPP and ET, prediction, and spreadsheet models should be developed.
  • Additional research should be conducted to assess the environmental impacts of CIPP and ET based on different curing methods.
  • Further exploration should include pipe characteristics for impact assessment.
  • Various soil and surface conditions should be considered while assessing both processes.
Kaushal and Najafi [15]2020Ozone Depletion, Human Toxicity, Land Deterioration, Aquatic ToxicityCIPP, ETLCA through SimaPro modelling, TRACI 2.1 Impact Assessment Tool
  • CIPP resulted in lower ozone depletion, human toxicity, aquatic toxicity and land deterioration, as compared to ET.
  • More data pertaining to similar projects and site conditions is required for better assessment.
  • The results are based on a case study for small diameter sanitary sewers. The scope could be broadened for more generalized results.
Kaushal et al. [31]2020Carbon EmissionsETLiterature Review, Emission Factor
  • ET generates higher GHG emissions due to longer project durations and more equipment usage.
  • Selection of appropriate material can significantly reduce carbon emissions depending on pipe characteristics and installation method.
  • Life cycle cost and carbon footprint should be considered for better decision making.
  • More comparative studies between ET and trenchless technologies need to be conducted.
  • Broader environmental categories should be considered for future research.
  • A decision-making framework incorporating environmental, economic, and project duration factors should be developed.
Sendesi et al. [22]2020Styrene Emissions, VOC Emissions, Other EmissionsCIPPSample Collection, Chemical Air Monitoring
  • CIPP releases VOCs and styrene in significant amounts.
  • Other hazardous compounds are also found to be released from CIPP.
  • High VOC emissions are hazardous to the health of workers and communities.
  • Additional research is required to detect non-styrene VOCs and other harmful compounds.
  • More studies should explore resin improvement techniques, post-curing treatments, and emission control measures.
Sendesi [23]2021Styrene Emissions, VOC Emissions, Other Emissions, Human Toxicity, Uncured ResinCIPPPIDs, GC-MS, Thermogravimetric Analysis (TGA), Different Scanning Calorimetry (DSC), Proton NMR SpectroscopyStyrene emissions, VOCs, and hazardous compounds were detected through uncured resin residue from CIPP.
  • Additional testing methods should be utilized for chemical identification and quantification of emitted compounds from CIPP.
  • Risk assessment is required to consider components such as water vapor, particulate matter, partially cured resin, for better mitigation strategies.
Knight et al. [60]2022Styrene Emissions, VOC Emissions, Human ToxicityCIPPField Study using PIDs, Waterloo Membrane Samplers, Styrene Analytical Risk Assessment Model, WMS
  • Harmful emissions, such as styrene and VOCs, can be prevented by using water-filled P-traps.
  • PIDs are applicable only to detect emissions and not for quantifying health risks.
  • WMS is a promising tool to analyze health exposure risks to styrene and VOCs for workers and communities.
  • Advanced research is required to assess the gas composition at CIPP sites for accurate styrene correction factors in emission monitoring.
  • More studies are needed to validate the effectiveness of WMS across different scenarios and working conditions.
Noh et al. [24]2022Styrene EmissionsCIPPPressure Calculation, Chemical Air Contamination and Decontamination Model
  • CIPP causes high exposure to styrene.
  • Styrene concentrations in indoor air are affected by bathroom exhaust fans and door air leakage.
  • More research is required to explore indoor air chemical exposure due to CIPP.
  • Further study should be conducted to assess health risks caused by CIPP.
Matthews et al. [25]2022Styrene Emissions, Human ToxicityCIPPField Measurements, AERMOD Modelling System
  • Styrene concentrations dissipate quickly
  • Health impacts outside the safety perimeter are unlikely.
  • Future research should model styrene emissions from uncured resin during different stages of the CIPP process.
  • Various environmental conditions should be considered for further research on emissions during the process.
Bavilinezhad
et al. [26]
2024VOC EmissionsCIPPPIDs, Summa Canisters, Passive Worker Samplers, Method 18 PUF/XAD Cartridges, Portable GC-MS unit
  • Non-styrene polyester resins do not exceed exposure limits.
  • Styrene concentrations detected were below the established limits.
Further research should include different resin types and curing methods.
Chorazy et al. [61]2024Carbon EmissionsETField Study, Emissions EquationET has a high carbon footprint value of 24.29 metric tons of CO2 eq.
  • Existing carbon footprint tools have error rates of 10–20%, therefore requiring more precise data.
  • Soil and environmental factors should be considered for better assessment of the method.
Table 2. Results for 8-inch-diameter CIPP Renewal.
Impact
Category
UnitGlass Fiber-Reinforced PlasticDummy PlasticPolyester ResinStyrene EPET
(Amorphous)
Polyethylene (Linear Low-Density, Resin, at Plant, CTR/kg/RNA) *Total
Emissions
Ozone depletionkg CFC-11 eq0.00768N/A0.00169N/AN/A2.85 × 10−50.0109
Global warmingkg CO2 eq1.11 × 105N/A1.91 × 1041.28 × 1041.57 × 1038.91 × 1032.24 × 105
Smogkg O3 eq4.75 × 103N/A542433892878.015 × 103
Acidificationkg SO3 eq408N/A48.438.67.26527.357706
Eutrophicationkg N eq172N/A31.70.9110.230.541230
CarcinogenicsCTUh0.00364N/A0.0004992.85 × 10−64.015 × 10−62.34 × 10−50.00525
Non-carcinogenicsCTUh0.0238N/A0.002732.38 × 10−61.15 × 10−60.0002460.0318
Respiratory effectskg PM2.5 eq30.11N/A3.9181.7460.3171.61651.31
EcotoxicityCTUe3.27 × 105N/A4.86 × 10447458.884.19 × 1034.64 × 105
Fossil fuel depletionMJ surplus1.91 × 105N/A3.44 × 1044.8 × 1044.84 × 1035.23 × 1044.81 × 105
Note: * SimaPro code.
Table 3. Results for 10-inch-diameter CIPP Renewal.
Impact
Category
UnitGlass Fiber-Reinforced PlasticDummy PlasticPolyester ResinStyrene EPET (Amorphous)Polyethylene (Linear Low-Density, Resin, at Plant, CTR/kg/RNA) *Total Emissions
Ozone depletionkg CFC-11 eq0.00206N/A0.0004515N/AN/A7.82 × 10−60.00289
Global warmingkg CO2 eq3.01 × 104N/A5.131 × 1033.42 × 1034222.43 × 1035.57 × 104
Smogkg O3 eq1.27 × 103N/A14911623.877.912.079 × 103
Acidificationkg SO2 eq113N/A13.3110.571.957.45182
Eutrophicationkg N eq46.225N/A8.620.2470.05970.14561.14
CarcinogenicsCTUh0.000996N/A0.0001337.9 × 10−61.15 × 10−66.39 × 10−60.00134
Non-carcinogenicsCTUh0.00641N/A0.0007446.44 × 10−63.28 × 10−76.75 × 10−50.00833
Respiratory effectskg PM2.5 eq8.173N/A1.0690.4720.0830.43313.26
EcotoxicityCTUe8.876 × 104N/A1.31 × 104129181.15 × 1031.25 × 105
Fossil fuel depletionMJ surplus5.24 × 104N/A9.24 × 1031.32 × 1041.31 × 1031.6 × 1041.23 × 105
Note: * SimaPro code.
Table 4. Results for 12-inch-diameter CIPP Renewal.
Impact CategoryUnitGlass Fiber-Reinforced PlasticDummy PlasticPolyester ResinStyrene EPET (Amorphous)Polyethylene (Linear Low-Density, Resin, at Plant, CTR/kg/RNA) *Total Emissions
Ozone depletionkg CFC-11 eq0.00153N/A0.000332N/AN/A5.656 × 10−60.00221
Global warmingkg CO2 eq2.24 × 104N/A3.79 × 1032.517 × 1033111.77 × 1034.545 × 104
Smogkg O3 eq941N/A11086.7217.657.291.62 × 103
Acidificationkg SO2 eq81.25N/A9.6157.751.445.44141
Eutrophicationkg N eq33.81N/A6.310.1820.04470.10646.15
CarcinogenicsCTUh0.000735N/A9.87 × 10−55.67 × 10−68.06 × 10−84.68 × 10−60.00107
Non-carcinogenicsCTUh0.00471N/A0.0005424.78 × 10−62.44 × 10−74.96 × 10−50.0063
Respiratory effectskg PM2.5 eq5.97N/A0.780.3450.06320.32410.43
EcotoxicityCTUe6.52 × 104N/A9.68 × 10394.4611.788189.21 × 104
Fossil fuel depletionMJ surplus3.867 × 104N/A6.78 × 1039.58 × 1039671.025 × 1049.74 × 104
Note: * SimaPro code.
Table 5. Results for 8-inch-diameter ET.
Impact CategoryUnitPVC Pipe EExcavatorTotal Emissions
Ozone depletionkg CFC-11 eqN/A2.167 × 10−60.00347
Global warmingkg CO2 eq4.278 × 1049872.035 × 105
Smogkg O3 eq2.014 × 10398.71.52 × 104
Acidificationkg SO2 eq1874.656735
Eutrophicationkg N eq140.265108
CarcinogenicsCTUh0.008855.12 × 10−70.01225
Non-carcinogenicsCTUh0.003573.14 × 10−60.0216
Respiratory effectskg PM2.5 eq8.490.25638.25
EcotoxicityCTUe2.04 × 10331.893.53 × 105
Fossil fuel depletionMJ surplus1.01 × 1051.95 × 1034.49 × 105
Table 6. Results for 10-inch-diameter ET.
Impact CategoryUnitPVC Pipe EExcavatorTotal Emissions
Ozone depletionkg CFC-11 eqN/A1.49 × 10−70.000231
Global warmingkg CO2 eq4.13 × 10367.181.52 × 104
Smogkg O3 eq1926.91.07 × 103
Acidificationkg SO3 eq17.810.31754.41
Eutrophicationkg N eq1.340.0186.53
CarcinogenicsCTUh0.0008513.51 × 10−80.00103
Non-carcinogenicsCTUh0.0003442.14 × 10−70.00126
Respiratory effectskg PM2.5 eq0.8110.01722.73
EcotoxicityCTUe1982.171.72 × 104
Fossil fuel depletionMJ surplus9.65 × 1031333.31 × 104
Table 7. Results for 12-inch-diameter ET.
Impact CategoryUnitPVC Pipe EExcavatorTotal Emissions
Ozone depletionkg CFC-11 eqN/A1.47 × 10−70.000231
Global warmingkg CO2 eq5.83 × 10367.11.69 × 104
Smogkg O3 eq2756.51.15 × 103
Acidificationkg SO2 eq25.250.31861.87
Eutrophicationkg N eq1.910.01817.05
CarcinogenicsCTUh0.00133.47 × 10−80.00136
Non-carcinogenicsCTUh0.0004852.115 × 10−70.0016
Respiratory effectskg PM2.5 eq1.170.01743.07
EcotoxicityCTUe2812.161.72 × 104
Fossil fuel depletionMJ surplus1.378 × 1041333.71 × 104
Disclaimer/Publisher’s Note: The statements, opinions and data contained in all publications are solely those of the individual author(s) and contributor(s) and not of MDPI and/or the editor(s). MDPI and/or the editor(s) disclaim responsibility for any injury to people or property resulting from any ideas, methods, instructions or products referred to in the content.

