Article

Root Cause Analysis of a Collapse in a Hydropower Tunnel

1
WSP Canada Inc., 590 McKay Avenaute, Suite 300, Kelowna, BC V1Y 5A8, Canada
2
WSP Canada Inc., 6925 Century Avenue, Floor 6, Mississauga, ON L5N 7K2, Canada
3
WSP Canada Inc., 201 Columbia Ave, Castlegar, BC V1N 1A8, Canada
*
Authors to whom correspondence should be addressed.
Appl. Sci. 2025, 15(3), 1437; https://doi.org/10.3390/app15031437
Submission received: 1 January 2025 / Revised: 25 January 2025 / Accepted: 27 January 2025 / Published: 30 January 2025
(This article belongs to the Special Issue Recent Research on Tunneling and Underground Engineering)

Abstract

:

Featured Application

Tunnel Collapse Root Cause Analysis (Rock Structure, Durability Problems, Laumontite, Overstressing, Transient Water Pressures).

Abstract

This paper describes the investigation and findings from the root cause analysis (RCA) of a significant collapse that occurred in a hydropower tunnel at a confidential location. This collapse involved about 12,000 m3 of material being deposited in the tunnel from a narrow 20 m width failure zone encountered in the haunch and crown area of the main power tunnel. This paper describes contributing factors which include the following: (1) degradation of a highly zeolitized (laumontite-rich) zone of rock within a bedding concordant fault zone, termed the fault-damaged zone or FDZ; (2) relatively high in situ rock stresses concentrated in the haunch and crown area of the collapse zone in the tunnel; (3) large transient water pressure differences in the rock above the collapse zone and upstream and downstream of the collapse zone; (4) cyclical repetition of the above-described factors resulted in the propagation of crown and sidewall collapse in and around the FDZ. Lessons learnt on this project and other projects with similar durability problems in volcanic rock are distilled in this paper. It is hoped that advances made in the understanding of the failure mechanism at the unnamed tunnel can be included in future tunnel investigations and design in volcanic rocks.

1. Introduction

1.1. Overview

The significant collapse highlighted in this paper occurred at approximately 11 km downstream from the portal of a 17 km long hydropower tunnel. The constructed tunnel is a horseshoe-shaped 6 m diameter size opening excavated with drill and blast methods. The location of the tunnel is confidential. The collapse event involved about 12,000 m3 of material being deposited and blocking the main power tunnel, despite originating from a narrow failure zone of only 20 m thickness. The installed support in the collapse zone comprised 2.5 m long rock bolts in a 1.3 m × 1.3 m staggered pattern with a design thickness of 120 mm of fibre-reinforced shotcrete lining. The collapse blocked the tunnel and caused the complete shut-down of power generation. This failure occurred within the tunnel in a sequence of rocks that is described in this paper as the fault-damaged zone (FDZ). The collapse zone is shown schematically in Figure 1.
Following the failure, a by-pass tunnel was constructed around the collapse zone to bring the scheme back into service. The general arrangement of the by-pass tunnel and main power tunnel is shown in Figure 2. The by-pass tunnel intersected the same sequence of rocks (or FDZ) that was present in the collapsed zone in the principal or main power tunnel. This exposure was a result of the NW-SE strike of the meta-volcanic sequence of rocks, i.e., the two tunnels cross the FDZ as a result of the orientation of the tunnels and the general strike of the volcanic units. The following data collection and testing were completed as part of the RCA:
  • Detailed geological mapping and observations of rock conditions within the by-pass tunnel at the location of the same geological sequence as the collapse zone of the main power tunnel;
  • Geotechnical drilling and core logging from an array of holes drilled from the upstream side of the collapse in the main tunnel;
  • Collection of samples from the bore holes around the main tunnel and by-pass tunnel for XRD testing, clay-sized speciation testing, petrographic examination, and swell pressure testing;
  • Detailed mapping of the debris pile as the failure debris material was removed downstream of the collapse.
Figure 2. By-pass tunnel, collapse zone, and main power tunnel layout with geotechnical test holes and geological units encountered in test holes also shown in (A) plan view. (B) Photo showing white veins infilled with laumontite taken in the FDZ during construction of the by-pass tunnel.
Applsci 15 01437 g002
Following data analysis, it was clear that the initiating cause of the collapse was the result of interplay between the mineralogy and geological structure within the 20 m wide failure zone that overload the tunnel liner. The analysis also showed that a combination of other factors (other than the mineralogical factor) contributed to the collapse.
It should be noted that the interaction of the factors described in this paper was undetected and unforeseen at the time of construction despite underground mapping on a round-by-round basis and prescribed ground support being installed prior to tunnel advance. The contributing factors are discussed below in their order of significance to the collapse.

1.2. Collapse and Key Observations

The collapse of the power or main tunnel occurred after the project had been in service for approximately 1 year. The scheme was shut down when the tunnel was completely blocked by the rockfall at the collapse zone. Debris was also noted for about 500 m downstream of the collapse, as shown in Figure 1. Approximately 12,000 m3 of debris is estimated to have entered the power tunnel as a result of the collapse. The geometry or exact extent of the catastrophic collapse void could not be accessed or inspected directly because the throat was blocked, and it was unsafe to excavate the debris (see Figure 1).
A second, much smaller collapse (estimated at about 40 m3) was also observed about 50 m downstream of the main collapse (Figure 1). There were also a number of areas on the tunnel crown and sidewall above the debris deposition zone downstream of the main collapse where significant shotcrete detachment and minor rock spalling were observed. Minor spalling and cracking of the shotcrete were also noted immediately upstream of the collapse and in several other areas located away from the collapse zone.
Post-failure geotechnical holes were drilled to investigate the collapse zone and by-pass alignment. This geotechnical work concluded that the collapse void did not extend a significant distance laterally from the tunnel. The core was retrieved in holes drilled through the FDZ laterally and away from the tunnel side walls, but a void was intersected only above the crown (Figure 2). The by-pass tunnel was designed to be at least 30 m away (along strike) from the collapse zone in the main tunnel in order to avoid the collapse zone and the void in the crown. Given these large material volumes downstream of the collapse, the crown void must have extended a considerable distance above the crown of the tunnel. The exact shape of the collapse above the crown is, however, not known (shown schematically in Figure 1).
With reference to Figure 2 at a high level, the prominent rock units immediately upstream and downstream of the collapse include the following:
  • Hydrothermally altered red tuffs (HARTs);
  • Andesitic agglomerates (AAs);
Within the collapse zone, the rock mass can be broken down further within a zone referred to in this paper as the fault-damaged zone (FDZ). Within the FDZ, the fault-damaged HART unit is observed to stratigraphically overlie a thin unit described as crystal lithic tuffs (CLTs). The boundary between the HART and CLT is a discrete hard contact. The CLT unit has a gradational contact with the lower AA unit which is also fault damaged within the FDZ. The approximate distributions of these distinct lithologies (HART and the CLT grading into AA) relative to the collapse zone are shown in both Figure 2 and Figure 3. Figure 2 also shows that the FDZ intersects the by-pass tunnel.

1.3. Tunnel Design, Construction, and Support Levels

The main power tunnel is a relatively low-pressure hydropower tunnel with a horseshoe shape and approximately 6 m in diameter. It was excavated using drill-and-blast methods with rock support provided by rock bolts, fibre-reinforced shotcrete, and, in places, lattice girders. Potentially swelling hydrothermally altered reddish tuffs (HARTs) were identified during the construction upstream of the collapse and towards the downstream end of the tunnel well beyond the collapse. For this reason, HART zones in both the upstream and the downstream ends of the tunnel (well beyond the collapse) were lined with shotcrete or composite concrete/shotcrete lining, which were designed to resist swelling pressure. Neither of these HART zones was complicit in the collapse, and the support details are not provided here; it is sufficient to say that the support levels upstream of the collapse were similar to those installed in the collapse zone.
It should be noted that the authors of the RCA were not responsible for the original/pre-failure tunnel design (the type and support levels described below are provided for context but were designed by others), but is provided for completeness as part of the forensic RCA. The following references that consider the design of tunnels in swelling rock were reviewed as part of the RCA, including [1,2,3,4,5,6,7,8,9,10,11] to name few. This was important given that significant lengths of the main tunnel were potentially in swelling rock even though these section did not suffer any major damage during the collapse.
As described below, the rock types in the collapse zone had limited to no swelling pressure issues, and the failure mechanism is described in detail below. Where the rock cover was low near the powerhouse, the tunnel was also constructed with a steel penstock to prevent the hydro-jacking of the rock formation. There were no major hydro-fracturing issues related to the collapse other than the effects of transient water pressure during the cyclical collapse, and this is discussed in Section 4.
It should also be noted that the authors of the RCA were not involved in collecting or analyzing the monitoring data during the construction or during the operation of the scheme prior to the collapse. The authors also did not have full access to these data, and it is therefore not possible to provide a comprehensive or meaningful contribution on trends before the collapse other than some anecdotal input that was provided post collapse. Also, given that the tunnel was only operational for approximately 1 year before the collapse, there were no long-term operational monitoring data either.
During the initial excavation of the tunnel, the geologic mapping of the sidewalls, crown, and face of the tunnel was carried out throughout the tunnel and in the vicinity of the collapse as the excavation proceeded. The geotechnical quality of the rock in the tunnel was classified using the Barton’s “Q” index [12,13,14], and the corresponding tunnel design rock class support was selected based on these results.
The operational hydrostatic pressure in the tunnel at the collapse was estimated to be around 40 m of pressure head, and the rock cover above the tunnel is about 600 m at the collapse section. The flow volume in the tunnel before the collapse was about 50 m3/s, and a maximum velocity of about 2 m/s when the powerhouse was operating at full capacity. Q values [12,13] assigned during construction were defined for the long-term operational condition and included a groundwater rating (Jw) to account for operational water conditions in the tunnel, and provisions for higher stress reduction factor (SRF) and/or joint alteration rating (Ja) values were included where swelling conditions were suspected.
In the collapse zone, support installed included Barton’s “Q” values [12] of between 0.1 and 4. The installed support in the collapse zone comprised 2.5 m long rock bolts in a 1.3 m × 1.3 m staggered pattern with a design thickness of 120 mm comprising fibre-reinforced shotcrete lining. The permanent ground support was placed as construction proceeded rather than temporary support followed by permanent support later.
Although some poor-quality rock sections were noted, tunnel mapping during construction did not indicate the presence of any major geological features in the collapse zone that could have provided a warning of abnormally adverse stability conditions that would indicate a 12,000 m3 collapse. A narrow dyke and a near vertical shear zone were observed upstream of the collapse zone, but these geological features did not influence or cross the collapse zone. The RCA identified a bedding concordant fault-damaged zone (FDZ) within the collapse zone, but as described in detail below, this was not a classic cross-cutting fault with weak fault gouge and very weak rock, with high water inflows often associated with ravelling or running ground when tunnelling through major fault zones, whereby problems mostly occur during construction, e.g., refs. [15,16,17,18,19].

2. Geological Observations and Interpretation

2.1. Collapse Zone Geological Observations

Detailed logging, petrographic work, and XRD testing from collapse investigation holes drilled from the upstream end of the collapse (Figure 2) identified two distinct packages of rock upstream and downstream of the collapse zone, respectively (Figure 2 and Figure 3).
Section 1.2 and Figure 2 and Figure 3 describe and show the prominent rock units immediately upstream and downstream of the collapse and within the collapse zone, and the reader should reference these when reading this section and the following sections in this paper.
The contact between the HART and the CLT forms a discrete surface that dips at about 50 degrees to the northeast, and this is concordant with the regional dip of the rock units present in this area. It is also inferred from these holes that the fault-damaged zone (FDZ) straddles this lithological contact and is also sub-parallel to the regional dip of the rock units (i.e., not a cross-cutting fault, which is more common in fault collapse zone in tunnels, e.g., refs. [15,16,17,18,19]). The same rock types were observed in the by-pass tunnel.

2.2. Downstream Observations

The debris pile from the collapse zone extended at least 500 m downstream, and during excavation, to clear the tunnel downstream of the collapse, clear evidence was obtained regarding several discrete deposits of debris, varying between 1 and 2 m in thickness, with traceable boundaries (bedding) between individual deposits. This indicated that deposition occurred in a series of steps, and lobes were deposited sequentially, specifically one on top of the other after each event during sequential collapse events in the FDZ.
Observations downstream of the main collapse zone (for about 200 m downstream of the second collapse, noting that the tunnel was not accessible between the main and second collapse zones for safety reasons—see Figure 1) also show that the spalling of shotcrete preferentially occurred in the 10 o’clock to 12 o’clock position (when facing downstream). This coincides with σ1 orientated in the 1 o’clock to 2 o’clock position (when facing downstream). This statement is also supported in Figure 4, which shows a frequency plot of the spalled shotcrete area and the approximate location in the tunnel profile.
Figure 5 shows the proposed mechanism of spalling downstream of the collapse, which is consistent with the mechanism and observations described by [20]. Once the shotcrete shear strength is exceeded, failures propagate in tunnel rock along maximum principal stress trajectories and form thin plates parallel to the tunnel boundary, as shown in Figure 5. An inspection of the exposed rock behind the spalled areas showed that flakes of rock had broken off in areas of shotcrete detachment. The rock flakes varied in size, from 10 to 20 cm and occasionally up to a metre in diameter. The rock flakes appeared to be plate-like, with the smallest dimension of the flakes typically in the 5 cm to 10 cm range. The flakes seem to either break off sub-parallel to the tunnel sidewall or break off sub-parallel to zeolite-filled veins (see Figure 5).
This type of spalling is believed to be consistent with stress-induced fracturing of the rock (downstream of the collapse) as a result of relatively high in situ stresses in the rock, as shown in Figure 5, noting that stress levels are discussed more fully in Section 3.3. The observations at these downstream locations suggest that the shotcrete spalling is not related to swelling rock, although there are occasional indications of this in the HART rock upstream of the collapse that showed minor shotcrete cracking and spalling but not collapse. This effect is more likely related to swelling pressures in the HART.

3. Factors That Contributed to the Catastrophic Failure

This section discusses multiple factors that acted in an unlikely combination to cause the major failure in the collapse zone. Each factor is discussed below. It is believed that the presence of mainly laumontite (which belongs to the zeolite family of mineral [21]) and minor amounts of swelling clay minerals [10] within the fault-damaged zone (FDZ), relatively high in situ rock stresses, and high transient water pressures in the rock mass, resulted in the ground support being locally overloaded (ref. [22] describes the transient water pressure phenomenon but for unlined hydro tunnels and is not directly applicable), followed by the sequential collapse of the FDZ mostly in the crown of the tunnel. These factors are discussed below.

3.1. Structural, Geological, and Lithological Factors

Based on regional geologic information, the main power tunnel in the vicinity of the collapse intersects an east to northeast dipping (30° to 50° regional dip) sequence of volcaniclastic rocks. The investigation holes were drilled from the upstream end in the main tunnel and were generally angled upwards and around the main tunnel to understand the extent of the collapse zone and to determine if any major faults had been missed during construction. These holes were drilled roughly perpendicular to the regional stratigraphy and downwards in the geological sequence (from younger to older rocks due to the presence of a synclinal regional structure [23]). The regional strike of these units is such that the main tunnel transects the same sequence of rocks present in the by-pass tunnel, although somewhat obliquely (Figure 6 and Figure 7).
As discussed above, three distinct lithologic packages can be projected along the strike to intersect both the collapse zone and the by-pass tunnel. Figure 3 and Figure 7A show schematically the pre-collapse distribution:
(1)
Hydrothermally altered red tuff (HART) upstream of the collapse zone;
(2)
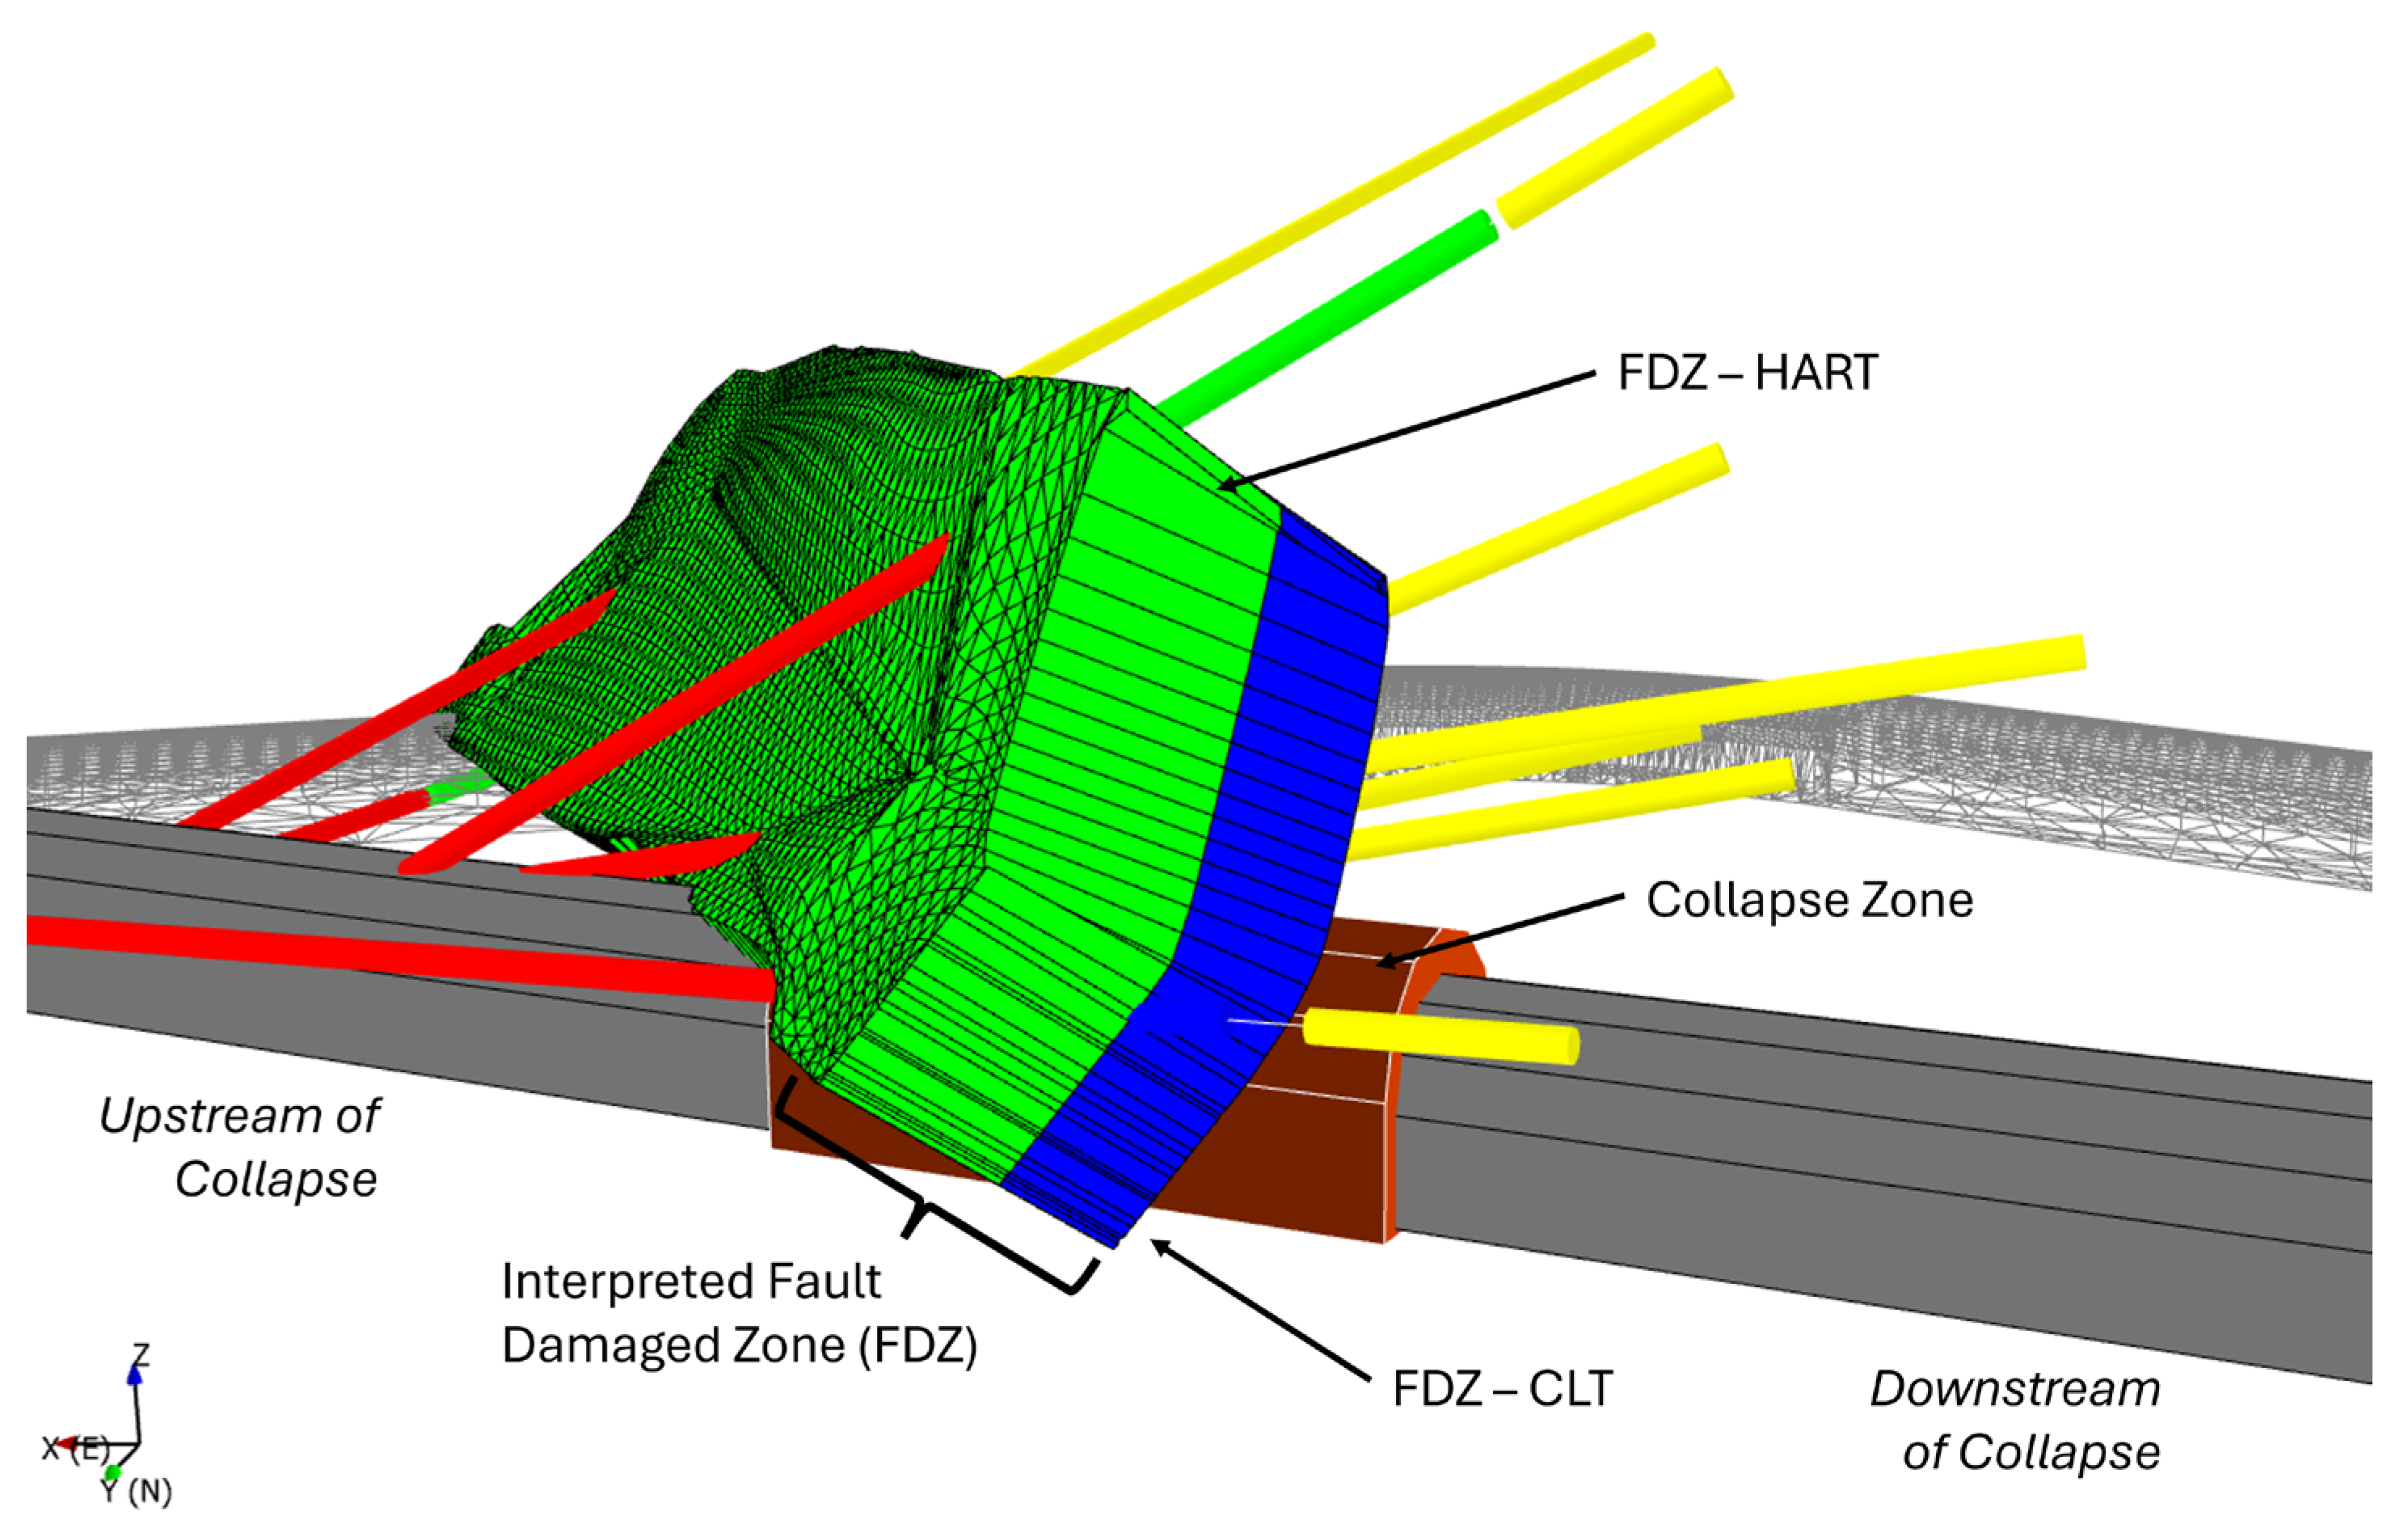
HART within the FDZ and crystal lithic tuff (CLT within the FDZ and AA within the FDZ;
(3)
Andesitic agglomerates (AAs) downstream of the collapse.
Figure 7. Failure mechanism and failure progression for (A) pre-collapse, (B) initial liner failure and Rockfall, (C) additional collapse, rockfall progressing into the FDZ, (D) temporary tunnel blockage, and (E) final collapse.
Applsci 15 01437 g007
In addition to core logging, petrographic examination and XRD testing were conducted on cores from the investigation holes, and these data were used to identify and determine the spatial location of HART, CLT, and AA lithologies as well as the FDZ.
From a regional perspective, the HART stratigraphically overlies the CLT and AA. The contact between the CLT and AA is gradational and is interpreted as representing a gradual change in the deposition style within this epiclastic volcanic unit. The boundary between the HART and the CLT, on the other hand, is a discrete contact. The general coincidence between the FDZ, associated lithologies, and the collapse zone is shown schematically in Figure 3, Figure 6 and Figure 7a–c. The fault-damaged zone (FDZ) straddles the lithological boundary and includes fault-damaged components from the HART, CLT, and AA lithologies.
In addition to identifying the lithological packages, as discussed above, the investigation holes in the main tunnel were also used to delineate the upstream boundary of the collapse in the tunnel crown and laterally from the tunnel. From this work and observations downstream, it was possible to ascertain that there was an approximate 20 m wide crown void above the collapse material. It was not possible to determine the exact shape or extent of the void above the crown, but as shown in Figure 7, the progressing collapse and the final crown void shape where controlled and occurred upward into the upstream dipping FDZ. The drilling investigation programme also determined that there was limited lateral collapse away from the sidewalls of the tunnel.
Based on uniaxial compressive strength (UCS) testing in the investigation holes, the rock mass on either side of the FDZ has very different strengths. Therefore, there is an inherent competency contrast associated with the lithologic packages adjacent to the FDZ:
  • Intact HART in the drill cores that were examined and tested have UCS values of around 25 MPa;
  • AA cores have UCS values of around 75 MPa.
In general, the downstream AA rock is much more competent than the HART. The rock on both sides of the contact between the two lithologic packages was damaged through localized faulting or bedding-type slippage (shown schematically in Figure 8), which occurred between the two mechanically contrasting rock types. Figure 6 and Figure 7 show the inferred geometry of the FDZ prior to the collapse and the coincidence of the FDZ with the collapse in the main tunnel.
It is inferred that fractures developed during bedding plane slippage in the FDZ during tectonic deformation and hydrothermal alteration were subsequently infilled and healed to create zeolite-rich FDZ rocks. Localized discrete faults and shears also occur in the HART and AA rocks away from the collapse zone but played no role in the collapse.
Based on the intersection of the north-easterly dipping FDZ in the by-pass tunnel and the extrapolated position of the lithologic packages within the FDZ between the by-pass tunnel and the main tunnel, there is clear evidence that the FDZ intersects the surveyed location of the tunnel collapse zone (see Figure 7).
Taken together, the existing structural geometry (northeast dip) and the strength contrasts described above are considered to have imposed significant structural and lithological controls on the nature of the collapse and its propagation upwards as a narrow north-easterly dipping chimney-like zone. In other words, the collapse initiated in the FDZ and propagated (mostly upwards) along the FDZ, generally following the orientation of bedding, which controlled the direction of the collapse as well as confining the width of the initial collapse to that of the FDZ to between about 15 m to 20 m.
The structural geological setting of the FDZ, as described above, is just one of the important factors that controlled the nature of the collapse propagation, along with the mineralogical factor (described in detail below). The FDZ intersected in the by-pass tunnel was assessed to have a true perpendicular thickness of about between 13 m and 17 m for dip angles of 30° and 50°, respectively. The maximum inferred width of the FDZ in the investigation holes was 18 m, suggesting a general range of width of the FDZ of between 15 m and 20 m. This is in general agreement with the approximately 20 m width of the collapse zone in the main tunnel, given that the collapse zone likely widened particularly in the hanging wall on the upstream side.
Bedrock outcrops observed during the helicopter reconnaissance in the vicinity of the collapse appear to be relatively continuous on the upper ridges, with little evidence of disruption by major cross-cutting faults, which further corroborates the bedding parallel slippage theory.

3.2. Mineralogical Factor

3.2.1. XRD Testing and Petrographic Examination

The systematic sampling of the core from the investigation holes and from the by-pass tunnel was used for XRD testing (Rietveld method and clay speciation [24]) and petrographic examination to determine the mineralogical make-up of these rocks and to quantify, as far as possible, the percentages of the various mineral assemblages present.
Figure 6 and Figure 7 provide, amongst other things, a general description of the rock types that are present in the area of the collapse and in the collapse zone (FDZ), and Figure 9 and Figure 10 show the distribution and results of XRD quantification of key minerals within and adjacent to the FDZ in both the investigation holes and the by-pass tunnel.
White minerals are visible in veins in all the rocks in the area around the collapse. The XRD testing and thin section examinations established that the white mineral is typically from the zeolite family, and the dominant zeolites present typically include laumontite, analcime, and wairakite (see [21] for more details on zeolites). The key factor here, however, is that the rocks present in the FDZ and the coincident collapse zone have an elevated amount of laumontite compared to the HART rocks upstream. Remember that the FDZ comprises fault-damaged HART rocks; weak, fault-damaged crystal lithic tuffs (CLTs); and fault-damaged andesitic agglomerates (AAs), all of which have zeolite-rich veins and filled fractures (Figure 9 and Figure 10).
The mineralogical differences upstream, downstream, and within the collapse zone can be summarized as follows:
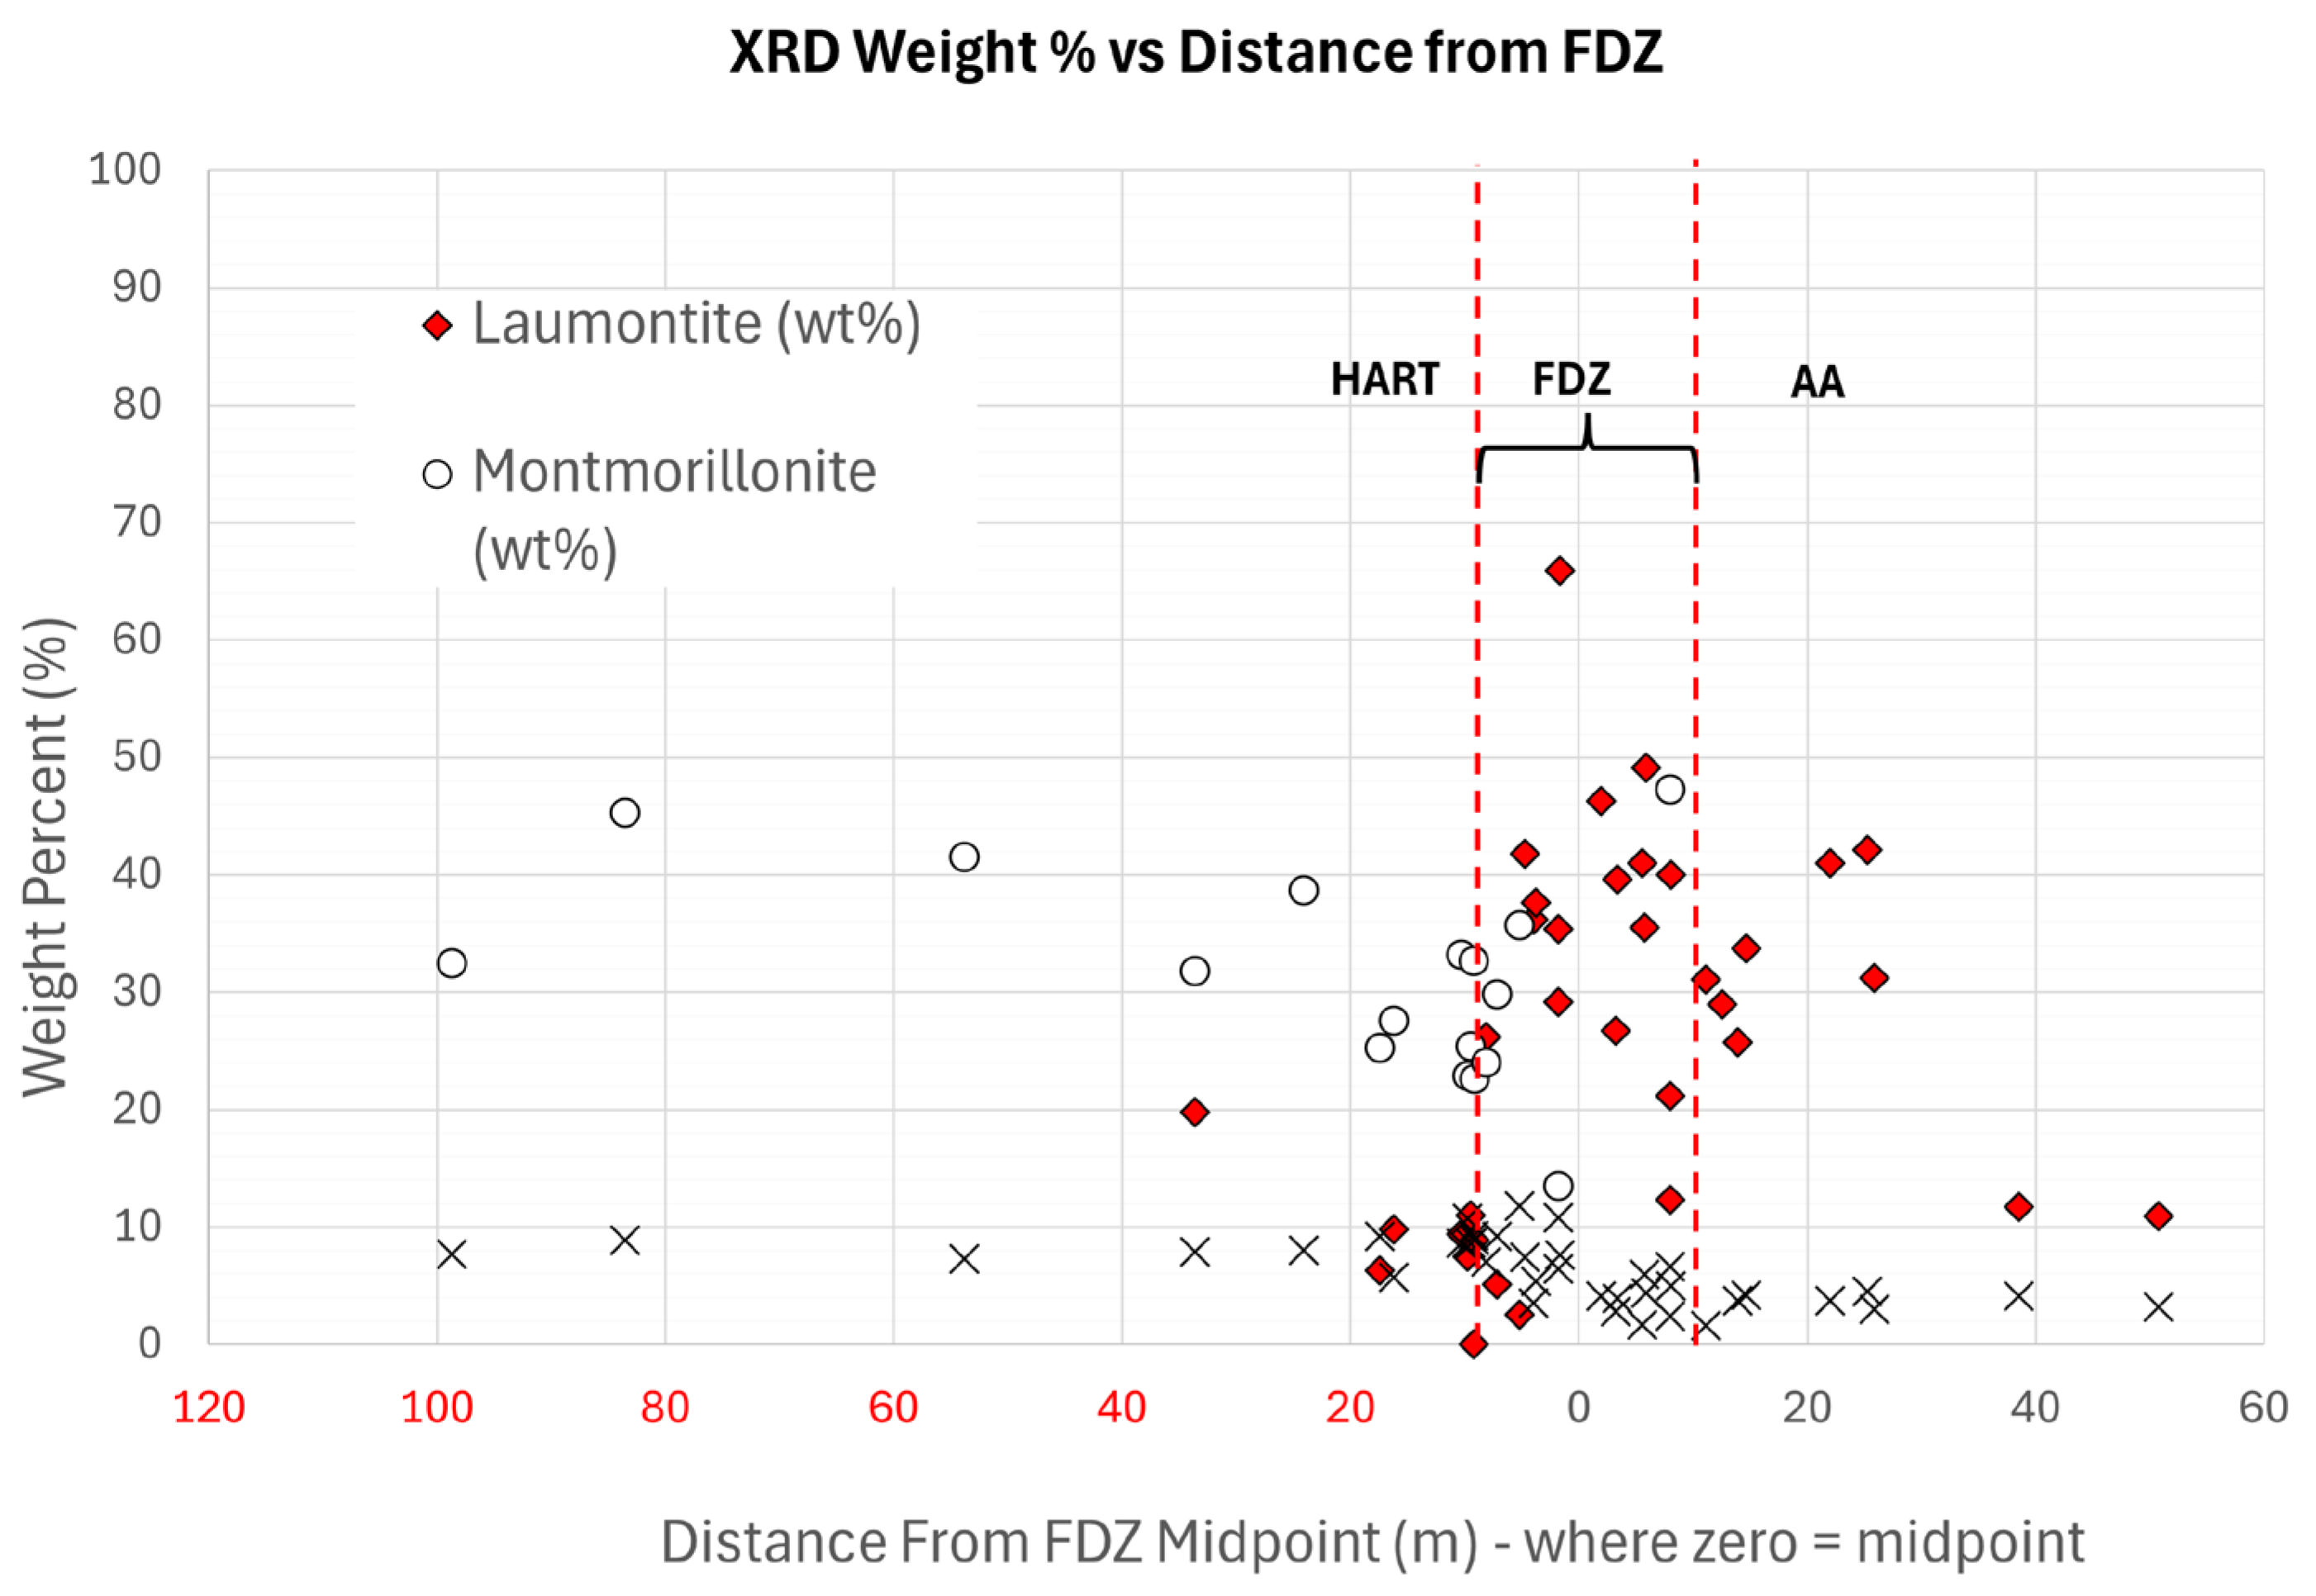
  • As shown in Figure 9 and Figure 10, the upstream HART rock has very little to no laumontite (and are therefore not reactive to dehydration and disintegration—see [21]) but has very high percentages of montmorillonite—a swelling clay [2,3,4,5,6,7,8,10]. As discussed above, despite the presence of montmorillonite in the HART rocks upstream of the collapse, these tuffs were not affected during the collapse (i.e., montmorillonite was only elevated outside the collapse zone);
  • The AA rocks downstream of the FDZ also have an elevated presence of laumontite (Figure 9 and Figure 10), and it is known from petrographic studies of the RCA that the laumontite in AA rocks is present primarily as an alteration product of plagioclase in euhedral mineral grains and (welded) grain-supported rock fragments. The significance of this is that laumontite in the crystals is largely protected to exposure to air or water and therefore is not as prone to desiccation or swelling;
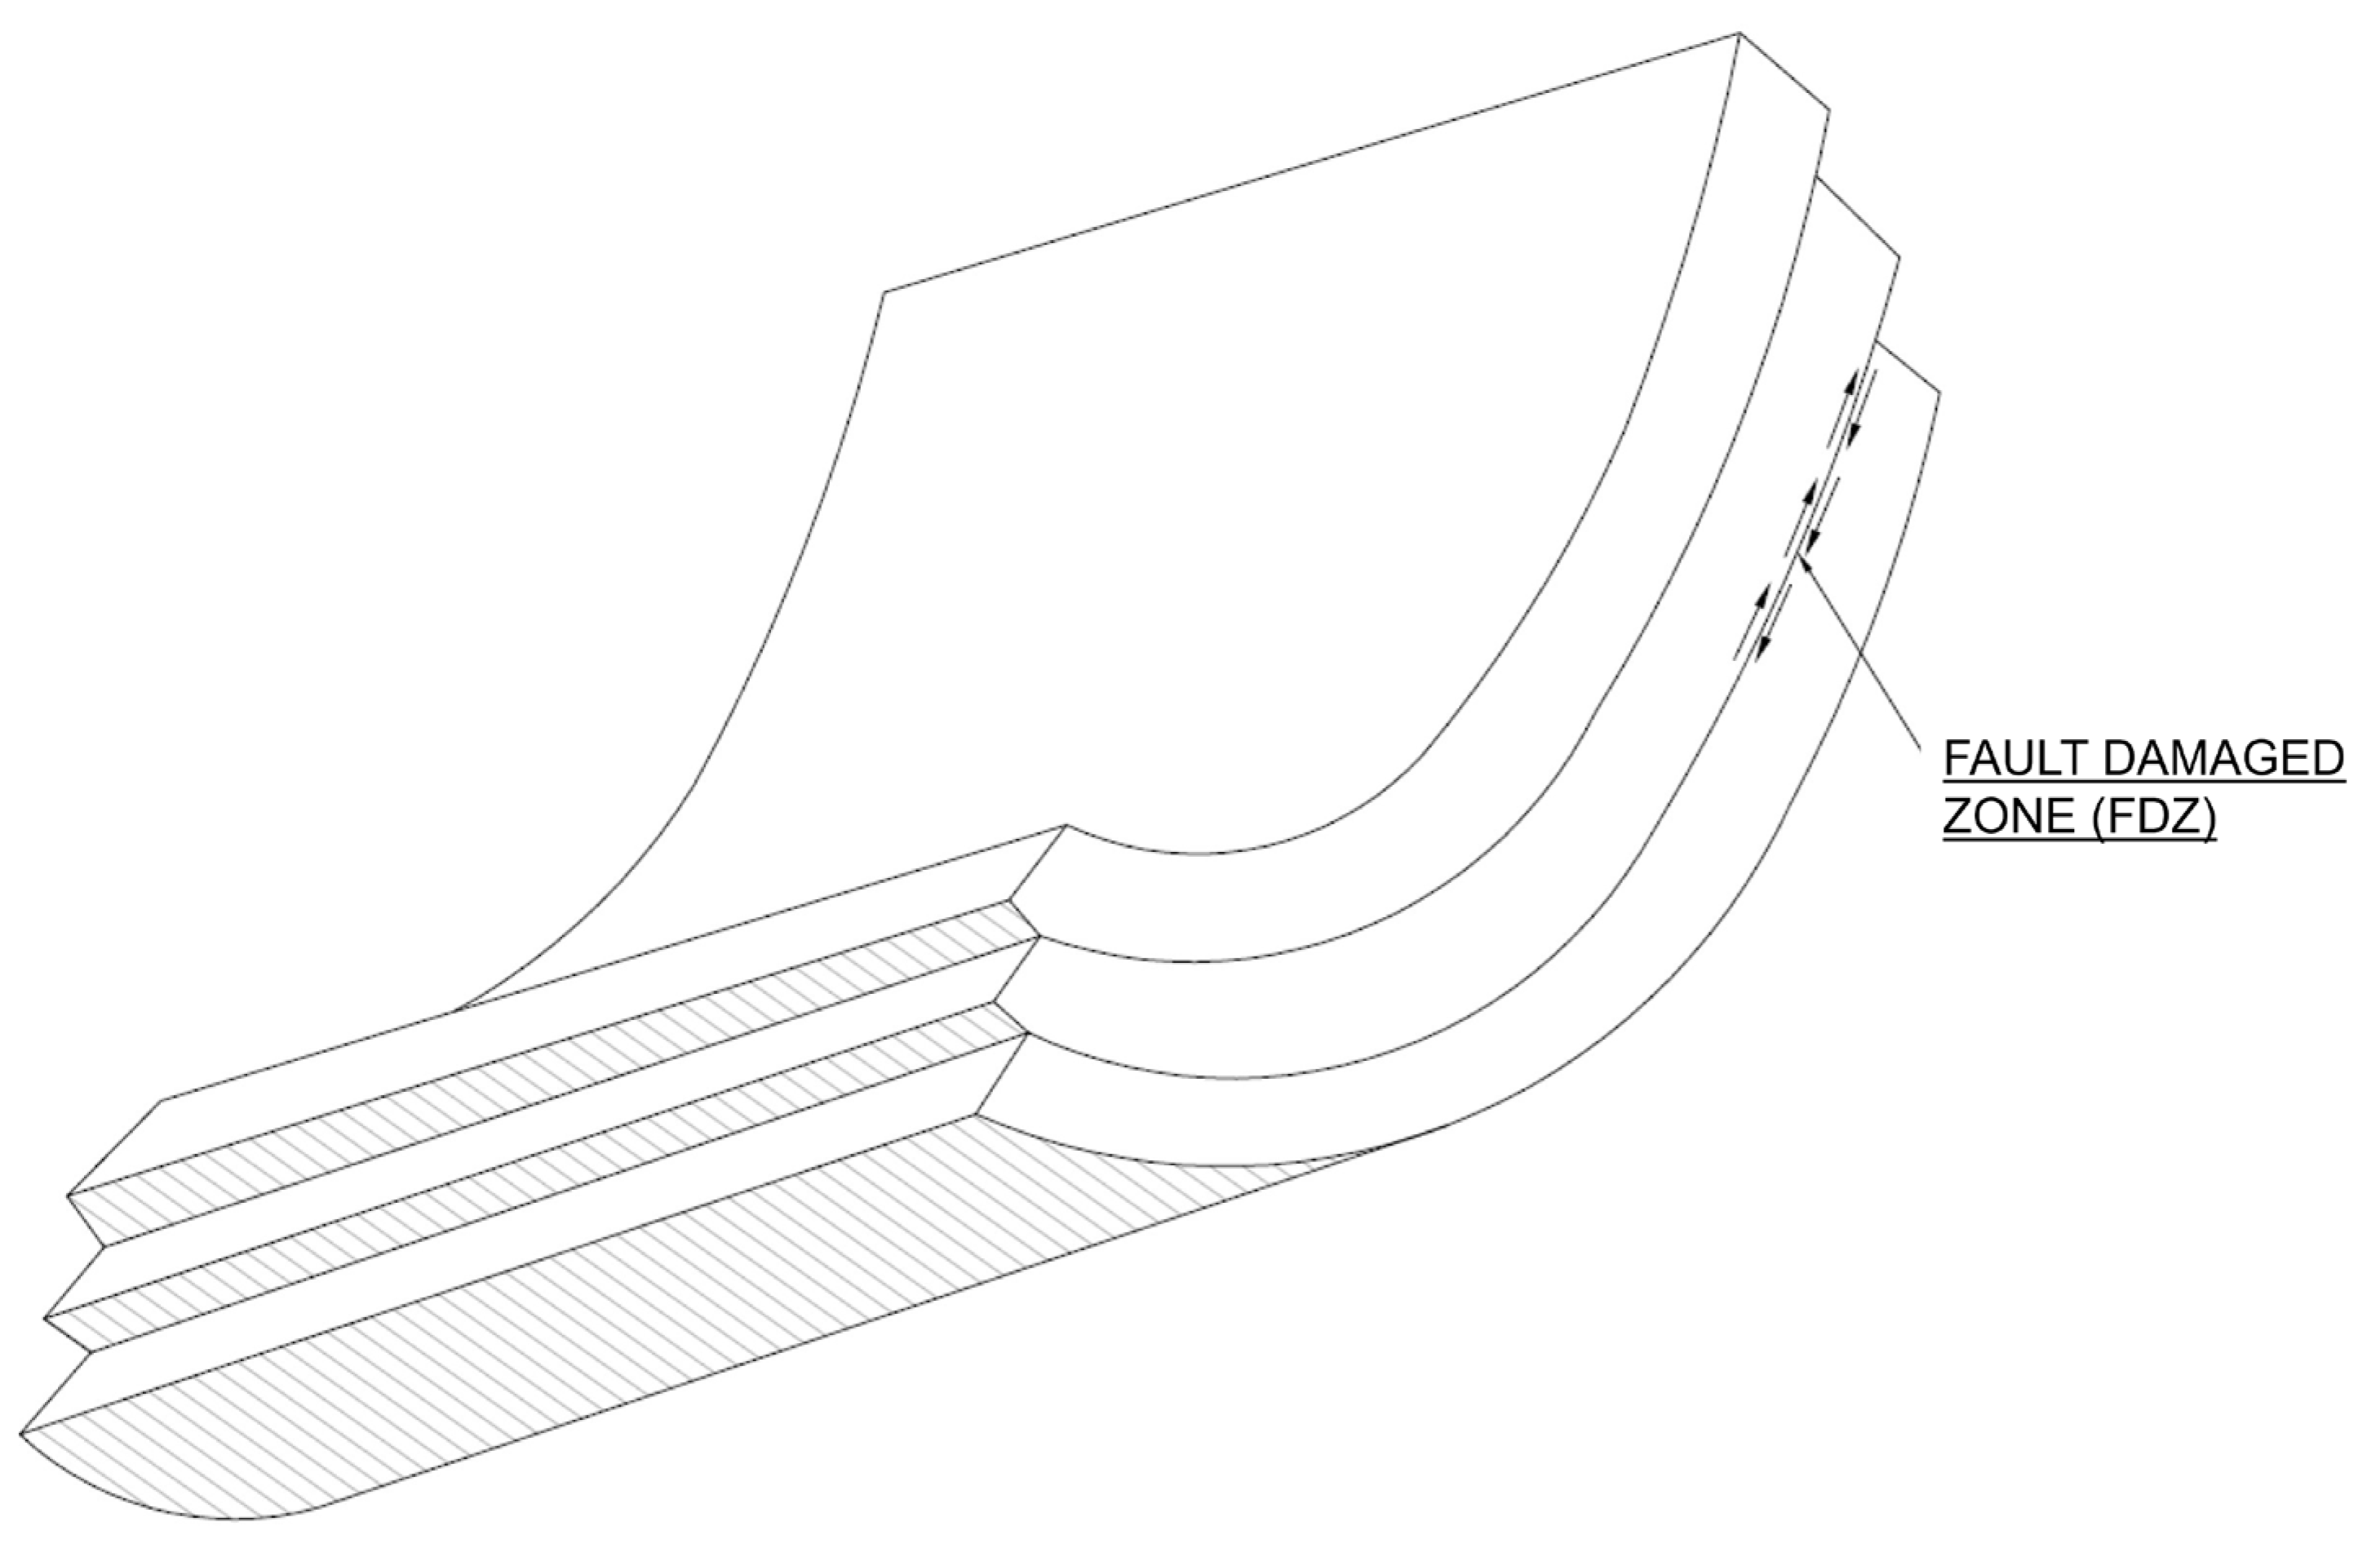
  • In the FDZ rocks, laumontite is abundant in interconnected ubiquitously developed veins and in the fine-grained clay-sized matrix between the veins. Unlike the AA rocks, these laumontite-rich veins and fractures are not protected from exposure to air or water.
Critical behavioural aspects relating to the abundance of interconnected ubiquitously developed veins of laumontite in the FDZ and the collapse zone include the following:
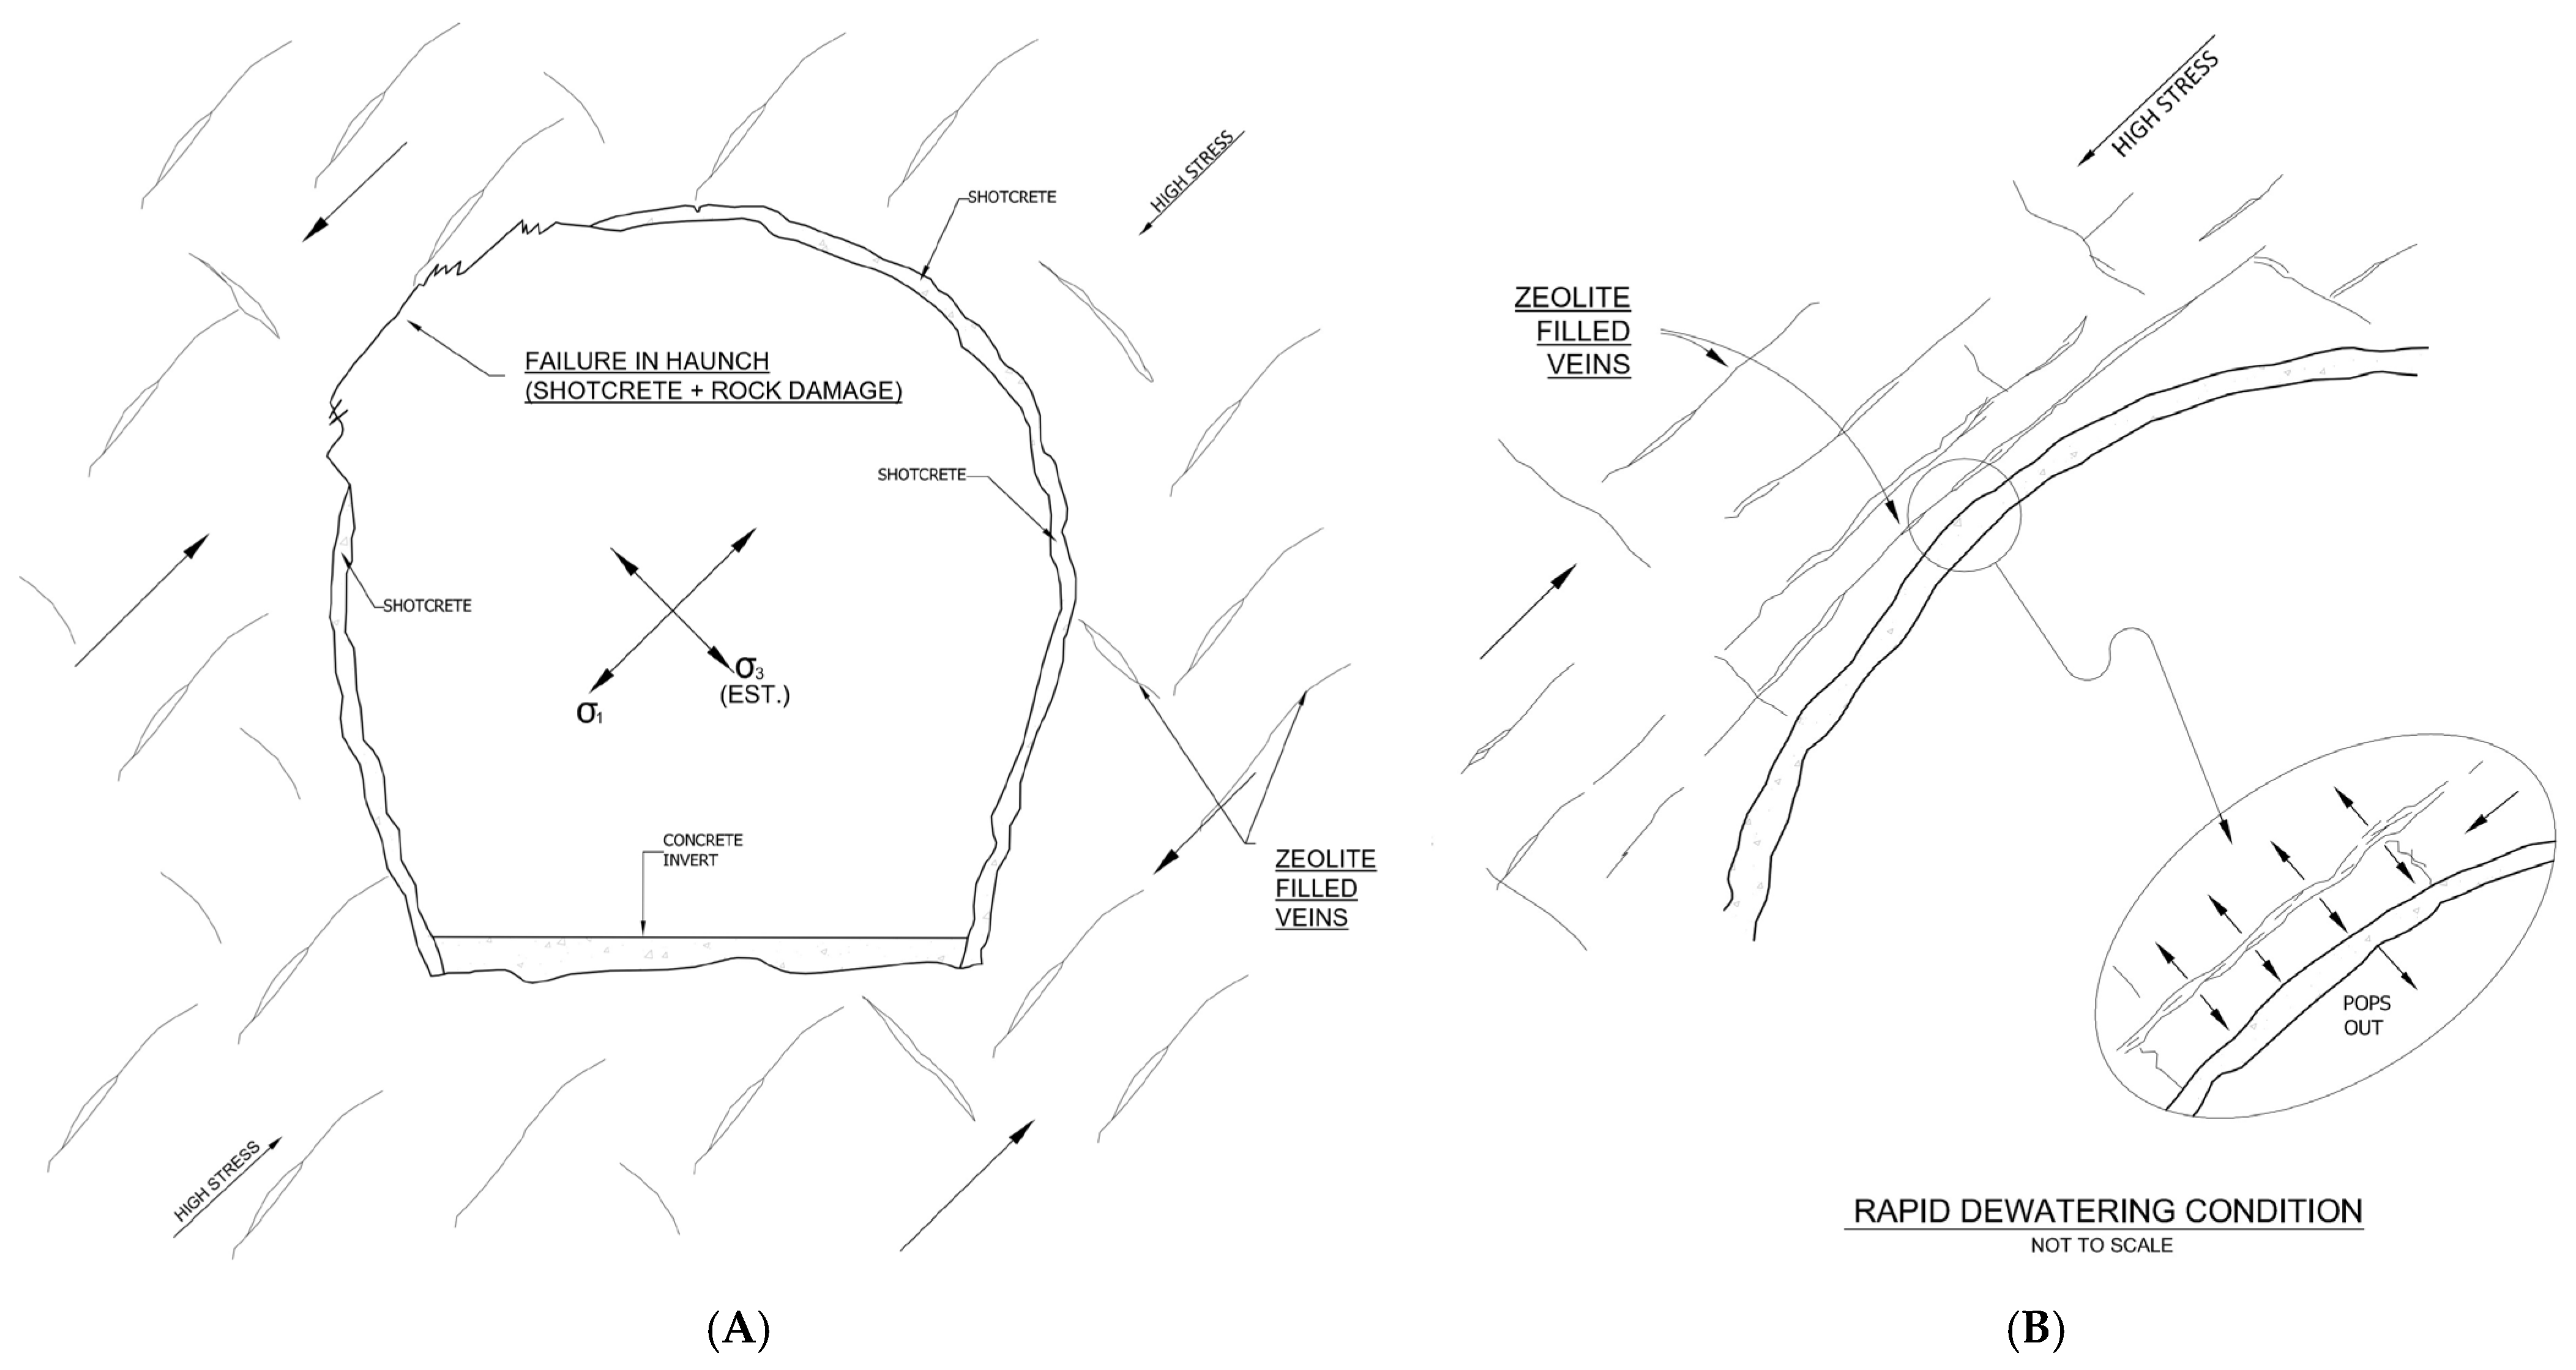
  • When exposed to air (during construction and during successive collapses), the laumontite in the veins loses water and desiccates, causing shrinkage cracks followed by the disaggregation of the FDZ rock as a whole. Ref. [21] confirms that dehydration causes the disintegration of laumontite;
  • Laumontite can lose up to one-eighth of its water of crystallization and changes to a desiccated laumontite or secondary leonhardite with a corresponding shrinkage of 1.5% in volume [21,25,26,27,28,29];
  • Conversely, leonhardite can expand (although not to the same degree as montmorillonite) as it acquires crystal water through wetting and can revert back to laumontite [21].
It is contended that the desiccation of laumontite leads to the weakening and disintegration of the rock in the FDZ when exposed to the atmosphere (with confirmation provided by [21], who describes the mechanism of dehydration and disintegration of laumontite in some detail). This disintegration is followed by some minor swelling as desiccated laumontite reverts to its hydrated state [21]. This mechanism is further described below in Section 3.2.2 below [25,26,27,28,29], with reference to the Lesotho transfer tunnel experience. This cycle repeated itself during initial tunnel filling and subsequently with successive collapses. This is described in more detail below and in Section 5.
The mineralogy of the rocks in the FDZ is not the only factor responsible for the collapse. However, it is considered to be the most important factor with respect to the initial shotcrete spalling, and it limited the initial width of collapse, as described above and below.
Within and outside the FDZ, the nature of the zeolites and other minerals can be summarized as follows:
  • XRD testing and petrographic examination in and around the collapse also showed that laumontite is preferentially deposited in veins in the FDZ, and this may be related to differing temperatures and pressure conditions within the FDZ rocks during faulting based on review and knowledge gained from [30,31,32,33,34,35,36,37,38]. While it is beyond the scope of this paper, readers interested in detail on the effect of temperature, pressure condition, and stability conditions for zeolites and other low grade metamorphic mineral are recommended to review [30,31,32,33,34,35,36,37,38];
  • This is in contrast to the HART rocks, in which several species of zeolite, namely wairakite and analcime, and a very low percentage of laumontite are present in veins;
  • Wairakite, analcime, and other zeolites are present but are much less susceptible to desiccation [21], which is likely why the HART rocks have higher swell potential than the FDZ rocks (due to montmorillonite absorbing water, see [1,2]) but do not disintegrate like the FDZ rocks. It is also apparent that a lot of the veins present in the HART rocks contain phyllosilicates that are not expansive clays, e.g., chlorite and muscovite;
  • The high montmorillonite percentages found in the HART rocks occur primarily in the very fine-grained matrix material, and the matrix material is bound together with hematite and other metallic oxides that may slow down the rate of swelling;
  • The significance of this is that while minor laumontite is present in the HART rock, it is likely less available to air or water exposure compared to the FDZ rocks. While the HART rocks are prone to swelling because of the high montmorillonite content, this is likely a relatively slow process due to the lower permeability of the HART rocks [10];
  • Laumontite is present in similar percentages in both the FDZ rocks and the AA rocks. Analysis showed that laumontite is locked into the welded rock fragments and altered plagioclase crystals in the AA rocks, and therefore, only a small proportion of the laumontite is available to react with air. While mostly below detection levels, montmorillonite is also likely present in the AA matrix but is again not readily available to react with water because the matrix material between the rock particles is typically not connected (based on thin section observations), thereby resulting in a fairly inert rock that is not prone to swelling.
Another important point of clarity from the XRD clay speciation work and petrographic work is that the FDZ rocks, while pervasively zeolite veined, do contain sporadic montmorillonite in the fine-grained fragments present between veins, particularly the FDZ material of HART origin, albeit in significantly lower proportions compared to the HART rocks upstream of the FDZ. It is also significant, as indicated above, that the fine-grained matrix in the FDZ contains laumontite, which is also prone to desiccation.
It is also hypothesized here that hematite binding in the FDZ fine-grained fragments between veins is not as pervasive as in the upstream HART rock, and the laumontite and swelling clay present may therefore be more available to absorb water compared to the HART rocks. Certainly, the XRD plots (Figure 9 and Figure 10) show some reduction in hematite going from the HART rocks to the AA rocks.
To summarize, the exact physical mechanism that results in the degradation is not well understood, but it is believed that, with exposure of the veins in the FDZ rock to the atmosphere, the crystal lattice of laumontite loses water, causing shrinkage as it transforms to a powder-like white substance, possibly leonhardite [21,25,26,27,28,29]. This results in ‘crazing’ or micro-fracturing in the rock mass surrounding the tunnel due to induced stress as laumontite veins lose volume as laumontite desiccates and reduces to a powder. This, in turn, results in a reduction in strength and even the disintegration of the rock as a whole in the case of the FDZ. The development of ‘crazing or micro-fracturing’ of the rock in the FDZ opens up pathways for water (natural groundwater and water flowing in the tunnel), allowing access to laumontite and any swelling clay minerals in the matrix and to the rock mass in general and thereby facilitating further degradation, swelling, and disintegration as well as a strength reduction in the rock mass.
It should be noted that this paper is not based on research in controlled laboratory conditions. Rather, the strong correlation between high percentages of laumontite in the FDZ rocks in the collapse zone provides strong empirical evidence that this is an important factor that should be considered on other projects where laumontite is suspected.
It is recommended that additional research that specifically deals with the exact mechanism of dehydration and rehydration of laumontite (beyond [21]) and the associated degradation of the surrounding volcanic rocks specifically for tunnels should be undertaken beyond the mechanism hypothesized for the subject tunnel and the Lesotho tunnel.

3.2.2. Laumontite and Swelling Clay: Experience on Another Project

During construction, the presence of both laumontite and montmorillonite was known in the subject tunnel. There were many expert opinions on how to deal with the presence of these minerals during construction. The support levels installed generally considered the presence of these minerals and overburden stress levels, but as shown in Figure 6 and Figure 7, this was not successful. A part of trying to understand the potential impact during construction included routine XRD and swell pressure testing during construction in order to determine the abundance of these mineral, in particular montmorillonite, and the degree of swelling that may be anticipated as a result of these analyses. The reason attention was paid to the minerals present in the rock during construction was because a few other projects around the world have had problems with swelling clays and swelling pressures, e.g., refs. [1,2,3,4,5,6,7,8,9,10,11].
A well-known tunnel project in southern Africa (the transfer tunnel of the Lesotho highland water scheme) had degradation problems along at least half of its 45 km length, and it was determined to be as a result of the presence of laumontite-rich zones as opposed to swelling pressure problems, see [25,26,27,28,29]. Familiarity with the Lesotho experience and experience on other tunnels in South America provides evidence that there is still no clear consensus within the tunnelling industry worldwide regarding the approach that should be adopted when designing for suspected mineralogically induced durability issues in rocks with laumontite and/or montmorillonite [25,26,27,28,29]. The reasons for this are believed to be that the mechanism involved with durability issues related to laumontite in particular is complex and is still not fully understood, as described above. Ref. [21] provides important advances in understanding issues related to the dehydration–rehydration mechanism of laumontite but does not fully resolve the mechanism at the tunnel presented in this paper or in the Lesotho experience. Despite not being fully understood, the common link between the subject tunnel and the Lesotho experience is the presence of elevated laumontite where issues occurred, as described in [25,29]. It is also clear that mere knowledge of the presence of these minerals does not mean that there is a rational design basis used globally that should have been followed at the subject tunnel.
While it is recognized that the basaltic rocks in Lesotho are not the same as the rocks in and adjacent to the FDZ at the subject tunnel (volcaniclastic rocks as described above), the circumstantial evidence from both geological environments does indicate that the presence of laumontite above certain proportions can exacerbate degradation or reduce rock durability. As discussed above, these signs were recognized in the subject tunnel, and additional support was provided where both swelling clays and zeolites (laumontite belongs to the zeolite family of mineral) were identified or suspected, but as evidenced by the collapse, the support levels were inadequate for the unforeseen conditions (elevated laumontite in the FDZ).
It is also evident from the Lesotho experiences [25,27,29] that the tectonic environments and rock types are very different (both are volcanic in origin), but the durability problems also manifested in a completely different way in the Lesotho transfer tunnel. Degradation occurred over a length of 20 km in the Lesotho tunnel [25,27,29], with disintegration in the tunnel walls in a largely unlined water conveyance tunnel, but without any major collapses. This occurred as a result of the tunnel intersecting a regional-scale sub-horizontal laumontite-rich zone, which is the result of a vertical zeolite zonation within the relatively undisturbed basaltic volcanic pile [25,27,29].
In the subject tunnel, as described above, a major collapse occurred in a narrow 20 m wide zone with very high laumontite percentages, certainly higher than those observed in the Lesotho transfer tunnel of around 10%, where damage was observed [25,27,29]. The FDZ (collapse zone) is, as described above, a localized very discrete zone that is the result of inter-bed slippage within a highly active faulted and folded mountain building tectonic environment, and this is very different to the geological environment in Lesotho (extrusive lava pile of around 1800 m thick and zeolite zonation due to paleo–geothermal gradients in the basaltic pile found in Lesotho) and elsewhere in other basaltic terrains globally [27,39,40,41,42]. At the confidential subject tunnel, the rock types are a result of explosive volcanic activity and subsequent mountain building processes and are not directly comparable to Lesotho but nevertheless are subjected to hydrothermal and low-grade alterations, with the development of laumontite as one of the end products of this metamorphism [30,31,32,33,34,35,36,37,38].
The zeolite zonation model and mineralogical criteria developed to address durability issues in Lesotho [25,27,29] are likely not universally applicable in all volcanic environments or rock types. The criteria developed in Lesotho are summarized below in Table 1. Table 1 is only partly applicable in the subject tunnel. This RCA has shown that rocks upstream of the collapse (HART rocks) have the highest swelling potential, yet these rocks are still standing, while rocks with much lower swelling potential and excessive laumontite (the FDZ) collapsed. The RCA also shows that the AA rocks downstream of the collapse have elevated levels of laumontite, similar to that encountered in the FDZ, and these rocks did not collapse. Reasons for this are proposed in Section 3.2.1.
While the FDZ rock in the collapse zone has very similar and elevated levels of laumontite when compared to the AA rocks downstream of the collapse, the latter are competent and still standing. These subtleties were not present in Lesotho, and it has to be concluded that the tunnelling industry, in general, has not developed a consistent approach to dealing with these laumontite-related durability issues yet, principally because the failure mechanism is only partially understood (as described above). The durability issue related to laumontite manifests in different projects at different scales and different intensities. As a consequence, direct knowledge from Lesotho or the subject tunnel can only be used as an indicator and does not provide explicit design methods that fit all circumstances.
Nevertheless, parts of Table 1 remain applicable as evidenced by the fact that while laumontite was present throughout much of the subject tunnel, these zones were below the empirical 10% laumontite by weight, above which durability issues may manifest. The lesson learnt from the subject tunnel RCA is that the FDZ had laumontite percentages significantly greater than 10% and had extreme durability issues, but the AA rock downstream of the collapse has similar elevated levels of laumontite, indicating that the collapse could not have been predicted purely on the basis of the presence or percentages of laumontite. Section 3.2.1 describes the petrographic difference between the occurrence of laumontite in the FDZ and the AA rocks and why the AA rocks are less susceptible to disintegration.
It is also known, from the Lesotho experience, that laumontite-rich zones, associated with poor durability, can have a vertical thickness of more than 200 m, and the same problematic zone can extend for tens of kilometres in a lateral or horizontal sense [25,27,29]. It is known that the zonation of zeolites in basalt terrains is a function of the paleo–geothermal gradient present after extrusion, and this, in turn, is a function of the extent and thickness of the original basalt pile [25,27,29].
The transfer tunnel in Lesotho had to be retroactively lined with full concrete lining with a nominal concrete lining thickness of at least 300 mm in low durability zones [43]. In the case of the subject tunnel, the by-pass tunnel had a permanent 500 mm concrete lining to deal with potential degradation in the same FDZ where the collapse occurred in the power tunnel. Two very different projects and settings, but in the end, similar design solutions were adopted.

3.2.3. Swelling Pressures in Support of Mineralogical Factors

Swelling pressure assessments were made on the basis of laboratory testing on samples of rock from the by-pass tunnel construction and from core samples from the investigation holes around the collapse. Details of the laboratory methods are beyond the scope of this paper, but for completeness, the authors note that the following references were reviewed and used when undertaking testing on powdered samples [2,7,10,21,44,45,46,47]. These data were used to help analyze the adequacy of the support for the RCA and the later design of the by-pass tunnel. These swelling pressure results of these tests are presented in Figure 11 and Figure 12. Details of the design of the by-pass tunnel are also beyond the scope of this paper given that the focus is on the RCA of the collapse. It is sufficient to say that the authors of this paper were responsible for the by-pass tunnel design.
Two types of tests were used in the course of the RCA investigations to estimate the potential swell pressures of the rock surrounding the subject tunnel. These include the following:
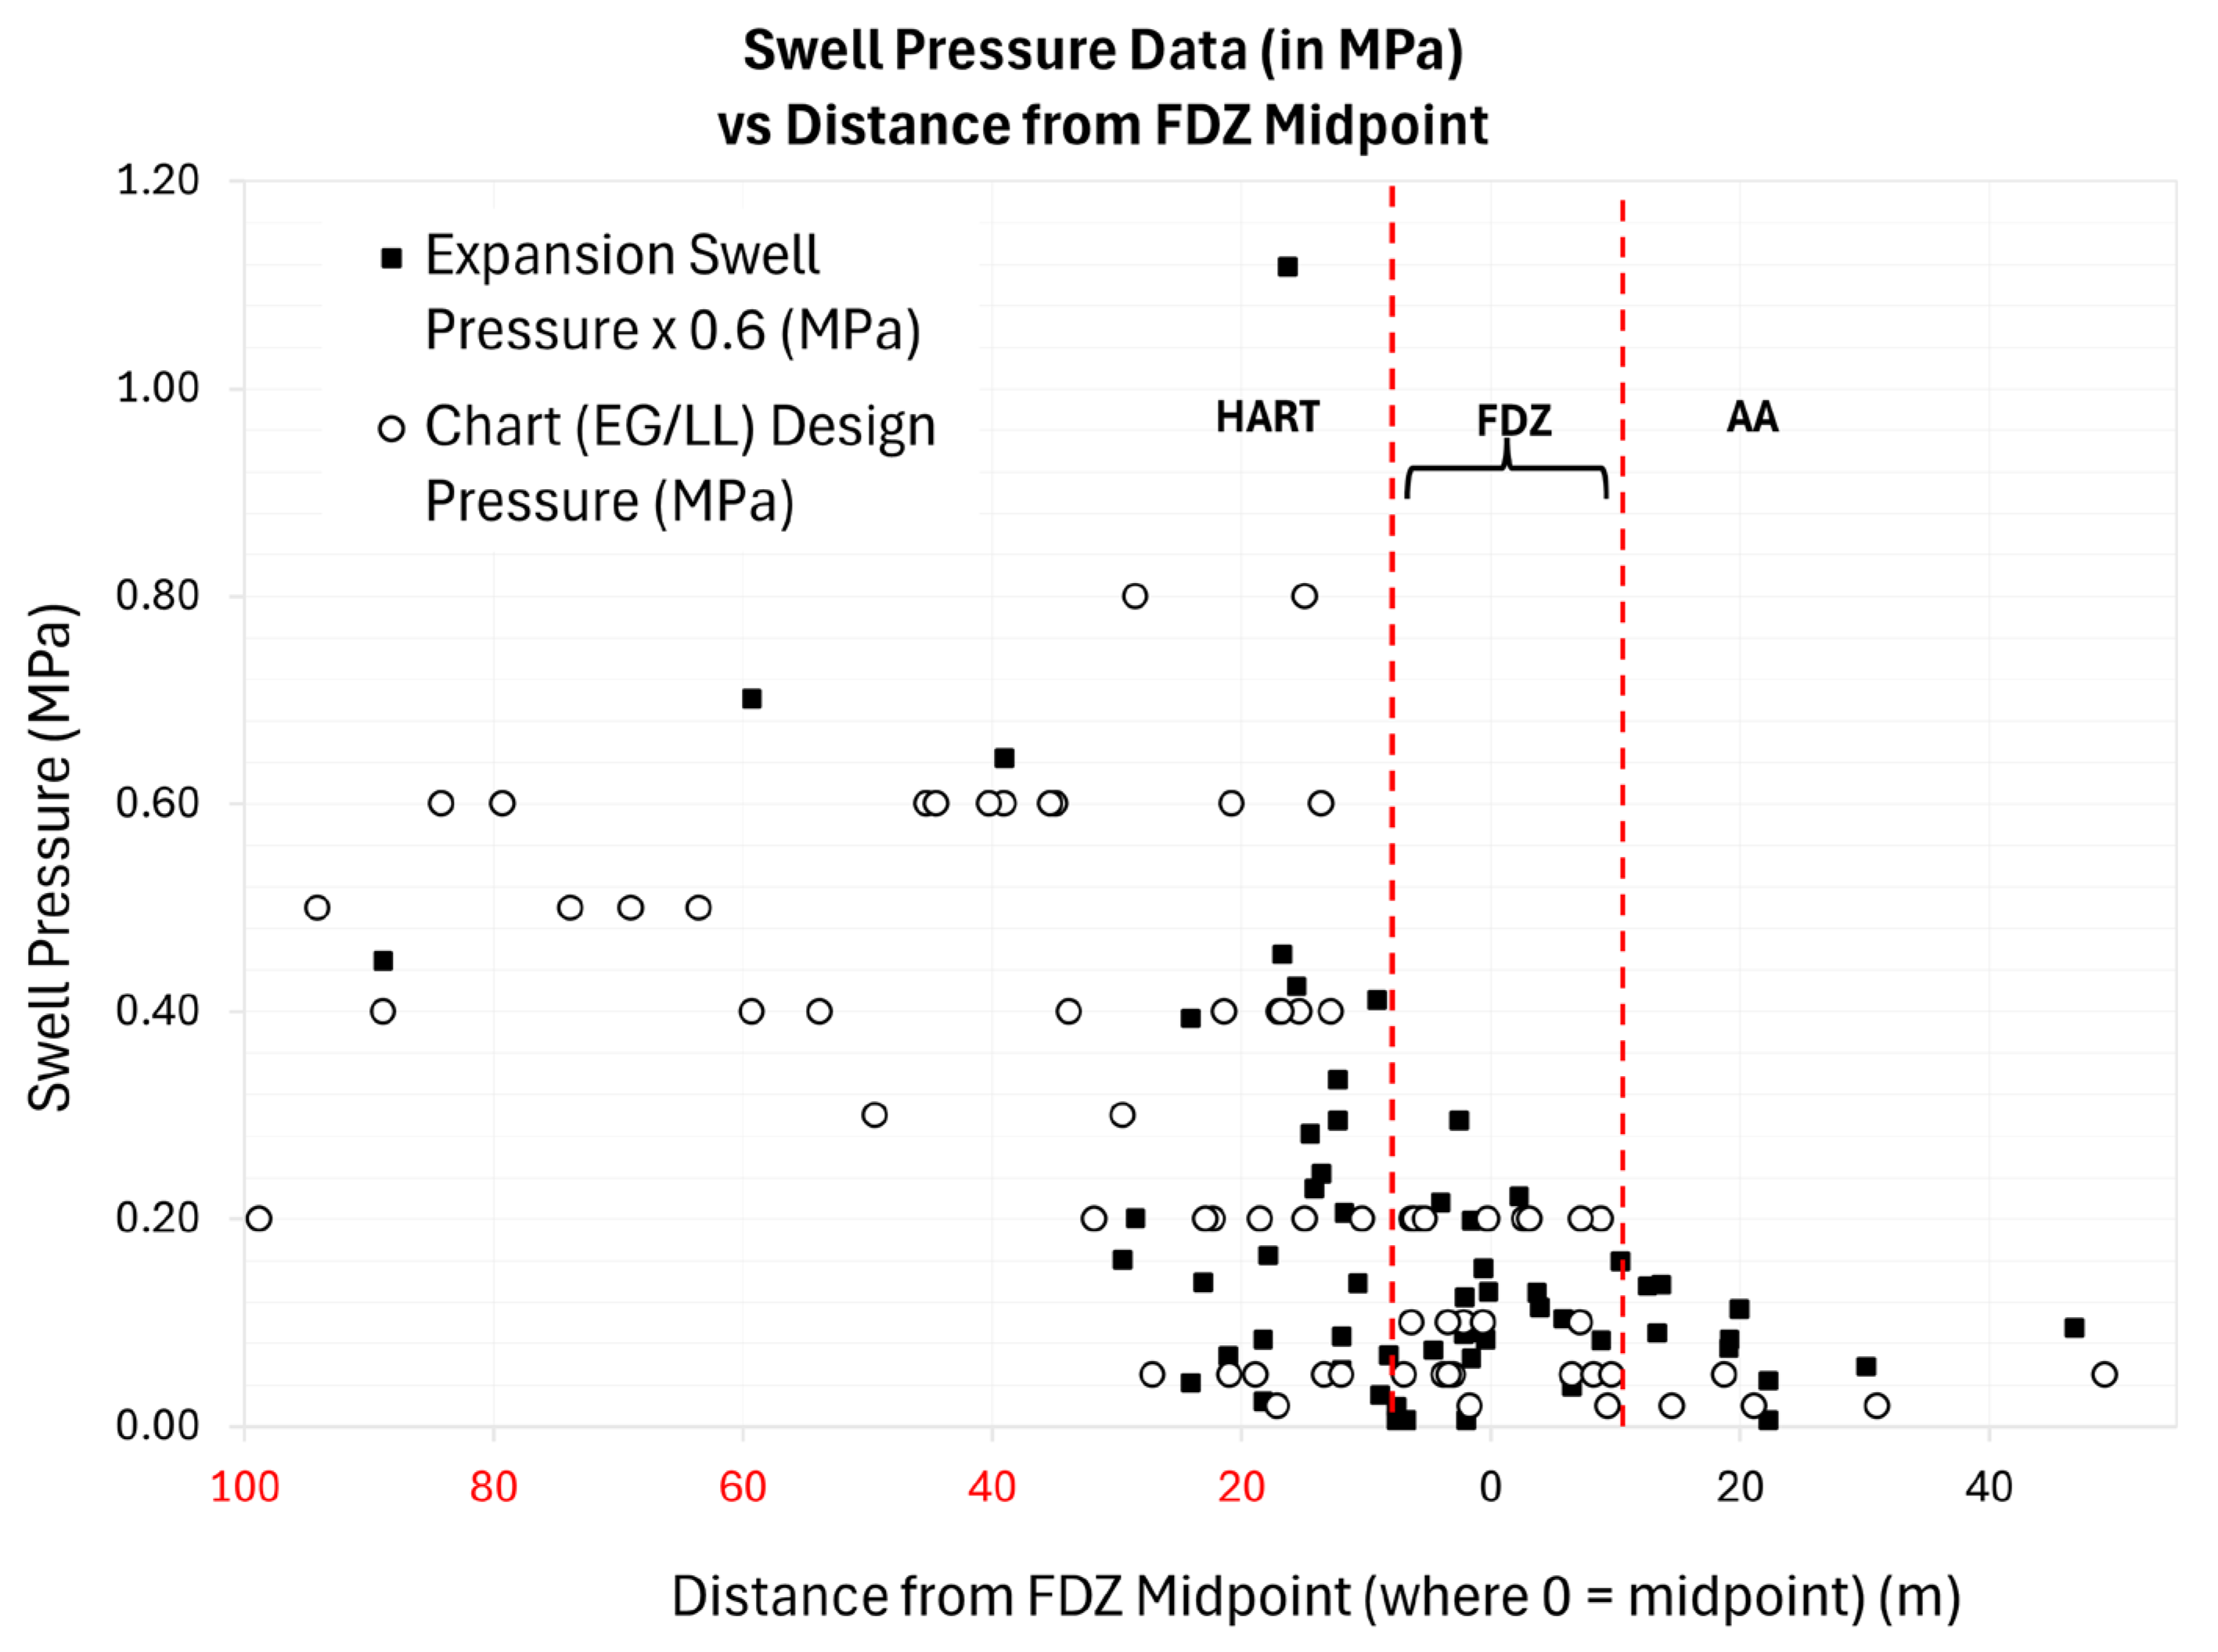
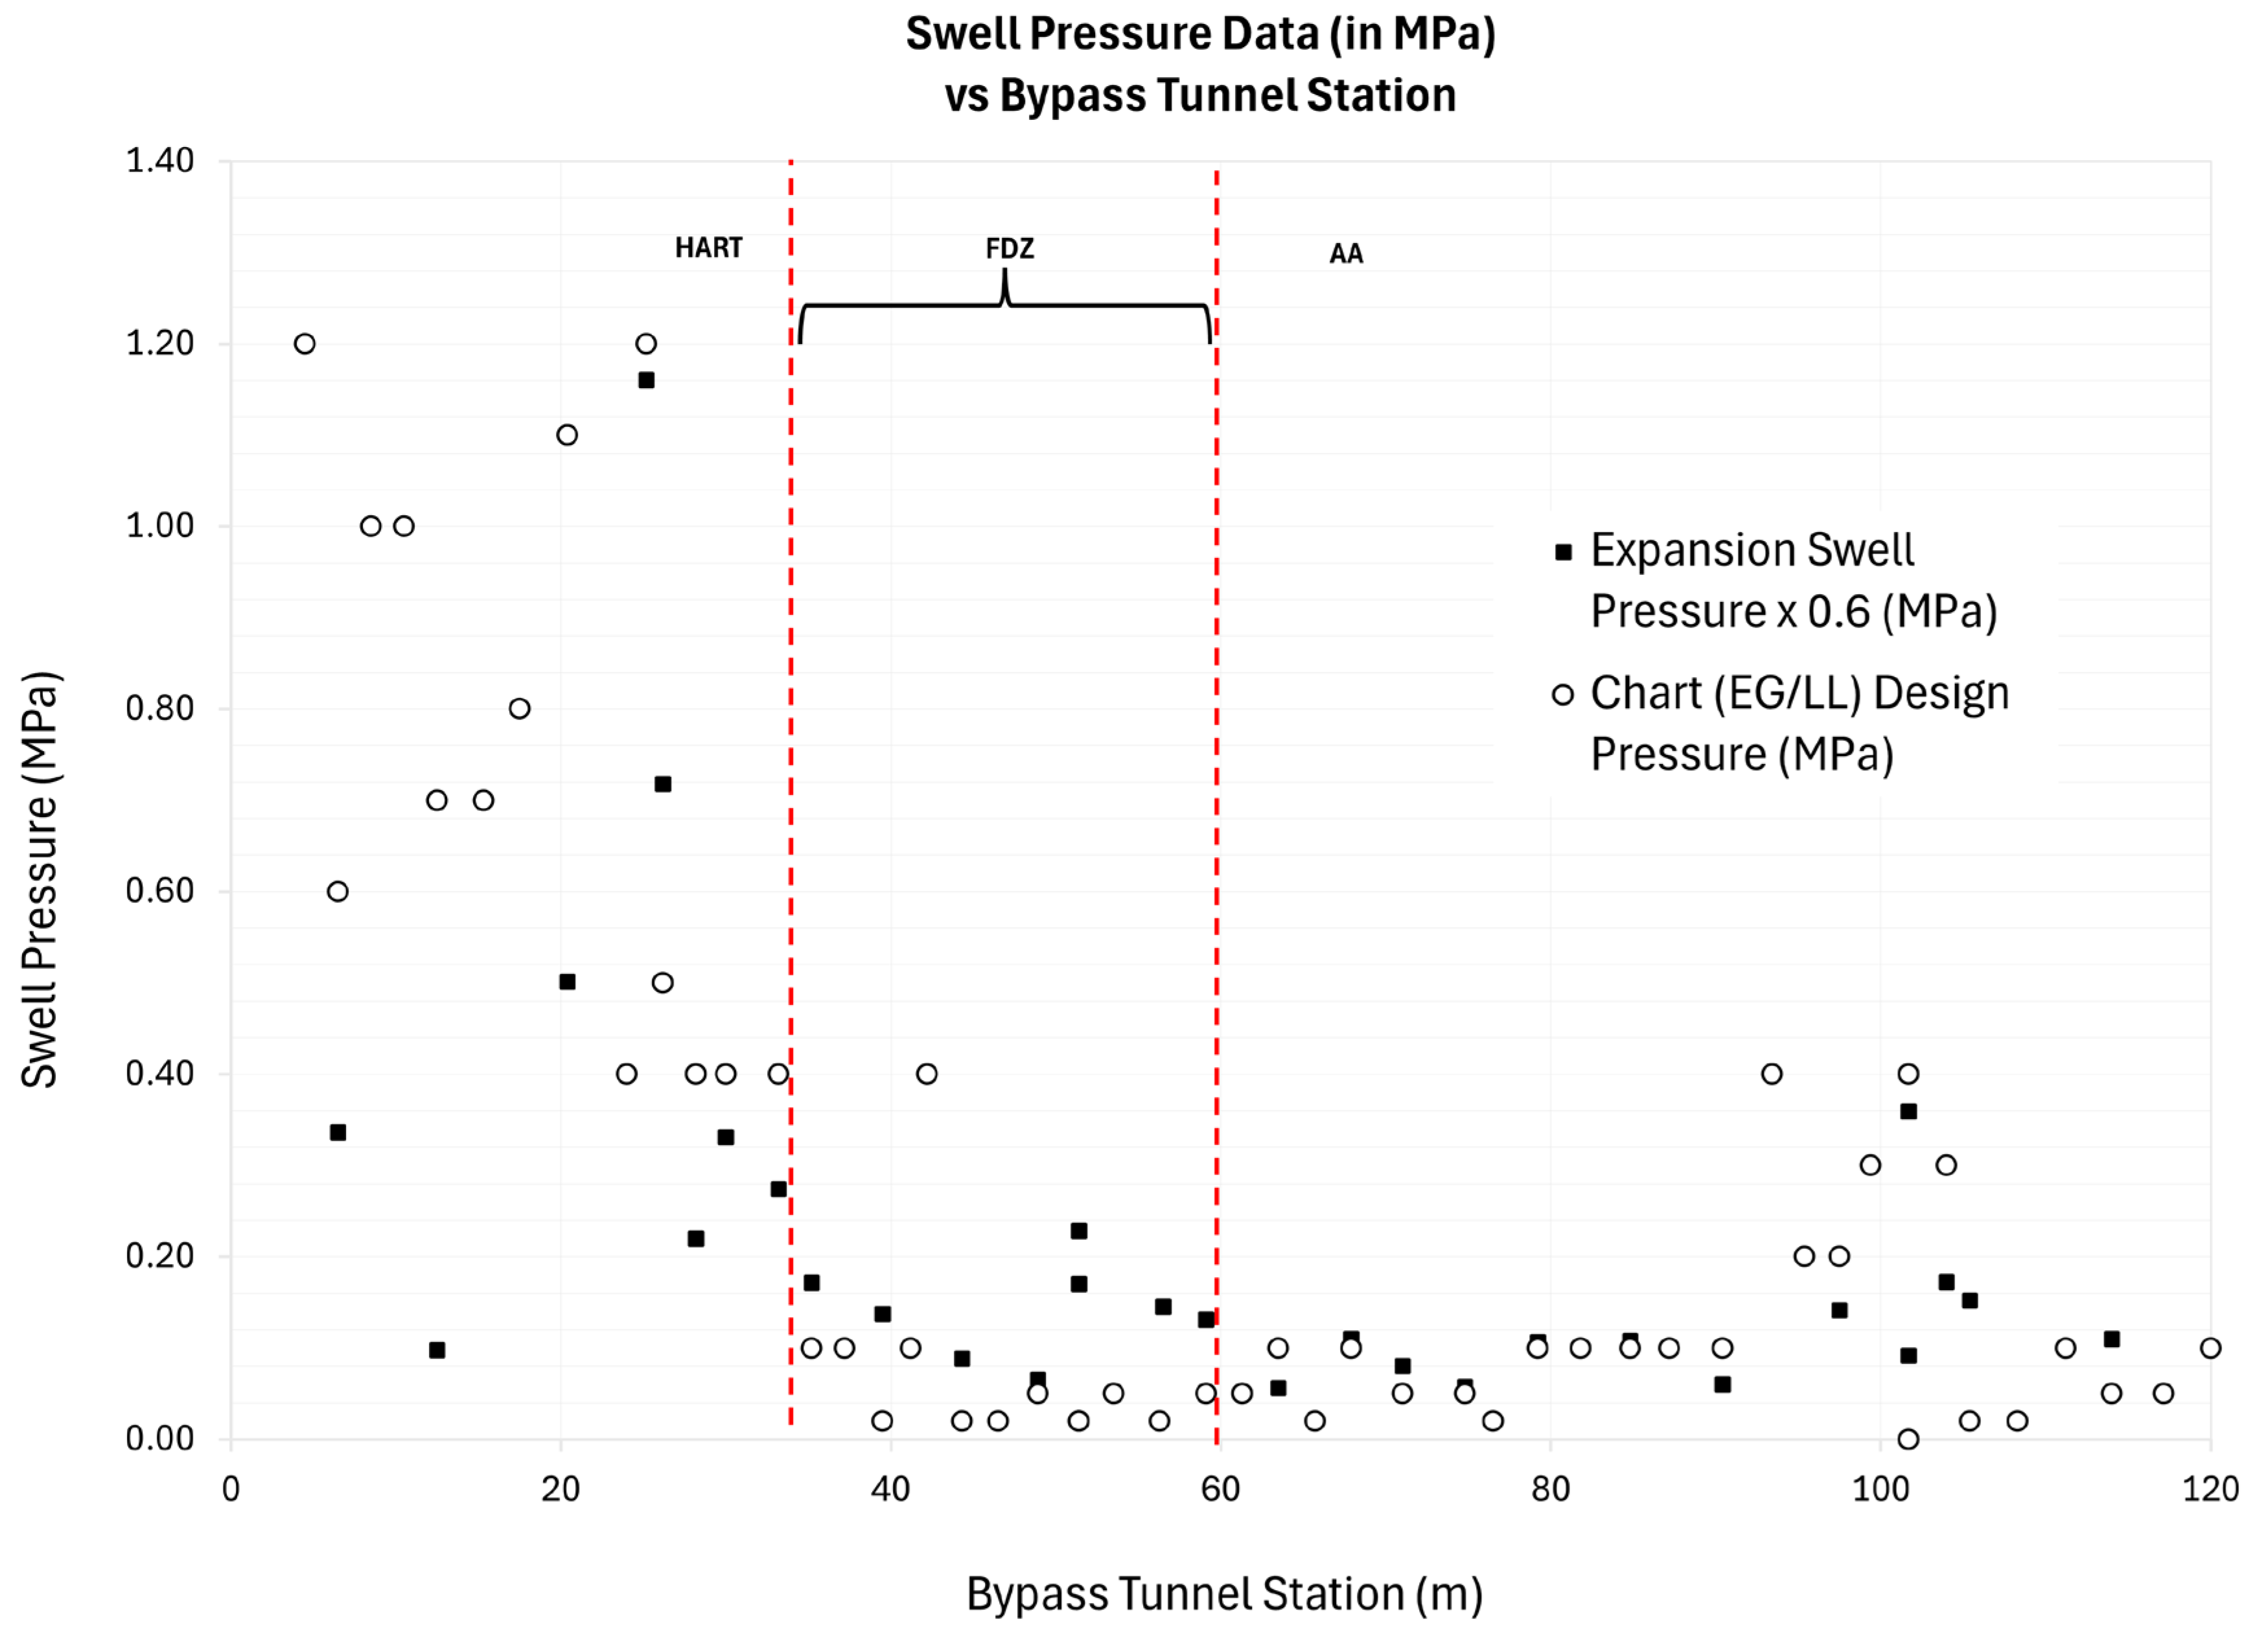
  • Constant volume swelling pressure tests carried out in the laboratory on powdered rock samples. These data are referred to as expansion swell pressures (ESPs); and
  • Use of a project-specific correlation between swelling pressures and the ethylene glycol (EG) state and liquid limit (LL). These data are referred to as chart (EG/LL) design swell pressures (CDPs) in this paper.
While the details are beyond the scope of this paper, the ESP method was found to provide a conservative estimate of actual rock mass swell behaviour and has been found to give generally higher result than the CDP test method. For those interested in the details of testing for swelling pressure in rock, please see [2,7,10,21,43,44,45,46,47]. The ESP swelling pressures were de-rated by a site-specific factor of 0.6 to achieve better equivalence, with the latter signifying CDP-correlated values. Once brought into equivalence, the resulting values from either method are considered comparable and were used for ground support design in the by-pass tunnel. It is important to note that while this section of the paper is focused on swell pressures, for the by-pass tunnel design, the increase in loading on the liner as a result of laumontite-induced FRD rock degradation was also considered, not just swelling pressures.
The results summarized in Figure 11 and Figure 12 are important to the RCA because they indirectly corroborate the mineralogical factor considered critical to the initiation of the collapse in the main tunnel, i.e., swell pressures alone cannot be used to understand the collapse, and the mineralogical factors described above provide the key to understanding the initiation of the collapse. Figure 11 and Figure 12 also provide useful insights that lend credence to the hypothesized failure mechanism in the collapse zone.
Figure 11 and Figure 12 show that while there is scatter in the data, the following conclusions can be drawn when referenced against mineralogical data for the same area (see Figure 9 and Figure 10):
  • The swell pressures are highest in the HART rocks and close to or at the transition into the FDZ. The average swell pressure (average of both ESP and CDP results combined) in this zone is approximately 0.64 MPa in the by-pass tunnel and 0.4 MPa in HART rocks upstream of the collapse zone. It is apparent when these results are compared with the mineralogical plots that HART rocks have the highest swelling clay percentages and the lowest zeolite (laumontite) percentages;
  • It is clear from these data that the measured swell pressures are directly proportional to the recorded swelling clay content, i.e., the higher the swelling clay content, the higher the swell pressure.
It is concluded from these results that swell pressure alone is not indicative of collapse potential in the subject tunnel, since it is known that the HART rocks occur upstream of the collapse, and these rocks had little damage noted as a result of the collapse.
Swell pressures are substantially lower in the FDZ and through the transition into the AA rocks. The combined swell pressures from both the by-pass tunnel and the collapse zone in the main tunnel average out at about 0.1 MPa to 0.12 MPa. Based on these averages, the swell pressures in the HART rocks are between 3.0 and 6.4 times higher than in the FDZ.
As demonstrated above, the collapse initiated in the main tunnel in the FDZ rock, and it is concluded from this that the initial collapse occurred as a result of the combined presence of both laumontite in veins (as a result of laumontite dehydration) and (limited, but present) swelling due to the rehydration of laumontite and minor swelling clay in the fine matrix of the rock. The recorded swelling pressures confirm the presence of a dual mechanism in the FDZ, likely including the loss of strength due to the dehydration of excessive laumontite and disaggregation the rock mass followed by minor swelling as described above.
Downstream of the FDZ in the AA rocks, the combined swell pressures average out at about 0.08 MPa in both the by-pass tunnel and near the collapse. This means that the HART rocks on average have swell pressures that are between 4.5 and 8.0 times higher than the AA rocks.
On the basis of the similarly low swell pressures, and the fact that laumontite is present in similar percentages in both the FDZ rocks and AA rocks, it could be argued that the AA rocks should have reacted the same way as the FDZ rocks, i.e., that the same dual mechanism of disintegration and swelling could have resulted in collapse in the AA rocks. Since this was not the case, it has to be concluded that, as discussed in above, the mode of occurrence of laumontite is a key factor in understanding why the FDZ rocks failed, while the AA rocks did not. While the AA rocks further downstream showed some minor damage (principally shotcrete detachment and plate like damage in the rock—see Figure 4 and Figure 5) as part of the collapse, this is largely attributed to the stress environment and the transient tunnel pressure changes during the collapse cycle (see Section 4 below). As stated above (Section 3.2.1), laumontite in the AA rocks is locked into the welded rock fragments and altered plagioclase crystals, and only a small proportion of the laumontite is available to react with air. Swelling clay is also likely present in the matrix but is again not readily available to react with water because the matrix material between the rock particles is typically not connected (based on thin section observations), resulting in fairly inert rock that is not prone to durability issue or swelling.

3.3. Over Stressing Factor

3.3.1. Stress Downstream of the Collapse

As discussed above, there was a second minor collapse about 50 m downstream of the main collapse in the AA rock (Figure 1). Downstream of the second collapse, shotcrete spalling and rock damage were noted in the 10 o’clock to 12 o’clock positions (shown in Figure 4 and Figure 5). On the basis of the preferential location of the shotcrete detachments and the minor collapse in the AA rock, it is inferred that σ1 was oriented in the 1 o’clock to 2 o’clock position when facing downstream prior to the collapse [20]; this provided guidance on understanding spalling patterns in competent rocks related to the orientation of the σ1 in high-stress environments. It is also inferred that stress field is a result of high in situ tectonic stress and was close to exceeding the shear and tensile capacity of the AA rocks and the shotcrete prior to and during the main collapse. The stress field combined with high differential transient water pressure conditions (due to rapid dewatering of the tunnel downstream of the FDZ during the collapse) is considered to have contributed to the damage in the AA rock downstream of the collapse. Ref. [22] provided guidance on understanding the effect of frequent start and stop sequences of hydropower operations, but in unlined pressure tunnels, and ref. [48] provided insights into stress in unlined hydro tunnels. Also, as described in Section 4, the transient water pressure changes during the collapse of the subject tunnel were well beyond what could be described as normal operational conditions or sequencing or operational dewatering, and the above references are useful but not directly applicable.

3.3.2. Stress in the Fault-Damaged Zone (FDZ)

While the observations and analysis provided above describe what occurred downstream of the collapse: the principal mechanism related to the stress field is considered to be similar within the FDZ, i.e., that the in-situ stress was likely close to exceeding the shear and tensile capacity of the FDZ rock and the shotcrete prior to collapse. While this contributing mechanism is considered important in the propagation of the collapse in the FDZ rocks, attempts at modelling the collapse and using in situ stress test data show that the σ1 was likely close to half of that present in the AA rocks because the FDZ rocks (HART and CLT) are considerably weaker than the AA rocks. This line of thought is articulated further in this section. It is, however, recognized that there was no evidence available to suggest that in situ stress was a critical issue in the collapse zone between construction and filling, i.e., no damage was observed. Likewise, no damage was seen downstream of the collapse between construction and filling until after the collapse.
The in situ stress in the FDZ is, nevertheless, considered to be an exacerbating factor in the root cause of the collapse. When the in situ stress is combined with the rock degradation as a result of the combined presence of laumontite dehydration and swelling due to minor amounts of montmorillonite, it provides strong evidence that the initiation of the collapse occurred in the left haunch or at the 10–11 o’clock position (facing downstream) and in the crown of the main tunnel in the FDZ, since σ1 was likely oriented in the 1–2 o’clock position. This is based on the observations downstream and inferred from post collapse in situ stress testing upstream and downstream of the collapse (discussed below).
It is also asserted that the as-built support was insufficient based on the conditions now understood to be present in the FDZ at the time of the collapse, and in situ stress would not have helped matters (modelling results to substantiate this statement are provided below).

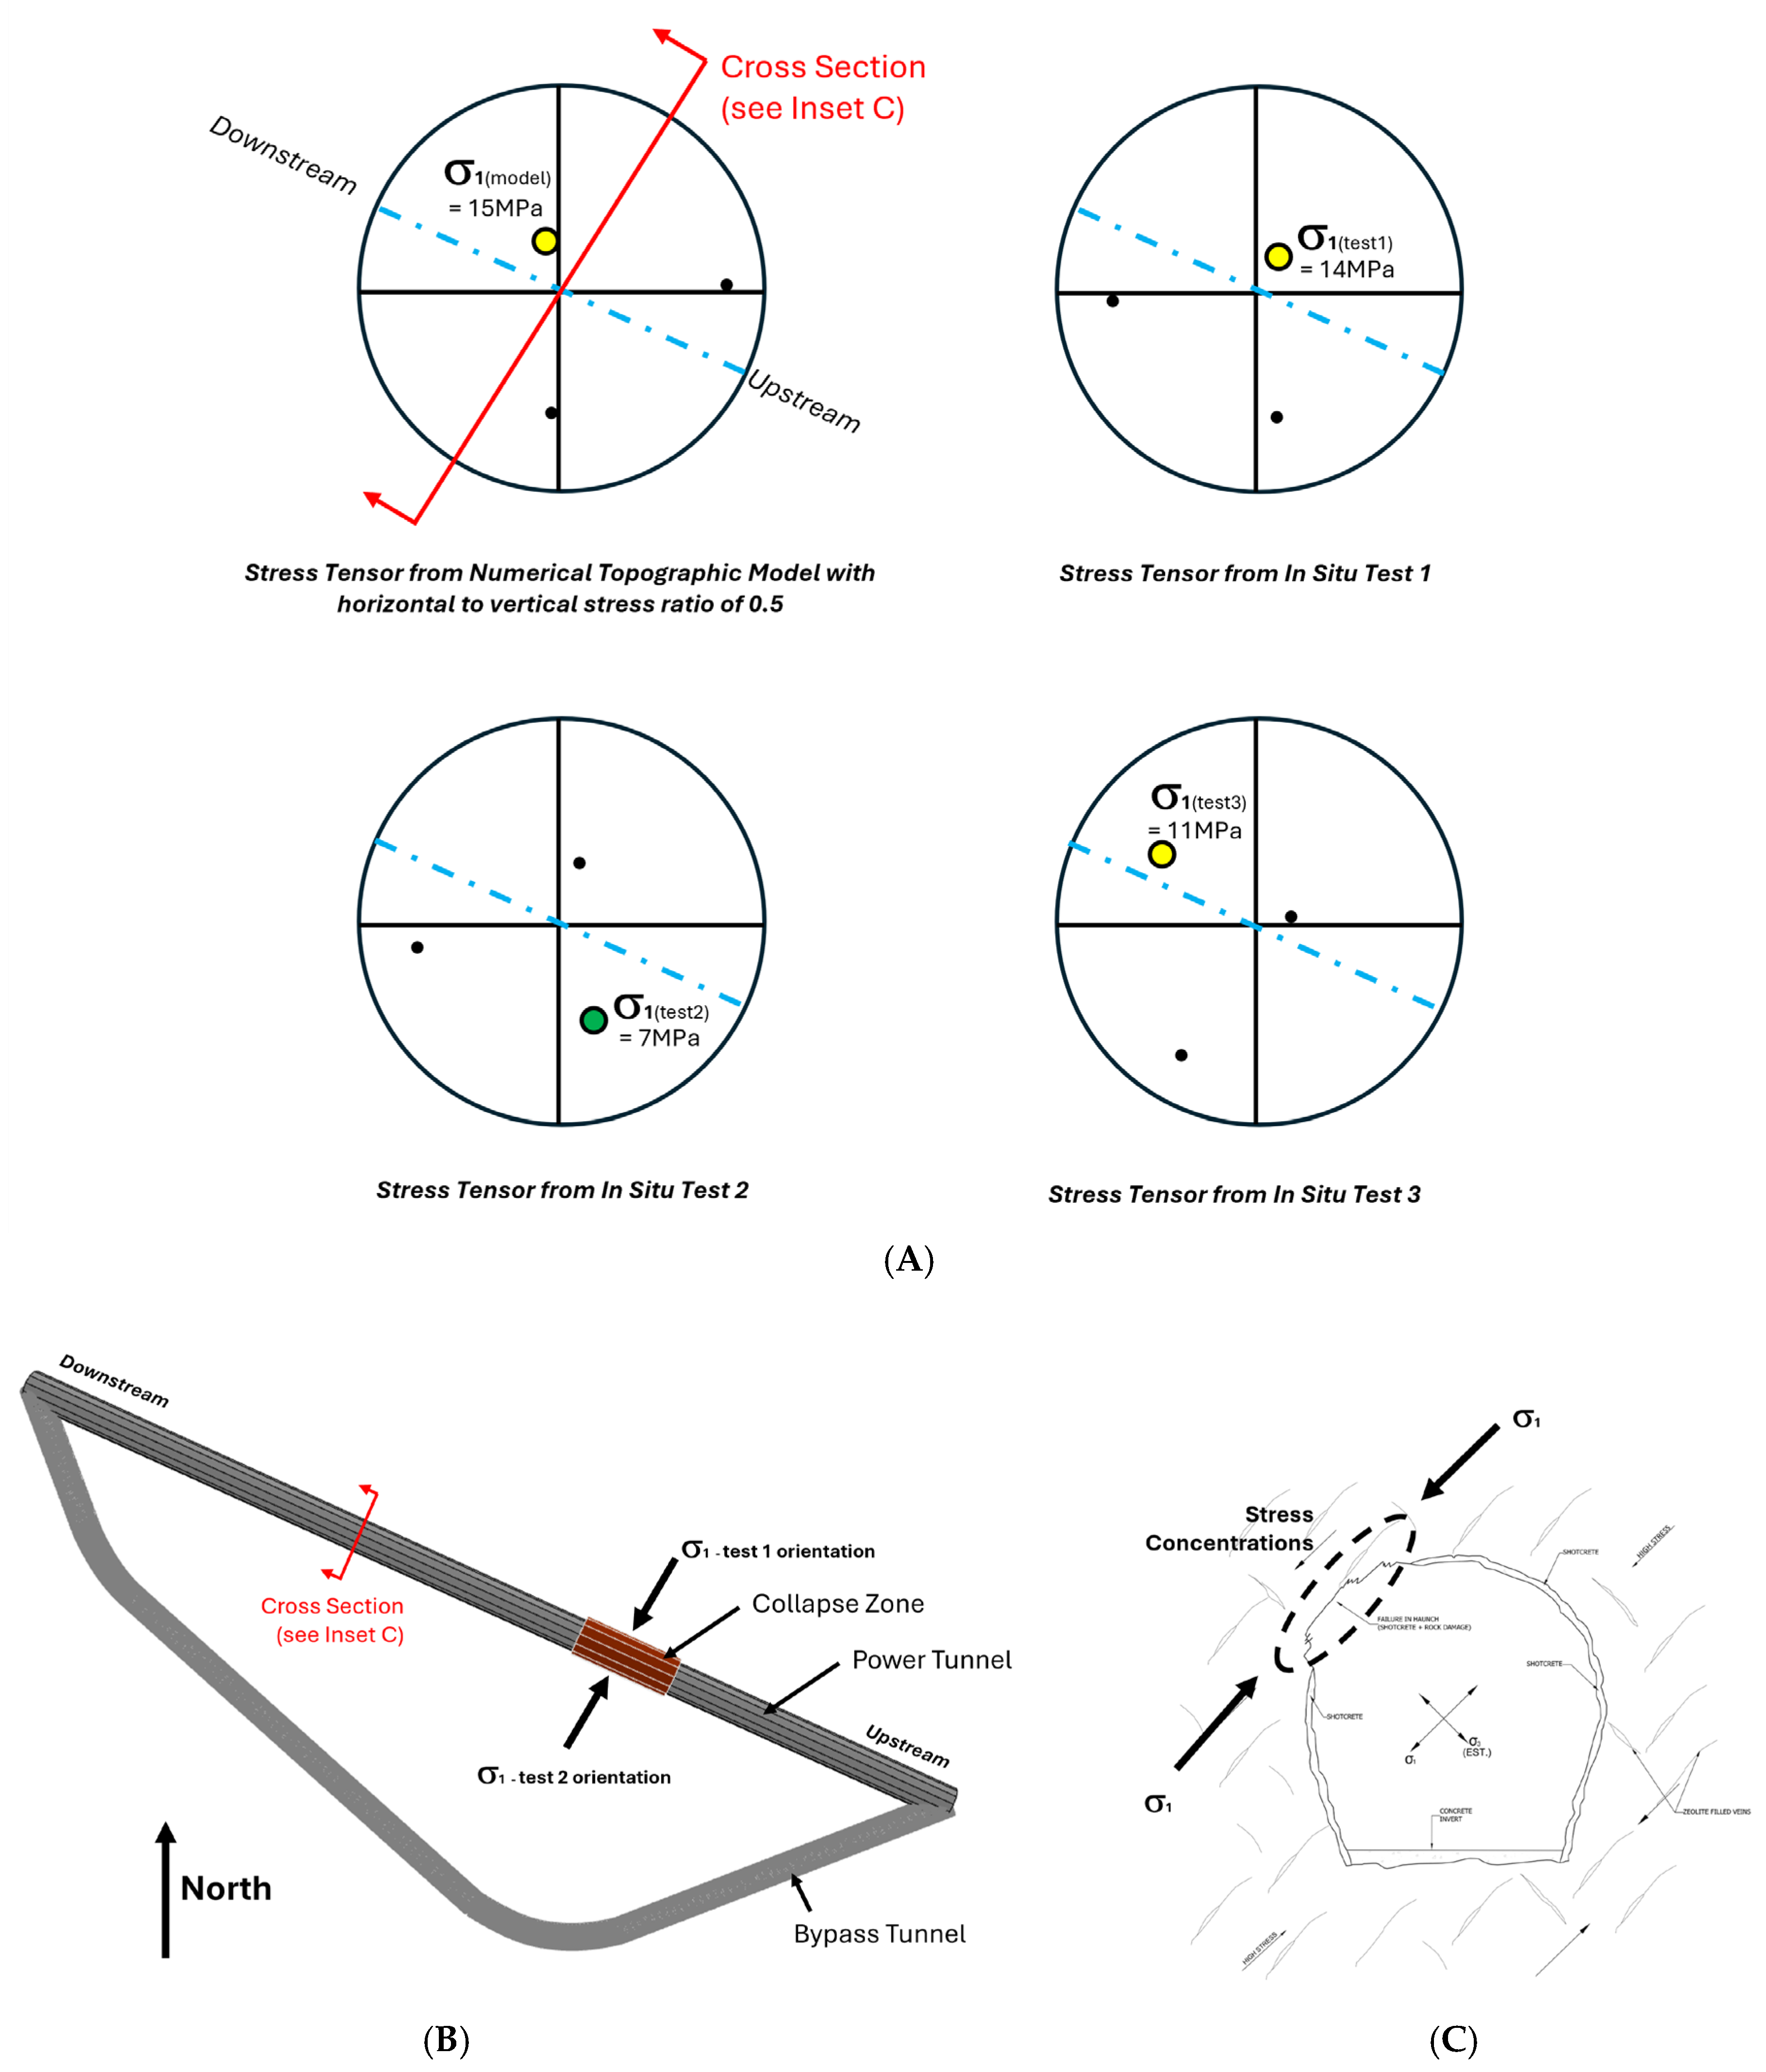
3.3.3. In Situ Stress Measurements

As summarized in Figure 13, three in situ stress measurements were conducted following the collapse (noting that in situ testing was only conducted post collapse and not during tunnel construction).
With the exception of Test 2, σ1 is roughly located in the 1–2 o’clock position when facing downstream for the modelled condition and the other two tests. Similarly, the in situ stress measurements for Test 1 and Test 3 are similar in magnitude to those estimated using the numerical modelling. In Test 2, σ1 flipped to the 10–11 o’clock position when facing downstream, and the magnitude is roughly half of the other tests and the modelled condition.
The reasons for the rotation of σ1 at Test 2 is not clear but given the consistent location of σ1 in the modelled conditions, Tests 1 and 3, and from the observation of the location damage downstream in the AA (lower right insert figure in Figure 13), it was assumed that the orientation in the FDZ was also roughly located in the 1–2 o’clock position when facing downstream. It is conceivable that the stress field in and near the collapse became more uniform, i.e., σ1 and σ2 are likely very near in magnitude, albeit reduced, and this may be a plastic response to accommodate for the weaker rocks in the FDZ and adjacent HART, with stress shed to the stronger AA rocks downstream based on insights from [49].

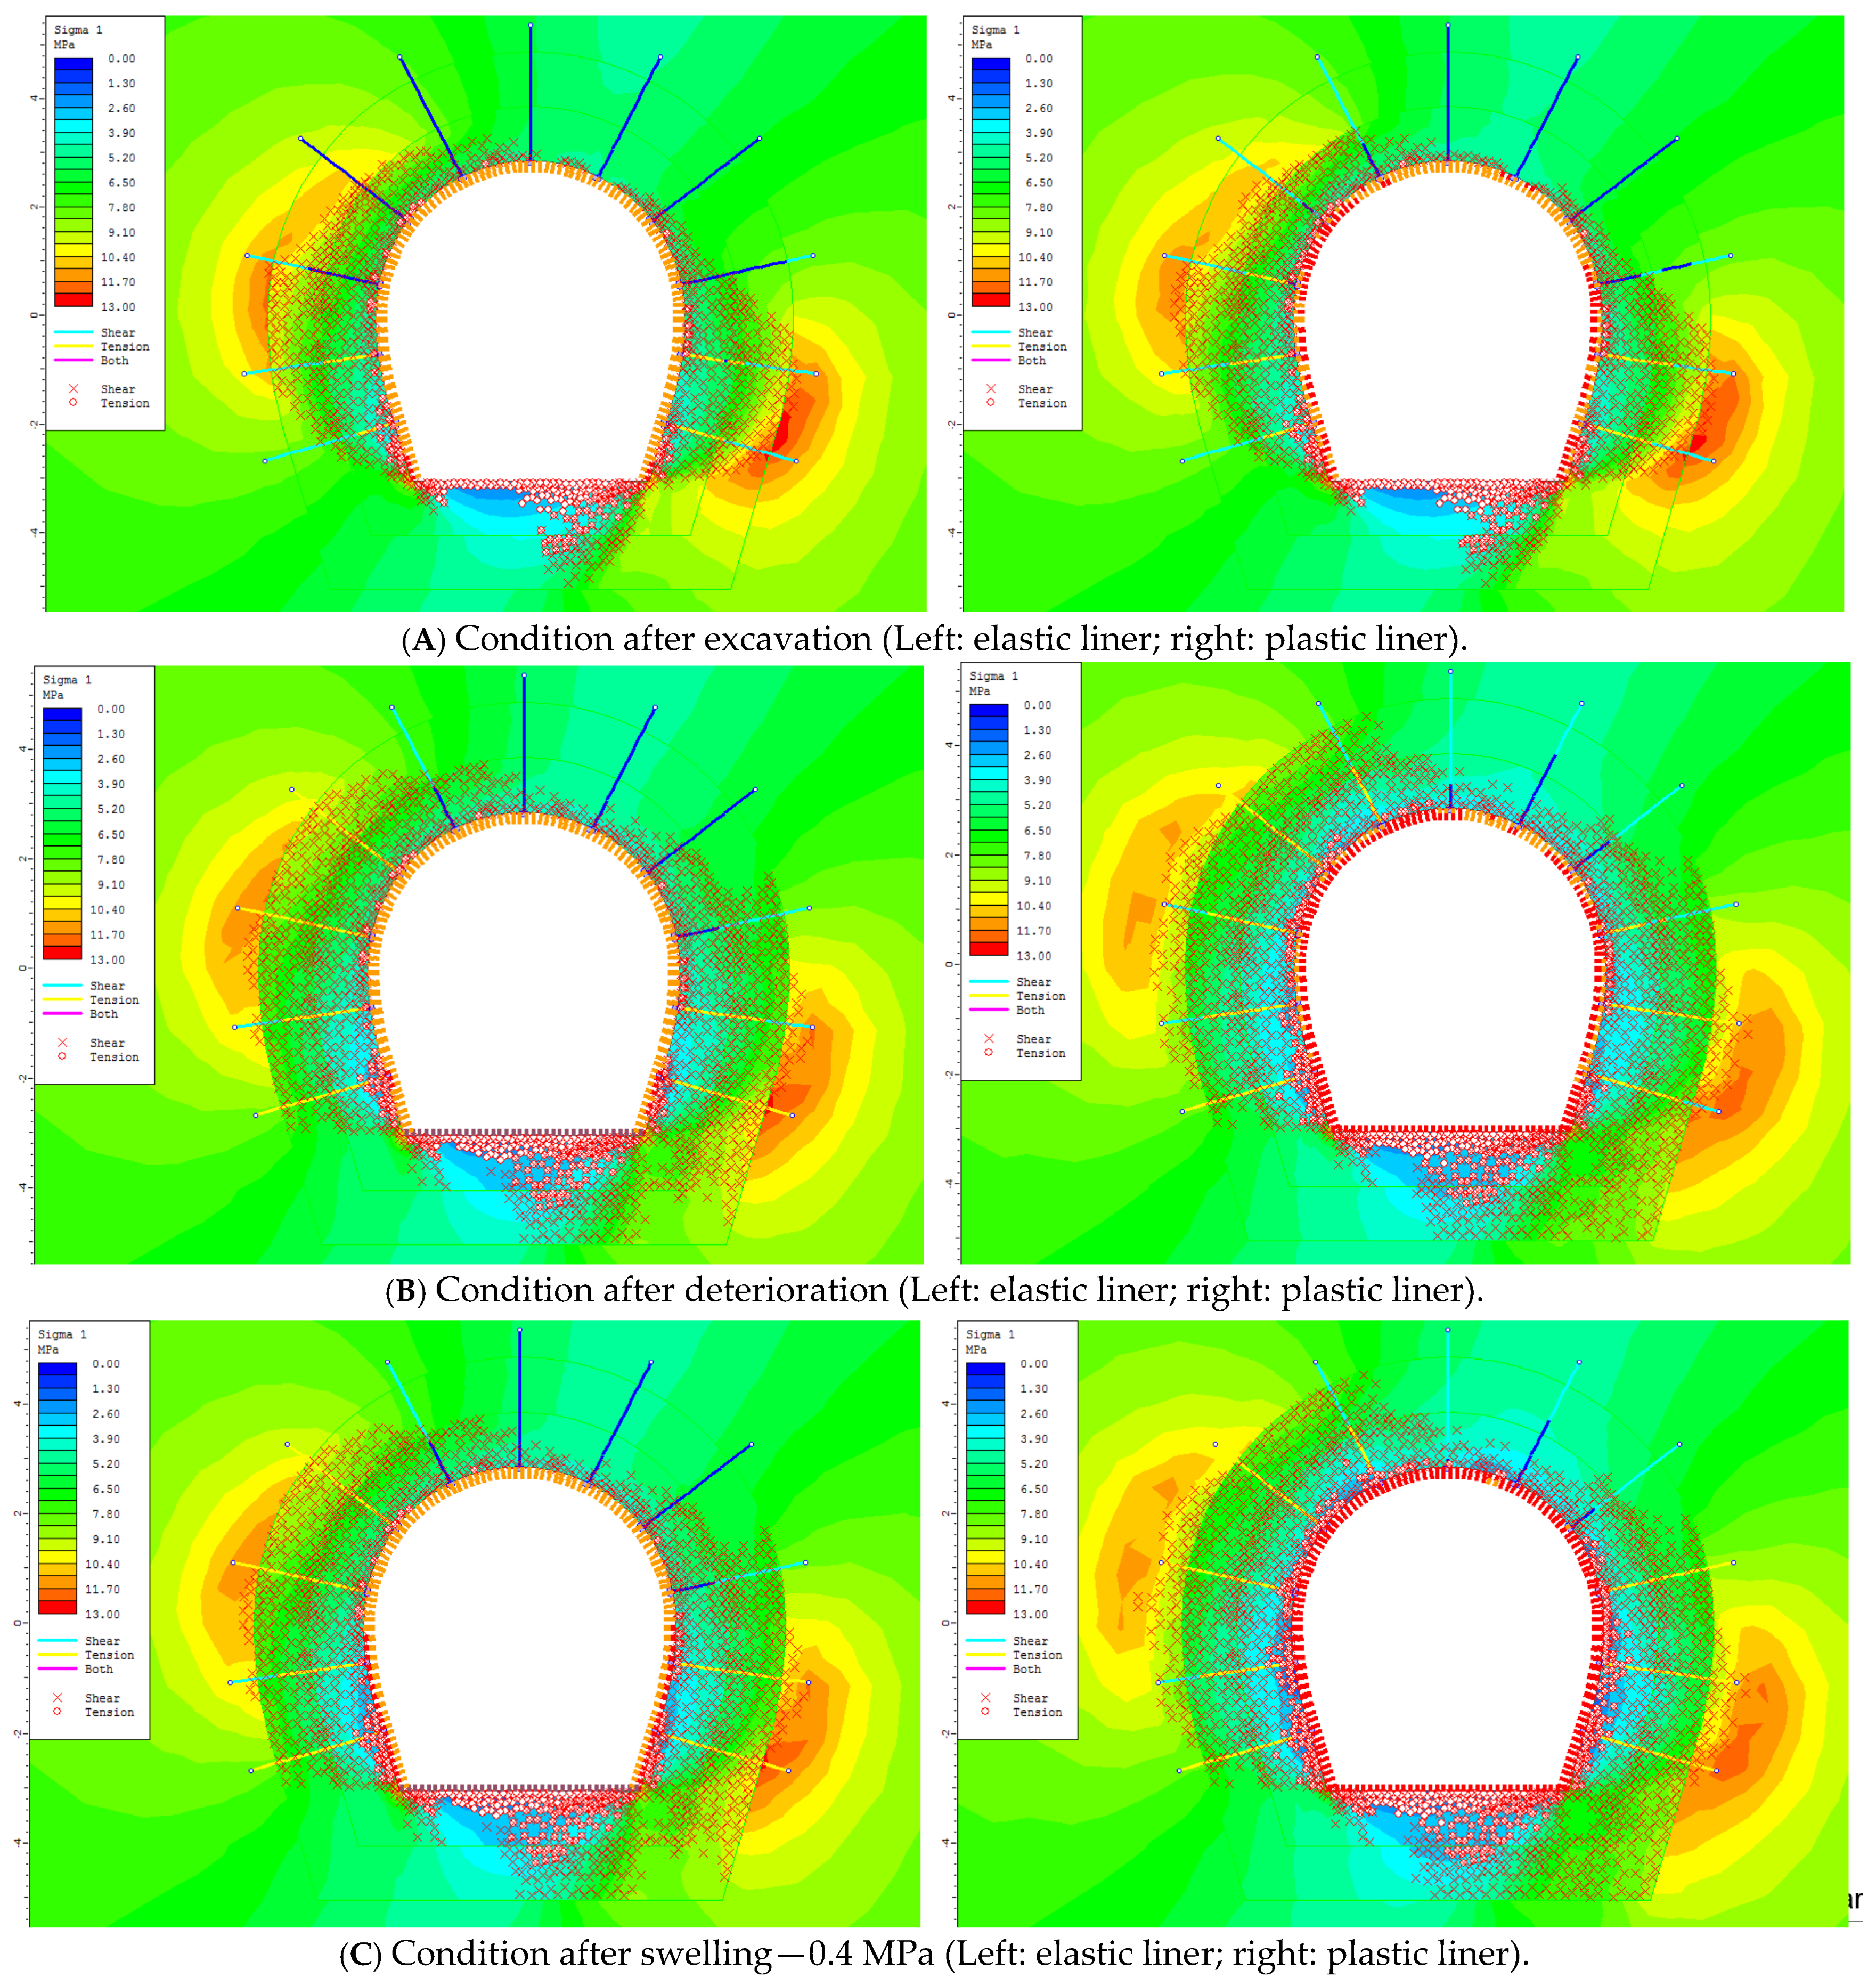
3.3.4. Back Analysis of the Collapse Zone

A 2D finite element back analysis of the FDZ collapse was undertaken to assess the following: (1) the adequacy of the support installed in this area of the tunnel during construction, (2) the impact of the deterioration of the surrounding tunnel rock mass due to the elevated presence of laumontite-induced disintegration and subsequent minor swelling pressure, and (3) the role of the in situ stress field in the collapse in conjunction with the deterioration of the surrounding rock mass. The strengths and other assumed parameters used in the modelling are provided in Table 2, and these are based on observations of the core drilled for the investigation holes and from observations in the by-pass tunnel, and calibration of the parameters was used to simulate (iterative finite element back analysis) the initiation of the collapse in the models.
For the back analysis, the in situ stress tensors from the numerical modelling were rotated to the plane of the tunnel section (perpendicular to the tunnel axis) and resulted in the following stress field:
σ1 = 13.95 MPa at 72° from the horizontal;
σ3 = 5.27 MPa at 18° from the horizontal;
σoop = 4.69 MPa (stress in the out-of-plane direction), where oop means out of plane.
This estimate of the in situ stresses is probably more applicable to the AA rocks where the downstream spalling occurred. Based on the strength estimates in and near the collapse (Table 2), it is rather unlikely that the HART and FDZ rocks could have sustain these high stresses. For this reason, the calibration of in situ stress field in the FDZ was undertaken.
Details of the calibration and modelling are beyond the scope of this paper, but it is sufficient to say that the resulting stress field at the location of the collapse was estimated to be as follows:
σ1 = 7 MPa;
σ13 = σoop = 4 MPa;
Major stress is 20° off vertical in the 1–2 o’clock position when looking downstream.
The rationale behind this adjustment lies in the assumption that the stronger/stiffer AA rocks carried a large part of the vertical load at or near the contact with the FDZ. The FDZ and the adjacent HART rocks for some distance upstream of the collapse were likely in a relative stress shadow because they are weaker and could not carry the same vertical stress, and the full in situ stress load was assumed by the downstream AA rocks.
After the immediate loads due to the excavation of the tunnel were analyzed (step 1); the model allowed for the deterioration of the rock mass around the tunnel to a depth of 1 m to 2 m to simulate the degradation of the FDZ rock as a result of laumontite desiccation (step 2), followed by the build-up of rock swelling pressure with a magnitude of up to 0.4 MPa to simulate the effect of rehydration on laumontite and some swelling on montmorillonite (step 3). The average swelling pressure for the FDZ (as discussed in Section 3.2.3 above) was about 0.1 MPa. The use of 0.4 MPa was considered reasonable for the back analysis since this is equivalent to the highest swell pressures in the FDZ, and it is likely that zones with higher swell pressures would have more impact with respect to initiating the catastrophic collapse.
Two models were run: one with the liner (shotcrete) assumed to behave elastically to assess the level of overstress without plastic cutoff and the other model allowed the liner (shotcrete) to behave plastically to assess how much deeper the failure extended into the rock mass, with failure of liner permitted in this model. Ref. [49] provided guidance related to plastic and elastic responses. The results of the modelling are shown in Figure 14.
In general, Figure 14A–C show the stress distribution and zones of shear and tensile failure in the rock mass surrounding the FDZ as a result of σ1 at 20 degrees from vertical (1–2 o’clock position when facing downstream) for an assumed elastic and plastic liner of 120 mm.
Differences between the model iterations shown include the following:
  • Figure 14A provides results immediately after excavation;
  • Figure 14B shows results after the deterioration of the rock mass surrounding the tunnel;
  • Figure 14C shows results after swelling takes place.
These figures indicate that the support was just adequate to deal with the conditions immediately after excavation (a). It also shows that the support could barely withstand the excavation-induced stresses after material deterioration due to the laumontite effect (indicated by the failed liner in the results for the plastic liner in) (b). Furthermore, the loss of support due to the liner failure leads to a larger failed zone once the swelling pressures develop (c). The model only considered strength deterioration to a depth of 2 m; however, it can be argued that the loss of support (i.e., failure of the shotcrete) led to a progressive failure in the haunch and the crown at the 10–11 o’clock position.
Figure 15A below shows that the load levels on the shotcrete are just within the strength envelope for the majority of the liner immediately after the excavation (stage 1—red markers), but the level of overstress, after the strength deteriorates and the swelling pressures develop, exceeds the strength of the shotcrete, and it was much more noticeable after the combined effect of deterioration and swelling. Figure 15A also indicates that a large sections of the shotcrete after deterioration and swelling (stages 2 and 3—cyan and green markers) are near yielding or in a state of failure.
Figure 15B shows the liner yields in compression (hoop stress) and flexure, as shown by the large number of points on the envelop boundary (right hand graph). It is interesting to note that the shear stresses in the liner were nowhere near the capacity and have held for the most part (horizontal axis in the left graph).
The back analysis shows that for the assumed stress field and the combined mineralogical degradation and swelling potential present at the time of the collapse, the design support was inadequate. Design analyses for the by-pass tunnel in the FDZ suggest that the collapse in the main tunnel would have only been contained using the support similar to that used for the FDZ in the by-pass tunnel. To stop the collapse from occurring in the main tunnel, temporary support should have been installed, followed by something in the order of 500 mm of concrete liner and bolts with appropriate safety factors.
It is concluded from the above that even though there may have been a stress shadow in the vicinity of the FDZ prior to the collapse in the main tunnel, the stress conditions were likely high enough that the weak rock in the vicinity of the collapse was close to being overstressed. This factor, in conjunction with the mineralogical factor described above and the insufficient support following degradation and swelling, all contributed to the initial collapse in the FDZ and the propagation of the collapse upwards in the FDZ. It is also speculated that the propagation of the collapse also occurred to a limited degree into the HART rocks immediately upstream of the FDZ in the hanging wall—see Figure 7.

4. Successive Failures and the Additive Effect of Tunnel Pressure Changes

While the initiation of the collapse is largely ascribed to the mineralogical factor, the propagation of the collapse and full choking or blockage leading to the shutdown of the scheme is likely as a result of the cyclical repetition of the mineralogical factor, the pervasive in situ- stress field, and as a result of changes in transient water pressures. While an operational hydraulics analysis is beyond the scope of this paper, observations in the tunnel post collapse suggest that successive rockfalls in the FDZ may have been a contributing factor, resulting in high transient water pressure differences (with guidance provided by [22,23,24,25,26,27,28,29,30,31,32,33,34,35,36,37,38,39,40,41,42,43,44,45,46,47,48,49]) in and around the collapse zone, and these pressures helped extend and expand the collapse zone (shown schematically in Figure 7).
The following probably contributed to the propagation of the catastrophic collapse, leading to the final project shutdown:
  • As described in Section 3.2.3 and Figure 11 and Figure 12, the swell pressures are highest in the HART rocks and close to or at the transition into the FDZ. It is also apparent when these results are compared with the mineralogical plots (Section 3.2.1 and Figure 9 and Figure 10) that the HART rocks have the highest swelling clay percentages and the lowest laumontite percentages;
  • The tunnel is below the hydraulic grade line [22], so the tunnel would have been under positive pressure during operations;
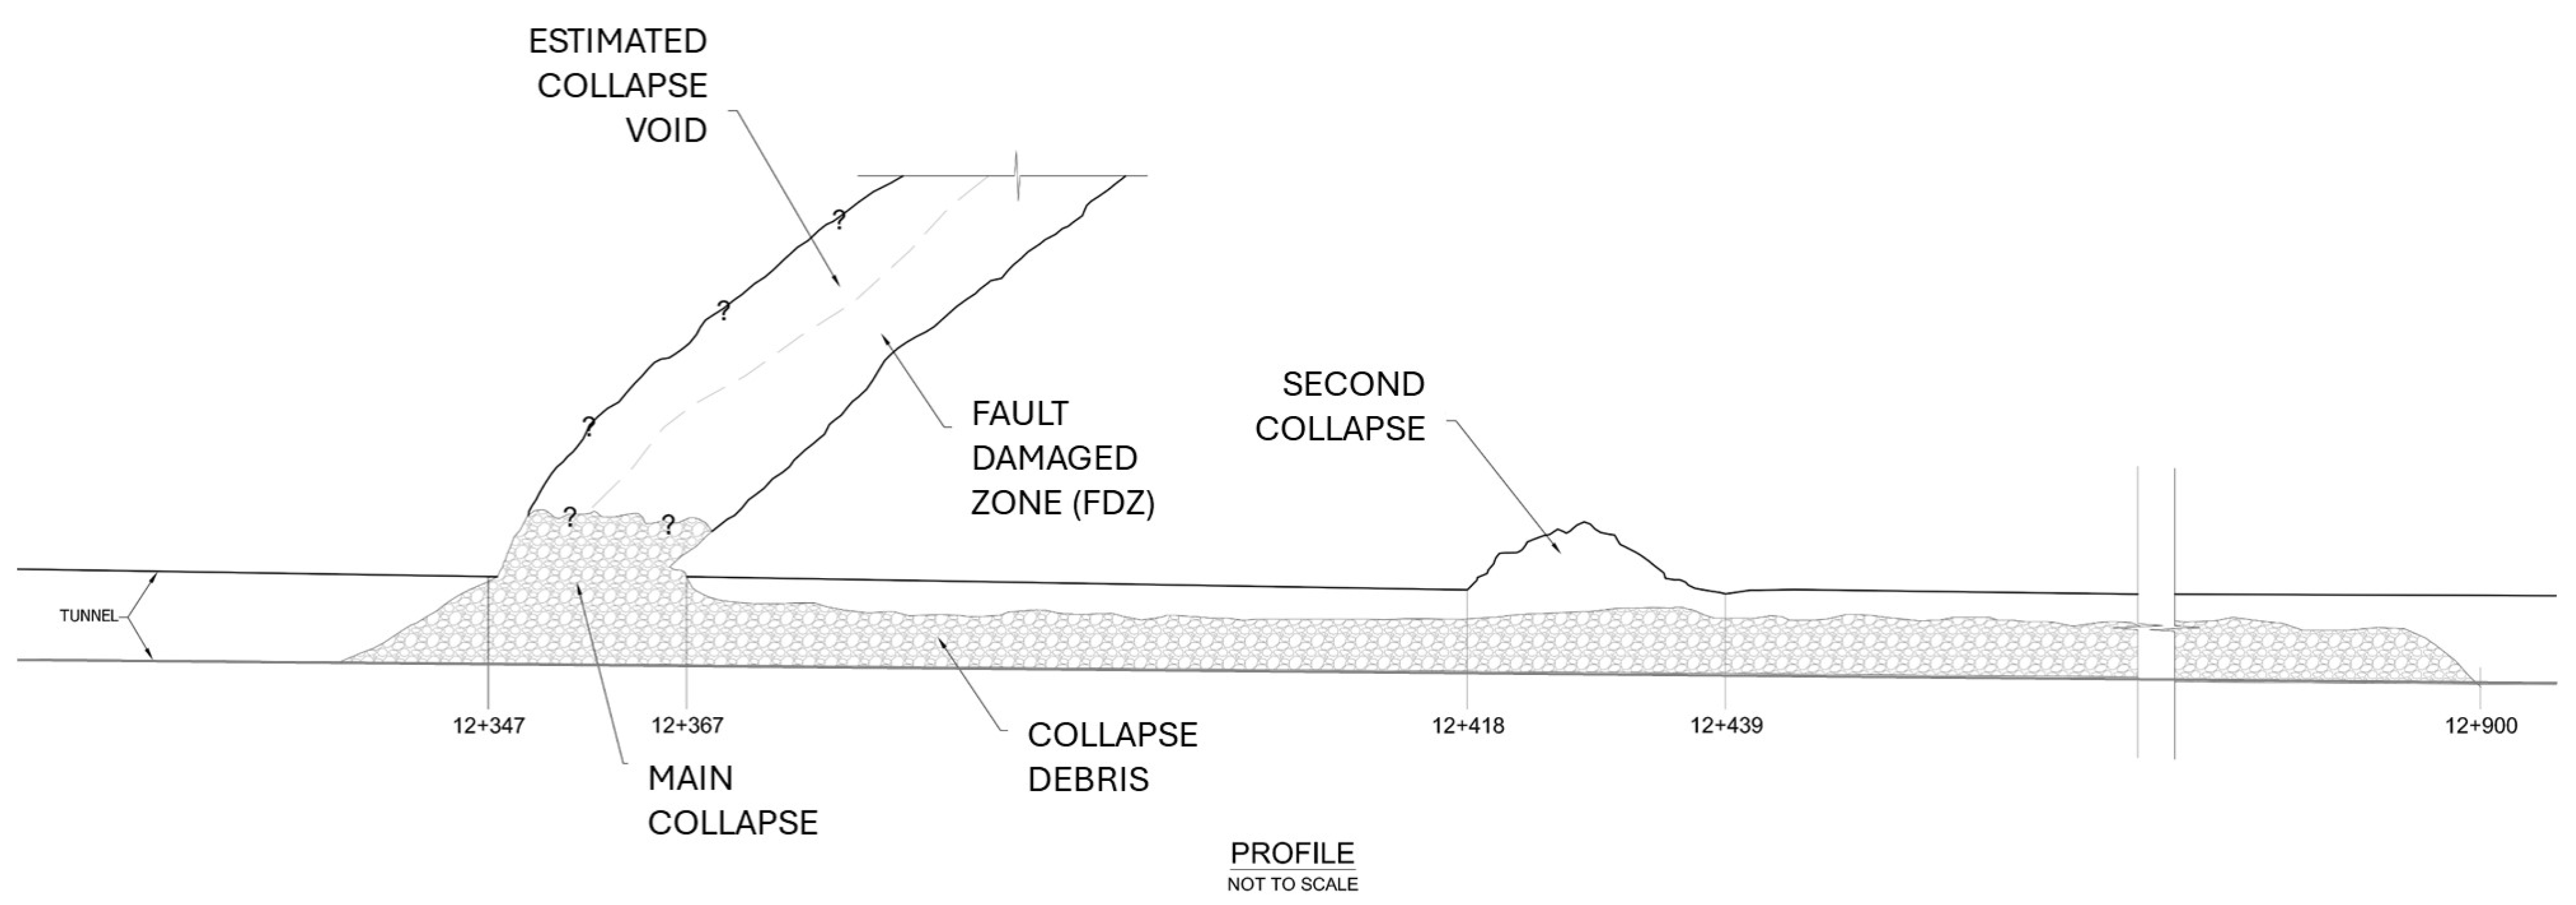
  • When the initial and successive rockfalls occurred and partially blocked the tunnel, the velocities above a particular partial blockage would have increased significantly, and the higher velocity would be able to transport material downstream from the collapse zone. This material was deposited downstream of the blockage, where the velocity drops, as shown in Figure 1 and Figure 6. This process continued as the collapse propagated upwards and more material collapsed in a series of rockfalls, with the higher flow velocities preventing the collapse zone from fully “choking” and stopping water flow. This is believed to be part of the reason why the volume of the collapse debris is so great;
  • After each rockfall occurred and the tunnel partially filled with debris (as shown in Figure 7), the velocity increased at the collapse (partial choke point) as described above. This would have had the effect of lowering the pressure in the tunnel via the Venturi effect. The pore pressure in the rock (in particular, in the FDZ) would remain the same as before the collapse, so the differential pressure would destabilize the material in the fault-damaged zone, causing further collapse;
  • At the final blockage, the tunnel downstream of the collapse is understood to have briefly completely drained downstream of the collapse; thus, the pressure in this section of the tunnel would have been lowered to atmospheric pressure or less. This unplanned depressurization would further result in a pressure differential between the rock around the tunnel and the interior of the tunnel, which would exacerbate the shotcrete and rock spalling. This may have caused the downstream so-called ‘second collapse zone’(Figure 1) in conjunction with the relatively high in situ stress field, where the fall-out material was observed to be sitting on top of the debris from the main collapse. While it is not known when individual rockfalls occurred, it is understood that the blockages only became significant enough to be detected in the degraded performance of the scheme a few days prior to the shutdown.
There may have been some contribution to the external pressure on the rock support as a result of ground water pressure, but this effect is not considered critical in this analysis, other than to say that groundwater was observed to be draining into the tunnel in the vicinity of the collapse once the tunnel was fully drained after the collapse.
It is concluded that the transient water pressure differences, as described above, likely helped to further weaken the haunch and the crown area rock in the FDZ in conjunction with ongoing cyclical mineralogical degeneration and the effects of the in situ stress promoting and propagating collapse into the tunnel.
As shown schematically in Figure 7, once the initial shotcrete collapsed in the haunch and crown area, the entire process would have started again (mineralogical breakdown, overstressing, and changes in transient water pressures) within the FDZ (Figure 7C,D). Since the FDZ is essentially near parallel with the general stratigraphic layering present in the rock, it is reasonable to assume that the degradation developed upwards but parallel to the FDZ in a westerly direction. It is not known if these successive steps occurred rapidly or if there was a time delay between events, but the lack of confinement (no support) would certainly have exacerbated the situation.
For partial blockages, the flow velocities above the debris pile would be sufficient to carry the failed material downstream but may also initially have resulted in some damage to the FDZ above and to the remaining intact shotcrete around the collapse as a result of the increased flow, as shown schematically in Figure 7C. As shown in Figure 7D, when the tunnel became totally blocked in the FDZ, this causes the tunnel downstream to drain.
During the blockages, the crown void in the FDZ would have been near or below atmospheric pressure, and the rock adjacent to it would have water pressures in the rock that was at near full tunnel pressure. These pressure differences would certainly have contributed to propagating the collapse within the FDZ. This effect may also have been further exacerbated by the presence of the water table pressure, which was likely present in the rock at this elevation. When the FDZ collapsed and created the crown void, it is also probable that the weak HART rocks in the hanging wall (upstream of the FDZ) would have started to collapse as well, thereby propagating the collapse zone to the east and possibly widening it (see Figure 7C,D). Both the HART rocks and the FDZ rocks would have dropped into the void as the tensile capacity of the rock above the void was exceeded. The intact tensile capacity of the HART rocks would have been about 1/10 of the UCS of about 25 MPa, and this would have likely further reduced because of the water pressure difference between the HART and the void (less than 2.5 MPa). In the case of the FDZ rock per se, the tensile capacity would have significantly reduced due to both the mineralogical degradation and swelling and the pressure difference between the FRD rock and the void, with material dropping into the void.
The pressure differences, combined with overstressing and general mineralogical degradation in the FDZ, would have facilitated the propagation of the collapse zone to the extent that 12,000 m3 collapsed in a series of rockfalls before the tunnel became completely choked, and the project was shut down by the catastrophic collapse. The confluence of all of these factors resulted in a complex interaction that completely blocked the tunnel.

5. Conclusions

This paper provides a distillation of the work performed for the root cause analysis (RCA) of the collapse in a hydroelectric tunnel. The RCA and the lessons learnt do not represent a laboratory-based research project in a controlled environment. The RCA was undertaken in real time to help expedite the design of the by-pass tunnel and make the scheme become operational again. The RCA work was undertaken to establish an understanding of the reasons for the collapse and why it was not foreseen prior to or during construction. The lessons learned were integrated into the design of the by-pass tunnel, which passed through the same FDZ rocks. Nevertheless, the analysis and results presented in this paper represent a state-of-the art distillation and advancements in the knowledge related to durability problems due to the presence of laumontite in volcanic rocks and the potential effects on tunnelling projects.
The conclusion from the RCA presented in this paper shows that there was no clear evidence of a simple or single failure mechanism. A complex and unusual interrelationship of factors converged in this zone, and this resulted in a failure of unusual magnitude and nature despite the ground support installed during construction. The coupling effect of each factor’s contribution is quantified implicitly in the finite element numerical modelling undertaken to back-analyze the initiation of the collapse, i.e., strength reduction in the rocks in the FDZ due to the desiccation of laumontite followed by minor swelling as a result of the rehydration of laumontite once the tunnel was operational. The RCA data used to calibrate the strength parameters are described in detail in this paper. The coupled effect of the in situ stress field is also implicitly considered in the modelling, with the input data coming from in situ stress testing post collapse (no stress measurements were taken during construction). The coupled effect of the transient water pressure changes during the several episodes of partial and final collapse is not explicitly included in the modelling primarily because there are no data; rather, this effect is assumed based on evidence from the observation of cyclical bedding deposits in the debris pile downstream of the collapse.
The paper is mainly based on post-accident investigations, tests, and modelling. The collapse occurred a year after the project became operation and therefore lacks long-term monitoring data during the tunnel operation. The authors also did not have access to operational monitoring data; it is sufficient to say that some anecdotal evidence was provided, and there were drops in pressure and sediment noted at the powerhouse a few days before the scheme was shut down. It is therefore not possible to fully analyze the development trends of various influencing factors over time before the accident. This, however, does not negate the RCA or the lessons learnt.
The RCA and the design process for the by-pass tunnel (not described in this paper) indicated that to have halted the interaction of all of the factors described above, it would have required a 0.5 m permanent concrete liner in the FDZ. The support designed in the collapse zone was insufficient for the unforeseen conditions encountered, but as the saying goes, hindsight is perfect, and the recognition of the interaction of the above factors was not feasible based on the information gathered from the routine tunnel mapping and the testing (following industry standard of care) undertaken during tunnel construction.
The lessons from Lesotho’s experience and the confidential projects presented in this paper show that the presence of elevated laumontite can be used as an indicator, but this alone does not provide an explicit design method that fits all circumstances. The degradation process needs to be understood and halted, and further research in this regard is required. Increased radial pressures also need to be accommodated in the lining design as a result of initial deterioration of the rock mass around the tunnel as a result of laumontite desiccation, followed by the build-up of albeit relatively small rock swelling pressure as a result of rehydration of laumontite and the presence of minor amounts of swelling clay.
An additional lesson is that merely increasing the support level marginally above the assessed in situ Q values may not be adequate when laumontite is present in percentages greater than 10% and when percentages are in the 40 to 50% range (depending on the rock type); extra care should be taken when designing support. Analysis similar to that used for the back analysis presented above may be required over and above just Q support charts and classes.
Finally, experience suggests that, in volcanic terrains where tunnelling is planned, the standard of practice should include regional studies with systematic drilling and sampling of long boreholes through volcanic stratigraphy and outcrops, followed by XRD and geochemical analysis. With correlation between boreholes, it should be possible to spatially locate laumontite-rich (narrow or wide) zones and their possible displacement with faulting if present before tunnelling commences. If bedding parallel slippage or faulting is suspected in hydrothermally altered terrane, drilling and XRD testing should also target these zones.

Author Contributions

Conceptualization, P.S. and J.C.; software, J.C. and B.P.; formal analysis, P.S. and J.C.; writing—original draft preparation, P.S.; writing—review and editing, P.S., J.C. and B.P; visualization, B.P.; supervision, P.S. All authors have read and agreed to the published version of the manuscript.

Funding

This research received no external funding.

Institutional Review Board Statement

Not applicable.

Informed Consent Statement

Not applicable.

Data Availability Statement

Confidential project, data not available.

Conflicts of Interest

The authors and WSP Canada Inc. declare no conflicts of interest.

References

  1. Steiner, W. Swelling rock in tunnels: Rock characterization, effect of horizontal stresses and construction procedures. Int. J. Rock Mech. Min. Sci. Geomech. Abstr. 1993, 30, 361–380. [Google Scholar] [CrossRef]
  2. Brattli, B.; Broch, E. Stability problems in water tunnels caused by expandable minerals. Swelling pressure measurements and mineralogical analysis. Eng. Geol. 1995, 39, 151–169. [Google Scholar] [CrossRef]
  3. Einstein, H. Tunnelling in difficult ground—Swelling behaviour and identification of swelling rocks. Rock Mech. Rock Eng. 1996, 29, 113–124. [Google Scholar] [CrossRef]
  4. Nakano, R.; Shimizu, H.; Nishimura, S. Cause of swelling phenomena in tunnelling and a proposal for a design procedure for a swelling tunnel. Soils Found. 1996, 36, 101–112. [Google Scholar] [CrossRef]
  5. Castro, S.; Van Sint Jan, M.; Gonzalez, R.; Lois, P.; Velasco, L.E. Dealing with expansive rocks in the Los Quilos and Chacabuquito water tunnels-Andes mountains of central Chile. In Proceedings of the 10th ISRM Congress, Sandton, South Africa, 8–12 September 2003; International Society for Rock Mechanics and Rock Engineering: Lisbon, Portugal, 2003. [Google Scholar]
  6. Galera, J.; Paredes, M.; Menchero, C.; Pozo, V. Risk Associated with Swelling Rocks in Volcanic Formations in the Design of Hydro-Tunnels. In Proceedings of the ISRM Regional Symposium-EUROCK 2014, Vigo, Spain, 26–28 May 2014; International Society for Rock Mechanics: Lisbon, Portugal, 2014. [Google Scholar]
  7. Pimentel, E. Existing methods for swelling tests—A critical review. Energy Procedia 2015, 76, 96–105. [Google Scholar] [CrossRef]
  8. Cao, C.; Shi, C.; Lei, M.; Yang, W.; Liu, J. Squeezing failure of tunnels: A case study. Tunn. Undergr. Space Technol. 2018, 77, 188–203. [Google Scholar] [CrossRef]
  9. Brox, D. Hydropower tunnel failures: Risks and causes. In Tunnels and Underground Cities: Engineering and Innovation Meet Archaeology, Architecture and Art; CRC Press: Boca Raton, FL, USA, 2019; pp. 4386–4396. [Google Scholar]
  10. Selen, L.; Panthi, K.K.; Vergara, M.R.; Mørk, M.B. Investigation on the effect of cyclic moisture change on rock swelling in hydropower water tunnels. Rock Mech. Rock Eng. 2021, 54, 463–476. [Google Scholar] [CrossRef]
  11. Alonso, E.; Ramon-Tarragona, A.; Verda, L. Designing tunnel lining in anhydritic claystones. Intensity and distribution of swelling forces. Rock Mech. Rock Eng. 2023, 56, 1467–1487. [Google Scholar] [CrossRef]
  12. Barton, N.R.; Lien, R.; Lunde, J. Engineering classification of rock masses for the design of tunnel support. Rock Mech. 1974, 6, 189–239. [Google Scholar] [CrossRef]
  13. Barton, N. Some new Q-value correlations to assist in site characterization and tunnel design. Int. J. Rock Mech. Min. Sci. 2002, 39, 185–216. [Google Scholar] [CrossRef]
  14. Palmstrom, A.; Broch, E. Use and misuse of rock mass classification systems with particular reference to the Q-system. Tunn. Undergr. Space Technol. 2006, 21, 575–593. [Google Scholar] [CrossRef]
  15. Goricki, A.; Rachaniotis, N.P.; Hoek, E.; Marinos, P.G.; Tsotsos, S.; Schubert, W. Support Decision Critieria for Tunnels in Fault Zones. Felsbau 2006, 24, 51–57. [Google Scholar]
  16. Schubert, W.; Fasching, A.; Goricki, A. Tunnelling in fault zones—State of the art. Tunn. Undergr. Space Technol. 2006, 21, 376–377. [Google Scholar] [CrossRef]
  17. Anagnostou, G.; Kovári, K. Tunnelling through geological fault zones. In Proceedings of International Symposium on Design, Construction and Operation of Long Tunnels, Taipei, Taiwan, 7–10 November 2005; ETH-Zürich: Zurich, Switzerland, 2005. [Google Scholar]
  18. Shrestha, P.K.; Panthi, K.K. Groundwater effect on faulted rock mass: An evaluation of Modi Khola pressure tunnel in the Nepal Himalaya. Rock Mech. Rock Eng. 2014, 47, 1021–1035. [Google Scholar] [CrossRef]
  19. Anagnostou, G.; Kovari, K. Tunnelling Through Geological Fault Zones; Zurich Research Collection; ETH: Zurich, Switzerland, 2005. [Google Scholar]
  20. Hoek, E.; Marinos, P.G. Tunnelling in Overstressed Rock. In Rock Engineering in Difficult Ground Conditions—Soft Rocks and Karst; Vrkljan, I., Ed.; Taylor and Francis Group: London, UK, 2009; pp. 49–60. [Google Scholar]
  21. Bravo, A.; Jerez, O.; Kelm, U.; Poblete, M. Dehydration-hydration reactivity of laumontite: Analyses and tests for easy detection. Clay Miner. 2017, 52, 315–327. [Google Scholar] [CrossRef]
  22. Ghimire, S.; Panthi, K.K.; Vereide, K. Hydraulic Transient Impact on Surrounding Rock Mass of Unlined Pressure Tunnels. Water 2023, 15, 3894. [Google Scholar] [CrossRef]
  23. Twiss, R.J.; Moore, E.M. Structural Geology; W.H. Freeman: New York, NY, USA, 1992. [Google Scholar]
  24. Bish, D.L.; Post, J.E. (Eds.) Modern Powder Diffraction; Reviews in Mineralogy & Geochemistry; De Gruyter: Vienna, Austria, 1989; Volume 20. [Google Scholar] [CrossRef]
  25. Schlotfeldt, P.J.E. Assessment of Basalt Durability. Unpublished Report No. 1009/24/00. Lesotho Highlands Tunnel Partnership (Mohale); Lesotho Highlands Development Authority: Maseru, Lesotho, 1995. [Google Scholar]
  26. Bell, F.; Haskins, D. A geotechnical overview of Katse dam and transfer tunnel, Lesotho, with a note on basalt durability. Eng. Geol. 1997, 46, 175–198. [Google Scholar] [CrossRef]
  27. Schlotfeldt, P. The Engineering Geology of the Katse Arch Dam, Lesotho Highlands. Ph.D. Thesis, University of Cape Town, Cape Town, South Africa, 1999. [Google Scholar]
  28. Bell, F.G.; Haskins, D.R.; Jermy, C.A. Basalt Durability and the Transfer Tunnel: Lesotho Highlands Water Project. In Proceedings of the Conference Proceedings—GeoEng 2000, Melbourne, Australia, 19–24 November 2000. [Google Scholar]
  29. Schlotfeldt, P. Assessment of basalt durability in tunnels—The Lesotho Highlands water scheme experience (Southern Africa). In Proceedings of the Conference Proceedings—Vancouver TAC 2014—Tunneling in a Resource Diven World, Vancouver, BC, Canada, 26–28 October 2014. [Google Scholar]
  30. Zen, E. Burial metamorphism. Can. Miner. 1974, 12, 445–455. [Google Scholar]
  31. Zen, E.; Thompson, A.B. Low grade regional metamorphism: Phase equilibrium relations. Ann. Rev. Earth Planet. Sci. 1974, 2, 179–212. [Google Scholar] [CrossRef]
  32. Kristmannsdottir, H.; Tomasson, J. Zeolite zones in geothermal areas in Iceland. In Natural Zeolites, Occurrence, Properties, Use; Sand, L.B., Mumpton, F.A., Eds.; Springer: Pergamon, Turkey; Oxford, UK, 1978; pp. 269–275. [Google Scholar]
  33. Cathelineau, M.; Nieva, D. A chlorite solid solution geothermometer the Los Azufres (Mexico) geothermal system. Contrib. Mineral. Petrol. 1985, 91, 235–244. [Google Scholar] [CrossRef]
  34. Liou, J.G.; Maruyama, S.; Cho, M. Phase equilibria and mineral parageneses of metabasites in low-grade metamorphism. Mineral. Mag. 1985, 49, 321–333. [Google Scholar] [CrossRef]
  35. Mehegan, J.M.; Robinson, P.T.; Delaney, J.R. Secondary mineralization and hydrothermal alteration in the Reydarfjordur drill core, eastern Iceland. J. Geophys. Res. 1982, 87, 6511–6524. [Google Scholar] [CrossRef]
  36. Coombs, D.S. Dehydration veins in diagenetic and very-low-grade metamorphic rocks: Features of the crustal seismogenic zone and their significance to mineral facies. J. Metam. Geol. 1993, 11, 389–399. [Google Scholar] [CrossRef]
  37. Schiffman, P.; Fridleifsson, G.O. The smectite-chlorite transition in drillhole NJ-15, Nesjavellier geothermal field, Iceland: XRD, BSE and electron microprobe investigations. J. Metam. Geol. 1991, 9, 679–696. [Google Scholar] [CrossRef]
  38. Schmidt, S.T. Regional and local patterns of low-grade metamorphism in the North Shore Volcanic Group, Minnesota, USA. J. Metam. Geol. 1993, 11, 401–414. [Google Scholar] [CrossRef]
  39. Vergara, M.; Levi, B.; Villarroel, R. Geothermal-type alteration in a burial metamorphosed volcanic pile, central Chile. J. Metam. Geol. 1993, 11, 449–454. [Google Scholar] [CrossRef]
  40. Dunlevey, J.N.; Ramluckan, V.R.; Mitchell, A.A. Secondary mineral zonation in the Drakensberg Basalt Formation, South Africa. S. Afr. J. Geol. 1993, 96, 215–220. [Google Scholar]
  41. MacKellar, D.C.R.; Reid, J.A.F. Mineralogical Aspects of the Durability of Basalt in the Lesotho Highlands. Tuncon ’94: Advances in Underground Construction with Special Reference to Tunnelling in Basalt; South African National Council on Tunnelling: Midrand, South Africa, 1994; pp. 93–102. [Google Scholar]
  42. Marsh, J.S.; Eales, H.V. The chemistry and petrogenesis of igneous rocks of the Karoo central area, Southern Africa. Spec. Publ. Geol. Soc. S. Afr. 1984, 13, 27–67. [Google Scholar]
  43. Boniface, A. Some technical lessons learnt from construction of the Lesotho Highlands Water Project transfer tunnel. Tunn. Undergr. Space Technol. 1999, 14, 29–35. [Google Scholar] [CrossRef]
  44. ISRM. Suggested methods for determining water content, porosity, density, absorption and related properties and swelling and slake-durability index properties. Int. J. Rock Mech. Min. Sci. Geomech. Abstr. 1979, 16, 141–156. [Google Scholar]
  45. ISRM. Suggested methods for laboratory testing of argillaceous swelling rocks. Int. J. Rock Mech. Min. Sci. Geomech. Abstr. 1989, 26, 415–426. [Google Scholar]
  46. ISRM. Suggested methods for laboratory testing of swelling rocks. Int. J. Rock Mech. Min. Sci. 1999, 36, 291–306. [Google Scholar]
  47. ASTM D4546-08; Standard Test Methods for One-Dimensional Swell or Collapse of Cohesive Soils. ASTM: West Conshohocken, PA, USA, 2008. [CrossRef]
  48. Chaudhary, B.; Panthi, K.K.; Trinh, N.Q. Assessment on the in-situ rock stress condition along an unlined pressure tunnel/shaft of a Norwegian Hydropower Project using numerical modeling. In Proceedings of the ISRM Congress ISRM–15CONGRESS, Salzburg, Austria, 9–14 October 2023; ISRM: Lisbon, Portugal, 2023. [Google Scholar]
  49. Hoek, E.; Carranza-Torres, C.; Diederichs, M.; Corkum, B. The 2008 Kersten Lecture Integration of geotechnical and structural design in tunneling. In Proceedings of the 56th Annual Geotechnical Engineering Conference, Minneapolis, MN, USA, 29 February 2008; pp. 1–53. [Google Scholar]
  50. Phase2-2D Finite Element Program for Calculating Stresses and Estimating Support around Underground Excavations. 2001. Available online: https://www.rocscience.com/downloads/phase2/Phase2_ModelReference.pdf (accessed on 24 December 2024).
Figure 1. Tunnel profile with main collapse, collapse debris, and estimated collapse zone void shown. “?” indicates inferred top of main collapse debris.
Applsci 15 01437 g001
Figure 3. Tunnel profile showing the fault-damaged zone (FDZ) and close-up of rock types in the collapse zone.
Applsci 15 01437 g003
Figure 4. Total area of shotcrete detachment vs. tunnel mapping “Clock Time” facing downstream. (A) Chart and (B) mapping clock time legend, inset B.
Applsci 15 01437 g004
Figure 5. Tunnel section downstream of the collapse in AA rocks showing stress-induced failure initiation of zeolite-filled veins. (A) Section showing interpreted stress orientations; (B) close up showing dilation in rapid dewatering condition.
Applsci 15 01437 g005
Figure 6. Oblique view showing the interpreted FDZ including FDZ-HART (green) and FDZ-CLT (blue) geological units.
Applsci 15 01437 g006
Figure 8. Interpreted bedding parallel fault movement (slippage) forming the fault-damaged zone (FDZ)—not to scale (adapted from [23]).
Applsci 15 01437 g008
Figure 9. XRD weight percent (%) vs. distance from the FDZ from geotechnical test hole samples. Red numbers on x-axis indicate upstream distance from FDZ midpoint.
Applsci 15 01437 g009
Figure 10. XRD weight percent (%) vs. by-pass tunnel station samples.
Applsci 15 01437 g010
Figure 11. Swell pressure data vs. distance from the FDZ from the geotechnical test hole sample. Red numbers on x-axis indicate upstream distance from FDZ midpoint.
Applsci 15 01437 g011
Figure 12. Swell pressure data vs. by-pass tunnel station samples.
Applsci 15 01437 g012
Figure 13. In situ stress measurement results. (A) Orientation and magnitude of the in situ stress tensor from various tests and models, and (B) tunnel plan view showing general orientation of major principal stress from in situ Test 1 and Test 3 and the topographic model. Test 2 shows the rotated position of the principal stress measured well upstream of the collapse, and (C) schematic tunnel section showing the orientation of the major principal stress from in situ tests in the AA rocks downstream of the collapse (see Figure 5) Test 1 was conducted approximately 500 m upstream of the collapse. Test 2 was conducted around 90 m upstream of the collapse, and Test 3 was executed around 140 m downstream of the collapse. A topographic model was also generated, and numerical modelling was undertaken to develop an understanding of the likely stress field as a result of the overburden and valley side effects. The orientation and magnitude of the in situ stresses from the numerical modelling based on the topography and from the three in situ stress measurements are shown in Figure 13.
Applsci 15 01437 g013
Figure 14. Comparison of rock mass damage between the elastic and plastic liners in the collapse zone for (A) condition after excavation, (B) condition after deterioration, and (C) condition after swelling (using Phase2 Version 7.0 by Rocscience and [50]).
Applsci 15 01437 g014
Figure 15. Loads on the elastic and plastic liners compared to the strength envelop with shotcrete and bolts in the collapse zone for (A) elastic and (B) plastic (using approach presented in [48,49]).
Applsci 15 01437 g015
Table 1. Lesotho mineralogical criteria [25,27,29].
Degradation TypeLaumontite (%)Laumontite: Smectite Ratio *
Sporadic degradation4% to 9% **Between 0.9 and 0.06
Total degradation (but not full collapse)>10% ***>0.9
* Including montmorillonite. ** This mostly occurs in the highly amygdaloidal portions of basalt flows, and these conditions generally fall outside of the laumontite-rich zonation identified to be present on a regional scale. *** Occurring almost exclusively in the highly amygdaloidal portions of basalt flows, and these generally fall within the laumontite-rich zonation identified to be present on a regional scale.
Table 2. Rock mass parameters for the analysis of the fault-damaged zone (FDZ).
ParameterFDZ
UCS (MPa)20
mi19
GSI37
mpeak2.002
speak0.0009
cpeak (MPa)1.23
ϕpeak (°)29.6
Dres0.25
mres1.452
sres0.0005
cres (MPa)1.091
ϕres (°)27.0
Ddeteriorated0.5
mdeteriorated0.946
sdeteriorated0.0002
cdeteriorated (MPa)0.926
ϕdeteriorated (°)23.7
Epeak (GPa)5.8
Epeak (GPa)0.75
Eresidual (GPa)0.53
Edeteriorated (GPa)0.37
Disclaimer/Publisher’s Note: The statements, opinions and data contained in all publications are solely those of the individual author(s) and contributor(s) and not of MDPI and/or the editor(s). MDPI and/or the editor(s) disclaim responsibility for any injury to people or property resulting from any ideas, methods, instructions or products referred to in the content.

