Article

An HPLC and LC-MS Method for Analyzing 2,2′,4,4′,6,6′-Hexanitrostilbene

School of Environment and Safety Engineering, North University of China, Taiyuan 030051, China
*
Authors to whom correspondence should be addressed.
Appl. Sci. 2025, 15(3), 1486; https://doi.org/10.3390/app15031486
Submission received: 7 January 2025 / Revised: 30 January 2025 / Accepted: 30 January 2025 / Published: 31 January 2025

Abstract

:
2,2′,4,4′,6,6′-hexanitrostilbene (HNS) is a heat-resistant, low-sensitivity energetic material with widespread applications in pliable linear-shaped charges, high-temperature-resistant oil well perforating charges, and rocket propellants. However, the presence of highly toxic and mutagenic nitroaromatic compounds in HNS wastewater necessitates efficient and accurate detection methods. Unfortunately, the existing analytical methods for HNS detection are outdated and incompatible with modern equipment. This limits their application due to issues with detection range, accuracy, and cost. To address this gap, an improved method was developed using an Ultimate 3000 UHPLC system with methanol and water as the mobile phase and UV-Vis detection at 271 and 226 nm wavelengths. The results indicate that the optimal detection conditions are achieved with a methanol-to-water ratio of 70:30 and a flow rate of 0.5 mL/min, providing high accuracy and efficiency. Compared to traditional methods, this approach reduced the detection time by nearly 70%, with the shortest analysis time ranging from 6 to 6.5 min, significantly lowering the cost of HNS detection. The method demonstrated excellent linearity (R2 > 0.9999) and high sensitivity within the concentration range of 0.50–150.00 mg/L, with precise and reliable results. This work provides both theoretical insights and experimental validation for the detection and analysis of HNS in wastewater.

1. Introduction

As national development demands have grown, the production and usage of explosives have increased annually, finding widespread applications in sectors such as mining [1], demolition of buildings [2], scientific experiments [3], mountain and road construction [4], oil extraction [5], explosive processing [6], controlled blasting [7], satellite launches, and aerospace projects [8,9]. Over a considerable period, the most commonly used explosives globally have included dinitrotoluene (DNT), trinitrotoluene (TNT), RDX, HMX (cyclotetramethylene tetranitramine), and CL-20 (hexanitrohexaazaisowurtzitane). However, the high sensitivity inherent to these explosives poses significant risks during storage and transport, leading to potentially unpredictable hazards [10,11,12,13,14].
Consequently, attention has shifted towards insensitive energetic materials like 2,2′,4,4′,6,6′-hexanitrostilbene (HNS). In comparison to other high explosives, HNS not only produces high energy but also possesses excellent impact resistance and thermal stability [15], facilitating its extensive application in fields such as oil extraction, aerospace, and space technology [16]. However, during the production and use of HNS, the generation of explosive wastewater is inevitable. This wastewater contains highly toxic and mutagenic nitroaromatic compounds (NACs), and if released untreated, can severely contaminate soil and water systems, posing significant risks to both flora and fauna, as well as human health [17,18,19]. Direct contact with nitroaromatic compounds can even lead to the onset of cancer in humans [20]. Moreover, the detonation of explosives releases toxic chemicals and disperses large fragments of unexploded ordnance into the environment, leading to the contamination of local soil, sediment, and both surface and groundwater with explosive residues that can persist for decades [21,22]. To mitigate these risks, employing high-performance liquid chromatography and mass spectrometry for the qualitative and quantitative analysis of HNS and its degradation products is essential.
However, research on the detection of HNS and its degradation products has been limited, focusing primarily on two methodologies: gas chromatography–mass spectrometry (GC-MS) and liquid chromatography–mass spectrometry (LC-MS) [23]. GC-MS is an analytical method that first utilizes gas chromatography to separate compounds in complex samples, followed by mass spectrometry to identify them. The specific process includes sample vaporization, chromatographic separation, electron impact ionization, mass-to-charge ratio separation, ion detection, and data analysis. Previous GC-MS methods for HNS detection often involved cumbersome sample preparation steps. These steps included extraction, drying under nitrogen flow, and dissolving the residue in dichloromethane, as well as long detection times, sometimes requiring up to 80 min [18]. In contrast, LC-MS simplifies sample preparation, requires smaller sample volumes, and avoids the need for high-temperature (280 °C) vaporization, making it more suitable for HNS detection. LC-MS [24] is an analytical method that employs liquid chromatography to separate compounds in complex liquid samples, followed by mass spectrometry for compound identification. This process includes sample introduction, chromatographic separation, compound ionization, mass spectrometric analysis, ion detection, and data analysis. Recently, Ziya Can et al. [25] utilized high-performance liquid chromatography (HPLC) for the quantitative validation of HNS, detecting HNS concentrations in the range of 2.00–20.00 mg/L. Fabio Garofolo et al. [26] used a Merck-Hitachi L-6200 HPLC (Labscan Ltd., Dublin, Ireland) with standard HNS solutions diluted in acetonitrile, detecting HNS concentrations ranging from 0.04 to 0.64 mg/L. The LC-MS used in this setup employed a Perkin Elmer Sciex API 111 triple quadrupole mass spectrometer equipped with an atmospheric pressure ionization source as the detector for the Merck-Hitachi L-6200 system.
The current methods for the liquid chromatographic detection of HNS predominantly utilize single-wavelength detection. These methods have long detection times of 20 min, typically generate numerous extraneous peaks, and primarily employ acetonitrile (ACN) as the mobile phase, which is more costly compared to methanol (MeOH). Additionally, the standard solutions of HNS are prepared using acetonitrile as the diluent instead of ultrapure water, which results in relatively higher costs associated with the detection and analysis of HNS. The overall expenses for analyzing HNS are consequently high, making these methods unsuitable for measuring HNS concentrations from 0.64 to 2.00 mg/L and above 20.00 mg/L. The Merck-Hitachi L-6200 high-performance liquid chromatograph, an older model, has been replaced by newer versions such as the Ultimate 3000 HPLC System (Shanghai Si instrument Biochemical Technology Co., Ltd. Shanghai, China). Modern HPLC systems typically offer greater sensitivity, separation efficiency, and automation capabilities. However, the LC-MS methods described earlier do not fully align with the rapid advancements in current instrumental technologies. Therefore, there is an urgent need to develop an efficient, precise, and cost-effective liquid chromatography–mass spectrometry method for HNS detection.
In this study, a controlled variable method was employed to develop a rapid, simple, sensitive, accurate, and economical LC-MS analytical method for the qualitative and quantitative detection of HNS, aiming to address the high costs, low efficiency, and limited detection range associated with existing methods. This research was divided into three main parts. Firstly, the solvent and extraction agent for HNS were identified through full-wavelength UV scanning. Additionally, the optimal wavelength for HNS detection was determined using a high-performance liquid chromatography ultraviolet spectrophotometer. Secondly, the conditions for HNS detection such as mobile phase, flow rate, column temperature, injection volume, and detection time were sequentially determined using the controlled variable method. Finally, by integrating experimental results with prior LC-MS conditions, the optimal HPLC conditions for the Ultimate 3000 HPLC System were established. Additionally, specific mass spectrometry conditions were defined, suitable for the widely used electrospray ionization quadrupole electrostatic field orbitrap high-resolution mass spectrometry (ESI-Q Orbitrap HRMS) to detect HNS and its products. The feasibility of these conditions was validated through testing HNS degradation samples.

2. Experiment

2.1. Materials and Methods

HNS exhibits low aqueous solubility, approximately 47.9 mg/L [27]. However, HNS is soluble in several organic solvents, such as dimethylformamide (DMF), acetonitrile (ACN), N-methyl-2-pyrrolidone (NMP), dimethyl sulfoxide (DMSO), and 1,4-butyrolactone (GBL) [28]. Therefore, DMF and ACN were selected as co-solvents to prepare simulated HNS wastewater solutions. Equal masses of HNS were separately dissolved in identical volumes of DMF and ACN. Experiments revealed that HNS dissolves more rapidly in DMF under ultrasonication in an ultrasonic cleaning machine. The solutions of HNS were subjected to full-wavelength scanning using a UV–visible spectrophotometer to select the optimal co-solvent for dissolving HNS. The selected organic solvent was first used to prepare the HNS solution, which was then uniformly dispersed in ultrapure water to create the simulated wastewater. Details of the reagents and instruments used during the experimental process are provided in Table 1 and Table 2.

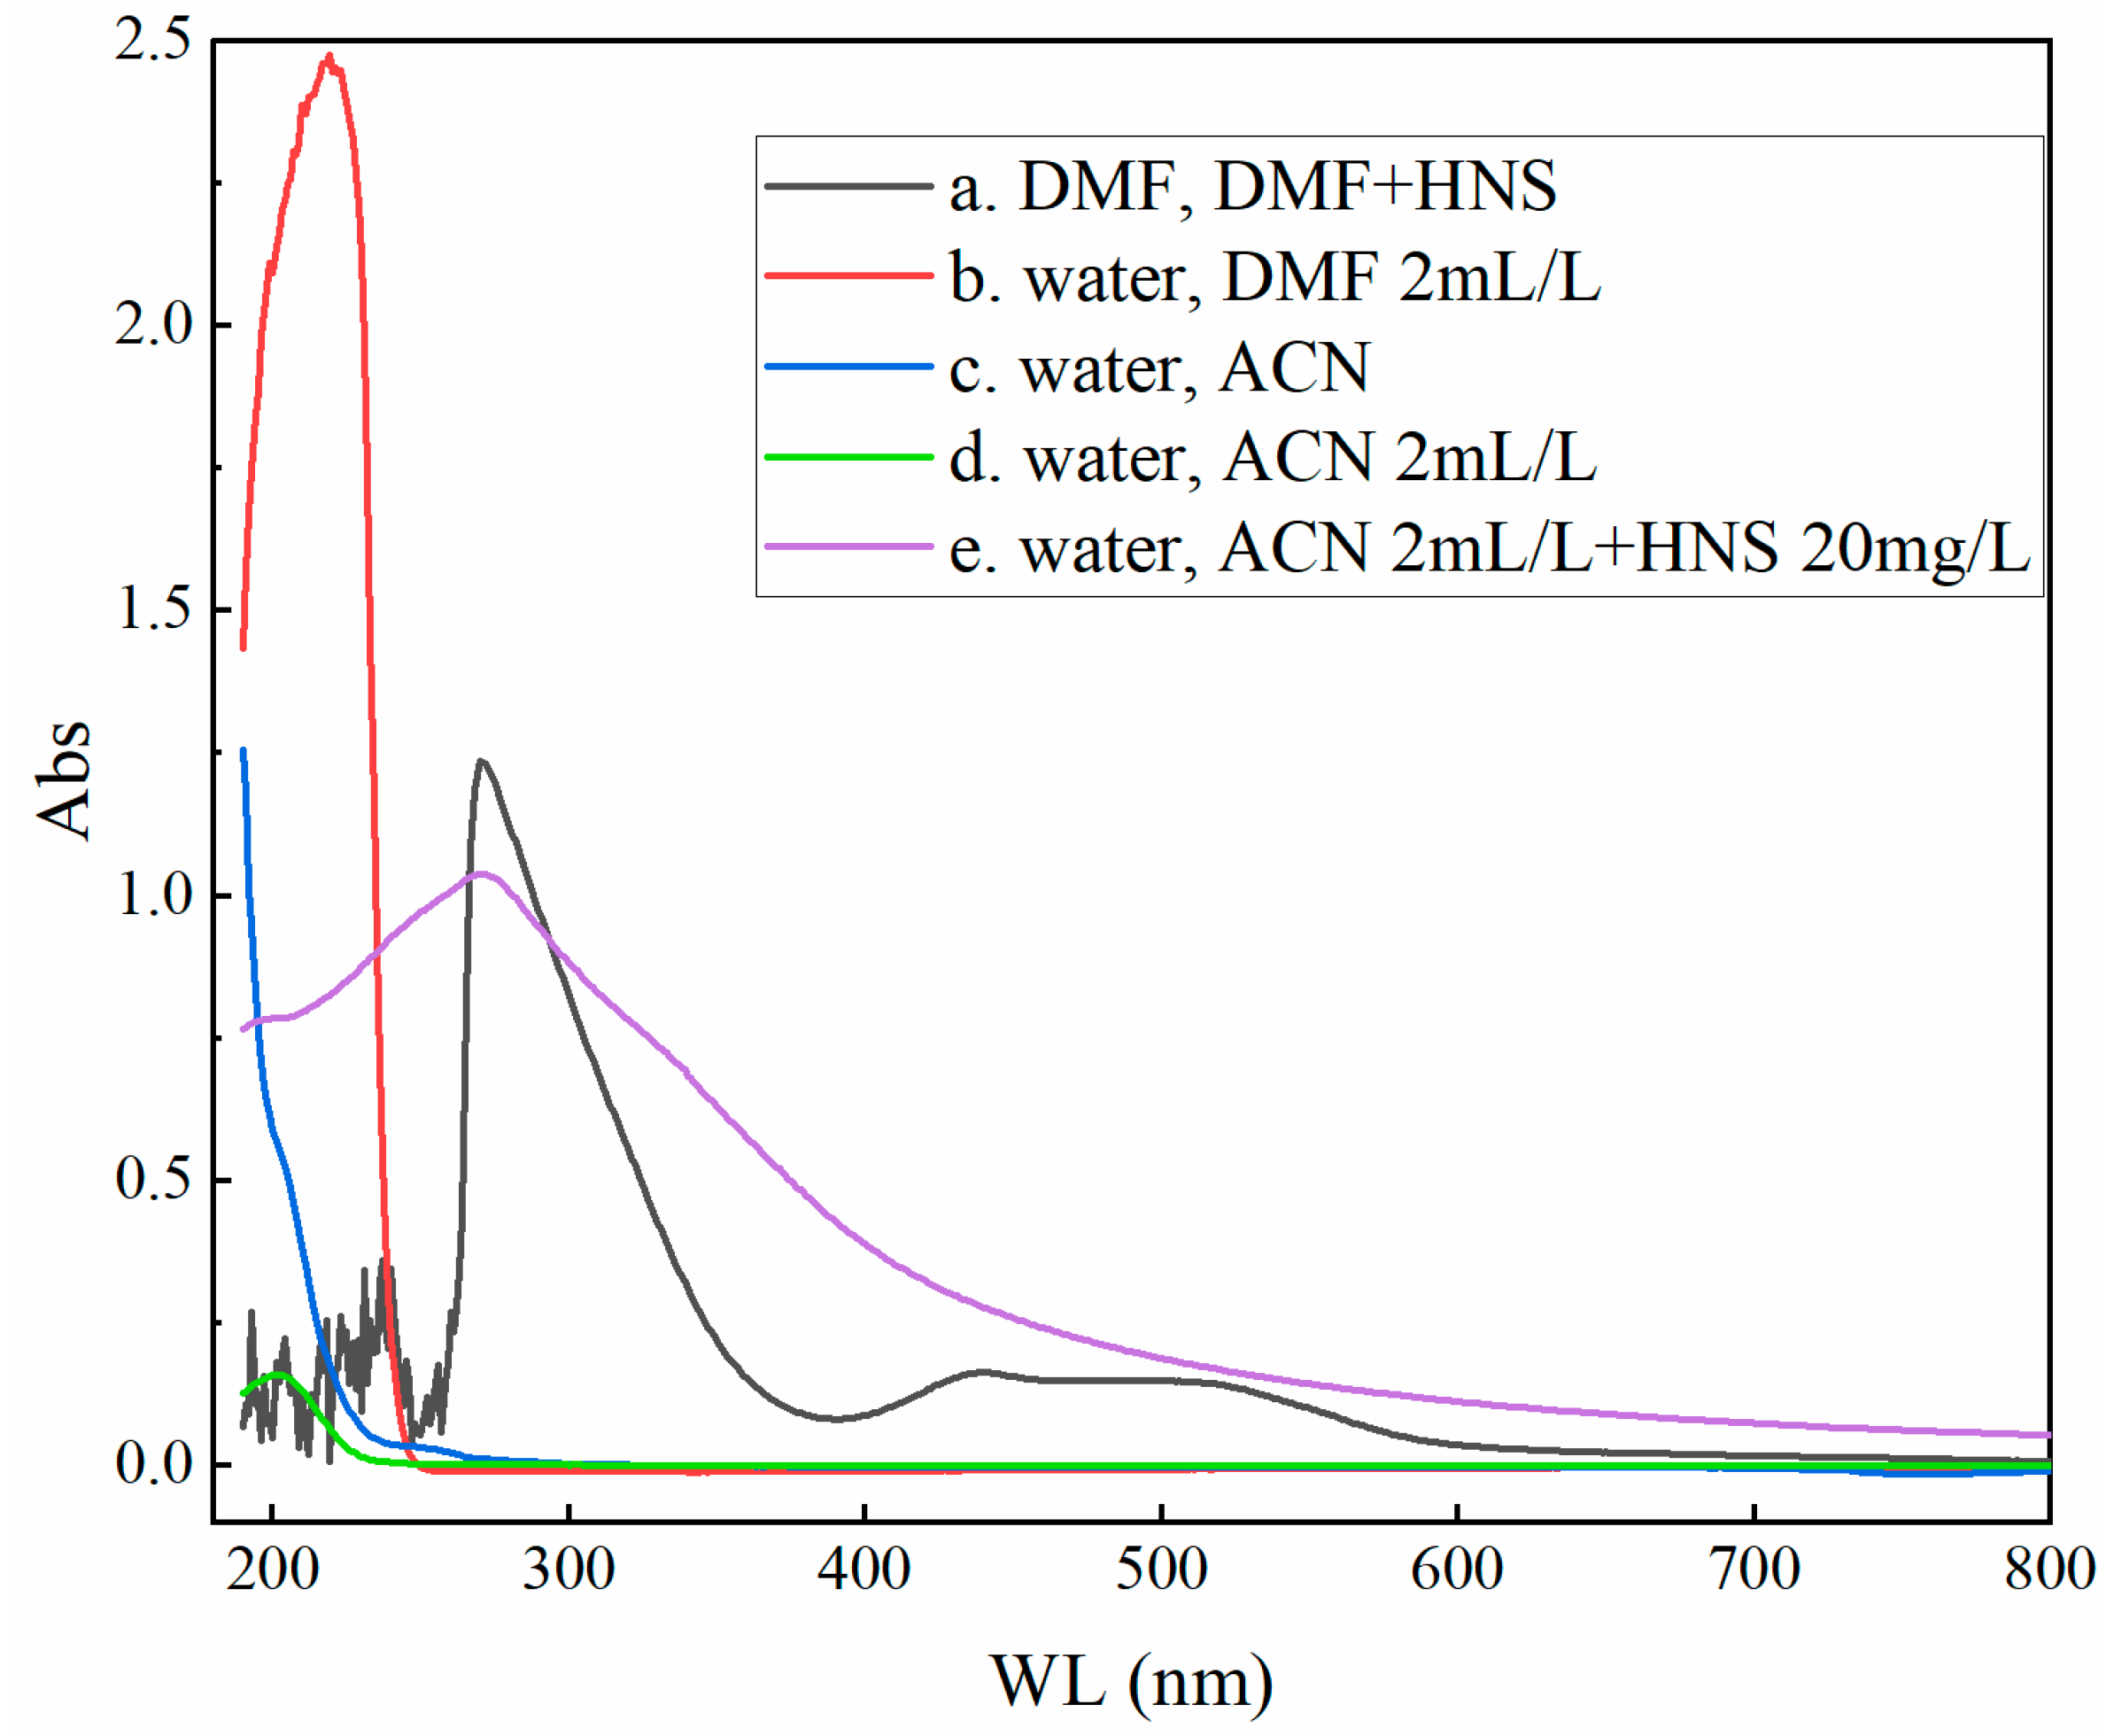
2.2. UV Full-Wavelength Analysis

First, a UV–visible spectrophotometer was used to perform full-wavelength scanning on the HNS solution series to identify the optimal wavelength for HPLC detection, as well as the best co-solvents and extractants for HNS. The specific steps are as follows:
To explore the most suitable organic solvents and detection wavelengths for HNS, seven 50 mL colorimeter tubes were used: colorimeter tube 1 contained ultrapure water, colorimeter tube 2 contained DMF, and colorimeter tube 3 contained ACN. Organic solutions of HNS in DMF and ACN were prepared in colorimeter tubes 4 (DMF + HNS) and 5 (ACN + HNS), along with two types of simulated HNS explosive wastewater in tubes 6 (DMF + HNS+ ultrapure water) and 7 (ACN + HNS+ ultrapure water). Together with the initial three tubes, these were labeled as samples 1 through 7. Baseline corrections were performed using samples 1, 2, and 3. Subsequent full-wavelength scans were conducted on samples 2 through 7 using a UV–visible spectrophotometer, with the samples placed in 10 mm quartz cuvettes. Figure 1 presents partial results of these scans, denoting experimental conditions with labels such as ‘baseline, scanned sample’. For example, Curve a shows the scan of sample 4 (DMF + HNS) with sample 2 (DMF) as the baseline.
Using water as a baseline, full-wavelength scans of ACN were conducted, as shown in Curves c and d in Figure 1. Both ACN and its aqueous solution exhibited significant changes in absorbance at wavelengths below 260 nm. Similarly, using water as a baseline, the full-wavelength scans of dimethylformamide (DMF) and its aqueous solution showed similar results. To better represent real water samples, the DMF aqueous solution was selected for depiction in Curve b of Figure 1. This indicates that the absorbance of DMF is particularly high at wavelengths below 260 nm. Therefore, it is advisable to select a detection wavelength for HNS that is greater than 260 nm to minimize interference from the organic solvents. A full-wavelength UV scan of DMF + HNS was performed using DMF as the baseline, resulting in Curve a. This scan revealed a peak in absorbance at 271 nm. Consequently, this study selected DMF as the co-solvent. Furthermore, as depicted in Curve e of Figure 1, ACN is effective in extracting HNS from aqueous solutions, making ACN the preferred extraction solvent.
As depicted in Figure 1, ultrapure water and pure solvents were used as baselines for scanning detection of simulated explosive wastewater. The absorbance peaks were observed around 271 nm. At this wavelength, the interference from the solvent on the explosives detection results is significantly reduced. Therefore, this study selected the ultraviolet channel of high-performance liquid chromatography at 226 nm and 271 nm to establish standard curves for DMF and HNS, respectively.

3. Results and Discussion

3.1. HPLC Detection of HNS

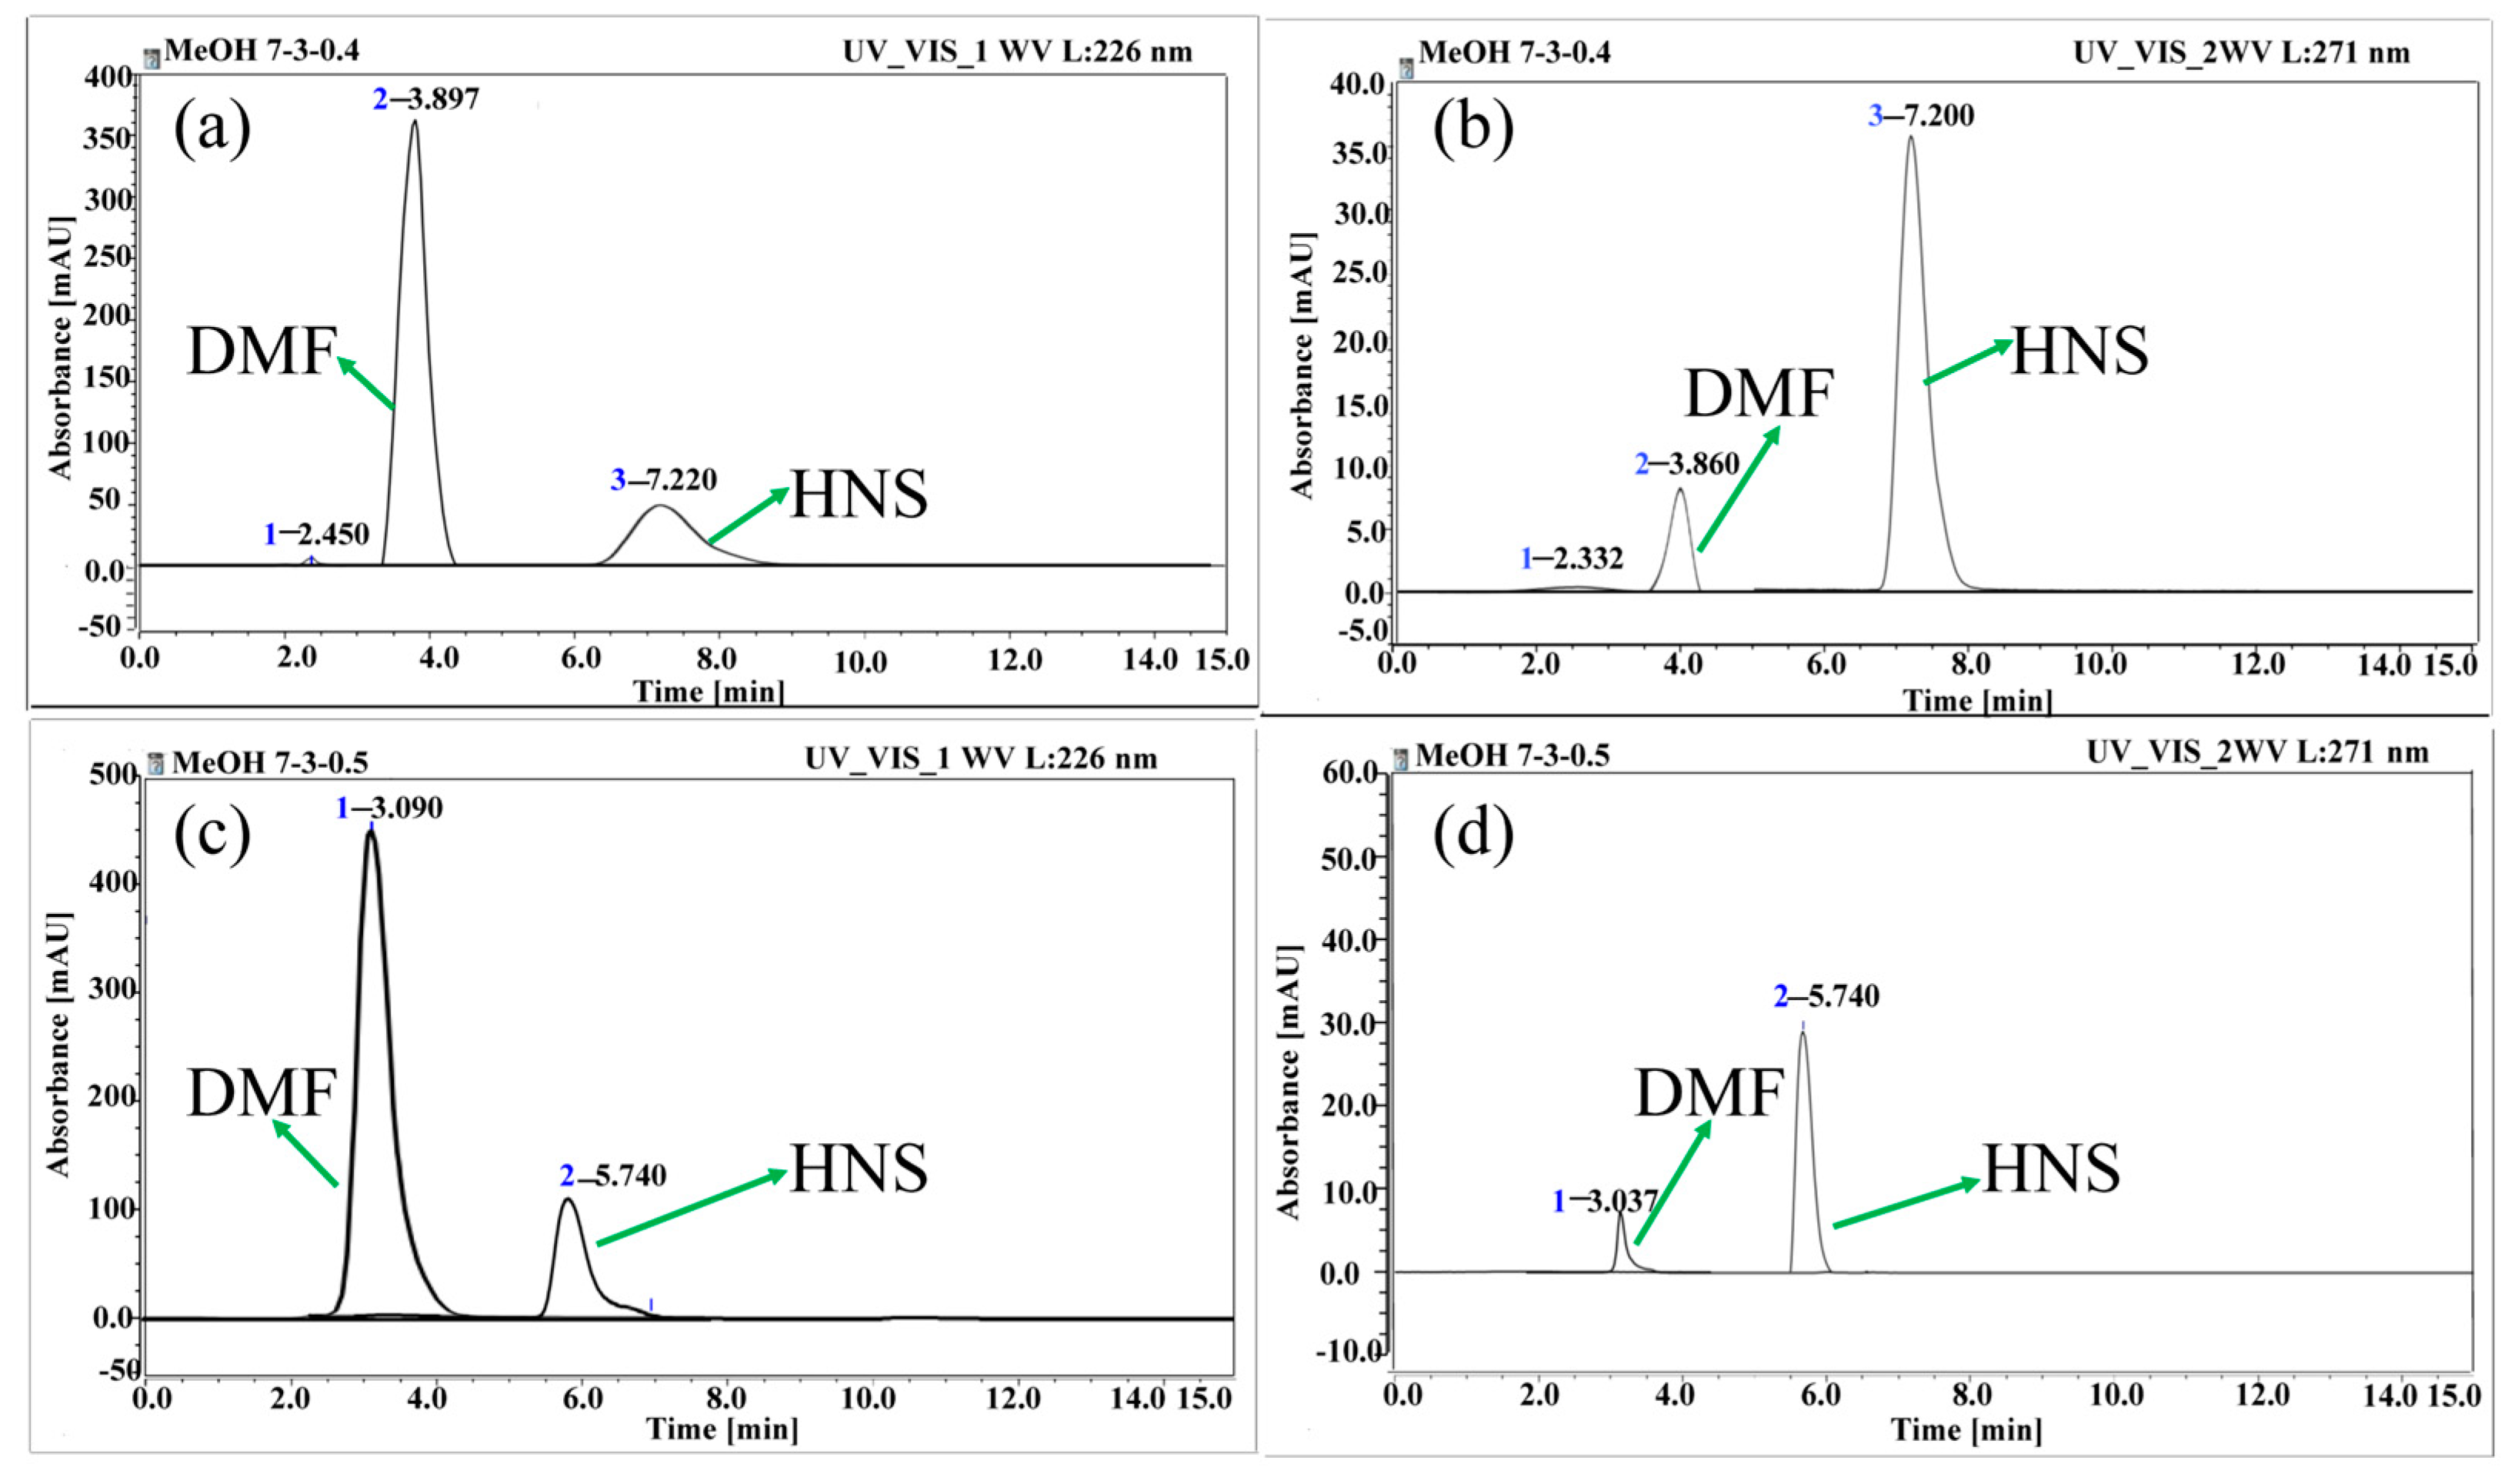
3.1.1. Determination of the Mobile Phase

In exploring the detection methods for HNS, this study utilized the ultraviolet channels of high-performance liquid chromatography at 226 nm and 271 nm. Mixed mobile phases of methanol (MeOH) and water, as well as acetonitrile (ACN) and water, were employed to separately identify and analyze simulated wastewater containing HNS explosives. It was assumed that the flow rate of the mobile phase was 1 mL/min, the column temperature was maintained at room temperature of 25 °C, the injection volume was 20 μL, and the duration of sample testing was set at 10 min. For both mixed mobile phases (MeOH and water, ACN and water), the volume fractions of MeOH and ACN were adjusted to 50%, 60%, 70%, 80%, and 90%. Selected optimal chromatograms are displayed in Figure 2 (chromatograms of other mixed mobile phases were similar). In the ACN and water mixed mobile phases, the best chromatographic results were obtained with an ACN volume fraction of 60%. Under the dual detection wavelengths, the retention times for DMF and HNS were relatively close. The retention time for HNS was notably longer, as shown in Figure 2a,b. This delay prolonged the detection time for HNS and increased the cost of detection. In the MeOH and water mixed mobile phases, the comprehensive performance was best at a MeOH volume fraction of 70%, with the next best at 80%. To compare with the chromatogram at an ACN volume fraction of 60%, the chromatogram at a MeOH volume fraction of 60% is presented in Figure 2c,d. Under the dual detection wavelengths, it was observed that at the main wavelength of 271 nm, the peak shape deteriorated, and the HNS retention time was extended, leading to increased detection costs. The detection was most effective at a MeOH volume fraction of 70%, with the chromatogram shown in Figure 2e,f exhibiting the best peak shape and moderate retention times for HNS, with minimal interference between the peaks. The performance at a MeOH volume fraction of 80% was inferior. Despite shorter HNS retention times, the retention times for DMF and HNS were close. Consequently, a MeOH volume fraction of 70% and an ultrapure water volume of 30% were chosen for subsequent experiments.

3.1.2. Determination of Flow Velocity

The column temperature was set to an ambient room temperature of 25 °C, with an injection volume of 20 µL. To minimize interference from impurity peaks on the main peak, the sample testing duration was adjusted to 15 min. The mobile phase consisted of a methanol (MeOH) volume fraction of 70% and an ultrapure water volume fraction of 30%. The mobile phase flow rates were tested at 0.4 mL/min, 0.6 mL/min, 0.8 mL/min, and 1.0 mL/min. The results indicated that overall performance, including peak shape, peak broadening, and retention time, was better at flow rates of 0.4 mL/min and 0.6 mL/min. Therefore, additional experiments were conducted at a flow rate of 0.5 mL/min, which revealed minimal differences between 0.5 mL/min and 0.6 mL/min. Optimal results are shown in Figure 3; chromatograms at other flow rates were similar. Compared to the results at a flow rate of 0.4 mL/min shown in Figure 3a,b, the outcomes at 0.5 mL/min presented in Figure 3c,d were notable. They showed shorter retention times for HNS and appropriate spacing between the DMF and HNS peaks. Predominantly, the chromatograms displayed only DMF and HNS peaks under dual-wavelength detection, with no impurity peaks.

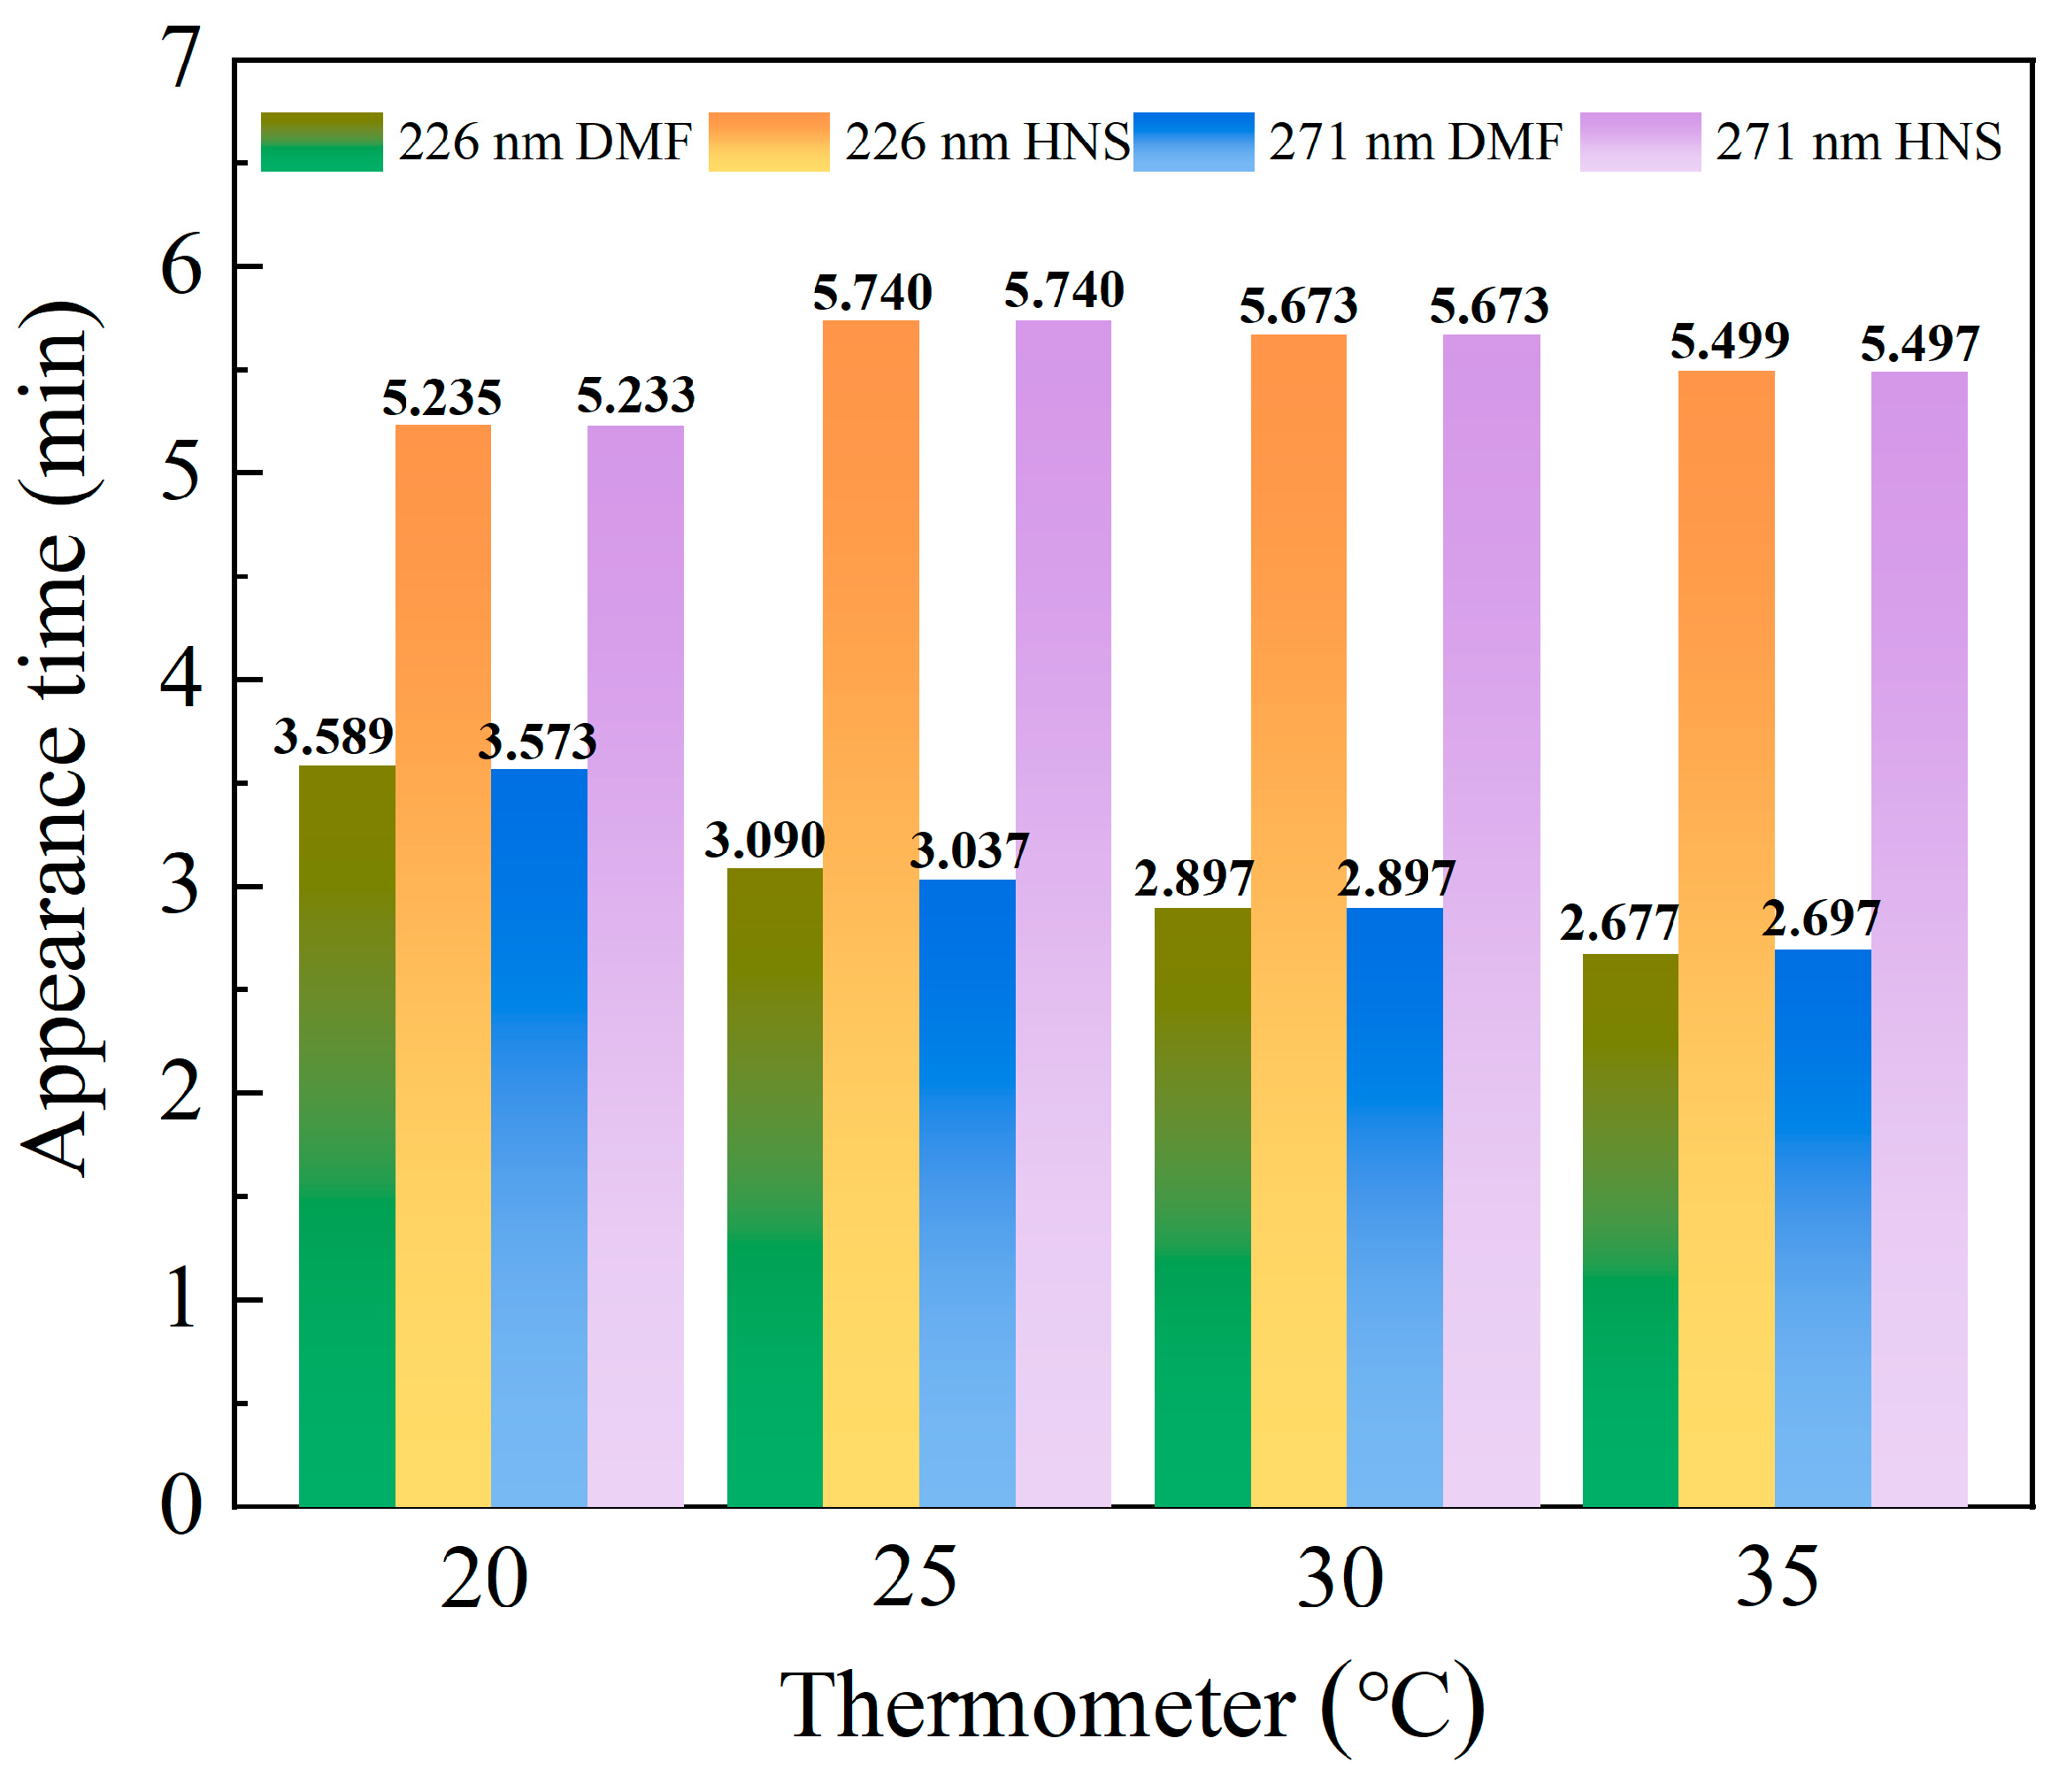
3.1.3. Determination of Column Temperature

We assumed an injection volume of 20 μL and a retention time of 15 min. The mobile phase was set to a volume fraction of 70% MeOH and 30% ultrapure water, with a flow rate of 0.5 mL/min. Column temperatures were tested at 20 °C, 25 °C, 30 °C, and 35 °C. As shown in Figure 4, at a column temperature of 30 °C, the retention times for DMF and HNS, as well as the interval between these peaks, were found to be optimal. Additionally, under dual-wavelength detection, stability was highest at this temperature.

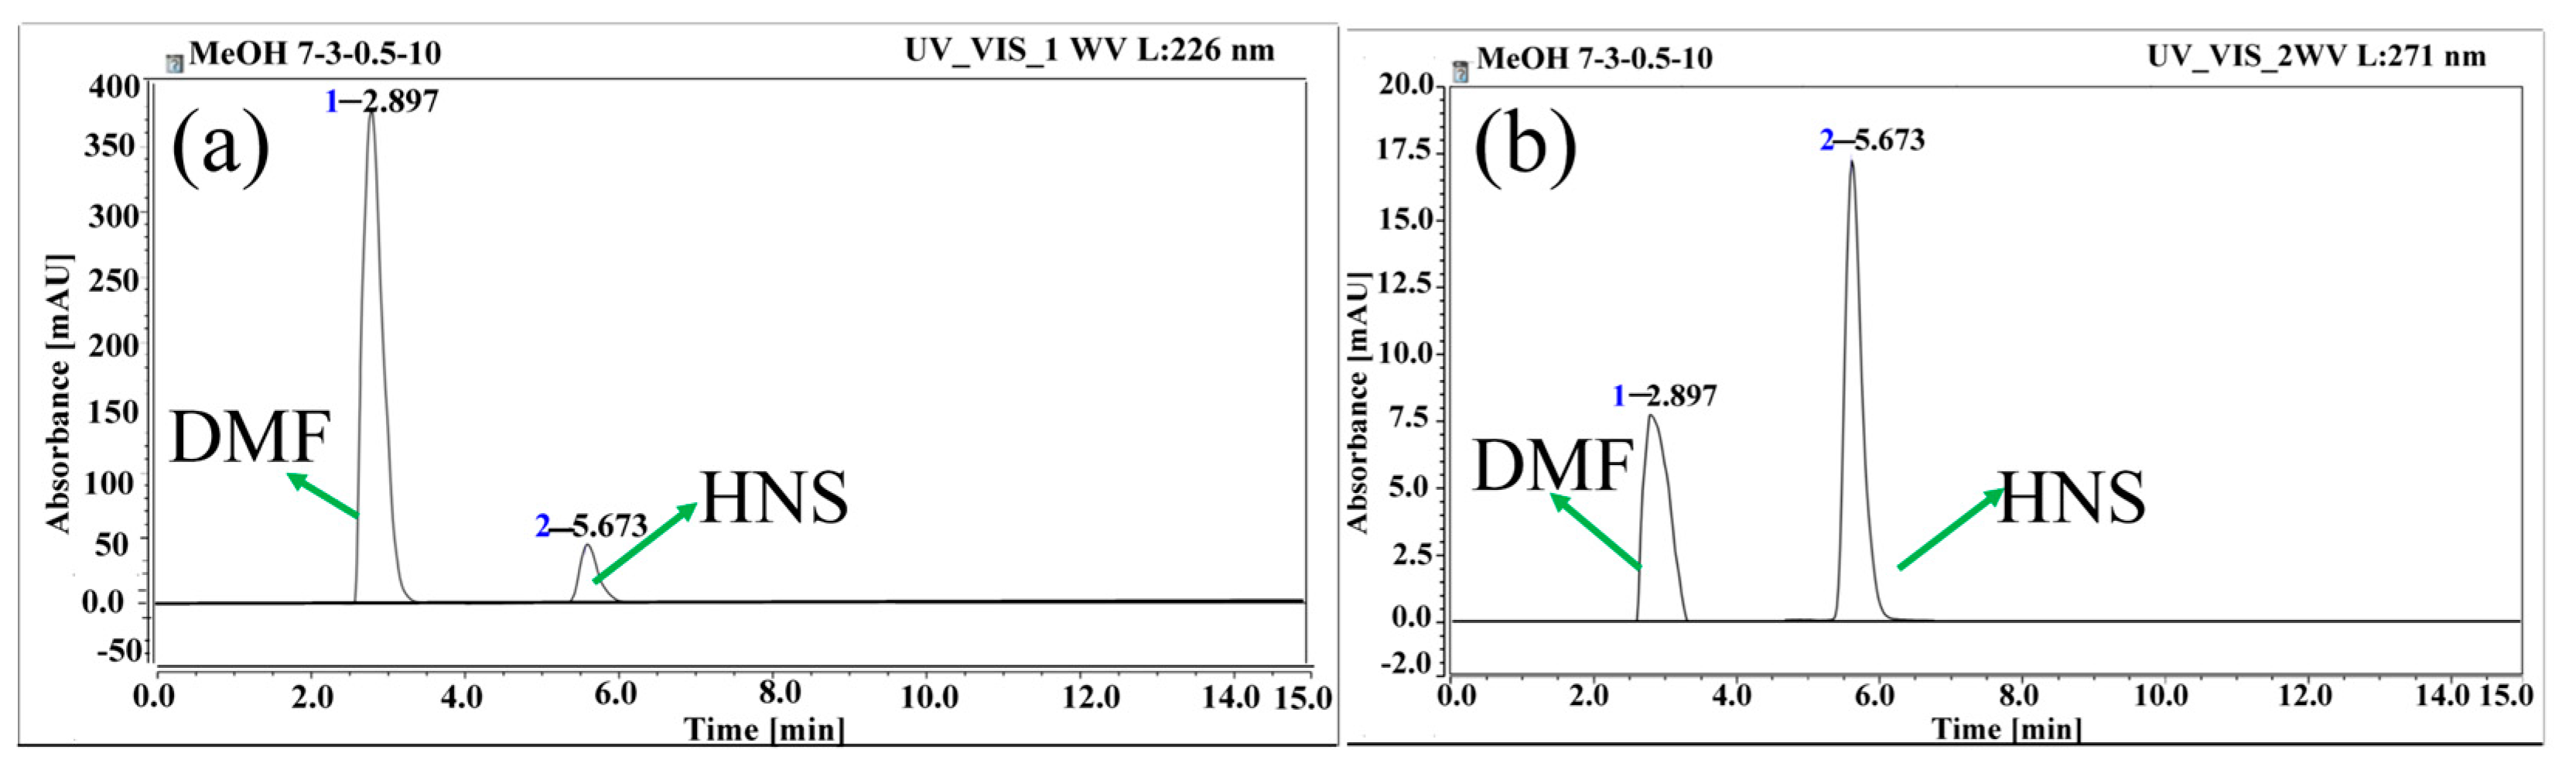
3.1.4. Determination of Sample Volume

We assumed a retention time of 15 min. The mobile phase consisted of a 70% MeOH volume fraction and 30% ultrapure water, with a flow rate of 0.5 mL/min. The column temperature was set at 30 °C, and we tested injection volumes of 5 μL, 10 μL, 15 μL, 20 μL, and 25 μL. As shown in Figure 5, chromatograms for other injection volumes were similar. Experimental results indicated that an injection volume of 10 μL provided consistent retention times for DMF and HNS under dual-wavelength detection. This volume also exhibited good peak shape and reproducibility, and lacked extraneous peaks. Using this volume, we adjusted the analysis time to 6.5 min. This adjustment did not interfere with subsequent analyses and reduced the detection time for HNS by nearly 70%, significantly lowering the cost of analysis. The performance with an injection volume of 15 μL was similar to that with 10 μL. However, reducing the injection volume extends the lifespan of the chromatographic column. To better protect the column, we ultimately selected an injection volume of 10 μL.
The optimal conditions for detecting HNS using high-performance liquid chromatography were determined through a series of experiments, as presented in Table 3.

3.2. Validation of the HPLC Analytical Method Performance

3.2.1. Sensitivity and Linearity of the Test Method

Preparation of HNS Simulated Wastewater at Different Concentration Gradients: Accurately weigh 50 mg of HNS drug and dissolve it in 10 mL of DMF under ultrasonic conditions to obtain what will be labeled as Sample 1. A 2 mL aliquot of Sample 1 was diluted to 25 mL with ultrapure water to prepare Sample 2. Similarly, a 2 mL aliquot of DMF organic solvent was diluted to 25 mL with ultrapure water to obtain Sample 3. Under the HPLC conditions described in Section 3.1, test these varying concentrations of HNS standard solutions in triplicate. To minimize interference, samples should be injected in sequence from lowest to highest concentration. Record the peak areas from each injection, calculate the average, and use this average as the vertical axis for plotting. Plot the mass concentrations (mg/L) of each standard on the abscissa to perform linear regression and establish a calibration curve. Further, a 150.00 mg/L HNS standard solution was diluted with ultrapure water until the response value reached three times the instrument’s baseline noise. This established a signal-to-noise ratio (S/N) of 3 as the detection limit. When the S/N ratio reaches ten times the baseline noise (S/N = 10), the quantitation limit is established. Stepwise dilution reveals that at an HNS concentration of 0.10 mg/L, the S/N ratio is 3, and at 0.40 mg/L, the S/N ratio is 10. Therefore, twelve concentrations of HNS were prepared: 0.10, 0.50, 2.00, 5.00, 10.00, 15.00, 20.00, 25.00, 30.00, 60.00, 90.00, and 150.00 mg/L. For each concentration, three replicates were prepared, totaling 36 samples to establish the calibration curve. Six samples, labeled sample 4 through sample 9 (0.50, 1.00, 20.00, 30.00, 60.00, 150.00 mg/L), were prepared as detailed in Table 4. The corresponding volumes of sample 1, sample 2, and sample 3 were placed in test tubes and diluted with ultrapure water to a final volume of 50 mL in colorimetric tubes. This process prepared a series of HNS standard solutions at concentrations of 0.50, 1.00, 20.00, 30.00, 60.00, and 150.00 mg/L.
To achieve more accurate detection, HNS needs to be extracted from the aqueous solution for testing. As shown by Curve e in Figure 1, ACN demonstrates superior performance in extracting HNS from the aqueous solution, and thus ACN was selected as the extractant. To prepare the HPLC samples, HNS standard solution was mixed with acetonitrile in volume ratios of 1:0.5, 1:1, 1:1.5, 1:2, 1:2.5, and 1:3. Each mixture was shaken thoroughly and then filtered through a 0.22 µm organic nylon 66 filter membrane into a brown chromatographic vial. Investigation revealed that a volume ratio of 1:2 or higher between the HNS standard solution or the wastewater to be tested and acetonitrile significantly enhanced the detection accuracy. For cost-effectiveness, a 1:2 volume ratio of HNS standard solution to acetonitrile was employed for sample preparation. The means of the peak areas obtained from the detection were linearly fitted against the corresponding HNS concentrations to construct a standard calibration curve for HNS detection. The established standard calibration curve correlating the HNS concentration with peak area is shown in Figure 6a. The equation for the curve is provided below:
y = 2.4665x + 0.0567
where x represents the peak area of HNS measured during detection, y denotes the corresponding HNS concentration in mg/L, and the linear fit achieved an R2 value of 0.9999.
The calibration curve for DMF was determined using methods similar to those aforementioned. With all other conditions held constant, the detection wavelength was set at 226 nm. A standard calibration curve was established from seven data points, correlating the concentration of DMF with the corresponding peak areas, as shown in Figure 6b. The equation for the curve is provided below:
y = 0.0783x + 2.7751
where x represents the peak area of DMF measured during detection, y denotes the corresponding DMF concentration in mL/L, and the linear fit achieved an R2 value of 0.9999.
In the selected concentration range, the mass concentrations of all target analytes exhibited a good linear relationship with the peak areas. The linear fit R2 values for both HNS and DMF reached 0.9999, indicating that the method provides a robust linear response when HNS concentrations range from 0.50 to 150.00 mg/L. The detection and quantification limits, at 0.10 mg/L and 0.40 mg/L, respectively, were relatively low, demonstrating the method’s high sensitivity and its compliance with analytical testing requirements.

3.2.2. Accuracy of the Test Method

Under the high-performance liquid chromatography conditions described in Section 3.1, spike recovery experiments were conducted by comparing measured concentrations with known standard concentrations. Recovery rates were calculated as shown in Equation (3) to assess the accuracy of the test conditions. Tests were typically performed at different addition levels (80%, 100%, and 120% of the analyte content in the sample), with each level sampled in triplicate. The average recovery rates were calculated using the external standard method. According to the data in Table 5, the recovery rates for HNS ranged from 99.78% to 100.35%, with average recovery rates between 99.93% and 100.17%, indicating that the method is highly accurate.
Recovery   Rate = ( Measured   Concentration     Baseline   Concentration Spiked   Concentration ) × 100 %
where Measured Concentration is the concentration of the analyte found in the sample after spiking; Baseline Concentration is the concentration of the analyte present in the sample before spiking; and Spiked Concentration is the known amount of analyte added to the sample.

3.2.3. Precision of the Test Method

Under the conditions of high-performance liquid chromatography described in Section 3.1, we analyzed HNS at concentrations of 10, 20, and 30 mg/L, and measured the peak areas. Concentrations were calculated using Equation (1). Standard deviation (SD) and relative standard deviation (RSD) were calculated according to Equations (4) and (5), respectively. RSD was used to assess the intra-day and inter-day precision of the method. We conducted six replicate analyses of HNS at each concentration on the same day and repeated these experiments over three consecutive days. As shown in Table 6, the intra-day RSDs for all concentrations did not exceed 1.1%, and the inter-day RSDs did not exceed 1.2%. These results indicate that the method provides good precision.
S D = i = 1 n ( x i x ¯ ) 2 n 1
where x i is each individual measurement; x ¯ is the mean of the measurements; n is the number of measurements.
R S D = SD x ¯ × 100 %
where x ¯ is the mean of the measurements.

3.2.4. Repeatability and Stability of the Test Method

The reproducibility of the method was assessed by evaluating the intra-day relative standard deviation (RSD) at 20.00 mg/L of HNS, as detailed in Table 6. Analyses were conducted under the high-performance liquid chromatography conditions described in Section 3.1 with HNS at a concentration of 20.00 mg/L. Samples were analyzed at various times—0, 2.0, 4.0, 6.0, 8.0, and 24 h—to evaluate the method’s stability. As presented in Table 6 and Table 7, the RSD values for all measurements consistently remained below 1%. These results demonstrate that the analysis method exhibits excellent reproducibility and stability.

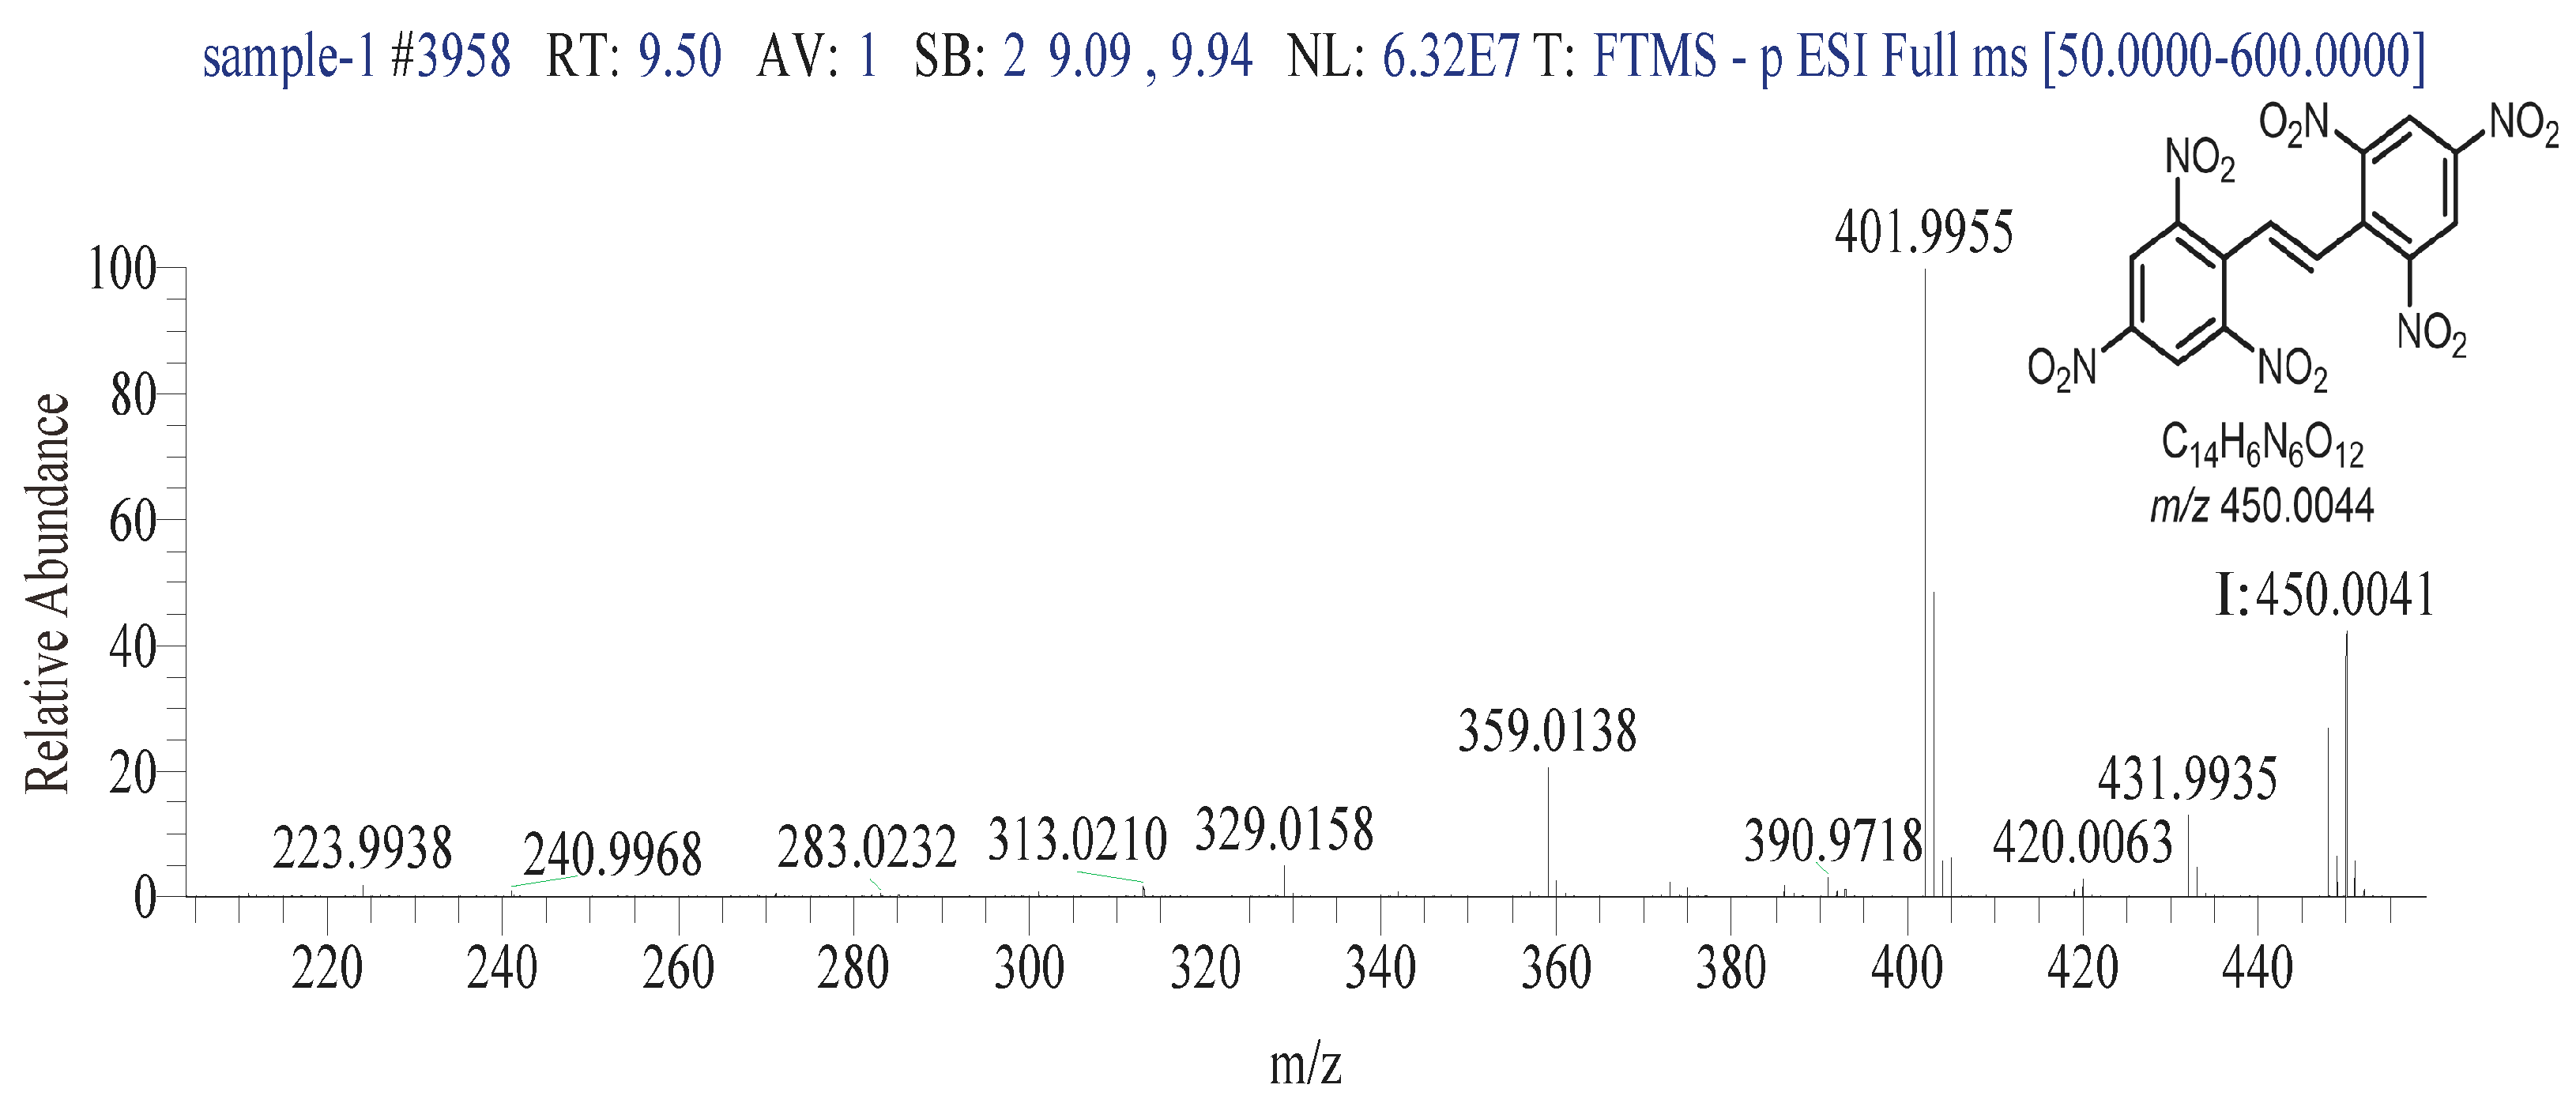
3.2.5. Liquid Chromatography–Mass Spectrometry Analysis Conditions

Ueli Ochsenbein et al. [29] employed liquid chromatography–electrospray tandem mass spectrometry to detect trace amounts of explosives (such as TNT and its diamino metabolites, HMX, RDX, etc.) in lake water and tributaries. Electrospray ionization was applied to the diamino metabolites of TNT, and the negative ion mode was used for all explosive compounds. David DeTata et al. utilized an optimized liquid chromatography quadrupole time-of-flight tandem mass spectrometry (LC-QToF-MS) protocol to detect various organic explosives and propellants (TNT, DNT, NT, and PETN), with ionization occurring simultaneously in both positive and negative ion modes [30]. In the negative ion mode, most nitro-containing substances were observed as molecular ions [M] or deprotonated molecular ions [M-H]. Rachel C. Irlam et al. used dual-sorbent solid-phase extraction coupled with liquid chromatography–high-resolution accurate mass spectrometry to determine 14 types of organic explosives, including HMX, RDX, NB, TNT, TATP, and TATB [31].
Based on previously established optimal conditions for HPLC and by referencing operational procedures and experiments from the literature [26,29,30,31], the detection of the organic compound HNS and its major degradation products in wastewater was conducted using LC-MS.
In this investigation, the research group utilized hydrodynamic cavitation (HC) technology combined with chlorine dioxide oxidation for the degradation of HNS. Wastewater samples for analysis were collected at the start (0 min) and end (180 min) of the reaction process. To verify the feasibility of the HPLC conditions, a gradient elution system using an ammonium acetate solution and acetonitrile in a 45:55 ratio, with a flow rate of 0.5 mL/min, was employed. The mass spectrometry conditions were set to the electrospray negative ion mode. The detection parameters for the HPLC-MS are listed in Table 8, and the results are presented in Figure 7 and Figure 8.
The total ion chromatograms at 0 min and 180 min were analyzed by integrating HPLC and mass spectrometry (MS), as depicted in Figure 7. Peak I, representing the initial substrate HNS, exhibited a decrease in peak area as the reaction progressed, indicating the degradation of HNS. The analytical conditions of this method were suitable for the detection of HNS via high-performance liquid chromatography. Figure 8 presents the mass spectrum of HNS, detected from Peak I. In ESI-MS, HNS ionizes to form a radical anion molecular ion peak [M] at m/z 450, which generally agrees with previous detections of HNS where a radical anion molecular ion peak [M] was observed at m/z 449 [26]. This confirms that the established LC-MS method is applicable for the qualitative analysis of HNS and its degradation products.

4. Conclusions

The existing HNS LC-MS detection methods exhibit several limitations:
The conditions for the detection of HNS using high-performance liquid chromatography (HPLC) are not detailed. Detection typically employs a single wavelength, and numerous subsidiary peaks are present. The detection range is limited; accurate measurements are only possible for HNS concentrations between 0.04–0.64 mg/L and 2.00–20.00 mg/L. This range fails to accommodate concentrations of 0.64–2.00 mg/L and those exceeding 20.00 mg/L. The mobile phase for HPLC detection of HNS predominantly consists of acetonitrile (ACN). Additionally, some methods even require the dilution of HNS standard solutions with acetonitrile instead of ultrapure water. The detection process takes 20 min, undoubtedly increasing the cost of analysis.
To address the aforementioned deficiencies, this study established a rapid, simple, sensitive, accurate, and cost-effective method for the qualitative and quantitative analysis of HNS using LC-MS. The analysis was conducted using an Ultimate3000 UHPLC system, utilizing an ACCUCORE C30, 2.6 µm, 150 × 4.6 mm chromatography column, and detection was performed by a UV–visible detector. The optimal test conditions for HNS analysis were established, including detection wavelength, mobile phase, flow rate, column temperature, and injection volume:
The mobile phase consisted of methanol:ultrapure water at a 70:30 ratio, with a flow rate of 0.5 mL/min, a column temperature of 30 °C, and an injection volume of 10 µL. Dual-wavelength detection was employed, using 271 nm as the primary testing wavelength and 226 nm as a secondary wavelength, resulting in chromatograms free of extraneous peaks. HNS exhibited a good linear relationship within the concentration range of 0.50–150.00 mg/L, with a linear fit (R2) greater than 0.9999. An examination of the method’s linearity and precision confirmed its effectiveness, accuracy, simplicity, high sensitivity, and reliable results. The mobile phase used for HPLC detection of HNS predominantly consisted of MeOH. HNS standard solutions could be diluted with ultrapure water. The analysis could be completed in as little as 6–6.5 min, reducing the detection time by nearly 70%, significantly lowering the cost of HNS analysis while maintaining excellent stability and reproducibility. The choice of mobile phase and the reduced retention time also made the HNS detection process more economical and environmentally friendly.
Based on the established high-performance liquid chromatography (HPLC) conditions for HNS and methodologies from previous studies, the detection conditions for electrospray ionization quadrupole static orbitrap high-resolution mass spectrometry (ESI-Q Orbitrap HRMS) were determined. The LC-MS parameters are suitable for analyzing HNS products and their wastewater within a concentration range of 0.50 to 150.00 mg/L, meeting the needs for practical sample analysis.

Author Contributions

Conceptualization, M.J. and R.J.; methodology, M.J. and J.G.; software, Y.Q.; validation, M.J., R.J. and J.G.; formal analysis, Y.Q.; investigation, J.L.; resources, Z.H. and Y.J.; data curation, Y.J. and Z.L.; writing—original draft preparation, M.J.; writing—review and editing, Y.Q., R.J. and J.L.; visualization, Z.H. and Z.L.; supervision, R.J. and Y.Q.; project administration, Y.Q.; funding acquisition, Y.Q. All authors have read and agreed to the published version of the manuscript.

Funding

This research was funded by the National Key R&D Program of China (Grant No. 2023YFC3206400).

Institutional Review Board Statement

Not applicable.

Informed Consent Statement

Not applicable.

Data Availability Statement

The data that support the findings of this study are available from the corresponding author upon reasonable request.

Acknowledgments

The authors would like to thank the reviewers and editors for their valuable comments.

Conflicts of Interest

The authors declare no conflicts of interest.

References

  1. Cheng, B.; Wang, Q.; Wang, H.; Zong, Q.; Gao, P.-J. Research on the mechanism and application of wedge cutting blasting with hole-inner delay. Sci. Rep. 2024, 14, 11383. [Google Scholar] [CrossRef]
  2. Oliveira, T.A.B.D.; Silva, G.D.; Mattos, E.D.C. Trends and prospects in the use of energetic materials: A comprehensive analysis of cyclotrimethylenetrinitramine, cyclotetramethylene-tetranitramine, and hexanitrohexaazaisowurtzitane. J. Aerosp. Technol. Manag. 2024, 16, 1326. [Google Scholar] [CrossRef]
  3. Sueska, M. Application of Explosive Equivalency Approach in Blast-Induced Seismic Effect Prediction Using EXPLO5 Thermochemical Code. Appl. Sci. 2024, 14, 7408. [Google Scholar] [CrossRef]
  4. Jiang, N.; Zhu, B.; Yao, Y.; Luo, X.-D. SC-CO2 and emulsion explosives equivalence of rock-breaking effect in granite and mudstone sites. J. CO2 Util. 2024, 83, 102806. [Google Scholar] [CrossRef]
  5. Ferr, O.G.E.B.; Da, C.D.M.B.; Naked, H.A.; Dos, S.I.J.A.L. Risk Assessment for Hexamine Nitration into RDX. J. Aerosp. Technol. Manag. 2014, 6, 373–388. [Google Scholar] [CrossRef]
  6. Shree, M.D.; Sangeetha, A.; Krishnan, P. Design and Analysis of FBG Sensor for Explosive Detection Applications. Plasmonics 2020, 15, 813–819. [Google Scholar] [CrossRef]
  7. Kucewicz, M.; Ukasz, M.; Baranowski, P.; Maachowski, J.; Fuawka, K.; Mertuszka, P.; Szumny, M. Numerical modeling of blast-induced rock fragmentation in deep mining with 3D and 2D FEM method approaches. Journal of Rock Mechanics and Geotechnical Engineering. J. Rock Mech. Geotech. Eng. 2024, 16, 4532–4553. [Google Scholar] [CrossRef]
  8. Liu, D.; Chen, J.; Yang, R.; Xiao, L.; Zhang, G.; Feng, X.; Zhang, K.; Jiang, W.; Hao, G. An Overview on Synthesis, Explosion, Catalysis, Modification, and Application of Dihydroxylammonium 5,5′-Bistetrazole-1,1′-diolate (TKX-50). Chem. Mat. 2024, 36, 3496–3535. [Google Scholar] [CrossRef]
  9. Abdelaziz, A.; Trache, D.; Tarchoun, A.F.; Boukeciat, H.; Kadri, D.E.; Hassam, H.; Ouahioune, S.; Sahnoun, N.; Thakur, S.; Klapoetke, T.M. Application of co-crystallization method for the production of ammonium perchlorate/ammonium nitrate oxidizer for solid rocket propellants. Chem. Eng. J. 2024, 487, 150654. [Google Scholar] [CrossRef]
  10. Sikde, A.K.; Sikder, N. A review of advanced high performance, insensitive and thermally stable energetic materials emerging for military and space applications. J. Hazard. Mater. 2004, 112, 1–15. [Google Scholar] [CrossRef]
  11. Lan, G.; Zhang, G.; Shen, J.; Jin, G.; Wang, J.; Li, J. Ameliorating the sensitivities, thermal and combustion properties of RDX byin situ self-assembly TA-Pb/Cu shells to RDX surface. Arab. J. Chem. 2023, 16, 104497. [Google Scholar] [CrossRef]
  12. Chen, T.; Jiang, W.; Du, P.; Liu, J.; Hao, G.; Gao, H.; Xiao, L.; Ke, X. Facile preparation of 1,3,5,7-tetranitro-1,3,5,7-tetrazocane/glycidylazide polymer energetic nanocomposites with enhanced thermolysis activity and low impact sensitivity. RSC Adv. 2017, 7, 5957–5965. [Google Scholar] [CrossRef]
  13. Duan, B.; Shu, Y.; Liu, N.; Wang, B.; Lu, X.; Lu, Y. Direct insight into the formation driving force, sensitivity and detonation performance of the observed CL-20-based energetic cocrystals. CrystEngComm 2018, 20, 5790–5800. [Google Scholar] [CrossRef]
  14. Cao, X.; Guan, Y.; Yang, L.; Yan, M.; Ma, Q.; Fan, G.; Liu, Y.; Huang, S. An energetic derivative of 2,2′,4,4′,6,6′-hexanitrostilbene (HNS) and its DMF solvate crystallized from HNS solution with tertiary amine additives. J. Energ. Mater. 2019, 37, 90–97. [Google Scholar] [CrossRef]
  15. Wang, J.; Huang, H.; Xu, W.-Z.; Zhang, Y.-R.; Lu, B.; Xie, R.-Z.; Wang, P.; Yun, N. Prefilming twin-fluid nozzle assisted precipitation method for preparing nanocrystalline HNS and its characterization. J. Hazard. Mater. 2009, 162, 842–847. [Google Scholar] [CrossRef]
  16. Zhao, Y.; Zhao, J.-S.; Zhao, F.-Q.; Xu, S.-Y.; Ju, X.-H. Revealing the decomposition behavior of hexanitrostilbene and aluminum nanoparticles composites: A reactive molecular dynamics simulation. Acta Astronaut. 2020, 177, 320–331. [Google Scholar] [CrossRef]
  17. Padda, R.S.; Wang, C.-Y.; Hughes, J.B.; Razia, K.; Bennett, G.N. Mutagenicity of nitroaromatic degradation compounds. Environ. Toxicol. Chem. 2003, 22, 2293–2297. [Google Scholar] [CrossRef] [PubMed]
  18. Liu, G.-H.; Ye, Z.; Li, H.; Che, R.; Cui, L. Biological treatment of hexanitrostilbene (HNS) produced wastewater using an anaerobic-aerobic immobilized microbial system. Chem. Eng. J. 2012, 213, 118–124. [Google Scholar] [CrossRef]
  19. Lima, D.R.S.; Bezerra, M.L.S.; Neves, E.B.; Moreira, F.R. Impact of ammunition and military explosives on human health and the environment. Rev. Environ. Health 2011, 26, 101–110. [Google Scholar] [CrossRef] [PubMed]
  20. Maser, E.; Buenning, T.H.; Strehse, J.S. Environmental and human toxicology studies on explosive chemicals leaking from submerged munitions. Propellants Explos. Pyrotech. 2024, 49, e202300181. [Google Scholar] [CrossRef]
  21. Kovacic, P.; Somanathan, R. Nitroaromatic compounds: Environmental toxicity, carcinogenicity, mutagenicity, therapy and mechanism. J. Appl. Toxicol. 2014, 34, 810–824. [Google Scholar] [CrossRef] [PubMed]
  22. Darrach, M.R.; Chutjian, A.; Plett, G.A. Trace Explosives Signatures from World War II Unexploded Undersea Ordnance. Environ. Sci. Technol. 1998, 32, 1354–1358. [Google Scholar] [CrossRef]
  23. Vandendriessche, T.; Nicolai, B.M.; Hertog, M. Optimization of HS SPME Fast GC-MS for High-Throughput Analysis of Strawberry Aroma. Food Anal. Meth. 2013, 6, 512–520. [Google Scholar] [CrossRef]
  24. Nikalje, A. Liquid Chromatography-Mass Spectrometry and Its Applications: A Brief Review. Arch. Org. Inorg. Chem. Sci. 2018, 1, 001–009. [Google Scholar] [CrossRef]
  25. Can, Z.; Uzer, A.; Tekdemir, Y.; Ercag, E.; Turker, L.; Apak, R. Spectrophotometric and chromatographic determination of insensitive energetic materials: HNS and NTO, in the presence of sensitive nitro-explosives. Talanta 2012, 90, 69–76. [Google Scholar] [CrossRef]
  26. Garofolo, F.; Longo, A.; Migliozzi, V.; Tallarico, C. Quantitative Analysis of Thermostable Explosive Compounds by Combined Liquid Chromatography/Tandem Mass Spectrometry. Rapid Commun. Mass Spectrom. 1996, 10, 960819. [Google Scholar] [CrossRef]
  27. Sandoval, J. Improvement of Water Soluble Test for HNS. Period Covered: January–March 1977; Mason and Hanger-Silas Mason Co., Inc.: Amarillo, TX, USA, 1977. [Google Scholar] [CrossRef]
  28. Chen, L.; Song, L.; Gao, Y.; Zhu, A.; Cao, D. Experimental determination of solubilities and supersolubilities of 2,2′, 4,4′, 6,6′-hexanitrostilbene in different organic solvents. Chin. J. Chem. Eng. 2017, 25, 809–814. [Google Scholar] [CrossRef]
  29. Ochsenbein, U.; Zeh, M.; Berset, J.-D. Comparing solid phase extraction and direct injection for the analysis of ultra-trace levels of relevant explosives in lake water and tributaries using liquid chromatography-electrospray tandem mass spectrometry. Chemosphere 2008, 72, 974–980. [Google Scholar] [CrossRef]
  30. DeTata, D.; Collins, P.; McKinley, A. A fast liquid chromatography quadrupole time-of-flight mass spectrometry (LC-QToF-MS) method for the identification of organic explosives and propellants. Forensic Sci. Int. 2013, 233, 63–74. [Google Scholar] [CrossRef]
  31. Irlam, R.C.; Parkin, M.C.; Brabazon, D.P.; Beardah, M.S.; O’Donnell, M.; Barron, L.P. Improved determination of femtogram-level organic explosives in multiple matrices using dual-sorbent solid phase extraction and liquid chromatography-high resolution accurate mass spectrometry. Talanta 2019, 203, 65–76. [Google Scholar] [CrossRef] [PubMed]
Figure 1. Ultraviolet full-band scanning of HNS series solution.
Applsci 15 01486 g001
Figure 2. Presents high-performance liquid chromatography chromatograms of DMF and HNS at dual wavelengths using different mobile phases, ACN volume fraction of 60% (a) 226 nm (b) 271 nm; MeOH volume fraction of 60% (c) 226 nm (d) 271 nm; MeOH volume fraction of 70% (e) 226 nm (f) 271 nm.
Applsci 15 01486 g002
Figure 3. Dual-wavelength high-performance liquid chromatography chromatograms of DMF and HNS at different flow rates, MeOH volume fraction of 70%: the mobile phase flow rates were tested at 0.4 mL/min (a) 226 nm (b) 271 nm.; the mobile phase flow rates were tested at 0.5 mL/min (c) 226 nm (d) 271 nm.
Applsci 15 01486 g003
Figure 4. Retention times of DMF and HNS under dual-wavelength detection at different flow rates.
Applsci 15 01486 g004
Figure 5. High-performance liquid chromatography chromatograms of DMF and HNS at dual wavelengths, with an injection volume set at 10 µL, (a) 226 nm (b) 271 nm.
Applsci 15 01486 g005
Figure 6. Depicts the standard curves correlating the concentrations of (a) HNS and (b) DMF with their respective peak areas.
Applsci 15 01486 g006
Figure 7. Total ion chromatogram.
Applsci 15 01486 g007
Figure 8. Mass spectrum of the HNS peak.
Applsci 15 01486 g008
Table 1. Experiment reagents.
Reagent NameSpecificationManufacturer
2,2′,4,4′,6,6′-hexanitrostilbene (HNS)AR, ≥99.5North University of China (Taiyuan, China)
N,N-Dimethylformamide (DMF)AR, ≥99.9Shanghai Aladdin Biochemical Technology Co., Ltd. (Shanghai, China)
Methanol (MeOH)AR, ≥99.9Shanghai Aladdin Biochemical Technology Co., Ltd.
Acetonitrile (ACN)AR, ≥99.9Shanghai Aladdin Biochemical Technology Co., Ltd.
Ultrapure waterAR, ≥99.9self-preparation
Table 2. Experiment instruments.
Instrument NameModelManufacturer
Electronic balanceAL204Mettler Toledo Instruments (Shanghai, China) Co., Ltd.
UV spectrophotometerUV-8000SShanghai Yuan analysis Instrument Co., Ltd. (Shanghai, China)
Ultrasonic cleanerSB-5200DTNingbo Xinzhi Biotechnology Co., Ltd. (Ningbo, China)
Vacuum drying ovenDZG-6050SAShanghai Senxin Experimental Instrument Co., Ltd. (Shanghai, China)
Long axis rotary mixerROM-80proJiangyin elite experimental instrument Co., Ltd. (Jiangyin, China)
Liquid chromatography (HPLC)Ultimate3000 UHPLCShanghai Si instrument Biochemical Technology Co., Ltd. (Shanghai, China)
Table 3. Conditions for the detection of HNS by HPLC.
Chromatographic ParameterChromatographic Condition
Chromatographic instrumentUltimate 3000 UHPLC
chromatographic columnACCUCORE C30,2.6UM 150 × 4.6 MM
UV detection channel wavelength226 nm and 271 nm
Liquid phase mobile phase ratioMeOH:water = 70:30
Liquid flow rate0.5 mL min−1
Column temperature30 °C
Liquid phase injection quantity10 μL
Sample test time6.5 min
Table 4. Detailed preparation methods for standard solutions.
Sample Preparation
Sampling ① (mL)0.0000.0000.0000.0000.6001.500
Sampling ② (mL)0.1250.2505.0007.5000.0000.000
Sampling ③ (mL)7.3757.2502.5000.0000.0000.000
Corresponding HNS concentration (mg/L)0.501.0020.0030.0060.00150.00
Table 5. Average spike recovery rates for HNS.
NameConcentration/(mg/L)Spike Recovery/%Average/%
BasicAdded123123
HNS60.0048.00107.93108.15107.8899.88100.2599.8099.98
60.00120.21120.17119.93100.35100.2899.88100.17
72.00131.89132.11131.8799.82100.1899.7899.93
Table 6. The intra-day RSD and inter-day RSD of HPLC method for HNS analysis.
Concentration/(mg/L)
Normal123456SDIntra-Day RSD/%Inter-Day RSD/%
Day 110.009.8710.039.969.8710.079.850.090.921.16
Day 29.779.8510.019.8210.0810.010.090.87
Day 310.299.9710.2310.2810.2510.330.111.03
Day 120.0019.7219.7920.0120.0220.0319.720.160.810.98
Day 219.7820.0319.7920.0719.9719.710.180.91
Day 320.3720.3919.9619.9720.2720.390.170.82
Day 130.0030.0229.7130.0229.9229.7130.230.300.990.96
Day 229.7130.0230.0330.0129.7230.190.240.81
Day 330.2330.3529.9730.3730.3929.880.321.05
Table 7. The stability of HPLC method for HNS analysis.
Time (h)0246824
Concentration (mg/L)19.9820.0519.8720.1919.9320.21
RDS %0.86
Table 8. LC-MS chromatographic and mass spectrometric conditions.
LC ConditionsMS Conditions
Chromatograph: Dinonex Ultimate 3000 UHPLCMass spectrometer: Thermo Scientific Q Exactive
Column: Eclipse Plus C18 100 mm × 4.6 mm, 3.5 μmIon source: HESI
Column temperature: 30 °CSheath gas rate: 30 arb; Auxiliary gas rate: 5 arb
Injection volume: 10.0 μLSpray voltage: negative ion 2.8 kV
Mobile phase: A: 5 mM ammonium acetate solution;
B: acetonitrile
Capillary temperature: 320 °C;
Auxiliary temperature: 300 °C
Gradient elution conditions: 45%A + 55%BS-lens: 50%
Flow rate: 0.5 mL/minScan mode: Fullms/dd-ms2 top10
Scanning range: First level scanning: resolution 70,000, range 50~600 m/z;
Collision voltage: NCE15, 30, 45
Disclaimer/Publisher’s Note: The statements, opinions and data contained in all publications are solely those of the individual author(s) and contributor(s) and not of MDPI and/or the editor(s). MDPI and/or the editor(s) disclaim responsibility for any injury to people or property resulting from any ideas, methods, instructions or products referred to in the content.

