
Using Multiple-Hop Assessments and Reactive Strength Indices to Differentiate Sprinting Performance in Sportsmen


Abstract
1. Introduction
2. Methodology
2.1. Participants
2.2. Procedures
2.3. Data Processing and Outcome Measures
2.4. Statistical Analysis
3. Results
4. Discussion
5. Conclusions and Practical Applications
Author Contributions
Funding
Institutional Review Board Statement
Informed Consent Statement
Data Availability Statement
Acknowledgments
Conflicts of Interest
References
- Sharp, A.P.; Cronin, J.B.; Neville, J.; Diewald, S.N.; Stolberg, M.; Draper, N.; Walter, S. Comparison of multiple hop test kinematics between force-platforms and video footage—A cross sectional study. Int. J. Kinesiol. Sports Sci. 2023, 11, 23–28. [Google Scholar] [CrossRef]
- Sharp, A.P.; Neville, J.; Diewald, S.N.; Oranchuk, D.J.; Cronin, J.B. Videographic variability of triple and quintuple horizontal hop performance. J. Sport Rehabil. 2024, 33, 570–581. [Google Scholar] [CrossRef] [PubMed]
- Bolgla, L.A.; Keskula, D.R. Reliability of lower extremity functional performance tests. J. Orthop. Sports Phys. Ther. 1997, 26, 138–142. [Google Scholar] [CrossRef] [PubMed]
- Hamilton, R.T.; Shultz, S.J.; Schmitz, R.J.; Perrin, D.H. Triple-hop distance as a valid predictor of lower limb strength and power. J. Athl. Train. 2008, 43, 144–151. [Google Scholar] [CrossRef]
- Munro, A.G.; Herrington, L.C. Between-session reliability of four hop tests and the agility T-test. J. Strength Cond. Res. 2011, 25, 1470–1477. [Google Scholar] [CrossRef] [PubMed]
- Vittori, C. The European school in sprint training: The experiences in Italy. New Stud. Athl. 1996, 11, 85–92. [Google Scholar]
- Habibi, A.; Shabani, M.; Rahimi, E.; Fatemi, R.; Najafi, A.; Analoei, H.; Hosseini, M. Relationship between jump test results and acceleration phase of sprint performance in national and regional 100m sprinters. J. Hum. Kinet. 2010, 23, 29–35. [Google Scholar] [CrossRef]
- Maulder, P.; Cronin, J. Horizontal and vertical jump assessment: Reliability, symmetry, discriminative and predictive ability. Phys. Ther. Sport 2005, 6, 74–82. [Google Scholar] [CrossRef]
- Maulder, P.S.; Bradshaw, E.J.; Keogh, J. Jump kinetic determinants of sprint acceleration performance from starting blocks in male sprinters. J. Sports Sci. Med. 2006, 5, 359–366. [Google Scholar] [PubMed]
- Cesar, G.M.; Edwards, H.T.; Hasenkamp, R.M.; Burnfield, J.M. Prediction of athletic performance of male and female athletes measured by triple hop for distance. Trends Sport Sci. 2017, 24, 19–25. [Google Scholar]
- Nesser, T.W.; Latin, R.W.; Berg, K.; Prentice, E. Physiological determinants of 40-meter sprint performance in young male athletes. J. Strength Cond. Res. 1996, 10, 263–267. [Google Scholar] [CrossRef]
- Vittori, C. Monitoring the training of the sprinter. New Stud. Athl. 1995, 10, 39–44. [Google Scholar]
- Jarvis, P.; Turner, A.; Read, P.; Bishop, C. Reactive strength index and its associations with measures of physical and sports performance: A systematic review with meta-analysis. Sports Med. 2022, 52, 301–330. [Google Scholar] [CrossRef] [PubMed]
- Kipp, K.; Kiely, M.T.; Giordanelli, M.D.; Malloy, P.J.; Geiser, C.F. Biomechanical determinants of the reactive strength index during drop jumps. Int. J. Sports Physiol. Perform. 2018, 13, 44–49. [Google Scholar] [CrossRef]
- Flanagan, E.P.; Comyns, T.M. The use of contact time and the reactive strength index to optimize fast stretch-shortening cycle training. Strength Cond. J. 2008, 30, 32–38. [Google Scholar] [CrossRef]
- Ebben, W.P.; Petushek, E.J. Using the reactive strength index modified to evaluate plyometric performance. J. Strength Cond. Res. 2010, 24, 1983–1987. [Google Scholar] [CrossRef]
- Choukou, M.A.; Laffaye, G.; Taiar, R. Reliability and validity of an accelerometric system for assessing vertical jumping performance. Biol. Sport 2014, 31, 55–62. [Google Scholar] [CrossRef] [PubMed]
- Healy, R.; Kenny, I.C.; Harrison, A.J. Reactive strength index: A poor indicator of reactive strength? Int. J. Sports Physiol. Perform. 2018, 13, 802–809. [Google Scholar] [CrossRef]
- Lloyd, R.S.; Oliver, J.L.; Kember, L.S.; Myer, G.D.; Read, P.J. Individual hop analysis and reactive strength ratios provide better discrimination of ACL reconstructed limb deficits than triple hop for distance scores in athletes returning to sport. Knee 2020, 27, 1357–1364. [Google Scholar] [CrossRef]
- Davey, K.; Read, P.; Coyne, J.; Turner, A.; Brazier, J.; Šarabon, N.; Jordan, M.; Bishop, C. An assessemnt of the hopping strategy and inter-limb asymmetry during the triple hop test: A test-retest pilot study. Symmetry 2021, 13, 1890. [Google Scholar] [CrossRef]
- Šarabon, N.; Kozinc, Z.; Bishop, C. Comparison of vertical and horizontal reactive strength index variants and association with change of direction performance. J. Strength Cond. Res. 2023, 37, 84–90. [Google Scholar] [CrossRef]
- Šarabon, N.; Milinović, I.; Dolenec, A.; Kozinc, Ž.; Babić, V. The reactive strength index in unilateral hopping for distance and its relationship to sprinting performance: How many hops are enough for a comprehensive evaluation? Appl. Sci. 2022, 12, 11383. [Google Scholar] [CrossRef]
- Norton, K.I. Standards for Anthropometry Assessment. In Kinanthropometry and Exercise Physiology, 4th ed.; Norton, K., Eston, R., Eds.; Routledge: Abingdon, UK, 2018; pp. 68–137. [Google Scholar] [CrossRef]
- Colyer, S.L.; Nagahara, R.; Takai, Y.; Salo, A.I. How sprinters accelerate beyond the velocity plateau of soccer players: Waveform analysis of ground reaction forces. Scand. J. Med. Sci. Sports. 2018, 28, 2527–2535. [Google Scholar] [CrossRef] [PubMed]
- Samozino, P.; Rabita, G.; Dorel, S.; Slawinski, J.; Peyrot, N.; Saez de Villarreal, E.; Morin, J.B. A simple method for measuring power, force, velocity properties, and mechanical effectiveness in sprint running. Scand. J. Med. Sci. Sports. 2016, 26, 648–658. [Google Scholar] [CrossRef] [PubMed]
- Shapiro, S.S.; Wilk, M.B.; Chen, H.J. A comparative study of various tests for normality. J. Am. Stat. Assoc. 1968, 63, 10480932. [Google Scholar] [CrossRef]
- Akoglu, H. User’s guide to correlation coefficients. Turk. J. Emerg. Med. 2018, 18, 91–93. [Google Scholar] [CrossRef] [PubMed]
- Weyand, P.G.; Sternlight, D.B.; Bellizzi, M.J.; Wright, S. Faster top running speeds are achieved with greater ground forces not more rapid leg movements. J. Appl. Physiol. 2000, 89, 1991–1999. [Google Scholar] [CrossRef]


| 10 m | 20 m | 40 m | ||
|---|---|---|---|---|
| 3-Hop distance | Pearson’s r | −0.705 | −0.760 | −0.795 |
| p-value | <0.001 | <0.001 | <0.001 | |
| 5-Hop distance | Pearson’s r | −0.700 | −0.759 | −0.796 |
| p-value | <0.001 | <0.001 | <0.001 |
| 3-Hop | 5-Hop | |||||||||
|---|---|---|---|---|---|---|---|---|---|---|
| 10 m | 40 m | 10 m | 40 m | |||||||
| Kinetic Variable | Mean ± SD | r | p | r | p | Mean ± SD | r | p | r | p |
| Maximal Vertical Force 1 | 32.5 ± 4.63 | −0.366 | 0.016 | −0.451 | 0.002 | 32.1 ± 4.22 | −0.279 | 0.070 | −0.350 | 0.021 |
| Maximal Vertical Force 2 | 42.0 ± 7.60 | −0.416 | 0.005 | −0.501 | <0.001 | 39.7 ± 7.15 | −0.484 | 0.001 | −0.553 | <0.001 |
| Maximal Vertical Force 3 | 45.1 ± 8.76 | −0.336 | 0.026 | −0.467 | 0.001 | |||||
| Maximal Vertical Force 4 | 50.7 ± 10.5 | −0.452 | 0.002 | −0.554 | <0.001 | |||||
| Net Vertical Impulse 1 | 5.67 ± 0.439 | −0.296 | 0.051 | −0.310 | 0.040 | 5.48 ± 0.442 | −0.286 | 0.060 | −0.307 | 0.043 |
| Net Vertical Impulse 2 | 5.87 ± 0.338 | −0.337 | 0.029 | −0.335 | 0.030 | 5.48 ± 0.415 | −0.319 | 0.037 | −0.358 | 0.018 |
| Net Vertical Impulse 3 | 5.60 ± 0.397 | −0.270 | 0.080 | −0.338 | 0.027 | |||||
| Net Vertical Impulse 4 | 5.88 ± 0.343 | −0.311 | 0.048 | −0.360 | 0.021 | |||||
| Vertical Braking Impulse 1 | 1.33 ± 0.626 | −0.043 | 0.785 | −0.054 | 0.736 | 1.04 ± 0.579 | 0.066 | 0.672 | 0.026 | 0.019 |
| Vertical Braking Impulse 2 | 2.58 ± 0.461 | −0.110 | 0.477 | −0.155 | 0.314 | 2.02 ± 0.372 | −0.148 | 0.337 | −0.190 | 0.218 |
| Vertical Braking Impulse 3 | 2.80 ± 0.373 | −0.023 | 0.884 | −0.136 | 0.389 | |||||
| Vertical Braking Impulse 4 | 3.55 ± 0.580 | −0.267 | 0.080 | −0.339 | 0.024 | |||||
| Vertical Propulsive Impulse 1 | 4.36 ± 0.431 | −0.250 | 0.101 | −0.237 | 0.122 | 4.46 ± 0.396 | −0.404 | 0.007 | −0.368 | 0.015 |
| Vertical Propulsive Impulse 2 | 3.32 ± 0.481 | −0.209 | 0.173 | −0.179 | 0.246 | 3.51 ± 0.293 | −0.242 | 0.128 | −0.283 | 0.073 |
| Vertical Propulsive Impulse 3 | 2.85 ± 0.243 | −0.330 | 0.029 | −0.262 | 0.085 | |||||
| Vertical Propulsive Impulse 4 | 2.42 ± 0.509 | 0.037 | 0.810 | 0.059 | 0.703 | |||||
| Net Horizontal Impulse 1 | 0.700 ± 0.157 | −0.306 | 0.046 | −0.354 | 0.020 | 0.780 ± 0.154 | −0.436 | 0.003 | −0.449 | 0.002 |
| Net Horizontal Impulse 2 | 0.305 ± 0.148 | −0.148 | 0.337 | −0.162 | 0.292 | 0.461 ± 0.091 | −0.171 | 0.280 | −0.200 | 0.205 |
| Net Horizontal Impulse 3 | 0.196 ± 0.094 | −0.234 | 0.135 | −0.185 | 0.242 | |||||
| Net Horizontal Impulse 4 | −0.050 ± 0.186 | 0.141 | 0.366 | 0.147 | 0.346 | |||||
| Horizontal Braking Impulse 1 | −0.048 ± 0.023 | −0.164 | 0.306 | −0.224 | 0.160 | −0.033 ± 0.017 | −0.179 | 0.263 | −0.178 | 0.266 |
| Horizontal Braking Impulse 2 | −0.191 ± 0.048 | −0.095 | 0.541 | −0.142 | 0.356 | −0.113 ± 0.035 | −0.026 | 0.869 | 0.017 | 0.912 |
| Horizontal Braking Impulse 3 | −0.257 ± 0.044 | 0.118 | 0.470 | 0.165 | 0.308 | |||||
| Horizontal Braking Impulse 4 | −0.400 ± 0.094 | 0.211 | 0.180 | 0.259 | 0.098 | |||||
| Horizontal Propulsive Impulse 1 | 0.756 ± 0.135 | −0.332 | 0.028 | −0.354 | 0.018 | 0.820 ± 0.138 | −0.477 | 0.001 | −0.477 | 0.001 |
| Horizontal Propulsive Impulse 2 | 0.500 ± 0.109 | −0.177 | 0.250 | −0.191 | 0.214 | 0.583 ± 0.074 | −0.281 | 0.068 | −0.337 | 0.027 |
| Horizontal Propulsive Impulse 3 | 0.445 ± 0.069 | −0.368 | 0.014 | −0.324 | 0.032 | |||||
| Horizontal Propulsive Impulse 4 | 0.350 ± 0.105 | 0.033 | 0.834 | 0.032 | 0.836 | |||||
| Mean ± SD | Range | 5 m | 10 m | 20 m | 40 m | |||||
|---|---|---|---|---|---|---|---|---|---|---|
| 3-Hop | r | p | r | p | r | p | r | p | ||
| Step 1–2 RSIhor-DIST | 7.26 ± 1.39 | 4.94 to 10.51 | −0.468 | 0.001 | −0.535 | <0.001 | −0.595 | <0.001 | −0.641 | <0.001 |
| Step 1–2 RSIhor-FT | 1.18 ± 0.25 | 0.68 to 1.82 | −0.350 | 0.020 | −0.438 | 0.003 | −0.496 | <0.001 | −0.549 | <0.001 |
| Step 2–3 RSIhor-DIST | 10.71 ± 2.18 | 7.12 to 15.72 | −0.477 | 0.001 | −0.555 | <0.001 | −0.626 | <0.001 | −0.680 | <0.001 |
| Step 2–3 RSIhor-FT | 1.71 ± 0.34 | 1.09 to 2.46 | −0.434 | 0.003 | −0.518 | <0.001 | −0.590 | <0.001 | −0.647 | <0.001 |
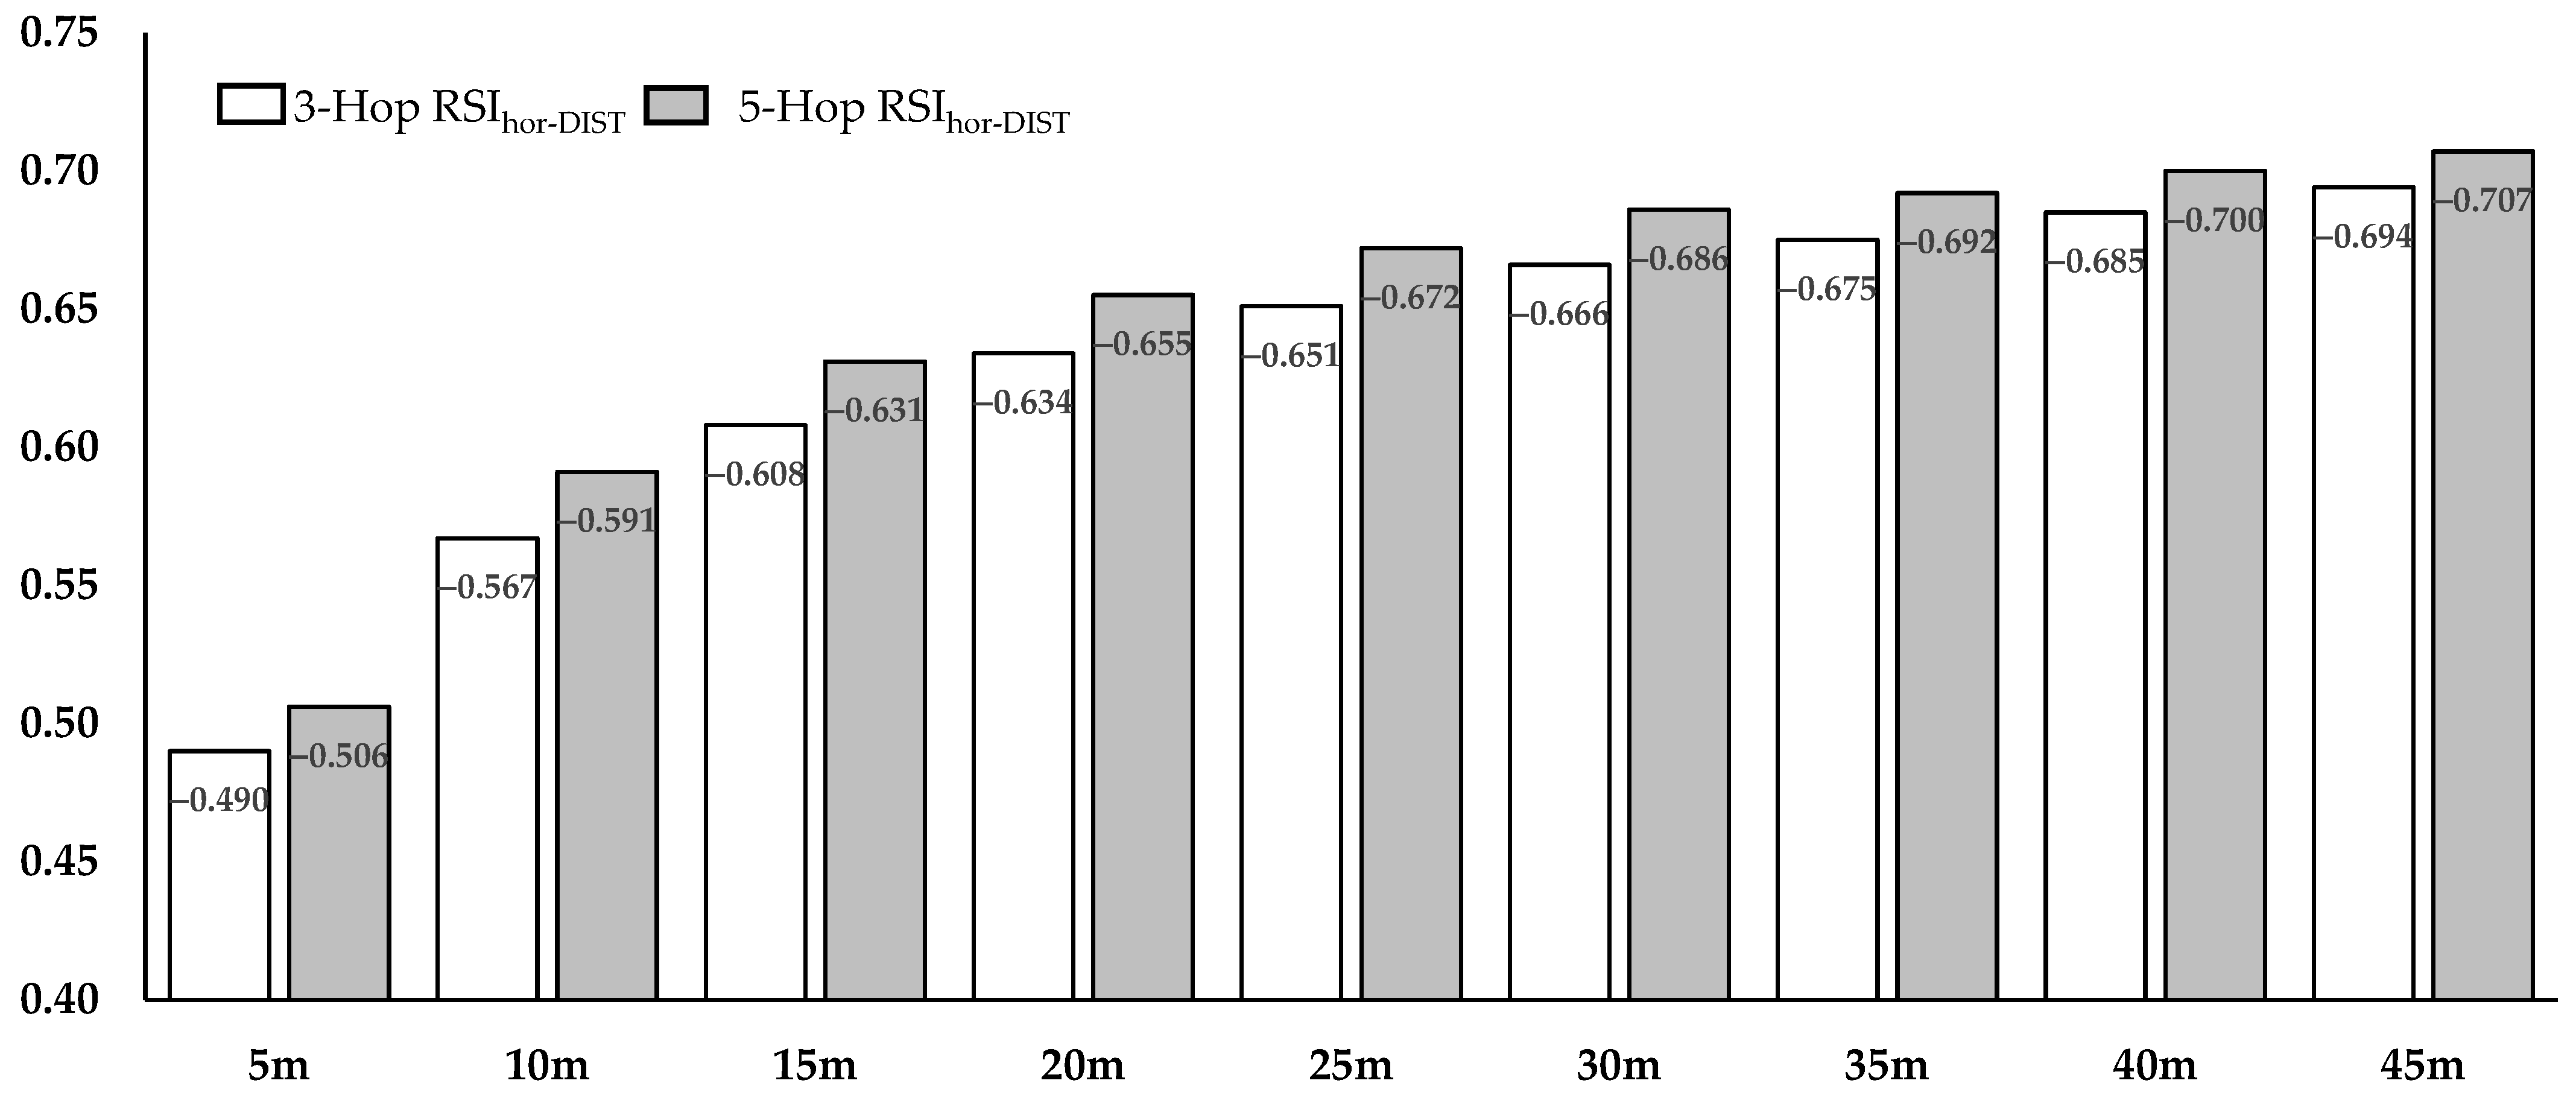
| Total RSIhor-DIST | 11.99 ± 2.21 | 8.48 to 16.78 | −0.490 | <0.001 | −0.567 | <0.001 | −0.634 | <0.001 | −0.685 | <0.001 |
| Total RSIhor-FT | 1.44 ± 0.28 | 0.88 to 2.12 | −0.391 | 0.009 | −0.482 | <0.001 | −0.544 | <0.001 | −0.562 | <0.001 |
| 5-Hop | ||||||||||
| Step 1–2 RSIhor-DIST | 7.30 ± 1.23 | 4.74 to 10.19 | −0.467 | 0.001 | −0.547 | <0.001 | −0.609 | <0.001 | −0.653 | <0.001 |
| Step 1–2 RSIhor-FT | 1.17 ± 0.23 | 0.72 to 1.82 | −0.270 | 0.076 | −0.357 | 0.017 | −0.408 | 0.006 | −0.455 | 0.002 |
| Step 2–3 RSIhor-DIST | 9.12 ± 1.69 | 5.90 to 12.93 | −0.453 | 0.002 | −0.548 | <0.001 | −0.619 | <0.001 | −0.671 | <0.001 |
| Step 2–3 RSIhor-FT | 1.36 ± 0.27 | 0.80 to 2.07 | −0.319 | 0.035 | −0.413 | 0.005 | −0.480 | <0.001 | −0.539 | <0.001 |
| Step 3–4 RSIhor-DIST | 9.93 ± 2.03 | 6.28 to 14.0 | −0.461 | 0.002 | −0.532 | <0.001 | −0.597 | <0.001 | −0.643 | <0.001 |
| Step 3–4 RSIhor-FT | 1.46 ± 0.31 | 0.83 to 2.30 | −0.315 | 0.037 | −0.403 | 0.007 | −0.475 | 0.001 | −0.542 | <0.001 |
| Step 4–5 RSIhor-DIST | 12.18 ± 2.82 | 7.74 to 18.4 | −0.507 | <0.001 | −0.583 | <0.001 | −0.639 | <0.001 | −0.674 | <0.001 |
| Step 4–5 RSIhor-FT | 1.89 ± 0.43 | 1.04 to 2.78 | −0.467 | 0.001 | −0.553 | <0.001 | −0.615 | <0.001 | −0.661 | <0.001 |
| Total RSIhor-DIST | 11.17 ± 2.02 | 7.33 to 15.6 | −0.506 | <0.001 | −0.591 | <0.001 | −0.655 | <0.001 | −0.700 | <0.001 |
| Total RSIhor-FT | 1.45 ± 0.28 | 0.84 to 2.15 | −0.391 | <0.001 | −0.482 | <0.001 | −0.544 | <0.001 | −0.597 | <0.001 |
| 10 m | 40 m | |||||||
|---|---|---|---|---|---|---|---|---|
| Slow | Fast | Slow | Fast | |||||
| Kinetic Variable | Mean ± SD | Mean ± SD | p | d | Mean ± SD | Mean ± SD | p | d |
| Maximal Vertical Force 1 | 30.2 ± 3.80 | 33.5 ± 3.47 | 0.024 | 0.892 | 30.1 ± 3.83 | 34.3 ± 3.61 | 0.006 | 1.120 |
| Maximal Vertical Force 2 | 37.9 ± 6.05 | 44.8 ± 7.04 | 0.008 | 1.046 | 38.2 ± 5.98 | 46.2 ± 6.86 | 0.002 | 1.240 |
| Net Vertical Impulse 1 | 5.57 ± 0.447 | 5.76 ± 0.447 | 0.245 | 0.433 | 5.51 ± 0.424 | 5.72 ± 0.442 | 0.188 | 0.493 |
| Net Vertical Impulse 2 | 5.78 ± 0.416 | 5.98 ± 0.337 | 0.166 | 0.529 | 5.74 ± 0.379 | 5.96 ± 0.334 | 0.102 | 0.629 |
| Vertical Braking Impulse 1 | 1.22 ± 0.642 | 1.31 ± 0.480 | 0.651 | 0.170 | 1.21 ± 0.665 | 1.26 ± 0.475 | 0.803 | 0.096 |
| Vertical Braking Impulse 2 | 2.44 ± 0.441 | 2.52 ± 0.446 | 0.663 | 0.161 | 2.49 ± 0.510 | 2.53 ± 0.461 | 0.803 | 0.092 |
| Vertical Propulsive Impulse 1 | 4.32 ± 0.480 | 4.44 ± 0.405 | 0.460 | 0.274 | 4.35 ± 0.523 | 4.45 ± 0.405 | 0.550 | 0.221 |
| Vertical Propulsive Impulse 2 | 3.29 ± 0.303 | 3.51 ± 0.524 | 0.185 | 0.496 | 3.21 ± 0.402 | 3.44 ± 0.585 | 0.222 | 0.456 |
| Net Horizontal Impulse 1 | 0.655 ± 0.144 | 0.751 ± 0.143 | 0.080 | 0.664 | 0.669 ± 0.159 | 0.777 ± 0.134 | 0.055 | 0.731 |
| Net Horizontal Impulse 2 | 0.299 ± 0.102 | 0.367 ± 0.166 | 0.182 | 0.500 | 0.289 ± 0.121 | 0.356 ± 0.173 | 0.223 | 0.455 |
| Horizontal Braking Impulse 1 | 0.054 ± 0.027 | −0.047 ± 0.017 | 0.420 | 0.304 | −0.052 ± 0.029 | −0.043 ± 0.019 | 0.343 | 0.359 |
| Horizontal Braking Impulse 2 | −0.193 ± 0.038 | −0.180 ± 0.052 | 0.416 | 0.301 | −0.193 ± 0.037 | −0.177 ± 0.053 | 0.362 | 0.339 |
| Horizontal Propulsive Impulse 1 | 0.725 ± 0.119 | 0.808 ± 0.123 | 0.070 | 0.689 | 0.735 ± 0.129 | 0.830 ± 0.107 | 0.037 | 0.800 |
| Horizontal Propulsive Impulse 2 | 0.492 ± 0.078 | 0.551 ± 0.123 | 0.130 | 0.570 | 0.482 ± 0.093 | 0.545 ± 0.120 | 0.119 | 0.587 |
| 10 m | 40 m | |||||||
|---|---|---|---|---|---|---|---|---|
| Slow | Fast | Slow | Fast | |||||
| Kinetic Variable | Mean ± SD | Mean ± SD | p | d | Mean ± SD | Mean ± SD | p | d |
| Maximal Vertical Force 1 | 30.4 ± 2.94 | 33.0 ± 3.59 | 0.044 | 0.784 | 30.5 ± 2.87 | 33.5 ± 3.74 | 0.021 | 0.909 |
| Maximal Vertical Force 2 | 35.9 ± 6.13 | 43.4 ± 6.24 | 0.002 | 1.214 | 35.9 ± 6.10 | 45.1 ± 6.00 | <0.001 | 1.514 |
| Maximal Vertical Force 3 | 40.7 ± 7.02 | 47.0 ± 7.52 | 0.025 | 0.864 | 40.9 ± 6.89 | 50.0 ± 7.88 | 0.002 | 1.236 |
| Maximal Vertical Force 4 | 44.0 ± 6.95 | 55.4 ± 10.2 | 0.001 | 1.306 | 44.5 ± 6.76 | 58.0 ± 9.45 | <0.001 | 1.644 |
| Net Vertical Impulse 1 | 5.39 ± 0.444 | 5.56 ± 0.477 | 0.303 | 0.383 | 5.31 ± 0.406 | 5.55 ± 0.457 | 0.131 | 0.568 |
| Net Vertical Impulse 2 | 5.42 ± 0.494 | 5.59 ± 0.368 | 0.298 | 0.387 | 5.35 ± 0.468 | 5.62 ± 0.374 | 0.091 | 0.640 |
| Net Vertical Impulse 3 | 5.55 ± 0.448 | 5.71 ± 0.373 | 0.299 | 0.383 | 5.49 ± 0.450 | 5.73 ± 0.380 | 0.121 | 0.585 |
| Net Vertical Impulse 4 | 5.79 ± 0.390 | 5.97 ± 0.352 | 0.192 | 0.497 | 5.75 ± 0.368 | 5.94 ± 0.333 | 0.158 | 0.550 |
| Vertical Braking Impulse 1 | 1.14 ± 0.604 | 0.945 ± 0.542 | 0.367 | −0.303 | 1.04 ± 0.663 | 0.985 ± 0.504 | 0.794 | −0.098 |
| Vertical Braking Impulse 2 | 2.02 ± 0.474 | 2.00 ± 0.273 | 0.914 | −0.040 | 1.97 ± 0.484 | 2.07 ± 0.308 | 0.539 | 0.227 |
| Vertical Braking Impulse 3 | 2.81 ± 0.339 | 2.77 ± 0.392 | 0.786 | −0.102 | 2.76 ± 0.370 | 2.82 ± 0.372 | 0.649 | 0.171 |
| Vertical Braking Impulse 4 | 3.27 ± 0.604 | 3.47 ± 0.405 | 0.278 | 0.404 | 3.32 ± 0.655 | 3.56 ± 0.553 | 0.303 | 0.383 |
| Vertical Propulsive Impulse 1 | 4.28 ± 0.424 | 4.64 ± 0.360 | 0.021 | 0.909 | 4.30 ± 0.439 | 4.49 ± 0.342 | 0.055 | 0.747 |
| Vertical Propulsive Impulse 2 | 3.43 ± 0.271 | 3.60 ± 0.325 | 0.134 | 0.564 | 3.40 ± 0.238 | 3.57 ± 0.321 | 0.120 | 0.585 |
| Vertical Propulsive Impulse 3 | 2.80 ± 0.279 | 2.97 ± 0.242 | 0.088 | 0.645 | 2.78 ± 0.265 | 2.92 ± 0.229 | 0.117 | 0.590 |
| Vertical Propulsive Impulse 4 | 2.57 ± 0.517 | 2.56 ± 0.390 | 0.991 | −0.004 | 2.47 ± 0.580 | 2.50 ± 0.474 | 0.916 | 0.039 |
| Net Horizontal Impulse 1 | 0.701 ± 0.132 | 0.843 ± 0.127 | 0.006 | 1.096 | 0.721 ± 0.155 | 0.863 ± 0.121 | 0.009 | 1.020 |
| Net Horizontal Impulse 2 | 0.431 ± 0.082 | 0.483 ± 0.095 | 0.129 | 0.594 | 0.446 ± 0.010 | 0.473 ± 0.098 | 0.476 | 0.274 |
| Net Horizontal Impulse 3 | 0.168 ± 0.085 | 0.219 ± 0.098 | 0.143 | 0.561 | 0.186 ± 0.101 | 0.217 ± 0.076 | 0.357 | 0.348 |
| Net Horizontal Impulse 4 | 0.039 ± 0.130 | −0.005 ± 0.162 | 0.422 | −0.303 | 0.010 ± 0.182 | −0.019 ± 0.175 | 0.661 | −0.165 |
| Horizontal Braking Impulse 1 | −0.036 ± 0.013 | −0.031 ± 0.015 | 0.296 | 0.404 | −0.034 ± 0.014 | −0.029 ± 0.015 | 0.385 | 0.334 |
| Horizontal Braking Impulse 2 | −0.123 ± 0.033 | −0.109 ± 0.035 | 0.295 | 0.390 | −0.116 ± 0.037 | −0.113 ± 0.037 | 0.846 | 0.072 |
| Horizontal Braking Impulse 3 | −0.256 ± 0.052 | −0.269 ± 0.029 | 0.424 | −0.307 | −0.253 ± 0.052 | −0.261 ± 0.031 | 0.643 | −0.180 |
| Horizontal Braking Impulse 4 | −0.351 ± 0.082 | −0.386 ± 0.076 | 0.249 | −0.438 | −0.349 ± 0.085 | −0.393 ± 0.085 | 0.174 | −0.529 |
| Horizontal Propulsive Impulse 1 | 0.746 ± 0.114 | 0.879 ± 0.116 | 0.004 | 1.159 | 0.764 ± 0.1355 | 0.897 ± 0.105 | 0.006 | 1.094 |
| Horizontal Propulsive Impulse 2 | 0.555 ± 0.065 | 0.611 ± 0.074 | 0.036 | 0.818 | 0.563 ± 0.075 | 0.606 ± 0.074 | 0.130 | 0.580 |
| Horizontal Propulsive Impulse 3 | 0.422 ± 0.057 | 0.480 ± 0.076 | 0.025 | 0.864 | 0.428 ± 0.061 | 0.470 ± 0.072 | 0.097 | 0.627 |
| Horizontal Propulsive Impulse 4 | 0.370 ± 0.103 | 0.377 ± 0.103 | 0.847 | 0.071 | 0.359 ± 0.112 | 0.368 ± 0.110 | 0.832 | 0.078 |
| Sprint Time (s) | Hop Ratio | p | 3-Hop RSIhor-DIST | p | 5-Hop RSIhor-DIST | p | |
|---|---|---|---|---|---|---|---|
| 10 m Sprint | |||||||
| Group 1 (fast) | 1.60 | 1.73 ± 0.034 | - | 13.1 ± 2.10 | - | 11.8 ± 1.08 | - |
| Group 2 (slow) | 1.78 | 1.71 ± 0.044 | 0.222 | 10.5 ± 1.52 | <0.001 | 10.1 ± 1.01 | <0.001 |
| 40 m Sprint | |||||||
| Group 1 (fast) | 5.10 | 1.72 ± 0.036 | - | 13.8 ± 2.20 | - | 12.8 ± 1.92 | - |
| Group 2 (slow) | 5.71 | 1.71 ± 0.046 | 0.434 | 10.7 ± 1.55 | <0.001 | 9.9 ± 1.59 | <0.001 |
Disclaimer/Publisher’s Note: The statements, opinions and data contained in all publications are solely those of the individual author(s) and contributor(s) and not of MDPI and/or the editor(s). MDPI and/or the editor(s) disclaim responsibility for any injury to people or property resulting from any ideas, methods, instructions or products referred to in the content. |
© 2025 by the authors. Licensee MDPI, Basel, Switzerland. This article is an open access article distributed under the terms and conditions of the Creative Commons Attribution (CC BY) license (https://creativecommons.org/licenses/by/4.0/).
Share and Cite
Sharp, A.; Neville, J.; Nagahara, R.; Wada, T.; Cronin, J. Using Multiple-Hop Assessments and Reactive Strength Indices to Differentiate Sprinting Performance in Sportsmen. Appl. Sci. 2025, 15, 1685. https://doi.org/10.3390/app15041685
Sharp A, Neville J, Nagahara R, Wada T, Cronin J. Using Multiple-Hop Assessments and Reactive Strength Indices to Differentiate Sprinting Performance in Sportsmen. Applied Sciences. 2025; 15(4):1685. https://doi.org/10.3390/app15041685
Chicago/Turabian StyleSharp, Anthony, Jonathon Neville, Ryu Nagahara, Tomohito Wada, and John Cronin. 2025. "Using Multiple-Hop Assessments and Reactive Strength Indices to Differentiate Sprinting Performance in Sportsmen" Applied Sciences 15, no. 4: 1685. https://doi.org/10.3390/app15041685
APA StyleSharp, A., Neville, J., Nagahara, R., Wada, T., & Cronin, J. (2025). Using Multiple-Hop Assessments and Reactive Strength Indices to Differentiate Sprinting Performance in Sportsmen. Applied Sciences, 15(4), 1685. https://doi.org/10.3390/app15041685