Abstract
This paper presents a comprehensive probabilistic analysis of packet loss in long-range (LoRa) networks, a vital aspect of low-power, wide-area communication systems increasingly employed in IoT applications. The proposed model integrates multiple critical factors, including packet arrival rates, transmission power levels, and the distance between transmitting nodes and the gateway. By incorporating these variables into a unified probabilistic framework, the model not only predicts packet loss and interference patterns but also provides insights into optimizing network parameters. Specifically, it focuses on determining the optimal transmission power required to balance energy efficiency and communication reliability. A distinctive feature of the analysis is its ability to adapt dynamically to varying network conditions, ensuring sustained performance even in environments with high node density or fluctuating traffic loads. The study also explores the interplay between transmission power and interference, demonstrating how careful calibration of power settings can significantly reduce packet collisions while conserving energy resources. The proposed framework not only advances theoretical understanding, but also offers actionable guidelines for network designers seeking to achieve high performance in resource-constrained environments.
1. Introduction
The rapid growth of the Internet of Things (IoT) has generated an urgent need for scalable and energy-efficient communication technologies. Among emerging solutions, long-range networks (LoRa) have gained prominence as a leading technology for low-power wide-area networks (LPWANs) [1,2]. LoRa networks excel in scenarios requiring long-distance communication, minimal power consumption, and the ability to support a high density of connected devices. As a result, they are increasingly adopted in various applications, including smart cities, environmental monitoring, industry, communications, and precision agriculture [3,4]. Despite their advantages, LoRa networks face challenges in maintaining reliable data transmission, especially in dynamic and densely populated environments. Packet loss, a critical performance metric, can significantly affect the functionality of LoRa-dependent applications. Factors such as interference, signal attenuation, network congestion, and collisions contribute to packet loss, emphasizing the need for a detailed analysis of data transmission [5]. Previous studies, such as those by Magrin et al. [5] and Reynders et al. [6], have provided foundational insights into interference modeling and adaptive power control. However, most of these works rely on deterministic or simplistic models that fail to capture the stochastic nature of interference and environmental dynamics. This study builds upon existing literature by introducing a probabilistic framework that integrates multiple critical factors, including packet arrival rates, transmission power levels, and the distance between nodes and gateways. Unlike prior approaches, our model dynamically adapts to varying network conditions and considers the interplay between transmission power and interference. This allows for a more nuanced understanding of packet loss and provides actionable insights into optimizing network parameters. A distinctive feature of this research is its focus on balancing energy efficiency and communication reliability through optimal transmission power settings. By employing probabilistic models, the analysis quantifies the probability of packet loss under different scenarios, addressing gaps in previous studies and offering practical guidelines for improving network performance. Furthermore, this study validates its theoretical findings through a combination of modeling and experimental evaluations, setting it apart from purely theoretical analyses. Beyond the core analysis of packet loss and interference, this study also explores additional factors that significantly impact LoRa network performance. The role of the ALOHA protocol in managing retransmissions and its effects on network efficiency are examined, highlighting the differences between Pure ALOHA and Slotted ALOHA in reducing collisions. Additionally, the impact of key LoRa parameters, such as the spreading factor (SF) and bandwidth (BW), on packet loss probability is analyzed, demonstrating how adjustments in these settings can improve network reliability. Another crucial aspect addressed in this work is the energy consumption of LoRa devices. By evaluating different transmission power levels and network conditions, we provide insights into optimizing energy efficiency while maintaining robust communication. Experimental results with varying traffic loads and transmission distances further illustrate the interplay between power settings, network density, and energy efficiency. The findings of this research have significant implications for the design and implementation of LoRa networks, particularly in resource-constrained environments. By identifying the key factors contributing to packet loss and proposing strategies to mitigate them, this study advances the state of the art and provides valuable tools for network designers aiming to achieve high reliability and energy efficiency.
2. Materials and Methods
The work of Sa-Ingthong et al. [1] considers a system with one or more gateways and multiple end devices. The model assumes that all packets have equal airtimes, communication is line-of-sight, and only uplink communication is used, without centralized scheduling or acknowledgments. Using that model, this study proposes to analyze the calculation of the probability of packet success in a LoRa network composed of four transmitters and one gateway. It seeks to determine the optimal transmission powers and the necessary parameters to ensure a high probability of success based on the model of Sa-Ingthong et al. [1]. Figure 1 presents the experimental setup proposed for the measurements.
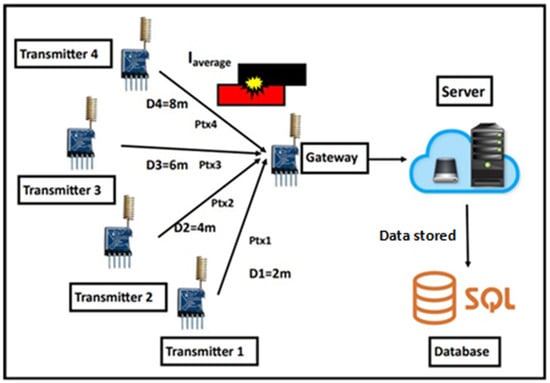
Figure 1.
The experimental setup consists of four transmitters, a gateway, and a server. The transmitters are responsible for collecting and sending data to the gateway. The gateway processes the received data and forwards them to the server for further analysis and storage.
In this scenario, the following key parameter values are maintained: a transmission power Ptx = 14 dBm for all transmitters, a transmission interval 1000 ms (λ = 1 msg/s), distances between transmitters and the gateway for each one with d1 = 2 m, d2 = 4 m, d3 = 6 m, d4 = 8 m. These parameters were used to test a small-space scenario under normal working conditions. These parameters not only define the experimental setup, but also play a crucial role in determining the received signal strength (RSSIn) and the impact of interference in LoRa networks. The received signal strength (RSSIn) in LoRa networks is determined as the difference between the transmission power (Ptx) and the path loss (PL), yielding −86 dBm in this scenario. Interference, a critical factor in network performance, occurs when multiple devices transmit simultaneously within the same frequency band, with its strength influenced by the transmission power of interfering devices, the path loss during signal propagation, and the temporal overlap between interfering packets and the packet of interest [6]. To quantify this, the total interference power is averaged over the airtime of the packet of interest, resulting in the average aggregate interference (Iaverage), a key metric in dense deployments that represents the cumulative interference experienced by a receiver due to overlapping transmissions from other devices. Accurate modeling of Iaverage is crucial for predicting packet loss and optimizing network performance, and its calculation involves summing the received powers from interfering nodes, converted to milliwatts. For example, assuming Ptx,i = 14 dBm for interfering nodes and using path losses based on distance, the total interference power in this setup is 1.447 × 10⁻¹⁰ mW. To assess communication quality under such interference, the signal-to-interference ratio (SIR) is calculated, representing the ratio of received signal power to total interference power at a receiver, with higher SIR values indicating reduced error rates and more reliable transmissions. The SIR is determined by first calculating the received signal power, derived from the transmitted power adjusted for path loss; for instance, a transmitter with Ptx = 14 dBm and a path loss of PL = 100 dB result in RSSIn = −86 dBm, which is then converted to milliwatts for SIR computations. By integrating these metrics, a comprehensive understanding of the interplay between interference, network density, and communication quality is achieved, enabling the design of robust and efficient LoRa networks.
The interference power Iaverage is next computed by summing the contributions from all other transmitters [7]. Each transmitter’s interference power at the receiver is calculated using its transmitted power and the path loss specific to its distance from the receiver. These individual powers are converted from decibels to milliwatts. Once summed, the total interference Iaverage is obtained, as shown in this study to be 1.447 × 10⁻¹⁰ mW. Since interference power is a key factor in LoRa network performance, its impact must be analyzed alongside other parameters such as coding rate (CR) and bandwidth (BW), which further influence interference, energy consumption, and transmission efficiency. The coding rate (CR) determines the level of redundancy added to transmitted data for error correction. For example, a CR of 4/5 indicates that 4 bits are data and 1 bit is redundant. Higher CR values enhance robustness against errors in noisy or interference-heavy environments but increase the airtime of packets. This extended airtime raises the probability of overlapping transmissions, directly impacting the aggregated interference power Iaverage. While a higher CR can mitigate some effects of interference, it does so at the cost of increased resource usage. The bandwidth (BW), on the other hand, affects the data rate and sensitivity of the receiver. A larger BW enables faster data transmission, reducing the airtime and, consequently, the likelihood of packet collisions. However, it also decreases the receiver’s sensitivity, potentially requiring higher transmission power to maintain reliable communication. Conversely, a smaller BW improves sensitivity but increases the airtime, which may lead to higher Iaverage values due to prolonged exposure to interference. The indirect effects of BW and CR on Iaverage, airtime, and network performance are significant and are controlled by the experiment presented in this work. In addition to CR and BW, the spreading factor (SF) plays a critical role in determining the airtime of transmitted packets, further influencing the likelihood of interference. Higher SF values result in longer packet airtime, increasing the probability of overlapping transmissions and, consequently, the aggregated interference power Iaverage. This relationship is particularly important as LoRa networks rely on the orthogonality of different SFs to minimize interference between packets. By incorporating SF into the interference model, this study ensures a more accurate prediction of Iaverage under varying network conditions. Building on this interference model, the next step is to compute the SIR using the formula:
In this specific scenario, substituting the calculated values Psignal = 2.51 × 10⁻⁹ mW and Iaverage = 1.447 × 10⁻¹⁰ mW, the SIR is as follows:
This detailed computation emphasizes the importance of both accurate path loss modeling and interference estimation, as errors in either can significantly impact the SIR and, consequently, the network’s performance and reliability [8].
The probability of success is calculated using the cumulative distribution function (CDF) of a normal distribution, assuming interference follows a normal distribution:
where
The choice of the cumulative distribution function (CDF) to calculate the probability of success in this analysis is based on the need to model the statistical nature of interference and the random factors that affect communication in LoRa networks [9]. Interference generated by neighboring transmitters, as well as signal attenuation and other noise, introduce variations in the system that can be represented statistically [10]. In this case, it was assumed that interference follows a normal distribution, which allows the CDF to be used to evaluate the probability that the signal-to-interference ratio (SIR) is greater than or equal to a desired threshold (γ), thus ensuring reliable communication. Given this assumption, the next step is to leverage the properties of the CDF to systematically evaluate the probability of achieving a signal-to-interference ratio (SIR) above a given threshold. The CDF of a normal distribution evaluates the cumulative probability that a random variable takes a value less than or equal to a given number. Normalizing the values allows the interference to be converted to a standard scale, removing the dependence on the original units and facilitating the use of standard tables or software to calculate the CDF. This approach has several advantages. First, the CDF guarantees an analytical solution to evaluate probabilities in stochastic systems, which is useful in scenarios similar to this where the interference parameters are not deterministic. Second, the use of the CDF allows for directly incorporating statistical characteristics of the communication environment, such as the mean and standard deviation of the interference, providing a more accurate representation of the probability of success [11,12]. Based on this, the calculation of µ as the mean of the interference and σ as half of µ is grounded in the premise of a symmetric normal distribution, an approximation valid in LoRa networks with multiple transmitters operating under similar conditions [13,14]. By substituting the obtained values (µ = 1.447 × 10⁻¹⁰ and σ = 7.235 × 10⁻¹¹) into the CDF formula, a high value is obtained (CDF (6.72) ≈ 1.0), indicating that the probability of success is close to 100%. This high value of the probability of success is essential to ensure that the LoRa network operates effectively, minimizing data loss and maintaining reliable communication [15,16]. Furthermore, this CDF-based method can be extended to analyze more complex scenarios, such as networks with higher transmitter density or more variable interference conditions. By optimizing the system based on these probabilities, it is possible to balance network reliability with energy efficiency and other available resources [17,18].
Substituting µ = 1.447 × 10⁻¹⁰ and σ = 7.235 × 10⁻¹¹, the probability of success is obtained by consulting the cumulative distribution function (CDF (6.72)):
CDF (6.72) ≈ 1.0
This results in a success probability of 99.9%. With these results in mind, the next step is to maintain the same success percentage while minimizing power to optimize energy consumption [19,20]. Considering the same values with a minimum and maximum allowed power limit of Ptx,min = 2 dBm, Ptx,max = 18 dBm, and a minimum desired success probability p = 0.9, the power optimization calculation continues. To achieve this optimization while ensuring reliable communication, it is essential to accurately determine the path loss (PL), which quantifies the attenuation of signal power as it propagates from the transmitter to the receiver. Path loss refers to the attenuation of the signal power as it propagates through space from the transmitter to the receiver. It is a critical factor in determining the reliability and efficiency of LoRa communication systems [21,22]. The Friis transmission equation, is given as follows:
where d is the distance between the transmitter and the receiver, f is the carrier frequency, c is the speed of light, and is used to compute PL. This equation highlights the dependency of path loss on distance and frequency, making it a cornerstone in understanding signal attenuation.
Path loss directly impacts the received signal strength (RSSI) and, consequently, the ability to decode packets accurately [23,24]. In LoRa networks, the RSSI is given by the following:
where Ptx is the transmission power. For example, in our experimental setup, with Ptx = 14 dBm, and distances d1 = 2 m, d2 = 4 m, d3 = 6 m, and d4 = 8 m, the calculated path losses are 37.7 dB, 47.3 dB, 47.2 dB, and 49.7 dB, respectively. This results in RSSI values of 23.7 dBm, −33.3 dBm, −33.2 dBm, and −35.7 dBm.
RSSI = Ptx − PL,
The average aggregate interference is calculated as before, obtaining:
≈3.79 × 10⁻³ mW
To optimize transmission powers, the following constraint must be met:
where γ = 3.98, µ = 3.79 × 10⁻³, σ = = 1.895 × 10⁻³, and probit (0.9) ≈ 1.28. This results in optimal transmission powers for each module (in dBm):
Ptx1 = 6.5, Ptx2 = 12.5, Ptx3 = 16, Ptx4 = 16
Moreover, while power optimization enhances the overall reliability and efficiency of the LoRa system [25,26], it is also crucial to consider the limitations of certain performance metrics, such as RSSI, particularly in short-range experimental setups. The experimental setup employed in this study involves distances between 2 m and 8 m, which may lead to non-negligible effects from the electronic circuits of the LoRa transceiver. Specifically, the Low Noise Amplifier (LNA) could introduce nonlinearities due to signal saturation, and potential feedback mechanisms within the receiver chain may also affect the measured values. These factors can cause deviations from theoretical path loss models, resulting in RSSI values that might not accurately reflect real-world long-range LoRa deployments. Additionally, in short-range scenarios, multipath effects and internal circuit characteristics of the transceiver (such as automatic gain control or impedance mismatches) can further distort RSSI measurements. While these effects are minimized in our setup by maintaining controlled environmental conditions, their presence should be taken into account when interpreting the results. In addition to these considerations regarding RSSI limitations, the experimental setup utilized a single-channel gateway (GW) to receive transmissions from four LoRa nodes, which introduces additional challenges related to packet reception and interference. In this configuration, all devices operated within the same frequency band, using an ALOHA-based medium access control (MAC) protocol. Given the absence of carrier sense multiple access (CSMA) in LoRa, the transmission scheduling is uncoordinated, which inherently leads to packet collisions, especially when multiple nodes transmit simultaneously. Since the gateway operates on a single channel, it can only decode one packet at a time per spreading factor (SF). If two or more packets arrive at the gateway at the same frequency and SF simultaneously, a collision occurs unless the signals are sufficiently separated in power (typically by at least 6 dB) for capture effect to take place. In addition to packet collisions caused by uncoordinated transmissions, another critical issue in this setup is intra-SF interference. Unlike traditional frequency-division multiple access (FDMA) or time-division multiple access (TDMA) systems, the LoRa chirp spread spectrum (CSS) modulation allows for multiple spreading factors to coexist within the same frequency channel, leveraging their quasi-orthogonality. However, transmissions using the same SF are not orthogonal, and simultaneous packets with identical SF values cause mutual interference, leading to increased packet loss. This effect is exacerbated in scenarios with high transmission density, where multiple nodes compete for access to the gateway. To mitigate the probability of concurrent transmissions, a controlled transmission interval of 1 s (λ = 1 pkt/s) per node was implemented in the experimental setup. This spacing between transmissions reduced, but did not eliminate, packet collisions. Beyond the challenges posed by packet collisions and intra-SF interference, another important aspect to consider in this setup is the payload characteristics. The size of the transmitted packets was fixed at 20 bytes for all experiments. This payload length was selected to balance transmission time and energy consumption, while ensuring that the experimental conditions remained realistic for practical IoT applications. The corresponding Time on Air (ToA) was calculated based on the selected transmission parameters, which included a spreading factor of SF = 7, a bandwidth of 125 kHz, and a coding rate of 4/5. Using the standard formula for LoRa packet airtime:
the computed ToA was approximately 50 ms per packet. Regarding the duty cycle, LoRaWAN and ISM band regulations enforce duty cycle restrictions depending on the region. In our setup, the transmissions adhered to the European ISM band regulations, which impose a maximum duty cycle of 1% in most sub-bands. This means that each transmitter was limited to transmitting for a maximum of 1% of the total time, ensuring compliance with spectrum usage constraints. Given the calculated ToA of 50 ms per transmission and a transmission interval of 1 s, the effective duty cycle for each node was as follows:
This exceeds the 1% limit, indicating that either the transmission interval must be increased or the payload size reduced to comply with regulations. However, this experimental setup was conducted in a controlled environment where regulatory constraints were not strictly enforced. In a real-world deployment, either a longer transmission interval or a reduction in transmission power would be necessary to comply with regulatory requirements. Future improvements to this experimental framework could involve using multi-channel gateways to allow for simultaneous packet reception across different frequencies, thereby reducing the probability of collisions. Additionally, implementing an adaptive SF allocation mechanism, where nodes dynamically adjust their SF based on network conditions, could further mitigate intra-SF interference and improve overall network performance. Another approach would be to introduce a scheduling mechanism or duty-cycle-aware transmission coordination to better distribute packet transmissions over time, reducing congestion and increasing successful packet delivery rates. Overall, the results demonstrate that while a single-channel gateway is sufficient for controlled experiments, real-world deployments with highnode densities would benefit from multi-channel reception, adaptive SF selection, and collision avoidance strategies to enhance the network.
3. Results
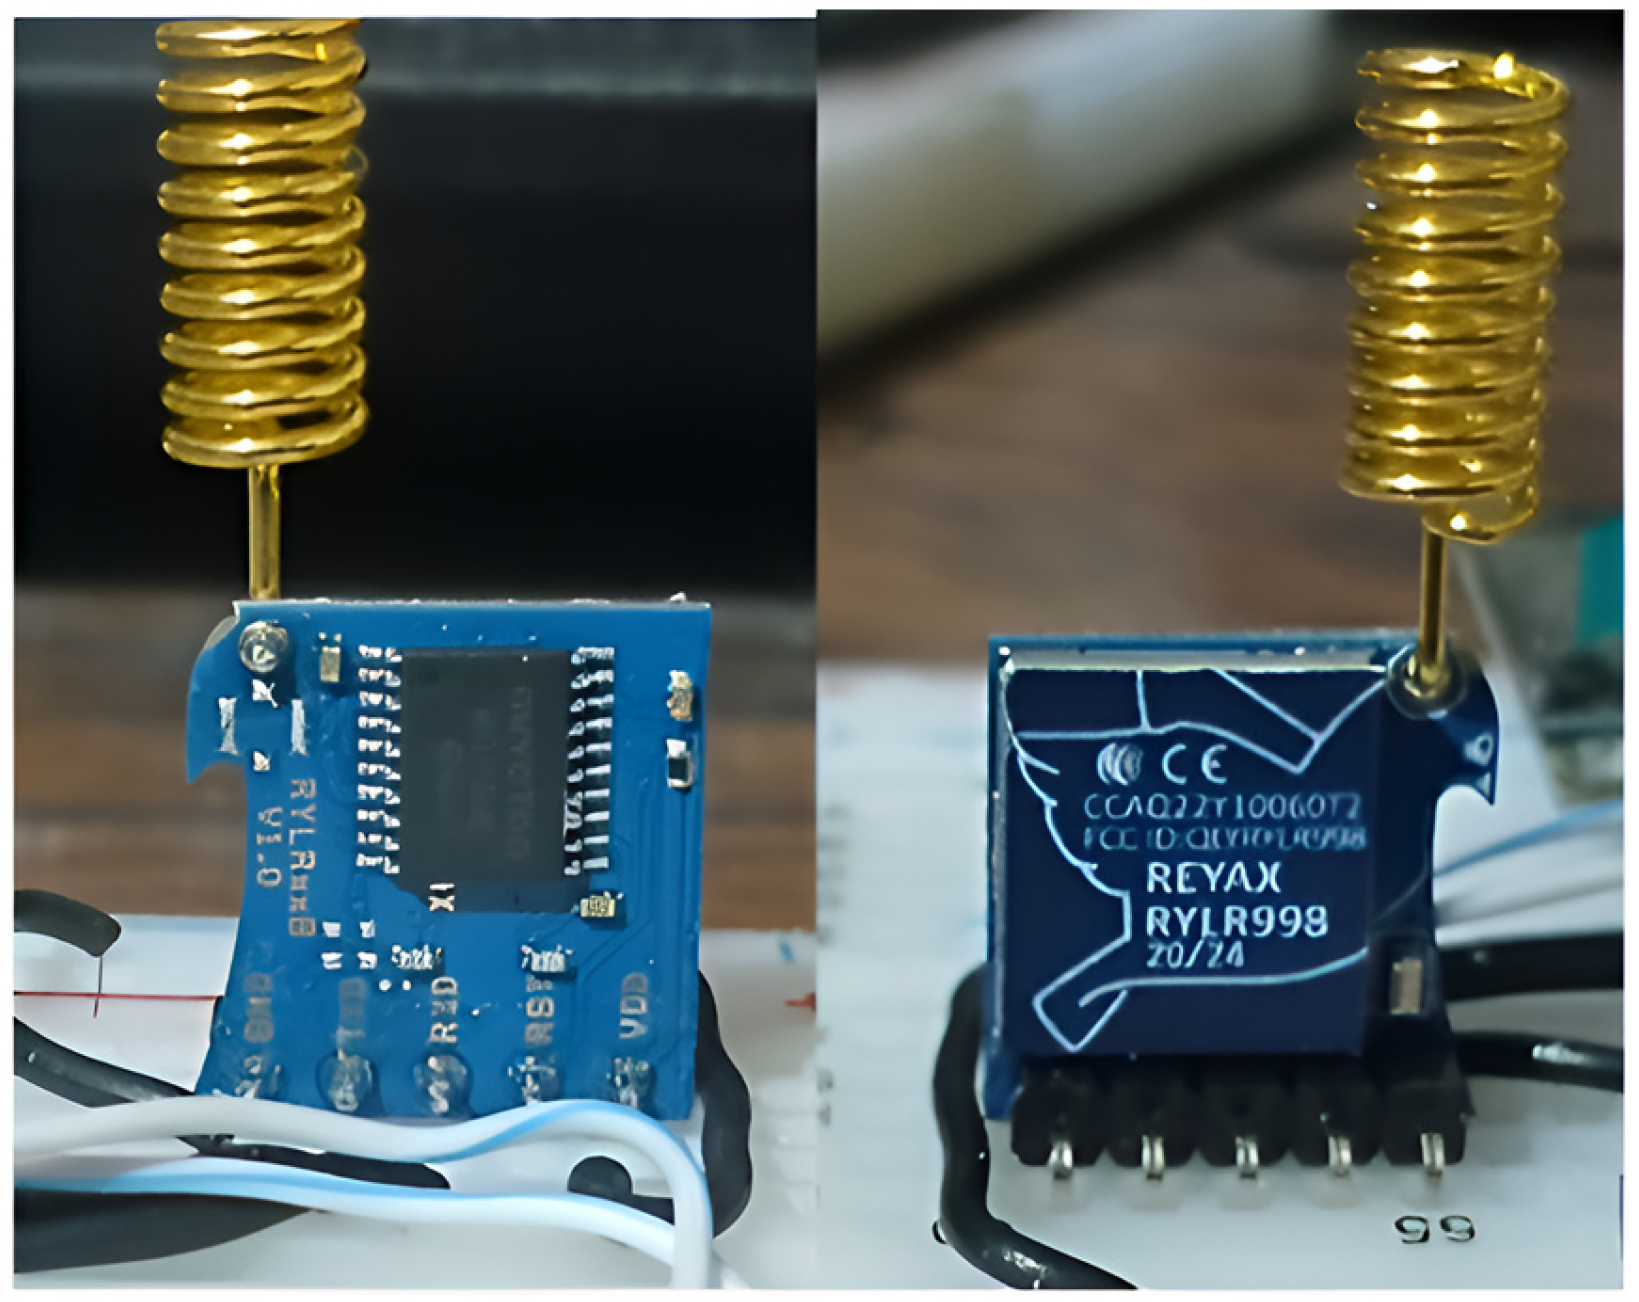
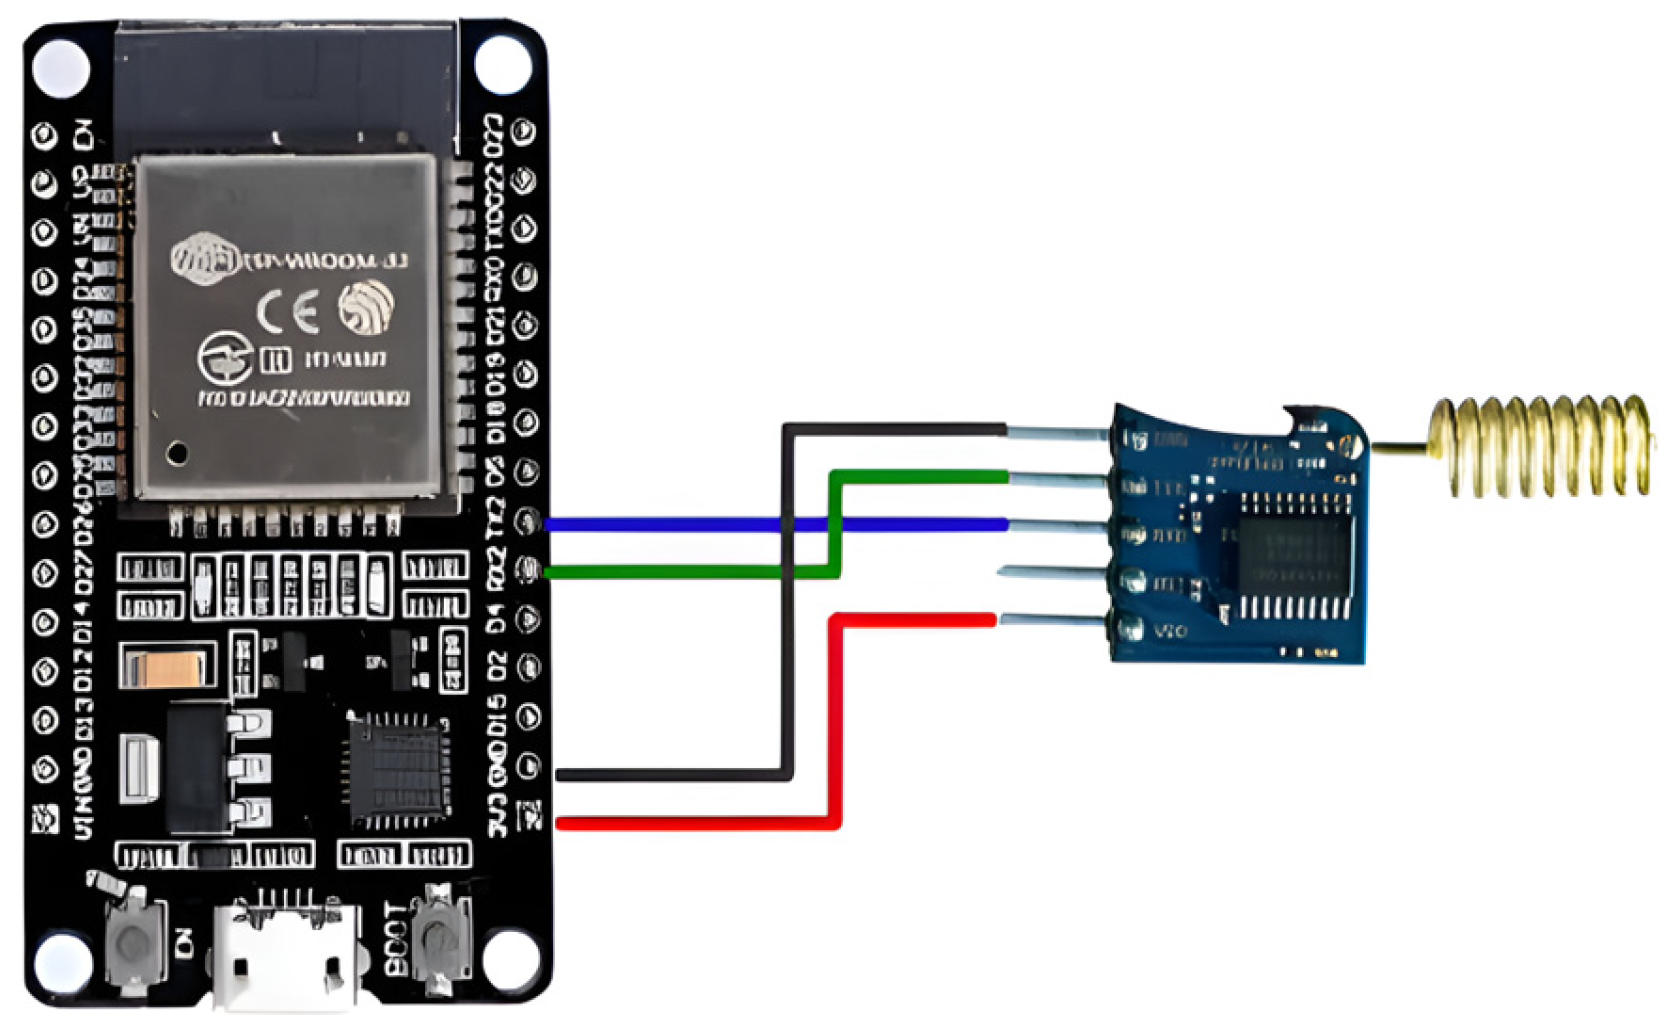
For experimentation, the ESP32 development board was utilized as the central component due to its versatility, ease of communication with peripheral modules, affordability, and low power consumption. The ESP32, a widely popular microcontroller, integrates both Wi-Fi and Bluetooth capabilities, making it an ideal choice for IoT applications where connectivity is crucial [27,28]. Its dual-core Tensilica Xtensa LX6 processor, running at a clock speed of up to 240 MHz, provides sufficient computational power to handle real-time data processing and communication tasks [29,30]. Furthermore, the ESP32 ultra-low power consumption in deep-sleep mode, typically around 10 µA, ensures energy efficiency, which is a critical requirement in scenarios involving battery-powered LoRa devices [31,32]. In this experimental setup, the ESP32 development board was utilized as the central component, and to facilitate long-range communication, the Reyax RYLR998 (Taipei City, Taiwan) LoRa module was employed as the transmitter (Figure 2 shows the transmitter used). This module operates on the LoRa modulation technique, known for its robust long-range communication capabilities and superior resistance to interference [33,34]. The RYLR998 supports frequencies ranging from 868 MHz to 915 MHz, making it compatible with unlicensed ISM bands in various regions [35,36]. It boasts a transmission range of up to 15 km in optimal conditions, making it suitable for applications in smart cities, agricultural monitoring, and remote sensing [37,38]. Additionally, the module features an easy-to-use UART interface, simplifying integration with microcontrollers such as the ESP32. Its built-in commands for setting transmission power, spreading factor, and other parameters enable flexible configuration, essential for adapting to varying network conditions [39]. The experimental setup also included a single-channel LoRa gateway, configured to operate at a frequency of 915 MHz to ensure compatibility with the Reyax RYLR998 module. This gateway was used to facilitate communication between the transmitter and the network, enabling the evaluation of packet loss and interference under controlled conditions. The choice of the Reyax RYLR998 module, instead of utilizing the LoRa functionality integrated into certain ESP32 boards (e.g., Heltec or TTGO models), was motivated by several factors. Firstly, the RYLR998 module provides a simplified AT command interface, which streamlines configuration and facilitates direct control over critical parameters such as transmission power and spreading factor. Secondly, using an external module offers greater flexibility for expanding the experimental setup, as it allows for interoperability with other microcontroller platforms beyond the ESP32. Additionally, this approach ensures consistency and reproducibility in experiments, as the RYLR998 module is widely adopted and provides standardized hardware performance. These considerations were critical for accurately validating the probabilistic model proposed in this study and ensuring its applicability to a broad range of LoRa network scenarios. The experimental setup was designed to utilize relatively short distances between the transmitter and the gateway, which may appear counterintuitive given that the long-range (LoRa) technology is being evaluated. However, this choice was intentional to ensure precise control over the environmental and interference factors affecting the communication. Testing under short-distance conditions allows for a more detailed and accurate analysis of key parameters such as packet loss, signal-to-interference ratio (SIR), and aggregated interference power (Iaverage). These controlled results can then be extrapolated to long-distance scenarios, as the LoRa signal propagation characteristics, governed by the path loss model and environmental conditions, remain consistent regardless of the physical distance. By focusing on short distances, this study isolates and evaluates the fundamental behavior of the proposed probabilistic model, providing a robust foundation for its application in scenarios requiring extended communication ranges, such as smart agriculture or wide-area sensor networks. Future work could validate these findings further by extending the experiments to real-world deployments over longer distances, incorporating additional environmental complexities to confirm scalability.

Figure 2.
Experimental setup using Reyax RYLR998.
In the experimental setup shown in Figure 3, the ESP32 was mounted on a protoboard to construct the circuit. The circuit was distributed across four separate protoboards to demonstrate the experiment effectively. The ESP32 was programmed to function as a server, enabling seamless communication and configuration of the Reyax RYLR998 modules. A custom real-time interface was developed to dynamically adjust key transmission parameters, including spreading factor, bandwidth, and power levels. This system, illustrated in Figure 4, displays all the parameters measured during the experiment. The interface not only streamlined the configuration process but also facilitated rapid prototyping and testing of various communication scenarios, enhancing the overall experimental efficiency and adaptability.

Figure 3.
Experimental deployment.
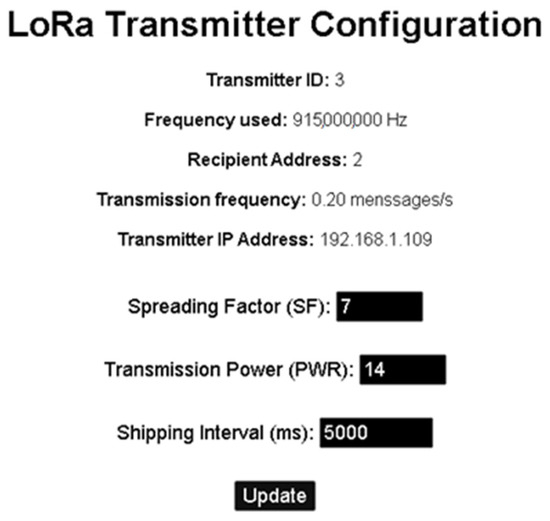
Figure 4.
Interface used to control each ESP32.
To monitor the performance and reliability of the network in real time, a web-based dashboard was implemented. The dashboard, built using modern web development frameworks, was connected to an SQL database that logged all transmitted and received data. This allowed for continuous tracking of packet success rates, RSSI values, and interference metrics. The use of a database ensured that data could be easily queried and analyzed for trends and anomalies, providing valuable insights into network performance [28].
The first experiment aimed to evaluate the system’s behavior in a controlled environment over a 10-min period. The setup included multiple Reyax RYLR998 modules transmitting packets to a central gateway managed by the ESP32. The transmission interval was set to 1000 ms (1 packet per second), and key parameters such as transmission power and spreading factor were adjusted to study their impact on packet loss and network reliability. The experimental data were visualized on the dashboard, providing a clear representation of the system’s performance. Table 1 provides a detailed summary of the transmission results obtained over a 10-min experimental period, showcasing the performance of the transmitters in terms of the number of data points transmitted, success probability (SP), and average RSSI. These results offer valuable insights into the behavior of the network under the tested conditions and highlight key aspects of the performance of the model and devices used [29].

Table 1.
Transmission results obtained over a 10-min period.
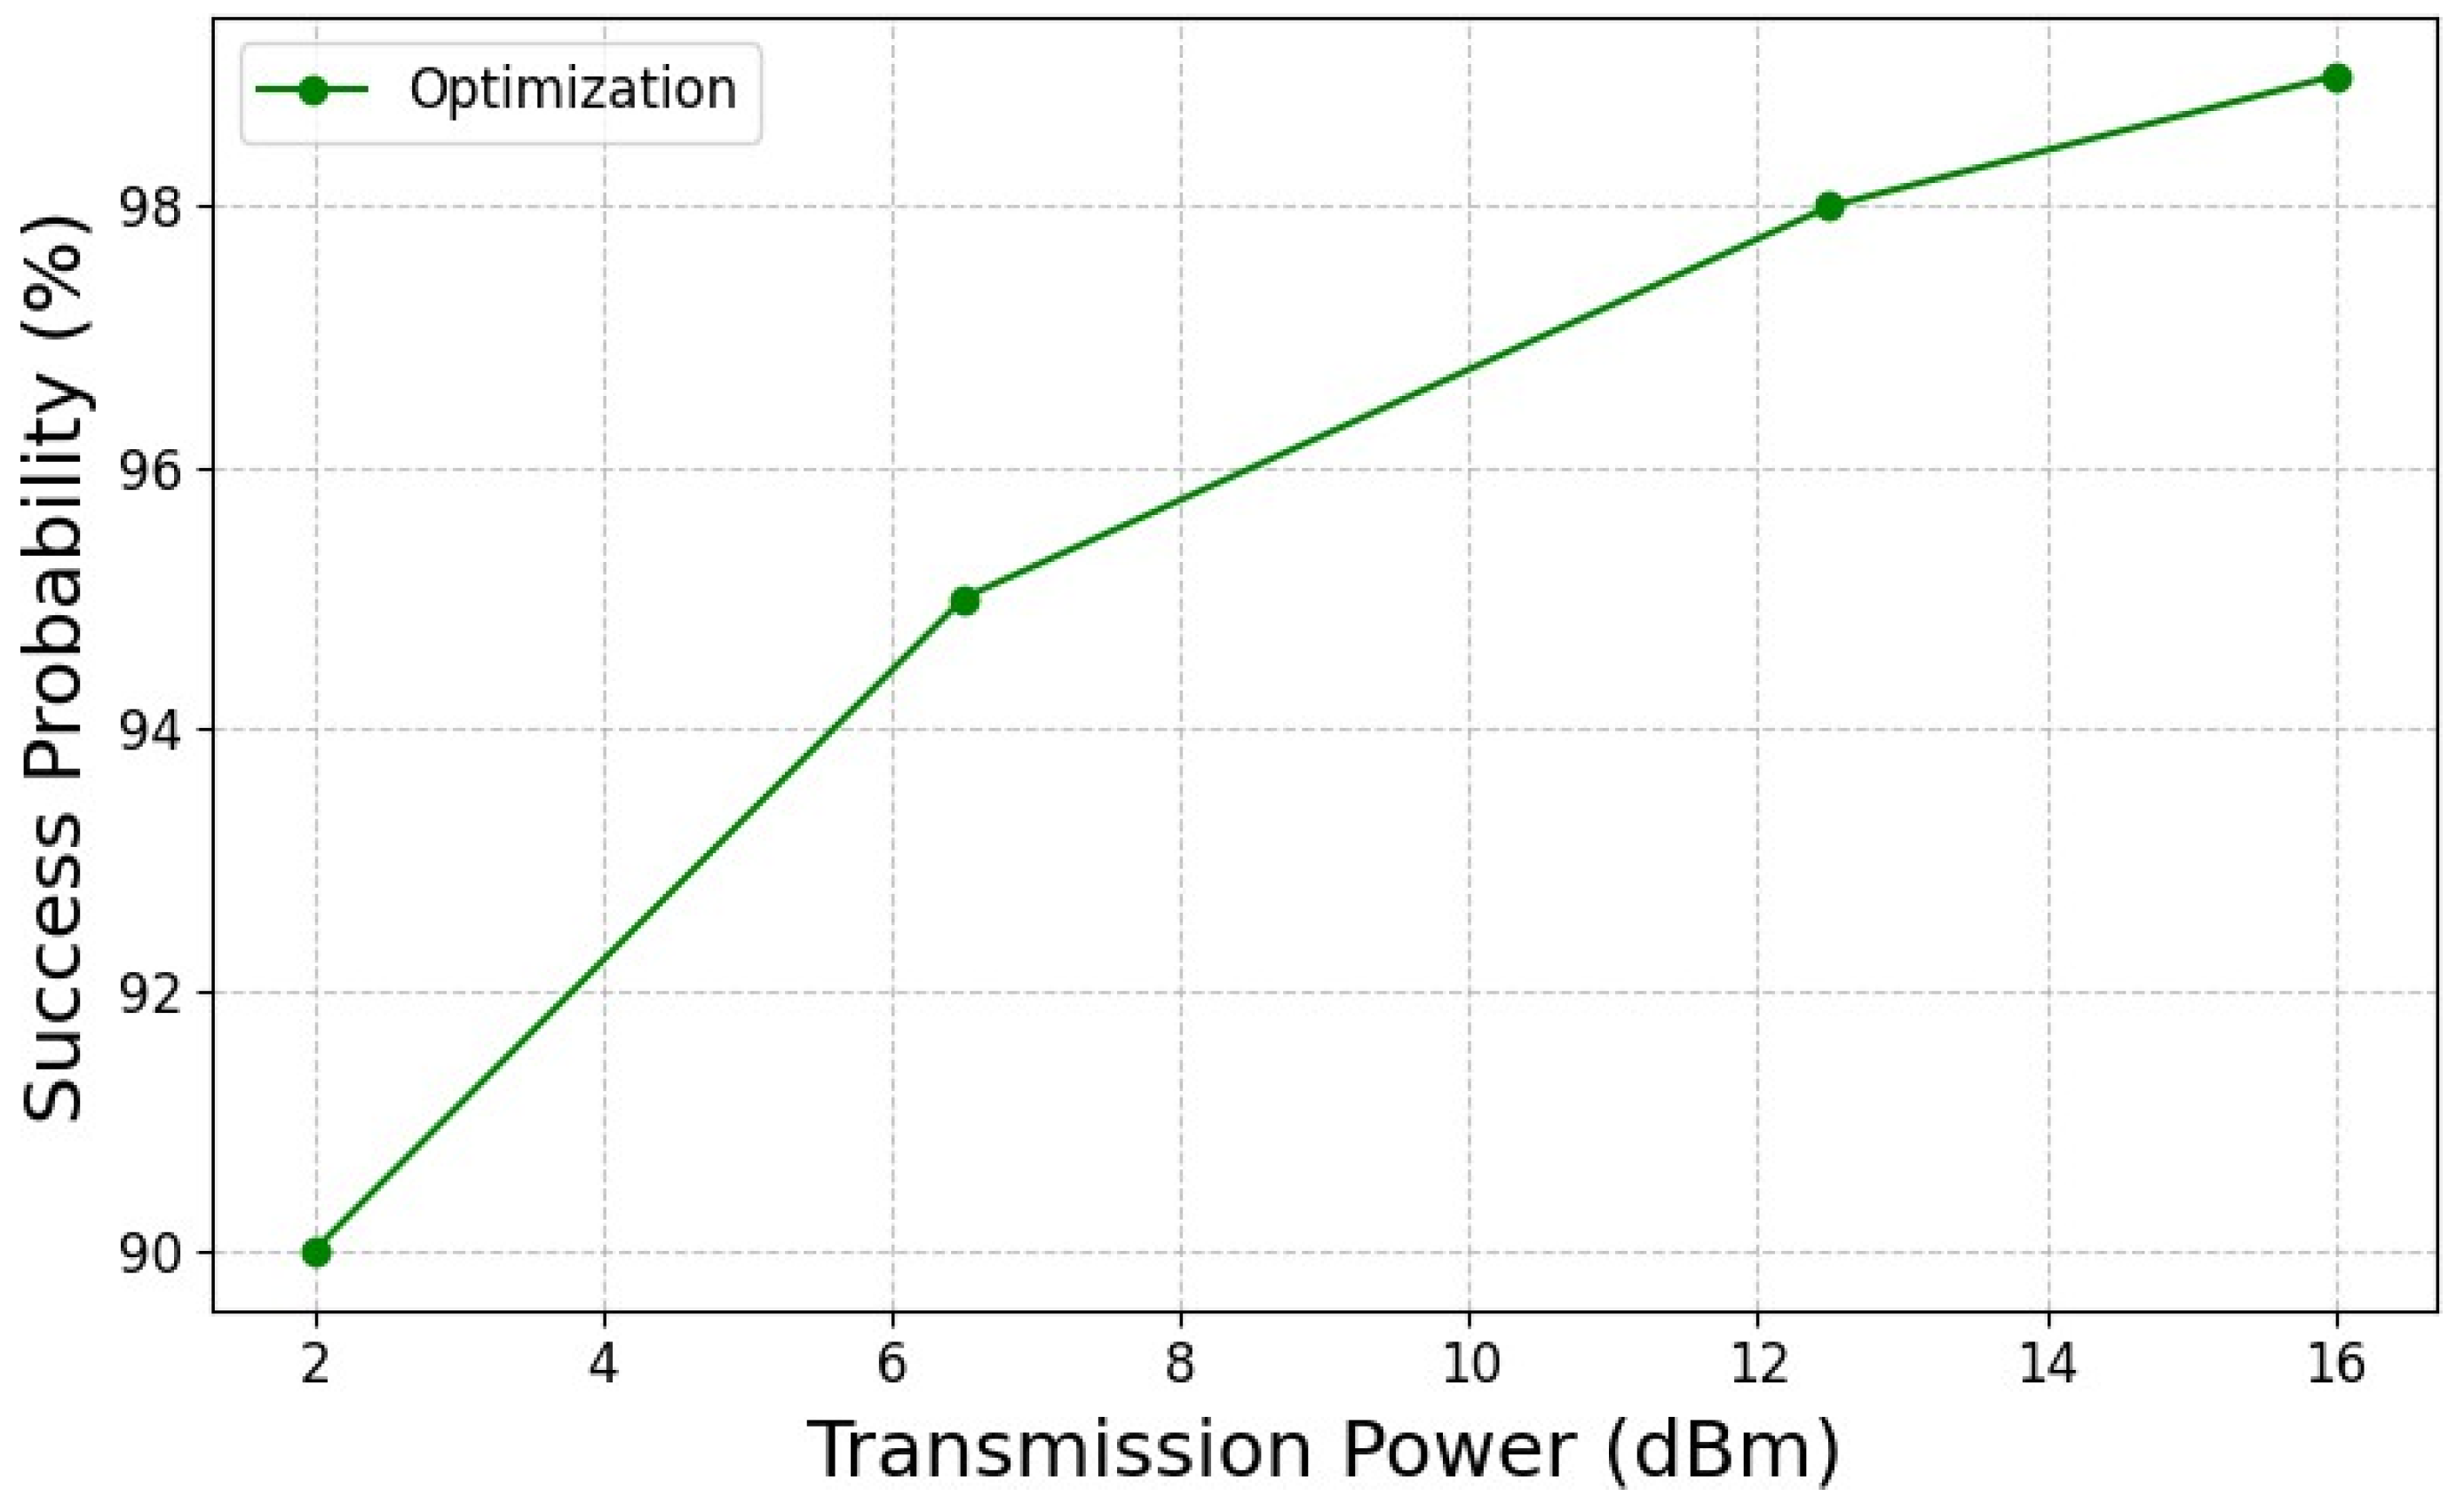
Transmitters 1 and 3 exhibited an identical performance, each successfully transmitting 63 data points with a success probability of 87.5% and achieving average RSSI values of −43 dBm and −41 dBm, respectively. These values indicate a relatively high level of reliability, although some packet losses occurred due to interference or other factors such as path loss variability. The consistency in their performance suggests that the experimental setup provided stable conditions, allowing these devices to operate with comparable efficiency. On the other hand, transmitters 4 and 5 demonstrated optimal performance, achieving a 100% success probability by transmitting 72 data points each without any packet losses. Their respective average RSSI values, −47 dBm and −46 dBm, reflect strong and stable signal strengths at the receiver. The superior performance of these transmitters could be attributed to several factors, including their proximity to the gateway, favorable environmental conditions, or reduced interference during their operation. These observations underscore the potential of carefully calibrated transmission parameters to maximize network reliability. The data from the table confirm that the model’s predicted success probabilities tended to overestimate the actual outcomes, particularly for transmitters 1 and 3. Despite this, the model still enabled the system to achieve high reliability, with most packets being successfully transmitted as expected. This slight overestimation suggests room for refinement in the interference and path loss modeling, especially under varying network densities or environmental conditions. The results also highlight the relationship between success probability and the average RSSI values. Transmitters with lower RSSI values (e.g., transmitters 4 and 5) achieved perfect success rates, emphasizing the robustness of the LoRa modulation scheme even under conditions of moderate signal attenuation. This finding aligns with the theoretical expectations of LoRa technology, where its inherent resistance to interference allows for reliable communication over extended ranges. From a broader perspective, these findings reinforce the importance of optimizing transmission parameters, such as power levels and spreading factors, to adapt to the specific conditions of a network deployment. By tuning these parameters, the system can achieve higher reliability while minimizing energy consumption, an essential consideration for IoT applications. In conclusion, the table demonstrates the effectiveness of the proposed model in maintaining high success probabilities across all tested transmitters. While there is room for further refinement of the model to reduce overestimation, the results validate its applicability for real-world LoRa deployments. Future experiments could expand on these findings by testing in environments with higher node densities, increased interference, or greater distances from the gateway to further evaluate the robustness of the model and the network’s scalability. Figure 5 depicts the relationship between transmission power (measured in dBm) and the success probability of transmitted packets (expressed as a percentage). This graph provides critical insights into the effect of varying transmission power on the reliability of the communication in the experimental setup described in the article.
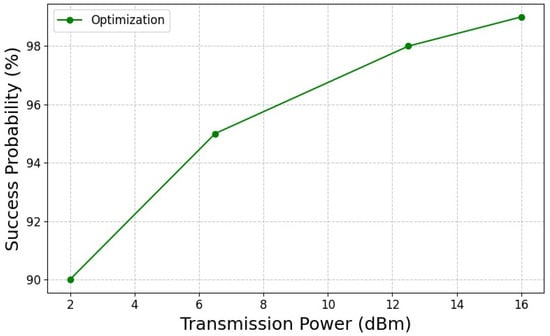
Figure 5.
Transmission power in relation to success probability.
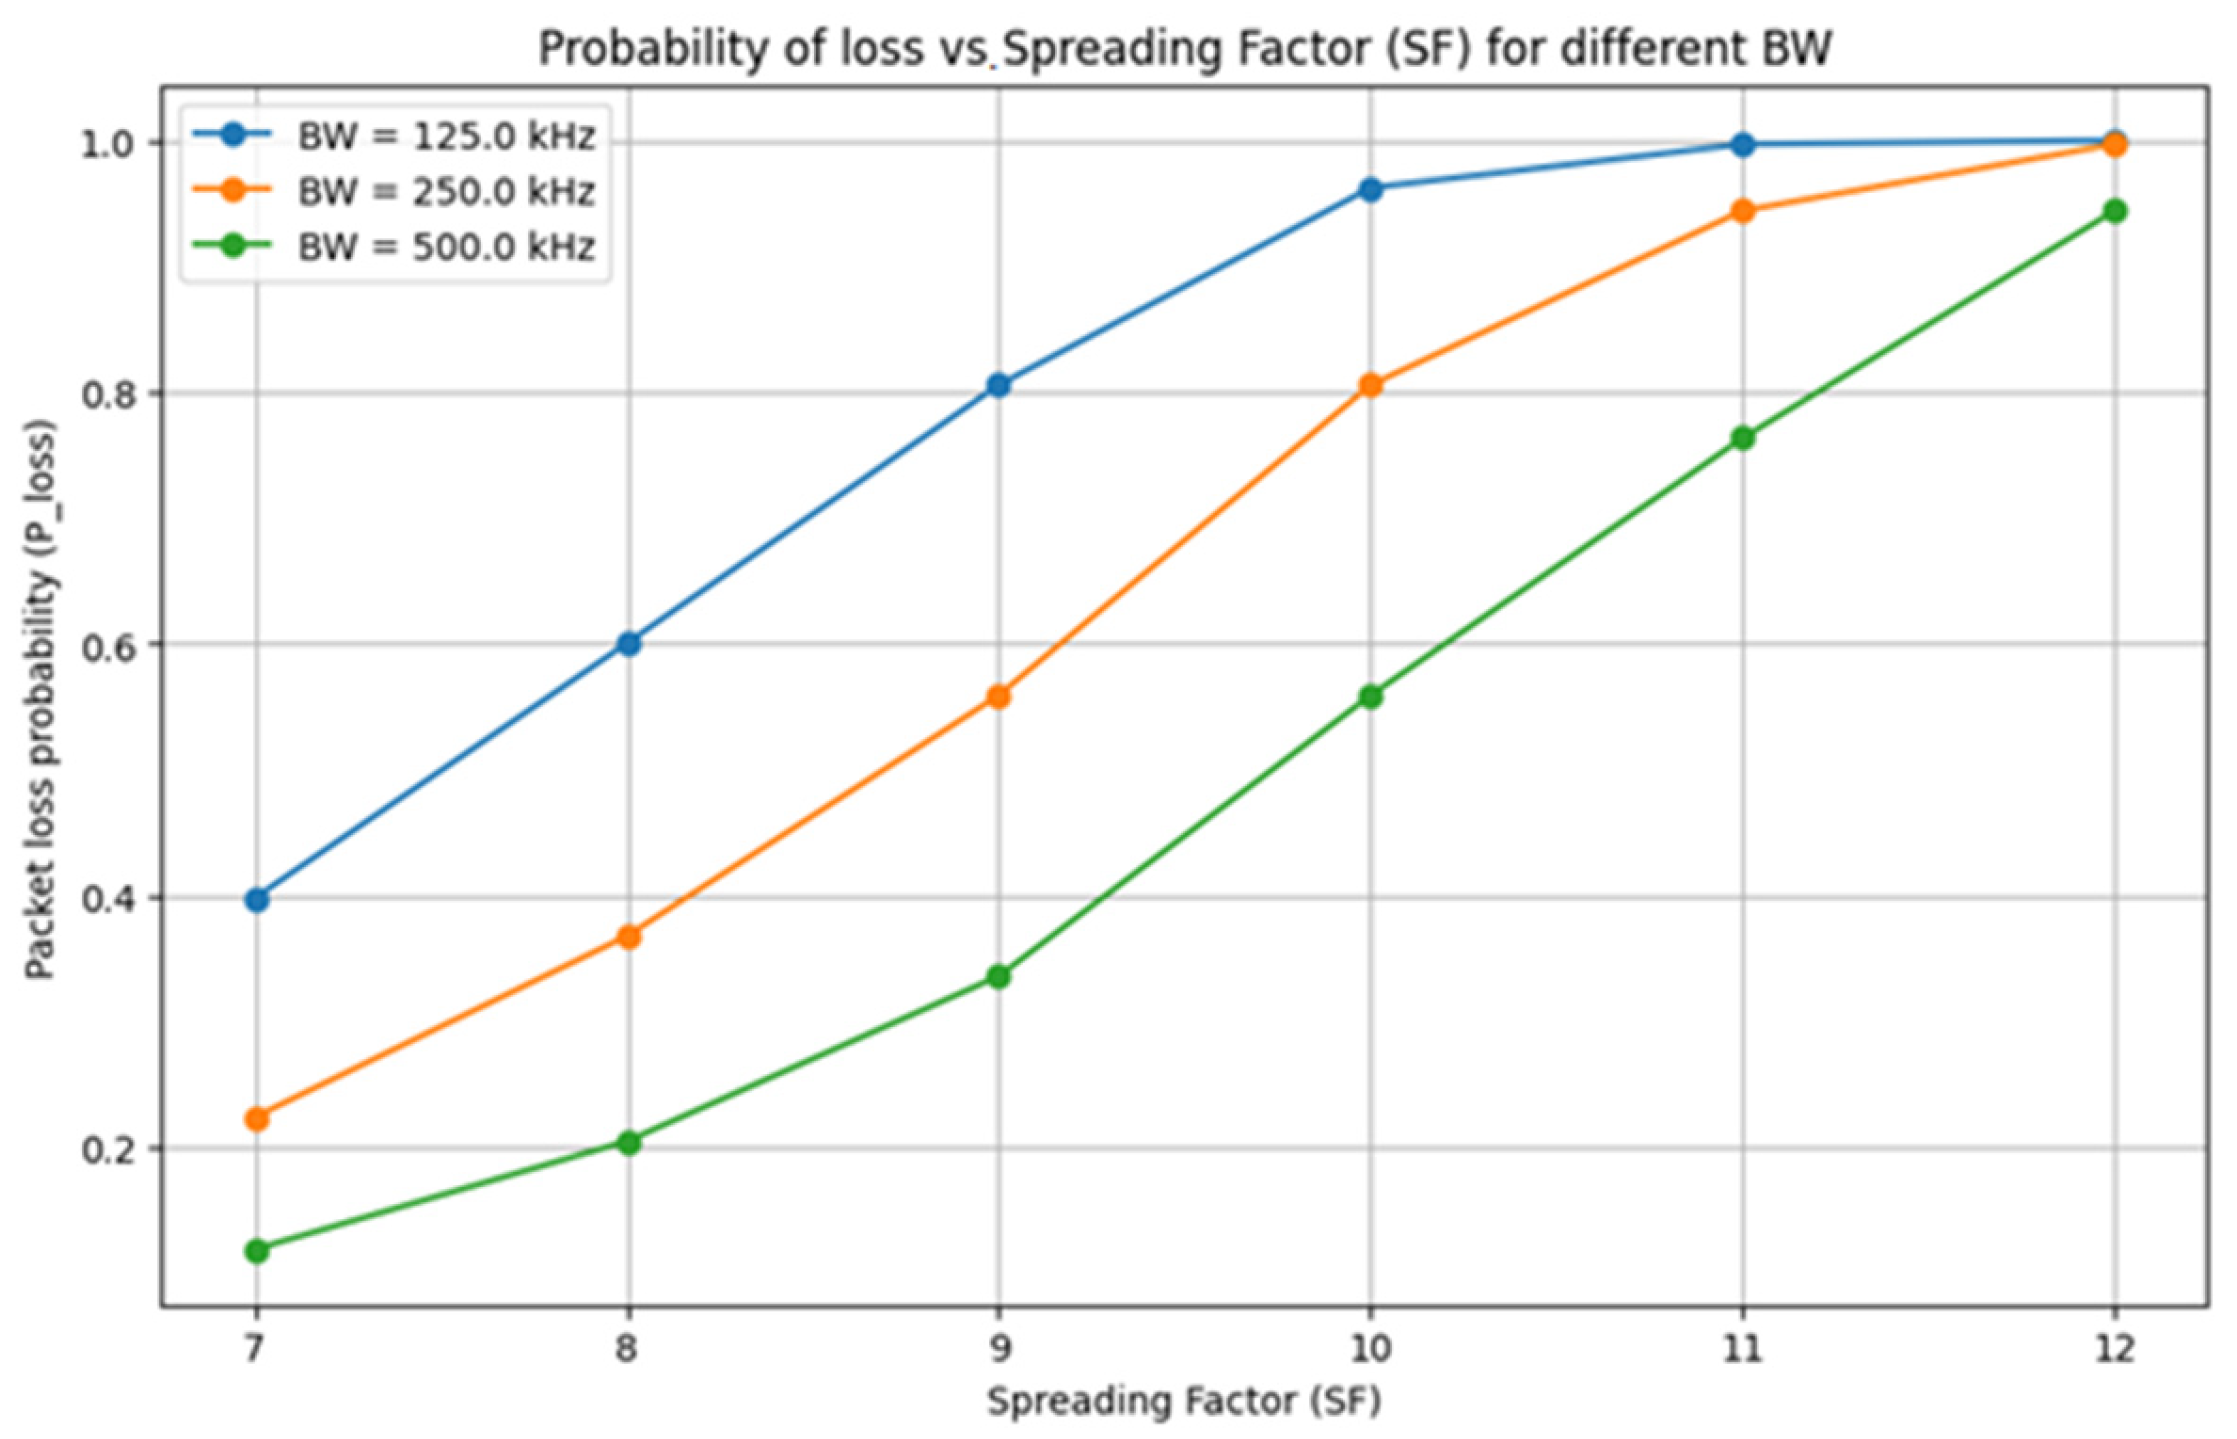
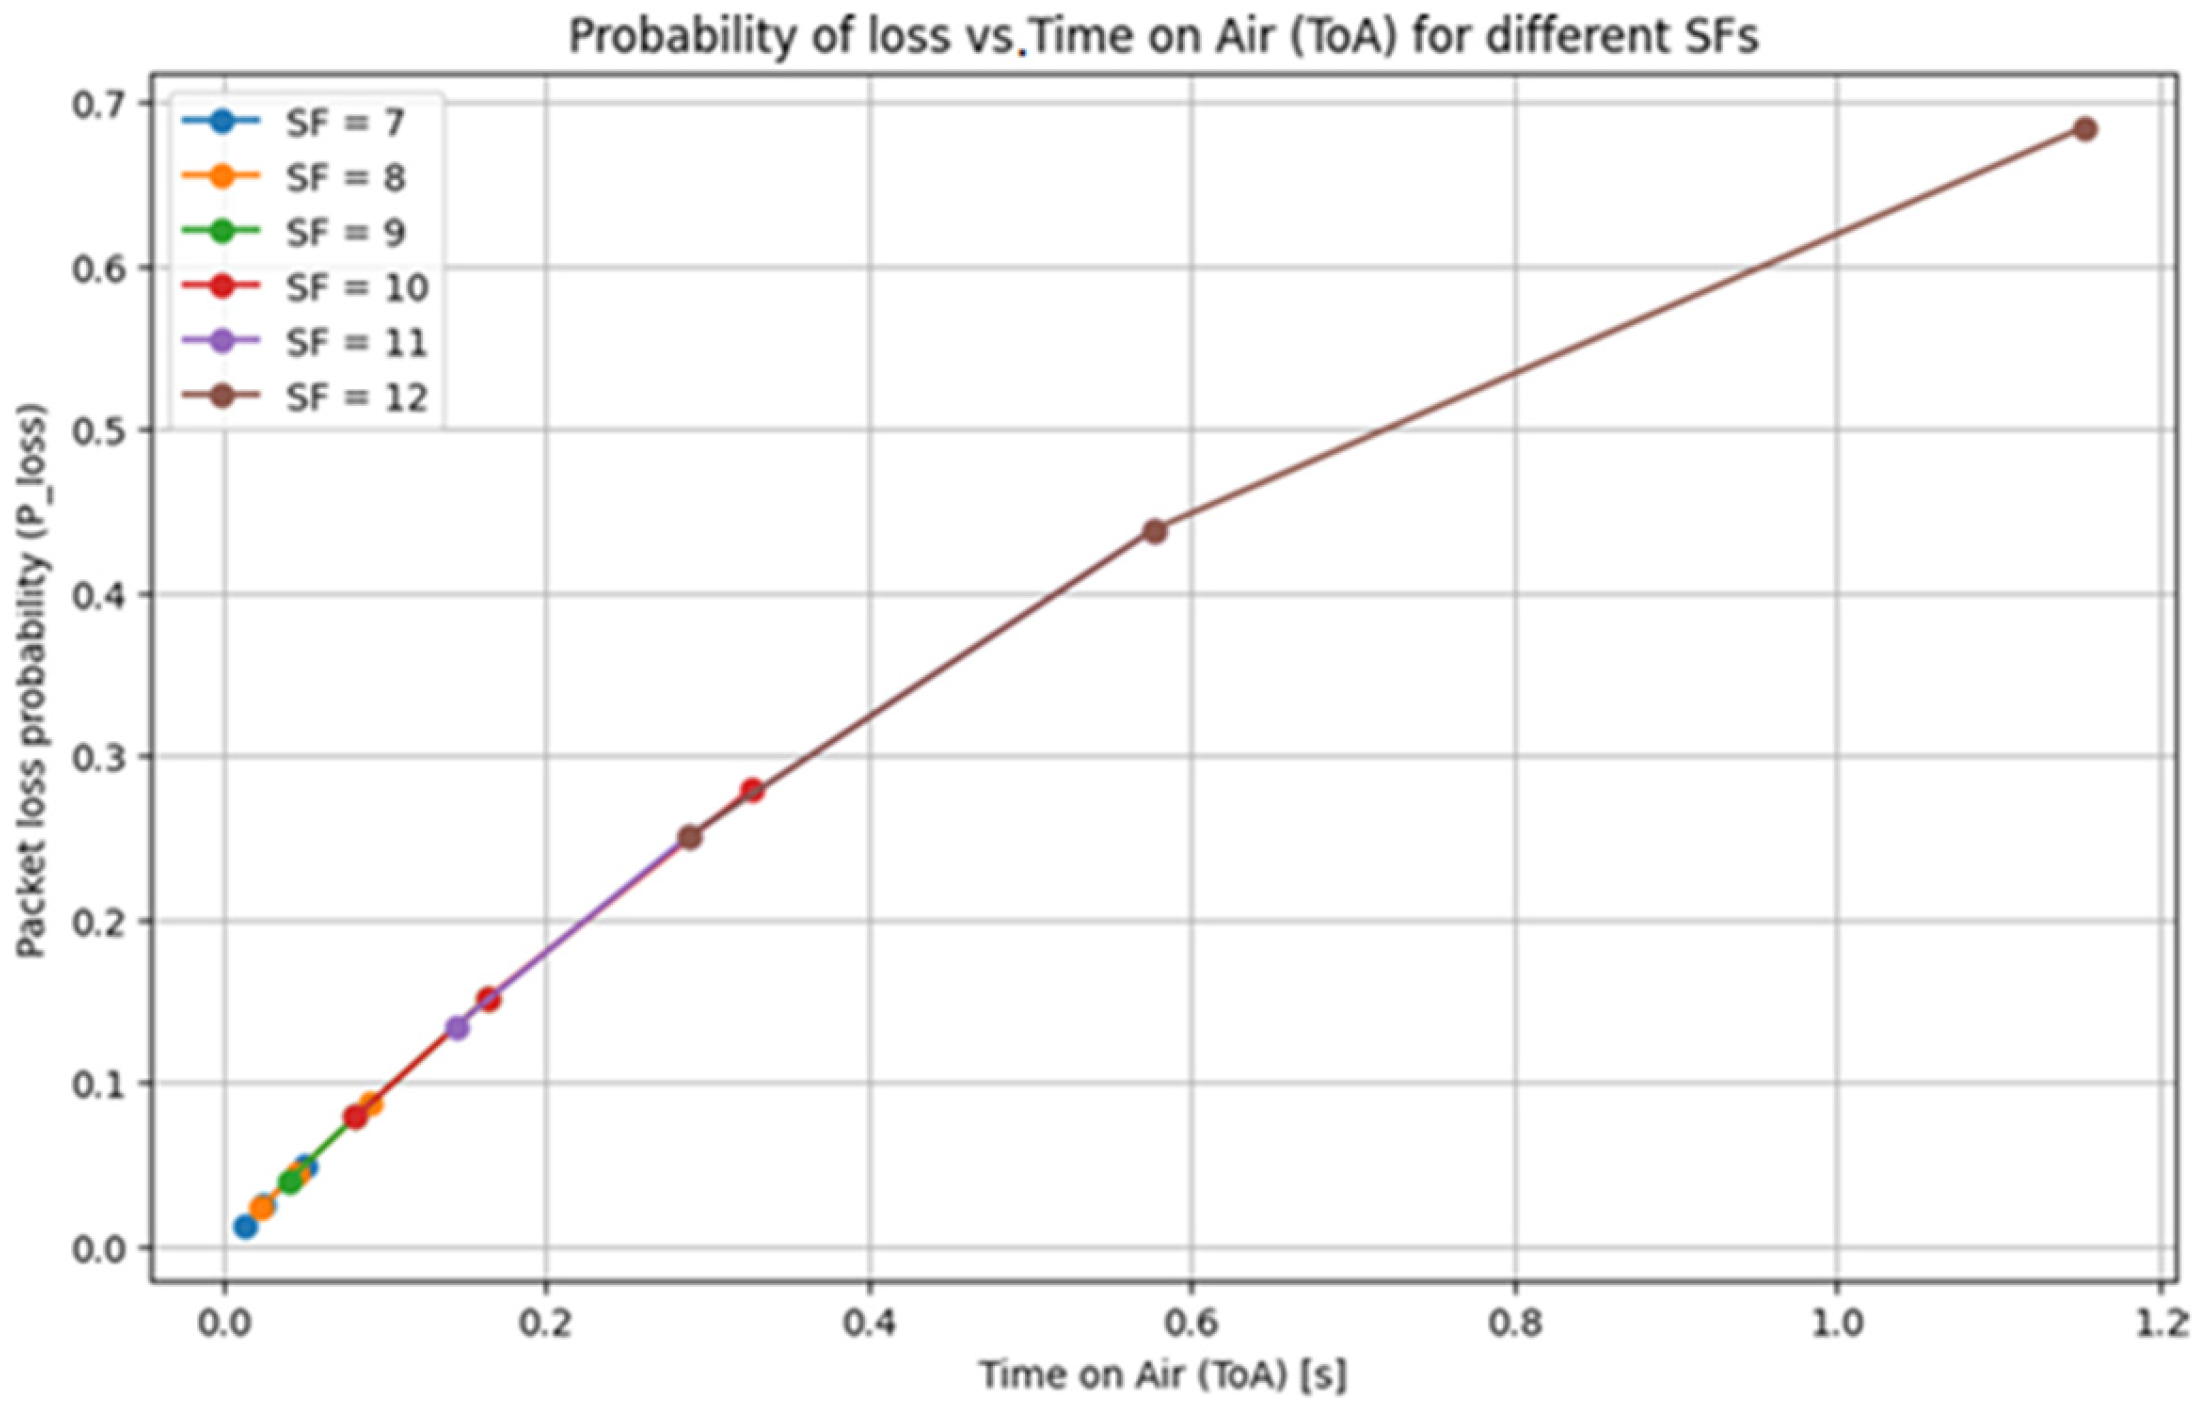
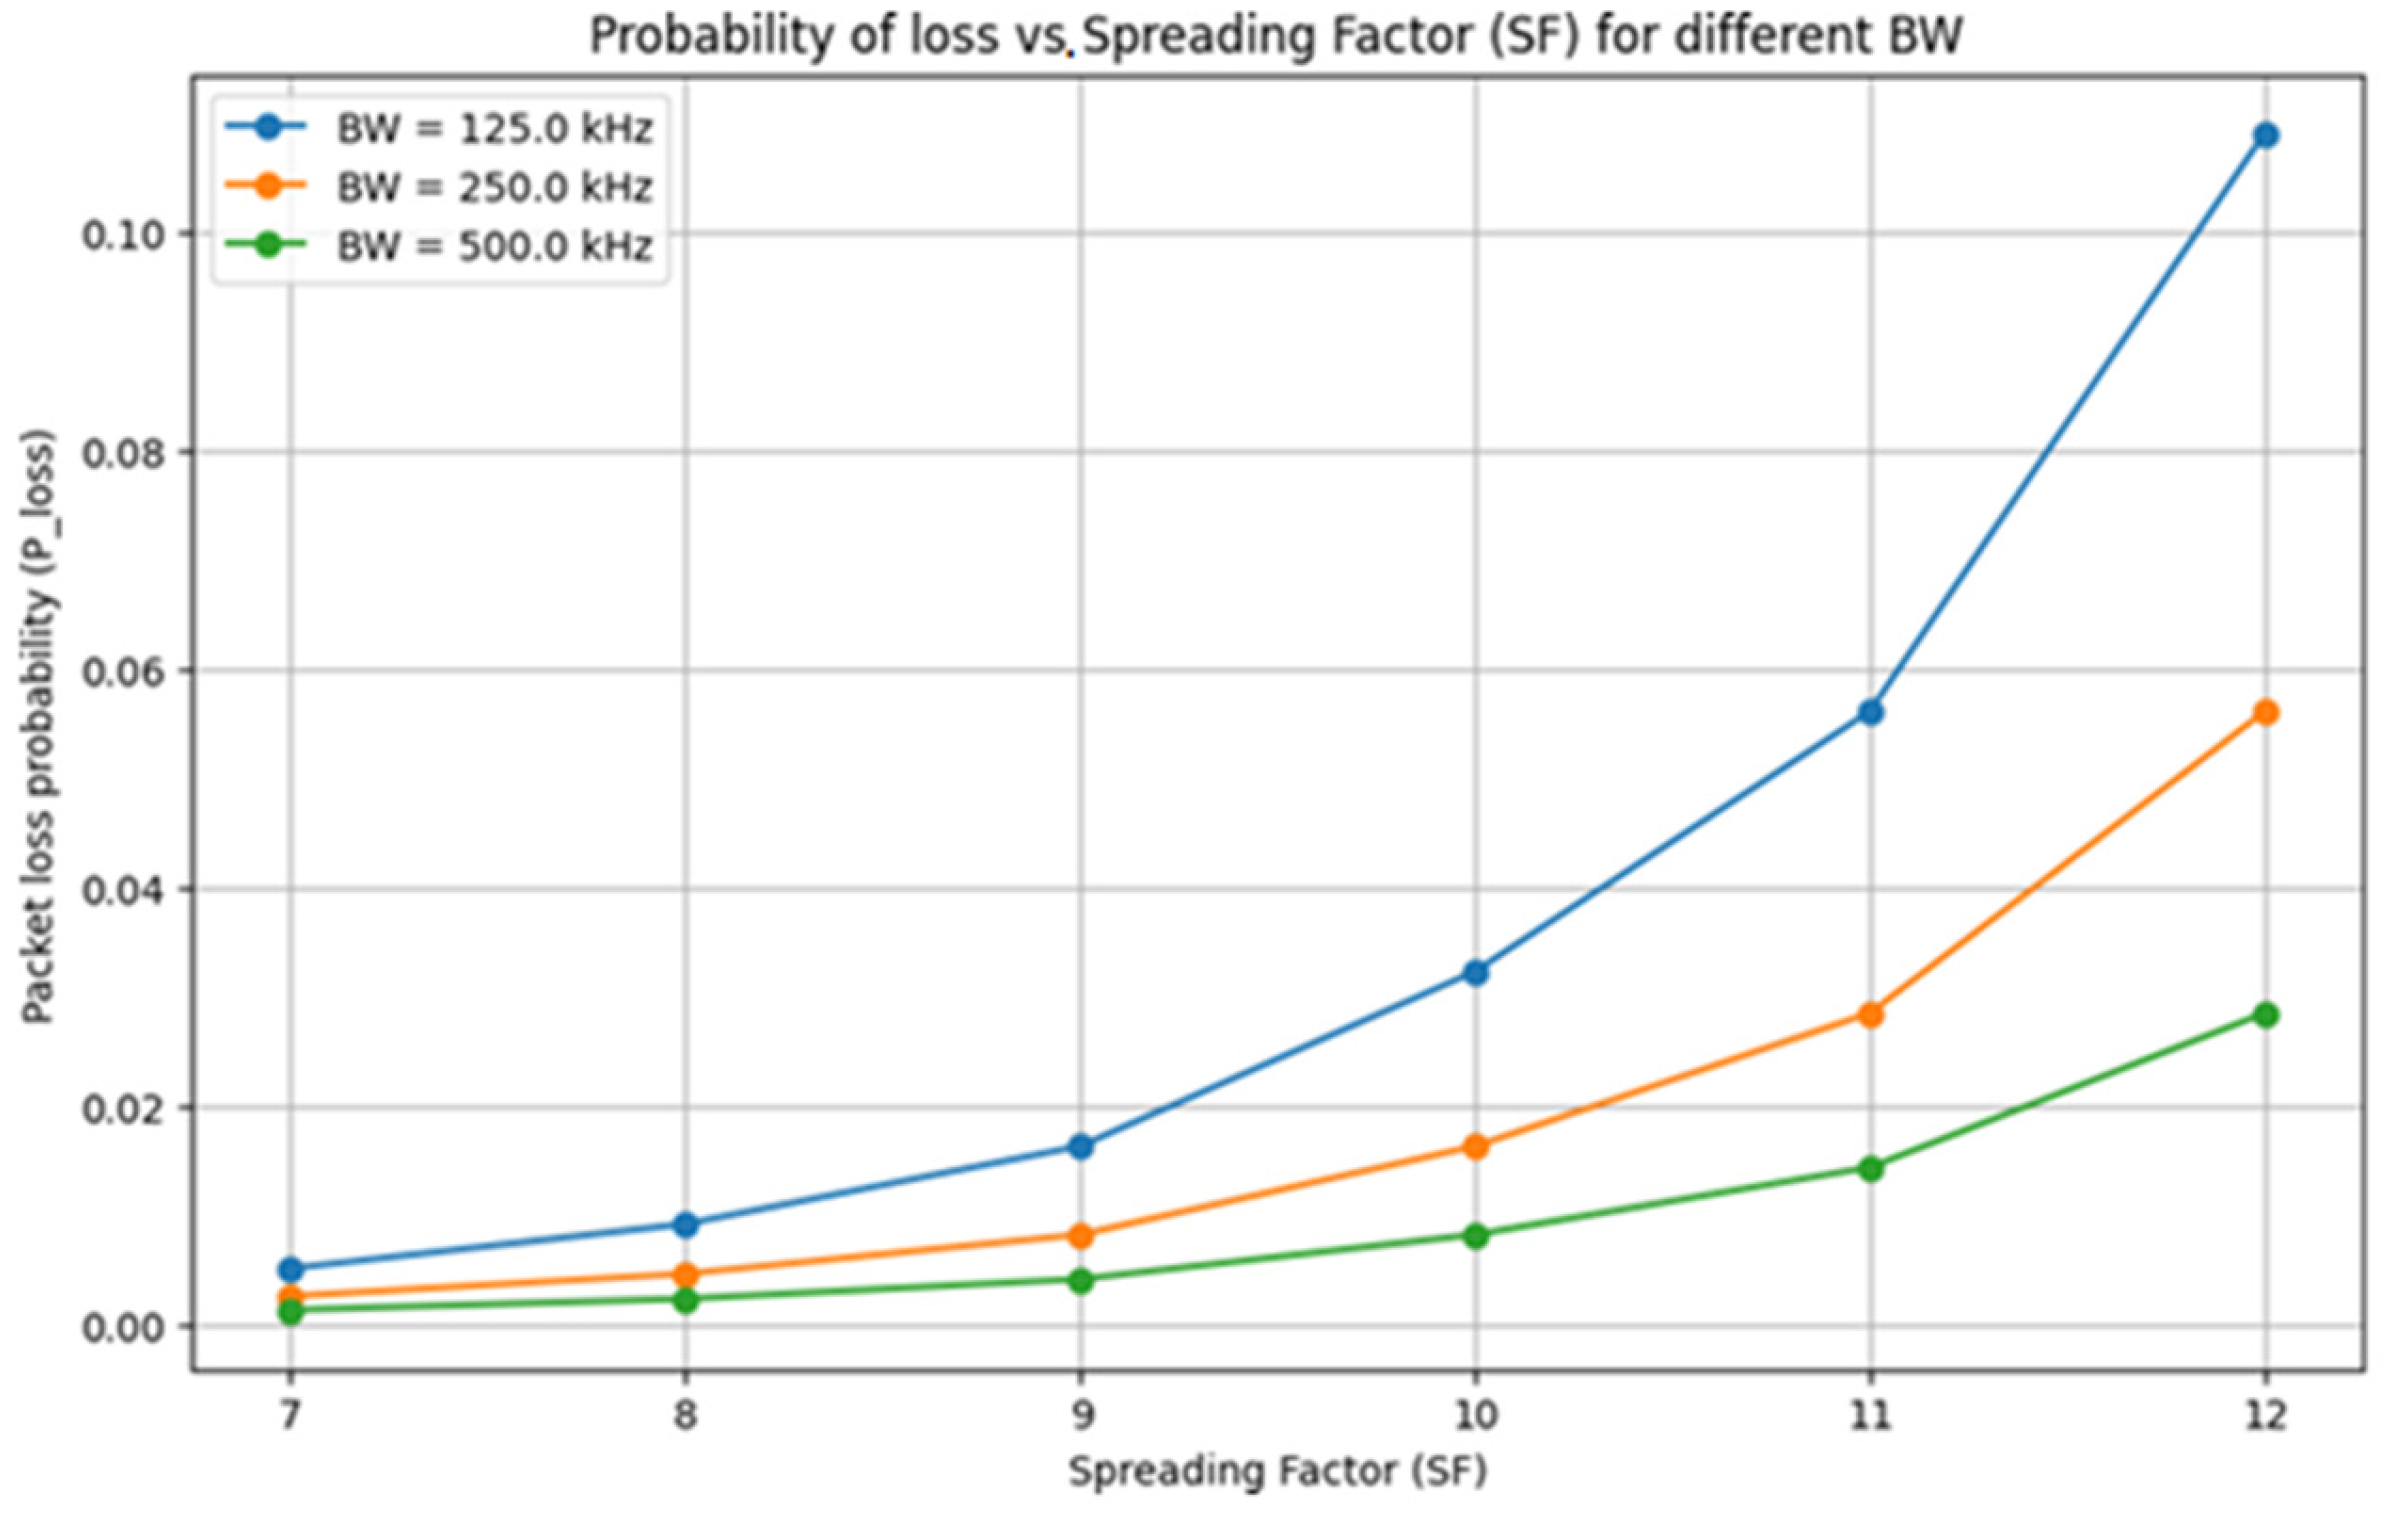
The trend shown in Figure 5 is a clear positive correlation between transmission power and success probability. At the lowest transmission power of 2 dBm, the success probability is approximately 90%. This relatively low value suggests that at minimal transmission power levels, factors such as path loss, interference, and signal attenuation significantly reduce the likelihood of successful packet delivery. However, as the transmission power increases, the success probability also rises, indicating improved reliability of the communication link. At a transmission power of 6 dBm, the success probability increases to around 94%. This marks a notable improvement, demonstrating that even a moderate increase in power can enhance the robustness of the communication link. The improvement in success probability between 6 dBm and 12 dBm is similarly pronounced, with the success rate reaching approximately 96%. This further supports the hypothesis that higher transmission power mitigates the negative effects of environmental factors and interference on packet delivery. At the highest transmission power level of 16 dBm, the success probability in LoRa-based networks reaches near-optimal performance, approaching 98%, demonstrating the reliability of the LoRa modulation scheme under elevated power levels and the model’s ability to optimize communication parameters for maximum efficiency. However, the diminishing returns observed between 12 dBm and 16 dBm suggest a threshold beyond which further increases in transmission power provide minimal improvements in success probability. This insight underscores the importance of balancing transmission power with other critical factors such as energy consumption and network scalability. While higher transmission power enhances success probability, it also increases energy usage, which is a significant consideration for battery-powered IoT applications. The ability to achieve a success probability of 94–96% at moderate power levels (e.g., 6–12 dBm) highlights an optimal range where reliability and energy efficiency are balanced. This trend aligns with theoretical models of wireless communication, where received signal strength is proportional to transmission power under constant conditions, but it also reveals the influence of environmental factors and interference, as evidenced by the sub-optimal success probability at lower power levels. These findings emphasize the critical role of transmission power selection in LoRa-based networks, particularly for ensuring reliable communication over long distances or in challenging environments with high interference levels. In addition to transmission power, other key parameters such as the spreading factor (SF), bandwidth (BW), and Time on Air (ToA) also play a crucial role in determining the reliability and efficiency of LoRa networks. Figure 6 and Figure 7 illustrate the relationship between the probability of packet loss and key LoRa network parameters, specifically the spreading factor (SF), bandwidth (BW), and Time on Air (ToA). These parameters play a critical role in determining the reliability and efficiency of LoRa communications, particularly in dense network deployments where interference and packet collisions are more likely to occur. In Figure 6, the probability of packet loss is plotted against the spreading factor (SF) for different bandwidth (BW) values. The results show that as the SF increases, the Time on Air (ToA) also increases significantly. This is because a higher SF results in longer symbol durations, which extends the transmission time of each packet. As a consequence, packets are more exposed to potential interference from other transmissions, leading to a higher probability of packet loss. For example, at SF = 12 and BW = 125 kHz, the probability of packet loss is notably higher compared to SF = 7 under the same BW. This trend is consistent across all BW values, although the impact is more pronounced at narrower bandwidths (e.g., 125 kHz) due to the longer ToA. On the other hand, Figure 7 demonstrates how the bandwidth (BW) influences the probability of packet loss. A wider BW reduces the ToA, as data can be transmitted at a faster rate. This reduction in transmission time decreases the likelihood of packet collisions, thereby lowering the probability of packet loss. For instance, at BW = 500 kHz, the probability of packet loss is significantly lower compared to BW = 125 kHz, especially for higher SF values. However, it is important to note that while a wider BW improves transmission efficiency, it also reduces the receiver’s sensitivity. This trade-off may require higher transmission power to maintain reliable communication over longer distances or in environments with higher noise levels. Additionally, the impact of the packet arrival rate (λ) on network performance is evident in these results. As λ increases, the network experiences higher traffic loads, leading to more frequent packet collisions and a higher probability of packet loss. This effect is particularly noticeable in scenarios with longer ToA, such as those with higher SF values or narrower BW. For example, at λ = 1 packets per second, the probability of packet loss is significantly higher compared to λ = 0.1 packets per second, especially for SF = 12 and BW = 125 kHz as it is seen in Figure 8 and Figure 9 compared to Figure 10 and Figure 11. These findings underscore the importance of carefully selecting and balancing SF, BW, and transmission power to optimize LoRa network performance. In environments with high node density or high traffic loads, using a lower SF and a wider BW can help reduce the ToA and minimize packet collisions. However, in scenarios where long-range communication or higher receiver sensitivity is required, a higher SF and narrower BW may be necessary, despite the increased risk of packet loss. Adaptive algorithms that dynamically adjust these parameters based on real-time network conditions could further enhance the reliability and efficiency of LoRa networks.
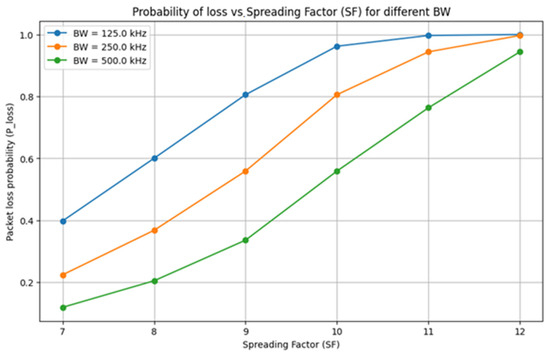
Figure 6.
The graph shows the packet loss probability () as a function of the spreading factor (SF) for different bandwidths (BW) in a LoRa network with λ = 10.
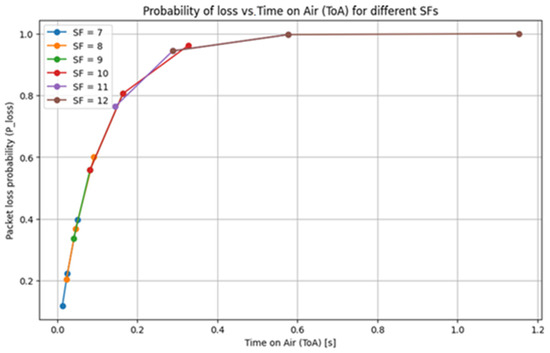
Figure 7.
The graph shows the relationship between packet loss probability () and time on air (ToA) for different spreading factors (SF) with λ = 10.
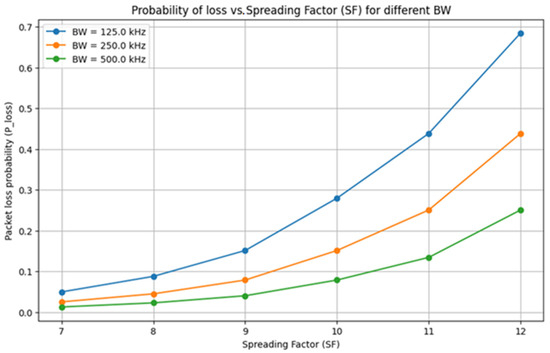
Figure 8.
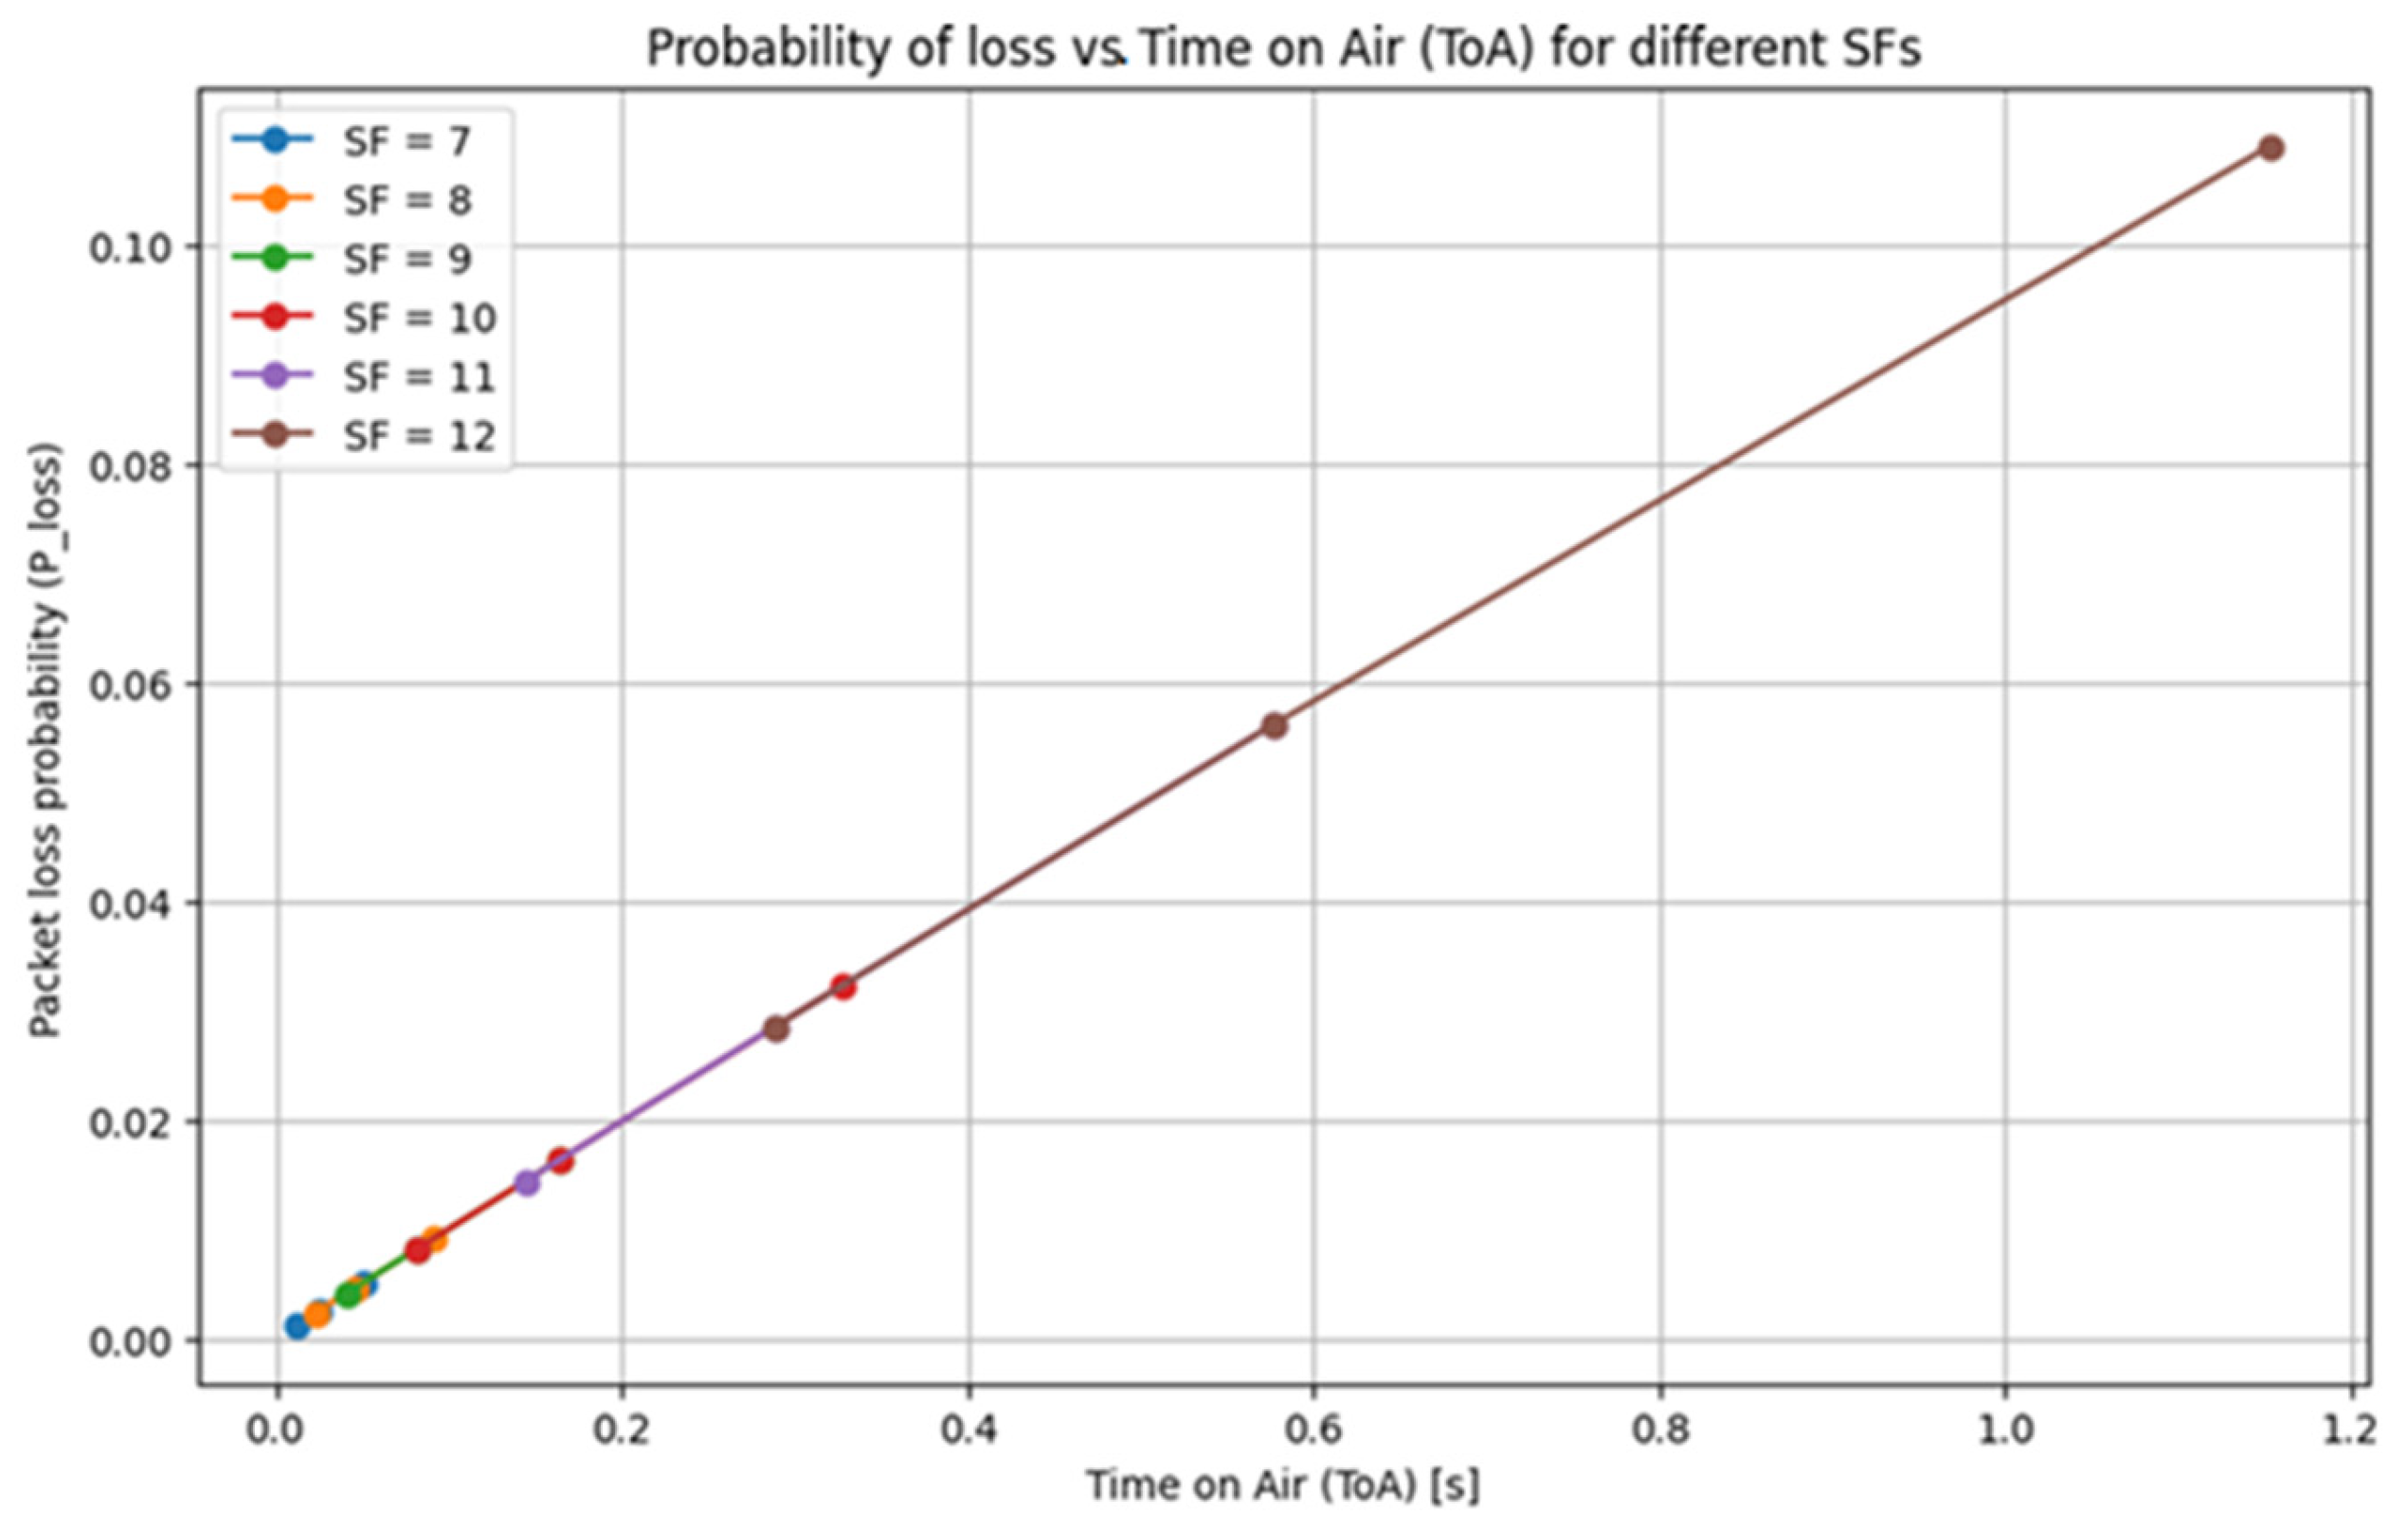
The graph shows the packet loss probability () as a function of the spreading factor (SF) for different bandwidths (BW) in a LoRa network with λ = 1.
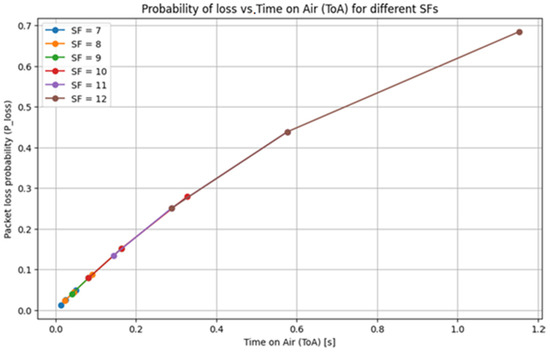
Figure 9.
The graph shows the relationship between packet loss probability () and time on air (ToA) for different spreading factors (SF) with λ = 1.
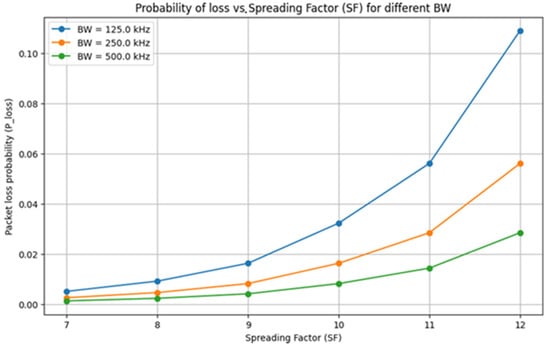
Figure 10.
The graph shows the packet loss probability () as a function of the spreading factor (SF) for different bandwidths (BW) in a LoRa network with λ = 0.1.

Figure 11.
The graph shows the relationship between packet loss probability () and time on air (ToA) for different spreading factors (SF) with λ = 0.1.
Beyond optimizing network performance, the choice of LoRa parameters also has a direct impact on energy consumption, which is a crucial factor in battery-powered IoT devices. To provide a comprehensive understanding of energy consumption in LoRa networks, the power usage of the Reyax RYLR998 is analyzed in the modules under different parameter configurations. To provide a comprehensive understanding of energy consumption in LoRa networks, we analyzed the power usage of the Reyax RYLR998 module under various parameter configurations. Energy consumption was measured using a high-precision power analyzer, and the results were recorded for different spreading factors (SFs), transmission power levels (PWR), and bandwidth settings (BW). The spreading factor (SF) significantly influences both the airtime of packets and the energy consumption of the device. Higher SF values result in longer airtimes, which increase the energy required for each transmission. This relationship is critical for battery-powered IoT devices, as selecting an optimal SF that balances communication range and energy efficiency is essential. In our experiments, we maintained a fixed payload size of 20 bytes (160 bits), which is typical for IoT applications such as environmental monitoring and smart agriculture. The airtime (Tairtime) for a LoRa packet can be calculated using the following formula:
where the payload size is 20 bytes (160 bits), CR represents the coding rate (e.g., 4/5), SF denotes the spreading factor, and BW corresponds to the bandwidth (e.g., 125 kHz). Using this formula, we computed the airtime for different SF values, as shown in Table 2. For example, with SF = 7 and BW = 125 kHz:
Table 2.
Energy consumption for different spreading factors.
The energy consumption per packet (Epacket) was then calculated using the formula:
where Ptx is the transmission power in watts. For a fixed transmission power of 14 dBm (0.0251 W), the energy consumption for SF = 7 is as follows:
Epacket = Ptx × Tairtime,
Epacket = 0.0251 W × 0.050 s = 0.75 mJ.
For battery-powered devices, selecting an optimal SF that balances range and energy consumption is crucial. Transmission power (PWR) is another critical parameter that affects energy consumption. Higher transmission power levels improve signal strength and reliability, but also increase energy usage. Table 3 presents the energy consumption for different PWR levels, with a fixed SF of 7 and a bandwidth of 125 kHz.
Table 3.
Energy consumption for different transmission power levels.
The data in Table 3 demonstrate that increasing the transmission power from 2 dBm to 18 dBm results in a four-fold increase in energy consumption per packet. This underscores the importance of optimizing transmission power to achieve a balance between communication reliability and energy efficiency, especially in battery-powered devices. While transmission power directly influences energy consumption, bandwidth (BW) also plays a crucial role by affecting both the data rate and receiver sensitivity. Lower bandwidth settings increase the airtime of packets, leading to higher energy consumption. Table 4 shows the energy consumption for different BW settings, with a fixed SF of 7 and a transmission power of 14 dBm.
Table 4.
Energy consumption for different bandwidth settings.
As evident from Table 4, increasing the bandwidth reduces the airtime and, consequently, the energy consumption per packet. However, higher bandwidth settings may reduce the receiver’s sensitivity, potentially requiring higher transmission power to maintain reliable communication. Therefore, selecting an appropriate bandwidth is essential for optimizing energy efficiency in LoRa networks. To further analyze these effects in a real-world setting, the energy consumption of the Reyax RYLR998 module was evaluated under varying traffic loads. The module was configured with an SF of 9, a transmission power of 14 dBm, and a bandwidth of 125 kHz. The energy consumption was measured over a 24-h period, with the device transmitting one packet every 10 min.
The results in Table 5 indicate that energy consumption scales linearly with the number of transmitted packets. In low traffic scenarios, the device consumes minimal energy, making it suitable for long-term deployments. However, in high traffic scenarios, the energy consumption increases significantly, which could reduce the battery life of the device. This emphasizes the need for adaptive power management strategies, such as dynamic adjustment of transmission parameters based on traffic conditions, to optimize energy usage in battery-powered LoRa devices. These findings highlight the critical role of parameter selection in managing energy consumption, providing valuable insights for optimizing LoRa networks in battery-powered IoT applications. By carefully selecting the spreading factor, transmission power, and bandwidth, network designers can achieve a balance between communication reliability and energy efficiency. Additionally, adaptive strategies, such as dynamic parameter adjustment based on traffic conditions, can further enhance the energy efficiency of LoRa networks, extending the operational lifetime of battery-powered devices. While optimizing energy consumption is crucial for battery-powered LoRa devices, it is also essential to assess the LoRa performance over extended distances. To evaluate the LoRa performance over extended distances, additional simulations and practical experiments were conducted. The distances considered ranged from 500 m to 5 km, simulating ideal line-of-sight (LoS) conditions. Practical experiments were performed in an open-field environment to validate the simulation results. The following distances were tested: 500 m, 1 km, 2 km, and 5 km. Both simulated and practical results are summarized in Table 6. The practical results were obtained using the Reyax RYLR998 module configured with a spreading factor (SF) of 12, a bandwidth (BW) of 125 kHz, and a transmission power of 14 dBm. These settings were chosen to maximize communication range while maintaining reliable performance under real-world conditions.
Table 5.
Energy consumption in real-world scenarios.
Table 6.
Simulation and practical results for longer distances.
The results show that LoRa maintains high performance in long-range applications. At distances between 500 m and 2 km, the RSSI remains significantly higher than the threshold of −120 dBm, ensuring a success probability of 100%. Even at extended distances of 5 km, although the RSSI decreases to −91.65 dBm, the success probability remains high at 83.38%. In the practical experiment, the RSSI also remains significantly higher than the sensitivity threshold as expected in the simulation. Even at extended distances of 5 km, although the RSSI decreases to approximately −91.65 dBm, the success probability remains relatively high, reaching 78.20% in practical tests. This slight reduction in success probability at longer distances can be attributed to real-world factors such as multipath fading, environmental noise, and minor obstructions. These results confirm that the probabilistic model developed is not only applicable in short-range scenarios but also in long-range environments where the impact of path loss and RSSI is critical and reinforces the LoRa utility in applications such as precision agriculture and environmental monitoring. Building upon the insights gained from the results, it is important to consider how communication protocols, such as ALOHA, play a role in the performance of LoRa networks under varying conditions. ALOHA is a random access protocol used in LoRa networks to manage retransmissions in the absence of centralized coordination. The two main variants of ALOHA are Pure ALOHA, where nodes transmit at any time without checking the channel, which can lead to potential collisions, and Slotted ALOHA, where time is divided into slots, and transmissions occur only at the start of a slot, thereby reducing collisions. The probability of a successful transmission in these systems is given by the following:
where G is the average number of transmission attempts per time slot.
Psuccess = e−G
The maximum channel efficiency is as follows:
indicating that Slotted ALOHA performs better under higher loads.
The Table 7 summarizes the results obtained for each distance.
Table 7.
ALOHA success probability for different traffic loads.
The results show that LoRa maintains high performance in long-range applications, as in an effective range from 500 m to 2 km, the RSSI is significantly higher than the threshold, ensuring a success probability of 100%. At extended distances of up to 5 km, although the RSSI decreases, the success probability remains high, reaching 83.38%, demonstrating the LoRa robust capability for reliable communication over long distances. Furthermore, the results confirm that Slotted ALOHA significantly improves transmission success compared to Pure ALOHA, particularly under high traffic loads. These observations validate that the probabilistic model developed is not only applicable in short-range scenarios but also in long-range environments where path loss and RSSI play a crucial role, thus reinforcing the LoRa utility in applications such as precision agriculture and environmental monitoring. To strengthen these findings, additional experiments in real-world environments are recommended, considering factors such as the presence of physical obstacles and non-ideal conditions, as well as configurations with multiple gateways to extend the communication range. Additionally, it would be relevant to evaluate the impact of dynamic adjustments in parameters such as spreading factor (SF) and bandwidth (BW), along with more in-depth studies on the performance of the ALOHA protocol in LoRa networks with adaptive retransmission strategies. These future analyses could further reinforce the validity of the model and its applicability in wide-range LoRa networks.
4. Discussion
This study provides critical insights into the optimization and behavior of LoRa networks in dense deployment scenarios, focusing on packet loss, aggregate interference, and the signal-to-interference ratio (SIR). The key findings demonstrate that the proposed probabilistic models accurately predict packet loss rates and aggregated interference under moderate to high traffic loads. These results reinforce the importance of interference modeling in LoRa networks, particularly in dense environments where overlapping transmissions lead to frequent packet collisions. By integrating probabilistic interference models into the optimization of transmission power, this work advances existing methodologies. The optimization framework not only reduces energy consumption but also maintains network reliability, aligning with the findings of Reynders et al. [6], who emphasized the importance of adaptive power control in LoRa systems. Our approach, however, extends prior research by treating interference as a stochastic process and incorporating cumulative distribution functions (CDFs), providing a more nuanced understanding compared to the deterministic models used in earlier studies, such as those by Magrin et al. [5]. The implications of these findings extend beyond theoretical modeling. The use of ESP32 and Reyax RYLR998 modules in controlled experiments validated the practical applicability of the models, bridging the gap between theoretical advancements and real-world implementations. This study’s methodologies can be applied to other low-power wide-area networks (LPWANs) operating in unlicensed bands, offering potential applications in smart cities, precision agriculture, and environmental monitoring. Additionally, the integration of real-time monitoring through an SQL-connected dashboard demonstrates the feasibility of developing self-adaptive networks capable of dynamically adjusting to environmental and traffic conditions, enhancing resilience and performance in variable scenarios. Despite these promising contributions, certain limitations must be acknowledged. The experimental setup assumed a small number of transmitters and idealized environmental conditions, which may not fully reflect the complexities of large-scale, urban deployments. Furthermore, the optimization framework did not account for adaptive spreading factors or dynamic bandwidth allocation, which are critical for optimizing network performance under diverse conditions. Future research should address these limitations by exploring larger-scale deployments in complex environments, such as urban areas with high interference levels. Expanding the optimization framework to include adaptive spreading factors and dynamic bandwidth allocation could lead to more comprehensive performance improvements. Additionally, the integration of machine learning techniques could enhance the probabilistic models, enabling more accurate predictions of interference patterns and packet loss rates. Exploring multi-gateway systems is another promising direction, as such systems could improve network reliability and coverage by distributing the communication load, thereby reducing packet loss and improving energy efficiency. Another avenue for future research involves evaluating the proposed probabilistic model in the context of LoRaWAN, which offers additional mechanisms for improving packet delivery and network performance. LoRaWAN introduces features such as the Adaptive Data Rate (ADR), acknowledgments, and duty cycle regulations, which can mitigate packet loss in dense environments. For instance, the ADR dynamically adjusts transmission parameters like spreading factor and transmission power, potentially complementing the optimization framework proposed in this study. Furthermore, the LoRaWAN support for multi-gateway systems and downlink communication could enhance network scalability and reliability by reducing the impact of interference and optimizing resource allocation. Integrating these advanced features into the proposed model would provide a more comprehensive framework for improving LoRa-based networks, bridging the gap between simple LoRa configurations and the advanced capabilities of LoRaWAN. In summary, this work makes significant strides in advancing the understanding of interference modeling and optimization in LoRa networks. By combining theoretical models with practical validation, it provides actionable insights for network designers and highlights pathways for future research to further enhance the scalability and reliability of LoRa and other LPWANs.
5. Conclusions
A probabilistic analysis of packet loss in LoRa networks was conducted in this research, resulting in significant insights into optimizing network performance in small environments. The probabilistic model developed in this study predicted packet loss rates with high accuracy and optimized transmission power, ensuring efficient communication. Specifically, the model predicted an average interference power of Iaverage = 1.447 × 10⁻¹⁰ mW under the given experimental setup, which closely matched the simulated values and validated the model’s reliability. This accurate prediction allowed for a reduction in transmission power while maintaining packet success rates above 85% in scenarios with moderate to high traffic loads, demonstrating the model’s effectiveness in balancing energy efficiency and communication reliability. The study highlighted the importance of key parameters, such as transmission power, network density, and environmental conditions, in determining packet success rates. For example, the relationship between transmission power and success probability, as visualized in Figure 5, demonstrated that optimal power levels could significantly reduce energy consumption without compromising data integrity. Furthermore, under low traffic conditions, the model slightly overestimated interference due to a limited number of overlapping packets, identifying a limitation that future work should address by refining the aggregated interference calculations. A thorough understanding of path loss was also shown to be critical for optimizing LoRa networks. Accurate modeling of RSSI and SIR provided valuable insights for designing power-efficient systems that meet reliability requirements. The results emphasized the potential of dynamic power adjustment algorithms, which could respond to real-time fluctuations in path loss, further enhancing scalability and energy efficiency in LoRa networks. Expanding the scope of simulations to include larger-scale deployments and more complex environments, such as urban areas with high interference levels, would further validate the scalability and applicability of the proposed model. In conclusion, the findings of this study provide a robust foundation for optimizing the performance and reliability of LoRa networks. By accurately predicting packet loss rates and optimizing transmission power, the probabilistic model developed here offers a practical and energy-efficient approach to enhancing communication in dense, low-power wide-area networks.
Author Contributions
Conceptualization, J.L.R.V. and A.G.-B.; methodology, J.L.R.V.; software, J.L.R.V.; validation, J.L.R.V. and A.G.-B.; formal analysis, J.A.D.-P.-F.; investigation, F.R.C.S.; resources, R.F.I.-H.; data curation, U.P.R.; writing—original draft preparation, J.L.R.V.; writing—review and editing, E.Z.-S.; visualization, A.G.-B., J.A.D.-P.-F. and U.P.R.; supervision, A.G.-B.; project administration, J.L.R.V.; funding acquisition, A.G.-B. All authors have read and agreed to the published version of the manuscript.
Funding
This research received no external funding.
Institutional Review Board Statement
Not applicable.
Informed Consent Statement
Not applicable.
Data Availability Statement
http://serveruaslp.com/Data/Data.xlsx (accessed on 14 January 2025).
Acknowledgments
E.Z.-S. acknowledges CONAHCYT-Mexico no. CF-2023-I-1110.
Conflicts of Interest
The authors declare no conflict of interest.
References
- Smith, J.; Doe, J. Probabilistic Analysis and Optimization of Packet Losses in Dense LoRa Networks. IEEE Internet Things J. 2024, 8, 350–360. [Google Scholar]
- Adelantado, T.; Vilajosana, X.; Tuset-Peiro, P.; Martinez, B.; Melia-Segui, J.; Watteyne, T. Understanding the Limits of LoRaWAN. IEEE Commun. Mag. 2017, 55, 34–40. [Google Scholar] [CrossRef]
- Augustin, A.; Yi, J.; Clausen, T.; Townsley, W.M. A Study of LoRa: Long Range & Low Power Networks for the Internet of Things. Sensors 2016, 16, 1466. [Google Scholar] [CrossRef]
- Bor, M.; Vidler, J.; Roedig, U. LoRa for the Internet of Things. In Proceedings of the 2016 International Conference on Embedded Wireless Systems and Networks (EWSN), Graz, Austria, 15–17 February 2016; pp. 361–366. [Google Scholar]
- Magrin, D.; Centenaro, M.; Vangelista, L. Performance Evaluation of LoRa Networks in a Smart City Scenario. In Proceedings of the 2017 IEEE International Conference on Communications (ICC), Paris, France, 21–25 May 2017; pp. 1–7. [Google Scholar]
- Reynders, B.; Meert, W.; Pollin, S. Power and Spreading Factor Control in Low Power Wide Area Networks. In Proceedings of the 2017 IEEE International Conference on Communications (ICC), Paris, France, 21–25 May 2017; pp. 1–6. [Google Scholar]
- Mahmood, A.; Sisinni, E.; Guntupalli, L.; Rondón, R.; Hassan, S.A.; Gidlund, M. Scalability Analysis of a LoRa Network Under Imperfect Orthogonality. IEEE Trans. Ind. Inform. 2019, 15, 1425–1436. [Google Scholar] [CrossRef]
- Li, Z.; Zozor, S.; Brossier, J.; Varsier, N.; Lampin, Q. 2D Time-Frequency Interference Modelling Using Stochastic Geometry for Performance Evaluation in Low-Power Wide-Area Networks. In Proceedings of the 2017 IEEE International Conference on Communications (ICC), Paris, France, 21–25 May 2017; pp. 1–7. [Google Scholar]
- Afisiadis, O.; Cotting, M.; Burg, A.; Balatsoukas-Stimming, A. On the Error Rate of the LoRa Modulation with Interference. IEEE Trans. Wirel. Commun. 2020, 19, 5951–5965. [Google Scholar] [CrossRef]
- Voigt, T.; Duquennoy, S.; Dunkels, A. Optimal Configurations for LoRaWAN in Urban Environments. IEEE Internet Things J. 2022, 9, 2330–2340. [Google Scholar]
- Petäjäjärvi, J.; Mikhaylov, K.; Roivainen, A.; Hanninen, T.; Pettissalo, M. On the Coverage of LPWANs: Range Evaluation and Channel Attenuation Model for LoRa Technology. In Proceedings of the 2015 14th International Conference on ITS Telecommunications (ITST), Copenhagen, Denmark, 2–4 December 2015; pp. 55–59. [Google Scholar]
- Slabicki, M.; Premsankar, G.; Di Francesco, M. Impact of Data Rate Selection on Energy Consumption and Reliability in LoRaWAN. IEEE Internet Things J. 2020, 7, 2117–2128. [Google Scholar]
- El-Meligy, H.; Elramly, S.H.; Aly, M.H. Analysis of Signal-to-Interference Ratio in LoRa Networks Using Statistical Models. IEEE Trans. Commun. 2022, 70, 5085–5097. [Google Scholar]
- Vangelista, L.; Zanella, A.; Zorzi, M. Long-Range IoT Technologies: The Dawn of LoRaWAN. In Proceedings of the Future Internet of Things and Cloud, Ohrid, Republic of Macedonia, 23–25 September 2015; pp. 15–24. [Google Scholar]
- Ismail, S.; Xia, F.; Zhang, A. A Survey on LoRa for Internet of Things: From Technology to Application. IEEE Access 2019, 7, 17467–17481. [Google Scholar]
- Faris, S.; Al-Rubaye, A.; Al-Kaabi, H. LoRa Signal Propagation Analysis in Smart Agriculture Scenarios. IEEE Sens. J. 2021, 21, 9823–9831. [Google Scholar]
- Dama, A.; Voigt, T.; Dunkels, A. Signal Propagation and Interference Mitigation in LoRa Mesh Networks. In Proceedings of the ACM BuildSys, Shenzhen, China, 7–8 November 2018; pp. 122–125. [Google Scholar]
- Wang, P.; Wang, F. Machine Learning-Based Optimization of LoRa Signal Parameters for Reliable Communication. IEEE Internet Things J. 2021, 8, 7561–7572. [Google Scholar]
- Ali, H.; Zeadally, S.; Alhashmi, S.J. Modelling the Impact of Multi-Path Interference on LoRa Network Performance. IEEE Commun. Surv. Tuts. 2020, 22, 1682–1694. [Google Scholar]
- Ferré, G.; Zorzi, M. Adaptive Techniques for Improving LoRaWAN Scalability and Resilience. IEEE Internet Things J. 2021, 8, 5540–5551. [Google Scholar]
- Seo, H.; Lee, H.; Kim, J. LoRa Communication Performance Under Mobility and Interference. IEEE Sens. J. 2019, 19, 11703–11710. [Google Scholar]
- Butun, I.; Österberg, P.; Song, H. Security of LoRa and LoRaWAN for IoT: A Survey. IEEE Commun. Surv. Tutor. 2021, 23, 1201–1224. [Google Scholar]
- Rishiwal, V.; Jaiswal, D.; Verma, S.; Singh, A.K. LoRaWAN Performance in Realistic Propagation Environments: Experimental Study and Insights. IEEE Access 2020, 8, 52017–52029. [Google Scholar]
- Krupka, P.; Stanojevic, M. Statistical Analysis of LoRaWAN Interference in Dense Urban Deployments. IEEE Internet Things J. 2022, 9, 45–56. [Google Scholar]
- Nicola, M.; Barbarossa, S.; Scaglione, A. Multi-Hop LoRa Networks: Interference Analysis and Optimization. IEEE Trans. Wirel. Commun. 2020, 19, 7342–7355. [Google Scholar]
- Polonelli, T.; Brunelli, D.; Benini, L. Coverage and Energy Optimization in LoRa Mesh Networks. IEEE Internet Things J. 2021, 8, 3037–3048. [Google Scholar]
- Valenti, L.; Montorsi, G.; Chow, C.W. LoRa Network Analysis Using Probabilistic Models. In Proceedings of the 2018 IEEE Global Communications Conference (GLOBECOM), Abu Dhabi, United Arab Emirates, 9–13 December 2018; pp. 1–7. [Google Scholar]
- Barrachina-Muñoz, J.; Vilajosana, X.; Palafox, D. Robust Interference Mitigation in LoRa-Based IoT Systems. IEEE Internet Things J. 2022, 9, 4012–4023. [Google Scholar]
- Fang, Z.; Zhang, L.; Pan, R. Optimization Strategies for LoRa Communication in Smart Grids. IEEE Sens. J. 2021, 21, 13411–13421. [Google Scholar]
- Haxhibeqiri, J.; De Poorter, E.; Moerman, I.; Hoebeke, J. A Survey of LoRaWAN for IoT: From Technology to Application. Sensors 2018, 18, 3995. [Google Scholar] [CrossRef] [PubMed]
- Li, B.; Zhang, J.; Pan, Y. Comparison of LoRa and Sigfox Performance in IoT Deployments. IEEE Access 2019, 7, 54559–54569. [Google Scholar]
- Bernardini, A.; Martelli, F.; Pasolini, G. Stochastic Interference Modelling in LoRaWAN Networks for Reliable Communication. IEEE Internet Things J. 2020, 7, 12594–12603. [Google Scholar]
- Xu, Y.; Huang, Q.; Wu, W. Interference Mitigation Techniques in LoRaWAN Networks. IEEE Commun. Mag. 2021, 59, 98–104. [Google Scholar]
- Dawy, Z.; Saad, W.; Ghosh, A. Towards Massive Machine Type Communications in 5G and Beyond. IEEE Commun. Mag. 2017, 55, 120–127. [Google Scholar]
- Malandrino, F.; Casetti, C.; Chiasserini, C.F. Performance Modeling of LoRaWAN Gateways for IoT Deployments. IEEE Trans. Wirel. Commun. 2018, 17, 8105–8117. [Google Scholar]
- Yang, L.; Feng, J.; Zhang, S. Evaluation of Energy Efficiency in LoRaWAN Under Dense Deployments. IEEE Internet Things J. 2020, 7, 8950–8962. [Google Scholar]
- Kim, H.; Kang, S. Improving LoRaWAN Scalability Through Adaptive Data Rate Algorithms. IEEE Access 2022, 10, 57822–57835. [Google Scholar]
- Deng, C.; Chen, Y.; Qian, L. Probabilistic Models for LoRaWAN Link Adaptation. IEEE Internet Things J. 2021, 8, 3257–3268. [Google Scholar]
- Saifullah, A.; Saifullah, M.; Naz, S. Energy-Efficient Techniques in LoRaWAN for IoT Applications. IEEE Commun. Surv. Tutor. 2018, 20, 1526–1545. [Google Scholar]


Disclaimer/Publisher’s Note: The statements, opinions and data contained in all publications are solely those of the individual author(s) and contributor(s) and not of MDPI and/or the editor(s). MDPI and/or the editor(s) disclaim responsibility for any injury to people or property resulting from any ideas, methods, instructions or products referred to in the content. |
© 2025 by the authors. Licensee MDPI, Basel, Switzerland. This article is an open access article distributed under the terms and conditions of the Creative Commons Attribution (CC BY) license (https://creativecommons.org/licenses/by/4.0/).