Abstract
The laser-induced hybrid hardening process integrates laser quenching and electromagnetic induction heating to overcome traditional heat treatment limitations, enhancing the depth and properties of hardened layers for applications like wind turbine bearings. This study uses Box–Behnken design (BBD) experiments to analyze key process parameters and develops response surface methodology (RSM) and whale-optimization-algorithm-optimized back-propagation neural network (WOA-BPNN) models for prediction and optimization. The WOA-BPNN model outperforms the RSM model, achieving superior predictive accuracy with R2 values exceeding 0.995 for both depth and hardness, with a root mean square error (RMSE) for depth of 0.099 mm and of 1.734 HV0.3 for hardness, and with mean absolute percentage error (MAPE) of 0.697% and 0.7867%, respectively. The WOA-BPNN model provides an effective and reliable framework for optimizing laser-induced hybrid hardening, improving production efficiency and extending component life for industrial applications.
Keywords:
laser-induced hybrid hardening; RSM; WOA-BPNN; parameters; prediction; optimization; model 1. Introduction
Wind power bearings, as critical components of wind turbines, endure significant periodic loads during operation, further compounded by their high power capacity and large dimensions. These extreme working conditions can accelerate failure mechanisms, including surface wear and fatigue-induced pitting, thereby impacting the reliability and service life of the turbine [1,2,3,4]. Traditional heat treatment techniques, including induction hardening [5,6,7], have been used to strengthen bearings and are capable of obtaining greater depths of hardened layers. Still, they are often characterized by high energy consumption, extended processing durations, and other inherent drawbacks such as surface cracking, large deformations, and soft bands. Laser quenching is a widely employed surface treatment that enhances the properties of material surfaces while maintaining their bulk characteristics. However, this process typically results in a relatively shallow hardened layer, usually less than 2 mm in depth [8,9,10,11,12], which fails to meet the requirements for prolonged operation in heavy-duty bearings application. To address these issues, laser-induced hybrid hardening, primarily utilizing laser quenching supplemented by electromagnetic induction heating, was proposed for the first time by our research team. Subsequently, related research has been conducted on laser-induced hybrid hardening devices, microstructure simulation, temperature field simulation, performance regulation, and experimental studies. This method enables the formation of a hardened layer with large depth, small HAZ, and excellent performance [13,14]. However, current research on the laser-induced hybrid hardening process relies on approaches such as the ‘test-and-improve’ cycle, the ‘orthogonal experiment’ [15,16,17], and the ‘finite element simulation’ [18,19,20,21], with a qualitative focus on the influence of process parameters. The presence of multiple heat sources in the laser-induced hybrid hardening process makes the variation of hardened layer characteristics complex and the process parameters more numerous. The non-linear relationship between these processing parameters and the hybrid phase transformation model poses a challenge in representing it through a simple parametric model.
Neural network models have recently gained widespread application across various fields, among which artificial neural networks (ANN) and back-propagation neural networks (BPNN) are most common. Their primary advantage lies in learning iteratively, without predefined mathematical functions. This capability allows them to effectively model non-linear, multivariate data and address complex interactions between process parameters [22,23,24,25,26]. Jiali Gao et al. [27] used different models to analyze the impact of melt pool temperature stability on part morphology in laser metal deposition. BPNN is the most accurate for future temperature control design. Moradi M et al. [28] found that ANN outperforms RSM in predicting the mechanical properties of 3D-printed ABS. However, research on applying these methods to hybrid hardening remains limited.
In this study, a Box–Behnken design (BBD) experiment is employed to construct a response surface model (RSM) [29,30] and a back-propagation neural network optimized by the whale optimization algorithm [31] (WOA-BPNN) model [32]. These models are applied within the process interval to compare their predictive capabilities and to optimize the process model [33]. This study will serve as an estimator in the closed-loop control process, continuously adjusting process parameters during manufacturing and providing a reference for achieving high-efficiency, deep laser-induction hardening.
2. Materials and Methods
2.1. Experimental System
The experiment employed an LDF6000-40 fiber-coupled diode laser (Laserline, Mülheim-Kärlich, Germany), with a maximum laser power of 6000 W, a wavelength range of 940~1060 nm, and an adjustable spot size ranging from 15 to 64 mm. An ultra-audio induction system, with 80 kW output and adjustable frequency, was utilized as the induction heating source.
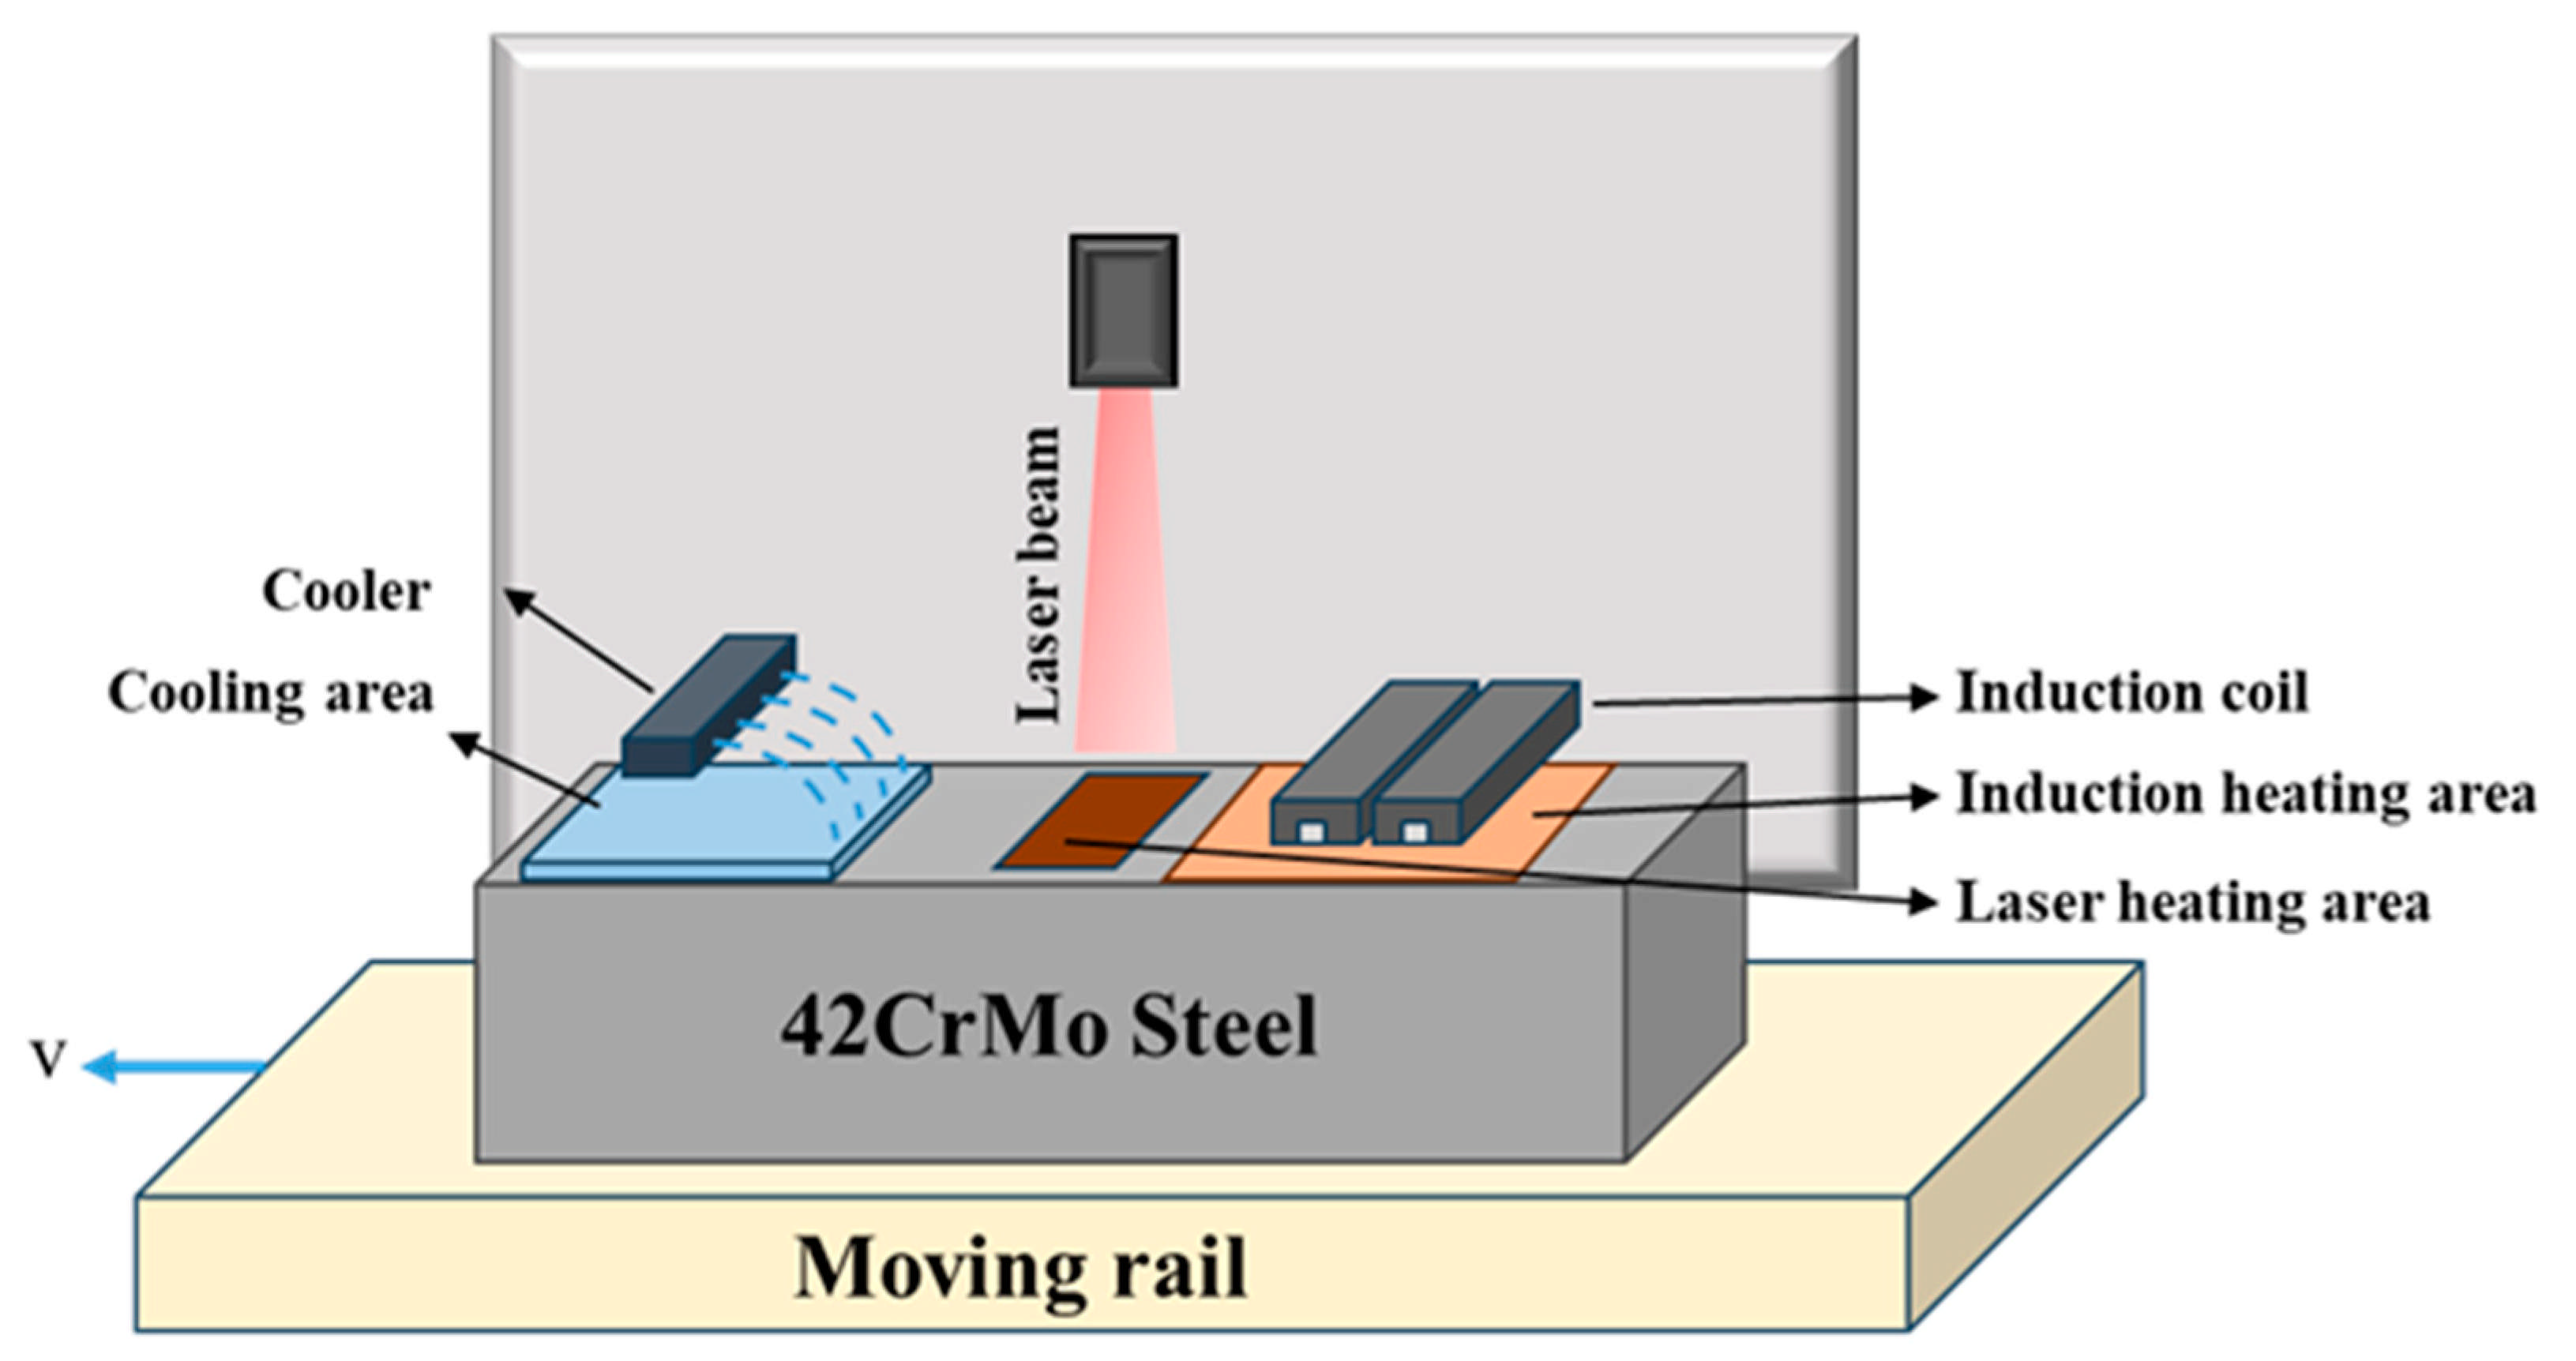
The laser-induction hybrid phase transformation system consisted of a laser system, an induction heating system, a computerized numerical control (CNC) mobile platform, and a cooling module. By integrating the laser beam with the induction heating head, the CNC console controls the relative movements of the substrate, laser, and inductor, thereby facilitating the hybrid heat treatment process. During this process, external cooling water is added for forced cooling. The overall composition of the system is illustrated in Figure 1.
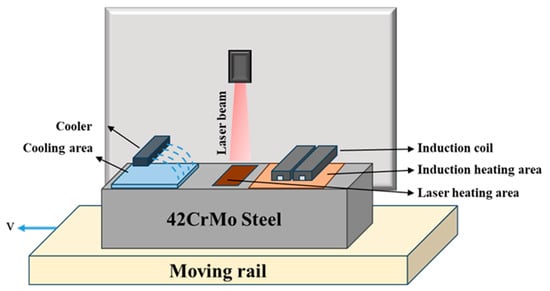
Figure 1.
Schematic diagram of the laser-induction hybrid phase transition process.
2.2. Experimental Materials and Sample Preparation
42CrMo steel (Zhejiang Tianma Bearing Group Co, Huzhou, China) is a high-lath, medium-carbon, low-alloy structural steel known for its excellent hardenability and minimal deformation during heat treatment. These properties contribute to its outstanding mechanical performance, making it a widely used material in bearing manufacturing [34,35]. Therefore, 42CrMo steel was used as the experimental material in this study, with quenching and tempering pretreatment. The surface hardness of the 42CrMo steel specimen is approximately 300 HV0.3. The dimensions of the specimen are 110 mm × 55 mm × 50 mm, where the 50 mm corresponds to the depth direction. Its primary components are detailed in Table 1. Prior to conducting experiments, it is essential to ensure that the machining surfaces are planar.

Table 1.
Chemical composition of 42CrMo steel for experiment (wt.%).
A 2 mm-thick black light-absorbing coating of metal oxides such as chromium oxide and cerium oxide was applied to the treatment surface to optimize the laser absorption effect, achieving over 85% absorption by the pretreated specimen. Following the experiment, the specimen was wire-cut along the cross-section of the hardened layer, resized, and polished using sandpaper with mesh sizes of 80, 240, 400, 800, 1000, 1500, and 2000. Hardness measurements were conducted using a fully automated Vickers microhardness tester (Shimadzu HMV-2TADWXY), applying a vertical load of 2.942 N for 10 s. Hardness values were recorded at five points near the center line (corresponding to the central axis in the thickness direction of the specimen) and 0.5 mm from the upper surface (measured downward along the depth direction) and then averaged. The depth characteristics of the hardened layer were determined according to the user’s requirements, and this was a heat-treated area with a hardness higher than 480 HV0.3.
2.3. Experimental Design and Analysis
The factors influencing hardness (HV0.3) and depth (D) of the hardened layer in the laser-induced hybrid hardening process are multifaceted. Notably, induction frequency (IF), laser power (P), scanning speed (V), and induced power (IP) significantly affect both hardness and depth. RSM and WOA-BPNN were used to analyze the effects of these parameters on hardness and depth.
The RSM model is a statistical approach used to address multivariate problems by fitting polynomial functions to the design space, which is constructed using the Box–Behnken design (BBD). This three-level factorial design is ideal for optimizing analytical methods, as it allows the assessment of the effects of multiple factors on response variables while minimizing the need for extensive experimentation. Based on the experimental analysis, we selected the parameters that have a more significant effect on the depth and hardness of the hardened layer. Based on the parameter values in Table 2, BBD experiments were designed using the response surface module in Minitab. For each set of process parameters, 17 data points were generated at induction frequencies of 10 kHz and 15 kHz, resulting in 34 experiments of the laser-induction hybrid hardening process, and some of the experimental parameters are tabulated in Table 3. The 34 samples obtained from the BBD experimental design were insufficient for constructing a neural network prediction model. To enhance the dataset, we used MATLAB to systematically generate an additional 20 sets of experimental parameters within the operational range. We then conducted laser-induced hybrid hardening experiments based on these parameters. These additional data points were evenly distributed between the two induction frequency groups (10 kHz and 15 kHz), similar to the initial 34 experiments. This approach increased the sample size and improved the generalization capability of the model.
Table 2.
BBD experimental parameter selection values.
Table 3.
BBD experimental parameters and results.
The stability and accuracy of the model were evaluated using three metrics: the root mean square error (RMSE), mean absolute error (MAE), and mean absolute percentage error (MAPE). A model with lower RMSE, MAE, and MAPE values indicates better stability and accuracy, with an ideal value of zero representing a perfect alignment between predicted and actual values. These metrics were employed to compare the predictions of the RSM and WOA-BPNN models for the hardness and depth of the reinforced layer:
where is the experimental value of the hardness or depth of the reinforcement layer, is the predicted value of the hardness or depth of the reinforcement layer, and n is the number of experiments carried out.
3. Results and Discussions
3.1. RSM Depth Modeling
With the depth of the hardened layer as the response variable, a multivariate regression model was constructed using data from BBD experiments at varying induction frequencies. Subsequently, the model’s performance was evaluated through analysis of variance (ANOVA) [36], with the ANOVA results for the hardened layer depth detailed in Table 4 and Table 5.
Table 4.
ANOVA of hardened layer depth predicted by RSM model (induction frequency = 10 kHz).
Table 5.
ANOVA of hardened layer depth predicted by RSM model (induction frequency = 15 kHz).
The F-value, which represents the statistic of the F-test, indicates the ratio of the sum of squares of deviations between and within groups relative to the degrees of freedom, while the p-value indicates the significance of the factors. As shown in Table 4, at an induction frequency of 10 kHz, the factors of laser power (A), scanning speed (B), induction power (C), the quadratic terms B2 and C2, and the interaction term BC all have a significant effect on the depth of the hardened layer (p < 0.0001), while the remaining factors are non-significant. Comparing mean square values, the process parameters affecting depth are ranked as C > B > A. The p-value for the lack-of-fit term is 0.5128 (p > 0.05), indicating that the model effectively describes the relationship between the depth of the hardened layer and the influencing factors.
In addition, the coefficient of determination of the RSM model has a value of 0.998 for R2 and 0.985 for R2adjust. After calculating Equations (1)–(3), the RMSE is 0.249 mm, the MAE is 0.019 mm, and the MAPE is 0.31%. The final response regression prediction of the quadratic polynomial model of the actual parameters is established as follows:
Table 5 indicates that at an induction frequency of 15 kHz, laser power (A), scanning speed (B), induction power (C), and the quadratic term C2 significantly influence the depth of the hardened layer (p < 0.0001). Additionally, the quadratic terms A2 and B2 and the interaction term AC have a notable impact (p < 0.05), while the other factors are non-significant. The ranking of the process parameters affecting depth remains consistent with that at 10 kHz: C > B > A. The p-value for the lack-of-fit term is 0.6217 (p > 0.05), indicating that the model effectively describes the relationship between the depth of the hardened layer and the influencing factors.
In addition, the coefficient of determination of the RSM model has a value of 0.993 for R2 and 0.955 for R2adjust. After calculating Equations (1)–(3), the RMSE is 0.069 mm, the MAE is 0.054 mm, and the MAPE is 1.12%. The final response regression prediction of the quadratic polynomial model of the actual parameters is established as follows:
3.2. RSM Hardness Modeling
The hardness of the hardened layer was used as the response value, and the data from the BBD experiments conducted at different induction frequencies were modeled by multivariate regression fitting. The model was then analyzed using the analysis of variance (ANOVA) method, and the results of the ANOVA for the hardness of the hardened layer are presented in Table 6 and Table 7. It was found that the prediction model of the hardness of the hardened layer using the response surface method was worse compared to that of the depth.
Table 6.
ANOVA of the hardness of the hardened layer predicted by RSM model (induction frequency = 10 kHz).
Table 7.
ANOVA of the hardness of the hardened layer predicted by RSM model (induction frequency = 15 kHz).
Table 6 illustrates that at an induction frequency of 10 kHz, the quadratic term A2, the cubic term AB2, and the three interaction terms significantly influence the hardness of the hardened layer (p < 0.05), while the remaining terms are not statistically significant. The process parameters are ranked in terms of their influence on hardness as follows: B > C > A. The p-value for the lack-of-fit term is 0.2819 (p > 0.05), suggesting that the model effectively describes the relationship between the hardness of the laser-induced hybrid hardening hardened layer and the influencing factors.
In addition, the coefficient of determination of the RSM model has a value of 0.850 for R2 and 0.758 for R2adjust. After calculating Equations (1)–(3), the RMSE is 10.098 HV0.3, the MAE is 8.504 HV0.3, and the MAPE is 1.15%. The final response regression prediction of the quadratic polynomial model of the actual parameters is established as follows:
Table 7 indicates that at an induction frequency of 15 kHz, scanning speed (B), the cubic term AB2, and the interaction term BC significantly affect the hardness of the hardened layer (p < 0.05), while the remaining terms are non-significant. The ranking of process parameters influencing hardness is B > A > C. The p-value for the lack-of-fit term is 0.2819 (p > 0.05), suggesting that the model effectively describes the relationship between the hardness of the laser-induced hybrid hardening hardened layer and the influencing factors.
In addition, the coefficient of determination of the RSM model has a value of 0.9085 for R2 and 0.7910 for R2adjust. After calculating Equations (1)–(3), the RMSE is 12.691 HV0.3, the MAE is 10.635 HV0.3, and the MAPE is 1.36%. The final response regression prediction of the quadratic polynomial model of the actual parameters is established as follows:
3.3. Interactivity Analysis of RSM Model Process Parameters
Upon comparison of the data in Table 4 and Table 5 (corresponding to depth) and Table 6 and Table 7 (corresponding to hardness), it is evident that the significance of certain parameters varies between the two frequencies. This discrepancy may be attributed to the differing mechanisms by which the process parameters influence the depth and hardness of the hardened layer at different induction frequencies, thus necessitating further analysis.
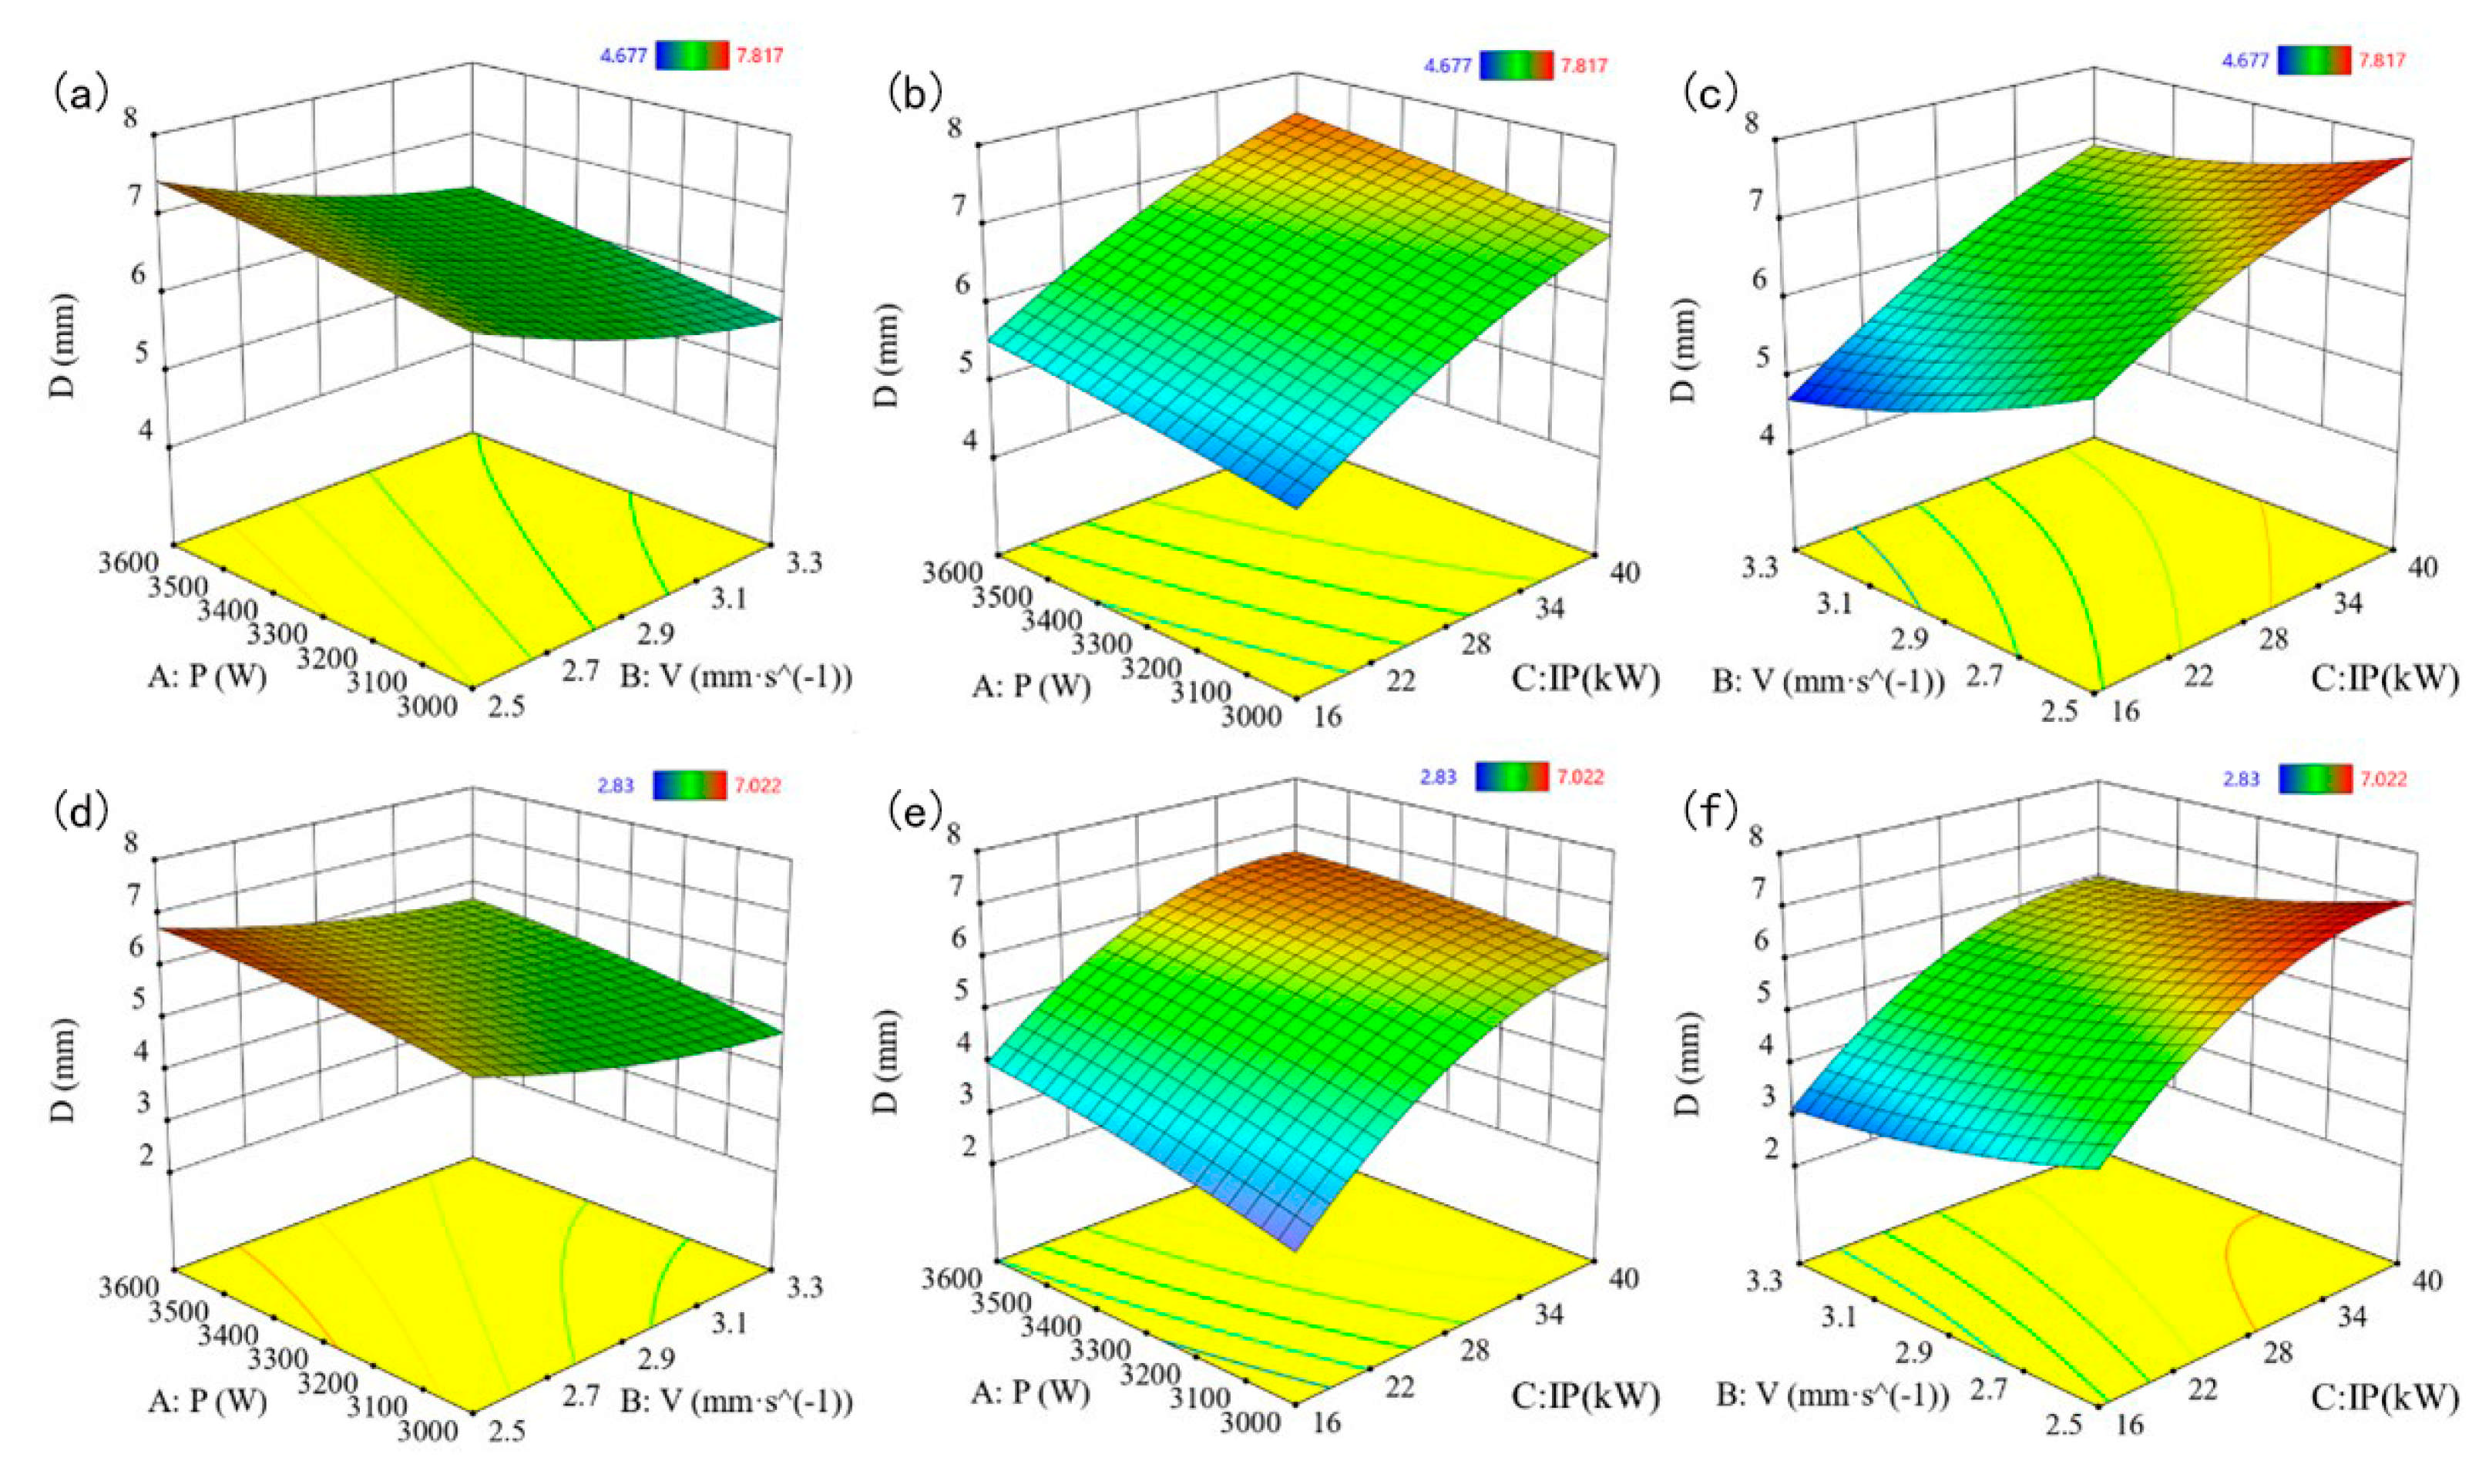
Based on the multiple regression equations and analysis of variance, three-dimensional surface plots can be generated to illustrate the interaction effects of the experimental factors. Figure 2 provides an intuitive representation of the effects of the laser power, the scanning speed, and the induced power, along with their interactions, on the depth of the hardened layer when the induction frequency is 10 and 15 kHz, respectively.
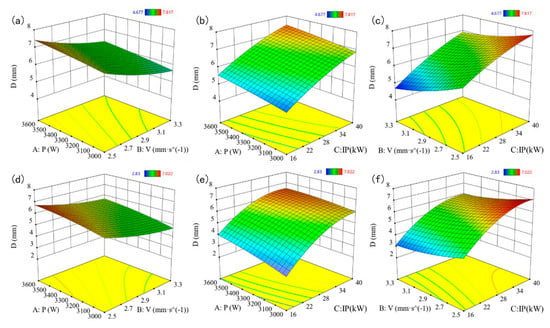
Figure 2.
Interaction effect of process parameters on the depth of the hardened layer. (a) Laser power and scanning speed (10 kHz); (b) laser power and induced power (10 kHz); (c) scanning speed and induced power (10 kHz); (d) laser power and scanning speed (15 kHz); (e) laser power and induced power (15 kHz); (f) scanning speed and induced power (15 kHz).
Among the three process parameters, only scanning speed (B) exhibits a negative correlation with the depth of the hardened layer. As scanning speed increases, the total heat input per unit time and area decreases, leading to a lower average surface temperature and a shallower region reaching the austenitizing temperature. In contrast, laser power (A) and induction power (C) show a positive correlation with the depth of the hardened layer. Increased heat input raises the temperature, allowing a deeper region of the 42CrMo steel to reach the austenitizing temperature. Furthermore, analysis of the interaction effect plots reveals that lower induction frequencies favor deeper hardened layers, with maximum depth increasing from 7.022 mm at 15 kHz to 7.817 mm at 10 kHz, indicating that induction heating penetrates deeper in this range.
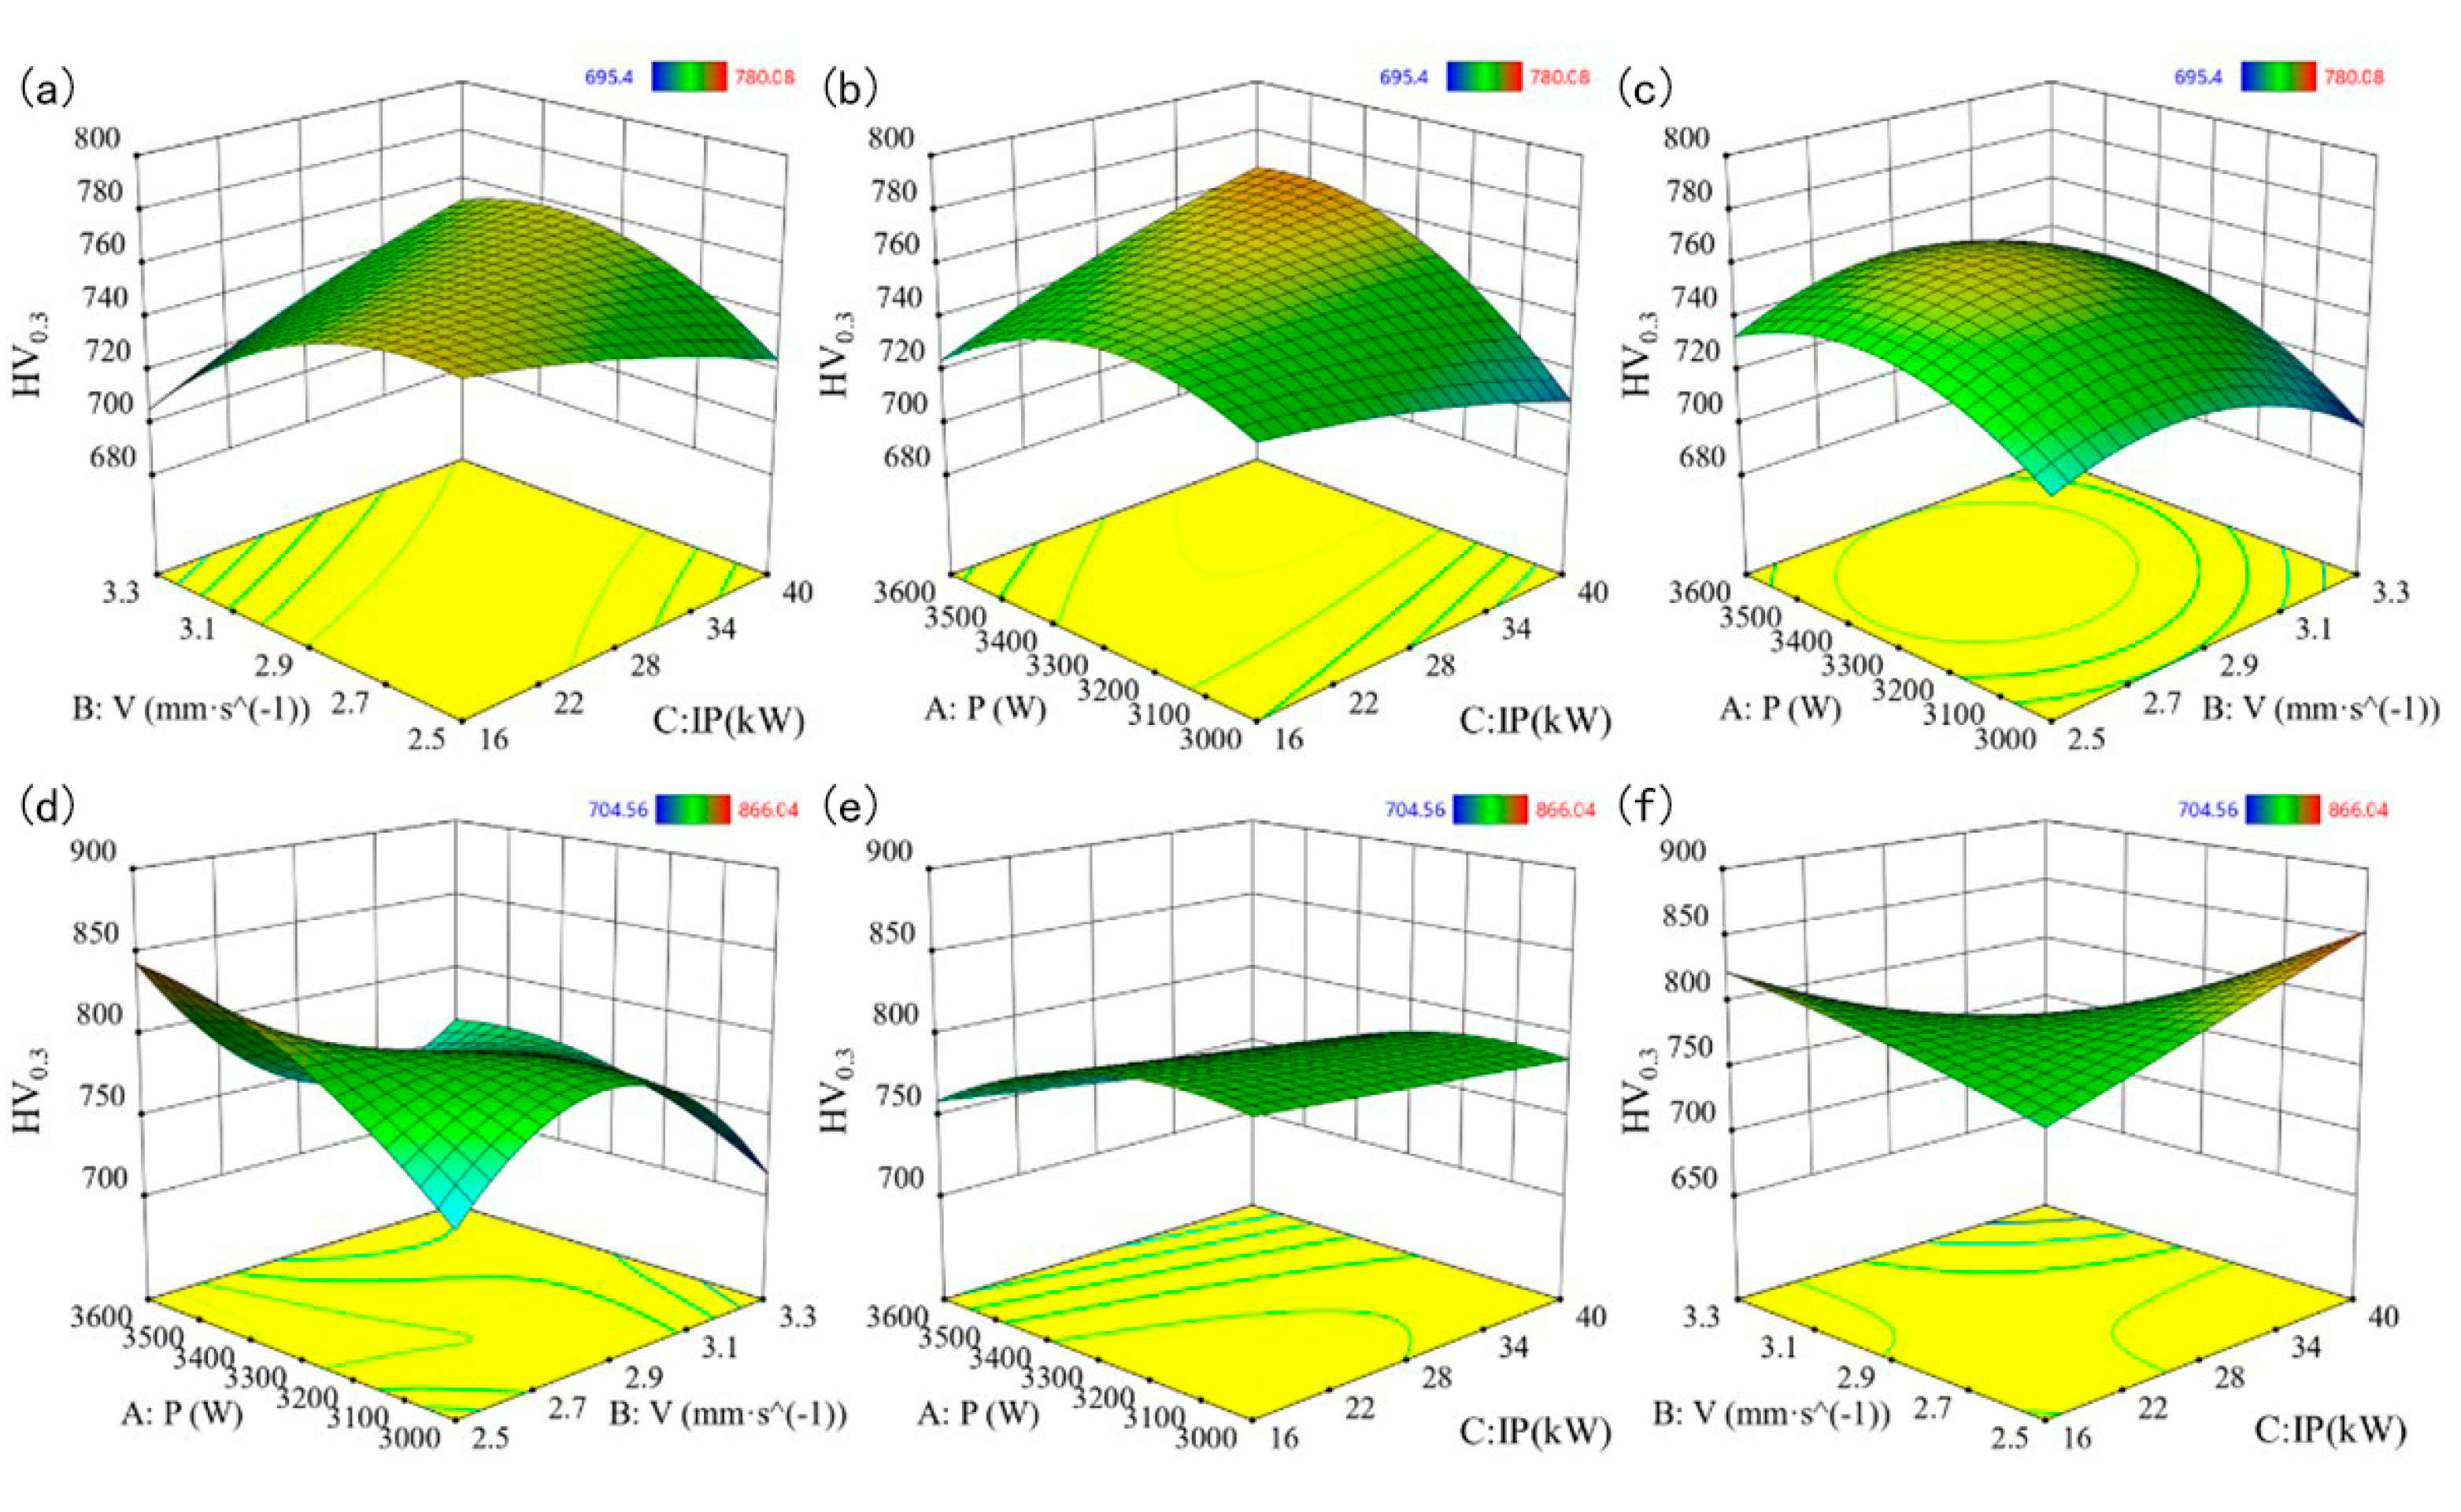
Figure 3 shows the effects of laser power, scanning speed, and induction power on the hardened layer at induction frequencies of 10 kHz and 15 kHz. The key to surface hardening of 42CrMo steel is the martensitic structure from phase transformation. At a constant scanning speed, increasing laser power boosts energy input, which raises the material’s temperature and extends the region reaching the austenitizing temperature. This leads to faster cooling and more martensite, increasing hardness. However, too much laser power can overload the heat input, insulating the specimen and slowing cooling, which cuts martensite formation and caps hardness gains. Consequently, simply increasing laser power, as shown in Figure 3a,d, will not enhance hardness. The complexity of multiple factors makes hardness analysis tricky, rendering single-factor evaluations less reliable.
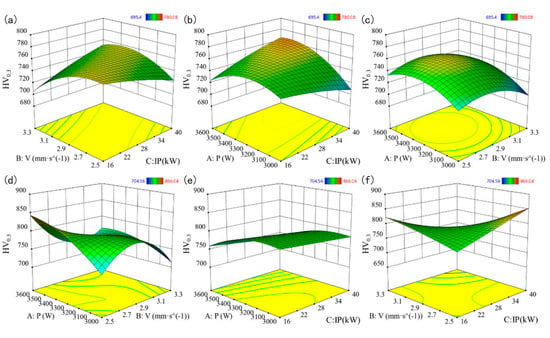
Figure 3.
Interaction effect of process parameters on the hardness of the hardened layer. (a) Laser power and scanning speed (10 kHz); (b) laser power and induced power (10 kHz); (c) scanning speed and induced power (10 kHz); (d) laser power and scanning speed (15 kHz); (e) laser power and induced power (15 kHz); (f) scanning speed and induced power (15 kHz).
3.4. WOA-BPNN Modeling
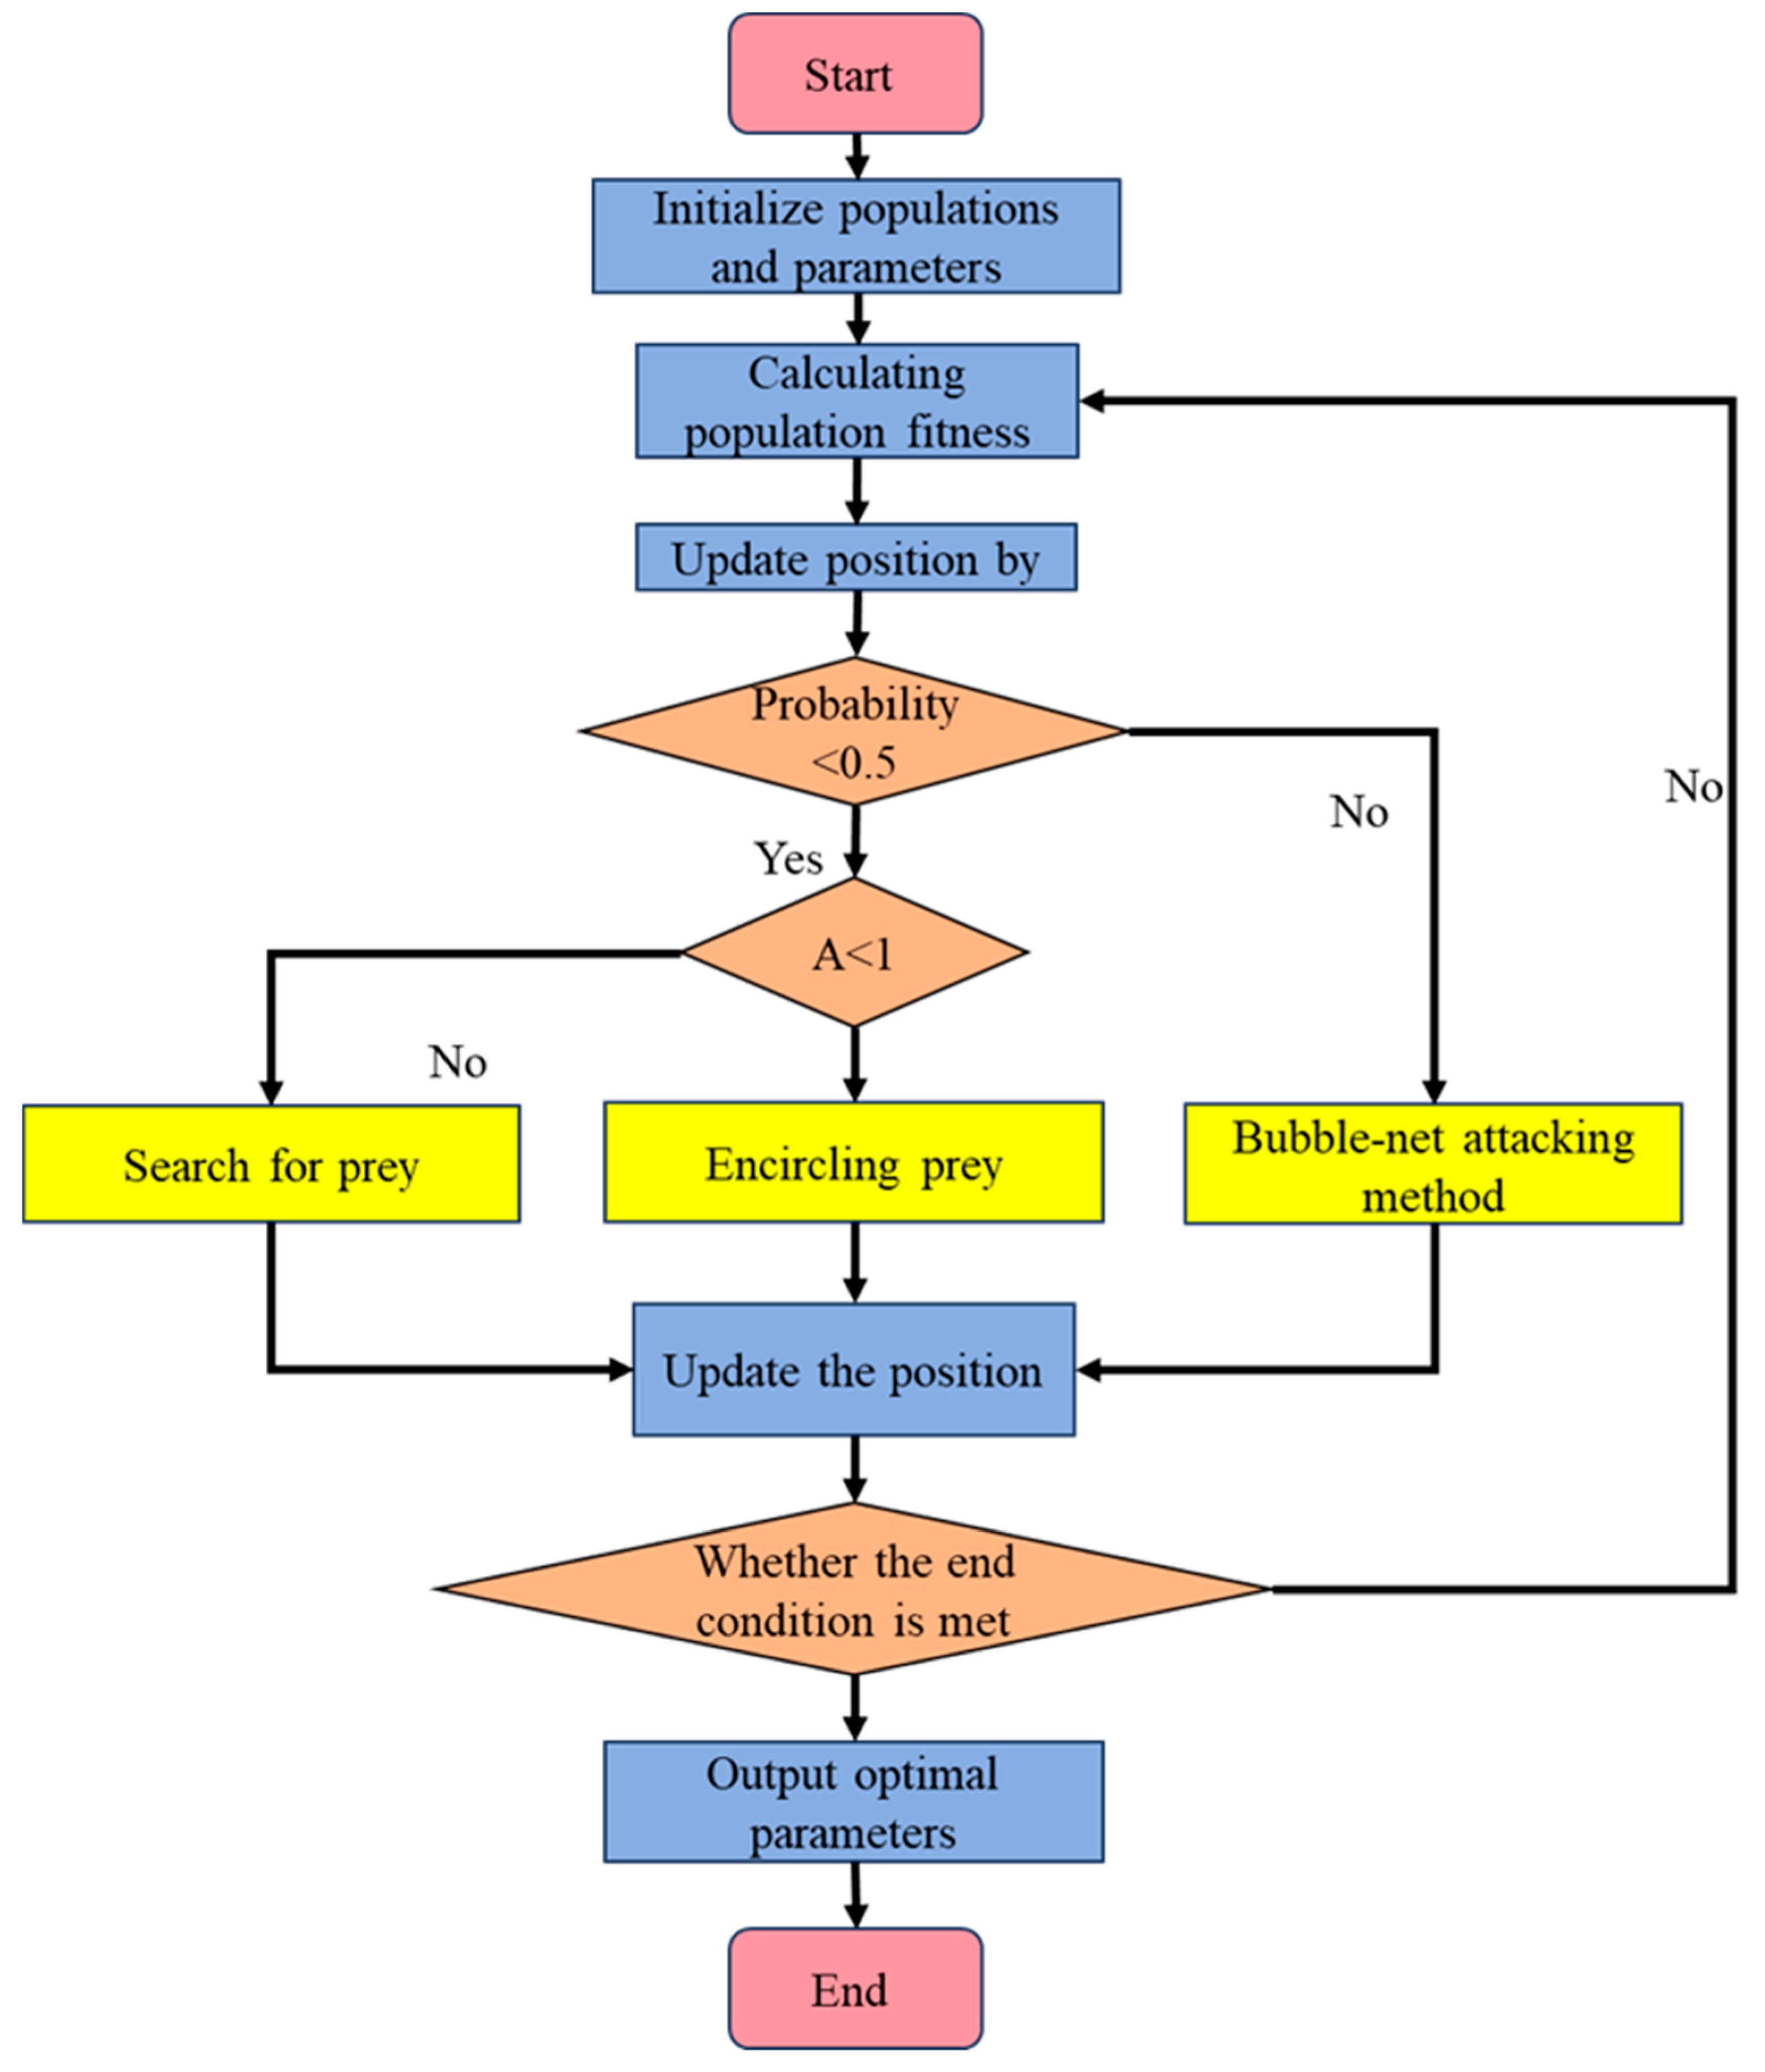
BPNN is a multilayer feedforward neural network trained according to the error back-propagation algorithm [37]. Mirjalili proposed the whale optimization algorithm (WOA) in 2016 [31]. This algorithm draws inspiration from the humpback whales’ unique feeding strategy, simulating their foraging behavior to enhance global search capabilities. It consists of three phases: encircling prey, the bubble-net attacking method, and searching for prey, as illustrated in the flowchart in Figure 4.

Figure 4.
Flowchart of the whale optimization algorithm.
(1) Encircling Prey. The mathematical model of a whale encircling prey is:
where t indicates the current iteration number, is the current position vector of the best solution, is the current position vector, and and are coefficient vectors. The specific formula is as follows:
where is the random vector in [0, 1], and
is the distance control factor, which decreases linearly from 2 to 0 during the iteration process:
where MaxIter is the maximum number of iterations.
(2) Bubble-net Attacking Method. The mathematical model of the whale bubble-net attacking method is:
where renders the distance from the first whale to the prey. l is a random value between [−1, 1], and b is a spiral constant. When p < 0.5, it is a narrowing encircling predation behavior. Conversely, it is a spiral bubble predation behavior.
(3) Search for Prey. The mathematical model for the random search hunt for whales is:
where is the position vector of an individual whale randomly selected from the population.
Optimization of BPNN using the WOA helps to find the optimal initial weights and thresholds and requires fewer adjustment parameters. This compensates for the shortcomings of BPNNs, which are prone to falling into local optimal solutions. Figure 5 shows the topology of the BPNN model structure optimized based on the whale algorithm.
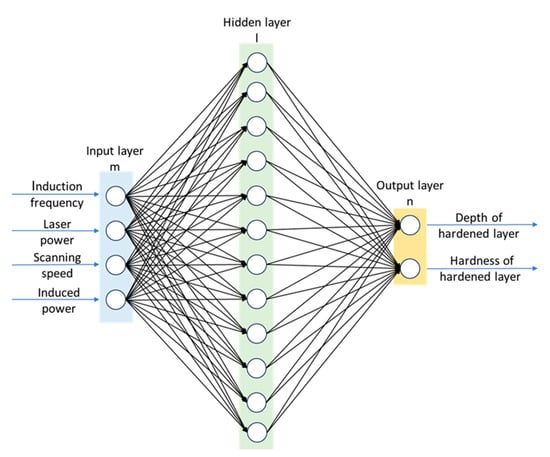
Figure 5.
The topological structure of the BPNN.
From the 34 samples prepared in the BBD experiment and the 20 randomly generated samples, 80% were selected as training samples and 20% as test samples. The WOA-BPNN model addresses the challenge of predicting the depth and hardness of the hardened layer under varying induction frequencies. This model features four input neurons representing induction frequency, laser power, scanning speed, and induction power. After parameter tuning, a single hidden-layer neural network with 10 neurons was chosen, resulting in a final structure of 4 × 10 × 2.
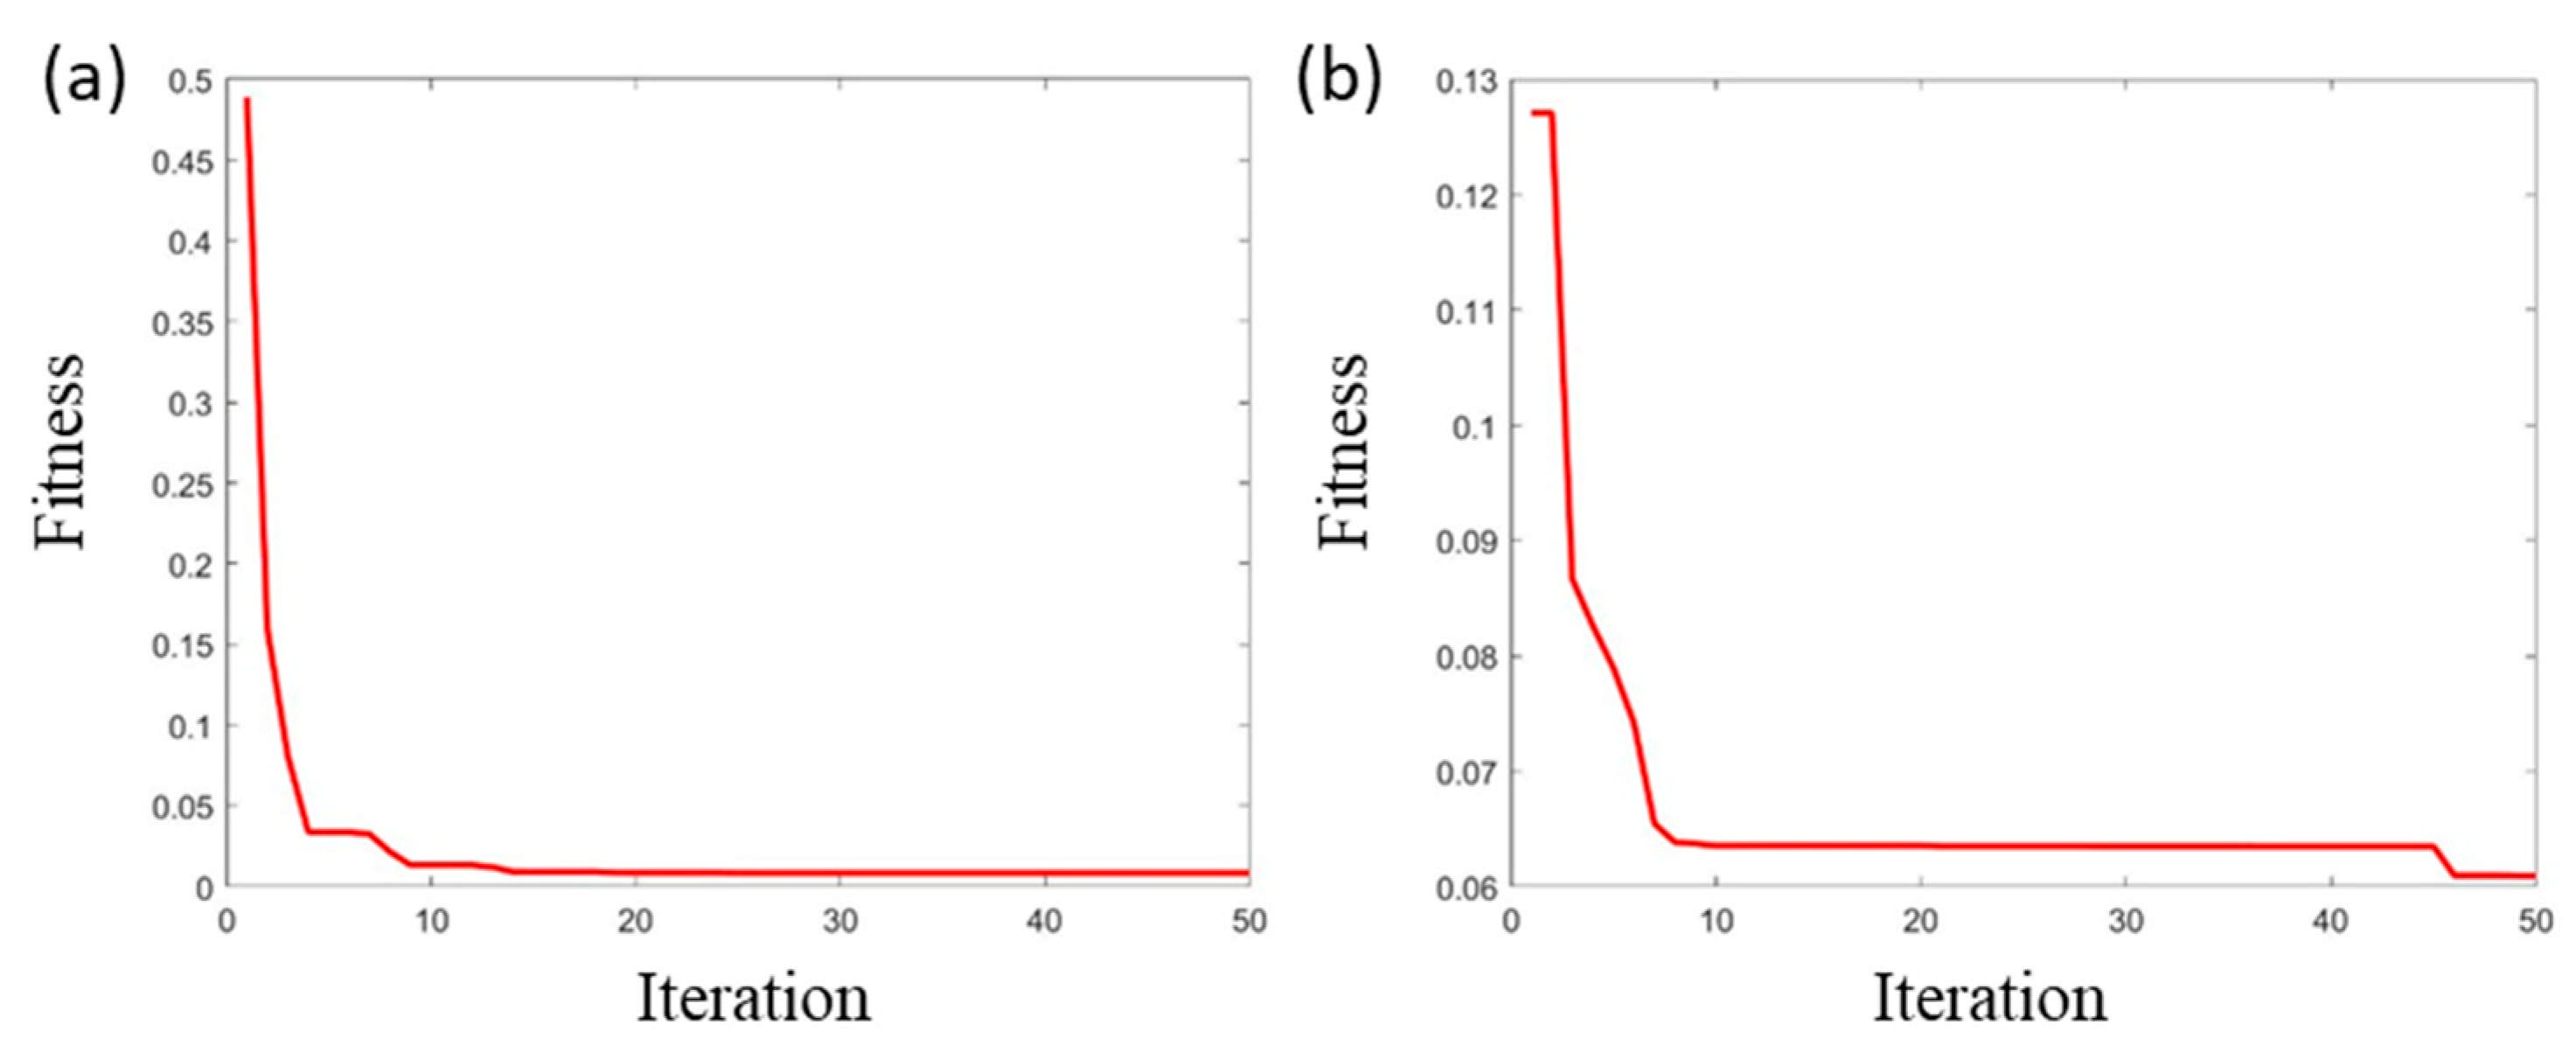
The whale algorithm was set with a population size of 30 and a maximum of 50 evolutionary iterations to find the optimal weight threshold for the BPNN. Initial parameters included 500 iterations, a learning rate of 0.01, and a training target of 0.0001. Predictive performance was assessed using scoring indices, allowing for the development of the laser-induced hybrid hardening hardened layer process prediction model in MATLAB. Figure 6 shows the fitness evolution of the hardened layer’s quality (depth and hardness). After optimizing the weights and thresholds via WOA, these values were applied to the BPNN. By the 50th generation, the fitness value for hardened layer depth reached 0.0256, while hardness fitness reached 0.0626.

Figure 6.
WOA-BPNN fitness value variation plot. (a) Depth fitness; (b) hardness fitness.
After training, the depth coefficient of determination of the neural network model optimized by the whale algorithm was 0.995, and the hardness coefficient of determination was 0.996. The RMSE, MAE, and MAPE of the depth of the WOA-BPNN model were calculated by Equations (1)–(3) to be 0.099 mm, 0.022 mm, and 0.697%, respectively, and those of the hardness of the WOA-BPNN model were 1.734 HV0.3, 0.596 HV0.3, and 0.787%, respectively.
3.5. Comparison of RSM and WOA-BPNN Models
The depth of the hardened layer was analyzed using the RSM and WOA-BPNN laser-induced hybrid hardening models, as established in the experiments. Both models showed coefficients of determination close to 1, indicating high fitting accuracy. However, the WOA-BPNN model exhibited significantly higher coefficients for the hardness of the hardened layer, indicating greater stability than the RSM model. A comparison of RMSE, MAE, and MAPE values reveals that the WOA-BPNN model has superior modeling capability in the laser-induced hybrid hardening process. All comparison results are presented in Table 8. Its main advantage lies in overcoming the limitations of the response surface method, particularly in simultaneously predicting both depth and hardness. This enhancement significantly improves model efficiency while maintaining accuracy, thus addressing multi-objective parameter challenges more effectively.
Table 8.
Comparison of metrics between RSM and WOA-BPNN.
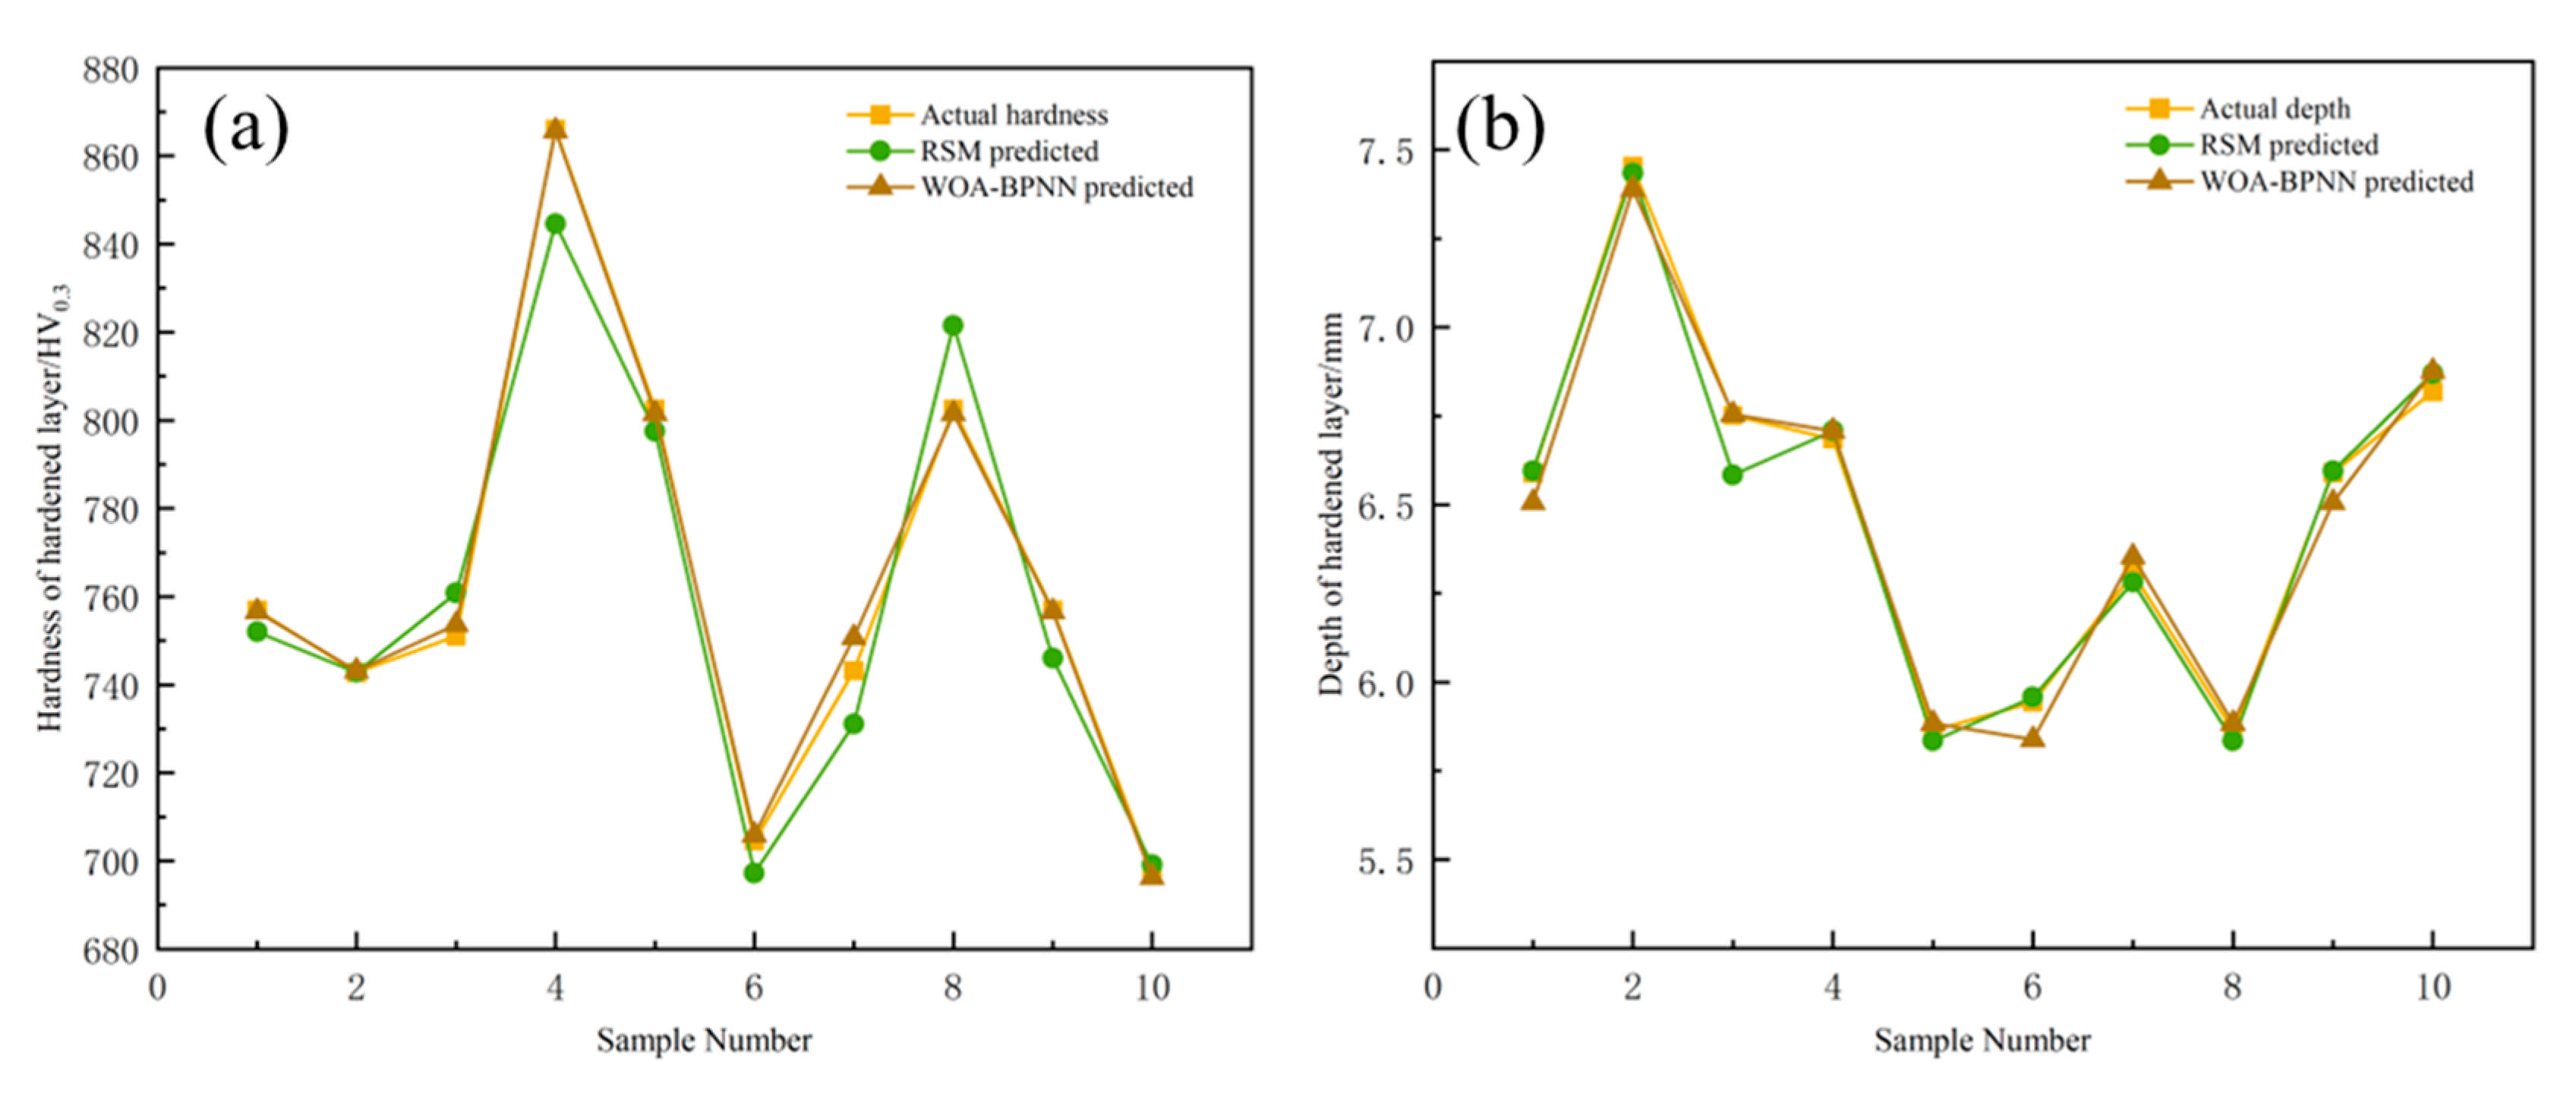
To compare the generalization abilities of the RSM and WOA-BPNN models, MATLAB randomly selected 10 sets of process parameters for laser-induced hybrid hardening experiments from the previously mentioned 54 sets. The experimental results and corresponding predictions from both models are shown in Figure 7. The RSM model yielded a MAPE of 0.715% in terms of the mean hardened layer depth for induction frequencies of 10 kHz and 15 kHz, while the WOA-BPNN model achieved a MAPE of 0.697%. For the hardened layer hardness, the RSM had a MAPE of 1.255%, in contrast to 0.787% for the WOA-BPNN model. Thus, the WOA-BPNN model demonstrates superior generalization ability and accuracy in predicting both depth and hardness of the hardened layer.

Figure 7.
Comparison of RSM and WOA-BPNN generalization capabilities. (a) Depth; (b) hardness.
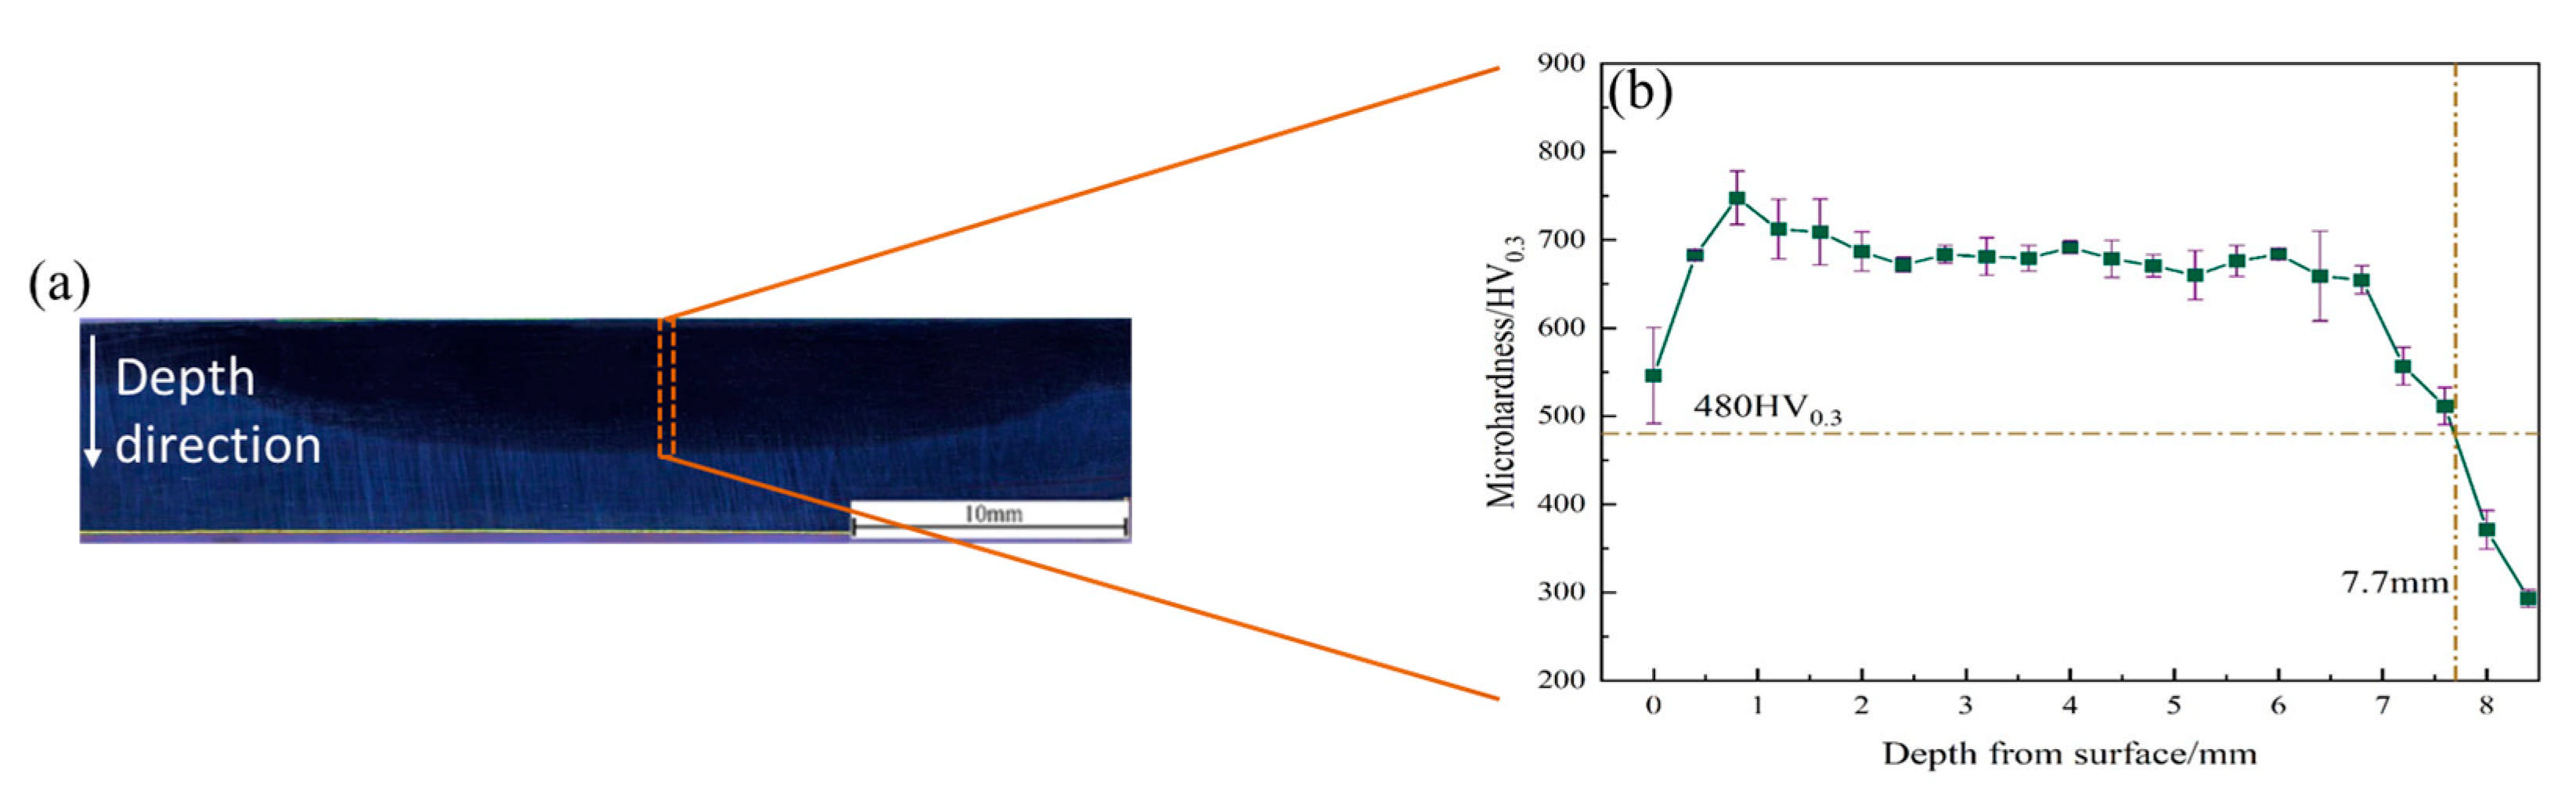
In the hardness compliance and fixed process interval, the RSM model and WOA-BPNN were set to the optimal process parameters, i.e., an induction frequency of 10 kHz, laser power of 3600 W, scanning speed of 2.5 mm/s, and induction power of 40 kW. At that time, the predicted depths D were 8.016 mm and 7.762 mm, respectively. Under these conditions, the laser-induced hybrid hardening experiments were carried out. The average value of depth was 7.7 mm, as shown in Figure 8. The difference between the theoretical and experimental values of RSM is 5.27%. In contrast, the difference between the experimental and predicted values of WOA-BPNN is 0.81%, so the accuracy of WOA-BPNN prediction is found to be higher than that of RSM.
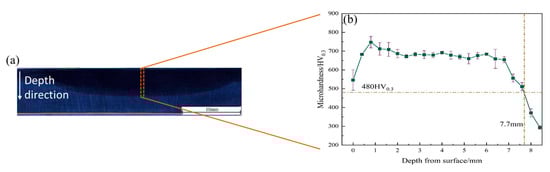
Figure 8.
Optimization results of process parameters. (a) Distribution map of hardened layers; (b) hardness distribution map.
4. Conclusions
To optimize the hardening process of 42CrMo steel, this study developed the RSM and WOA-BPNN models for the laser-induced hybrid phase transformation process. Conclusions drawn from the study are as follows:
- The WOA-BPNN model outperforms RSM in stability and generalization, with R2 values of 0.995 and 0.996 for the depth and hardness of the hardened layers, respectively.
- The WOA-BPNN model achieved higher accuracy, with RMSEs of 0.099 mm for depth and 1.734 HV0.3 for hardness, and MAPEs of 0.697% and 0.787%, respectively.
- The WOA-BPNN model demonstrated superior generalization and multi-objective prediction capability, making it more suitable for non-linear problems in the laser-induced hybrid hardening process.
In summary, WOA-BPNN provides an effective method to enhance 42CrMo steel’s surface properties, offering valuable insights for optimizing parameters to extend component life and reduce production costs. Furthermore, the WOA-BPNN model exhibits high reliability, which can help researchers promptly obtain the optimal depth and hardness through limited processing parameters.
Author Contributions
Q.Z. and J.L.: conceptualization, methodology, data curation, investigation, software, visualization, validation, writing—original draft, writing—review and editing. J.Y.: conceptualization, project administration, funding acquisition, supervision, writing—review and editing. Z.C., G.W., J.Z., Z.Y., Y.W. and J.Z.: methodology, writing—review and editing. All authors have read and agreed to the published version of the manuscript.
Funding
This research was supported by the National Key Research and Development Program of China under Grant 2023YFB4603400, the “Elite” Program of Zhejiang Province under Grant 2023C01064/2024SJCZX0040, and the Key Science and Technology Program of Long-You County (JHXM2023072).
Institutional Review Board Statement
Not applicable.
Informed Consent Statement
Not applicable.
Data Availability Statement
The original contributions presented in this study are included in the article. Further inquiries can be directed to the corresponding author.
Conflicts of Interest
The authors declare no conflicts of interest.
Abbreviations
The following abbreviations are used in this manuscript:
| RSM | Response surface methodology |
| BBD | Box–Behnken design |
| WOA-BPNN | Back-propagation neural network optimized by the whale optimization algorithm |
References
- Jiang, G.; He, H.; Yan, J.; Xie, P. Multiscale Convolutional Neural Networks for Fault Diagnosis of Wind Turbine Gearbox. IEEE Trans. Ind. Electron. 2019, 66, 3196–3207. [Google Scholar] [CrossRef]
- Silvestri, A.T.; Papa, I.; Rubino, F.; Squillace, A. On the critical technological issues of CFF: Enhancing the bearing strength. Mater. Manuf. Process. 2022, 37, 123–135. [Google Scholar] [CrossRef]
- Liu, S.; Cui, C.; Zhang, D.; Wang, C.; Wang, X. Strength degradation of 42CrMo steel in a thermal field and its characterization method. Mater. Lett. 2020, 274, 128031. [Google Scholar] [CrossRef]
- Li, T.; Li, W.; Liu, L.; Li, J.; Wang, C.; Li, S.; Sun, Q. Research Progress on the Current Situation and Prevention of Erosion of Key Components of Wind Turbines. Int. J. Extrem. Manuf. 2023, 36, 30–43. [Google Scholar]
- Tuominen, M.; Ek, M.; Saloranta, P.; Toivakka, M.; Kuusipalo, J. The effect of flame treatment on surface properties and heat sealability of low-density polyethylene coating. Packag. Technol. Sci. 2013, 26, 201–214. [Google Scholar] [CrossRef]
- Zhao, J.; Wen, F.; Gu, C.; Gao, L.; Zhang, J. Effect of vacuum induction heat treatment on the formation of intermetallic compounds between electroplated Ni coating and TC4 alloy. Vacuum 2021, 191, 110380. [Google Scholar] [CrossRef]
- Stević, Z.; Dimitrijević, S.P.; Stević, M.; Stolić, P.; Petrović, S.J.; Radivojević, M.; Radovanović, I. The Design of a System for the Induction Hardening of Steels Using Simulation Parameters. Appl. Sci. 2023, 13, 11432. [Google Scholar] [CrossRef]
- Omar, S.; Plucknett, K. The influence of DED process parameters and heat-treatment cycle on the microstructure and hardness of AISI D2 tool steel. J. Manuf. Process. 2022, 81, 655–671. [Google Scholar] [CrossRef]
- Fakir, R.; Barka, N.; Brousseau, J.; Caron-Guillemette, G. Analysis of the Mechanical Behavior of AISI 4340 Steel Cylindrical Specimens Heat Treated with Fiber Laser. J. Manuf. Process. 2020, 55, 41–56. [Google Scholar] [CrossRef]
- Chen, Z.; Zhou, G.; Chen, Z. Microstructure and hardness investigation of 17-4PH stainless steel by laser quenching. Mater. Sci. Eng. A 2012, 534, 536–541. [Google Scholar] [CrossRef]
- Martínez, S.; Lesyk, D.; Lamikiz, A.; Ukar, E.; Dzhemelinsky, V. Hardness Simulation of over-tempered Area During Laser Hardening Treatment. Phys. Procedia 2016, 83, 1357–1366. [Google Scholar] [CrossRef]
- Wang, B.; Barber, G.C.; Wang, R.; Pan, Y. Comparison of Wear Performance of Austempered and Quench-Tempered Gray Cast Irons Enhanced by Laser Hardening Treatment. Appl. Sci. 2020, 10, 3049. [Google Scholar] [CrossRef]
- Tang, Z.; Zhang, Q.; Huang, H.; Chen, Z.; Cao, J.; Yao, J. Geometric Characteristics and Microstructure of Laser-Induction Hybrid Quenching Hardened Layer on 42CrMo Steel. Met. Mater. Eng. 2022, 51, 2519–2528. [Google Scholar]
- Zhang, Q.; Tong, W.; Chen, Z.; Yao, J.; Li, Z.; Feng, K.; Kovalenko, V.S. Effect of Spot Size on Geometrical Characteristics of Laser Deep Quenching Hardened Layer of 42CrMo Steel. Surf. Technol. 2020, 49, 254–261. [Google Scholar] [CrossRef]
- Sun, S.; Yang, X.; Zhou, J.; Yang, J.; Cai, Y.; Xie, L.; Hu, J. Lubrication Analysis of Small-End Bearings of Reciprocating Engines Based on Orthogonal Experiment. Appl. Sci. 2023, 13, 3756. [Google Scholar] [CrossRef]
- Gao, X.; Zhang, N.; Zhang, Y.; Chen, M.; Ding, Y.; Jiang, B.; Liu, Y. Exploring the Heat Treatment Parameters, Microstructural Evolution, and Mechanical Properties of Ti–6Al–4V Alloy Fabricated by a Selective Laser Melting Process. Met. Mater. Int. 2022, 28, 2596–2612. [Google Scholar] [CrossRef]
- He, W.; Yao, C.; Zhao, Z.; Rong, C.; Zhang, Y.; Li, B.; Wu, X. Optimization of heat treatment program and effect of heat treatment on microstructure and flexural strength of micro-nano-Li2Si2O5 whisker-reinforced glass-ceramics. Front. Mater. 2023, 9, 1096276. [Google Scholar] [CrossRef]
- Wu, D.; Li, Z.; Shan, Q.; Zhang, F.; Han, S.; Gou, H.; Huang, Q. A finite element model with multi-flow fields for the quenching process of mill liner component made of bainite and martensite: Simulation and experimental validation. Therm. Sci. Eng. Prog. 2024, 48, 102412. [Google Scholar] [CrossRef]
- Wei, X.; Zhang, X.; He, W.; Li, J.; Zhang, J.; Li, D.; Li, S. Influence of Deep Cryogenic Treatment on Microstructural Evolution and Transformation Kinetics Simulation by Finite Element Method of Low-Carbon High-Alloy Martensitic-Bearing Steel. Steel Res. Int. 2022, 93, 2100785. [Google Scholar] [CrossRef]
- Xiao, G.; Wang, J.; Zhu, S.; He, Y.; Liu, Z.; Huang, Y. A review of research on material removal mechanisms for laser-assisted machining of difficult-to-machine materials. Surf. Sci. Technol. 2023, 1, 8. [Google Scholar] [CrossRef]
- Wu, Z.; Buck, D.; Zhang, F.; Yu, Y.; Guo, X.; Cao, P.; Zhu, Z. Finite element method and its application to cutting processes of stone–plastic composite. Int. J. Adv. Manuf. Technol. 2023, 129, 4491–4508. [Google Scholar] [CrossRef]
- Jagtap, A.D.; Shin, Y.; Kawaguchi, K.; Karniadakis, G.E. Deep Kronecker neural networks: A general framework for neural networks with adaptive activation functions. Neurocomputing 2022, 468, 165–180. [Google Scholar] [CrossRef]
- Yılmaz, O.; Bas, E.; Egrioglu, E. The Training of Pi-Sigma Artificial Neural Networks with Differential Evolution Algorithm for Forecasting. Comput. Econ. 2022, 59, 1699–1711. [Google Scholar] [CrossRef]
- Wolday, A.K.; Ramteke, M. Optimisation of methanol distillation using GA and neural network hybrid. Mater. Manuf. Process. 2023, 38, 1911–1921. [Google Scholar] [CrossRef]
- He, C.; Yan, J.; Wang, S.; Zhang, S.; Chen, G.; Ren, C. A theoretical and deep learning hybrid model for predicting surface roughness of diamond-turned polycrystalline materials. Int. J. Extrem. Manuf. 2023, 5, 035102. [Google Scholar] [CrossRef]
- Lu, F.; Liang, Y.; Wang, X.; Gao, T.; Chen, Q.; Liu, Y.; Zhou, Y.; Yuan, Y.; Liu, Y. Prediction of amorphous forming ability based on artificial neural network and convolutional neural network. Comput. Mater. Sci. 2022, 210, 111464. [Google Scholar] [CrossRef]
- Gao, J.; Wang, C.; Hao, Y.; Wang, X.; Zhao, K.; Ding, X. Prediction of molten pool temperature and processing quality in laser metal deposition based on back propagation neural network algorithm. Opt. Laser Technol. 2022, 155, 108363. [Google Scholar] [CrossRef]
- Moradi, M.; Beygi, R.; Yusof, N.M.; Amiri, A.; da Silva, L.F.M.; Sharif, S. 3D Printing of Acrylonitrile Butadiene Styrene by Fused Deposition Modeling: Artificial Neural Network and Response Surface Method Analyses. J. Mater. Eng. Perform. 2023, 32, 2016–2028. [Google Scholar] [CrossRef]
- Polat, S.; Sayan, P. Application of response surface methodology with a Box–Behnken design for struvite precipitation. Adv. Powder Technol. 2019, 30, 2396–2407. [Google Scholar] [CrossRef]
- Yıldız, A.; Uğur, L.; Parlak, I.E. Optimization of the Cutting Parameters Affecting the Turning of AISI 52100 Bearing Steel Using the Box-Behnken Experimental Design Method. Appl. Sci. 2023, 13, 3. [Google Scholar] [CrossRef]
- Mirjalili, S.; Lewis, A. The Whale Optimization Algorithm. Adv. Eng. Softw. 2016, 95, 51–67. [Google Scholar] [CrossRef]
- Sharma, M.; Janardhan, G.; Sharma, V.K.; Kumar, V.; Joshi, R.S. Comparative prediction of surface roughness for MAFM finished aluminium/silicon carbide/aluminium trioxide/rare earth oxides (Al/SiC/Al2O3)/REOs) composites using a Levenberg–Marquardt Algorithm and a Box–Behnken Design. Proc. Inst. Mech. Eng. Part E J. Process. Mech. Eng. 2022, 236, 790–804. [Google Scholar] [CrossRef]
- Chen, J.; Li, J.; Zheng, D.; Zheng, Q.; Zhang, J.; Wu, M.; Liu, C. Prediction of Grain Porosity Based on WOA–BPNN and Grain Compression Experiment. Appl. Sci. 2024, 14, 2960. [Google Scholar] [CrossRef]
- Wang, H.; Wang, X.; Tian, Y.; Ling, Y. Study on surface residual stress of 42CrMo steel treated by ultrasonic rolling extrusion. Sci. Rep. 2023, 13, 6956. [Google Scholar] [CrossRef]
- Feng, R.; Pan, J.; Zhang, J.; Shao, Y.; Chen, B.; Fang, Z.; Roy, K.; Lim, J.B. Effects of corrosion morphology on the fatigue life of corroded Q235B and 42CrMo steels: Numerical modelling and proposed design rules. Structures 2023, 57, 105136. [Google Scholar] [CrossRef]
- Bishop, T.A.; Dudewicz, E.J. Exact Analysis of Variance with Unequal Variances: Test Procedures and Tables. Technometrics 1978, 20, 419–430. [Google Scholar] [CrossRef]
- Feng, W.; Feng, F. Research on the Multimodal Digital Teaching Quality Data Evaluation Model Based on Fuzzy BP Neural Network. Comput. Intell. Neurosci. 2022, 2022, 7893792. [Google Scholar] [CrossRef]

Disclaimer/Publisher’s Note: The statements, opinions and data contained in all publications are solely those of the individual author(s) and contributor(s) and not of MDPI and/or the editor(s). MDPI and/or the editor(s) disclaim responsibility for any injury to people or property resulting from any ideas, methods, instructions or products referred to in the content. |
© 2025 by the authors. Licensee MDPI, Basel, Switzerland. This article is an open access article distributed under the terms and conditions of the Creative Commons Attribution (CC BY) license (https://creativecommons.org/licenses/by/4.0/).