Featured Application
From a public health perspective, the CUN-BAE can serve as a screening tool in physically active populations in the presence of restricted techniques for assessing body composition.
Abstract
An equation-derived body fat estimator, namely the Clínica Universidad de Navarra Body Adiposity Estimator (CUN-BAE), was established to assess the body fat percentage in adults. However, its efficiency compared to that of the bioelectrical impedance analysis (BIA) approach remains under-researched. This study aimed to assess the agreement between the body fat percentages measured using a BIA and estimated using the CUN-BAE in a sample of Lithuanian professional athletes. A single cross-sectional study was conducted using the BIA technique to measure and the CUN-BAE equation to calculate the body fat percentages of 323 study participants. The Bland–Altman plot system was applied to comparing both the body fat percentages estimated using the CUN-BAE equation and those obtained via the BIA approach. The average values of the body fat percentages found in the total sample of elite athletes and estimated using the BIA and CUN-BAE equaled 18.4 ± 5.3% and 18.7 ± 6.6%, respectively (ICC: 0.91; 95% confidence interval (CI): 0.88; 0.93). This study found that the CUN-BAE method overestimated the BIA’s calculation of the body fat percentages by 2.7% on average. Meanwhile, the comparison of adiposity in the athletes using the CUN-BAE equation and the BIA methods demonstrated a similar, although not identical, accuracy. The BIA method cannot be replaced by the CUN-BAE equation in routine sports medicine practice due to moderately sized limits of agreement (95% CI: −6.5; 7.1), even when the access to body fat measurement devices is limited. From a public health perspective, the outcomes derived from the CUN-BAE equation can possibly be extrapolated to females and to individuals competing in strength–power sports, as well as to populations of adults.
1. Introduction
The term ‘body composition’ refers to the ratio of fat mass to fat-free mass, composed of body water, bones, organs, and muscles, in the human body [1]. Body composition and dietary adequacy are recognized as potential factors affecting performance and physical health [2]. More specifically, an athlete’s body composition phenotype indicates the complex interaction between genotype and sport-related metabolic demands, nutritional goals, and physical extent. This focus on functional body composition may favor both the health and performance of an athlete [3,4]. Thus, in many sporting activities, athletes can turn to advantage by changing characteristics of their body composition such as their body weight, lean body mass, and body fat percentage (BF%). For example, whilst many sports such as boxing, Greco-Roman wrestling, judo, and taekwondo are weight-classified, athletes should fall within a specific range of body weights [5]. Other weight-sensitive aerobic sports such as road cycling, swimming, skiing, endurance running, rowing, and modern pentathlons and biathlons are equally important [6]. As a result, both athletes’ routines and diets are as adaptable to the specific demands of the cultivated sport as possible [7]. In this case, assessing and monitoring the body composition in high-performance athletes have become essential to their sporting success.
Many quantification approaches, including ‘indirect’ methods, have been developed to measure body fat accurately [2]. An ‘indirect’ evaluation of physical characteristics such as the distribution of body fat mass and fat-free mass can be conducted by applying certain technologies, namely magnetic resonance imaging (MRI) [8,9], computed X-ray tomography (CT) [8,9], air displacement plethysmography (ADP) [10], and dual-energy X-ray absorptiometry (DXA) [11,12,13,14]. However, high-priced body composition measurement techniques, referring to methods of the second level of validity, due to their large size, transportation difficulties, complexity, and the utilization of radiation, pose a challenge in terms of their deployment in many healthcare settings [15,16]. In connection to this, approaches of the third level of validity, such as bioelectrical impedance analysis (BIA) [8,17,18] and anthropometry (skinfold thickness measures) [19], were established to assess human body composition [20].
Apart from this, diverse equations for the evaluation of body composition have been proposed for application to various population groups [15,21,22,23,24,25,26,27]. Among this variety of equations, the Clínica Universidad de Navarra Body Adiposity Estimator (CUN-BAE) has made a distinction. Recently, the CUN-BAE has served as a newer algorithm broadly used for the analysis of body composition in clinical research. This is a body fat estimator determined by age, sex, and body mass index (BMI) in Caucasian adults [23,28,29,30].
Furthermore, it should be emphasised that no body composition assessment techniques have an accuracy better than 1% [2]. Although DXA has been recognized as the gold standard, it still provides errors within the measurements (the estimated error for the prediction of BF% ranges from 2 to 3% [2]). Similarly, as the range of errors for the ADP test was detected at ±1 to 2.7% [31], the ADP was recognized as a fast, accurate, and reliable method for estimating BF%. Meanwhile, the BIA, as a method of the third level of validity for assessing body composition, has a weaker accuracy in estimating BF% or body water content (the reported errors in its BF% estimates were up to ~5% [2]). In this context, while the CUN-BAE has been validated against ADP as the gold standard (test), widely applied as the first screening tool in clinical practice, and served as a proper tool for identifying patients at risk of cardiovascular diseases and type 2 diabetes [28,29,32], there is no consensus that similar effects could be expected in the testing of professional athletes using the CUN-BAE tool. In addition, elite athletes tend to have a higher lean soft tissue mass and total body water levels [33,34] when compared to those in the entire population of individuals with the same characteristics of interest.
Furthermore, since the BIA has been recognized as a safe and practical method for body composition assessments in athletes [14], there is no evidence that in intervention studies among elite athletes, the BIA can be replaced by the zero-cost CUN-BAE approach, which only includes the basic characteristics of sex (female, male), age, and BMI.
This study aimed to assess the concordance between the body fat percentages measured using the BIA and estimated using the CUN-BAE in a sample of Lithuanian elite athletes. To achieve the research objective, both an alternative hypothesis (H1) and a null hypothesis (H2) were constructed as follows:
H1.
For body composition analyses in athletes, the BIA method can be replaced by the CUN-BAE tool given the limits of agreement.
H2.
For body composition analyses in athletes, the BIA method cannot be replaced by the CUN-BAE tool given the limits of agreement.
2. Materials and Methods
2.1. Study Design
This study, cross-sectional in design, was conducted at the Lithuanian Sports Centre. A total of 323 professional athletes from an eligible cohort were pooled from the reference community (N = 362). A representative sample number [35] (n = 315), with a marginal error of 2% and considering a 95% two-sided confidence interval (CI), was estimated using OpenEpi software version 3.01 [36]. The athletes were pooled from a list authorized by the Lithuanian National Olympic Committee. The central inclusion criterion for the study participants included the following characteristics: (1) athletes standing to participate in the Olympic Games, including those belonging to the prospective Olympic shift; (2) participants of national and international competitions; (3) athletes who regularly attended a 6-day workout split; and (4) professional athletes exercising on a regular basis during the pre-season phase of competition, not subject to seasonal variations.
The exclusion criteria were defined as follows: (1) athletes taking part in competitions during the study period (n = 9); (2) sportsmen with injuries or complaints of illness (n = 5); (3) female athletes during menstruation (n = 7), as the menstrual cycle can give rise to symptoms such as weakness, pain, and overall fluid imbalance or fluid retention at rest and during exercise; and (4) athletes who refused to participate in the observational study (n = 18). Furthermore, this cross-sectional study was conducted in 2018–2019 while the data were collected in one cohort of athletes and at two moments in time, defined by the beginning (September/October) and the end (March/April) of the preparatory period. This observational study included athletes involved in Olympic sports who were categorized into two groups—endurance athletes (n = 193; 60%: rowers (n = 38), swimmers (n = 39), long-distance runners (n = 16), modern pentathletes (n = 20), road cyclists (n = 40), gymnasts (n = 6), skiers (n = 23), and biathletes (n = 17)) and strength–power athletes (n = 130; 40%: high jumpers (n = 6), boxers (n = 12), weightlifters (n = 10), basketball players (n = 39), Greco-Roman wrestlers (n = 25), discus and javelin throwers (n = 10), taekwondists (n = 8), and judokas (n = 14))—on the basis of the primary metabolic pathways (aerobic and anaerobic) in the body [37]. According to age, the cohort of athletes was divided into junior athletes (aged ≤ 18) (n = 181; 56%) and athletes over 18 years of age (n = 142; 44%), respectively.
2.2. Variables and Measurements
The dependent variable (BF%) was calculated by applying the equation established by the Clínica Universidad de Navarra, the CUN-BAE [28], as follows:
CUN-BAE (BF%) = −44.988 + (0.503 × Age) + (10.689 × Sex) + (3.172 × BMI) − (0.026 × BMI2) + (0.181 × BMI × Sex) − (0.02 × BMI × Age) − (0.005 × BMI2 × Sex) + (0.00021 × BMI2 × Age)
The age of the athletes was measured in years, and sex was codified as female = 1 and male = 0. BMI was calculated as weight in kilograms (kg) divided by height in meters squared (m2). Currently, the four categories of BMI used to estimate weight in adults are as follows: (1) underweight status (BMI < 18.5 kg/m2); (2) a healthy weight for adults (BMI = 18.5–25 kg/m2); (3) overweight status (BMI = 25–30 kg/m2); and (4) obese adults (BMI > 30 kg/m2) [38]. For the CUN-BAE, the cut-off points for body fat were considered to be normal (BF% < 20% in males and <30% in females), overweight (BF% ranging from 20 to 25% in males and from 30 to 35% in females), and obese (BF% > 25% in males and >35% in females) [28,39].
The body composition analyzer used in our study was manufactured by Jawon Medical, developed in cooperative research with Korea and Japan from 1996 to 1999, and commercialized in 1999. More specifically, the independent variable (BF%) was estimated using the BIA [20] technique (the body composition analyzer X-Scan Plus (the International Organization for Standardization adopted by the European Union (EN-ISO): 13488 [40], Seoul, South Korea). The assessment of body composition was performed according to the protocols recommended by Kyle at al. [41] and Lohman [42]. The X-Scan Plus prediction equations were developed based on body composition estimates derived from an a priori criterion, namely an isotope dilution approach. The X-Scan Plus bioelectrical impedance analyzer operated at multi-frequencies of 5, 50, 250, 550, and 1000 kHz and was suitable for providing outcomes such as fat-free mass and BF% via eight touch electrodes (with two on each foot and two on each hand). Moreover, using the multi-frequency technology at low frequencies (<50 kHz) allowed the bioelectric current to pass through the extracellular fluid in the human body. In contrast, at frequencies above 100 kHz and up to 1000 kHz, the bioelectric current could pass through all body fluids and tissues [8,17]. Thus, the multi-frequency bioelectrical impedance analysis provided enhanced body composition outcomes in a time-efficient (≤5 min) manner. It should be highlighted that the estimates of BF% and fat-free mass obtained from the multi-frequency bioelectrical impedance analysis demonstrated good agreement with a four-compartment model in normal-weight adults [43]. Furthermore, the X-Scan Plus had a built-in stadiometer for the measurement of standing height to the nearest 0.1 cm [42]. It should be highlighted that the X-Scan Plus device had an auto-calibration function that was used every time the device was turned on. Thus, the absence of the need to calibrate the X-Scan Plus device could also be considered an advantage of this study. The accuracy of the weight measurements was ensured in the presence of a sports nutritionist throughout all of the investigation procedures. However, auto-calibration of the X-Scan Plus device was performed whenever the weight measurements seemed incorrect.
In addition, athletes should avoid exercise (>24 h) before the measurement procedure to restrict the influence of muscle damage or injury, increases in body temperature, excessive sweating, or the accumulation of skin electrolytes. Also, some scientific data have proposed that glycogen depletion in the muscles and loading may impact BIA measurements [44]. Therefore, the athletes were guided to ensure the proper hydration and muscle glycogen content according to the proper levels of food and fluid intake and maintain their physical activity loads before the measurement procedure took place. Hence, before the assessment of their body composition, the athletes were asked to follow pre-testing guidelines: (1) emptying their bowels at least 30 min before testing; (2) drinking no liquid for 2 h; (3) refraining from exercise for 24 h; (4) and refraining from drinking alcohol for 48 h.
2.3. Statistical Analysis
The Kolmogorov–Smirnov test was used to verify the normality of the data distribution. For normally distributed data, the means ± standard deviations (SDs) were calculated. For bivariate analyses, the intraclass correlation coefficient (ICC) was used to assess the consistency of the BF% measurements obtained using the CUN-BAE equation and the BIA method.
It should be noted that once there is a need to compare two methods, the correct statistical approach is not evident. Many studies provide only the Pearson’s correlation coefficient between the outcomes of two measurement methods as an indicator of agreement [45]. However, bivariate correlation is not recommended as a statistical analysis approach to assessing the comparability between methods. Within this case, our study proposed replacing one method (BIA) for another (the CUN-BAE); therefore, Bland–Altman graph plots were used to graphically assess the agreement between the BF% calculated using the CUN-BAE equation and the BF% estimated using the BIA method [46,47]. In the Bland–Altman graph plots, the y-axis represented the difference between the two approaches (∆ BIA − CUN-BAE equation (BF%)), and the x-axis displayed the average of the two measurements ([BIA + CUN-BAE]/2 (BF%)). Whilst it was recommended that 95% of the data points should fall within ±1.96 SDs of the mean differences, the upper and lower limits of agreement (95% CIs) were estimated.
As the agreement between the two methods (CUN-BAE and BIA) depended on the total bias, the differential bias (α), which represented the constant difference between the true trait and the measurement method, was calculated for all cases. Additionally, the proportional biases (β) were calculated using a linear regression analysis to confirm or deny the trends in the Bland–Altman graph plots which displayed the athlete subsamples stratified by sex, age, and sport discipline. In cases where α = 0 and β ≠ 1, it was proposed that the measurement method was unbiased.
The statistical analysis was performed using the Statistical Package for the Social Sciences (IBM SPSS Statistics) version 25.0 for Windows (IBM Corp, Armonk, NY, USA). In all of the tests used for the data analysis, a 2-tailed p-value ≤ 0.05 was considered statistically significant. Statistical visualization and graphical representation of the data were performed using SPSS software version 25.0.
3. Results
Out of all the pooled and studied elite athletes who composed the sample, 72% were male and 38% were female. Their training practice range was 7.9 ± 3.8 years, the intensity of their exercise sessions was 5.9 ± 0.7 days per week, and the average workout duration equaled 186 ± 62 min during the daily workout routine. More detailed information on the demographic data of this sample of high-performance athletes is presented in Table 1.

Table 1.
Demographic and anthropometric data on high-performance athlete sample.
It has been well documented that sex-based physiological differences can cause dissimilarities (in terms of size) in the body composition of male and female athletes [48,49]; therefore, the body composition (body weight (kg), height (m), fat-free mass (%), BMI (kg/m2), and BF% of the athletes was evaluated according to sex (males vs. females), as displayed in Table 1. The mean body weight, fat-free mass, and BMI of the athletes involved in this study were 72.2 ± 14.9 kg, 81.5 ± 5.4%, and 22.1 ± 2.8 kg/m2, respectively. Given the body composition characteristics of male athletes, statistically significant (p < 0.001) differences were identified between their body weight, fat-free mass, BMI, and BF% and those of the sample of female athletes. As regarded body fat percentage, the average values equaled 18.4 ± 5.3% and 18.7 ± 6.6% when using the BIA and CUN-BAE, respectively.
3.1. The Bivariate Analysis
Firstly, as shown in Table 2, in the total elite athlete sample, the ICC calculated between both the CUN-BAE and BIA methods for estimating BF% was 0.91 (95% CI: 0.88; 0.93). With regard to age and sport discipline, the ICCs were higher for junior athletes (ICC 0.96; 95% CI: 0.95; 0.97) and strength–power athletes (ICC 0.92; 95% CI: 0.88; 0.94) while they were lower for both male and female athletes, endurance athletes, and athletes within the 19–33-year age range.
Table 2.
Comparison of body fat (%) measured using the CUN-BAE anthropometry equation and using the bioelectrical impedance analysis (BIA) as the reference method.
Overall, conformity between both methods, namely the CUN-BAE and BIA, was detected. At the same time, the established consistency of the measurements obtained using the two methods did not necessarily lead to agreement.
3.2. The Bland–Altman Analysis
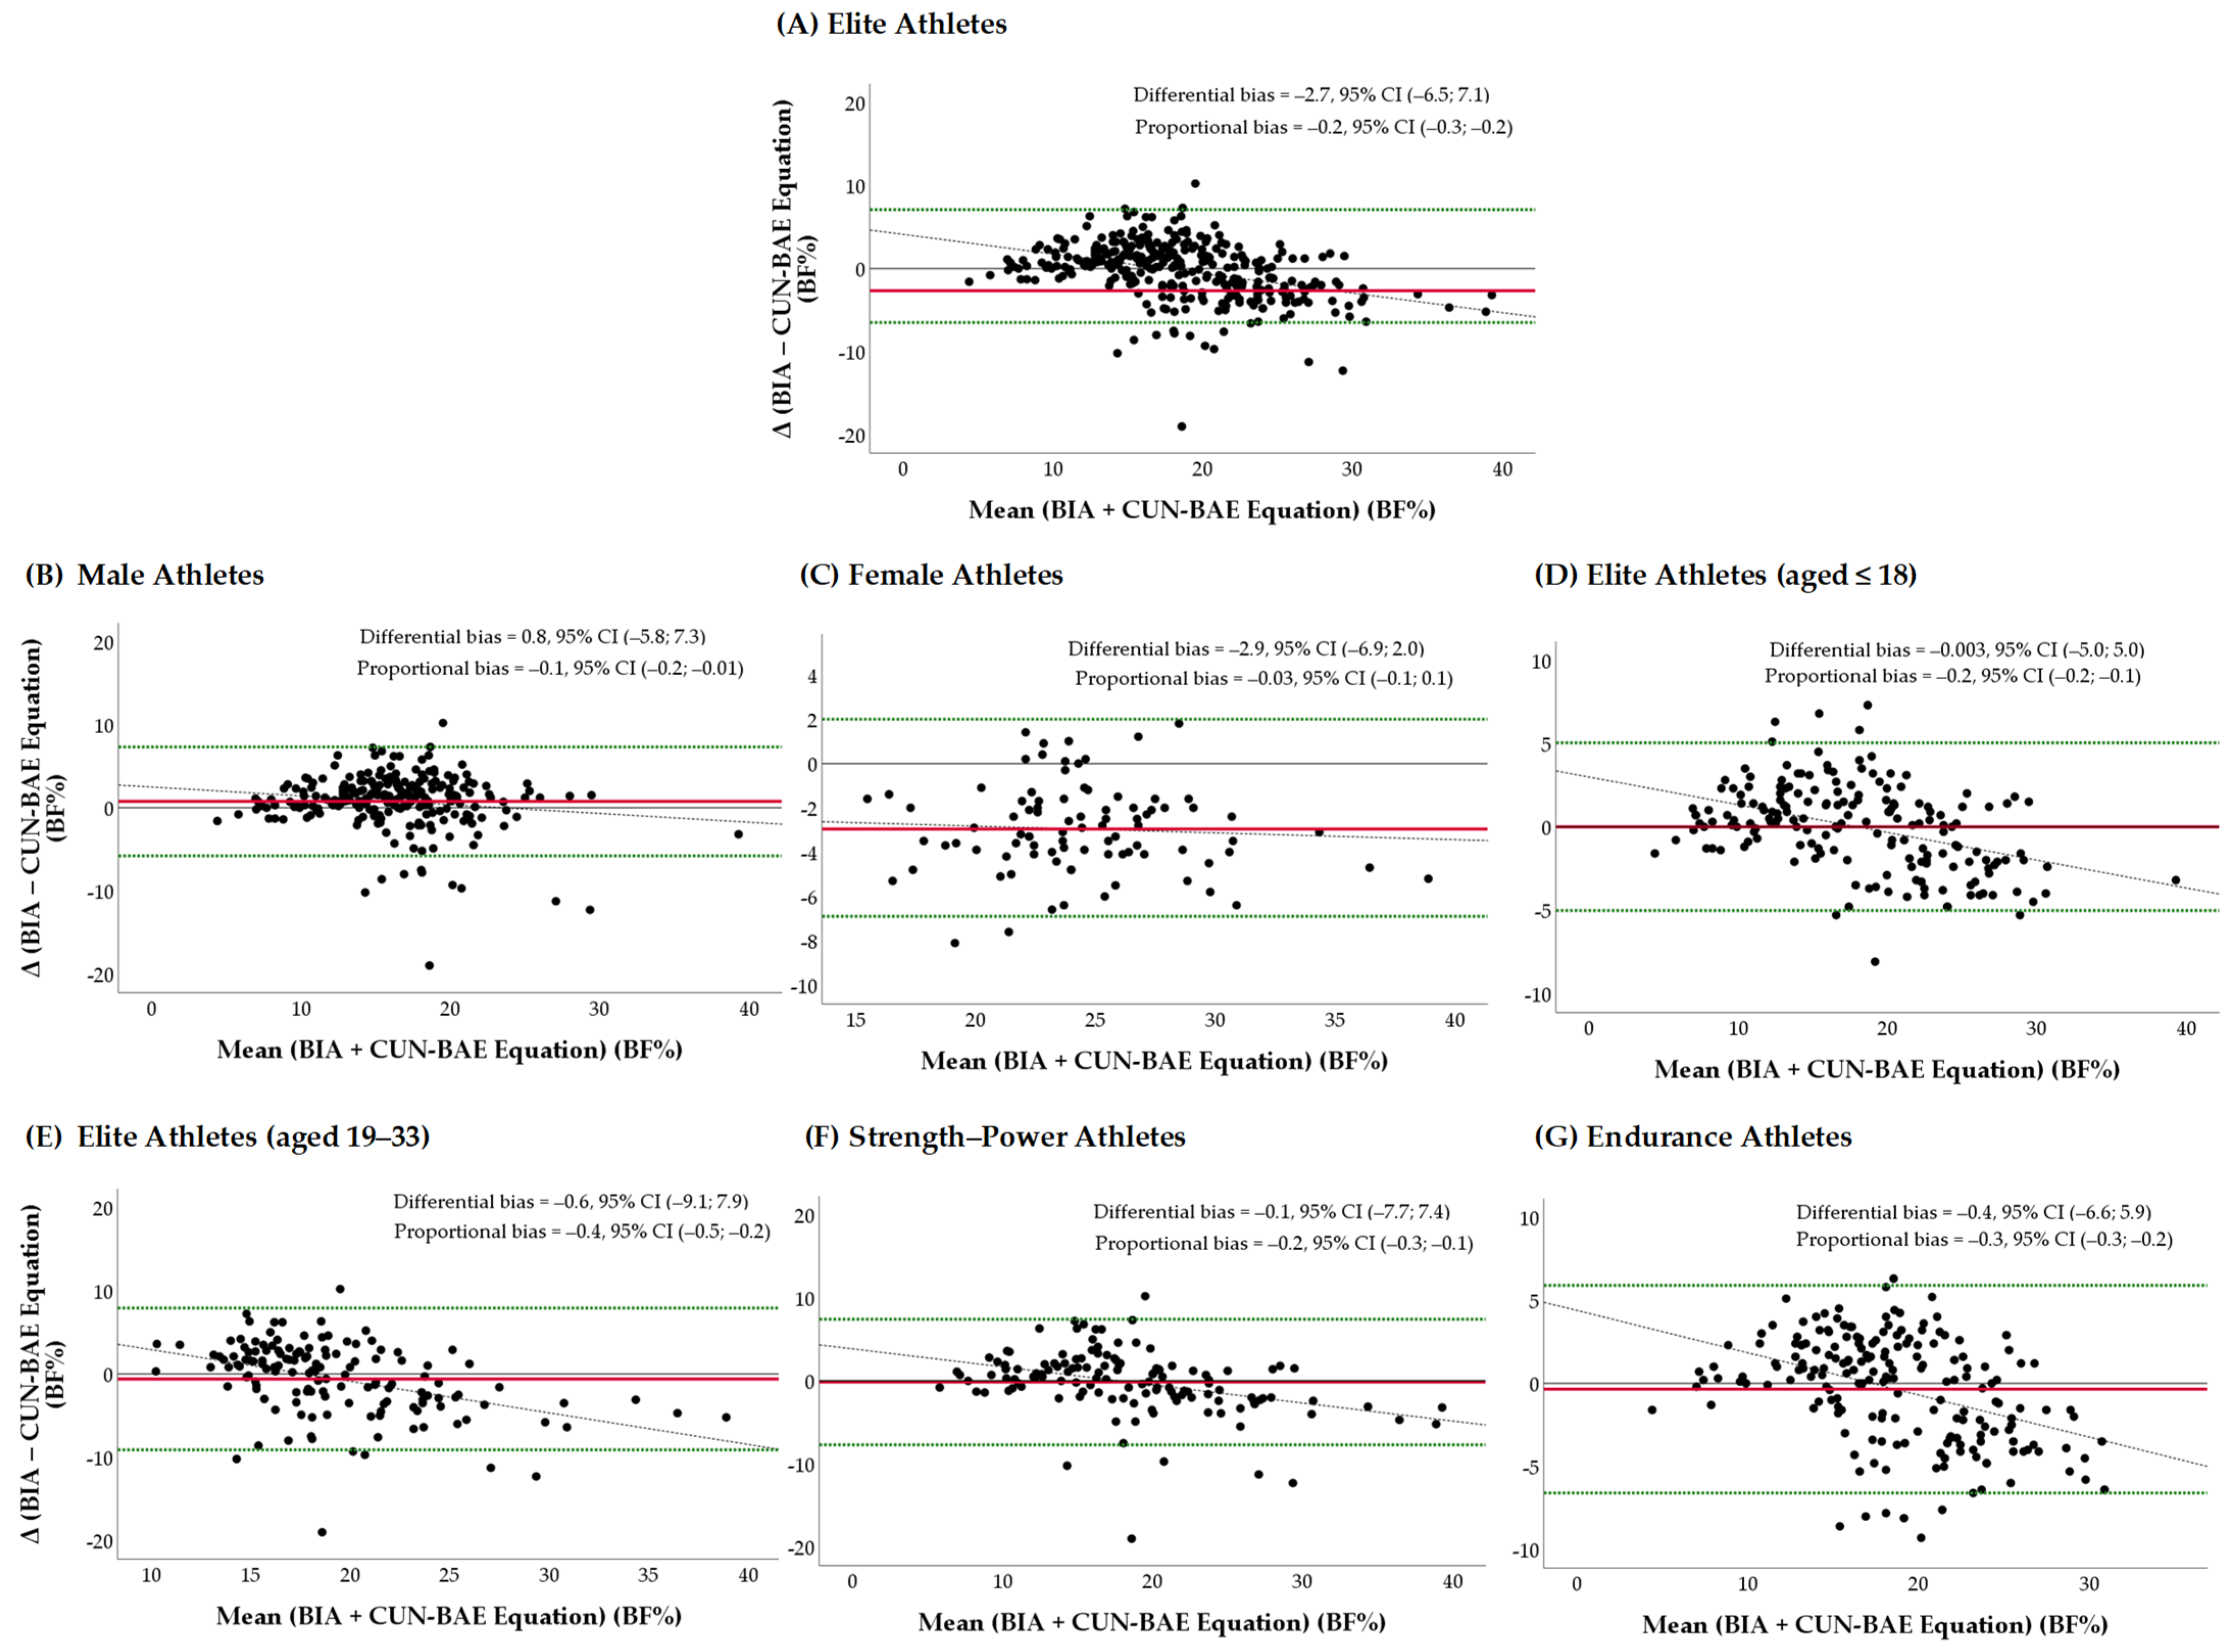
As shown in Figure 1A–G, the Bland–Altman graph plots represent the differences between the BF% measured using the BIA and estimated using the CUN-BAE against the average of the measurement in the comparison sample of elite athletes and the subsamples stratified by sex, age, and sport discipline.

Figure 1.
(A–G) Bland–Altman plots showing the limits of agreement between BF% measured using the BIA and estimated using the CUN-BAE in the comparison sample of elite athletes and the subsamples stratified by sex, age, and sport discipline: (A) Elite athletes (total): the differential bias α (differential bias): −2.7, 95% CI: −6.5; 7.1 and no β (proportional bias): −0.2; 95% CI: −0.3; −0.2. (B) Elite male athletes: α: 0.8, 95% CI: −5.8; 7.3 and β: −0.1; 95% CI: −0.2; −0.01. (C) Elite female athletes: α: −2.9; 95% CI: −6.9; 2.0 and no β: −0.03; 95% CI: −0.1; 0.1. (D) Elite athletes aged 14–18: α: −0.03; 95% CI: −5.0; 5.0 and no β: −0.2; 95% CI: −0.2; 0.1. (E) Elite athletes aged 18–33: α: −0.6; 95% CI: −9.1; 7.9 and β: −0.4; 95% CI: −0.5; −0.2. (F) Strength–power athletes: α: −0.1; 95% CI: −7.7; 7.4 and no β: −0.2; 95% CI: −0.3; −0.1. (G) Endurance athletes: α: −0.4; 95% CI: −6.6; 5.9 and β: −0.3; 95% CI: −0.3; −0.2. Dashed lines represent 95% limits of agreement; y = 0 is a line of the perfect average agreement. The middle red lines indicate the mean difference between the measured and estimated BF%. Dotted black lines represent the correlation lines. BIA—bioelectrical impedance analysis; BF—body fat; CUN-BAE—the body fat prediction equation; 95% CI—confidence interval.
The differential bias (α) of −2.7 (95% CI: −6.5; 7.1) units was represented by the gap between the x-axis in the sample of elite athletes. The data suggested that on average, the CUN-BAE method measured 2.7% more BF than the BIA, as the mean difference was nonzero. However, the Bland–Altman graph plots represented the differences in the differential biases depending on the elite athletes’ age, sex, and sport discipline. More specifically, on average, the CUN-BAE method measured 2.9% more BF; however, the narrower limit of agreement range was ±4.5 BF% (from −6.9 to 2.0 BF%) in the sample of female athletes. In the meantime, more favorable agreement was observed between the CUN-BAE method and the BIA in the subsamples of elite athletes aged 14–18 (α: −0.03; 95% CI: −5.0; 5.0) and those competing in strength and power sports (α: −0.1; 95% CI: −7.7; 7.4). Overall, more than 50% of the values were observed inside the limit, which indicated that there was agreement between the two assessment methods in all groups of athletes under analysis.
As displayed in Figure 1A–G, the variability in the proportional differences (proportional biases (β)) between the two measurements tended to become smaller (the β values ranged from −0.4 to −0.1, and the 95% CIs ranged from −0.5 to −0.2) as the averages increased in the subsamples of elite male athletes, those aged 18 or over, and those competing in endurance sports. Thus, in the athlete subsamples mentioned above, the existence of proportional biases indicated that the two methods, namely the CUN-BAE and BIA, did not agree equally through the range of measurements.
4. Discussion
4.1. The CUN-BAE for Intervention Goals
Although the BIA approach is commonly applied in athletes’ routines, additionally, this study explored the concordance between the BIA and the CUN-BAE. Since reasonable accuracy between the two different methods was found, individual errors may prevent the replacement of the BIA approach with the CUN-BAE in interventional studies. More specifically, in terms of the total sample of high-performance athletes studied, this study found an agreement between the BIA method and the CUN-BAE equation method in calculating BF%. However, our study suggested that on average, the CUN-BAE method measured 2.7% more BF than the BIA. Our findings were consistent with the results published by Prijatmoko et al. [50], which referred to a correlation between the CUN-BAE equation method and the BIA method in calculating BF%. However, it was found that the CUN-BAE method overestimated the BIA’s calculation of BF%. In contrast, Endukuru et al. [51] found a significant absolute agreement between the CUN-BAE equation and the BIA for the BF% in middle-aged southern Indians. Also, these authors highlighted that the ‘CUN-BAE provides precise BF% estimates similar to the BIA method making it suitable for routine clinical practice when an access to BF% measurement devices is limited’ [51].
In addition, according to our study results, the evidence of the validity of the CUN-BAE rests on low differential bias and moderately sized limits of agreement (95% CI: −6.5; 7.1). Thus, where the Bland–Altman plot system does not reflect statistics for seeing whether the limits of agreement are exceeded or not [45], our study can only speculate that the CUN-BAE’s usefulness a priori cannot be related to clinical implications or interventional study results. This inductive hypothesis was confirmed by the results obtained from this study, where the level of evidence of the CUN-BAE’s validity varied in different athlete groups according to age, sex, and sports specialty.
Particularly, for the subsamples of male athletes aged 18 or over as well as those competing in endurance sports, our study found proportional biases between the two measurements, the CUN-BAE equation and the BIA. In this case, the findings of our study meant that the CUN-BAE equation for measuring BF% was more appropriate for females, junior athletes (aged from 14 to 18), and those competing in strength–power sports. Regardless of this, when the athletes’ sex was considered, the CUN-BAE substantially overestimated the BF% in the female athletes overall compared to that measured using the BIA. This difference may exist due to the disparities in the fat distribution patterns among male and female athletes. It has been well documented that females have a higher BF% (in terms of subcutaneous fat), which can influence the outcomes derived from the CUN-BAE equation. This finding of our study presupposes the necessity of further research in order to customize the algorithms of the CUN-BAE equation depending on sex variations due to biological variances.
Furthermore, scientific research has shown that lipid metabolism during endurance exercise is related to increased fatty acid turnover, as endurance-trained athletes have a high oxidative capacity [52]; therefore, athletes representing aerobic sports have a relatively lower BF%. In addition, the carbohydrate and fat metabolism in the body is more labile during adolescence. It should be highlighted that the results produced by using the CUN-BAE equation may be applied to populations of adolescents, too. Nonetheless, the CUN-BAE equation created via the Bod-Pod approach could also be reconsidered and coupled with variables related to sports activities during future research.
4.2. The CUN-BAE for Population-Based Goals
Generally, from a public health perspective, there may be a variety of reasons why physically active individuals have their body composition assessed in a similar way to athletes. The main reasons include determination of the effectiveness of an intervention, as well as tracking body composition values. For intervention purposes, the method of body composition assessment should not only be reliable but also accurate (e.g., DXA or ADP) [2].
On the other hand, whilst the BIA method has been documented to have poorer accuracy for estimating BF% (in terms of errors, depending on the variability in the hydration of the soft tissue, in the estimates of up to ~5%) compared to that of both DXA or ADP, it is still possible to use this approach to track changes in body composition according to specific goals or apply it to population-based studies.
Moreover, similarly to the BIA method, the CUN-BAE equations were constructed and validated via the ADP approach for predicting body fat mass, too. Within this context, in terms of population-based goals related to assessing BF%, the results obtained from our study, referring to the moderate level of agreement limits between the BIA method and the CUN-BAE equation method in calculating body fat percentages, imply the usefulness of applying the CUN-BAE tool alongside the BMI equation where other methods, namely DXA, ADP, or BIA, are limited.
4.3. Limitations
There may be some possible limitations of our study. All of the methods of human body composition assessment are considered ‘indirect’; therefore, they have limited accuracy. Even though an ‘indirect’ method for assessing BF% does not exist, both the BIA and the CUN-BAE methods are considered ‘indirect’ methods for estimating BF%. In the present study, the reference outcomes were estimated using the BIA; however, the gold standard may possibly require other more complex techniques since BIA measurements can produce random errors due to inter-individual differences in body composition, geometry, and size, resulting in non-uniform conductivity [14].
Secondly, the raw estimations obtained via BIA differ amid devices depending on technological and biological factors; therefore, healthcare professionals should be aware of these factors when extrapolating prediction equations established for body composition assessment [53].
The third limitation may be related to the changes that can occur in an athlete’s body weight status resulting from the seasonality of their physical activity (in terms of pre- and in-season training); therefore, further cohort studies should be continued on the basis of the data obtained in this single cross-sectional study.
Finally, whilst the representative sample size of the athletes was modest, the cross-sectional study we conducted may have held some biases because such research is not able to establish cause-and-effect relationships between the variables studied. However, taking into account the representative sample size and the probability sampling technique used, these study results can be generalized and transferred to populations of physically active people exclusively through population-based studies.
5. Conclusions
This study found agreement between the BIA method and the CUN-BAE equation method in calculating body fat percentages. Regardless of this, the CUN-BAE equation method estimated a similar, although not identical, accuracy to that of the BIA method in assessing adiposity in athletes.
While a purposeful body composition evaluation necessitates a solution-oriented implementation to benefit an individual athlete [2], the bioelectrical impedance analysis method cannot be replaced with the CUN-BAE equation as a surrogate, as it is not suitable for routine sports medicine practice due to the moderately sized limits of agreement between these two methods, even when access to body fat measurements via dual-energy X-ray absorptiometry or air displacement plethysmography is not available.
Alternately, for population-based goals, the practical recommendations for sport professionals would relate to the use of the body adiposity estimator, which could serve as a screening tool in physically active populations in the presence of restricted techniques for assessing their body composition.
From a public health perspective, the outcomes derived from the CUN-BAE equation could possibly be extrapolated to females, individuals competing in strength–power sports, and adult populations. Meanwhile, the CUN-BAE equation should be applied with caution in males aged 18 or over and athletes competing in endurance sports. Future research should focus on constructing and validating body composition assessment tools, accompanied by regression equations customized to sex-specific populations with sport-specific characteristics.
Author Contributions
Conceptualization: M.B. and R.S. Methodology: M.B., R.S. and I.K. Software: J.L. and M.B. Visualization: M.B. and J.L. Data curation: M.B., R.S. and I.K. Investigation: M.B., R.S. and I.K. Writing—review and editing: M.B., R.S. and I.K. Validation: R.S., I.K., M.B. and J.L. Writing—original draft preparation: M.B. Resources and supervision: I.K. and J.L. All authors have read and agreed to the published version of the manuscript.
Funding
This research received no external funding.
Institutional Review Board Statement
This study was conducted in accordance with the Declaration of Helsinki and approved by the Vilnius Regional Committee of Biomedical Research Ethics (protocol code 158200-17-898-419, 11 April 2017).
Informed Consent Statement
Informed consent was obtained from all of the subjects involved in this study.
Data Availability Statement
The original contributions presented in this study are included in the article. Further inquiries can be directed to the corresponding author.
Conflicts of Interest
The authors declare no conflicts of interest.
References
- Padwal, R.; Majumdar, S.R.; Leslie, W.D. Relationship among body fat percentage, body mass index, and all-cause mortality. Ann. Intern. Med. 2016, 165, 604. [Google Scholar] [CrossRef] [PubMed]
- Ackland, T.R.; Lohman, T.G.; Sundgot-Borgen, J.; Maughan, R.J.; Meyer, N.L.; Stewart, A.D.; Müller, W. Current status of body composition assessment in sport: Review and position statement on behalf of the ad hoc research working group on body composition health and performance, under the auspices of the I.O.C. Medical Commission. Sports Med. 2012, 42, 227–249. [Google Scholar] [CrossRef] [PubMed]
- Lukaski, H.; Raymond-Pope, C.J. New frontiers of body composition in sport. Int. J. Sports Med. 2021, 42, 588–601. [Google Scholar] [CrossRef]
- Mathisen, T.F.; Ackland, T.; Burke, L.M.; Constantini, N.; Haudum, J.; Macnaughton, L.S.; Meyer, N.L.; Mountjoy, M.; Slater, G.; Sundgot-Borgen, J. Best practice recommendations for body composition considerations in sport to reduce health and performance risks: A critical review, original survey and expert opinion by a subgroup of the IOC consensus on Relative Energy Deficiency in Sport (REDs). Br. J. Sports Med. 2023, 57, 1148–1158. [Google Scholar] [CrossRef]
- Franchini, E.; Brito, C.J.; Artioli, G.G. Weight loss in combat sports: Physiological, psychological and performance effects. J. Int. Soc. Sports Nutr. 2012, 9, 52. [Google Scholar] [CrossRef] [PubMed]
- Martinsen, M.; Sundgot-Borgen, J. Higher prevalence of eating disorders among adolescent elite athletes than controls. Med. Sci. Sports. Exerc. 2013, 45, 1188–1197. [Google Scholar] [CrossRef]
- Sundgot-Borgen, J.; Torstveit, M.K. Aspects of disordered eating continuum in elite high-intensity sports. Scand. J. Med. Sci. Sports 2010, 20, 112–121. [Google Scholar] [CrossRef]
- Heymsfield, S.; Lohman, T.; Wang, Z.; Going, S.B. Human Body Composition; Human Kinetics: Champaign, IL, USA, 2005; Volume 918. [Google Scholar]
- MacDonald, A.J.; Greig, C.A.; Baracos, V. The advantages and limitations of cross-sectional body composition analysis. Curr. Opin. Support. Palliat. Care 2011, 5, 342–349. [Google Scholar] [CrossRef]
- Bentzur, K.M.; Kravitz, L.; Lockner, D.W. Evaluation of the BOD POD for estimating percent body fat in collegiate track and field female athletes: A comparison of four methods. J. Strength Cond. Res. 2008, 22, 1985–1991. [Google Scholar] [CrossRef]
- Borga, M.; West, J.; Bell, J.; Harvey, N.; Romu, T.; Heymsfield, S.B.; Leinhard, O.D. Advanced body composition assessment: From body mass index to body composition profiling. J. Investig. Med. 2018, 66, 1–9. [Google Scholar] [CrossRef] [PubMed]
- Liao, Y.-S.; Li, H.-C.; Lu, H.-K.; Lai, C.-L.; Wang, Y.-S.; Hsieh, K.-C. Comparison of bioelectrical impedance analysis and dual energy x-ray absorptiometry for total and segmental bone mineral content with a three-compartment model. Int. J. Environ. Res. Public Health 2020, 17, 2595. [Google Scholar] [CrossRef] [PubMed]
- Pietrobelli, A.; Formica, C.; Wang, Z.; Heymsfield, S.B. Dual-energy x-ray absorptiometry body composition model: Review of physical concepts. Am. J. Physiol. 1996, 27, E941–E951. [Google Scholar] [CrossRef] [PubMed]
- Moon, J.R. Body composition in athletes and sports nutrition: An examination of the bioimpedance analysis technique. Eur. J. Clin. Nutr. 2013, 67, S54–S59. [Google Scholar] [CrossRef] [PubMed]
- Belarmino, G.; Horie, L.; Sala, P.; Torrinhas, R.; Heymsfield, S.; Waitzberg, D. Body adiposity index performance in estimating body fat in a sample of severely obese Brazilian patients. Nutr. J. 2015, 14, 130. [Google Scholar] [CrossRef]
- Chambers, A.; Parise, E.; Mccrory, J.; Cham, R. A comparison of prediction equations for the estimation of body fat percentage in non-obese and obese older Caucasian adults in the United States. J. Nutr. Health Aging 2014, 18, 586–590. [Google Scholar] [CrossRef]
- Heyward, V.H.; Wagner, D.R. Applied Body Composition Assessment; Human Kinetics: Champaign, IL, USA, 2004. [Google Scholar]
- Campa, F.; Toselli, S.; Mazzilli, M.; Gobbo, L.A.; Coratella, G. Assessment of body composition in athletes: A narrative review of available methods with special reference to quantitative and qualitative bioimpedance analysis. Nutrients 2021, 13, 1620. [Google Scholar] [CrossRef] [PubMed]
- Jackson, A.S.; Pollock, M.L.; Ward, A. Generalized equations for predicting body density of women. Med. Sci. Sports Exerc. 1980, 12, 175–181. [Google Scholar] [CrossRef] [PubMed]
- Holmes, C.J.; Racette, S.B. The utility of body composition assessment in nutrition and clinical practice: An overview of current methodology. Nutrients 2021, 13, 2493. [Google Scholar] [CrossRef]
- Woolcott, O.O.; Bergman, R.N. Relative fat mass (RFM) as a new estimator of whole-body fat percentage—A cross-sectional study in American adult individuls. Sci. Rep. 2018, 8, 10980. [Google Scholar] [CrossRef] [PubMed]
- Mill-Ferreyra, E.; Cameno-Carrillo, V.; Saúl-Gordo, H.; Camí-Lavado, M.C. Estimación del porcentaje de grasa corporal en función del índice de masa corporal y perímetro abdominal: Fórmula Palafolls. Semergen 2019, 45, 101–108. [Google Scholar] [CrossRef] [PubMed]
- Molina-Luque, R.; Romero-Saldaña, M.; Álvarez-Fernández, C.; Bennasar-Veny, M.; Álvarez-López, A.; Molina-Recio, G. Equation Córdoba: A simplified method for estimation of body fat (ECORE-BF). Int. J. Environ. Res. Public Health 2019, 16, 4529. [Google Scholar] [CrossRef] [PubMed]
- Cui, Z.; Truesdale, K.P.; Cai, J.; Stevens, J. Evaluation of anthropometric equations to assess body fat in adults. Med. Sci. Sport. Exerc. 2014, 46, 1147–1158. [Google Scholar] [CrossRef]
- Suliga, E.; Ciesla, E.; Gluszek-Osuch, M.; Rogula, T.; Gluszek, S.; Koziel, D. The usefulness of anthropometric indices to identify the risk of metabolic syndrome. Nutrients 2019, 11, 2598. [Google Scholar] [CrossRef] [PubMed]
- de Moraes, A.M.; Vidal-Espinoza, R.; Bergamo, R.R.; Gómez-Campos, R.; de Lazari, E.; de Campos, L.F.C.C.; Sulla-Torres, J.; Cossio-Bolaños, M. Prediction of fat-free mass from body surface area in young basketball players. BMC Sports Sci. Med. Rehabil. 2024, 16, 65. [Google Scholar] [CrossRef] [PubMed]
- Serafini, S.; Charrier, D.; Izzicupo, P.; Esparza-Ros, F.; Vaquero-Cristóbal, R.; Petri, C.; Mecherques-Carini, M.; Baglietto, N.; Holway, F.; Tinsley, G.; et al. Anthropometric-based predictive equations developed with multi-component models for estimating body composition in athletes. Eur. J. Appl. Physiol. 2024. [Google Scholar] [CrossRef]
- Gómez-Ambrosi, J.; Silva, C.; Catalán, V.; Rodríguez, A.; Galofré, J.C.; Escalada, J.; Valentí, V.; Rotellar, F.; Romero, S.; Ramírez, B.; et al. Clinical usefulness of a new equation for estimating body fat. Diabetes Care 2012, 35, 383–388. [Google Scholar] [CrossRef] [PubMed]
- Gómez-Ambrosi, J.; Silva, C.; Galofré, J.C.; Escalada, J.; Santos, S.; Millán, D.; Vila, N.; Ibañez, P.; Gil, M.J.; Valentí, V.; et al. Body mass index classification misses subjects with increased cardiometabolic risk factors related to elevated adiposity. Int. J. Obes. 2012, 36, 286–294. [Google Scholar] [CrossRef]
- Davila-Batista, V.; Gómez-Ambrosi, J.; Fernández-Villa, T.; Molina, A.J.; Frühbeck, G.; Martín, V. Escala colorimétrica del porcentaje de grasa corporal según el estimador de adiposidad CUN-BAE. Aten. Prim. 2016, 48, 422–423. [Google Scholar] [CrossRef] [PubMed]
- Muntean, P.; Popa, A.; Miclos-Balica, M.; Schick, F.; Munteanu, O.; Pupazan, V.; Neagu, A.; Neagu, M. Learning effects in air displacement plethysmography. Life 2023, 13, 1315. [Google Scholar] [CrossRef] [PubMed]
- Martín, V.; Dávila-Batista, V.; Castilla, J.; Godoy, P.; Delgado-Rodríguez, M.; Soldevila, N.; Molina, A.J.; Fernandez-Villa, T.; Astray, J.; Castro, A.; et al. Comparison of body mass index (BMI) with the CUN-BAE body adiposity estimator in the prediction of hypertension and type 2 diabetes. BMC Public Health 2016, 16, 82. [Google Scholar] [CrossRef]
- Giorgi, A.; Vicini, M.; Pollastri, L.; Lombardi, E.; Magni, E.; Andreazzoli, A.; Orsini, M.; Bonifazi, M.; Lukaski, H.; Gatterer, H. Bioimpedance patterns and bioelectrical impedance vector analysis (BIVA) of road cyclists. J. Sports Sci. 2018, 36, 2608–2613. [Google Scholar] [CrossRef] [PubMed]
- Carrasco-Marginet, M.; Castizo-Olier, J.; Rodríguez-Zamora, L.; Iglesias, X.; Rodríguez, F.A.; Chaverri, D.; Brotons, D.; Irurtia, A. Bioelectrical impedance vector analysis (BIVA) for measuring the hydration status in young elite synchronized swimmers. PLoS ONE 2017, 12, e0178819. [Google Scholar] [CrossRef]
- Pourhoseingholi, M.A.; Vahedi, M.; Rahimzadeh, M. Sample size calculation in medical studies. Gastroenterol. Hepatol. Bed Bench 2013, 6, 14–27. [Google Scholar]
- Sullivan, K.M. Open Source Statistics for Public Health. Available online: http://www.openepi.com/SampleSize/SSCohort.htm (accessed on 5 October 2024).
- Skernevičius, J.; Milašius, K.; Raslanas, A.; Dadelienė, R. Sporto treniruotė (Sports training). In Sportininkų Gebėjimai ir jų Ugdymas (Skills and Training of Athletes), 1st ed.; Čepulėnas, A., Saplinskas, J., Paulauskas, R., Eds.; Lithuanian University of Educational Sciences Press: Vilnius, Lithuania, 2011; pp. 165–217. [Google Scholar]
- A Healthy Lifestyle—WHO Recommendations. Available online: https://www.who.int/europe/news-room/fact-sheets/item/a-healthy-lifestyle---who-recommendations (accessed on 6 September 2024).
- Okorodudu, D.O.; Jumean, M.F.; Montori, V.M.; Romero-Corral, A.; Somers, V.K.; Erwin, P.J.; Lopez-Jimenez, F. Diagnostic performance of body mass index to identify obesity as defined by body adiposity: A systematic review and meta-analysis. Int. J. Obes. 2010, 34, 791–799. [Google Scholar] [CrossRef]
- EN ISO 13488:2000; Quality Systems—Medical Devices—Particular Requirements for the Application of EN ISO 9002 (Revision of EN 46002:1996) (Identical to ISO 13488:1996). ISO: Geneva, Switzerland, 2000.
- Kyle, U.G.; Bosaeus, I.; De Lorenzo, A.D.; Deurenberg, P.; Elia, M.; Gómez, J.M.; Heitmann, B.L.; Kent-Smith, L.; Melchior, J.C.; Pirlich, M.; et al. Bioelectrical impedance analysis–part I: Review of principles and methods. Clin. Nutr. 2004, 23, 1226–1243. [Google Scholar] [CrossRef] [PubMed]
- Lohman, T.G.; Roche, A.F.; Martorell, R. Anthropometric Standardization Reference Manual; Human Kinetics Books: Champaign, IL, USA, 1988. [Google Scholar]
- Brewer, G.J.; Blue, M.N.; Hirsch, K.R.; Saylor, H.E.; Gould, L.M.; Nelson, A.G.; Smith-Ryan, A.E. Validation of InBody 770 bioelectrical impedance analysis compared to a four-compartment model criterion in young adults. Clin. Physiol. Funct. Imaging 2021, 41, 317–325. [Google Scholar] [CrossRef]
- Shiose, K.; Yamada, Y.; Motonaga, K.; Sagayama, H.; Higaki, Y.; Tanaka, H.; Takahashi, H. Segmental extracellular and intracellular water distribution and muscle glycogen after 72-h carbohydrate loading using spectroscopic techniques. J. Appl. Physiol. 2016, 121, 205–211. [Google Scholar] [CrossRef] [PubMed]
- Giavarina, D. Understanding Bland Altman analysis. Biochem. Med. 2015, 25, 141–151. [Google Scholar] [CrossRef]
- Bland, J.M.; Altman, D.G. Statistical methods for assessing agreement between two methods of clinical measurement. Lancet 1986, 1, 307–310. [Google Scholar] [CrossRef] [PubMed]
- Bland, J.M.; Altman, D.G. Measuring agreement in method comparison studies. Stat. Methods Med. Res. 1999, 8, 135–160. [Google Scholar] [CrossRef] [PubMed]
- Al-Khelaifi, F.; Diboun, I.; Donati, F.; Botrè, F.; Alsayrafi, M.; Georgakopoulos, C.; Suhre, K.; Yousri, N.A.; Elrayess, M.A. A pilot study comparing the metabolic profiles of elite-level athletes from different sporting disciplines. Sports Med. Open 2018, 4, 2. [Google Scholar] [CrossRef] [PubMed]
- Karastergiou, K.; Smith, S.R.; Greenberg, A.S.; Fried, S.K. Sex differences in human adipose tissues—The biology of pear shape. Biol. Sex Differ. 2012, 3, 13. [Google Scholar] [CrossRef] [PubMed]
- Prijatmoko, D.; Alifiana, V.K.; Hernawati, S.; Dewi, L.R.; Sutjiati, R. Effect of energy intake on percentage body fat as measured by BIA and CUN-BAE equation formula: A comparative study of body fat measurement methods. Int. J. Med. Sci. Clin. Res. Studies 2023, 3, 461–465. [Google Scholar] [CrossRef]
- Endukuru, C.K.; Gaur, G.S.; Yerrabelli, D.; Sahoo, J.; Vairappan, B. Agreement between equation-derived body fat estimator and bioelectrical impedance analysis for body fat measurement in middle-aged southern Indians. Physiol. Rep. 2024, 12, e70095. [Google Scholar] [CrossRef]
- Gemmink, A.; Schrauwen, P.; Hesselink, M.K.C. Exercising your fat (metabolism) into shape: A muscle-centred view. Diabetologia 2020, 63, 1453–1463. [Google Scholar] [CrossRef]
- Bennett, J.P.; Cataldi, D.; Liu, Y.E.; Kelly, N.N.; Quon, B.K.; Gonzalez, M.C.; Heymsfield, S.B.; Shepherd, J.A. Variations in bioelectrical impedance devices impact raw measures comparisons and subsequent prediction of body composition using recommended estimation equations. Clin. Nutr. ESPEN 2024, 63, 540–550. [Google Scholar] [CrossRef] [PubMed]
Disclaimer/Publisher’s Note: The statements, opinions and data contained in all publications are solely those of the individual author(s) and contributor(s) and not of MDPI and/or the editor(s). MDPI and/or the editor(s) disclaim responsibility for any injury to people or property resulting from any ideas, methods, instructions or products referred to in the content. |
© 2025 by the authors. Licensee MDPI, Basel, Switzerland. This article is an open access article distributed under the terms and conditions of the Creative Commons Attribution (CC BY) license (https://creativecommons.org/licenses/by/4.0/).