Abstract
Accurate in vivo glucose monitoring is essential for effective diabetes management and for the care of pre-term infants in critical care. Glucose-monitoring techniques are broadly categorized into three types: invasive, minimally invasive, and non-invasive. Each method presents distinct advantages and challenges. Non-invasive glucose sensors, despite impressive advancements in recent years, still face issues with signal interference and accuracy, limiting their widespread clinical application. In contrast, implanted devices offer more reliable and consistent results in clinical settings, making them the current gold standard. This review provides an overview of the leading glucose-sensing technologies, detailing both their advantages and drawbacks. We discuss invasive techniques, such as implanted electrodes, which allow continuous glucose monitoring with high accuracy, but often come with risks of infection and discomfort. Minimally invasive methods, such as fluorescence sensors, Raman sensors, and microneedle arrays, aim to reduce discomfort while providing more precise measurements than non-invasive devices. Additionally, non-invasive methods, such as optical, infrared, and microwave techniques, are explored for their potential to provide pain-free, continuous glucose monitoring. Finally, the review highlights a brief comparison among the current technologies and future directions in the field, particularly the use of signal enhancement algorithms and integration with wearable devices.
1. Introduction
Glucose is a key energy source for cellular activity, and maintaining its proper concentration in the bloodstream is critical for overall health. The body’s homeostatic systems, such as the nervous and endocrine systems, tightly regulate blood glucose levels to ensure balance [1]. With the rise in diabetes cases worldwide, maintaining proper glucose levels has become a significant health challenge. As estimated by WHO, the global number of people with diabetes may reach 400 million by 2025 [2]. The ideal range for fasting blood glucose is approximately 3.9–6.1 mmol/L. However, patients with clinically diagnosed diabetes experience persistent hyperglycemia, where blood glucose levels remain above normal (greater than 6.9 mmol/L), which can lead to complications such as renal failure, blindness, and cardiovascular diseases [3]. On the other hand, hypoglycemia refers to abnormally low blood glucose levels, typically below 3.9 mmol/L, which can also cause serious health issues [3]. Worldwide, over a billion lives are affected by poorly controlled blood glucose, and thus, the fast and precise assessment of glucose concentration is important.
Among various techniques explored for glucose measurements, electrochemical and optical methods have become immensely popular. Electrochemical sensors are the standard in glucose-sensing applications due to their low detection limits, fast response times, and significantly lower cost compared to sensors based on other detection methods. Among the electrochemical detection techniques, potentiometry and amperometry are the most widely used. In potentiometric sensors, the potential difference between a reference electrode and a working electrode is measured with zero applied current, and the potential of the working electrode varies with glucose concentration. These sensors are capable of detecting glucose concentrations as low as 10 μM, with typical human blood glucose levels ranging from 4 to 7 mM [4,5]. In amperometric glucose sensors, a constant bias potential is applied, and the resulting current, which is directly proportional to glucose concentration, is measured. Amperometric sensors typically offer detection limits similar to potentiometric sensors, generally in the μM to M range [5,6]. Significant research has been dedicated to improving electrochemical-based glucose-monitoring technologies, especially focusing on electrode design, surface functionalization, and electrochemical methods to enhance sensitivity and selectivity. Among optical-based sensing methods, fluorescence and Raman spectroscopic measurements are widely used [7,8,9,10]. In the case of fluorescence-based sensors, the color of the fluorophore changes due to its reaction with glucose. Although the color change provides a faster way to quantify the glucose amount, however, this process has limitations for precise quantification and low-glucose level detection [11]. Even if precise measurements are possible, it often requires a spectrophotometer, making the colorimetric method unsuitable for commercial use. On the other hand, surface-enhanced Raman spectroscopy (SERS) offers exceptional sensitivity and specificity due to its ability to enhance signals and provide molecular fingerprints of the compounds. This technique has been applied to analyze various biological samples, including glucose, pH, and redox potentials [12,13,14]. However, directly detecting biochemicals through SERS has been challenging due to the poor adsorption of molecules. To overcome this issue, SERS sensors based on nanostructures, such as silver or gold nanopillars, have been developed. By employing this technique, significant improvement in the Raman signals has been observed [15,16,17]. In addition, several glucose-monitoring methods have been developed for both non-invasive and direct blood glucose monitoring, enabling more convenient and patient-friendly diabetes management [18,19].
In this review, we focus on discussing various glucose sensors from the perspectives of invasive, minimally invasive, and non-invasive sensing methods. The review also highlights several device designs and explores opportunities for improvement to enhance the sensitivity of established blood glucose-monitoring systems, as well as the latest advances in non-invasive methods. Finally, we offer a forward-looking perspective on the future of painless, non-invasive glucose monitoring for more efficient diabetes care. This is particularly important as diabetes mellitus, one of the most common chronic diseases, is associated with complications such as blindness, cardiovascular disorders, and kidney failure, underscoring the need for accurate and convenient blood glucose monitoring.
2. Invasive Methods
Invasive glucose sensing plays a pivotal role in modern diabetes management, providing real-time insights into glucose levels through the use of subdermally implanted or inserted sensors. These systems measure glucose in the interstitial fluid, offering a dynamic alternative to traditional finger-prick testing [20]. In this section, we will discuss the advanced invasive glucose-sensing technologies along with their clinical utilities.
2.1. Electrochemical Glucose Sensors
Electrochemical glucose biosensors, which dominate the commercial glucometer market, typically consist of a three-electrode system: working, reference, and counter electrodes [21]. Each of these electrodes serves a distinct function. The working electrode acts as the sensor or transducer that responds to the electrochemical reaction occurring during the measurement process. The reference electrode provides a stable, known electrode potential and is often based on a saturated calomel electrode (SCE) or a silver–silver chloride (Ag/AgCl) electrode. The counter electrode completes the electrical circuit by facilitating current flow between the electrocatalytic solutions and the working electrode within the electrochemical cell. Counter electrodes are typically made from inert materials, such as platinum (Pt), gold (Au), graphite, or glassy carbon. Among the three electrodes, the working electrode plays the crucial role in determining the sensitivity and specificity of glucose detection [21].
Electrochemical glucose biosensors can be broadly categorized into two types: enzymatic and non-enzymatic. Enzymatic glucose biosensors are widely used due to the high specificity and sensitivity provided by the immobilized glucose oxidase (GOD) enzyme [22]. The process of immobilizing the GOD enzyme on the surface of the working electrode is a key consideration in the development of these biosensors. Glucose oxidase (GOD) is a flavoprotein that facilitates the oxidation of β-d-glucose to d-glucono-δ-lactone and hydrogen peroxide (H2O2), with molecular oxygen acting as the electron acceptor [22,23]. This reaction occurs in two steps: a reductive and an oxidative reaction (Figure 1a) [23]. In the reductive reaction, GOD catalyzes the conversion of β-d-glucose into d-glucono-δ-lactone, which is then hydrolyzed non-enzymatically to form gluconic acid. This process reduces the flavin adenine dinucleotide (FAD) in GOD to FADH2. During the oxidative reaction, FADH2 is reoxidized by oxygen, producing hydrogen peroxide. Catalase (CAT) then breaks down the hydrogen peroxide into water and oxygen. Additionally, Witteveen et al. (1992) identified the enzyme lactonase (EC 3.1.1.17) from Aspergillus niger as the catalyst responsible for hydrolyzing glucono-δ-lactone to gluconic acid [24].
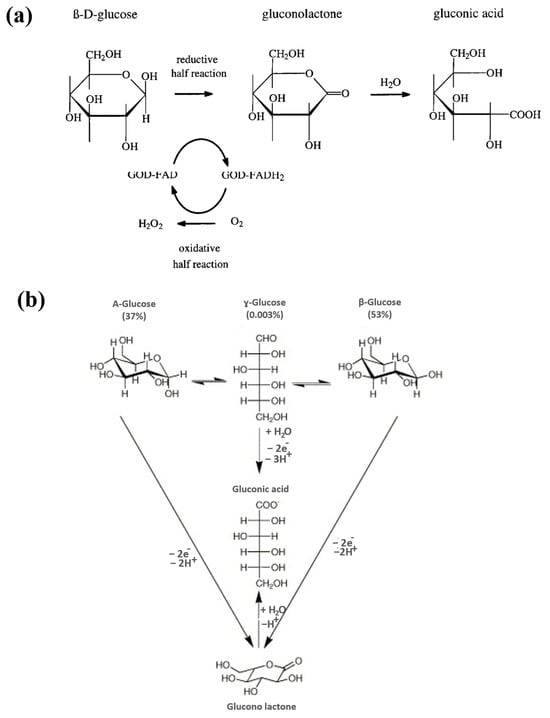
Figure 1.
(a) Schematic representation of glucose oxidation in presence of GOD. Reproduced with permission from [23]. (b) Redox mechanism of glucose demonstrating pathways of electrochemical electron transfer. Reproduced with permission from [25].
However, enzyme activity is highly sensitive to factors like temperature, humidity, and interference from other substances. Furthermore, the electron transfer process can be hindered by the thick enzyme layer, limiting the efficiency of these sensors [21]. As a result, there has been increasing interest in non-enzymatic glucose detection methods, which offer advantages such as improved stability and reduced interference. For instance, Ernst et al. demonstrated the general reaction pathway of glucose on metal surfaces (Figure 1b) [25]. For both α- and β-glucose, the hydrogen atom attached to the C1 carbon becomes activated because the acidity of the hemiacetal OH group (pKa = 12.3) is stronger than that of the alcoholic OH group (pKa = 16). As a result, the electrochemical oxidation of α- and β-glucose primarily produces glucono-δ-lactone, which is then hydrolyzed to gluconic acid. This hydrolysis occurs with a half-life of about 10 min at pH 7.5. On the other hand, the electrochemical oxidation of γ-glucose directly yields gluconic acid. Whether glucono-δ-lactone is involved as an intermediate or not, gluconic acid is the ultimate stable product of glucose oxidation through a two-electron process [25].
The conventional blood glucose-monitoring methods involves collecting blood through a fingertip prick, followed by measurement with an enzyme-based glucometer [26,27]. A typical fingertip glucose meter contains a glucose-sensing electrode and a signal acquisition module. It operates electrochemically by utilizing glucose oxidase (GOD) immobilized on the electrode. During testing, a lancet is used to draw blood from the fingertip, which is then put on the electrode. The enzyme on the electrode reacts with glucose, which produces electrons to alter the electrical current. This electric current is recorded by the signal acquisition system (Figure 2a) [26]. This method is widely used in clinical settings due to its ability to provide real-time blood glucose readings. It helps in tailoring treatments, assessing medication efficacy, and reducing the risks of undetected hypo- or hyperglycemia.
While enzyme-based glucose sensors are widely used, they still exhibit several limitations, including the dependence of enzyme activity on factors such as temperature, humidity, and interference from other substances [21]. Due to these challenges, many researchers have shifted their focus towards developing enzyme-free glucose detection methods. Recent advancements in glucose biosensors have focused on enhancing the working electrode by incorporating nanomaterials [28], such as metals [29], metal oxides [30], and carbon-based nanomaterials [31,32]. Due to their large surface area, excellent catalytic properties, and strong adsorption capabilities, nanomaterials are ideal for facilitating glucose oxidation reactions. Based on the material’s good electrical and thermal conductivity, a series of glucose non-enzyme sensors have been developed. For example, Cherevko et al. developed a non-enzymatic electrochemical glucose sensor using a gold nanowire array electrode [28]. The FESEM image of gold nanowire array is shown in Figure 2b. The detection principle of glucose is based on the partial and direct oxidation of glucose on the gold nanowire array electrode. The sensor has a detection limit of 30 μM with a sensitivity of 41.9 μA mM−1 cm−2 (Figure 2c) [28]. In a similar approach, Zhai et al. developed a highly stretchable electrochemical electrode using Enokitake mushroom-shaped Au NW films that allows glucose detection with a sensitivity of 4.55 μA·mM–1·cm–2 with a linear range of 0–800 μM under 30% strain [33]. Apart from noble metal-based materials, various researchers have also focused on inexpensive and efficient metal–organic framework (MOF)-based porous materials. MOF materials, with large porosity, can have potential applications in glucose detection, energy storage, and catalysis [34]. Li et al. prepared a working electrode with a Co-MOF loaded on nickel foam (Figure 2d), with a sensor sensitivity of 10,886 μA cm−2 mM−1 and a glucose detection limit as low as 1.3 nM (Figure 2e–g) [6]. In a different approach, Imran et al. fused Carbon Nitride with different metals such as niobium (Nb) and ruthenium (Ru) to develop enzyme-free electrochemical glucose sensors [35,36]. This approach has reported to provide better anti-interference ability with justifiable reproducibility, reusability, and stability.
In addition to the metal-based and MOF-based materials, conductive polymers have also emerged as a promising class of materials for glucose sensing due to their unique electrical properties and versatility. In the case of conductive polymer materials, the main chain has a conjugated principal electron system, and it can reach the conductive state through doping. These includes various commonly used polymers such as polypyrrole (PPy), polyaniline (PANI), poly-phenylene-vinylene (PPV), poly(3,4-ethylene dioxythiophene) (PEDOT), etc. [37]. Liu et al. synthesized a glucose electrocatalyst by combining CuO with PANI. The surface morphology of hollow PANI nanofibers is shown in Figure 2h) [38]. The result indicates that the electrode exhibits a wide range of 0.001–19.899 mM, and a low detection limit of 0.45 μM (Figure 2i,j) [38].

Figure 2.
(a) Illustration of testing method using paper-based electrochemical device. Reprinted with permission from [26] (b) FESEM image of electrodeposited Au nanowire array. Reprinted with permission from [28] (c) DPV curves of Au NW electrode in 0.1 M NaOH solution and glucose at concentrations of 0.5 and 2–20 mM with step size of 2 mM. Scan rate: 20 mV s−1; step height: 5 mV; step width: 1 s; pulse width: 200 ms; pulse height: 50 mV; and sample period: 50 ms. The inset shows dependence of peak current of glucose oxidation on concentration of glucose. Reprinted with permission from [28] (d) Schematic illustrating formation of Co-MOF nanosheet array on nickel foam. Reprinted with permission from [6] (e) CV curves of Co-MOF/NF in 0.1 M NaOH in present of various glucose concentrations, i.e., 0, 1, 3, 5, 7, and 9 mM, with a scan rate at 30 mV s−1. Reprinted with permission from [6] (f,g) The amperometric responses of Co-MOF/NF with successive addition of glucose in 0.1 M NaOH. Reprinted with permission from [6]. (h) Surface morphology analysis of hollow PANI nanofibers doped with CuO. Reprinted with permission from [38]. (i) I–T response of CuO/PANI nano-hybrid fibers modified with GCE in 0.1 M PBS with successive addition of H2O2 at −0.2 V. Reprinted with permission from [38]. (j) Calibration curve. Reprinted with permission from [38]. (k) SEM images of fabricated Pt-Ni NPS-MWCNTs/SPE. Reprinted with permission from [39]. (l) Process illustration for preparation of Pt-Ni NPs-MWCNTs/GCE. Reprinted with permission from [39]. (m) Schematic view of microfluidic device showing position of microchannels and microneedles in microfluidic device. Reprinted with permission from [39].

In an attempt to improve the real-time tracking of glucose, a microdialysis-based method is introduced. In the case of microdialysis systems, a fine, hollow dialysis fiber is implanted in the subcutaneous tissue and perfused with isotonic fluid. Glucose from the tissue diffuses into the fiber and is pumped outside the body for measurement by an electrochemical sensor. Recently, Najmi et al. developed an integrated implantable microfluidic system that uses a microdialysis method for the non-enzymatic measurement of human body glucose [39]. The microfluidic system consists of a small dialysis channel with a height of 60 µm embedded with a non-enzymatic glucose sensor consisting of Pt-Ni nanoparticles—multiwalled carbon nanotubes/screen-printed carbon electrode (Pt-Ni NPs-MWCNTs/SPE). Figure 2k shows the SEM images of the fabricated Pt-Ni NPS-MWCNTs/SPE, and the process for the preparation of Pt-Ni NPs-MWCNTs/GCE is illustrated in Figure 2l. The schematic view of the microfluidic device is shown in Figure 2m. The detection limit for this microfluidic sensor was reported as 21 μM, which was comparatively low when compared to that of the other non-enzymatic process mentioned above [39]. In the view of the growing interest towards the non-invasive approach, Zhao et al. designed a highly stretchable electrochemical glucose sensor based on gold fibers for monitoring glucose in sweat. By combining the intrinsic stretchability of highly conductive gold fibers with an extrinsic helical structure, the sensor demonstrated strain-insensitive and reproducible electrochemical performance across a range of 0 to 200% strain with a sensitivity of 13.9 μA mM–1 cm–2 [40].
2.2. Hexokinase Method
The hexokinase method, often referred to as the photometric method, involves a sequence of enzymatic reactions. Initially, glucose reacts with hexokinase in the presence of adenosine triphosphate (ATP) and magnesium ions, resulting in the formation of glucose-6-phosphate (G6P) and adenosine diphosphate (ADP). In the subsequent step, G6P undergoes oxidation in the presence of glucose-6-phosphate dehydrogenase and nicotinamide adenine dinucleotide (NAD), producing 6-phosphogluconate and reduced nicotinamide adenine dinucleotide (NADH). The quantity of NADH generated is directly proportional to the glucose concentration in the sample (Figure 3a). NADH absorbs light at a wavelength of 340 nm, enabling glucose levels to be quantified using spectrophotometric methods based on light absorption [20,41]. In a recent application, hexokinase (HK)I and II have been used to test metabolic rates associated with different subcellular distributions [42]. Effects of HKI and HKII on glucose utilization in CHO cells has been studied here, and their data suggested that HKI activity, which is primarily associated with mitochondria (Figure 3b(i–iv)), increases glucose metabolism, while increased HKII activity, which is found at least in part in the cytosol, slows glucose metabolism (Figure 3c(i–iv)) [42]. This may be an important mechanism by which HK’s allow cells to adapt to changing metabolic conditions to maintain energy balance and avoid injury, thus allowing hexokinase to track their metabolic activity.
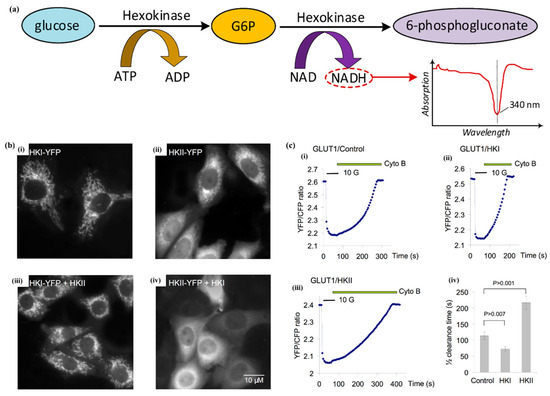
Figure 3.
(a) Hexokinase method for glucose measurement. (b) Subcellular distribution of HKI and HKII linked to YFP in CHO cells. (i) HKI-YFP demonstrates that HKI is bound to mitochondria with little or no fluorescence found in cytosol. (ii) Distribution of HKII-YFP showed both mitochondrial labeling and diffuse fluorescence in cytoplasm. (iii) HKI-YFP together with HKII (ratio 1:3) shows that HKI-YFP is attached to mitochondria and is not affected by excess HKII. (iv) HKII-YFP together with HKI (ratio 1:3) shows that HKII-YFP was no longer associated with mitochondria in presence of excess HKI. (c) Effects of HKI and HKII on glucose utilization in CHO cells. These data illustrate how overexpression of HKI (Panel B) and HKII (Panel C) affects glucose clearance measured in presence of CytoB. (i) Control signal. (ii) Compared to control, HKI increased rate of glucose clearance. (iii) In comparison with control, HKII is observed to have opposite effect and decreases this rate. (iv) Quantification of clearance time for HKI and HKII. Reprinted with permission from [42].
2.3. Ion-Selective Field-Effect Transistor (ISFET)
Invasive ISFET glucose sensors are used to measure blood glucose levels by inserting the sensors into the skin to measure interstitial fluid glucose levels. An ISFET-based glucose sensor uses the principle of hydrogen peroxide electrolysis, which is one of the by-products of glucose oxidation. The ISFET sensor typically consists of a transducer along with a sensing element. The sensing film is usually defined as the gate of ISFET. The gate materials on the sensing film determine the sensing performance of the ISFET. A preliminary design of common ISFET is shown at Figure 4a(i) [43]. In 1996, Vjacheslav Volotovsky et al. developed an ISFET-based glucose sensor by crosslinking a mixture of glucose oxidase and bovine serum albumin in saturated glutaraldehyde vapor on the sensitive area of the transducer [44]. Recently, Zhao et al. reported a low-power, portable, real-time glucose-sensing device with dextran-capped silver nanoparticles (Dex-AgNPs) served as sensitive nanoprobes on the ISFET gate (Figure 4a(ii)) [43]. The have utilized the affinity between Con A and carbohydrates to capture Con A by ISFET/Dex-AgNPs system. Then, glucose can be indirectly detected by removing Con A from the ISFET/Dex-AgNPs/Con A unit via competition with dextran [43]. In a different approach, a silk fibroin-encapsulated graphene field-effect transistor (FET) enzymatic biosensor was developed for glucose detection [31]. It detects glucose levels by measuring the differential drain-source current and the Dirac point shift in the graphene transistor, as glucose is oxidized by glucose oxidase immobilized in the silk fibroin film on the graphene FET (Figure 4b(i–iv)). The glucose sensors has a linear detection range over 0.1–10 mM, with a detection limit of 0.1 mM [31]. To improve the sensitivity of this technique, Koike et al. modified the sensing component, by immobilizing glucose oxidase-containing silk fibroin membrane on a TiO2/Ti surface as the bio-sensing component. This TiO2/Ti extended gate electrode field-effect transistor (EGFET) reported detection limit as 0.001 mg/mL [29]. Junjie et al. developed ZnO nano-array-based EGFETs for detecting pH and glucose levels [45]. Their sensor reported a very fast response time of approximately 6–7 s. The schematic illustration of ZnO nano-array and the incorporation of ZnO nano-array in EGFET circuit in shown in Figure 4c(i) and Figure 4c(ii), respectively [45]. With its high specific surface area, the ZnO nano-array EGFET sensor showed a sensitivity of −0.395 mV/μM for glucose detection within a concentration range of 20 to 100 μM. These EGFET glucose biosensors exhibit good linearity and can detect glucose at low concentrations (as low as 20 μM), making them suitable for detecting glucose in saliva and tears at concentrations lower than those typically found in blood. To improve portability and reusability, Huang et al. designed a polymer-functionalized graphene field-effect transistor (P-GFET) portable bio-sensing device for glucose monitoring. The polymer is synthesized using acrylamide/3-acrylamidophenylboronic acid (AAPBA)/N and N-dimethylaminopropyl acrylamide [46]. The SEM and AFM image of graphene before and after functionalization is shown in Figure 4d(i). In the presence of glucose, the P-GFET exhibits shifts in the Dirac point and changes in current due to the formation of a covalent bond between glucose and AAPBA in the synthesized polymer on the graphene surface (Figure 4d(ii,iii)). The P-GFET demonstrates a high sensitivity of 822 μA·cm−2·mM−1 and a detection limit of 1.9 μM for glucose monitoring in human urine. The sensor covers a detection range of 0.04–10 mM and exhibits excellent reusability, maintaining its performance over 20 cycles. These advancements highlight the promise of ISFET sensors in providing highly sensitive, specific, and versatile glucose-monitoring solutions. However, more improvements are still required for reducing detection limits in order to produce more accurate and reliable glucose measurements.
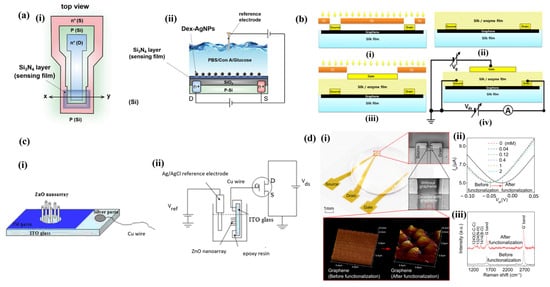
Figure 4.
(a) (i) The top view of a common ISFET. (ii) The assembly of ISFET for the measurement of glucose. An Ag/AgCl electrode serves as the reference electrode, while the ISFET functions as the gate electrode, modified with functionalized Dex-AgNPs. Reprinted with permission from [43]. (b) The schematic illustration of the graphene/silk enzymatic sensor fabrication process. (i) Source and drain electrodes were prepared by depositing Au/Ti (500 nm/100 nm) at the two opposite ends of the graphene channel using an e-beam evaporator via a Ni shadow mask. (ii) The Gox-entrapped silk film was coated on graphene channels upon the silk substrates. (iii) Top gate electrodes were then patterned on GOx-entrapped silk film above graphene FET channels through a second shadow mask. (iv) The current between source and drain (Ids) of the graphene FET was continuously monitored while sweeping the gate voltage. The gate potential was applied on the top gate electrode, and its influence was transmitted through the silk/GOx layer. Reprinted with permission from [31] (c). (i) The schematic diagram of the sensing membrane of EGFET. (ii) The measurement system of the EGFET. Reprinted with permission from [45]. (d) P-FET characteristics: (i) the SEM image of the liquid-gated P-GFET. The AFM images of the graphene channel before and after functionalization with Poly(AAm-AAPBA-DMAPAA). (ii) The transfer characteristic curve of pristine graphene does not show any shift with glucose concentrations ranging from 0 to 2 mM. After functionalization, the Dirac point shifts from −48.3 mV to −23.3 mV. (iii) Raman spectra of graphene before and after functionalization. AAm: acrylamide; AAPBA: 3-acrylamidophenylboronic acid; DMAPAA: N-dimethylaminopropyl acrylamide; P-GFET: polymer-functionalized graphene field-effect transistor; SEM: scanning electron microscopy. Reprinted with permission from [46].
Despite the effectiveness, invasive methods face challenges such as sensor calibration, potential discomfort, and biological responses at the implantation site. As the demand for accurate, user-friendly monitoring solutions grows, numerous innovative approaches focused on minimally invasive and non-invasive technologies.
3. Minimally Invasive Methods
Minimally invasive glucose-sensing methods aim to provide accurate blood glucose measurements with reduced discomfort as compared to traditional invasive techniques like finger pricking. These methods typically involve using sensors that penetrate the skin to a minimal depth or rely on non-intrusive technologies, offering patients a more comfortable and continuous monitoring experience. Technologies such as fluorescence-based sensing methods [7,8,47], SERS-based sensing [9,10,48], microneedle-based sensors [49] are being explored to monitor glucose levels in real time while minimizing tissue disruption. In this segment, we will discuss various minimally invasive methods applicable for real-time glucose sensing.
3.1. Fluorescence Methods
Fluorescence-based techniques have gained significant attention due to their distinct advantages in bioanalysis and biomedicine, such as good selectivity, high sensitivity, visual detection, easy traceability, and non-invasive monitoring. The core principle of fluorescence-based glucose detection relies on the interaction between glucose and the fluorescent probes, where the presence of glucose induces changes in the fluorescence properties of the probe [47]. Fluorescence-sensing methods, which are highly sensitive, can be implemented with affordable light sources such as visible LEDs or ultraviolet (UV) lights [50,51,52]. Receptors, acting as intermediaries, are mostly used as labels in fluorescence-based glucose sensing. These receptors are engineered to bind with glucose molecules, leading to changes in fluorescence that are easier to detect. For instance, a novel colorimetric and ratiometric fluorescence sensor, which was recently developed, was designed using carbon quantum dots (CQDs) and o-diaminobenzene (ODB) [52]. In this method, glucose can be detected both quantitatively through ratiometric fluorescence and colorimetry and semi-quantitatively by observing the color changes under sunlight or ultraviolet light at 365 nm [52]. Various other types of receptors have also been reported for fluorescence-based glucose sensing, such as boronic acid derivatives [53], glucose-binding proteins (e.g., concanavalin A (ConA)) [54,55], enzymes [56], quantum dots [32,57], carbon nanotubes [8,58], and so on. Especially, concanavalin A (Con A), with its four binding sites, exhibits strong glucose-binding properties, making it a popular choice for affinity-based glucose sensors. Recently, Tang et al. designed a fluorescence resonance energy transfer (FRET) sensor involving quantum dots (QDs) and plasmonic gold nanoparticles (AuNPs) linked by Con A [59]. After the addition of glucose, Con A moves towards the glucose, owing to its higher affinity, and this makes the quantum dots to move apart from AuNPs, affecting the fluorescence intensity [59]. A recent study introduced a hydrogel glucose sensor with in vivo stability, utilizing boronic acid-based fluorescence intensity [60]. The sensor integrates two antioxidant enzymes, superoxide dismutase (SOD) and catalase, which protect the arylboronic acid from degradation by hydrogen peroxide in vitro. This protection helps maintain the boronic acid-based fluorescence intensity of the hydrogel glucose sensors in vivo for over a 28-day period. The glucose-sensing mechanism is illustrated in the schematic shown in Figure 5a(i) [60]. In the absence of glucose, the fluorescence of anthracene is quenched. However, when glucose molecules bind to the arylboronic acid, the fluorescence intensity increases, as depicted in Figure 5a(ii) [60]. In another study, Aznar et al. developed a gated mesoporous silica nanodevice where ruthenium bipyridine complexes were trapped within the silica mesopores through interactions between methylbenzimidazole moieties on the pore openings and cyclodextrin-modified glucose oxidase (CD-GOx) [61]. This setup prevented the fluorescent probes from being released. Upon the addition of glucose, gluconic acid is produced, that triggers fluorescence recovery, as shown in Figure 5b. Several other biosensors have been reported, such as those using QDs as donors and dextran-bound malachite green as an acceptor [62], CDs as donors and graphene oxide (GO) as an acceptor [63], and Eu sulfosuccinimidyl dextran as the donor and Alexa Fluor 647 sulfosuccinimidyl as the acceptor [64]. Czarnik et al. reported a modified fluorescent chemosensor with an advanced algorithm, designed to monitor real-time blood glucose [65]. The first and the modified version of the chemosensor is shown in Figure 5c [65]. The sensor can continuously monitor glucose up to 365 days with a single sensor and can be easily paired with an insulin pump. The product is commercially available in Europe and the U.S.
Fluorescence sensing offers easy accessibility, affordability, and ease of implantation under the skin without the need for surgery. Inspired by this, various studies have focused on designing glucose sensors that can be embedded in the contact lenses for the ease of measurement [66,67]. Seo et al. developed an innovative smart contact lens by incorporating boronic acid onto its surface (Figure 5d) [67]. To achieve the facile conjugation of boronic acid, they have used a functional coating of poly(tannic acid). This modification enables the contact lens to bind with glucose present in body fluids, such as tears. When the lens is immersed in an enzymatic solution, the bound glucose is released, allowing for glucose levels to be measured via a colorimetric assay [67]. Although fluorescence-based sensing methods have made significant advancements in glucose measurement, there are still several challenges associated with the current research scenario. For example, autofluorescence and photobleaching are two major problems associated with fluorescence-based sensing [68]. Additionally, in the case of in vivo monitoring, the light scattering of fluorescence can be affected by variations in skin properties, such as pigmentation levels [69].

Figure 5.
(a) The schematic diagram of explaining the glucose-binding mechanism of hydrogel-based glucose sensor. (i) The illustration of in vivo stability of the fluorescent-based hydrogel glucose sensor. (ii) The glucose detection mechanism of the sensing dye. Without glucose molecules, the fluorescence of anthracene is suppressed. When glucose binds to arylboronic acid, the fluorescence intensity increases. Reprinted with permission from [60]. (b) Fluorescence glucose sensors made with mesoporous silica nanoparticles. The mesopores are then capped with an active CD-modified-glucose oxidase (CD-GOx) through the formation of an inclusion complex between the cyclodextrins and the propylbenzimidazole group anchored to the solid support. Reprinted with permission from [61]. (c) Structures of sensors bound to glucose. (i) The first fluorescent chemosensor (ii) The modified diboronic acid fluorescent chemosensor. (iii) The final glucose-monitoring device—Senseonics Eversense. Reprinted with permission from [65]. (d) The schematic illustration of glucose-binding process on the functionalized contact lens. Two-step functionalization process is depicted: first, coating the bare contact lens with tannic acid (pTA) and then conjugating with 4-MPBA (pTA-BA). Reprinted with permission from [67].

3.2. Raman Spectroscopy
Raman spectroscopy is extensively used in biomolecule detection due to its high selectivity towards the target molecule. This technology has previously been applied to analyze various biological samples, including glucose levels, pH, and redox potentials [12,13,14]. However, the direct detection of biochemicals using SERS remained challenging due to poor adsorption. To improve Raman signal intensity, SERS sensors based on various nanostructures, such as silver or gold nanopillars, have been used, significantly enhancing weak Raman signals by factors ranging from 106 to 108 [15,16,17]. Stuart et al. developed innovative implantable nanospheres incorporating a silver film and self-assembled monolayers (SAMs). The SAMs, applied as functional layers on the silver film, enhance the analyte signal and are utilized in vivo for SERS-based applications [70]. The silver nanoparticles coated on the microneedles enhance Raman signals, while the 1-decanethiol coating serves as a glucose-capturing agent, concentrating glucose molecules in the interstitial fluid (ISF) (Figure 6a) [71]. On the other hand, Yang et al. developed, 4-Mercaptophenylboronic acid (4-MPBA)-functionalized gold (Au)-coated zinc oxide (ZnO) nanowires. This SERS substrate was later used as a glucose sensor that was applied for ex vivo glucose measurement (Figure 6b) [72]. The reversibility of 4-MPBA – glucose bonding allowed the continuous tracking of ambient glucose concentrations and made it suitable for biomedical applications [72]. In this context, AgNPs generate stronger SERS signals, offering better sensitivity compared to AuNPs [73,74]. In several studies, it was found that the surface plasmons generated by silver nanoparticles are higher as compared to gold nanoparticles [73,75]. Olga et al. developed an SERS-based glucose-sensing substrate by coating polystyrene nanospheres with silver and mixing them with decanethiol (DT) and mercaptohexanol (MH). This system achieved a detection limit of 0.55 mM for glucose [48]. However, the larger linker molecules used in the system have a tendency to distance the glucose molecules from the surface’s near-field enhancement, making it challenging to obtain consistent and precise measurements [72,76].
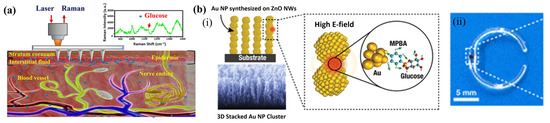
Figure 6.
(a) Schematic illustration demonstrating intradermal glucose detection using poly(methyl methacrylate) microneedle (PMMA MN) array. Reprinted with permission from [71]. (b) (i) Schematic illustration and SEM of Au-NP clusters stacked in a vertical ZnO NW pillars that later used as an SERS disk. (ii) Photo of SERS-disk mounted on C-shaped PDMS implant. Reprinted with permission from [72].
Recently, Dey et al. developed an SERS-based glucose nanosensor for in vitro measurements (Figure 7a). Their nanosensor probe reported a detection limit of 0.1 mM and was found to be linear in the range of 1–10 mM of glucose with excellent compatibility. The nanosensor was embedded into the tumor spheroid, in order to track the continuous metabolic activity in various tumor microenvironments (Figure 7b). The glucose in the intratumor microenvironment was measured for 5 days. The glucose gradient produced by the co-cultured colon cancer spheroid was found to be twice as high as that in the mono-cultured fibroblast spheroid (Figure 7c) [9]. This gives a very good insight into the tumor’s metabolic activity, indicating how nutrient availability varies across the spheroid’s diameter, with cells in the peripheral region receiving full nutrient coverage from the medium, while cells in the core region face significant nutrient shortages. This provides valuable insight into the tumor’s metabolic activity, indicating the relevance and importance of continuous glucose monitoring.
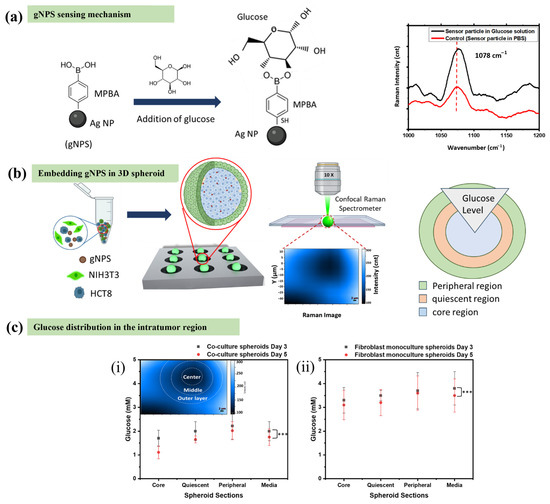
Figure 7.
(a) The schematic illustration demonstrating the conjugation between SERS glucose nanoparticle sensor (gNPS) and glucose. The Raman intensity of SERS-gNPS was increased (at a wavelength of 1078 cm-1) post conjugation with glucose. (b) The graphical depiction of the process shows the incorporation of SERS-gNPS into the 3D tumor spheroid, followed by the recording of the Raman signal under a confocal Raman spectrometer. The Raman image also shows that a lower Raman intensity towards the central region of the tumor spheroid. (c) The quantification of Raman data to analyze the glucose level in the intratumor region. (i) Glucose concentration of co-cultured (color cancer cell (HCT-8), fibroblast cells (NIH3T3)) tumour spheroid as measured after 3 days and 5 days respectively. p-values are calculated using one-way ANOVA test with Bonferroni corrections, *** p < 0.0001. (ii) Glucose concentration of mono-cultured fibroblast tumour spheroid as measured after 3 days and 5 days, respectively. p-values are calculated using a one-way ANOVA test with Bonferroni corrections, *** p < 0.0001. The error bars illustrate the relative standard deviation (RSD) for three replicates. [9].
Although Raman spectroscopy opens new pathways for the continuous monitoring process, there are several hurdles associated with this process, such as high equipment cost, requirement of professional operators, precise calibration methods, and so on. Continued advancements in Raman sensor technology, including improved sensitivity and calibration methods, could overcome these limitations. Overall, Raman sensors hold significant potential for revolutionizing glucose monitoring, particularly in minimally invasive and continuous applications.
3.3. Microneedle Array
The minimally invasive microneedle array became widely popular owing to its advantage of minimizing tissue trauma or fibrosis after implantation. These implantable microneedles have a diameter in the micrometer range and a length of under 1 mm [77]. The microneedle arrays, made up of several tiny, neatly arranged needles, typically penetrate the stratum corneum and reach the dermis without affecting blood vessels or nerves [77].
Over the last two decades, there has been extensive research into the design and fabrication of microneedles, leading to the exploration of various microneedle structures. For example, Ribet et al. designed the CGM device by integrating an ultra-miniaturized electrochemical-sensing probe inside the single hollow microneedle [49]. Their device reported a sensitivity of 1.5 nA/mM with a linearity of up to 14 mM of glucose concentration. The in vivo human test revealed reduced discomfort and high accuracy in real-time monitoring (Figure 8a) [49]. In another study, Jian and his team introduced a wearable CGM system based on microneedles that can be controlled via a smartphone to monitor glucose concentration in real time [78]. The system uses hollow microneedles to access ISF and detect subcutaneous glucose levels. Flexible sensing electrodes, fabricated through screen printing and laser cutting, ensure good sensitivity and stability in glucose monitoring. This glucose sensor uses a sandwich-type enzyme immobilization strategy to detect the glucose level in vitro with a relative standard deviation (RSD) of 4.8%, indicating the accuracy of this sensor (Figure 8b) [78].
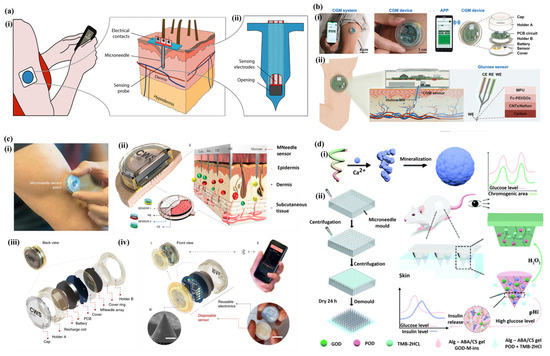
Figure 8.
(a) (i) A cross-sectional illustration showing the developed CGM device inserted into the skin. The sensing probe is placed within a hollow microneedle lumen, with the sensing electrodes positioned towards the opening, facilitating the diffusion of substances to and from the dermal interstitial fluid. (ii) A closer view of the three sensing electrodes aligned with the lateral opening of the microneedle. Reprinted with permission from [49]. (b) (i) The illustration of CGM system combined with a customized smartphone app, a reusable CGM device, and an MN-based glucose sensor. The expanded view of the CGM device with its main components, including the cap, holders, PCB, battery, and cover. (ii) The schematic illustration of the CGM device combined with a glucose sensor for transdermal ISF glucose detection. Reprinted with permission from [78]. (c) Wireless glucose sensor. (i) The sensor patch is shown adhered to the arm of the wearer. (ii) A cross-sectional illustration displays the sensor patch with microneedles penetrating the skin to reach the epidermis, alongside a schematic of the microelectrode configuration used in the multiplexed sensor component. (iii) The back view of the microneedle sensor patch, with an exploded view highlighting the corresponding subcomponents. (iv) The front view of the sensor patch displays the two main parts—the disposable sensor array and the reusable electronics. Reprinted with permission from [79]. (d) The schematic illustration of glucose responsiveness for the self-regulated release of insulin and the real-time glycemia monitoring visible to the naked eye. (i) Insulin mineralization through Ca2+ ions. (ii) A bifunctional microneedle array patch fabricated using crosslinking and micro-molding techniques. Reprinted with permission from [80].
Wang and his team further advanced the field by developing a fully integrated, wearable microneedle array for wireless, continuous, and real-time monitoring of two metabolites in ISF throughout daily life [79]. This system consists of two primary components, i.e., a “disposable sensor” and a “reusable electronic device”, which can be disassembled into nine separate parts. When the sensor becomes worn out, the low-cost “disposable sensor” can be replaced, enabling continuous metabolic sensing. The microneedle electrodes in the disposable sensor penetrate the skin and access the interstitial fluid to detect various biomarkers such as lactic acid and glucose electrochemically. The collected signals are then sent to the wearer’s device wirelessly for data analysis (Figure 8c) [79]. To further improve the system, Sun et al. combined this technique with controlled drug release, providing an advanced approach for diabetes management [80]. The microneedle patch developed by Sun and his team enables visual glucose quantification and controlled insulin release. The microneedles are modified with 3-aminophenylboronic acid, crosslinked with chondroitin sulfate, and the tips are wrapped with mineralized insulin particles and glucose oxidase (GOx) for controlled insulin release. When glucose levels are high, GOx catalyzes the conversion of glucose into hydrogen peroxide (H2O2), triggering calcium layer dissolution and promoting sustained insulin release. The presence of H2O2 also causes a color change in the horseradish peroxidase layer at the bottom of the patch, facilitating visual glucose quantification (Figure 8d) [80]. Yuen et al. introduced an agarose microneedle-coated silver design that can be embedded into the surface of a skin phantom. This approach offers high sensitivity comparable to stainless steel microneedles while also providing improved biocompatibility and cost-effectiveness [81]. Additionally, Ju et al. developed an innovative biosensor featuring a polymer-based (methyl methacrylate) microneedle array designed for in situ in vivo measurements. These advances in microneedle technology not only promise more effective and comfortable CGM methods but also open new avenues for continuous, personalized treatment contributing significantly to the management of conditions such as diabetes.
4. Non-Invasive Methods
Towards the end of 20th century, significant effort has been made to develop non-invasive glucose sensors, aiming to minimize the shortcomings of invasive and minimally invasive methods. The main advantage of non-invasive sensors is their ability to provide continuous, real-time glucose data without causing discomfort or potential complications associated with invasive methods. These sensors hold significant potential for enhancing diabetes management, improving patient compliance, and reducing the risks associated with frequent blood sampling. Despite the ongoing challenges, such as calibration accuracy and sensitivity, non-invasive glucose sensing remains a rapidly advancing field in medical technology [82]. In this section, we will discuss the current advancements in the non-invasive glucose-sensing technology.
4.1. Reverse Iontophoresis
Reverse iontophoresis is a transdermal technique, where glucose is extracted through intact skin by electro-osmotic flow (a process called “reverse iontophoresis”). In 1991, Richard H. Guy’s group proposed to use reverse iontophoresis to extract glucose through the skin for the diagnosis of diabetes, initiating the development of the technology [83]. A low electric current is applied across the skin between two electrodes. Since glucose is uncharged, its transportation occurs through electro-osmosis (Figure 9a) [84]. At the physiological pH, the skin carries a net negative charge, causing Na+ ions to be the primary charge carriers. The movement of these Na+ ions generates a convective solvent flow, which transports uncharged molecules like glucose towards the iontophoretic cathode [85]. The Cygnus GlucoWatch reverse iontophoresis sensor was the first transdermal glucose sensor licensed by the US Food and Drugs Administration (FDA) [85,86]. In clinical trials, it showed an adequate precision for home blood glucose monitoring [87]. However, it was not useful for the detection of hypoglycemia with a sensitivity of 23% for glucose concentrations of ≤3.3 mmol/L and a 51% false alarm rate [88]. The device was withdrawn in 2008.
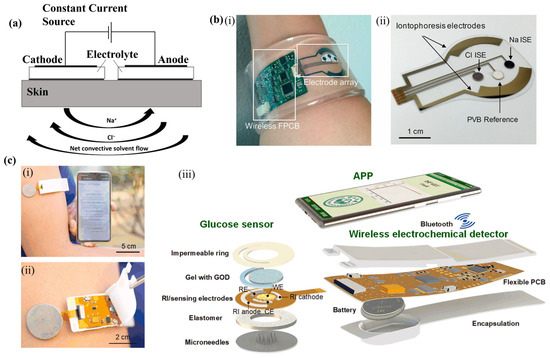
Figure 9.
(a) The schematic illustration demonstrating the reverse iontophoresis process. Reprinted with permission from [84]. (b) (i) The depiction of the wearable glucose-sensing platform, containing the electrode array unit and wireless flexible printed circuit board (FPCB). (ii) The depiction of the electrodes used for iontophoresis and sweat sensing, designed to detect Na+ and Cl− concentrations. Reprinted with permission from [89]. (c) (i) The image of the smartphone-integrated Glucose Electrochemical Detection Platform (GEDP). (ii) The image of the wireless electrochemical detector linked with the touch-activated glucose sensor for reverse iontophoresis (RI) extraction and electrochemical glucose measurement. (iii) The schematic representation of the smartphone-based GEDP, comprising the touch-activated glucose sensor with integrated microneedle array (MA) and RI, wireless electrochemical detector, and Android-based app for transdermal glucose monitoring. Reprinted with permission from [90].
With the advancements in flexible electronics, several transdermal miniaturized iontophoresis interfaces have been developed to monitor glucose through sweat, with improved sensitivity [89,90]. For example, the electrochemically enhanced iontophoresis interface developed by Emaminejad et al. can stimulate sweat secretion and measure various analytes present in the collected sweat (e.g., glucose, Na+, and Cl−) (Figure 9b(i)) [89]. The integration of sensing electrodes on the same substrate as the iontophoresis electrodes has helped to analyze sweat onsite and in real time. As illustrated in Figure 8b(ii), the sensing device consists of an array of electrodes designed for both sweat induction and sensing, which are integrated with a wireless, flexible printed circuit board (FPCB) [89]. The design ensures that the sweat sensing and sweat induction functions operate separately, allowing each to function independently without interfering with the other. Although the wearable sensing platform showed a promising way for non-invasive glucose monitoring, the sensitivity of this sensor was low (2.1 nA/μM). Cheng et al. developed touch-activated glucose biosensor for monitoring glucose levels in the interstitial fluid (ISF) with improved sensitivity [90]. The glucose sensor consists of a microneedles array (MA) for painless skin penetration, a reverse iontophoresis (RI) unit for extracting ISF, and a sensing unit for glucose detection (Figure 9c) [90]. The glucose-sensing unit was prepared by immobilizing glucose oxidase (GOD) in the agarose gel at the working electrode. This biosensor operates based on the process of skin penetration, RI extraction, and electrochemical detection [90]. The sensitivity of the glucose sensor was reported as 7.76 μA mM−1. In a notable study by Zhang et al., an innovative biofuel cell-based sensor has been presented that combines flexible enzymatic biofuel cells (EBFCs) with a power management system (PMS) circuit, for glucose detection in urine and serves as an alarm device for diabetic patients [91].
While reverse iontophoresis shows great potential for non-invasive glucose monitoring, several challenges need to be addressed for its practical application in clinical settings, particularly sensors and algorithms. Since the concentration of target substances extracted through reverse iontophoresis is typically lower than that in the bloodstream, more sensitive sensors with lower detection limits are required to detect these low concentrations. Additionally, reverse iontophoresis often requires adhesion to the skin for extraction. Given that human skin is a curved surface, rigid devices face challenges due to deformation, which can lead to significant measurement errors. Therefore, flexible sensors need to be more advanced, in order to adapt the skin deformation. Moreover, the concentration of target substances in the extracted interstitial fluid (ISF) does not match that in the blood, making it essential to understand and establish a relationship model between these concentrations [92]. This will enable the conversion of ISF measurements into accurate blood glucose levels [93]. However, this conversion is complicated by microcirculation variability, and the exact quantitative relationship remains unclear. Thus, suitable algorithms need to incorporate both advancements in computational science and a better understanding of human physiology. Furthermore, environmental factors such as temperature can influence reverse iontophoresis performance, necessitating further research to refine the extraction process and improve the algorithms used to adjust for these variations.
4.2. Optical Coherence Tomography (OCT)
Optical coherence tomography (OCT) is a technique that uses an interferometer with low coherence light to measure tissue characteristics. Typically, OCT uses near-infrared (NIR) light, benefiting from relatively affordable and compact components, and making it suitable for the 3D imaging of biological tissues [94]. Figure 10a illustrates the OCT system, which includes the interferometer optics and the photodetector/camera setup. The light source is split into two beams—one is scattered back from the tissue, and the other is reflected from the reference mirror towards the beam splitter. The interference of the light from both the tissue sample and the reference mirror creates the interferometric signal at the beam splitter. The photodetector then captures the interference pattern, and the resulting intensity varies depending on the glucose concentration at various tissue depths, up to 1.6 mm [94]. Although OCT has shown promise in non-invasive glucose monitoring, research is still in its early stages. For instance, Larin et al. demonstrated that OCT could correlate well with blood glucose levels in vivo (R = 0.88), though motion artifacts and skin temperature significantly impacted the results [95,96]. In the late 2000s, GlucoLight developed a glucose-monitoring device based on OCT [97]. In 2008, a small pilot study was conducted involving 27 diabetic patients, including 15 with Type 2 Diabetes (T2D) and 12 with Type 1 Diabetes (T1D) [98]. After two hours of measurements for each participant, the device demonstrated a mean absolute relative difference (ARD) of 11.5%. However, the study did not include measurements in the hypoglycemic range, and there has been no further published research on the device since then. Recently, Su et al. introduced a three-dimensional (3D) correlation technique that takes full advantage of the OCT system’s 3D imaging capability [99]. This method enhances the accuracy of BGC detection by identifying and eliminating scattering data from non-correlating or low-correlating regions during data processing, leading to significantly more accurate results compared to the previous 1D correlation method and the 2D correlation approach demonstrated earlier. Additionally, they developed a wristband-style optical probe that reduces motion artifacts caused by shaking and ensures stable contact pressure between the probe and the skin. Figure 10b shows the OCT system paired with wristband-style optical probe. Clinical experiments, as represented by Clark’s error grid model, show that 88.4% of the data points fall within Zone A, indicating a high level of accuracy for this approach (Figure 10c) [99]. Despite the potential, progress in optical glucose-monitoring methods has been slow, with many systems still in the prototype phase. Key challenges include miniaturization, high component costs, signal drift, and the variability between subjects [100]. Additionally, OCT is sensitive to motion artifacts and environmental factors like skin temperature and humidity, making accurate glucose detection challenging [100]. The small changes in the scattering coefficient and the influence of other physiological compounds complicate the application of OCT in glucose sensing. The future of OCT-based transdermal glucose sensing lies in reducing biological interference, enhancing sensitivity and resolution, and improving optical probes for more accurate and reliable measurements.
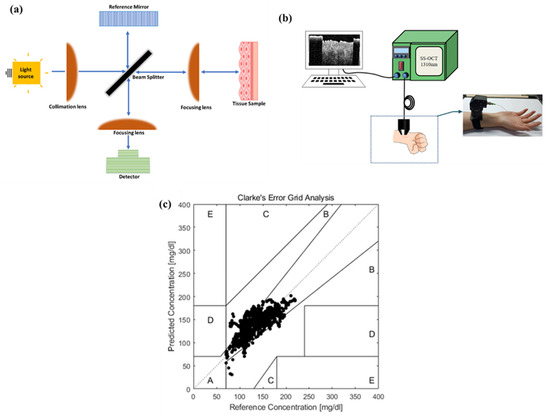
Figure 10.
(a) Schematic illustration demonstrating optical coherence tomography (OCT) process. Adapted from Ref. [94]. (b) Schematic illustration demonstrating OCT process. (b) Depiction of OCT system paired with wristband optical probe. Reprinted with permission from [99]. (c) The Clarke error grid for OCT-measured-style blood glucose indicates that 84.6% of the data points fall within Zone A, which represents accurate glucose measurements. Reprinted with permission from [99].
4.3. Infrared Absorption Spectroscopy
Infrared absorption spectroscopy is based on the absorption and scattering caused by molecular vibrations and rotations. The typical wavelength for infrared absorption spectroscopy ranges from 780 to 2500 nm (14000–4000 cm−1). In the case of glucose sensing, the first overtone (6500–5500 cm−1) and combination (5000–4000 cm−1) regions are commonly used for measuring the bending and stretching of C–H and O–H bonds in glucose. Transmittance and reflectance are two primary measurement modes that are used in NIR spectroscopy. Figure 11a illustrates the schematic diagrams for both transmittance and reflectance modes. In the transmittance mode (Figure 11a(i)), the sample is exposed to polychromatic light from a light source (tungsten halogen or LED). The transmitted light is then separated into its component wavelengths using a diffraction grating, and the optical information is analyzed by a detector and computer. In contrast, the reflectance mode (Figure 11a(ii)) operates similarly, but the diffraction grating is placed on the same side as the light source, allowing the light to be reflected at a specific angle [97]. Transmission spectroscopy is commonly used for aqueous solutions, while reflectance spectroscopy is preferred for non-invasive measurements [97]. NIR spectroscopy has gained significant popularity in non-invasive glucose monitoring owing to many successful in vivo and clinical studies [101,102,103]. For instance, Olesberg et al. reported of monitoring glucose levels in rats with a fiber probe. The fiber probe has a detection range of 90 to 630 mg/dL (5 to 35 mM) and a standard error of prediction (SEP) of 35.6 mg/dL (1.98 mM) [101]. Apart from animal trials, several research groups have also focused on clinical studies. For instance, Maruo and his team developed a non-invasive NIR-based sensor for monitoring glucose levels in diabetic patients and compared the data with healthy individuals. The study involved five healthy participants and seven diabetic patients. The standard error of prediction (SEP) was calculated as 27.2 mg/dL, measured within the glucose concentration range of 50–500 mg/dL [103]. Figure 11b shows the comparison between the predicted and reference glucose values, along with the Clarke error grid (CEG) analysis [103]. Despite the many advancements and clinical trials, this technology suffers from biological noises owing to the various skin conditions. In order to improve this, Han et al. approached a two-step process to enhance the NIR spectroscopy measurement system. A customized multi-ring Indium Gallium Arsenide (InGaAs) detector with a high signal-to-noise ratio is used to reduce the influence of human variations, and a fixing and aiming method is used to reproduce a consistent measurement condition. Seventeen glucose tolerance tests (GTT) were conducted on both healthy and diabetic volunteers to validate this strategy. The results from the human experiments demonstrated that blood glucose changes were successfully detected at 1550 nm. The average correlation coefficient between the light signal and glucose reference across the 17 GTT cases was found to be 0.84 [102]. In order to improve accuracy, several researchers attempted to use multiple-band NIR (mbNIR) and use this mbNIR to train neural networks (NN). For example, Garcia et al. (2021) used an artificial neural network with a combination of NIR and 37–39 GHz frequency to excite and track the glucose response for glucose measurement [104]. The experiment was conducted in an aqueous solution in vitro. A major limitation in previously reported models was the absence of personalized medical features (PMFs) in the training of neural networks. It is important to note that interference from factors such as bones, tissue thickness, fat, and other unknown variables leads to reduced accuracy due to disturbances in the NIR response. To overcome this problem and enhance the measurement accuracy, Sr ichan and his team employed shallow dense neural networks (SDNNs) for developing a multiple photonic band near-infrared (mbNIR) sensor, integrated with personalized medical features (PMFs) (Figure 11c) [105]. Datasets from 401 blood samples were randomized and trained using ten-fold validation. In addition, a cohort of 234 individuals, who were not a part of the training set, was used to assess the model’s performance. This model achieved an impressive 97.8% accuracy and 94.8% sensitivity with 96.0% precision and 98.7% specificity for diabetes mellitus classification, using a fasting blood glucose threshold of 126 mg/dL. For non-invasive, real-time glucose monitoring, the shallow dense neural network (SDNN) model showed an accuracy of 98.5% along with 98.0% precision, 96.2% sensitivity, and 99.3% specificity within a detection range of 60–400 mg/dL [105]. To improve the accuracy further, Shokrekhodaei et al. used machine learning (ML) algorithms with multiple wavelength measurements for glucose monitoring. Their Clarke error grid analysis indicates that 99.75% of glucose readings fall within the clinically acceptable zones, marking a significant advancement towards reliable diagnosis in emergency patient situations [106]. However, currently, there are no glucose-sensing devices on the market that utilize NIR technology. NIR-based glucose sensors face challenges due to the variability of skin conditions, including factors like sunburn, sweating, or tattoos. As a result, developing personalized calibration models is essential to accurately detect different physiological states across patients.
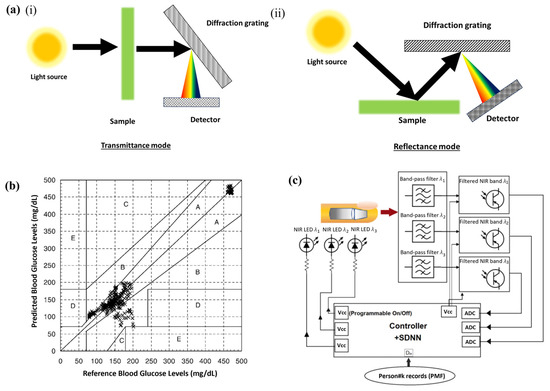
Figure 11.
(a) The schematic illustration demonstrating the NIR process. (i) In the transmittance mode, the sample is exposed to polychromatic light from a light source (tungsten halogen or LED). The transmitted light is then separated into its component wavelengths using a diffraction grating, and the optical information is analyzed by a detector and computer. (ii) In the case of reflectance mode, the diffraction grating is placed on the same side as the light source, allowing the light to be reflected at a specific angle [Redrawn from [97]]. (b) The Clarke error grid demonstrating the correlation between the reference and predicted blood glucose levels in the second-stage experiment, evaluated using the Clarke error grid, showed a correlation coefficient (r) of 0.97 and a standard error of prediction (SEP) of 27.2 mg/dL. Out of the 304 data points, 80.3% fell within Zone A, 19.7% in Zone B, and none were in Zones C, D, or E, indicating high prediction accuracy for ICU patients. Reprinted with permission from [103]. (c) The schematic illustration of the mbNIR/PMF + SDNN system demonstrating that the light scattered from the finger was filtered prior to entering the readout channel of the controller, with specific bands selected, i.e., band #1 ranging from 800 to 900 nm centered at 850 nm, band #2 ranging from 900 to 1000 nm centered at 950 nm, and band #3 ranging from 1100 to 1200 nm centered at 1150 nm. Reprinted with permission from [105].
Apart from NIR-based sensors, OCT, and reverse iontophoresis, researchers have explored several advanced alternative methods, such as photoacoustic spectroscopy [107] and microwave resonators [108], which have shown potential for higher precision in glucose detection. Photoacoustic spectroscopy works by combining laser-emitted light with the acoustic response generated. The ultrasonic transmitter detects pressure wave variations, which occur due to absorption [107]. Earlier in vivo studies have shown that this technique provides greater sensitivity for glucose detection compared to traditional spectroscopic methods [107]. This enhanced sensitivity is attributed to the weak photoacoustic response of water, which helps in detecting compounds like glucose and hydrocarbons more effectively. Recently, Baghelani et al. introduced a microwave resonator-based sensor designed for continuous glucose monitoring from the interstitial fluid (ISF). This sensor features a substrateless split-ring resonator tag, which is electromagnetically coupled with a reader. The sensing element does not require power consumption; thus, microwave resonator-based glucose sensors hold significant potential for integration into the artificial pancreatic systems [108]. Apart from these, several studies have explored resonance-based sensors for glucose measurement in the microwave spectrum. For instance, one study demonstrated that a micro-resonator utilizing a metal–insulator–semiconductor structure could serve as a reliable indicator of glucose levels [109]. Another study reported a highly sensitive resonator-based microwave biosensor for real-time blood glucose detection [110]. Additionally, radiofrequency-based biosensors have been investigated for real-time, continuous glucose monitoring [111]. Building on these advancements, researchers have developed a soft, smart contact lens that integrates glucose sensors and wireless power transfer circuits, and display pixels for the real-time visualization of glucose levels [112]. The lens developed by Parka and his team features a hybrid structure combining transparent, stress-tunable materials, with mechanically reinforced islands to house electronic devices and elastic joints for stretchable components like antennas and interconnects (Figure 12a) [112]. The hybrid materials are chosen for their minimal refractive index difference, ensuring high transparency (93%) and low haze (1.6%) to maintain optical clarity. The elastic portion maximizes oxygen permeability for eye health. Stretchable and transparent electrodes made of one-dimensional ultralong metal nanofibers (mNFs). In this smart contact lens, the antenna receives radiofrequency (RF) signals from a transmitter (with a transmission distance of less than 9 mm), and the rectifier, which consists of a diode and capacitor, converts the AC signals into DC to power the LED and operate the glucose sensor (Figure 12b) [112]. When the glucose concentration in tear fluid exceeds the threshold, the sensor’s resistance decreases. This reduction lowers the overall resistance of the parallel circuit that includes the LED and sensor, while the resistance of other components, such as the antenna and rectifier, remains unchanged. As a result, the bias applied to the parallel circuit of the LED and sensor decreases, which, under a constant voltage, can turn the LED on or off based on the glucose level (Figure 12c). Thus, the glucose concentration in tear fluid is detected by a graphene-based sensor, and the data are wirelessly transmitted to a display system that uses LEDs to show real-time glucose levels. This non-invasive system enables glucose monitoring without bulky external equipment. In vivo testing on rabbits confirmed the lens’s safety and reliability. This smart contact lens platform offers potential for continuous health monitoring and applications in drug delivery and augmented reality. However, challenges such as similar signal-to-noise ratios, interference from nearby radiofrequency devices, and difficulties in distinguishing glucose from other biological components underscore the need for improved sensitivity, accuracy, and stability in these sensors. One potential solution lies in the integration of artificial intelligence (AI) and machine learning algorithms. For example, Qureshi et al. conducted a pilot study of a non-invasive, wrist-worn device that analyzes resonance shifts in the microwave spectrum using AI. This device features a dial-resonating sensor (DRS) to measure bulk plasma glucose levels, which are then converted into glucose readings. The device was able to make accurate predictions of plasma glucose levels across four cohorts, achieving an average mean absolute relative difference of 10.3% through a random sampling method applied to the complete dataset [113].
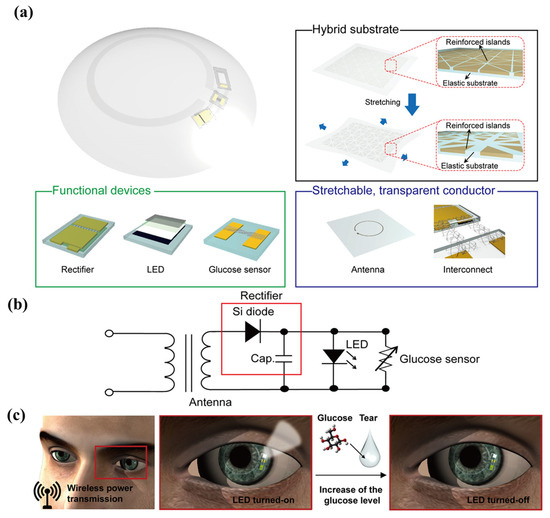
Figure 12.
A smart contact lens based a glucose-monitoring system. (a) The schematic diagram of the soft, smart contact lens, which includes a hybrid substrate, functional components (rectifier, LED, and glucose sensor), and a transparent, stretchable conductor for the antenna and interconnects. (b) The circuit diagram of the smart contact lens system. (c) The operation of the smart contact lens: wireless power is transmitted to the lens via the antenna, activating both the LED pixel and the glucose sensor. When the glucose level in the tear fluid exceeds a certain threshold, the LED pixel turns off. Reprinted with permission from [112].
5. Limitation of Current Methodologies
The development of glucose sensors has significantly improved the monitoring and treatment of diabetes, aiding in glycemic control and preventing complications. However, enzyme-based glucose sensors [61,114], while widely used, suffer from low thermal and chemical stability, as well as high costs, particularly with disposable strips. Non-enzymatic sensors and alternative biofluid monitoring methods have been introduced to address these limitations, though challenges remain in achieving high sensitivity and reliability [5]. Especially, wearable sensors for point-of-care glucose monitoring in biofluids have garnered significant interest due to their ease of use, portability, affordability, and non-invasive nature, minimizing user discomfort [115]. The detection of glucose in blood remains the gold standard for diabetes diagnosis and management. Extensive research has focused on wearable blood glucose sensors, but many of these devices remain invasive, introducing discomfort and the risk of infection [116]. Sweat and urine, due to their easy accessibility and non-invasive nature, have been the focus of many studies [89,91,117]. Wearable sensors based on gold fibers for sweat monitoring [89], biofuel cells for glucose detection in urine [91], and tear-based sensors using soft contact lenses [112] have shown significant promise. The smart contact lens, for example, integrates glucose sensors, wireless power transfer circuits, and display pixels, allowing for real-time glucose level visualization. This lens uses stress-tunable, transparent materials and stretchable electrodes made of ultralong metal nanofibers, wirelessly transmitting glucose data from tear fluid to a display system using LEDs, eliminating the need for bulky external equipment. However, challenges persist, including interference from nearby radiofrequency devices, difficulty distinguishing glucose from other biological components, and improving the sensitivity and accuracy of these sensors [91]. However, glucose detection in saliva [30] presents challenges, including discomfort during collection and the need for filtration or dilution, as well as low biomarker concentrations and variability in its composition.
Despite these challenges, alternative methods for glucose detection are being explored, with optical glucose-sensing technologies offering a promising solution. Optical glucose-sensing technologies, particularly fluorescence [68] and Raman spectroscopy [9], hold promise due to their non-invasive nature and potential for continuous glucose monitoring (CGM). These methods do not consume glucose molecules, providing real-time, accurate readings and longer sensor lifespans compared to electrochemical sensors. Especially, methods like Raman spectroscopy have low glucose detection signals, though surface-enhanced Raman spectroscopy (SERS) can improve sensitivity at the cost of sensor lifespan and potential biotoxicity [9,72]. Photoacoustic (PA) spectroscopy [107] and optical coherence tomography (OCT) [95,98] show promise in vivo, but their sensitivity under physiological conditions is too low for precise measurements. Despite these benefits, optical methods like NIR spectroscopy face issues with signal strength and high costs, limiting their application in non-invasive CGM. We have summarized the brief comparison among the various glucose-sensing technologies in Table 1.

Table 1.
Key metrics of glucose-sensing technologies.
In conclusion, while optical sensing technologies, especially fluorescence, Raman sensing, and OCT offer significant advantages, challenges still remain in maintaining their signal strength, sensor lifespan, probe biocompatibility, and interference with other biological signals. Continuous development and refinement of these technologies are essential to meet the demand for more reliable, non-invasive glucose-monitoring systems.
6. Conclusions
Glucose monitoring is crucial for individuals with diabetes as it helps in maintaining optimal blood sugar levels, preventing hyperglycemia or hypoglycemia, and minimizing the risk of long-term complications such as cardiovascular disease, nerve damage, and kidney failure [123]. With the advancements in latest technologies, several different glucose-sensing techniques has been developed such as optical [100], colorimetric [52], near-infrared [104], photoacoustic [107], and so on. Some of these technologies even enable painless sample collection from alternative biofluids, such as tears [130], saliva [30], and sweat [89], offering non-invasive solutions for continuous monitoring. Emerging innovations, including smart contact lenses [67], wearable sensors [82], and epidermal patches [82], aim to provide real-time glucose readings with high accuracy. Due to simpler approach and predictive accuracy, electrochemical glucose sensors became widely popular [38]. Despite their widespread use, electrochemical glucose sensors face issues related to stability, interference, material biocompatibility, and so on [5]. Techniques like Ion-Selective Field-Effect Transistor (ISFET) [120] and extended gate electrode field-effect transistor (EGFET) [29] offer fast reproducibility but suffer from low sensitivity and electrical noise interference. Aiming to minimize the shortcomings of invasiveness, researchers started exploring various optical methods like fluorescence [8], Raman spectroscopy [72], optical coherence tomography [126], photoacoustic spectroscopy [129], and so on. The new age fluorescence method even offered visibility with affordable light sources such as ultraviolet (UV) or visible LEDs [50,51,52]. Raman spectroscopy offers sharp spectral features [12,13,14], and it can be further enhanced by incorporating SERS sensors with a high plasmonic response [9,71,81]. Reverse iontophoresis enables real-time monitoring with a low risk of infection, though it struggles with low glucose concentration in the interstitial fluid and interference from sweat or skin conditions [85]. Optical coherence tomography (OCT) provides high-resolution, real-time monitoring with deep tissue penetration but is sensitive to motion artifacts and environmental factors [126]. Other optical methods, such as infrared absorption spectroscopy, allow deep skin penetration but are also sensitive to varied skin conditions [101,102]. Photoacoustic spectroscopy provides a higher sensitivity to motion artifacts, and environmental conditions limit their application [129]. New techniques like microwave-based glucose sensing have also shown promising results in real-time monitoring on flexible substrates but lack precision [108]. While each technique shows promise, there are still significant challenges to overcome, such as sensitivity to skin conditions, signal interference, and long-term stability. Future advancements should focus on enhancing the sensitivity, specificity, and calibration of these methods, ensuring long-term stability and accuracy in diverse physiological conditions. The convergence of these technologies with the integration of artificial intelligence (AI) and machine learning (ML) presents an exciting future direction for glucose sensing [129]. To improve calibration, AI-driven systems dynamically adjust sensor outputs by learning from historical data and real-time feedback, ensuring more accurate glucose measurements. For example, AI models can correct for sensor drift, environmental factors, and interference, which typically affect glucose sensors, leading to more consistent and reliable results. Machine learning also helps to reduce errors by identifying and mitigating noise from external sources, such as movement or signal interference, which can distort readings [105,118]. In addition, AI algorithms can integrate data from multiple sources, such as blood glucose readings, wearables, and lifestyle factors, to personalize predictions. For example, AI-powered wrist-worn devices that analyze resonance shifts in the microwave spectrum can predict glucose levels with significant accuracy [113,118]. These devices utilize machine learning models to calibrate the glucose readings based on real-time data and improve the prediction of glucose trends. Moreover, large-scale trials and datasets can further fine-tune the algorithms, increasing the precision of real-time predictions, which could ultimately reduce the need for invasive procedures and enhance overall diabetes management. The integration of AI and machine learning into glucose-monitoring systems enhances their ability to forecast glucose levels, calibrate sensors for greater accuracy, and reduce errors through continuous learning and adaptation. This represents a significant step forward in improving diabetes management and patient outcomes.
Author Contributions
K.D.: Conceptualization, data curation and writing original draft. T.S.S.: Technical suggestions for the manuscript. F.G.T.: Review of draft, Supervision. All authors have read and agreed to the published version of the manuscript.
Funding
Authors would like to thank the Ministry of Science and Technology (MOST), Taiwan, MOST110-2221-E-007-017-MY3, MOST111-2923-E-007-006-MY3, National Health Research Institute, Taiwan, NHRI-EX111-11126BI, and Ministry of Education (MOE), Taiwan, Frontier Research Centre on Fundamental and Applied Sciences of Matters (111QR001I5, MOST 111-2634-F-007-007) for providing financial support for this research project.
Data Availability Statement
No new data were created or analyzed in this study.
Acknowledgments
The authors acknowledge “Indian Institute of Technology, Madras” and “National Tsing Hua University” Partnership Collaboration.
Conflicts of Interest
The authors declare no conflict of interest.
Abbreviations
| SERS | surface-enhanced Raman spectroscopy |
| OCT | optical coherence tomography |
| MOFs | metal–organic frameworks |
| ATP | adenosine triphosphate |
| G6P | glucose-6-phosphate |
| ADP | adenosine diphosphate |
| NAD | nicotinamide adenine dinucleotide |
| HK | hexokinase |
| ConA | concanavalin A |
| SOD | superoxide dismutase |
| 4-MPBA | 4-Mercaptophenylboronic acid |
| MH | mercaptohexanol |
| RSD | relative standard deviation |
| CGM | continuous glucose monitoring |
| RSD | relative standard deviation |
| Gox | glucose oxidase |
| RI | reverse iontophoresis |
| ISF | interstitial fluid |
| FPCB | flexible printed circuit board |
| GOD | glucose oxidase |
| GEDP | Glucose Electrochemical Detection Platform |
| MA | microneedle array |
| ARD | absolute relative difference |
| ANN | Artificial Neural Networks |
| mbNIR | Multiple photonic band near-infrared |
| NN | Neural networks |
| GTT | glucose tolerance tests |
| SEP | standard error of prediction |
| CEG | Clarke error grid |
| NIR | near-infrared |
| ARD | absolute relative difference |
| T2D | Type 2 Diabetes |
| T1D | Type 1 Diabetes |
References
- Rosen, E.D.; Spiegelman, B.M. Adipocytes as Regulators of Energy Balance and Glucose Homeostasis. Nature 2006, 444, 847–853. [Google Scholar] [CrossRef]
- L’Heveder, R.; Nolan, T. International Diabetes Federation. Diabetes Res. Clin. Pract. 2013, 101, 349–351. [Google Scholar] [CrossRef]
- American Diabetes Association. 2. Classification and Diagnosis of Diabetes. Diabetes Care 2017, 40, S11–S24. [Google Scholar] [CrossRef] [PubMed]
- Rahman, M.; Ahammad, A.J.S.; Jin, J.-H.; Ahn, S.J.; Lee, J.-J. A Comprehensive Review of Glucose Biosensors Based on Nanostructured Metal-Oxides. Sensors 2010, 10, 4855–4886. [Google Scholar] [CrossRef] [PubMed]
- Tian, K.; Prestgard, M.; Tiwari, A. A Review of Recent Advances in Nonenzymatic Glucose Sensors. Mater. Sci. Eng. C 2014, 41, 100–118. [Google Scholar] [CrossRef] [PubMed]
- Li, Y.; Xie, M.; Zhang, X.; Liu, Q.; Lin, D.; Xu, C.; Xie, F.; Sun, X. Co-MOF Nanosheet Array: A High-Performance Electrochemical Sensor for Non-Enzymatic Glucose Detection. Sens. Actuators B Chem. 2019, 278, 126–132. [Google Scholar] [CrossRef]
- D’Auria, S.; DiCesare, N.; Staiano, M.; Gryczynski, Z.; Rossi, M.; Lakowicz, J.R. A Novel Fluorescence Competitive Assay for Glucose Determinations by Using a Thermostable Glucokinase from the Thermophilic Microorganism Bacillus Stearothermophilus. Anal. Biochem. 2002, 303, 138–144. [Google Scholar] [CrossRef]
- Barone, P.W.; Parker, R.S.; Strano, M.S. In Vivo Fluorescence Detection of Glucose Using a Single-Walled Carbon Nanotube Optical Sensor: Design, Fluorophore Properties, Advantages, and Disadvantages. Anal. Chem. 2005, 77, 7556–7562. [Google Scholar] [CrossRef]
- Dey, K.; Goudar, V.S.; Kaladharan, K.; Santra, T.S.; Tseng, F.-G. Continuous In-Vitro Physiological Glucose Sensing for Co-Cultured 3D Tumour Spheroids Using SERS Based Nano Particle Sensors (SERS-gNPS). Sens. Actuators B Chem. 2024, 404, 135243. [Google Scholar] [CrossRef]
- Yonzon, C.R.; Lyandres, O.; Shah, N.C.; Dieringer, J.A.; Duyne, R.P. Glucose Sensing with Surface-Enhanced Raman Spectroscopy. In Surface-Enhanced Raman Scattering; Kneipp, K., Moskovits, M., Kneipp, H., Eds.; Topics in Applied Physics; Springer: Berlin/Heidelberg, Germany, 2006; Volume 103, pp. 367–379. ISBN 978-3-540-33566-5. [Google Scholar]
- Bode, K.J.; Mueller, S.; Schweinlin, M.; Metzger, M.; Brunner, T. A Fast and Simple Fluorometric Method to Detect Cell Death in 3D Intestinal Organoids. BioTechniques 2019, 67, 23–28. [Google Scholar] [CrossRef] [PubMed]
- Jamieson, L.E.; Harrison, D.J.; Campbell, C.J. Raman Spectroscopy Investigation of Biochemical Changes in Tumor Spheroids with Aging and after Treatment with Staurosporine. J. Biophotonics 2019, 12, e201800201. [Google Scholar] [CrossRef] [PubMed]
- Jamieson, L.E.; Camus, V.L.; Bagnaninchi, P.O.; Fisher, K.M.; Stewart, G.D.; Nailon, W.H.; McLaren, D.B.; Harrison, D.J.; Campbell, C.J. Targeted SERS Nanosensors Measure Physicochemical Gradients and Free Energy Changes in Live 3D Tumor Spheroids. Nanoscale 2016, 8, 16710–16718. [Google Scholar] [CrossRef] [PubMed]
- Camus, V.L.; Stewart, G.; Nailon, W.H.; McLaren, D.B.; Campbell, C.J. Measuring the Effects of Fractionated Radiation Therapy in a 3D Prostate Cancer Model System Using SERS Nanosensors. Analyst 2016, 141, 5056–5061. [Google Scholar] [CrossRef] [PubMed][Green Version]
- Campion, A.; Kambhampati, P. Surface-Enhanced Raman Scattering. Chem. Soc. Rev. 1998, 27, 241–250. [Google Scholar] [CrossRef]
- Willets, K.A.; Van Duyne, R.P. Localized Surface Plasmon Resonance Spectroscopy and Sensing. Annu. Rev. Phys. Chem. 2007, 58, 267–297. [Google Scholar] [CrossRef] [PubMed]
- Wang, D.; Zhu, W.; Best, M.D.; Camden, J.P.; Crozier, K.B. Directional Raman Scattering from Single Molecules in the Feed Gaps of Optical Antennas. Nano Lett. 2013, 13, 2194–2198. [Google Scholar] [CrossRef] [PubMed]
- Weinzimer, S.A. Analysis: PENDRA: The Once and Future Noninvasive Continuous Glucose Monitoring Device? Diabetes Technol. Ther. 2004, 6, 442–444. [Google Scholar] [CrossRef]
- Davison, N.B.; Gaffney, C.J.; Kerns, J.G.; Zhuang, Q.D. Recent Progress and Perspectives on Non-Invasive Glucose Sensors. Diabetology 2022, 3, 56–71. [Google Scholar] [CrossRef]
- Villena Gonzales, W.; Mobashsher, A.; Abbosh, A. The Progress of Glucose Monitoring—A Review of Invasive to Minimally and Non-Invasive Techniques, Devices and Sensors. Sensors 2019, 19, 800. [Google Scholar] [CrossRef]
- Mohamad Nor, N.; Ridhuan, N.S.; Abdul Razak, K. Progress of Enzymatic and Non-Enzymatic Electrochemical Glucose Biosensor Based on Nanomaterial-Modified Electrode. Biosensors 2022, 12, 1136. [Google Scholar] [CrossRef]
- Bankar, S.B.; Bule, M.V.; Singhal, R.S.; Ananthanarayan, L. Glucose Oxidase—An Overview. Biotechnol. Adv. 2009, 27, 489–501. [Google Scholar] [CrossRef]
- Witt, S.; Wohlfahrt, G.; Schomburg, D.; Hecht, H.-J.; Kalisz, H.M. Conserved Arginine-516 of Penicillium Amagasakiense Glucose Oxidase Is Essential for the Efficient Binding of β-d-Glucose. Biochem. J. 2000, 347, 553–559. [Google Scholar] [CrossRef] [PubMed]
- Witteveen, C.F.B.; Veenhuis, M.; Visser, J. Localization of Glucose Oxidase and Catalase Activities in Aspergillus Niger. Appl. Environ. Microbiol. 1992, 58, 1190–1194. [Google Scholar] [CrossRef] [PubMed]
- Ernst, S.; Heitbaum, J.; Hamann, C.H. The Electrooxidation of Glucose in Phosphate Buffer Solutions: Kinetics and Reaction Mechanism. Ber. Bunsenges. Phys. Chem. 1980, 84, 50–55. [Google Scholar] [CrossRef]
- Wang, C.-C.; Hennek, J.W.; Ainla, A.; Kumar, A.A.; Lan, W.-J.; Im, J.; Smith, B.S.; Zhao, M.; Whitesides, G.M. A Paper-Based “Pop-up” Electrochemical Device for Analysis of Beta-Hydroxybutyrate. Anal. Chem. 2016, 88, 6326–6333. [Google Scholar] [CrossRef]
- Guilbault, G.G.; Lubrano, G.J. An Enzyme Electrode for the Amperometric Determination of Glucose. Anal. Chim. Acta 1973, 64, 439–455. [Google Scholar] [CrossRef] [PubMed]
- Cherevko, S.; Chung, C.-H. Gold Nanowire Array Electrode for Non-Enzymatic Voltammetric and Amperometric Glucose Detection. Sens. Actuators B Chem. 2009, 142, 216–223. [Google Scholar] [CrossRef]
- Koike, K.; Sasaki, T.; Hiraki, K.; Ike, K.; Hirofuji, Y.; Yano, M. Characteristics of an Extended Gate Field-Effect Transistor for Glucose Sensing Using an Enzyme-Containing Silk Fibroin Membrane as the Bio-Chemical Component. Biosensors 2020, 10, 57. [Google Scholar] [CrossRef] [PubMed]
- Sharma, A.; AlGhamdi, W.S.; Faber, H.; Lin, Y.-H.; Liu, C.-H.; Hsu, E.-K.; Lin, W.-Z.; Naphade, D.; Mandal, S.; Heeney, M.; et al. Non-Invasive, Ultrasensitive Detection of Glucose in Saliva Using Metal Oxide Transistors. Biosens. Bioelectron. 2023, 237, 115448. [Google Scholar] [CrossRef]
- You, X.; Pak, J.J. Graphene-Based Field Effect Transistor Enzymatic Glucose Biosensor Using Silk Protein for Enzyme Immobilization and Device Substrate. Sens. Actuators B Chem. 2014, 202, 1357–1365. [Google Scholar] [CrossRef]
- Shehab, M.; Ebrahim, S.; Soliman, M. Graphene Quantum Dots Prepared from Glucose as Optical Sensor for Glucose. J. Lumin. 2017, 184, 110–116. [Google Scholar] [CrossRef]
- Zhai, Q.; Gong, S.; Wang, Y.; Lyu, Q.; Liu, Y.; Ling, Y.; Wang, J.; Simon, G.P.; Cheng, W. Enokitake Mushroom-like Standing Gold Nanowires toward Wearable Noninvasive Bimodal Glucose and Strain Sensing. ACS Appl. Mater. Interfaces 2019, 11, 9724–9729. [Google Scholar] [CrossRef] [PubMed]
- Wei, M.; Qiao, Y.; Zhao, H.; Liang, J.; Li, T.; Luo, Y.; Lu, S.; Shi, X.; Lu, W.; Sun, X. Electrochemical Non-Enzymatic Glucose Sensors: Recent Progress and Perspectives. Chem. Commun. 2020, 56, 14553–14569. [Google Scholar] [CrossRef] [PubMed]
- Imran, H.; Manikandan, P.N.; Dharuman, V. Highly Selective and Rapid Non-Enzymatic Glucose Sensing at Ultrathin Layered Nb Doped C3N4 for Extended Linearity Range. Microchem. J. 2021, 160, 105774. [Google Scholar] [CrossRef]
- Imran, H.; Alam, A.; Dharuman, V.; Lim, S. Fabrication of Enzyme-Free and Rapid Electrochemical Detection of Glucose Sensor Based on ZnO Rod and Ru Doped Carbon Nitride Modified Gold Transducer. Nanomaterials 2022, 12, 1778. [Google Scholar] [CrossRef]
- Pan, Y.; Zhang, J.; Guo, X.; Li, Y.; Li, L.; Pan, L. Recent Advances in Conductive Polymers-Based Electrochemical Sensors for Biomedical and Environmental Applications. Polymers 2024, 16, 1597. [Google Scholar] [CrossRef]
- Liu, T.; Guo, Y.; Zhang, Z.; Miao, Z.; Zhang, X.; Su, Z. Fabrication of Hollow CuO/PANI Hybrid Nanofibers for Non-Enzymatic Electrochemical Detection of H2O2 and Glucose. Sens. Actuators B Chem. 2019, 286, 370–376. [Google Scholar] [CrossRef]
- Najmi, A.; Saidi, M.S.; Shahrokhian, S.; Hosseini, H.; Kazemzadeh Hannani, S. Fabrication of a Microdialysis-Based Nonenzymatic Microfluidic Sensor for Regular Glucose Measurement. Sens. Actuators B Chem. 2021, 333, 129569. [Google Scholar] [CrossRef]
- Zhao, Y.; Zhai, Q.; Dong, D.; An, T.; Gong, S.; Shi, Q.; Cheng, W. Highly Stretchable and Strain-Insensitive Fiber-Based Wearable Electrochemical Biosensor to Monitor Glucose in the Sweat. Anal. Chem. 2019, 91, 6569–6576. [Google Scholar] [CrossRef] [PubMed]
- Burrin, J.M.; Price, C.P. Measurement of Blood Glucose. Ann. Clin. Biochem. 1985, 22, 327–342. [Google Scholar] [CrossRef]
- John, S.; Weiss, J.N.; Ribalet, B. Subcellular Localization of Hexokinases I and II Directs the Metabolic Fate of Glucose. PLoS ONE 2011, 6, e17674. [Google Scholar] [CrossRef]
- Zhao, S.; Shi, C.; Hu, H.; Li, Z.; Xiao, G.; Yang, Q.; Sun, P.; Cheng, L.; Niu, W.; Bi, J.; et al. ISFET and Dex-AgNPs Based Portable Sensor for Reusable and Real-Time Determinations of Concanavalin A and Glucose on Smartphone. Biosens. Bioelectron. 2020, 151, 111962. [Google Scholar] [CrossRef] [PubMed]
- Volotovsky, V.; Soldatkin, A.P.; Shul’ga, A.A.; Rossokhaty, V.K.; Strikha, V.I.; El’skaya, A.V. Glucose-Sensitive Ion-Sensitive Field-Effect Transistor-Based Biosensor with Additional Positively Charged Membrane. Dynamic Range Extension and Reduction of Buffer Concentration Influence on the Sensor Response. Anal. Chim. Acta 1996, 322, 77–81. [Google Scholar] [CrossRef]
- Qi, J.; Zhang, H.; Ji, Z.; Xu, M.; Zhang, Y. ZnO Nano-Array-Based EGFET Biosensor for Glucose Detection. Appl. Phys. A 2015, 119, 807–811. [Google Scholar] [CrossRef]
- Huang, C.; Hao, Z.; Wang, Z.; Zhao, X.; Wang, H.; Li, F.; Liu, S.; Pan, Y. A Fully Integrated Graphene-Polymer Field-Effect Transistor Biosensing Device for on-Site Detection of Glucose in Human Urine. Mater. Today Chem. 2022, 23, 100635. [Google Scholar] [CrossRef]
- Klonoff, D.C. Overview of Fluorescence Glucose Sensing: A Technology with a Bright Future. J. Diabetes Sci. Technol. 2012, 6, 1242–1250. [Google Scholar] [CrossRef] [PubMed]
- Lyandres, O.; Shah, N.C.; Yonzon, C.R.; Walsh, J.T.; Glucksberg, M.R.; Van Duyne, R.P. Real-Time Glucose Sensing by Surface-Enhanced Raman Spectroscopy in Bovine Plasma Facilitated by a Mixed Decanethiol/Mercaptohexanol Partition Layer. Anal. Chem. 2005, 77, 6134–6139. [Google Scholar] [CrossRef] [PubMed]
- Ribet, F.; Stemme, G.; Roxhed, N. Real-Time Intradermal Continuous Glucose Monitoring Using a Minimally Invasive Microneedle-Based System. Biomed. Microdevices 2018, 20, 101. [Google Scholar] [CrossRef] [PubMed]
- DiCesare, N.; Lakowicz, J.R. Evaluation of Two Synthetic Glucose Probes for Fluorescence-Lifetime-Based Sensing. Anal. Biochem. 2001, 294, 154–160. [Google Scholar] [CrossRef]
- Chen, L.; Hwang, E.; Zhang, J. Fluorescent Nanobiosensors for Sensing Glucose. Sensors 2018, 18, 1440. [Google Scholar] [CrossRef]
- Zhai, H.; Bai, Y.; Qin, J.; Feng, F. Colorimetric and Ratiometric Fluorescence Dual-Mode Sensing of Glucose Based on Carbon Quantum Dots and Potential UV/Fluorescence of o-Diaminobenzene. Sensors 2019, 19, 674. [Google Scholar] [CrossRef]
- Fang, H.; Kaur, G.; Wang, B. Progress in Boronic Acid-Based Fluorescent Glucose Sensors. J. Fluoresc. 2004, 14, 481–489. [Google Scholar] [CrossRef]
- Cummins, B.M.; Garza, J.T.; Coté, G.L. Optimization of a Concanavalin A-Based Glucose Sensor Using Fluorescence Anisotropy. Anal. Chem. 2013, 85, 5397–5404. [Google Scholar] [CrossRef] [PubMed]
- McCartney, L.J.; Pickup, J.C.; Rolinski, O.J.; Birch, D.J.S. Near-Infrared Fluorescence Lifetime Assay for Serum Glucose Based on Allophycocyanin-Labeled Concanavalin A. Anal. Biochem. 2001, 292, 216–221. [Google Scholar] [CrossRef] [PubMed]
- Brown, J.Q.; Srivastava, R.; Zhu, H.; McShane, M.J. Enzymatic Fluorescent Microsphere Glucose Sensors:Evaluation of Response Under Dynamic Conditions. Diabetes Technol. Ther. 2006, 8, 288–295. [Google Scholar] [CrossRef] [PubMed]
- Wen, J.; Li, N.; Li, D.; Zhang, M.; Lin, Y.; Liu, Z.; Lin, X.; Shui, L. Cesium-Doped Graphene Quantum Dots as Ratiometric Fluorescence Sensors for Blood Glucose Detection. ACS Appl. Nano Mater. 2021, 4, 8437–8446. [Google Scholar] [CrossRef]
- Karachevtsev, V.A.; Glamazda, A.Y.; Leontiev, V.S.; Lytvyn, O.S.; Dettlaff-Weglikowska, U. Glucose Sensing Based on NIR Fluorescence of DNA-Wrapped Single-Walled Carbon Nanotubes. Chem. Phys. Lett. 2007, 435, 104–108. [Google Scholar] [CrossRef]
- Tang, B.; Cao, L.; Xu, K.; Zhuo, L.; Ge, J.; Li, Q.; Yu, L. A New Nanobiosensor for Glucose with High Sensitivity and Selectivity in Serum Based on Fluorescence Resonance Energy Transfer (FRET) between CdTe Quantum Dots and Au Nanoparticles. Chem. Eur. J. 2008, 14, 3637–3644. [Google Scholar] [CrossRef] [PubMed]
- Sawayama, J.; Okitsu, T.; Nakamata, A.; Kawahara, Y.; Takeuchi, S. Hydrogel Glucose Sensor with In Vivo Stable Fluorescence Intensity Relying on Antioxidant Enzymes for Continuous Glucose Monitoring. iScience 2020, 23, 101243. [Google Scholar] [CrossRef] [PubMed]
- Aznar, E.; Villalonga, R.; Giménez, C.; Sancenón, F.; Marcos, M.D.; Martínez-Máñez, R.; Díez, P.; Pingarrón, J.M.; Amorós, P. Glucose-Triggered Release Using Enzyme-Gated Mesoporous Silica Nanoparticles. Chem. Commun. 2013, 49, 6391–6393. [Google Scholar] [CrossRef]
- Chen, L.; Tse, W.H.; Chen, Y.; McDonald, M.W.; Melling, J.; Zhang, J. Nanostructured Biosensor for Detecting Glucose in Tear by Applying Fluorescence Resonance Energy Transfer Quenching Mechanism. Biosens. Bioelectron. 2017, 91, 393–399. [Google Scholar] [CrossRef] [PubMed]
- Chen, L.; Dotzert, M.; Melling, C.W.J.; Zhang, J. Tunable Photoluminescence of Carbon Dots Used for Homogeneous Glucose Sensing Assay. Biochem. Eng. J. 2020, 159, 107580. [Google Scholar] [CrossRef]
- Ge, M.; Bai, P.; Chen, M.; Tian, J.; Hu, J.; Zhi, X.; Yin, H.; Yin, J. Utilizing Hyaluronic Acid as a Versatile Platform for Fluorescence Resonance Energy Transfer-Based Glucose Sensing. Anal. Bioanal. Chem. 2018, 410, 2413–2421. [Google Scholar] [CrossRef]
- Czarnik, A.W.; James, T.D. Fluorescent Chemosensors in the Creation of a Commercially Available Continuous Glucose Monitor. ACS Sens. 2024, 9, 6320–6326. [Google Scholar] [CrossRef] [PubMed]
- Deng, M.; Song, G.; Zhong, K.; Wang, Z.; Xia, X.; Tian, Y. Wearable Fluorescent Contact Lenses for Monitoring Glucose via a Smartphone. Sens. Actuators B Chem. 2022, 352, 131067. [Google Scholar] [CrossRef]
- Seo, J.; Kang, J.; Kim, J.; Han, H.; Park, M.; Shin, M.; Lee, K. Smart Contact Lens for Colorimetric Visualization of Glucose Levels in the Body Fluid. ACS Biomater. Sci. Eng. 2024, 10, 4035–4045. [Google Scholar] [CrossRef] [PubMed]
- Mal, D.K.; Pal, H.; Chakraborty, G. A Comprehensive Review on Recent Advances in Fluorescence-Based Bio-Analytes Sensing. TrAC Trends Anal. Chem. 2024, 171, 117493. [Google Scholar] [CrossRef]
- Setchfield, K.; Gorman, A.; Simpson, A.H.R.W.; Somekh, M.G.; Wright, A.J. Effect of Skin Color on Optical Properties and the Implications for Medical Optical Technologies: A Review. J. Biomed. Opt. 2024, 29, 010901. [Google Scholar] [CrossRef]
- Stuart, D.A.; Yuen, J.M.; Shah, N.; Lyandres, O.; Yonzon, C.R.; Glucksberg, M.R.; Walsh, J.T.; Van Duyne, R.P. In Vivo Glucose Measurement by Surface-Enhanced Raman Spectroscopy. Anal. Chem. 2006, 78, 7211–7215. [Google Scholar] [CrossRef]
- Ju, J.; Hsieh, C.-M.; Tian, Y.; Kang, J.; Chia, R.; Chang, H.; Bai, Y.; Xu, C.; Wang, X.; Liu, Q. Surface Enhanced Raman Spectroscopy Based Biosensor with a Microneedle Array for Minimally Invasive In Vivo Glucose Measurements. ACS Sens. 2020, 5, 1777–1785. [Google Scholar] [CrossRef]
- Yang, D.; Afroosheh, S.; Lee, J.O.; Cho, H.; Kumar, S.; Siddique, R.H.; Narasimhan, V.; Yoon, Y.-Z.; Zayak, A.T.; Choo, H. Glucose Sensing Using Surface-Enhanced Raman-Mode Constraining. Anal. Chem. 2018, 90, 14269–14278. [Google Scholar] [CrossRef] [PubMed]
- Borah, R.; Ninakanti, R.; Bals, S.; Verbruggen, S.W. Plasmon Resonance of Gold and Silver Nanoparticle Arrays in the Kretschmann (Attenuated Total Reflectance) vs. Direct Incidence Configuration. Sci. Rep. 2022, 12, 15738. [Google Scholar] [CrossRef] [PubMed]
- Liu, W.; Wu, Y.; Wang, C.; Li, H.C.; Wang, T.; Liao, C.Y.; Cui, L.; Zhou, Q.F.; Yan, B.; Jiang, G.B. Impact of Silver Nanoparticles on Human Cells: Effect of Particle Size. Nanotoxicology 2010, 4, 319–330. [Google Scholar] [CrossRef]
- Liu, P.; Jin, H.; Guo, Z.; Ma, J.; Zhao, J.; Li, D.; Wu, H.; Gu, N. Silver Nanoparticles Outperform Gold Nanoparticles in Radiosensitizing U251 Cells in Vitro and in an Intracranial Mouse Model of Glioma. Int. J. Nanomed. 2016, 11, 5003–5014. [Google Scholar] [CrossRef]
- Tong, L.; Xu, H.; Käll, M. Nanogaps for SERS Applications. MRS Bull. 2014, 39, 163–168. [Google Scholar] [CrossRef]
- Huang, X.; Yao, C.; Huang, S.; Zheng, S.; Liu, Z.; Liu, J.; Wang, J.; Chen, H.; Xie, X. Technological Advances of Wearable Device for Continuous Monitoring of In Vivo Glucose. ACS Sens. 2024, 9, 1065–1088. [Google Scholar] [CrossRef]
- Yang, J.; Gong, X.; Chen, S.; Zheng, Y.; Peng, L.; Liu, B.; Chen, Z.; Xie, X.; Yi, C.; Jiang, L. Development of Smartphone-Controlled and Microneedle-Based Wearable Continuous Glucose Monitoring System for Home-Care Diabetes Management. ACS Sens. 2023, 8, 1241–1251. [Google Scholar] [CrossRef] [PubMed]
- Tehrani, F.; Teymourian, H.; Wuerstle, B.; Kavner, J.; Patel, R.; Furmidge, A.; Aghavali, R.; Hosseini-Toudeshki, H.; Brown, C.; Zhang, F.; et al. An Integrated Wearable Microneedle Array for the Continuous Monitoring of Multiple Biomarkers in Interstitial Fluid. Nat. Biomed. Eng. 2022, 6, 1214–1224. [Google Scholar] [CrossRef]
- Sun, X.; Ji, W.; Zhang, B.; Ma, L.; Fu, W.; Qian, W.; Zhang, X.; Li, J.; Sheng, E.; Tao, Y.; et al. A Theranostic Microneedle Array Patch for Integrated Glycemia Sensing and Self-Regulated Release of Insulin. Biomater. Sci. 2022, 10, 1209–1216. [Google Scholar] [CrossRef] [PubMed]
- Yuen, C.; Liu, Q. Hollow Agarose Microneedle with Silver Coating for Intradermal Surface-Enhanced Raman Measurements: A Skin-Mimicking Phantom Study. J. Biomed. Opt. 2015, 20, 061102. [Google Scholar] [CrossRef]
- Kim, J.; Campbell, A.S.; Wang, J. Wearable Non-Invasive Epidermal Glucose Sensors: A Review. Talanta 2018, 177, 163–170. [Google Scholar] [CrossRef] [PubMed]
- Erickson, D. Skinside out. Drug Delivery in Reverse Could Be a Diabetic’s Boon. Sci. Am. 1991, 265, 128–130. [Google Scholar] [CrossRef]
- Giri, T.K.; Chakrabarty, S.; Ghosh, B. Transdermal Reverse Iontophoresis: A Novel Technique for Therapeutic Drug Monitoring. J. Control. Release 2017, 246, 30–38. [Google Scholar] [CrossRef]
- Potts, R.O.; Tamada, J.A.; Tierney, M.J. Glucose Monitoring by Reverse Iontophoresis. Diabetes Metab. Res. Rev. 2002, 18, S49–S53. [Google Scholar] [CrossRef] [PubMed]
- Tierney, M.J.; Tamada, J.A.; Potts, R.O.; Jovanovic, L.; Garg, S. Clinical Evaluation of the GlucoWatch® Biographer: A Continual, Non-Invasive Glucose Monitor for Patients with Diabetes. Biosens. Bioelectron. 2001, 16, 621–629. [Google Scholar] [CrossRef] [PubMed]
- Delgado-Charro, M.B. Recent Advances on Transdermal Iontophoretic Drug Delivery and Non-Invasive Sampling. J. Drug Deliv. Sci. Technol. 2009, 19, 75–88. [Google Scholar] [CrossRef]
- The Diabetes Research in Children Network (DirecNet) Study Group. Accuracy of the GlucoWatch G2 Biographer and the Continuous Glucose Monitoring System During Hypoglycemia. Diabetes Care 2004, 27, 722–726. [Google Scholar] [CrossRef]
- Emaminejad, S.; Gao, W.; Wu, E.; Davies, Z.A.; Nyein, H.Y.Y.; Challa, S.; Ryan, S.P.; Fahad, H.M.; Chen, K.; Shahpar, Z.; et al. Autonomous Sweat Extraction and Analysis Applied to Cystic Fibrosis and Glucose Monitoring Using a Fully Integrated Wearable Platform. Proc. Natl. Acad. Sci. USA 2017, 114, 4625–4630. [Google Scholar] [CrossRef]
- Cheng, Y.; Gong, X.; Yang, J.; Zheng, G.; Zheng, Y.; Li, Y.; Xu, Y.; Nie, G.; Xie, X.; Chen, M.; et al. A Touch-Actuated Glucose Sensor Fully Integrated with Microneedle Array and Reverse Iontophoresis for Diabetes Monitoring. Biosens. Bioelectron. 2022, 203, 114026. [Google Scholar] [CrossRef] [PubMed]
- Zhang, J.; Liu, J.; Su, H.; Sun, F.; Lu, Z.; Su, A. A Wearable Self-Powered Biosensor System Integrated with Diaper for Detecting the Urine Glucose of Diabetic Patients. Sens. Actuators B Chem. 2021, 341, 130046. [Google Scholar] [CrossRef]
- Friedel, M.; Thompson, I.A.P.; Kasting, G.; Polsky, R.; Cunningham, D.; Soh, H.T.; Heikenfeld, J. Opportunities and Challenges in the Diagnostic Utility of Dermal Interstitial Fluid. Nat. Biomed. Eng. 2023, 7, 1541–1555. [Google Scholar] [CrossRef] [PubMed]
- Zheng, H.; Pu, Z.; Wu, H.; Li, C.; Zhang, X.; Li, D. Reverse Iontophoresis with the Development of Flexible Electronics: A Review. Biosens. Bioelectron. 2023, 223, 115036. [Google Scholar] [CrossRef]
- Shokrekhodaei, M.; Quinones, S. Review of Non-Invasive Glucose Sensing Techniques: Optical, Electrical and Breath Acetone. Sensors 2020, 20, 1251. [Google Scholar] [CrossRef] [PubMed]
- Larin, K.V.; Eledrisi, M.S.; Motamedi, M.; Esenaliev, R.O. Noninvasive Blood Glucose Monitoring With Optical Coherence Tomography. Diabetes Care 2002, 25, 2263–2267. [Google Scholar] [CrossRef] [PubMed]
- Esenaliev, R.O.; Larin, K.V.; Larina, I.V.; Motamedi, M. Noninvasive Monitoring of Glucose Concentration with Optical Coherence Tomography. Opt. Lett. 2001, 26, 992. [Google Scholar] [CrossRef] [PubMed]
- Ahmed, I.; Jiang, N.; Shao, X.; Elsherif, M.; Alam, F.; Salih, A.; Butt, H.; Yetisen, A.K. Recent Advances in Optical Sensors for Continuous Glucose Monitoring. Sens. Diagn. 2022, 1, 1098–1125. [Google Scholar] [CrossRef]
- Gabbay, R.A.; Sivarajah, S. Optical Coherence Tomography-Based Continuous Noninvasive Glucose Monitoring in Patients with Diabetes. Diabetes Technol. Ther. 2008, 10, 188–193. [Google Scholar] [CrossRef]
- Su, Y.; Cai, K.; Sun, J.; Hao, P.; Zhang, Y.; Dong, Y.; Xue, Y.; Guo, Z.; Yao, X.S. Three-Dimensional Correlation Method for Non-Invasive Blood Glucose Monitoring with Optical Coherence Tomography. Opt. Lasers Eng. 2025, 186, 108821. [Google Scholar] [CrossRef]
- Jernelv, I.L.; Milenko, K.; Fuglerud, S.S.; Hjelme, D.R.; Ellingsen, R.; Aksnes, A. A Review of Optical Methods for Continuous Glucose Monitoring. Appl. Spectrosc. Rev. 2019, 54, 543–572. [Google Scholar] [CrossRef]
- Olesberg, J.T.; Liu, L.; Zee, V.V.; Arnold, M.A. In Vivo Near-Infrared Spectroscopy of Rat Skin Tissue with Varying Blood Glucose Levels. Anal. Chem. 2006, 78, 215–223. [Google Scholar] [CrossRef] [PubMed]
- Han, T.; Liu, J.; Liu, R.; Chen, W.; Yao, M.; Liu, X.; Ge, Q.; Zhang, Z.; Li, C.; Wang, Y.; et al. In Vivo Near-Infrared Noninvasive Glucose Measurement and Detection in Humans. Appl. Spectrosc. 2022, 76, 1100–1111. [Google Scholar] [CrossRef] [PubMed]
- Maruo, K.; Oota, T.; Tsurugi, M.; Nakagawa, T.; Arimoto, H.; Hayakawa, M.; Tamura, M.; Ozaki, Y.; Yamada, Y. Noninvasive Near-Infrared Blood Glucose Monitoring Using a Calibration Model Built by a Numerical Simulation Method: Trial Application to Patients in an Intensive Care Unit. Appl. Spectrosc. 2006, 60, 1423–1431. [Google Scholar] [CrossRef] [PubMed]
- Cano-Garcia, H.; Kshirsagar, R.; Pricci, R.; Teyeb, A.; O’Brien, F.; Saha, S.; Kosmas, P.; Kallos, E. Enhancing the Accuracy of Non-Invasive Glucose Sensing in Aqueous Solutions Using Combined Millimeter Wave and Near Infrared Transmission. Sensors 2021, 21, 3275. [Google Scholar] [CrossRef]
- Srichan, C.; Srichan, W.; Danvirutai, P.; Ritsongmuang, C.; Sharma, A.; Anutrakulchai, S. Non-Invasively Accuracy Enhanced Blood Glucose Sensor Using Shallow Dense Neural Networks with NIR Monitoring and Medical Features. Sci. Rep. 2022, 12, 1769. [Google Scholar] [CrossRef] [PubMed]
- Shokrekhodaei, M.; Cistola, D.P.; Roberts, R.C.; Quinones, S. Non-Invasive Glucose Monitoring Using Optical Sensor and Machine Learning Techniques for Diabetes Applications. IEEE Access 2021, 9, 73029–73045. [Google Scholar] [CrossRef] [PubMed]
- Tanaka, Y.; Tajima, T.; Seyama, M.; Waki, K. Differential Continuous Wave Photoacoustic Spectroscopy for Non-Invasive Glucose Monitoring. IEEE Sens. J. 2020, 20, 4453–4458. [Google Scholar] [CrossRef]
- Baghelani, M.; Abbasi, Z.; Daneshmand, M.; Light, P.E. Non-Invasive Continuous-Time Glucose Monitoring System Using a Chipless Printable Sensor Based on Split Ring Microwave Resonators. Sci. Rep. 2020, 10, 12980. [Google Scholar] [CrossRef] [PubMed]
- Dhakal, R.; Kim, E.S.; Jo, Y.-H.; Kim, S.-S.; Kim, N.-Y. Characterization of Micro-Resonator Based on Enhanced Metal Insulator Semiconductor Capacitor for Glucose Recognition. Med. Eng. Phys. 2017, 41, 55–62. [Google Scholar] [CrossRef] [PubMed]
- Kumar, A.; Wang, C.; Meng, F.-Y.; Zhou, Z.-L.; Zhao, M.; Yan, G.-F.; Kim, E.-S.; Kim, N.-Y. High-Sensitivity, Quantified, Linear and Mediator-Free Resonator-Based Microwave Biosensor for Glucose Detection. Sensors 2020, 20, 4024. [Google Scholar] [CrossRef]
- Jang, C.; Lee, H.-J.; Yook, J.-G. Radio-Frequency Biosensors for Real-Time and Continuous Glucose Detection. Sensors 2021, 21, 1843. [Google Scholar] [CrossRef]
- Park, J.; Kim, J.; Kim, S.-Y.; Cheong, W.H.; Jang, J.; Park, Y.-G.; Na, K.; Kim, Y.-T.; Heo, J.H.; Lee, C.Y.; et al. Soft, Smart Contact Lenses with Integrations of Wireless Circuits, Glucose Sensors, and Displays. Sci. Adv. 2018, 4, eaap9841. [Google Scholar] [CrossRef] [PubMed]
- Qureshi, M.R.A.; Bain, S.C.; Luzio, S.; Handy, C.; Fowles, D.J.; Love, B.; Wareham, K.; Barlow, L.; Dunseath, G.J.; Crane, J.; et al. Using Artificial Intelligence to Improve the Accuracy of a Wrist-Worn, Noninvasive Glucose Monitor: A Pilot Study. J. Diabetes Sci. Technol. 2024, 19322968241252819. [Google Scholar] [CrossRef]
- Jiang, S.; Zhang, Y.; Yang, Y.; Huang, Y.; Ma, G.; Luo, Y.; Huang, P.; Lin, J. Glucose Oxidase-Instructed Fluorescence Amplification Strategy for Intracellular Glucose Detection. ACS Appl. Mater. Interfaces 2019, 11, 10554–10558. [Google Scholar] [CrossRef] [PubMed]
- Zhang, X.; Jing, Y.; Zhai, Q.; Yu, Y.; Xing, H.; Li, J.; Wang, E. Point-of-Care Diagnoses: Flexible Patterning Technique for Self-Powered Wearable Sensors. Anal. Chem. 2018, 90, 11780–11784. [Google Scholar] [CrossRef]
- Zhang, S.; Zeng, J.; Wang, C.; Feng, L.; Song, Z.; Zhao, W.; Wang, Q.; Liu, C. The Application of Wearable Glucose Sensors in Point-of-Care Testing. Front. Bioeng. Biotechnol. 2021, 9, 774210. [Google Scholar] [CrossRef] [PubMed]
- Oyaert, M.; Delanghe, J.R. Semiquantitative, Fully Automated Urine Test Strip Analysis. Clin. Lab. Anal. 2019, 33, e22870. [Google Scholar] [CrossRef] [PubMed]
- Jin, X.; Cai, A.; Xu, T.; Zhang, X. Artificial Intelligence Biosensors for Continuous Glucose Monitoring. Interdiscip. Mater. 2023, 2, 290–307. [Google Scholar] [CrossRef]
- Wickramasinghe, Y.; Yang, Y.; Spencer, S.A. Current Problems and Potential Techniques in In Vivo Glucose Monitoring. J. Fluoresc. 2004, 14, 513–520. [Google Scholar] [CrossRef] [PubMed]
- Cao, S.; Sun, P.; Xiao, G.; Tang, Q.; Sun, X.; Zhao, H.; Zhao, S.; Lu, H.; Yue, Z. ISFET-based Sensors for (Bio)Chemical Applications: A Review. Electrochem. Sci. Adv. 2023, 3, e2100207. [Google Scholar] [CrossRef]
- Seo, H.-I.; Kim, C.-S.; Sohn, B.-K.; Yeow, T.; Son, M.-T.; Haskard, M. ISFET Glucose Sensor Based on a New Principle Using the Electrolysis of Hydrogen Peroxide. Sens. Actuators B Chem. 1997, 40, 1–5. [Google Scholar] [CrossRef]
- Park, K.-Y.; Choi, S.-B.; Lee, M.; Sohn, B.-K.; Choi, S.-Y. ISFET Glucose Sensor System with Fast Recovery Characteristics by Employing Electrolysis. Sens. Actuators B Chem. 2002, 83, 90–97. [Google Scholar] [CrossRef]
- Pullano, S.A.; Greco, M.; Bianco, M.G.; Foti, D.; Brunetti, A.; Fiorillo, A.S. Glucose Biosensors in Clinical Practice: Principles, Limits and Perspectives of Currently Used Devices. Theranostics 2022, 12, 493–511. [Google Scholar] [CrossRef] [PubMed]
- Zang, L.; Wang, J.; Yang, X.; Fan, G.; Yu, X.; Wang, Y.; Wang, T.; Wang, Q.; Zhao, H. Improved Glucose Detection Limit Based on Phosphorescence from Protected Metalloporphyrin Triplet State. Anal. Chim. Acta 2024, 1315, 342825. [Google Scholar] [CrossRef]
- Sun, Y.; Zhang, Y.; Ren, H.; Qiu, H.; Zhang, S.; Lu, Q.; Hu, Y. Highly Sensitive SERS Sensors for Glucose Detection Based on enzyme@MOFs and Ratiometric Raman. Talanta 2024, 271, 125647. [Google Scholar] [CrossRef] [PubMed]
- Kuranov, R.V.; Sapozhnikova, V.V.; Prough, D.S.; Cicenaite, I.; Esenaliev, R.O. Prediction Capability of Optical Coherence Tomography for Blood Glucose Concentration Monitoring. J. Diabetes Sci. Technol. 2007, 1, 470–477. [Google Scholar] [CrossRef]
- Kuranov, R.; Prough, D.; Sapozhnikova, V.; Cicenaite, I.; Esenaliev, R. In Vivo Application of 2-D Lateral Scanning Mode Optical Coherence Tomography for Glucose Sensing. In Smart Medical and Biomedical Sensor Technology III; Cullum, B.M., Carter, J.C., Eds.; SPIE Press: Bellingham, WA, USA, 2005; p. 60070K. [Google Scholar]
- Kuranov, R.V.; Sapozhnikova, V.V.; Prough, D.S.; Cicenaite, I.; Esenaliev, R.O. In Vivo Study of Glucose-Induced Changes in Skin Properties Assessed with Optical Coherence Tomography. Phys. Med. Biol. 2006, 51, 3885–3900. [Google Scholar] [CrossRef]
- Aloraynan, A.; Rassel, S.; Xu, C.; Ban, D. A Single Wavelength Mid-Infrared Photoacoustic Spectroscopy for Noninvasive Glucose Detection Using Machine Learning. Biosensors 2022, 12, 166. [Google Scholar] [CrossRef] [PubMed]
- Kim, S.; Jeon, H.-J.; Park, S.; Lee, D.Y.; Chung, E. Tear Glucose Measurement by Reflectance Spectrum of a Nanoparticle Embedded Contact Lens. Sci. Rep. 2020, 10, 8254. [Google Scholar] [CrossRef] [PubMed]


Disclaimer/Publisher’s Note: The statements, opinions and data contained in all publications are solely those of the individual author(s) and contributor(s) and not of MDPI and/or the editor(s). MDPI and/or the editor(s) disclaim responsibility for any injury to people or property resulting from any ideas, methods, instructions or products referred to in the content. |
© 2025 by the authors. Licensee MDPI, Basel, Switzerland. This article is an open access article distributed under the terms and conditions of the Creative Commons Attribution (CC BY) license (https://creativecommons.org/licenses/by/4.0/).