Abstract
This study explores the integration of a custom-designed pneumatic spring into a car-seat cushion and its interaction with a simplified human body model using the Finite Element Method (FEM). A 3D half-symmetry FEM framework, developed from experimental data, ensured computational efficiency and convergence. This research bridged experimental and numerical approaches by analyzing the contact pressure distributions between a seat cushion and a volunteer with representative biometric characteristics. The model incorporated two material groups: (1) human body components (bones and muscles) and (2) seat cushion materials (polyurethane foam, latex, and fabric tape). Mechanical properties were obtained from both the literature and experiments, and simulations were conducted using MSC.Marc software under realistic boundary and initial conditions. The simulation results exhibited strong agreement with experimental data, validating the model’s reliability in predicting contact pressure distribution and optimizing seat cushion designs. Contrary to the conventional notion that uniformly distributed contact pressure inherently enhances comfort, this study emphasizes that the precise localization of pressure plays a crucial role in static and long-term seating ergonomics. Both experimental and simulation results demonstrated that modulating the pneumatic spring’s internal pressure from 0 kPa to 25 kPa altered peak contact pressure by approximately 3.5 kPa (around 20%), significantly influencing pressure redistribution and mitigating high-pressure zones. By validating this FEM-based approach, this study reduces dependence on physical prototyping, lowering design costs, and accelerating the development of ergonomically optimized seating solutions. The findings contribute to a deeper understanding of human–seat interactions, offering a foundation for next-generation automotive seating innovations that enhance comfort, fatigue reduction, and adaptive pressure control.
1. Introduction
Automobiles are among the most transformative inventions in human history, profoundly influencing mobility, commerce, and social interactions. With the proliferation of vehicles and urbanization, the time individuals spend driving has significantly increased. This shift, driven by lifestyle changes and rising traffic density, has brought about various physical and mental health concerns associated with prolonged driving. These concerns, including back pain, muscle fatigue, and stress, have become pressing issues in contemporary life, necessitating advancements in vehicle seating systems to enhance driver comfort and mitigate health risks.
Driver seat cushions, predominantly made of polyurethane, are widely recognized for their flexibility, durability, and ability to distribute pressure effectively. These cushions primarily rely on material properties to reduce vibrations transmitted to occupants, providing ergonomic support and enhancing comfort under both static and dynamic conditions. However, conventional seats often fail to deliver optimal support and mechanical performance, especially during extended use. This limitation has spurred considerable research aimed at improving seat comfort through innovative designs, advanced materials, and the integration of smart technologies. Modern seating systems are evolving from passive physical supports to intelligent, adaptive solutions that interact seamlessly with both the user and the vehicle.
Seat comfort is a multifaceted concept influenced by both static and dynamic characteristics, including stiffness and vibration amplitude, respectively. The relative significance of these properties depends on the operating conditions. Under low-vibration environments, comfort is primarily dictated by static pressure distribution, whereas at higher vibration intensities, dynamic factors become increasingly dominant. A comprehensive evaluation of seating comfort requires assessing both the static and dynamic contributions. However, this study focuses specifically on the influence of static characteristics in contact pressure distribution, as dynamic effects introduce additional complexities beyond the scope of this work. A critical determinant of seat comfort is the way contact pressure is distributed between the occupant and the cushion. A key determinant of seat comfort is not merely the evenness of contact pressure distribution but rather the precise localization of pressure across different regions of the seat cushion. Studies indicate that excessive pressure in specific areas—such as the ischial tuberosities—can lead to discomfort and fatigue, while a well-distributed yet strategically placed pressure profile enhances ergonomic support and long-term comfort [1]. Factors such as seat height, body posture, cushion material, and vibration frequency significantly affect this pressure distribution. However, many current approaches are limited by the static mechanical characteristics of the materials employed [2].
In recent years, research has explored innovative approaches to modifying seat cushion properties. One notable advancement is the incorporation of additional elements, such as pneumatic springs, to adjust the cushion’s mechanical behavior. The pioneering work by Tien and David Cirkl [3,4,5,6,7] introduced a custom-designed pneumatic spring, integrated into car-seat cushions, demonstrating its potential to enhance contact pressure distribution and user comfort. This device allows for the active adjustment of contact pressure between the seat cushion and the occupant’s body based on predefined functions, including constant pressure mode, constant stiffness mode, and pressure variation in sinusoidal or triangular waveforms [3]. Consequently, a seat equipped with this system offers greater customization for personalized comfort compared to conventional car seats. Building on this foundation, the current study developed and verified a finite element model (FEM) to replicate the interaction between a seat cushion with an embedded pneumatic spring and a simplified human body model under static conditions.
Finite element analysis (FEA) has proven invaluable in studying human–seat interactions, yet it presents significant challenges [8,9,10,11,12]. These challenges include accurately modeling the geometry and material properties of human structural layers (bones, muscles, and skin) and capturing the unique characteristics of the pneumatic spring. Furthermore, defining realistic boundary conditions and validating simulation results against experimental data are essential yet complex tasks. Previous studies on FEM-based seat cushion modeling have often relied on oversimplified material models, neglecting the viscoelastic and hyperelastic behavior of seat materials, which has led to discrepancies between simulations and real-world performance. Additionally, many works have been constrained by limited experimental validation, relying on outdated pressure distribution data or insufficient participant demographics, reducing the generalizability of findings. Furthermore, incomplete boundary conditions in prior research have failed to accurately replicate realistic seating scenarios, limiting the applicability of FEM in optimizing seat comfort. Addressing these limitations, this study integrated experimentally validated material models, refined boundary conditions, and an adaptive pneumatic spring system to enhance the accuracy and practicality of FEM-based seat design.
This paper proposes a novel solution: a simplified half-symmetric FEM framework designed utilizing MSC.Marc 2018 software. The model effectively replicates the static contact pressure distribution between a human body and a car-seat cushion integrated with a pneumatic spring. By maintaining generality and minimizing computational complexity, the model incorporates realistic boundary and initial conditions derived from experimental setups, ensuring its reliability and applicability.
The paper is organized as follows: Section 2 offers an in-depth analysis of the seat cushion design and the operational principles of the integrated pneumatic spring. Section 3 describes the key steps involved in performing finite element analysis (FEA) of the human–seat interaction. Section 4 discusses the findings from both the simulations and experimental evaluations, highlighting key findings and offering insights for future research. Finally, Section 5 concludes the study, emphasizing the broader implications of the proposed FEM framework.
This work aimed to establish a robust and innovative simulation model that bridges experimental and computational approaches. The validated model serves as a foundation for optimizing seat designs, reducing the reliance on costly physical prototypes, and accelerating the development of advanced, ergonomic seating solutions for enhanced driver comfort and health.
2. Preview of the Car-Seat Model with an Integrated Pneumatic Spring Device
The development of a car-seat model capable of dynamically altering contact pressure to improve occupant comfort represents a significant innovation in automotive ergonomics. Early prototypes, pioneered by Tien and David Cirkl [3], laid the groundwork for integrating pneumatic spring devices into car-seat cushions. Over the years, these models have been progressively improved to achieve a more accurate representation of the interaction between the human body and the seat cushion equipped with a pneumatic spring (Figure 1). This section outlines the structure and functionality of the car-seat model, with an emphasis on the integration and operation of the pneumatic spring mechanism.
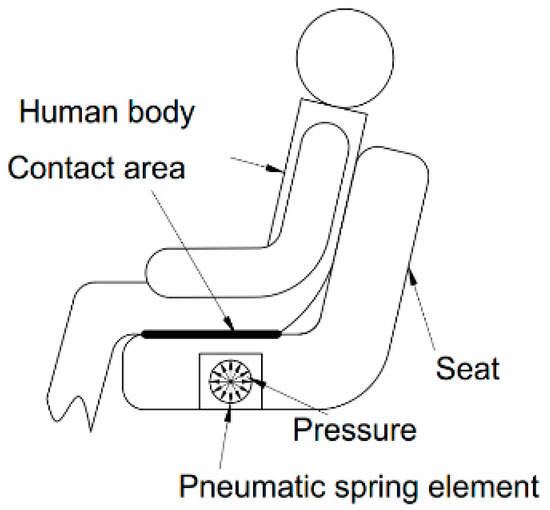
Figure 1.
A simplified scheme of the human–seat interaction.
2.1. Design and Integration of the Pneumatic Spring
The incorporation of the pneumatic spring into the car-seat cushion begins with modifying the cushion’s structure. A rectangular cylindrical block is carefully excised from the seat cushion in a region that frequently experiences high contact pressure, typically beneath the occupant’s buttocks. This excised block serves as the housing for the pneumatic spring, which is inserted into a hollowed-out core along the block’s centerline. The geometry of this core is tailored to match the spring’s dimensions, ensuring a snug fit.
After the pneumatic spring is installed, the modified block is reinserted into its original position within the cushion. The inherent flexibility of the polyurethane material, combined with the stability provided by the outer leather cover, ensures that the cushion’s overall mechanical properties remain intact, except for the localized changes introduced by the pneumatic spring. This design maintains the seat’s structural integrity while enabling adjustable mechanical properties in the targeted area.
The pneumatic spring itself is a custom-engineered device, as depicted in Figure 2. Its core structure is hollowed out to facilitate rapid and uniform air diffusion when inflated. This hollow core is surrounded by a latex tube that is sealed at both ends and covered with a layer of fabric adhesive tape. The latex tube provides elasticity similar to the polyurethane cushion in its uninflated state, while the fabric tape enhances durability and supports effective pressure transmission to the surrounding foam.
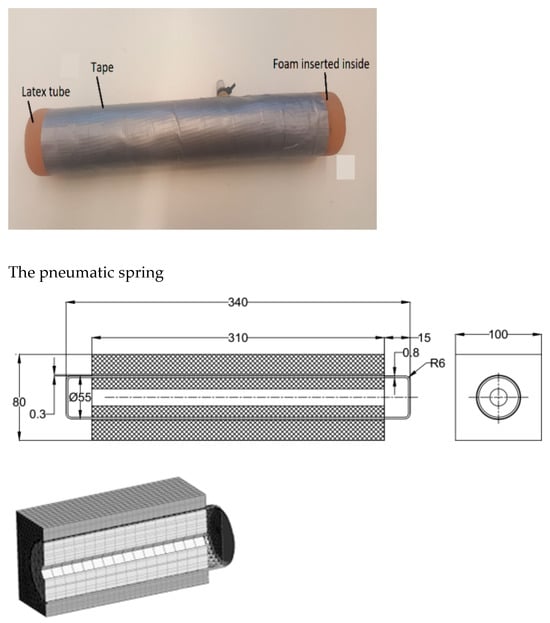
Figure 2.
Structure and dimensions of the pneumatic spring [4].
2.2. Functionality of the Pneumatic Spring
The mechanical characteristics of the pneumatic spring are highly flexible and depend on the internal pressure within the latex tube. As air is added, the stiffness and compressive strength of the spring rise, which changes the pressure distribution on the contact surface. This ability to adjust allows the pneumatic spring to improve comfort by dynamically redistributing pressure across the seat cushion.
The internal pressure of the pneumatic spring is precisely regulated by an advanced electro-pneumatic control system, as shown in Figure 3. This system includes solenoid valves, pressure sensors, an accumulator, a mini air compressor, and a control circuit implemented through LabVIEW 2018 software. Under static operating conditions, the system maintains the desired pressure range between 0 and 25 kPa, ensuring consistent performance. The electro-pneumatic control system allows for fine-tuned adjustments to the pneumatic spring’s behavior, providing optimal comfort for a wide range of users and scenarios.
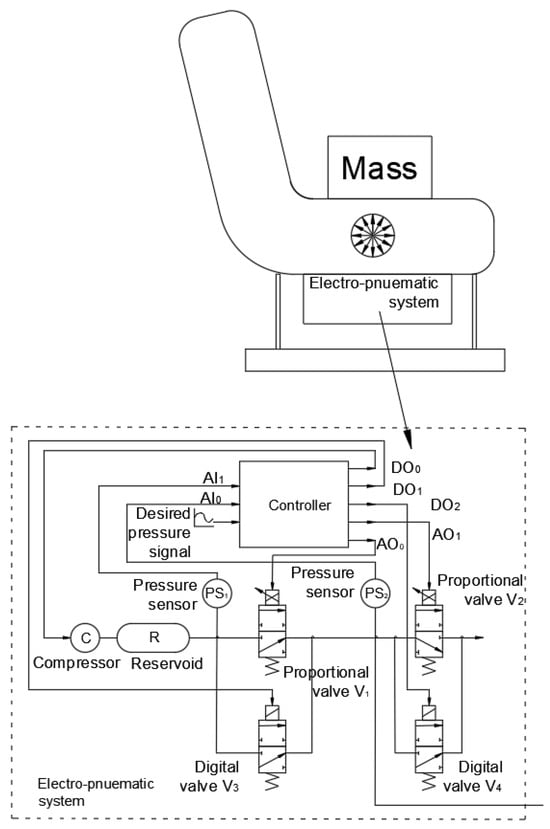
Figure 3.
The electro-pneumatic control system.
The integration of the pneumatic spring into the car-seat cushion represents a novel approach to addressing the limitations of conventional seat designs. Unlike standard cushions that rely solely on material properties for comfort, this model introduces a dynamically adjustable mechanism to tailor the pressure distribution. The design’s modularity ensures minimal impact on the overall cushion structure while enabling precise control over localized mechanical properties. The use of advanced materials, coupled with an innovative electro-pneumatic control system, showcases the creative application of engineering principles to enhance ergonomic performance.
This car-seat model offers significant advancement in automotive seating technology, providing a foundation for future research and development. By enabling real-time adjustments to contact pressure, the pneumatic spring device is expected to not only improve occupant comfort but also addresses health concerns associated with prolonged seating, such as muscle fatigue and poor circulation.
3. Finite Element Modeling (FEM) of Human–Seat Interactions
This study employed a detailed finite element analysis (FEA) framework to investigate the interaction between a driver’s body and a car-seat cushion integrated with a pneumatic spring. Following established methodologies in the literature [13], the development of the interaction model was systematically divided into the following key steps: data collection, geometric modeling, material definition, meshing, the application of boundary conditions, simulation, and validation of the results. The model focused on capturing the static contact pressure distribution influenced by the pneumatic spring, leveraging a half-symmetric approach to optimize computational efficiency and ensure convergence.
3.1. Human Modeling
A simplified human body model was developed using anthropometric data derived from a volunteer participant [14,15]. The volunteer’s biometric characteristics (Table 1) represented an average user profile for automotive seating studies.

Table 1.
The size and anthropometry characteristics of the model.
The model comprised two distinct components: the skeletal structure (Figure 4a) and the soft tissue layer (Figure 4b). The skeletal structure included the sacrum, pelvis, and femur, modeled using standard 3D dimensions based on referenced studies [16,17]. The soft tissue layer, encompassing skin, muscles, and connective tissues, was geometrically simplified using basic shapes such as cylinders and spheres. These shapes were refined and assembled to reflect the anatomical proportions and seated posture, as shown in Figure 4.
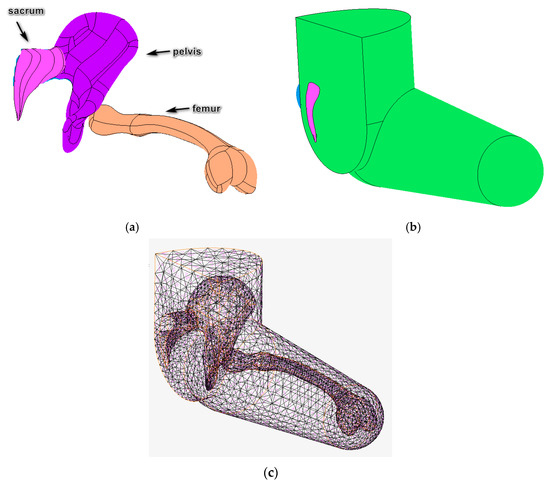
Figure 4.
The skeletal component (a), soft tissue part (b), and biomechanical finite element (c) of the model. Colors were used to distinguish different types of component, including the sacrum (pink), pelvis (purple), femur (or-ange), the soft tissue layer (green), biomechanical finite element (Transparent color).
A biomechanical model was created by meshing the skeletal and soft tissue components with a total of 13,346 four-node tetrahedral elements. These included 5779 elements for the femur, 5575 for the pelvis, and 1992 for the sacrum (Figure 4c). The modeling process was conducted using MSC.Marc simulation software, ensuring high fidelity in representing the physical and mechanical characteristics of the human body.
The mechanical properties of bones were defined using data from Hoof [18], with a Young’s modulus of 16,700 MPa, Poisson’s ratio of 0.3, and density of 1700 kg/m3 (Table 2). For soft tissues, the Mooney–Rivlin hyperelastic material model (Equation (1)) was employed, capturing nonlinear deformation behavior. Material parameters were set as C10 = 1.65 kPa, C01 = 3.35 kPa, and D1 = 3.653, based on Du Xiaoming’s studies [19].
where:
C10, C01 are material parameters representing shear characteristics;
D1 is a material parameter that represents the compressibility of the material;
I1, I2 are two invariants of the isochoric (volume-preserving) form tensors of the Cauchy–Green strain tensor;
J represents the volume change ratio of the material before and after deformation.
Table 2.
Material parameters of bones [18].
Table 2.
Material parameters of bones [18].
| Young’s Modulus (E/MPa) | Poisson’s Ratio (µ) | Density (ρ/kg.m3) |
|---|---|---|
| 16,700 | 0.3 | 1700 |
3.2. Seat Cushion Modeling
The seat cushion was modified to integrate the pneumatic spring. This process involved excising a rectangular block from the cushion, hollowing its core to match the pneumatic spring’s shape, and reinserting it after the spring installation. The spring, comprising a latex tube and fabric tape, was designed to ensure elasticity and durability, with its mechanical properties being adjustable through internal pressure control.
A 3D half-symmetric model of the seat cushion was created using SolidWorks 2017 and imported into MSC.Marc for FEA. The cushion was meshed with 288,327 tetrahedral elements, ensuring accurate simulation (Figure 5a). The foam block and pneumatic spring assembly were also meshed and modeled, considering the nonlinear and viscoelastic properties of polyurethane. Experimental data on polyurethane deformation were used to calibrate the viscoelastic model through a 9th order Prony series, providing realistic material behavior under compression (Figure 5b).
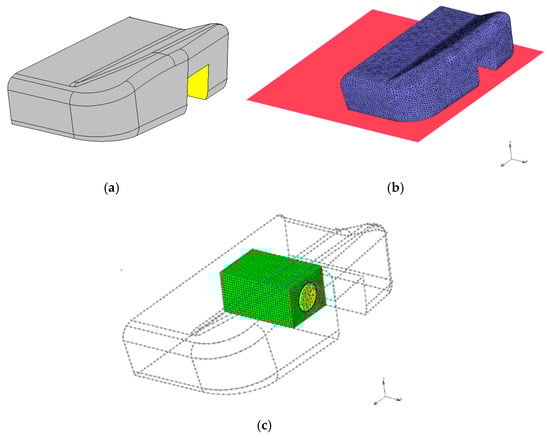
Figure 5.
Geometry and mesh of the right half-symmetric model of the car-seat cushion (a) and with the simplified pneumatic spring integrated inside (b). Colors were used to distinguish different component, including geometry (gray) and mesh (blue) of the right half-symmetric model, mesh of the rectangular block (green), mesh of the pneumatic spring integrated inside (yellow) (c).
3.3. Material Modeling and Challenges
Polyurethane (PU), widely recognized for its exceptional flexibility and durability, is extensively used in the automotive industry, particularly for car-seat cushions. Despite its advantages, PU exhibits strong nonlinear behaviors in both physical and geometric aspects, presenting significant challenges for accurate simulation using finite element methods (FEM). As indicated in multiple studies ([16,19,20,21]), hyperelastic material models are commonly employed to describe the complex constitutive relationships of PU.
3.3.1. Hyperelastic Modeling of Polyurethane Foam
To characterize the material properties of PU foam, compression tests were conducted, reflecting the real-world compressive forces that car-seat cushions endure during use. The objective was to determine the stress–strain behavior of PU foam under uniaxial stress and derive parameters for the hyperelastic material model. Test samples, measuring 100 × 100 × 80 mm, were prepared from seat cushion materials. The tests were performed on an Instron E3000 machine (Figure 6a), with the displacement rate set at 1 mm/min and a maximum compression strain of 75%. Figure 6a illustrates the detailed explanation of the compression experiment and its simulation in MSC.Marc. The primary objective was to assess the correlation between experimental and simulated stress–strain and force–displacement curves, confirming the suitability of the selected material model for polyurethane (PU) foam.
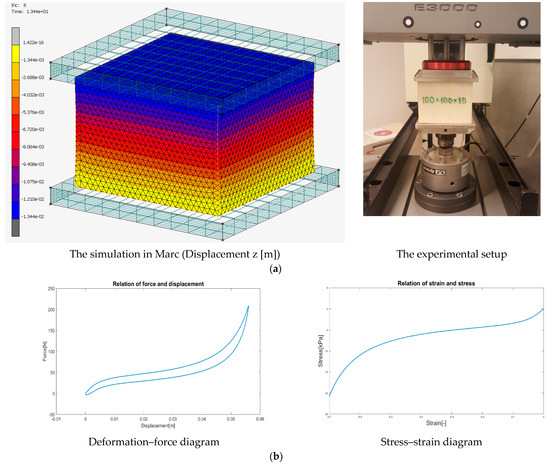
Figure 6.
The compression test of polyurethane foam (a) and experimental results (b).
The experimental deformation–force data were processed using MATLAB 2017 to generate stress–strain curves (Figure 6b). These curves provided input for identifying suitable material parameters for the hyperelastic model, which was implemented and validated through simulations in MSC.Marc software. According to the input requirements for analyzing and calculating the hyperelastic material model in MSC.Marc software, the stress–strain curve was computed based on the average values of the deformation–force curve obtained from the loading and unloading process in the compression test.
The selected constitutive model for PU foam was defined by the strain energy density function:
where are material constants with two terms (N = 2); and are the stretch ratios along the three principal axes. The volumetric ratio J, indicating volumetric change, is defined as . The simulations and parameter calculations conducted using MSC.Marc software yielded the following results:
3.3.2. Viscoelasticity of the Polyurethane Foam
This study extended the material modeling by incorporating the time-dependent viscoelastic properties of PU foam. According to Tanzi [22], viscoelastic behavior is influenced by deformation and deformation rates, exhibiting stress relaxation under constant strain. To investigate this behavior, foam specimens of the same dimensions (100 × 100 × 80 mm) were compressed to strain levels ranging from 5% to 70% in 5% increments. Each strain level was maintained for 1800 s, and stress relaxation data were recorded (Figure 7).
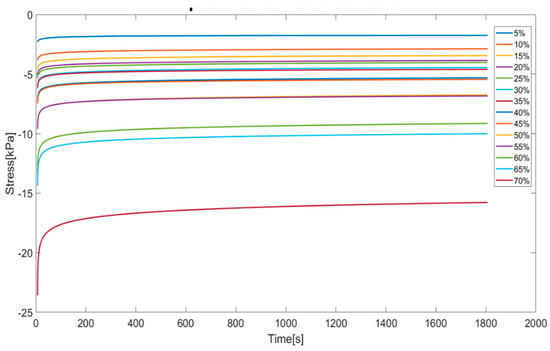
Figure 7.
Data for foam relaxation from the experiment.
A 9th order Prony series was used to model the viscoelastic behavior:
where:
S(t) represents the time-dependent strain energy function;
is the infinite relaxation modulus;
N denotes the order of the Prony series;
k is the relaxation time for the k-th Prony term;
is the Prony coefficients.
The calibrated Prony coefficients and relaxation times (Table 3) were integrated into the MSC.Marc simulations, successfully modeling the time-dependent material behavior.
Table 3.
The set of coefficients from the relaxation function for the viscoelastic properties.
The experimental and simulated force–displacement and stress–strain relationships showed a high degree of agreement (Figure 8), confirming the reliability of the derived material model.
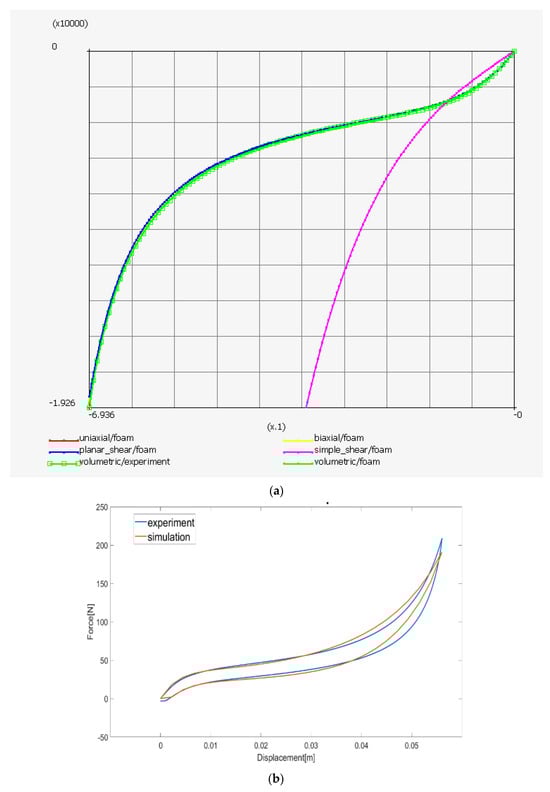
Figure 8.
The experimental stress–strain curves (green square) and the fitted curves (solid green) from the foam compression test (a), along with the force–displacement diagram obtained from both the experiment and simulation (b).
According to the referenced studies ([16,19,20,21]), polyurethane is a commonly used foam material in the automotive industry. Polyurethane (PU) exhibits strong nonlinear characteristics in both physical and geometric aspects, posing significant challenges for finite element simulation. However, most studies have chosen hyperelastic material models to describe the constitutive relationship of polyurethane.
3.3.3. Material Modeling for Latex and Fabric Adhesive Tape
- Material Characterization of Latex Using Circular Membrane Inflation Test
The pneumatic spring consists of a thin latex membrane, requiring accurate characterization of its mechanical properties. A circular membrane inflation test was applied, which is particularly effective for thin-film hyperelastic materials ([23,24,25,26,27,28]). This method measures mechanical properties by analyzing the stress–strain relationship derived from the pressure–deformation behavior of spherical membranes.
The experimental setup (Figure 9a) involved cutting latex samples from a tube and fixing them onto a device with a circular window, sealed with screws and rubber layers. Air was pumped into or released from the membrane to induce deformation. An optoNCDT 1402 laser sensor (Micro Epsilon, Raleigh, NC, USA) measured the displacement of the apex of the spherical cap, while an SMC PSE543AR06 pressure sensor (SMC Corporation, Tokyo, Japan) recorded the internal pressure.
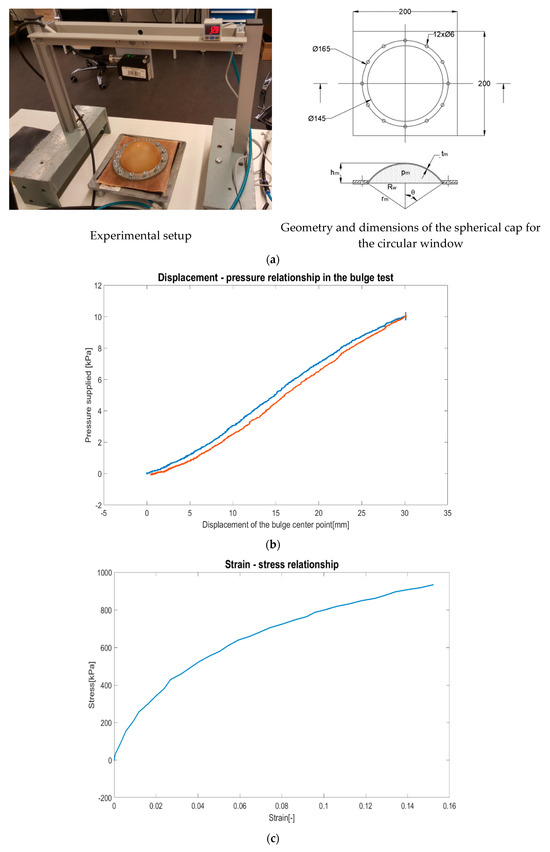
Figure 9.
Circular membrane inflation test set up and the height of the hemisphere cap (a), displacement–pressure diagram of the test (b) and the strain–stress relationship (c).
The geometry of the inflated membrane is illustrated in Figure 9a, where pm represents the internal pressure of the latex membrane, tm is the membrane thickness, hm is the height of the spherical cap, rm is the radius of the spherical cap, and Rw is the radius of the circular window (Rw = 72.5 mm).
The stress distribution within the spherical cap, σm, is calculated as:
The thickness tm is given by:
where tm0 = 0.65 mm (initial membrane thickness).
From the geometric relationship, the radius rm and angle θ are expressed as:
The experimental results (Figure 9b) show the relationship between membrane height (hm) and internal pressure (pm) during the inflation process (represented by the blue line) and the deflation process (represented by the red line). The engineering strain λ was calculated as:
where lm0 represents the initial length and lm is the instantaneous length of the meridian curve of the deformed membrane, rm0 and () are the initial values of the radius rm and angle θ, respectively. Finally, the strain–stress relationship was determined as shown in Figure 9c. The stress–strain curve was calculated based on the average values of the pressure–displacement curves obtained from the inflation and deflation processes of the circular membrane inflation test.
The stress–strain behavior of the latex membrane was described using the Ogden model:
where are material constants; K is the initial bulk modulus; and J is the volumetric ratio, defined as . According to the summary by Bergström [29], considering the material as incompressible (J = 1) and employing the Ogden model for latex, a 3-term formulation can be applied. For the biaxial mode, the engineering stress–strain curve uses the engineering strain parameters defined as .
The analysis process to determine the appropriate material model and simulate the experiment, as described above, for the latex membrane was carried out similarly to that for polyurethane foam. This process utilized input data from the strain–stress curve and finite element modeling to simulate the circular membrane inflation test (Figure 10a). Additionally, Figure 10b highlights the significant swelling behavior of the latex tube under 25 kPa internal pressure, underscoring the necessity of fabric tape reinforcement to stabilize the structure. Similar to the analysis process for PU foam, the purpose of this process was to compare the stress–strain curves obtained from the experimental data and simulations, thereby demonstrating that the chosen material model for latex was appropriate. The comparison results are presented in Figure 10c.
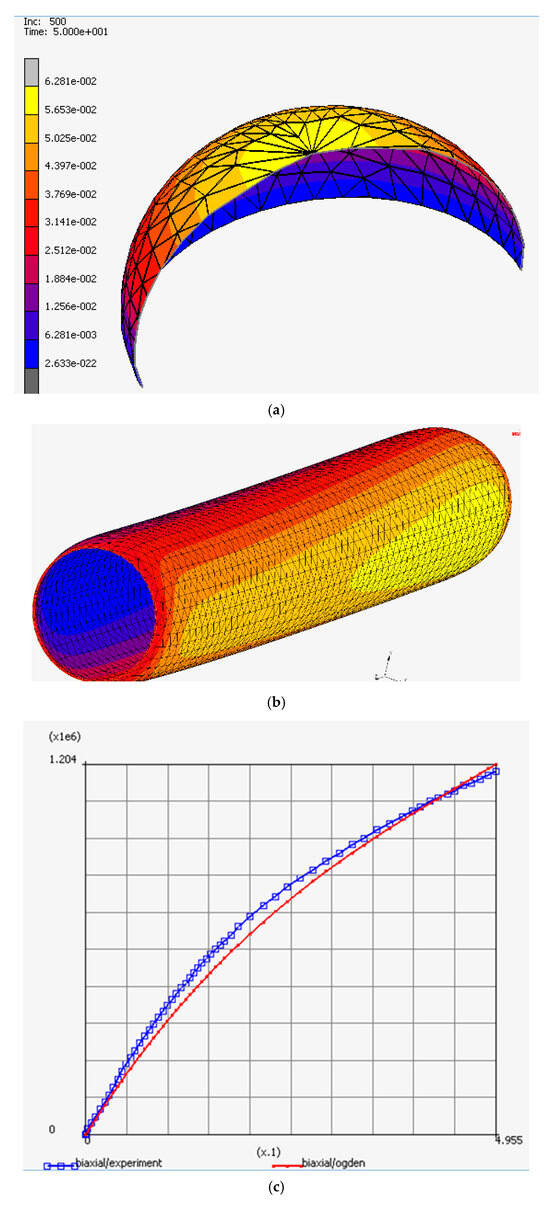
Figure 10.
(a) Simulation results for the inflation test of a circular membrane, showing displacement in the z-direction [m]; (b) Simulation of the deformation behavior of the latex tube; (c) Comparison of experimental stress–strain data (blue) and fitted curves (red) for the latex membrane.
With the selected material model being Ogden and the numerical values for the coefficients in Equation (9) set as N = 3, the results obtained were:
The simulation results for the latex tube subjected to 25 kPa internal pressure (Figure 10b) closely matched the experimental data. Figure 10b illustrates the significant swelling capability of the latex tube under an internal pressure of 25 kPa. This highlights the necessity of using fabric tape to wrap the latex tube in order to mitigate this characteristic.
- b.
- Material Characterization of Fabric Adhesive Tape Using Uniaxial Tensile Test
To ensure the stability of the pneumatic spring, a fabric adhesive tape was wrapped around the latex membrane. The tape’s mechanical properties were determined through uniaxial tensile tests, using specimens measuring 0.16 mm in thickness, 48 mm in width, and 220 mm in length.
The flow–stress curve obtained from the tests were modeled using the Mooney–Rivlin hyperelastic equation:
For uniaxial extension, the engineering strains are defined as shown in [30] with [25], leading to:
The material fitting results based on this model were provided as follows:.
The experimental and simulated stress–strain relationships (Figure 11) showed significant alignment, confirming the reliability of the material model for the fabric tape. Figure 11 includes details on the uniaxial tensile testing setup (Figure 11a) and a direct comparison of the experimental (blue) and fitted (red) stress–strain curves (Figure 11b).
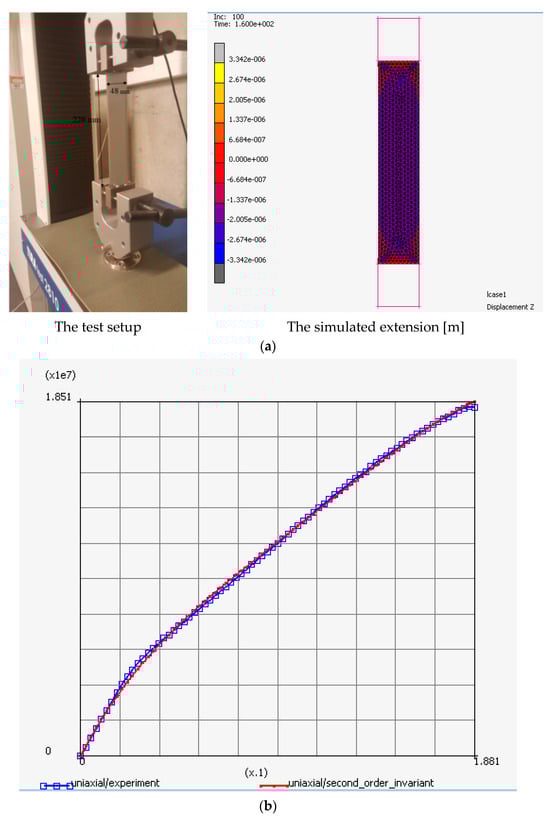
Figure 11.
(a) Uniaxial tensile testing setup for the fabric adhesive tape; (b) Experimental stress–strain curve (blue) compared with the fitted stress–strain curve (red) from the tensile test of the tape.
This section highlighted a systematic approach to characterizing and modeling hyperelastic materials used in pneumatic spring systems. By integrating advanced experimental methods and precise computational modeling, this study provides innovative insights into the design and optimization of automotive seating systems, emphasizing durability, performance, and occupant comfort.
3.4. Boundary Conditions and Initial Setup for Simulation
Accurately defining boundary conditions is critical for effectively simulating the forces acting on model components in seat-comfort analysis. Two widely utilized approaches, as highlighted by Alawneh [13], are the gravity-based method and the thigh and buttock model. The gravity-based method ([16,19,20,31,32,33,34]) applies body weight as a gravitational force continuously acting over time at the model’s center of gravity, directed downward onto the seat cushion surface to simulate static interactions. In contrast, the thigh and buttock model ([35,36,37]) distributes body weight across specific anatomical regions, with 55% allocated to the ischial tuberosities, 27% to the femurs, and 18% to the centers of mass of the lower legs. By enabling a more localized and precise simulation of pressure distribution, the thigh and buttock model offers enhanced accuracy and was therefore selected for this study.
The body weight distribution in the model was based on the weight of the experimental participant, adjusted to match the half-symmetric design of the model. A total mass of 14 kg, corresponding to an evenly distributed force of 140 N, was assigned to the pelvic and sacral regions to represent muscle and bone mass, as shown in Figure 12a. The weight of the half-upper body, equivalent to 18 kg, was represented as a simplified force of 180 N applied at the ischial tuberosity, effectively replicating the load exerted by the upper body.
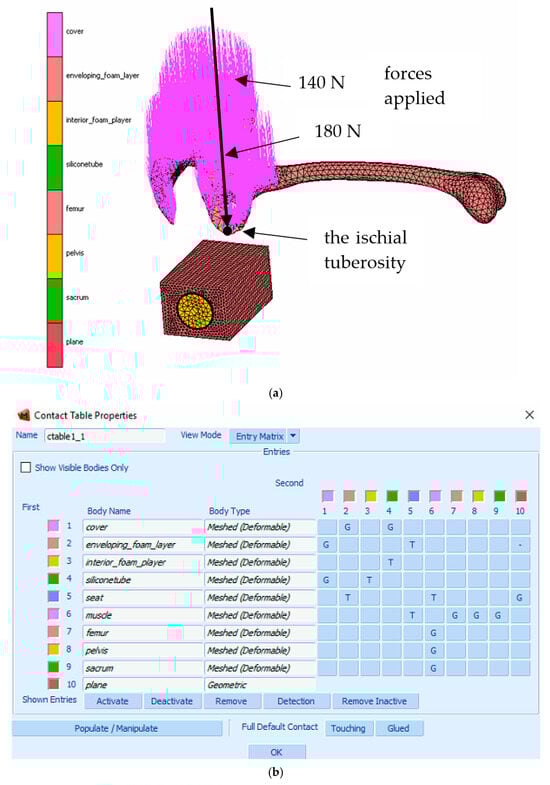
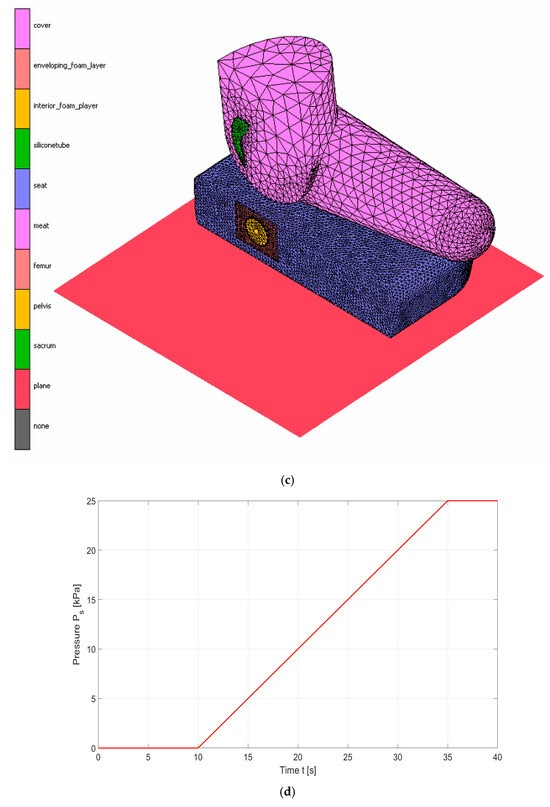
Figure 12.
The force distribution on the human body mode (a), contact table of the components in the model (b), the complete model (c), and the desired internal pressure of the pneumatic spring (d).
The connections between components in the model were established through a connectivity matrix, as shown in Figure 12b. The MSC.Marc software facilitated these connections by using two types of contact interactions: Glue Contact (G), which simulates rigid connections, and Touch Contact (T), which represents flexible surface interactions. These contact definitions ensured accurate modeling of the components’ mechanical behavior.
To ensure simulation stability, specific constraints were applied to the movement of the model components. Directional constraints limited the seat cushion, pneumatic spring, and human body to motion along the z-axis, in alignment with gravity. Additionally, contact constraints were applied to the interface between the flesh and bone layers in the human body model, the layers comprising the pneumatic spring, and the interaction between the seat cushion and the pneumatic spring.
An alternative boundary condition, referred to as the collision approach, was implemented, as detailed in previous studies ([37,38,39,40,41,42,43,44]). In this method, the human body model is positioned 0.1 mm above the seat cushion and allowed to move downward in the z-direction to mimic a natural sitting motion. The initial velocity was set to 0 m/s, with gravity as the sole acting force. This approach prevents mesh penetration during contact, ensuring high accuracy and reliability in the simulation results.
The complete finite element model is illustrated in Figure 12c. To analyze the contact pressure distribution between the human body and the car-seat cushion, the internal pressure of the pneumatic spring was adjusted within a range of 0–25 kPa. This variation was modeled as a time-dependent function (Equation (12)), with the target pressure profile shown in Figure 12d.
This section presented an innovative application of the thigh and buttock model approach, coupled with the collision method, to provide realistic simulations of contact pressure distributions. By integrating advanced boundary conditions, dynamic modeling, and material-specific constraints, this research introduces novel methodologies that significantly contribute to the optimization of seat design, aiming to enhance both performance and user comfort.
4. Simulation and Experimental Results
The simulation results for the contact pressure distribution between the human body and the car-seat cushion are presented in Figure 13a for two cases: internal pneumatic spring (PSE) pressures of 0 kPa and 25 kPa. The simulations reveal a significant effect of increased internal pressure on the distribution of contact pressure. Specifically, raising the PSE pressure from 0 to 25 kPa causes the peak contact pressure to increase from 15.84 kPa to 18.67 kPa, illustrating the role of PSE pressure in altering pressure distribution. The experimental results, depicted in Figure 13b, were collected from a 75 kg participant with a height of 175 cm, seated on a car seat equipped with a pneumatic spring integrated into the cushion. The PSE internal pressure was adjusted between 0 and 25 kPa using an electro-pneumatic control system. High-resolution contact pressure data were captured using the Xsensor mapping system, detailed in Table 4, which employs capacitive sensor technology.
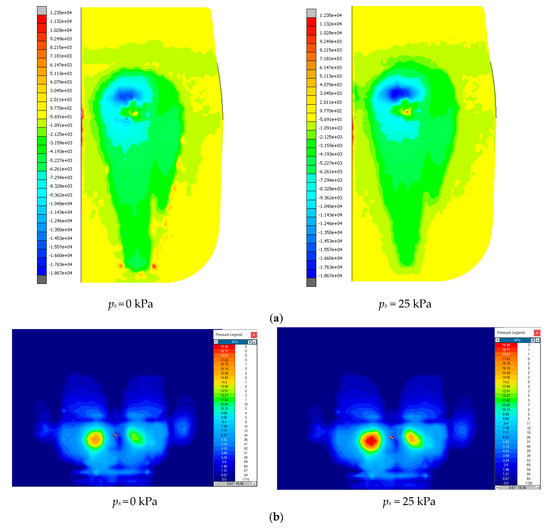
Figure 13.
The results of simulated (a) and experimental (b) contact pressure distribution.
Table 4.
Properties of the pressure mapping system.
A comparison between the simulation results and experimental data, illustrated in Figure 14, demonstrated strong agreement, with peak pressures ranging from 15.57 kPa to 18.67 kPa in the simulations and 16.78 kPa to 19.36 kPa in the experiments. The observed difference of approximately 3.5 kPa (20%) between peak pressures at 0 kPa and 25 kPa of PSE pressure validated the simulation model’s ability to replicate realistic pressure distributions. These findings confirmed that the model accurately reflects the physical and mechanical characteristics of both the human body and the seat cushion integrated with the pneumatic spring.
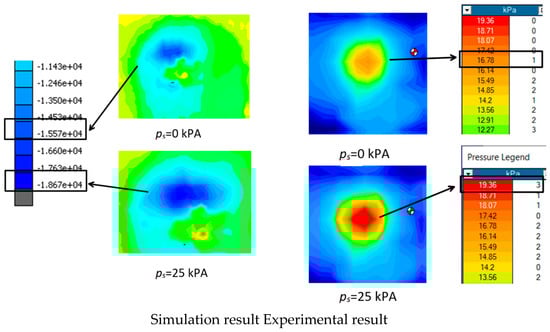
Figure 14.
The desired internal pressure of the PSE from simulations (left) and experiments (right).
This validation highlights the effectiveness of the model in capturing key factors such as cushion geometry, pneumatic spring structure, material properties, and human–seat interactions. By reliably simulating contact pressure distribution, the model can supplement or replace physical experiments, offering a robust tool for optimizing the shape, materials, and structure of pneumatic spring devices to achieve optimal pressure distribution. The validated model also reduces the need for extensive physical testing by enabling the exploration of various test scenarios through parameter modifications in simulations.
Such an approach not only minimizes costs associated with prototype production and testing but also accelerates the identification and rectification of design weaknesses. The concordant results provide a valuable foundation for studying the interplay between body shape, contact pressure, and occupant comfort. Moreover, the insights gained can drive the development of seat designs that enhance comfort during prolonged use, thereby advancing ergonomic standards in automotive seating.
5. Conclusions
This study investigated the distribution of contact pressure between the human body and a seat cushion integrated with a pneumatic spring using the finite element method (FEM). A half-symmetry modeling approach was adopted to balance computational efficiency with experimental fidelity while ensuring broad applicability. Simulations were conducted using MSC.Marc software, incorporating validated material models for polyurethane foam, latex membranes, and fabric tape, which were experimentally tested and compared against real-world results. The findings demonstrated a strong correlation between simulated and experimental data, confirming the model’s reliability in predicting contact pressure distribution and peak pressure variations across different pneumatic spring conditions. The ability to modify peak pressure will serve as a foundation for further research aimed at enhancing automotive seat comfort.
The scientific contribution of this study lies in its integration of advanced material modeling and precisely defined boundary conditions, enhancing the accuracy of computational simulations in occupant–seat interactions. Additionally, this study introduces validated hyperelastic and viscoelastic material models, improving the representation of seat cushion behavior under static loads. From a practical perspective, the FEM model provides a cost-effective and efficient tool for optimizing seat cushion designs, enabling real-time adjustments to pneumatic spring pressure and cushion stiffness. The findings have direct applications in automotive, aerospace, and medical seating systems, where ergonomic optimization and fatigue reduction are essential.
This research also bridges the gap between computational modeling and real-world seating applications, laying the foundation for next-generation adaptive seating solutions. By enabling personalized seat adjustments based on real-time occupant posture and pressure feedback, this novel approach advances seating comfort, durability, and overall performance.
Future research will extend this work by incorporating dynamic loading conditions, such as vibration effects and transient forces, to better simulate real-world driving scenarios. The integration of biomechanical models will offer deeper insights into postural shifts, entry–exit movements, and long-term seat use [1], refining pressure distribution analysis. Furthermore, expanding experimental validation to diverse demographic groups will support the development of adaptive seat adjustment algorithms, allowing real-time pneumatic spring modulation for personalized comfort optimization. These advancements will drive the evolution of user-centric, intelligent seating systems, enhancing both ergonomic performance and occupant well-being across various industries.
Author Contributions
Conceptualization, X.-T.T.; Methodology, X.-T.T. and D.-T.N.; Software, X.-T.T.; Validation, D.-T.N.; Formal analysis, V.-H.N.; Investigation, X.-T.T. and D.-T.N.; Resources, V.-H.N.; Data curation, X.-T.T.; Writing—original draft, X.-T.T.; Writing—review & editing, D.-T.N.; Visualization, V.-H.N.; Supervision, D.-T.N.; Project administration, X.-T.T. All authors have read and agreed to the published version of the manuscript.
Funding
This work was financially supported by the Ministry of Education and Training, Vietnam under the grant number B2023-SKH-03.
Data Availability Statement
The original contributions presented in this study are included in the article. Further inquiries can be directed to the corresponding author.
Acknowledgments
The authors sincerely acknowledge the financial support from the Vietnam Ministry of Education and Training under Vietnam Grant No. B2023-SKH-03. The Faculty of Mechanical Engineering at Hungyen University of Technology and Education is also gratefully acknowledged for providing the necessary facilities and support to conduct this research.
Conflicts of Interest
The authors declare no conflict of interest.
References
- Mergl, C.; Klendauer, M.; Mangen, C.; Bubb, H. Predicting Long Term Riding Comfort in Cars by Contact Forces Between Human and Seat; SAE Technical Paper 2005-01-2690; SAE International: Warrendale, PA, USA, 2005. [Google Scholar] [CrossRef]
- Kyung, G.; Nussbaum, M.A. Driver sitting comfort and discomfort (part II): Relationships with and prediction from interface pressure. Int. J. Ind. Ergon. 2008, 38, 526–538. [Google Scholar] [CrossRef]
- Cirkl, D.; Xuan, T.T. Simulation model of seat with implemented pneumatic spring. Vibroengineering Procedia 2016, 7, 154–159. [Google Scholar]
- Xuan, T.T.; Cirkl, D. FEM model of pneumatic spring assembly. Vibroengineering Procedia 2017, 13, 199–204. [Google Scholar] [CrossRef][Green Version]
- Xuan, T.T.; Cirkl, D. Modelling of dynamical behavior of pneumatic spring—Mass system. Eng. Mech. 2018, 2018, 865–868. [Google Scholar] [CrossRef]
- Xuan, T.T.; Cirkl, D. The effect of system improvement on regulation of pressure inside pneumatic spring element and on transmission of acceleration. Vibroengineering Procedia 2019, 27, 49–54. [Google Scholar] [CrossRef]
- Xuan, T.T.; Phu, D.N. The mathematical model of the improved system of the seat with adjustable pressure profile. Math. Model. Eng. 2020, 6, 79–92. [Google Scholar] [CrossRef]
- Luyen, T.-T.; Nguyen, D.-T. Improving parameters for achieving uniform cylindrical cup wall thickness in two-step deep drawing processes with SPCC sheet material. Proc. Inst. Mech. Eng. Part E J. Process Mech. Eng. 2024, 09544089241285182. [Google Scholar] [CrossRef]
- Trieu, Q.-H.; Luyen, T.-T.; Nguyen, D.-T.; Bui, N.-T. A Study on Yield Criteria Influence on Anisotropic Behavior and Fracture Prediction in Deep Drawing SECC Steel Cylindrical Cups. Materials 2024, 17, 2872. [Google Scholar] [CrossRef] [PubMed]
- Luyen, T.T.; Mac, T.B.; Banh, T.L.; Nguyen, D.-T. Investigating the impact of yield criteria and process parameters on fracture height of cylindrical cups in the deep drawing process of SPCC sheet steel. Int. J. Adv. Manuf. Technol. 2023, 128, 2059–2073. [Google Scholar] [CrossRef]
- Phan, T.-H.-L.; Luyen, T.-T.; Nguyen, D.-T. A Study Utilizing Numerical Simulation and Experimental Analysis to Predict and Optimize Flange-Forming Force in Open-Die Forging of C45 Billet Tubes. Appl. Sci. 2023, 13, 9063. [Google Scholar] [CrossRef]
- Luyen, T.T.; Nguyen, D.T. Improved uniformity in cylindrical cup wall thickness at elevated temperatures using deep drawing process for SPCC sheet steel. J. Braz. Soc. Mech. Sci. Eng. 2023, 45, 348. [Google Scholar] [CrossRef]
- Alawneh, O.; Zhong, X.; Faieghi, R.; Xi, F. Finite Element Methods for Modeling the Pressure Distribution in Human Body–Seat Interactions: A Systematic Review. Appl. Sci. 2022, 12, 6160. [Google Scholar] [CrossRef]
- Reed, M.P.; Manary, M.A.; Schneider, L.W. Methods for Measuring and Representing Automobile Occupant Posture; SAE Technical Paper no. 724; SAE International: Warrendale, PA, USA, 1999. [Google Scholar] [CrossRef]
- Reed, M.P.; Manary, M.A.; Flannagan, C.A.C.; Schneider, L.W. A statistical method for predicting automobile driving posture. Hum. Factors 2002, 44, 557–568. [Google Scholar] [CrossRef] [PubMed]
- Pankoke, S.; Siefert, A. Virtual Simulation of Static and Dynamic Seating Comfort in the Development Process of Automobiles and Automotive Seats: Application of Finite-Element-Occupant-Model CASIMIR; SAE Technical Paper no. 724; SAE International: Warrendale, PA, USA, 2007. [Google Scholar] [CrossRef]
- Siefert, A.; Pankoke, S.; Hofmann, J. CASIMIR/Automotive: A Software for the Virtual Assessment of Static and Dynamic Seating Comfort; SAE Technical Paper; SAE International: Warrendale, PA, USA, 2009; Volume 4970. [Google Scholar] [CrossRef]
- Van Hoof, J.; Van Markwijk, R.; Verver, M.; Furtado, R.; Pewinski, W. Numerical Prediction of Seating Position in Car Seats; SAE Technical Paper no. 724; SAE International: Warrendale, PA, USA, 2004. [Google Scholar] [CrossRef]
- Du, X.; Ren, J.; Sang, C.; Li, L. Simulation of the interaction between driver and seat. Chin. J. Mech. Eng. 2013, 26, 1234–1242. [Google Scholar] [CrossRef]
- Grujicic, M.; Pandurangan, B.; Arakere, G.; Bell, W.C.; He, T.; Xie, X. Seat-cushion and soft-tissue material modeling and a finite element investigation of the seating comfort for passenger-vehicle occupants. Mater. Des. 2009, 30, 4273–4285. [Google Scholar] [CrossRef]
- Cheng, L.; Wen, H.; Ni, X.; Zhuang, C.; Zhang, W.; Huang, H. Optimization Study on the Comfort of Human-Seat Coupling System in the Cab of Construction Machinery. Machines 2023, 11, 30. [Google Scholar] [CrossRef]
- MTanzi, C.; Farè, S.; Candiani, G. Mechanical Properties of Materials. In Foundations of Biomaterials Engineering; Academic Press: Cambridge, MA, USA, 2010. [Google Scholar] [CrossRef]
- Abbassi, F.; Pantalé, O.; Zghal, A.; Rakotomalala, R. Analysis of the thinning phenomenon variations in sheet metal forming process. In Proceedings of the IX International Conference on Computational Plasticity, COMPLAS IX, Barcelone, Spain, 5–7 September 2007; pp. 96–99. [Google Scholar]
- Patil, A.; Dasgupta, A.; Eriksson, A. Contact mechanics of a circular membrane inflated against a deformable substrate. Int. J. Solids Struct. 2015, 67–68, 250–262. [Google Scholar] [CrossRef]
- Volinsky, A.A.; Bahr, D.F.; Kriese, M.D.; Moody, N.R.; Gerberich, W. Nanoindentation Methods in Interfacial FractureTesting. Compr. Struct. Integr. 2023, 8, 3–42. [Google Scholar] [CrossRef]
- Sirotti, S.; Pelliciari, M.; Tarantino, A.M. Effect of compressibility on the mechanics of hyperelastic membranes. Int. J. Mech. Sci. 2024, 278, 109441. [Google Scholar] [CrossRef]
- Jung, B.B.; Lee, H.K.; AnfHyun-ChulPark, H.C. Measurement of mechanical properties of thin films using a combination of the bulge test and nanoindentation. Trans. Korean Soc. Mech. Eng. B 2012, 36, 117–123. [Google Scholar] [CrossRef]
- Kraft, O. Thin Films: Mechanical Testing. Encycl. Mater. Sci. Technol. 2001, 36, 9257–9261. [Google Scholar] [CrossRef]
- Bergström, J. Elasticity/Hyperelasticity. In Mechanics of Solid Polymers Theory and Computational Modeling; William Andrew: Norwich, NY, USA, 2015. [Google Scholar] [CrossRef]
- Kadlowec, J.; Wineman, A.; Hulbert, G. Elastomer bushing response: Experiments and finite element modeling. Acta Mech. 2003, 163, 25–38. [Google Scholar] [CrossRef]
- Liu, C.; Qiu, Y.; Griffin, M.J. Finite element modelling of human-seat interactions: Vertical in-line and fore-and-aft cross-axis apparent mass when sitting on a rigid seat without backrest and exposed to vertical vibration. Ergonomics 2015, 58, 1207–1219. [Google Scholar] [CrossRef]
- Dong, R.C.; He, L.; Du, W.; Cao, Z.K.; Huang, Z.L. Effect of sitting posture and seat on biodynamic responses of internal human body simulated by finite element modeling of body-seat system. J. Sound Vib. 2019, 438, 543–554. [Google Scholar] [CrossRef]
- Siefert, A.; Pankoke, S. Development of a Detailed Buttock and Thigh Muscle Model casimir. SAE Int. J. Passeng. Cars-Mech. Syst. 2018, 1, 1085–1093. [Google Scholar] [CrossRef]
- Lewis, A.; Phillips, E.; Grimshaw, P.; Portus, M.; Robertson, W.S.P. Effect of Seating Cushions on Pressure Distribution in Wheelchair Racing. ISBS Proc. Arch. 2017, 35, 219. [Google Scholar]
- Li, S.; Zhang, Z.; Wang, J. A new custom-contoured cushion system based on finite element modeling prediction. J. Mech. Med. Biol. 2013, 13, 1350051. [Google Scholar] [CrossRef]
- Makhsous, M.; Lim, D.; Hendrix, R.; Bankard, J.; Rymer, W.Z.; Lin, F. Finite element analysis for evaluation of pressure ulcer on the buttock: Development and validation. IEEE Trans. Neural Syst. Rehabil. Eng. 2007, 15, 517–525. [Google Scholar] [CrossRef]
- Huang, S.; Zhang, Z.; Xu, Z.; He, Y. Modeling of human model for static pressure distribution prediction. Int. J. Ind. Ergon. 2015, 50, 186–195. [Google Scholar] [CrossRef]
- Xu, W.; Zeng, Y.; Ye, J. Study on Virtual Simulation Method of Driver Seat Comfort. IOP Conf. Ser. Mater. Sci. Eng. 2019, 493, 012096. [Google Scholar] [CrossRef]
- Savonnet, L.; Wang, X.; Duprey, S. Finite element models of the thigh-buttock complex for assessing static sitting discomfort and pressure sore risk: A literature review. Comput. Methods Biomech. Biomed. Engin. 2018, 21, 379–388. [Google Scholar] [CrossRef] [PubMed]
- Cheng, Z.; Smith, J.A.; Fleming, S.M. Considerations and Experiences in Developing a Finite Element Buttock Model for Seating Comfort Analysis; Dayton OH 45431-1289 Biosciences and Protection Division Human Effectiveness Directorate Biosciences and Protection Division Biomechanics Branch; SAE International: Warrendale, PA, USA, 2008. [Google Scholar]
- Carfagni, M.; Governi, L.; Volpe, Y. Comfort assessment of motorcycle saddles: A methodology based on virtual prototypes. Int. J. Interact. Des. Manuf. 2007, 1, 155–167. [Google Scholar] [CrossRef]
- Kim, H.; Lee, T.; Lee, Y.; Kim, J.; Jung, S.; Yang, D.; Hong, J. A design for seat cushion and back-supporter using finite element analysis for preventing decubitus ulcer. J. Biomech. Sci. Eng. 2017, 12, 16–00586. [Google Scholar] [CrossRef][Green Version]
- Hu, J.; Reed, M. Development of a methodology for simulating seat back interaction using realistic body contours. SAE Int. J. Passeng. Cars-Mech. Syst. 2013, 6, 623–628. [Google Scholar] [CrossRef][Green Version]
- Pennestri, E.; Valentini, P.P.; Vita, L. Comfort analysis of car occupants: Comparison between multibody and finite element models. Int. J. Veh. Syst. Model. Test. 2005, 1, 68–78. [Google Scholar] [CrossRef]


Disclaimer/Publisher’s Note: The statements, opinions and data contained in all publications are solely those of the individual author(s) and contributor(s) and not of MDPI and/or the editor(s). MDPI and/or the editor(s) disclaim responsibility for any injury to people or property resulting from any ideas, methods, instructions or products referred to in the content. |
© 2025 by the authors. Licensee MDPI, Basel, Switzerland. This article is an open access article distributed under the terms and conditions of the Creative Commons Attribution (CC BY) license (https://creativecommons.org/licenses/by/4.0/).