Article

Evaluating the Resilience of Mountainous Sparse Road Networks in High-Risk Geological Disaster Areas: A Case Study in Tibet, China

1
The Key Laboratory of Road and Traffic Engineering, Ministry of Education, Tongji University, Shanghai 201804, China
2
College of Transportation Engineering, Tongji University, Shanghai 201804, China
*
Author to whom correspondence should be addressed.
Appl. Sci. 2025, 15(5), 2688; https://doi.org/10.3390/app15052688
Submission received: 2 February 2025 / Revised: 20 February 2025 / Accepted: 28 February 2025 / Published: 3 March 2025
(This article belongs to the Special Issue Future Transportation Systems: Efficiency and Reliability)

Abstract

:

Featured Application

The proposed dynamic resilience assessment framework and two-layer topological model can be directly applied to evaluate and enhance the resilience of transportation networks in geohazard-prone regions. Specifically, the framework provides valuable insights for optimizing emergency response strategies, resource allocation, and infrastructure planning in sparse road networks. These findings are particularly relevant for decision-makers and engineers aiming to mitigate the impacts of geological disasters on transportation systems, ensuring efficient recovery and improved network reliability in remote and vulnerable areas.

Abstract

Sparse road networks in high-risk geological disaster areas, characterized by long segments, few nodes, and limited alternative routes, face significant vulnerabilities to geological hazards such as landslides, rockfalls, and collapses. These disruptions hinder emergency response and resource delivery, highlighting the need for enhanced resilience strategies. This study develops a dynamic resilience assessment framework using a two-layer topological model to analyze and optimize the resilience of such networks. The model incorporates trunk and local layers to capture dynamic changes during disasters, and it is validated using the road network in Tibet. The findings demonstrate that critical nodes, including tunnels, bridges, and interchanges, play a decisive role in maintaining network performance. Resilience is influenced by disaster type, duration, and traffic capacity, with collapse events showing moderate resilience and debris flows exhibiting rapid recovery but low survivability. Notably, half-width traffic interruptions achieve the highest overall resilience (0.7294), emphasizing the importance of partial traffic restoration. This study concludes that protecting critical nodes, optimizing resource allocation, and implementing adaptive management strategies are essential for mitigating disaster impacts and enhancing recovery. The proposed framework offers a practical tool for decision-makers to improve transportation resilience in high-risk geological disaster areas.

1. Introduction

In the context of escalating climate change and frequent public health incidents, the transportation system faces increasing uncertainties and unknown risks [1,2,3]. This issue is particularly pronounced in remote and rural areas [4], where geological and climatic conditions often limit road networks, resulting in sparse road infrastructure. Characteristics of these sparse networks include a scarcity of critical nodes, widespread node distribution, long distances between nodes, low traffic volumes, low network density, and limited alternative routes. Despite these limitations, these sparse networks are the only means of regional connectivity, emergency service provision, and economic support [5]. Therefore, ensuring the reliability and resilience of these sparse networks is crucial for the safety of individuals and the sustainable development of regions. Currently, research on the resilience of sparse road networks under the impact of emergencies faces several challenges.
On the one hand, natural disasters (such as mudslides, landslides, earthquakes, etc.), severe weather conditions (dense fog, heavy snow, icy roads, etc.), traffic accidents, and planned interruptions can cause random damage to segments and critical nodes within the sparse road network. These disruptions can lead to complete closures or one-way traffic, significantly altering the road network’s topology compared to regular conditions [6,7]. Additionally, temporary traffic control measures or road closures are often necessary in response to sudden disaster events, with normal traffic resuming once the temporary state ends. This results in frequent, localized, and time-limited changes in the network topology [8]. Therefore, it is crucial to develop a road network model that accurately reflects the structural characteristics of sparse road networks and their dynamic changes during disaster events. Such a model would provide a foundation for assessing traffic conditions, planning emergency rescue routes, and optimizing resilience measures, thereby improving the timeliness and accuracy of emergency responses in sparse road networks affected by disasters.
On the other hand, geological disaster events in extreme environments and severe weather pose unique challenges to sparse road networks [9,10,11]. Unlike rare large-scale events such as earthquakes [12], tsunamis [13], and floods [14,15], frequent geological disasters often occur before the previous incident is fully repaired, causing continuous service interruptions and long-term recovery efforts. This results in the cumulative degradation of road network infrastructure and service performance, severely impacting the stability and safety of the road network. Compared to dense road networks, sparse road networks lack alternative bypass routes, making them more vulnerable to disasters. When a disaster occurs, it severely hampers emergency response efforts and significantly delays the arrival of emergency relief and recovery resources. Moreover, the critical components of these networks, including bridges and tunnels, may require months or even years for repair or reconstruction [16,17]. During this period, utilizing the remaining functionality of damaged infrastructure for intermittent passage is crucial for maintaining the operability and accessibility of the road network.
Previous research on the resilience of transportation networks has primarily focused on the development of frameworks for quantifying and optimizing the resilience of urban roads and dense networks [9,18,19]. These studies often assume that road networks operate in environments with infrequent natural disasters, such that disaster events occur simultaneously, and that the service functionality of segments or nodes is completely disrupted [20]. However, these assumptions do not always reflect reality, neglecting the unique challenges faced by sparse road networks, including the frequent occurrence of geological disasters, limited recovery resources, and the lack of alternative routes. Additionally, existing methods often lack dynamism, making them ineffective in predicting and adapting to the temporal variations and impacts of geological disasters.
Therefore, this paper proposes an integrated dynamic resilience assessment and optimization framework (SRN-RAOF) for sparse road networks affected by geological disasters in extreme environments. This framework aims to comprehensively understand and enhance the resilience of sparse road networks in regions prone to geological disasters by constructing a dual-layer topological structure model, defining the resilience connotation of sparse road networks, and developing resilience quantification assessment models and optimization strategies. This study specifically focuses on the dynamic changes in road network performance following geological disasters and the corresponding recovery strategies. Specifically, it examines the impact of sparse network structures, disaster duration, and the residual functionality of damaged infrastructure on network resilience in the absence of alternative routes. The study does not address pre-disaster risk prediction or long-term monitoring. The main contributions of this study are as follows:
  • Proposing a two-layer topological modeling approach suitable for road networks in regions prone to frequent geological and meteorological disasters.
  • Developing a dynamic resilience evaluation method for sparse road networks under high-frequency cumulative disaster events.
The remainder of this paper is organized as follows: Section 2 reviews related research on transportation network resilience assessment; Section 3 introduces the mathematical model of SRN-RAOF; Section 4 applies SRN-RAOF to an actual road network in China; and Section 5 presents the conclusions of the paper.

2. Related Research

2.1. Network Topology Construction

Network topology metrics measure network resilience from a static perspective, reflecting the connectivity of transportation networks under disruptions. Scholars have proposed various methods to construct and optimize road network topology models. For instance, some studies utilize complex network theory to analyze the robustness and efficiency of urban road networks [21]. For example, Zheng [22] revealed the crucial impact of road network structural characteristics on traffic flow by studying the evolution of the road network in Changchun. Additionally, graph theory-based methods are widely applied to the dynamic topology generation and optimization of road networks [23]. Machine learning techniques, particularly deep learning, have also been introduced into road network topology modeling to enhance the accuracy and efficiency of traffic flow prediction.
Despite significant advancements in using complex network theory and deep learning techniques for road network topology modeling [24], most research has focused on graph theory-based single-layer topology micro-models. These model abstract road network intersections as nodes and road segments as edges. However, when simulating large-scale sparse road networks, their computational efficiency is low, failing to meet the timeliness and real-time requirements of emergency rescue. Additionally, most applications of road network topology models are limited to static or pre-defined scenarios, lacking the capability to respond to real-time changes in road network conditions under sudden disaster events. Consequently, they cannot dynamically represent the traffic state and emergencies of sparse road networks.

2.2. Transportation Network Resilience Assessment

In recent years, resilience has garnered significant interest from researchers and practitioners across various disciplines. Current transportation resilience research primarily falls into two categories: pre-disaster infrastructure risk warning and post-disaster transportation network functionality assessment. The former utilizes multi-source monitoring technologies (e.g., Multi-Temporal Interferometry Synthetic Aperture Radar (MTInSAR) [25] and Unmanned Aerial Vehicle (UAV) [26]) to quantify infrastructure failure probabilities and facilitate long-term geological disaster risk warnings. The latter focuses on the immediate impact of disaster events on road network connectivity and accessibility, as well as their recovery capabilities [27,28]. This study aligns with the latter approach, aiming to develop a quantitative model and optimization framework for post-disaster dynamic resilience assessment.
As shown in Table 1, existing studies on transportation resilience primarily adopt two mainstream perspectives. The first defines resilience as an inherent capability or attribute of a system, emphasizing its ability to maintain functionality during disruptive events [29]. The second, though less common, conceptualizes resilience as a quantifiable dynamic function of system performance, used to assess network behavior under potential disruptions [19]. Despite these differing perspectives, most definitions converge on two core dimensions: a transportation network’s ability to withstand disruptions and its capacity for rapid recovery following failures. The overarching goal remains to characterize the evolution of system performance under disruptive events. System resilience is a multi-dimensional and dynamic concept commonly used to evaluate a system’s ability to absorb external disturbances and recover [20,30]. Most studies measure resilience by assessing whether a system’s performance or functionality meets the required level before and after a disturbance event [31].
In terms of methods for assessing transportation system resilience, Bruneau [37] introduced the resilience triangle, which measures resilience based on the magnitude of anticipated quality decline (failure probability) over time (i.e., recovery time). However, this approach assumes a linear recovery phase connecting pre- and post-disaster performance, thus lacking a detailed model of the recovery phase. In reality, road networks in extreme environments prone to frequent disasters may experience extended recovery periods [38]. They developed a comprehensive resilience assessment framework based on the structural and functional performance of road networks, using the “R4 Framework” to analyze system resilience attributes. Li et al. [20] proposed a dynamic resilience assessment framework for highway networks under extreme conditions from a long-term operational perspective. However, current resilience quantification models typically address only one disturbance event at a time, while disaster-prone areas often face simultaneous events affecting multiple components of the system. Therefore, it is necessary to consider multiple types of disturbances simultaneously, as noted in Zobel and Khansa [39].
To address these issues, this paper establishes a dynamic resilience assessment framework for sparse road networks in disaster-prone areas. The framework aims to analyze the performance of sparse road networks under the impacts of continuous service interruptions and prolonged recovery periods, as well as the lack of alternative routes.

3. Methodology

This study proposes a comprehensive framework for evaluating the resilience of sparse road networks in high-risk geological disaster areas. As shown in Figure 1, the methodology consists of three main steps: (1) developing a hierarchical road network topology based on trunk-level and local-level networks, which captures the layered structure of transportation systems in mountainous regions; (2) defining road network performance by integrating structural metrics (e.g., graph-based connectivity) and functional metrics (e.g., average travel delay (AvTD)), providing a dynamic assessment of network functionality over time; and (3) simulating disaster impacts and recovery processes to evaluate changes in network topology and performance under different scenarios, considering factors such as road network structure, disaster duration, and remaining capacity. This framework enables a systematic evaluation of road network resilience, offering insights for disaster mitigation and infrastructure planning.

3.1. Two-Layer Topological Model for Sparse Road Networks

Complete and comprehensive road network information is fundamental for post-disaster emergency route planning. To address the coupling relationships among road infrastructure components (e.g., bridges, tunnels, embankments, etc.), local road networks, and traffic operation states in sparse road networks during disaster events, we propose a topological structure that includes both a trunk layer network and a local layer network. This structure enables the expression and analysis of topological relationships and dynamic attributes between road segments, supporting traffic analysis and control under varying disaster conditions.
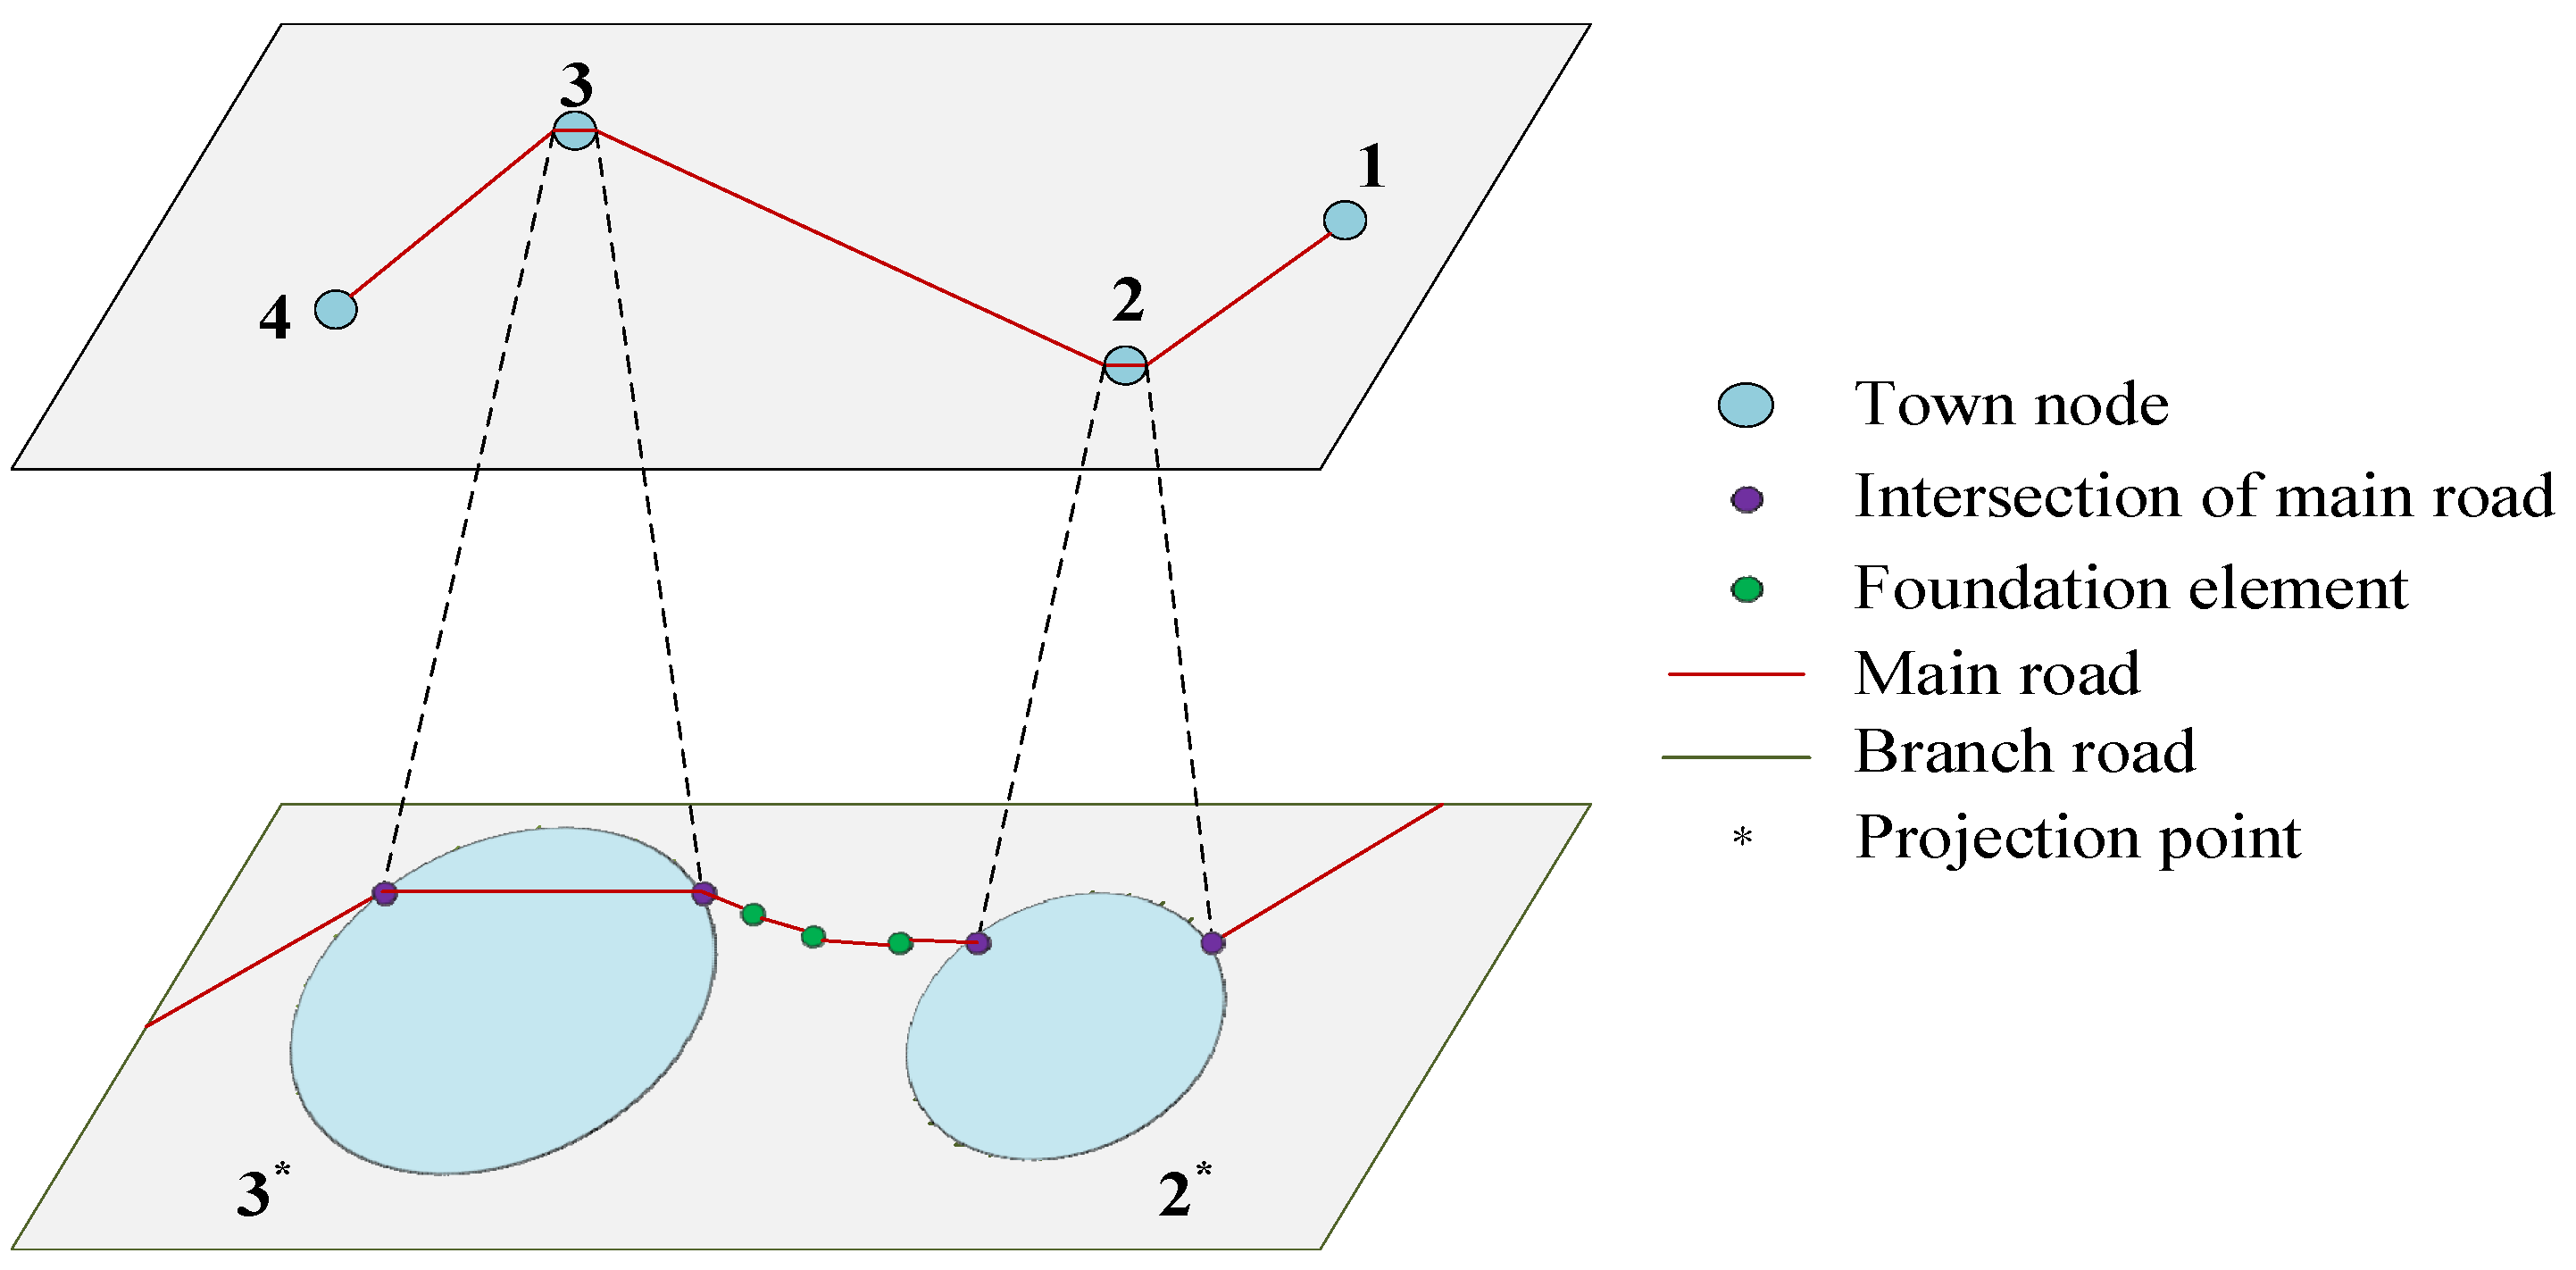
Based on the Barabási-Albert (BA) model [40] and multi-dimensional variable space models [41], this paper views the sparse road network system as a multi-layer network. To account for heterogeneity between different layers, a dual-layer network theory is employed to represent the trunk layer and local layer road networks. The upper layer represents the trunk layer road network, while the lower layer represents the local layer road network. The switching between the trunk network and the local network is facilitated through intersections, forming a connecting cross-layer network as illustrated in Figure 2.
We choose a directed graph to represent the topology of sparse road networks in disaster-prone areas [42]. Based on graph theory, the sparse road network is abstracted as a directed graph G = (Node, Edge), where Node represents the set of nodes, selecting major traffic hubs that significantly impact driving routes, and Edge represents the set of directed arcs connecting these nodes, corresponding to the road segments.

3.1.1. Trunk-Level Road Network Topology

The sparse main network layer topology is composed of simplified basic modeling units of a sparse road network. The simplification of the main road network follows these principles:
  • Delete urban roads within the target area, retaining highways, national roads, and provincial roads;
  • Remove internal road nodes and merge multiple connected roads without branches into a single structure;
  • Eliminate auxiliary roads that are short and do not affect the overall connectivity of the main road network;
  • Merge internal road nodes of cities (municipalities), counties (districts), and towns within the target area into a single node.
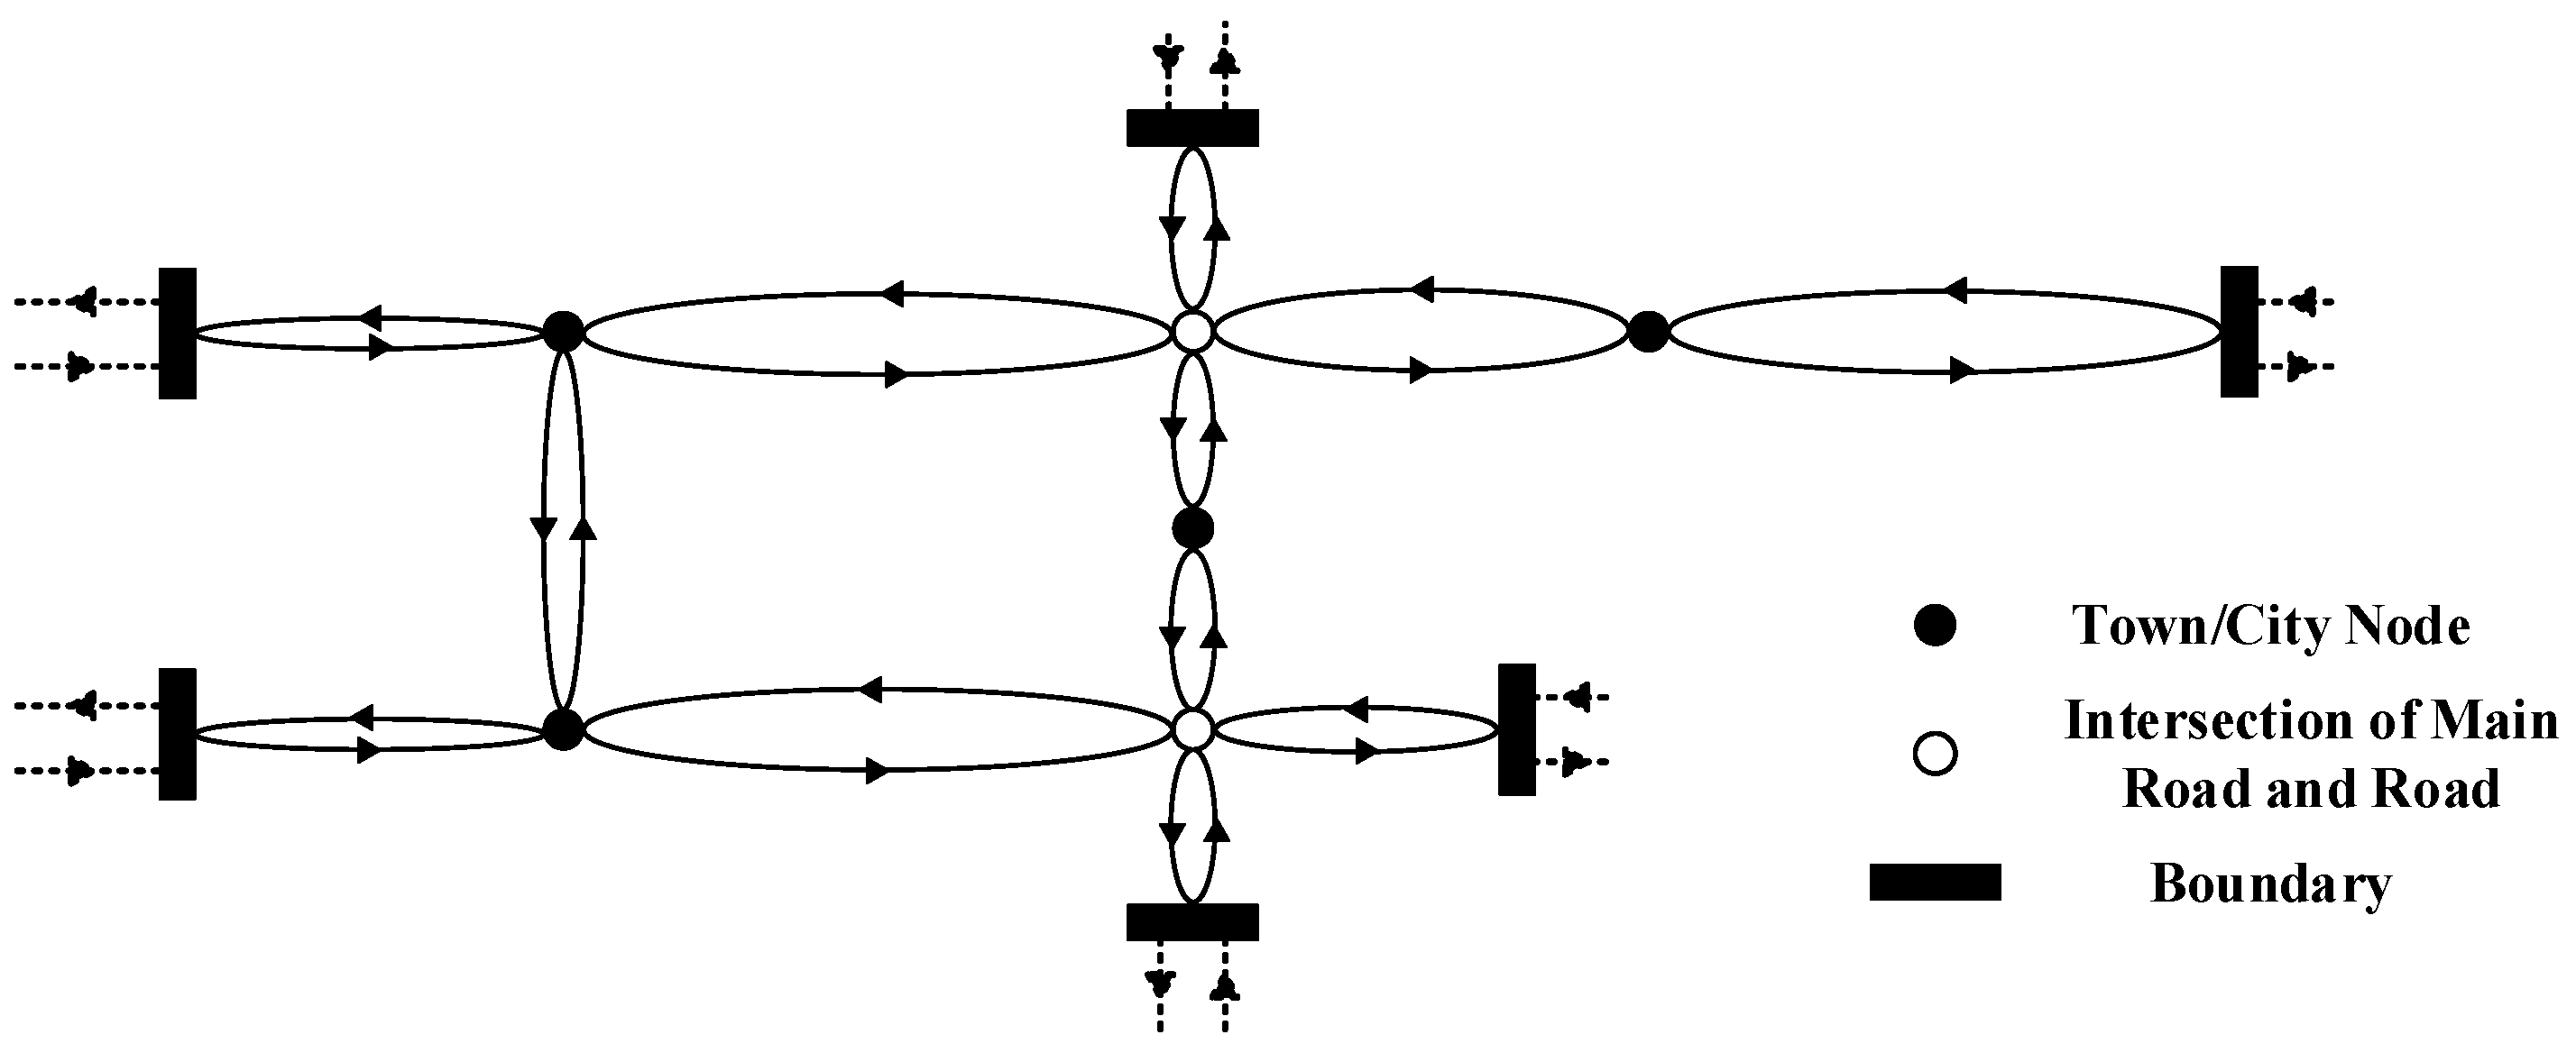
Based on these simplification principles and using complex network directed graph theory, a sparse main network layer topology model is constructed. This model includes two data elements: directed road segments and nodes. Road segments represent directed lines between nodes, such as high-level roads like highways, national roads, and provincial roads within the area. Nodes encompass major road intersections and local road networks, such as important national and provincial road intersections, as well as county and city road networks. The relationships between road segments and nodes reflect the overall macro topology of the road network. The basic topology of the main network layer is illustrated in Figure 3.

3.1.2. Local-Level Road Network Topology

The local layer road network topology is an enlarged view of the trunk layer road network’s nodes and segments. It still consists of two data elements, i.e., nodes and directed segments, including local node topology and local segment topology.
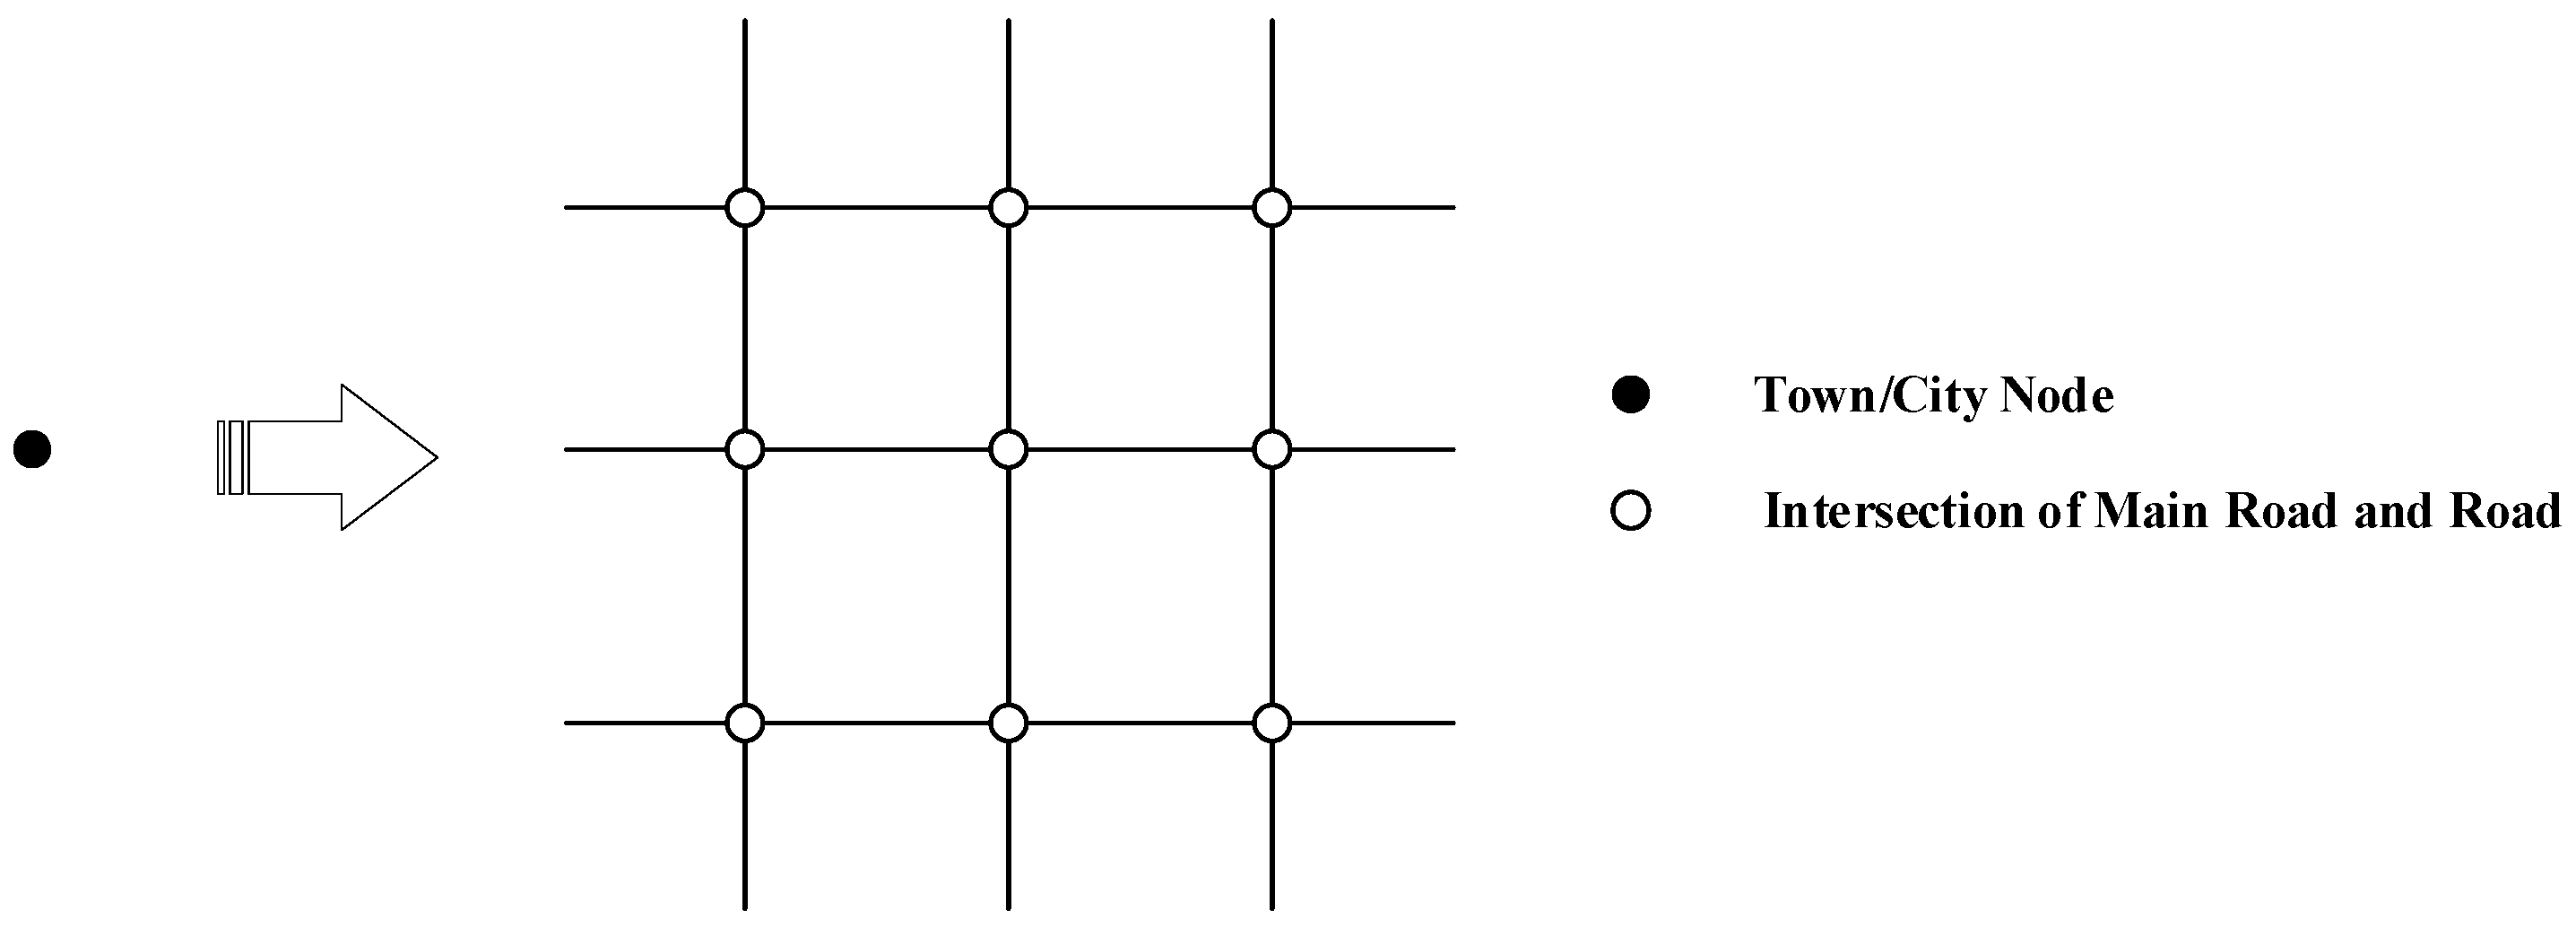
The local node topology is an enlarged version of the trunk layer network’s node topology. It represents a local network within the trunk layer network node that has independent traffic properties, including more nodes and edges. The nodes refer to intersections within the local road network, while the edges represent road connections within the local area, including county roads, streets, and alleys within the city. Figure 4 illustrates the local node road network topology model.
The local segment topology is an enlarged version of the trunk road network segment topology. In a real traffic network, due to geological disasters, traffic control, or construction work, certain sections may be closed, or entire segments may be nonexistent or individually closed. This connectivity information must be flexibly configured in the topology to accurately describe the sparse road network topology. Additionally, due to local traffic control (speed/weight limits), topographic features, and changes in road alignment conditions can result in bridges, tunnels, and short road segments having inconsistent infrastructure conditions compared to adjacent road facilities. To accurately represent the network state, these differences must be stored as segmented data across distinct road sections. Consequently, components or sections are used as the smallest modeling units. In sparse road networks, bridges and tunnels are not merely infrastructure components but are often modeled as critical nodes in network topology due to their significant impact on connectivity and functionality when disrupted. Thus, in our topological modeling approach, bridges and tunnels are uniformly abstracted as critical nodes. This means that nodes represent bridges, tunnels, topographic feature boundaries, road alignment change points, and segment connectivity points caused by disaster events. Figure 5 illustrates the local segment road network topology model.

3.2. Connotation of Resilience of Sparse Road Networks

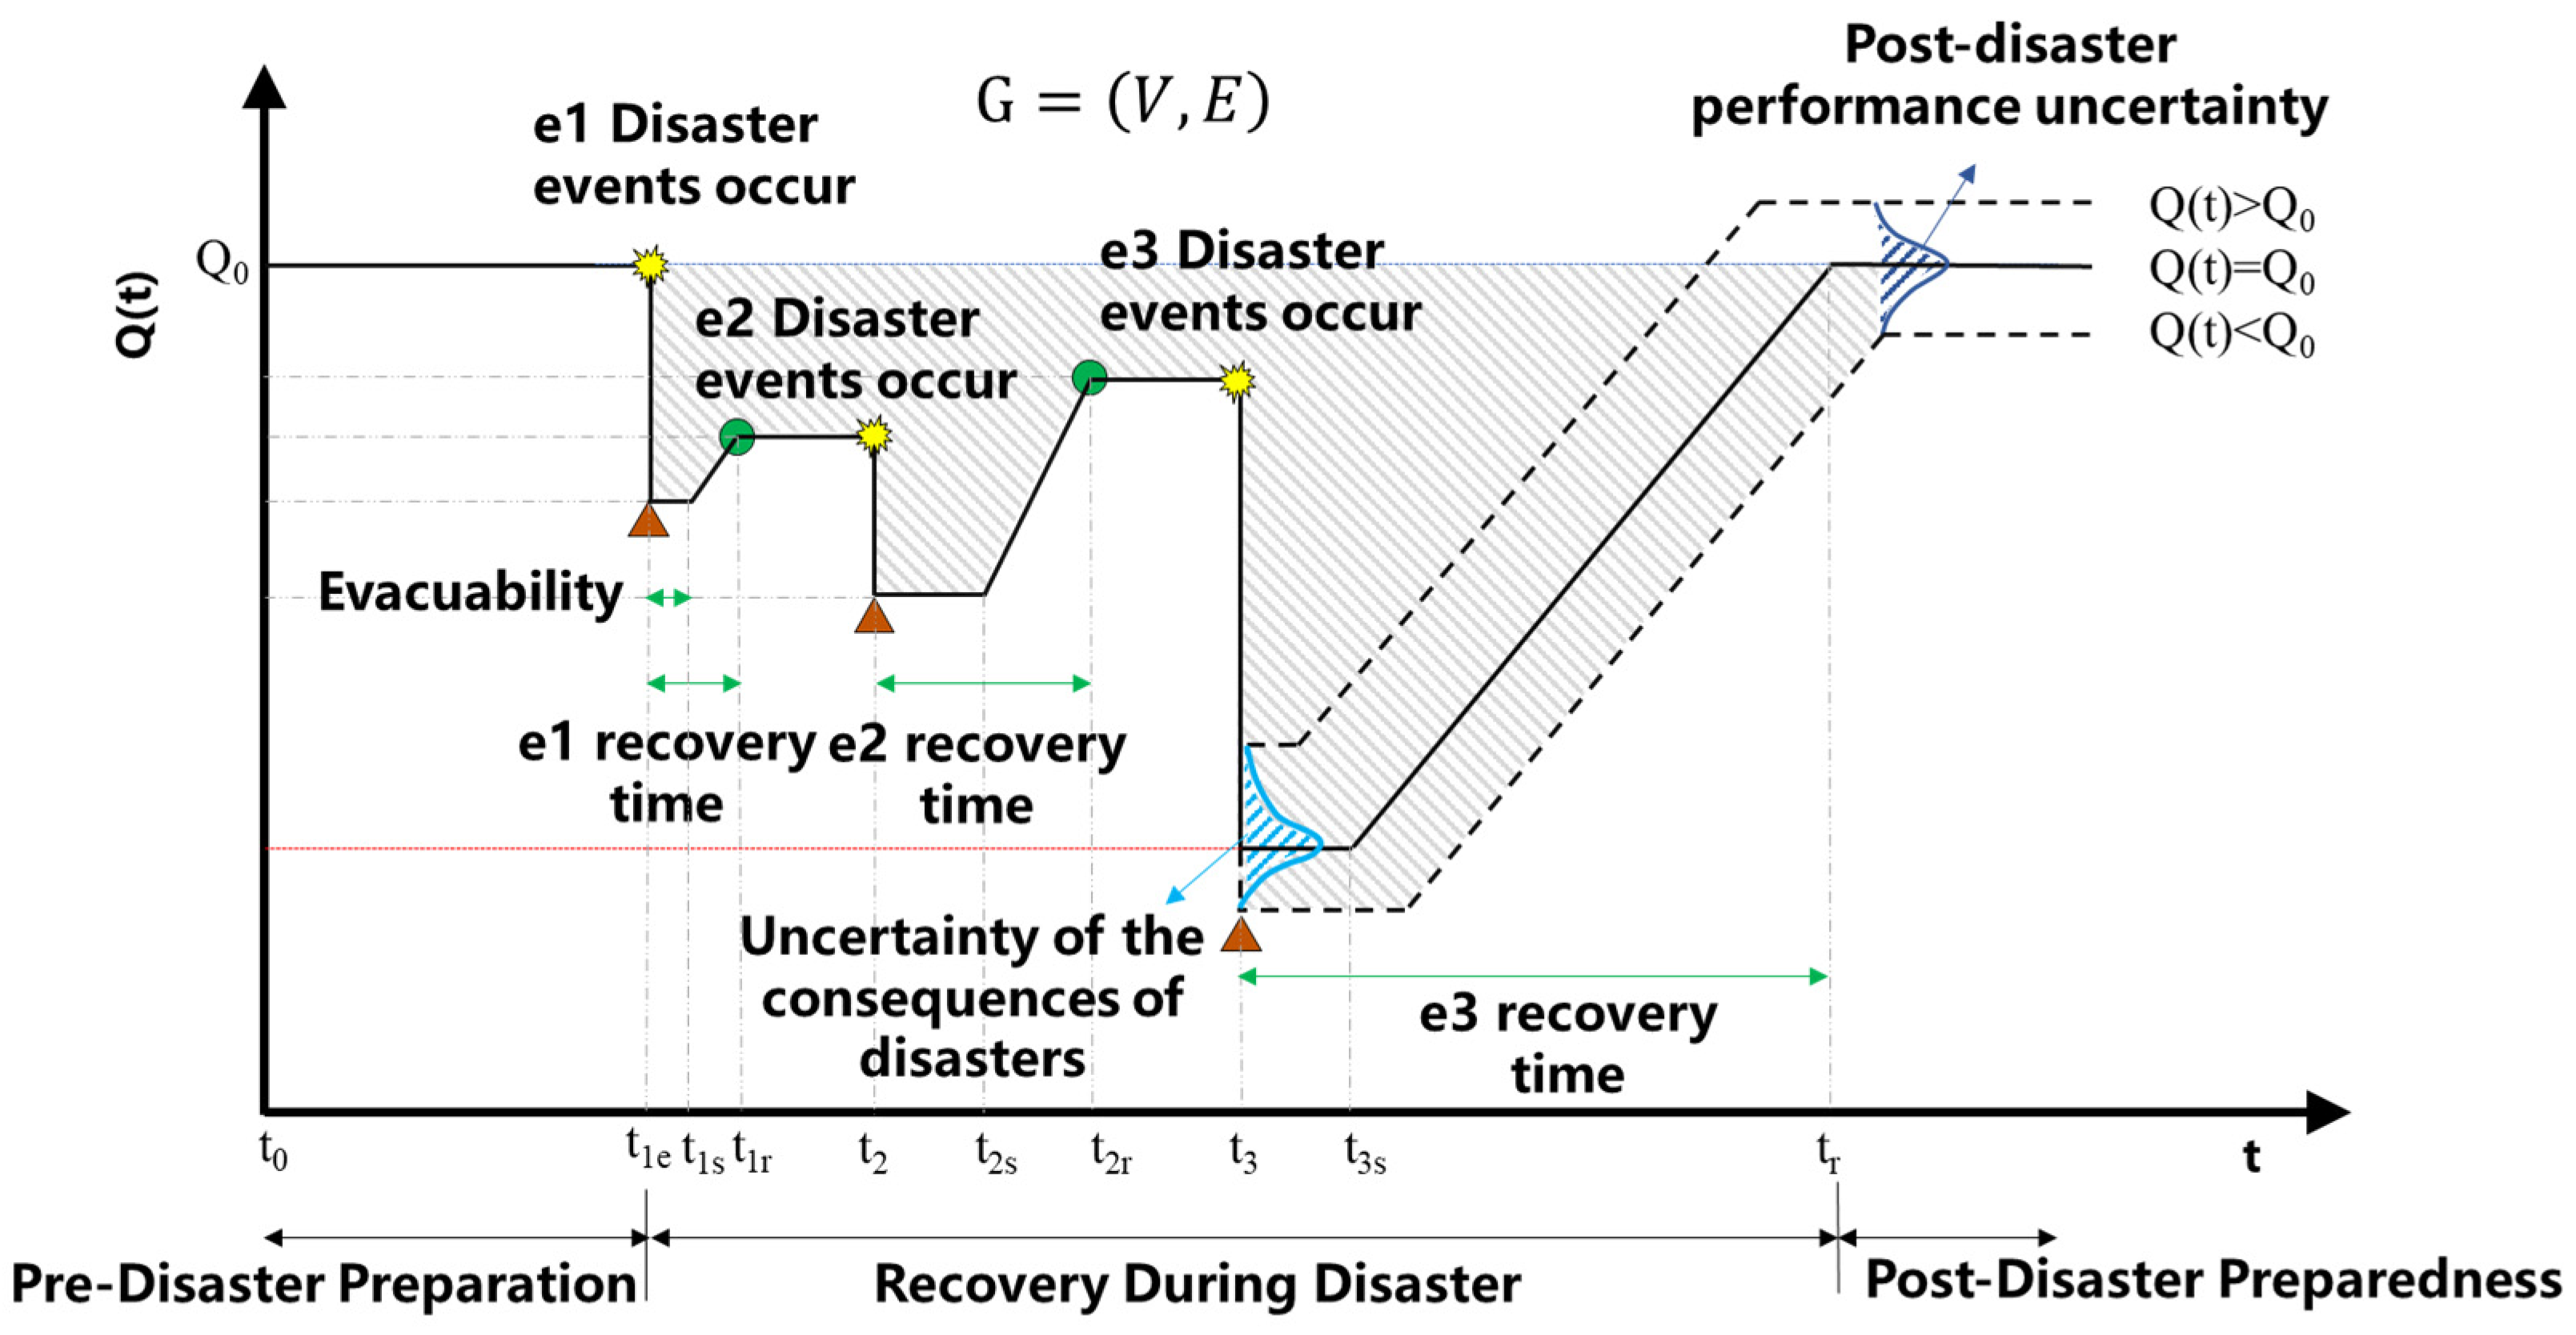
Frequent geological disasters within a short period can severely impact the performance of sparse road networks. Compared to road networks affected by a single disaster, the usability of the network significantly decreases. Networks affected by a single disaster often do not consider the scenario where multiple links are continuously damaged before complete recovery, and they assume that disaster events occur simultaneously. However, in extreme environments, sparse road networks emphasize the continuous implementation of emergency recovery strategies in response to ongoing disaster events. Once major infrastructure is significantly damaged, repairs may take months or longer. Thus, the performance of sparse road networks is in a state of dynamic change over a long period, and its resilience concept differs greatly from the conventional resilience triangle, as shown in Figure 6.
Building on the existing resilience triangle and referencing the definition by Li [20], we define the resilience of sparse road networks as the ability of the system to prepare for and adapt to disruptions (pre-disaster), provide and maintain acceptable levels of service or functionality (during disaster), and respond to interruptions and rapidly recover to meet travel demands while maintaining system balance (post-disaster).

3.3. Quantifying the Resilience of Sparse Road Networks

3.3.1. Average Travel Delay

Traffic flow indicators provide a more integrated analysis of the residual functionality of various network components following a geological disaster, reflecting the decrease in network performance due to travel delays on road segments [43,44].
Sparse road networks are typically bidirectional and consist of two lanes. Therefore, the topology of such networks can be simplified into an undirected graph model using graph theory, represented as G = V , E , where V = v 1 , v 1 , , v n denotes the set of network nodes, including bridges, tunnels, and intersections, and E = e 1 , e 2 , e n represents the set of all travel paths. The performance indicators of a sparse road network, AvTD, can be expressed using Equations (1) and (2):
A v T D ( t ) = i = 1 m ω i T i p r e T i ( t )
ω i = l i C i 0 i = 1 m l i C i 0
In the formula, m represents the total number of segments in the sparse road network. T i ( t ) denotes the travel time required for segment e i at time t during the recovery process. T i p r e indicates the normal travel time for segment e i . The weight ω i , which is a function of segment length l i and initial flow C i 0 , reflects the importance of segment e i within the network, with the condition i = 1 m ω i = 1 . According to the formula, when AvTD = 1, all components in the network have been repaired.
The C i 0 represents the baseline traffic volume of a road under normal operating conditions before a disaster event. It is derived from historical traffic data recorded at traffic flow survey stations prior to the disaster. The calculation formula is given in Equation (3).
C i 0 = k = 1 n F k n
where F k denotes the observed traffic flow on day k , and n represents the total number of observation days.

3.3.2. Network Accessibility

In transportation network analysis, connectivity, continuity, and density are commonly used indicators for evaluating network structure [45]. Connectivity is typically employed to assess whether a network maintains overall connectivity, and its calculation is provided in Equation (4).
J = i = 1 n m i N = 2 M N
where J represents the network connectivity index, N is the total number of nodes in the transportation network, m i denotes the number of edges connected to node i, and M is the total number of edges (road segments) in the network.
While connectivity effectively evaluates whether a road network remains connected, it does not quantify the accessibility of individual nodes or the recovery process following a disruption. To address this limitation, we propose an improved connectivity-based metric network accessibility, which incorporates node flow weights to provide a more precise depiction of network performance degradation under disaster impacts. Unlike conventional connectivity measures that only assess whether nodes are linked, network reachability also accounts for the importance of nodes (e.g., traffic flow), allowing for a more dynamic evaluation over different time steps.
In this study, the accessibility matrix is used to calculate the number of times a node can reach other nodes. The performance of a node at time t is measured by the ratio of reachable nodes at time t to the number of nodes reachable under normal conditions, as shown in Equation (5). Consequently, the overall performance of network nodes at time t is determined by Equation (6).
g i t = c i t C i     (   c i t = 0 , 1 , , C i )
G t = i V ω n i g i t
In the expression, g i t represents the accessibility performance of node i at time t. c i t denotes the number of nodes reachable from node i at time t, while C i indicates the number of nodes that are normally reachable from node i. G t signifies the overall performance of all nodes in the road network at time t. ω n i   represents the weight of node i in the network, which depends on the traffic flow.

3.4. Quantifying the Performance of Sparse Road Networks

The performance of a road network is represented by its accessibility and travel time. Equation (7) provides the performance representation of the road network at time t:
F t = α s G t + α f A T D ( t )
In this equation, F t denotes the performance of the road network at time t, α s represents the weight of the network’s structural performance, and α f denotes the weight of the network’s functional performance. In this study, it is assumed that the structural and functional aspects of the road network are equally important; therefore, both α s and α f are set to 0.5.
Existing research widely utilizes the resilience indicator proposed [46,47]. This indicator dynamically represents resilience as a function of time (Equation (8)), quantifying resilience as the ratio of recovery to loss:
Я F t z j = F t z j F t d z j F t 0 F t d z j
Here, Я F t z j represents the resilience of the system at time t after the occurrence of disaster z j . The numerator represents recovery up to time t, while the denominator represents the total loss due to the disruption. This resilience indicator reflects the ratio of the system’s recovery during the recovery period to the performance loss due to the disturbance.
As described in Section 3.2, the resilience of sparse road networks encompasses three aspects: the ability to continuously resist disasters, the ability to maintain basic structure and functionality before emergency rescue vehicles arrive, and the ability to recover from disasters. Therefore, the resilience indicator for sparse road networks should consider the overall performance of the system throughout the disaster event lifecycle. Thus, as illustrated in Figure 6, this study quantifies the resilience of sparse road networks as the average cumulative performance from the occurrence of the first disaster event until the system performance recovers to match the current traffic volume. A comprehensive resilience indicator for evaluating the entire disaster event lifecycle is proposed, with the resilience of the sparse road network at time t given by Equation (8):
ψ ( t ) = t e t F ( τ ) d τ F 0 ( t ) t t e , t e t t r ,
In this equation, F 0 ( t ) is the expected performance of the system at time t, and F 0 t = F ( t ) . The numerator represents the cumulative performance from the time of the first disaster event t e to time t, while the denominator represents the ideal performance the system is expected to achieve from t e to t.
Considering multiple successive disaster events, the modified resilience indicator is given by Equation (10):
ψ t z j = j = 1 J t ( e z j ) t ( z j 1 ) F t z j d t F t | z 1 t ( z J ) t ( e z 1 )
Here, F t z j denotes the system performance function after each disaster, where j = 1, 2, …, J, J represents the sequence of disaster events, and t denotes time. F t | z 1 is the initial expected performance of the system at time t, F t | z 1 = F 0 is the time of the first disaster event, and t ( z J ) is the time when the last disaster is fully repaired, during which the system’s performance gradually recovers. The numerator represents the cumulative performance from the time of the first disaster event t e to time t, while the denominator represents the ideal performance expected from t ( e z 1 ) to t ( z J ) .
The physical meaning of ψ ( t ) , as illustrated in Figure 6, can be intuitively represented as the ratio of the area S1 enclosed by the performance curve to the area S2 enclosed by the ideal (initial) performance line, which includes S1. A higher ψ ( t ) indicates better resilience of the road network.

3.5. Resilience Assessment of Sparse Road Networks

Based on the analysis in Figure 6, the unique attributes of resilience in sparse road networks include survivability, evacuability, recoverability, and adaptability. These attributes assess the resilience of sparse road networks under disturbances from four perspectives.

3.5.1. Survivability

Survivability is defined as the ability to withstand sudden disruptions while meeting original demands. It can be represented by the network’s residual performance, reflecting the system’s resistance to interference. Given the occurrence of multiple geological disaster events, the average residual performance of the network is used, which is the average of the residual performances for each disaster event.
A S u r v i v a b i l i t y = 1 j j = 1 J m i n ψ ( t z j )
where z j represents the j disaster event.

3.5.2. Evacuability

Rapid evacuation is a crucial component of disaster management and system resilience. Geological disaster events in sparse road networks can lead to severe congestion, disrupting emergency responses, transportation of supplies, and resident evacuation. Thus, evacuability refers to the ability to quickly clear congested vehicles using secondary roads and smaller networks, improving the response time of emergency management. It is measured by the total time taken for emergency response vehicles to reach blocked locations after each disaster event, indicating the system’s effectiveness in managing congestion and rapid response.
A E v a c u a b i l i t y = j = 1 J t ( s z j ) t ( d z j )
here, ψ t z j is the system performance after the j disaster, t ( s z j ) is the time when recovery starts, and t ( s z j ) is the time when recovery reaches an acceptable level. J is the total number of disaster events observed.

3.5.3. Recoverability

Recoverability, often discussed in transportation system resilience studies, is defined as the network’s ability to restore its functions promptly after a disruptive event. It measures the speed at which the system returns to its original or an acceptable functional level. To assess the recoverability of a sparse road network after multiple disasters, the average speed of performance recovery to an acceptable level is used, reflecting the effectiveness of post-disaster recovery. This metric considers the recovery time after each disaster event and provides a comprehensive evaluation of recovery speed.
A R e c o v e r a b i l i t y = 1 J j = 1 J ψ t ( r z j ) ψ t ( s z j ) t ( r z j ) t ( s z j )
where ψ t z j is the system performance after the j disaster, t ( s z j ) is the time when recovery starts, and t ( s z j ) is the time when recovery reaches an acceptable level. J is the total number of disaster events observed.

3.5.4. Adaptability

Adaptability reflects the system’s ability to respond to disruptions and adjust to post-disaster conditions through emergency planning and resource reallocation. It measures how well the transportation system continues to accommodate current traffic needs despite uncertainties.
For sparse road networks, the recovery of severely damaged infrastructure may take months, and a lack of detour routes means it may not fully return to pre-disaster conditions. Adaptability is assessed by the system’s ability to accommodate current traffic demands at acceptable service levels.
A A d a p t a b i l i t y = ψ t r ψ 0 × Q t Q 0
where ψ t r denotes the performance of the system after recovery, F 0 denotes the original performance of the system before the occurrence of the disaster event, and ψ t r ψ 0 reflects the degree of system recovery. Q t denotes the current hourly traffic volume, and Q 0 denotes the hourly traffic volume of the roadway design, and the unit is vehicles/hour. ψ t ψ 0 reflects the ability of the system to adapt to the current traffic demand. The closer the adaptability index A A d a p t a b i l i t y is to 1, it indicates that the recovered system performance better adapts to the current traffic flow demand.

3.6. Repair Time Estimation Model

The repair time for critical components in sparse road networks, such as road segments, bridges, and tunnels, is influenced by both disaster type and disaster scale. To quantify the repair time for different infrastructure components, previous studies have employed triangular fuzzy numbers [48] or uniform distribution models [49] to estimate the expected recovery time of damaged links. Following the existing research [20], this study assumes that the repair time of a damaged link (or node) follows an exponential distribution, considering that repair time is positively correlated with disaster scale, whereas disaster scale is negatively correlated with disaster probability. The corresponding calculation formula is presented in Equation (15).
P d j l = c = 1 π j l e c π j l
In the formula, d j l   denotes repair time required (in days) for a road link to recover from damage caused by the jth type of disaster event. π j l denotes the average repair time of a road segment affected by the jth type of disaster event, calculated based on historical data. c is a positive random variable.
Using Equation (13), the recovery time of different components under disaster events is estimated and denoted as S j , l T . If no disaster event occurs on road segment l   on day T, then S j , l T = 0. Otherwise, S j , l T equals the required recovery time for the disaster event occurring on road segment l   on day T.

4. Case Study

4.1. Study Area

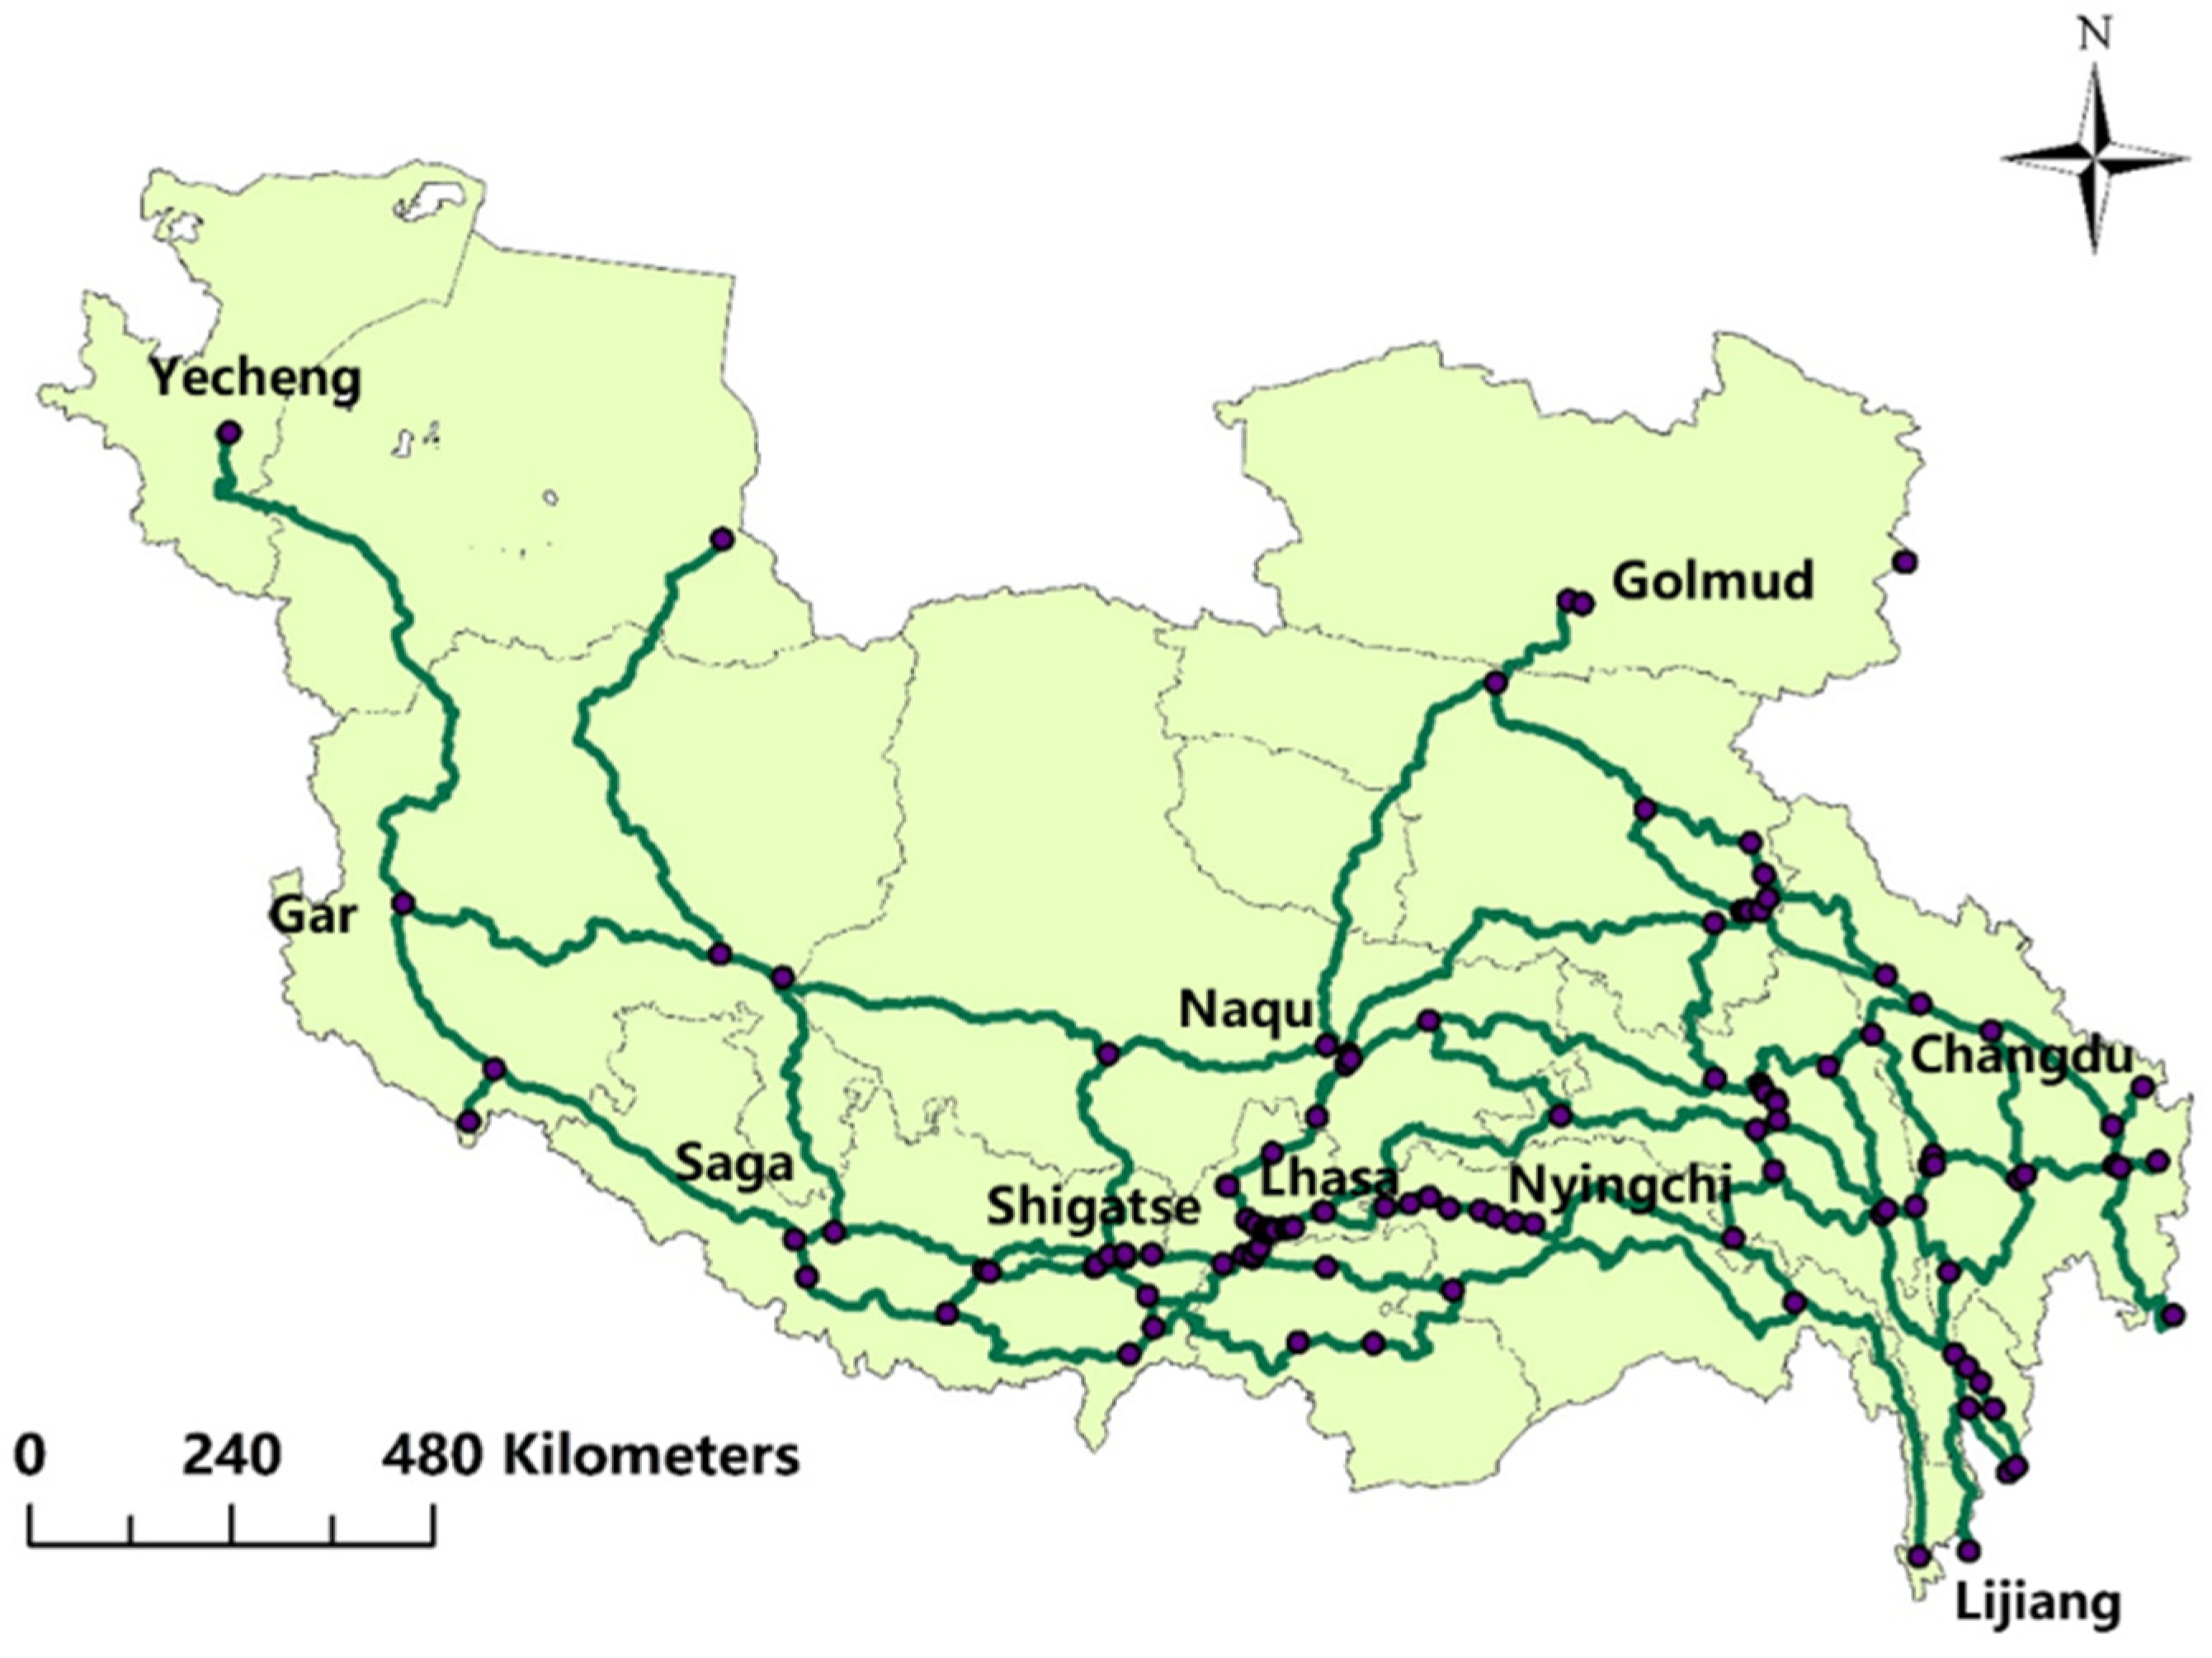
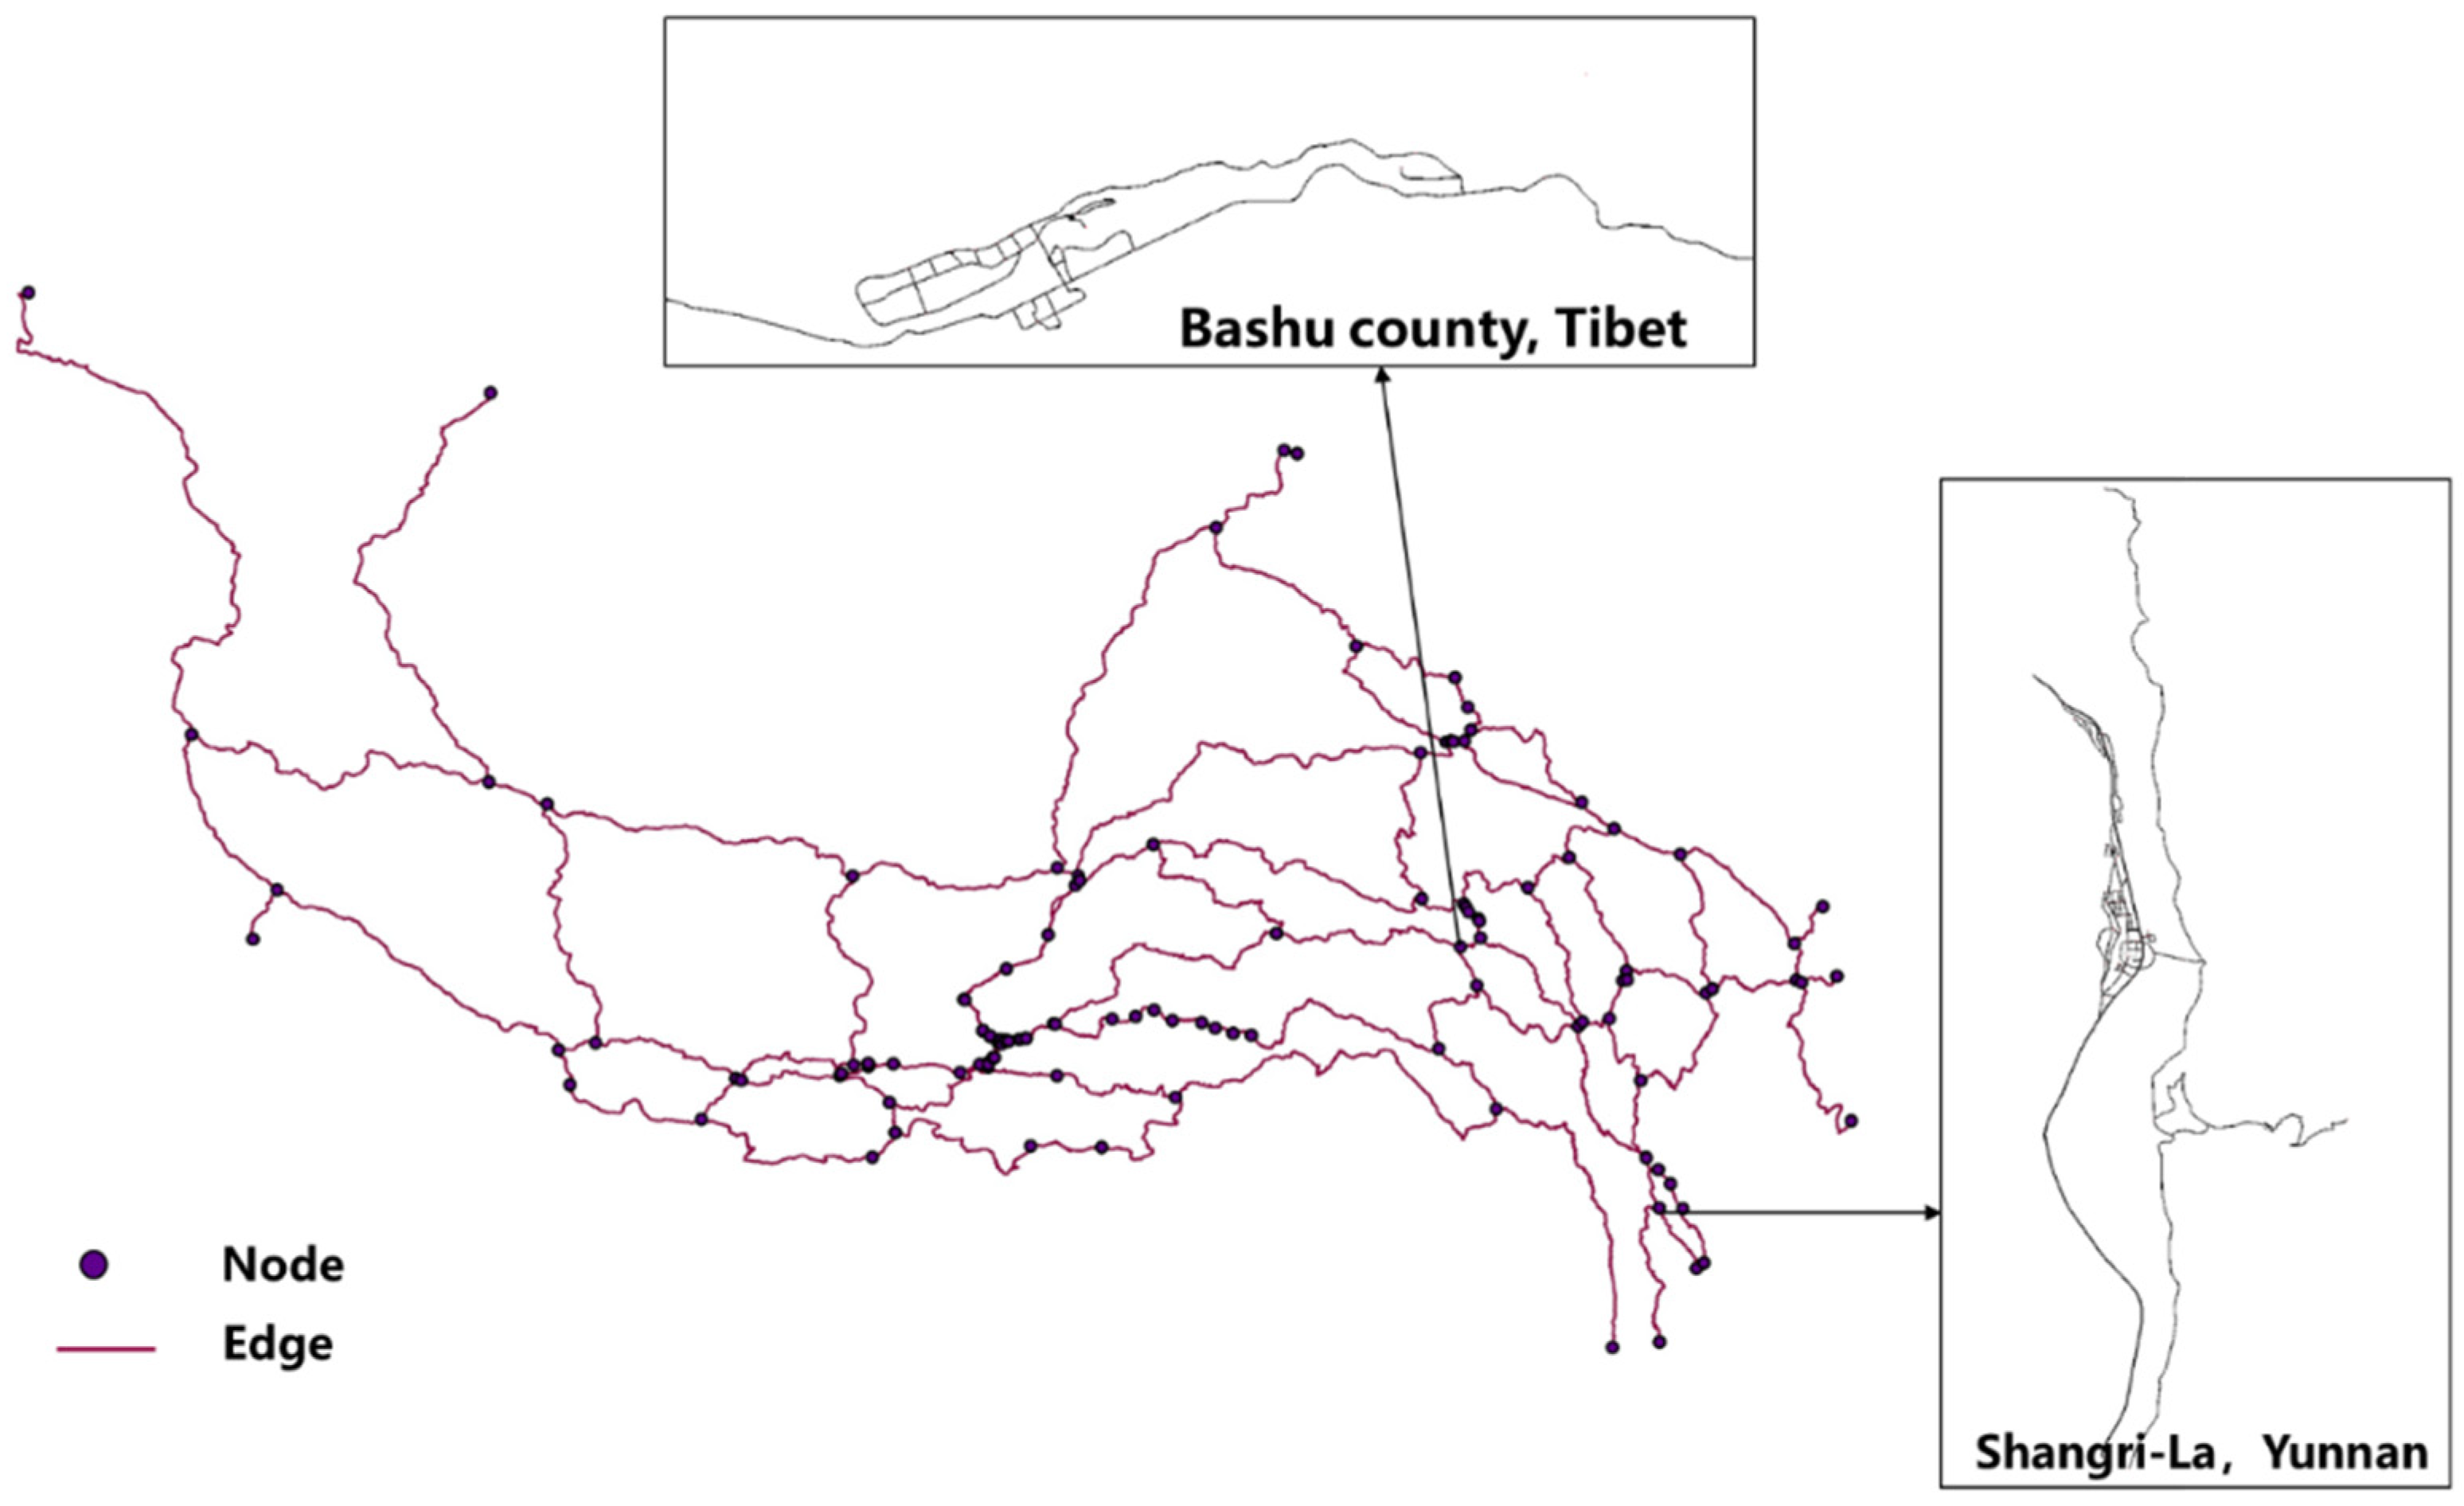
We applied the proposed framework to the road network located in Tibet in China (Figure 7). The Tibet Autonomous Region is situated in the southwestern plateau of China, characterized by high altitudes, vast territory, and sparse population. Currently, Tibet has developed a road network primarily composed of four national highways: the Sichuan–Tibet, Qinghai–Tibet, Xinjiang–Tibet, and Yunnan–Tibet highways. This network, however, remains relatively sparse and consists mainly of national, provincial, and county roads. Due to geographical and climatic conditions, the road network in Tibet features low grades, low density, long segments, few connecting nodes, weak disaster resilience, and significantly different traffic operation characteristics compared to other regions. Geological hazards, adverse weather, sudden events, and their coupling with extreme environments severely affect traffic safety. For example, on 18 August 2023, continuous rainfall triggered a flash flood and mudslide on a section of the Sichuan–Tibet Highway in Bomi County, resulting in over 500 vehicles and 1500 people being stranded. Emergency response efforts lasted 11 h before single-lane traffic could be resumed. Therefore, we selected the road network of Tibet, specifically starting from Ganzi in Sichuan, Lijiang in Yunnan, Golmud in Qinghai, and Kashgar in Xinjiang, with Lhasa as the endpoint, as the target area for our case study.

4.2. Data Preparation

4.2.1. Road Network Topology Data

This study utilizes OpenStreetMap (OSM) data to establish a topological model of the road network in the research area. To simplify the modeling and analysis of the sparse road network, highways, national roads, provincial roads, and county roads were selected (Figure 7). The modeling elements include geographic information of road segments and nodes, as well as static traffic data of the road segments.

4.2.2. Traffic Flow Data

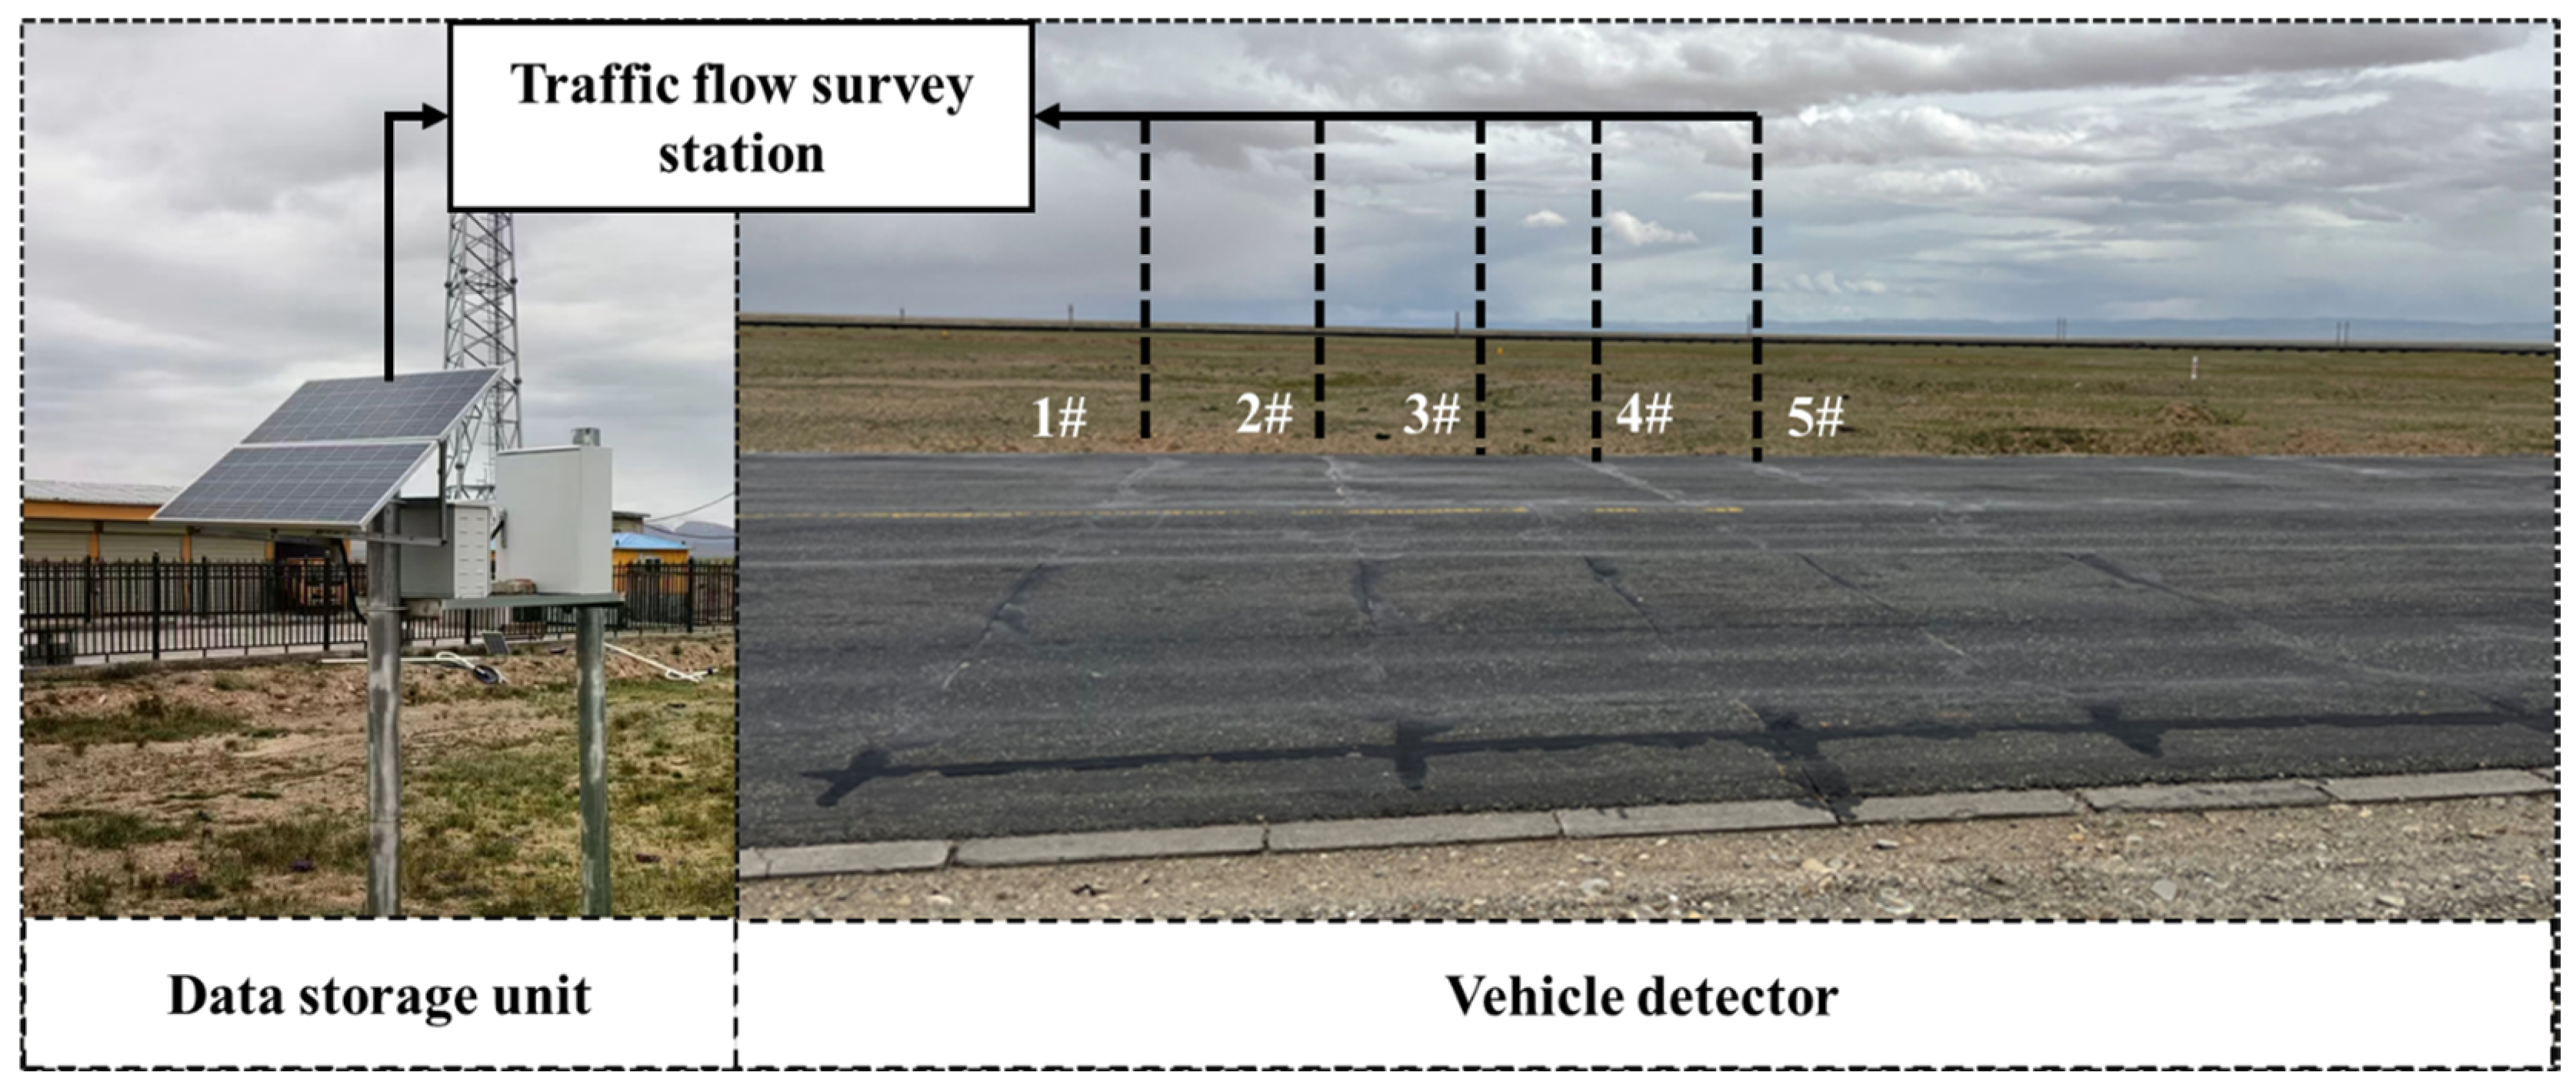
The initial traffic flow data for the case study area were obtained from the Tibet Autonomous Region Department of Transportation, based on daily average traffic volume statistics collected at various traffic flow survey stations from January 2021 to 2023. The dataset includes station name, date, vehicle types (passenger cars, trucks, tractors, motorcycles), and vehicle count. A sample of the statistical data is presented in Table 2, and the data collection process at the survey stations is illustrated in Figure 8. The initial traffic volume for each road segment was calculated based on these statistical records.

4.2.3. Travel Time Data

Travel time data consist of two components: baseline travel time under normal conditions and travel time under disaster impact.
To estimate the baseline travel time under normal conditions, this study utilizes Gaode Map’s daytime route planning data. Gaode Map’s route planning function integrates historical traffic data, real-time traffic conditions, and predictive models, incorporating floating vehicle trajectories, large-scale user trajectory data (e.g., GPS and mobile signaling), traffic monitoring equipment (e.g., cameras, geomagnetic sensors, and radar detectors), and road network topology. This integration provides optimal route recommendations and estimated travel times. Consequently, in the absence of significant traffic disruptions, Gaode Map’s planned travel times can approximate actual conditions. To mitigate short-term traffic fluctuations, this study collects data during non-peak weekday hours using the Gaode Map API to obtain recommended routes and corresponding travel times between designated origin-destination pairs. Data are collected continuously for at least seven days, and the average value is computed to reduce single-query bias.
For post-disaster travel time estimation, this study employs the Simulation of Urban MObility (SUMO) traffic simulation software (version 1.19.0) to reconstruct travel times across affected road network segments. Based on the constructed road network topology, disaster-induced conditions such as road closures, reduced traffic capacity, and node disruptions are simulated. The maximum traffic capacity of affected road segments is adjusted accordingly. SUMO’s built-in tripinfo.xml and edge-based statistics modules are used to record vehicle travel times at different time points. The final simulation results are employed to compute the average travel delay caused by the disaster.

4.2.4. Disaster Event Data

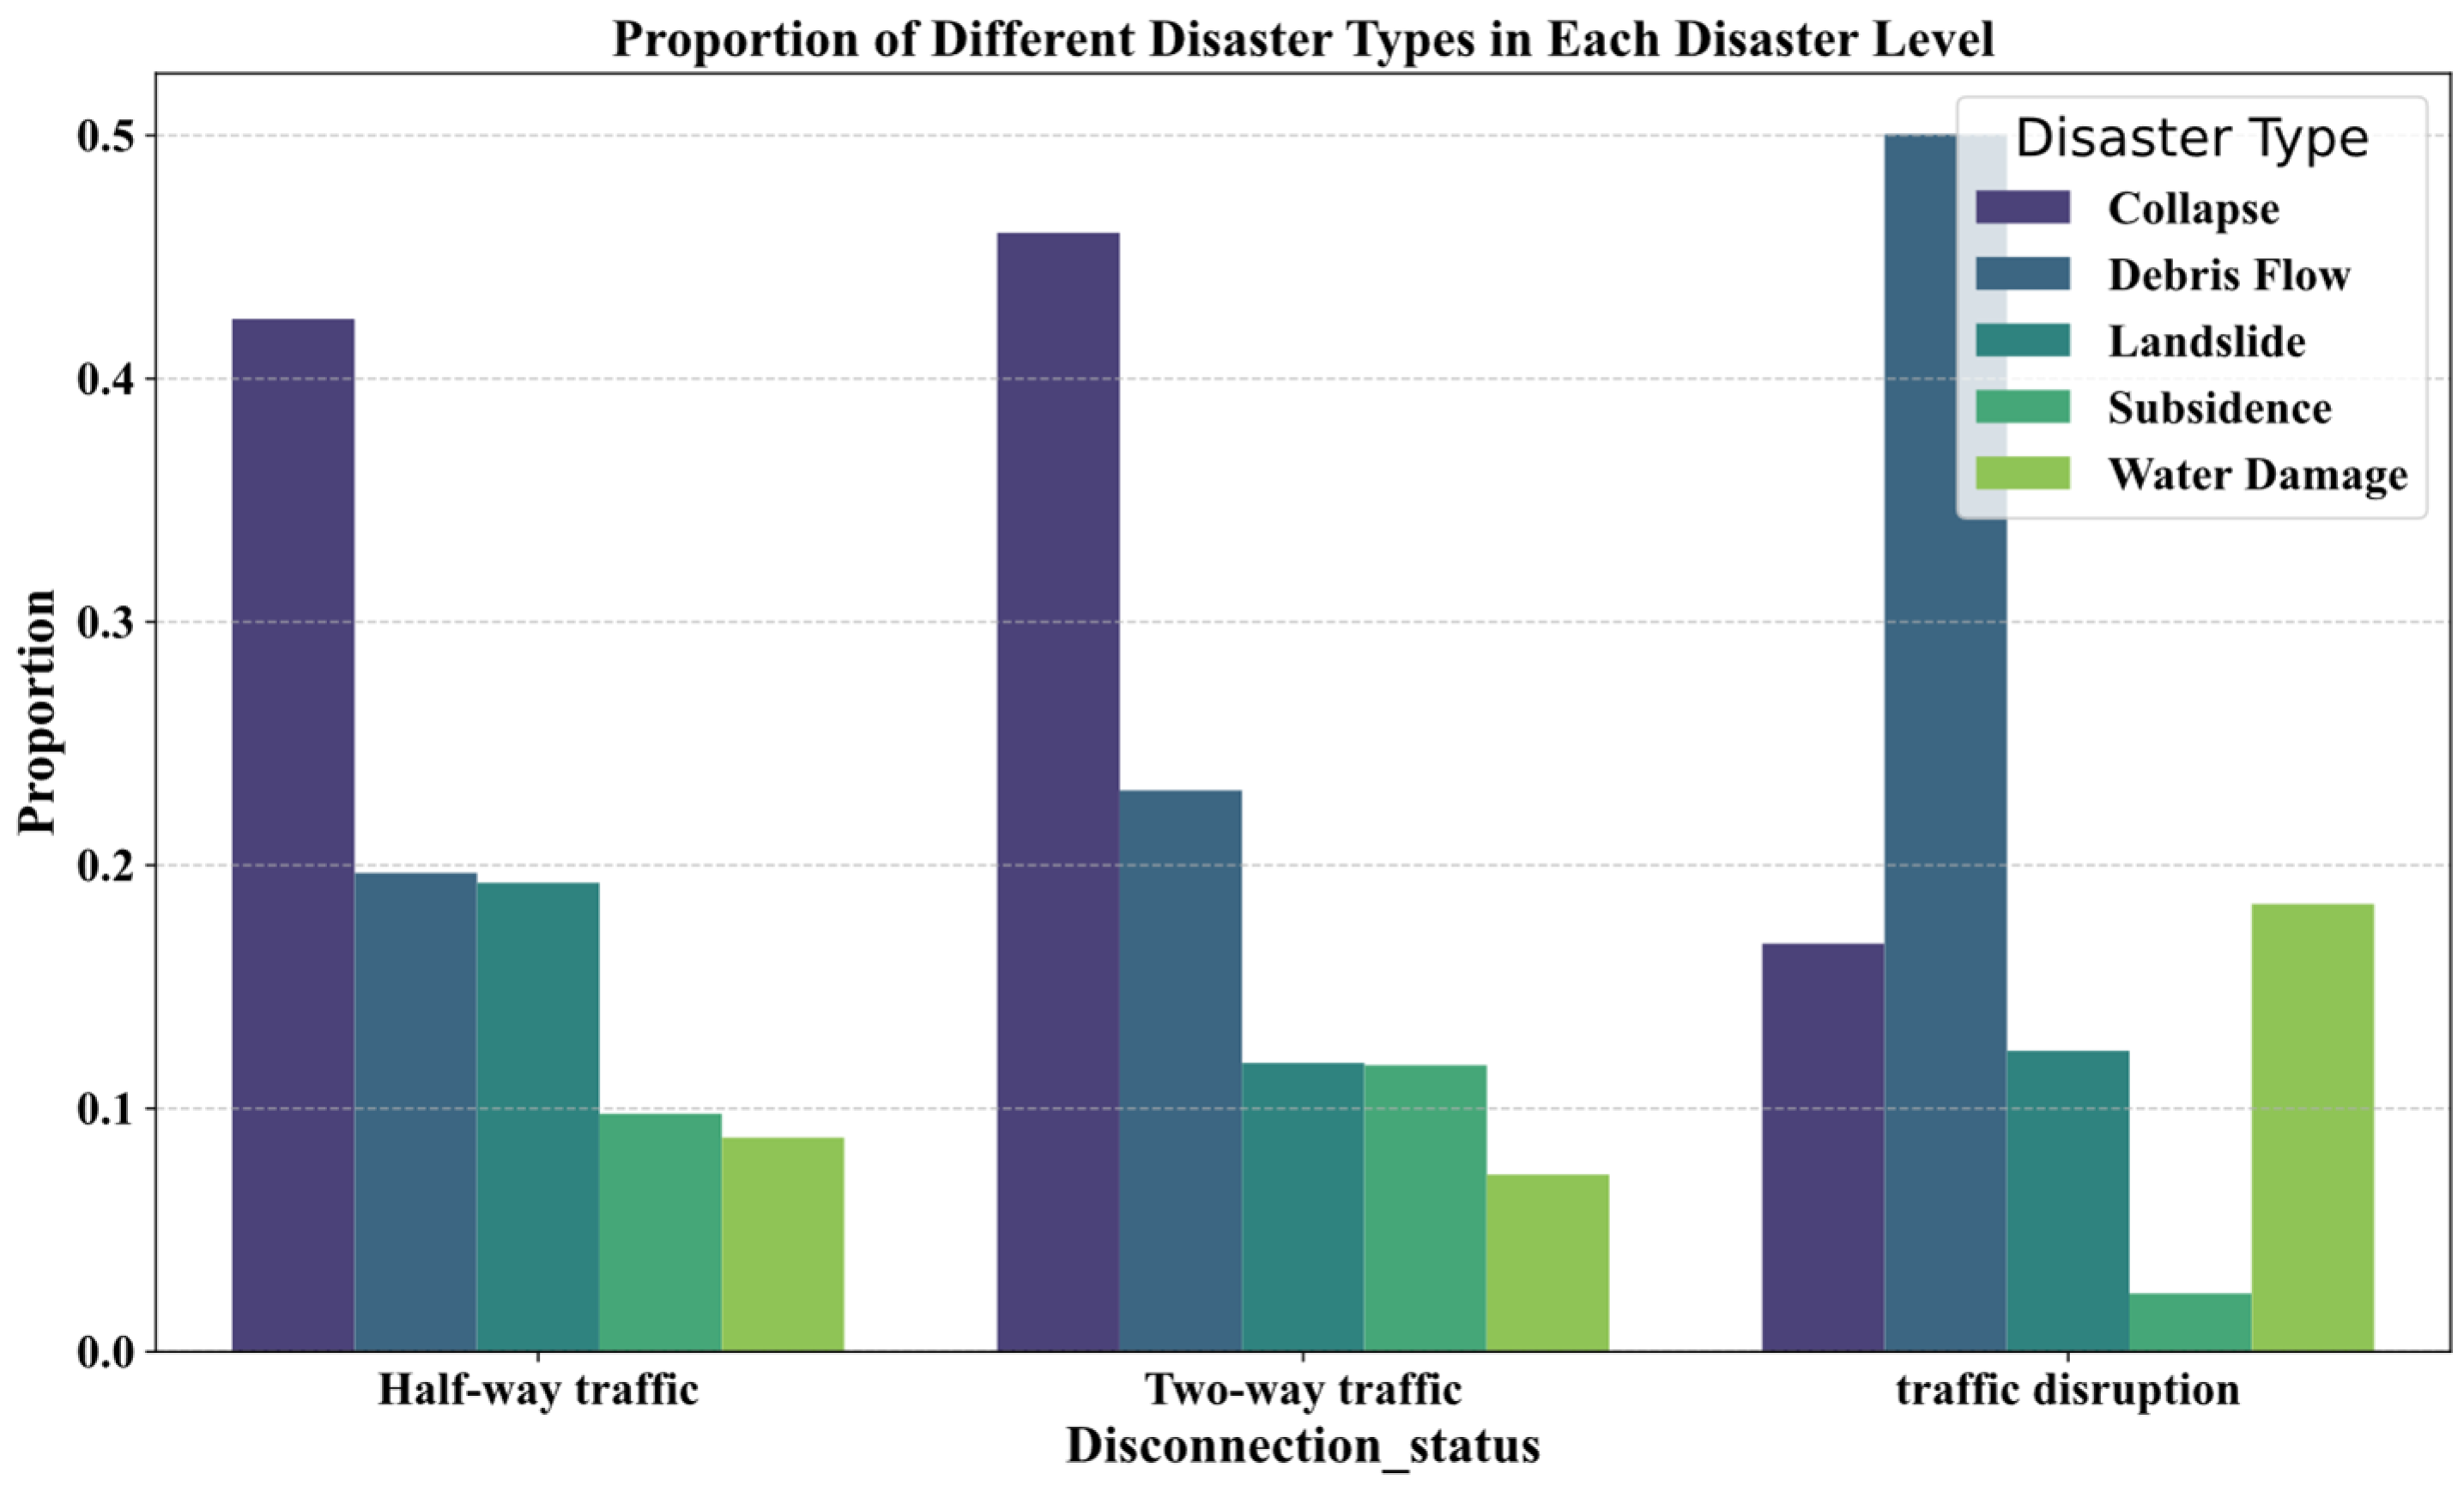
Field investigations were conducted to collected geological disaster event data from a specific route into Tibet. The dataset includes information on the occurrence time, location, disaster type, scale, and clearance duration. Based on the 2021–2023 geological disaster survey data, the distribution of geological disaster events in Tibet is shown in Figure 9, Figure 10, Figure 11 and Figure 12. The primary disaster types include rockfalls, landslides, debris flows, subsidence, and water damage.
It is important to clarify that road water damage refers to the destruction of road infrastructure caused by heavy rainfall, flooding, scouring, impact forces, seepage, and human activities within a short period. Based on the affected locations, road water damage can be classified into four categories: riverbank roadbed erosion, bridge pier scouring, bridge foundation erosion, and culvert blockage. In this study, water damage specifically refers to riverbank roadbed erosion, which primarily manifests as embankment collapse and slope protection failure, typically classified as shallow surface damage with a relatively short repair period.
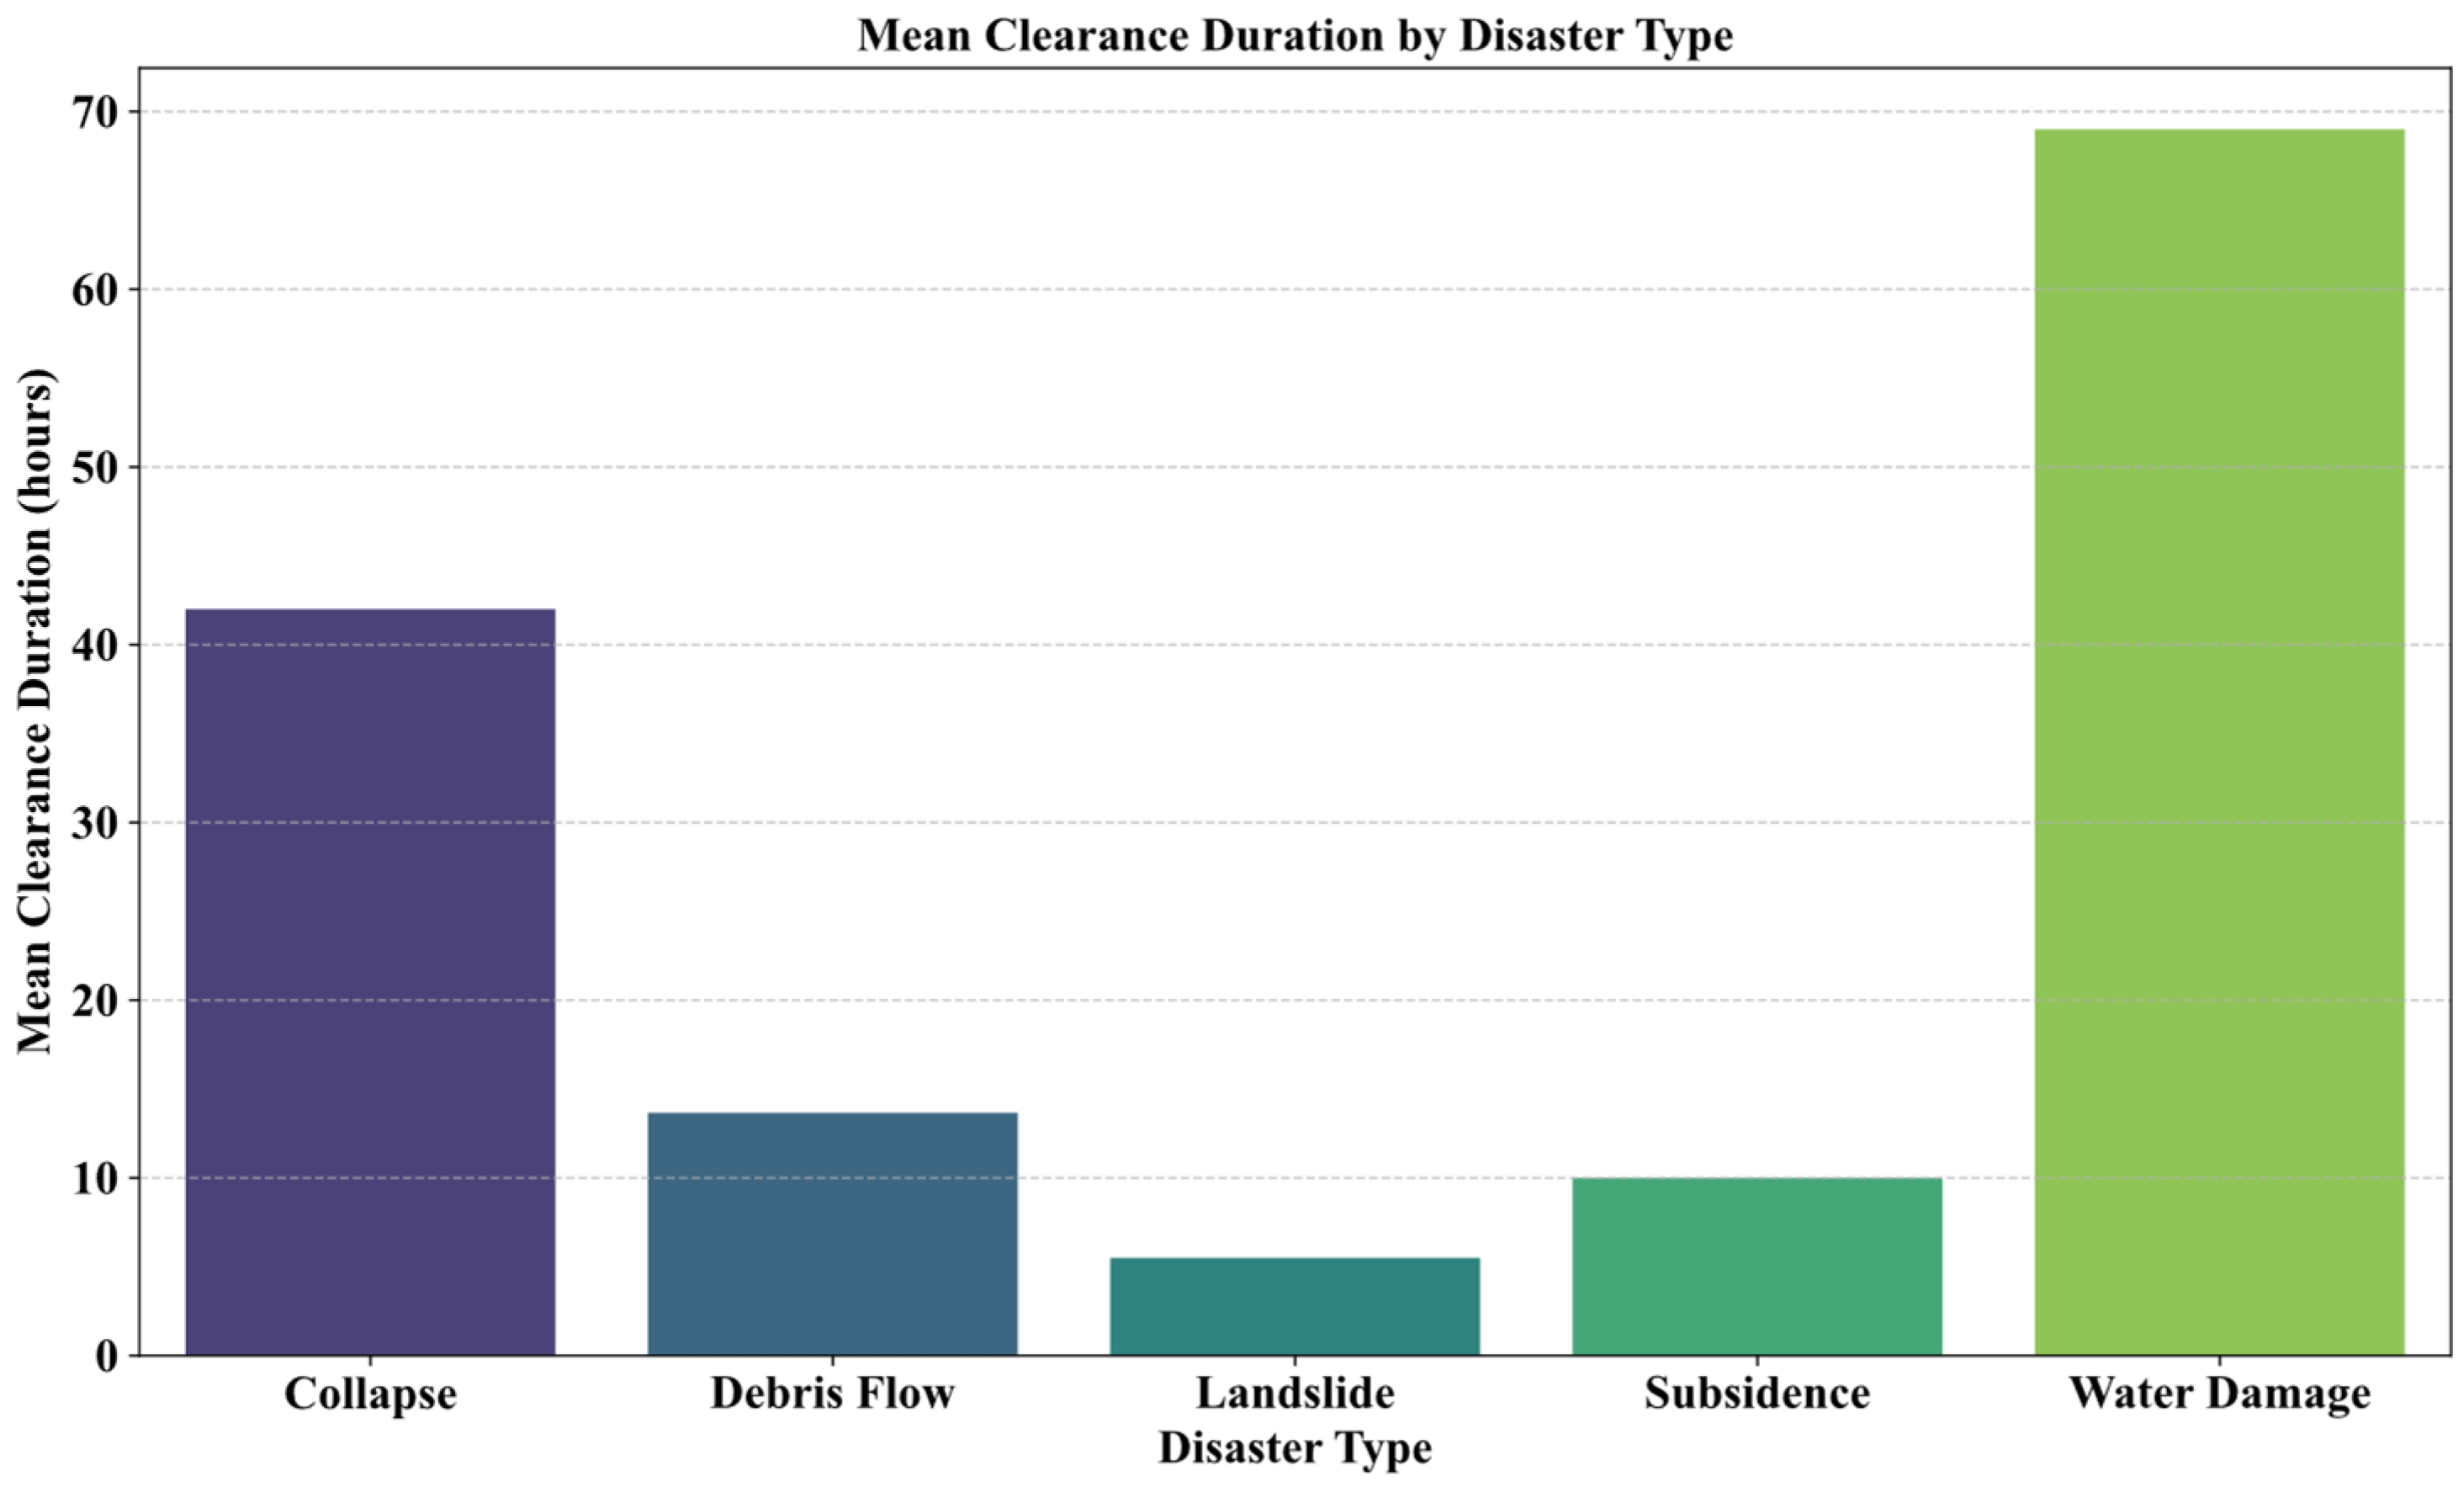
Further analysis of Figure 9 showed that collapses and debris flows are the most common types of geological disasters, accounting for 48.61% and 21.13%, respectively. Landslides occur at a moderate frequency, representing 13.82%. Subsidence and water damage events are less frequent, accounting for 8.91% and 7.53%, respectively. From the perspective of disaster severity (Figure 10) and its impact on road operations (Figure 11), debris flows are most likely to cause complete road closure, accounting for 50% of such events, followed by water damage at approximately 20%, with water damage being the most severe type of geological disaster. Collapses have the least severity and are more likely to result in partial road closures, as the impact is mainly concentrated on one side of the road. Landslides tend to cause low-severity events, with a higher proportion of two-way traffic. Subsidence events are relatively evenly distributed across different road closure statuses, rarely causing complete closures, and more often resulting in partial closures or maintaining two-way traffic. Regarding the average debris clearance time caused by disasters (Figure 12), water damage has the longest clearance time, up to 70 h, followed by collapses, due to the extensive material removal and repair of damaged roadbeds and structures, requiring heavy machinery and high safety measures. Debris flows and landslides have shorter clearance times because the material is relatively loose, necessitating a rapid response.

4.2.5. Repair Time Data

The repair time parameters in this study are based on geological disaster recovery records from 2021 to 2023, provided by the Tibet Autonomous Region Department of Natural Resources for the Qinghai–Tibet Highway (G109). The average clearance time for different types of disasters is statistically analyzed and presented in Table 3. Furthermore, the repair time for each component is calculated using Equation (15).
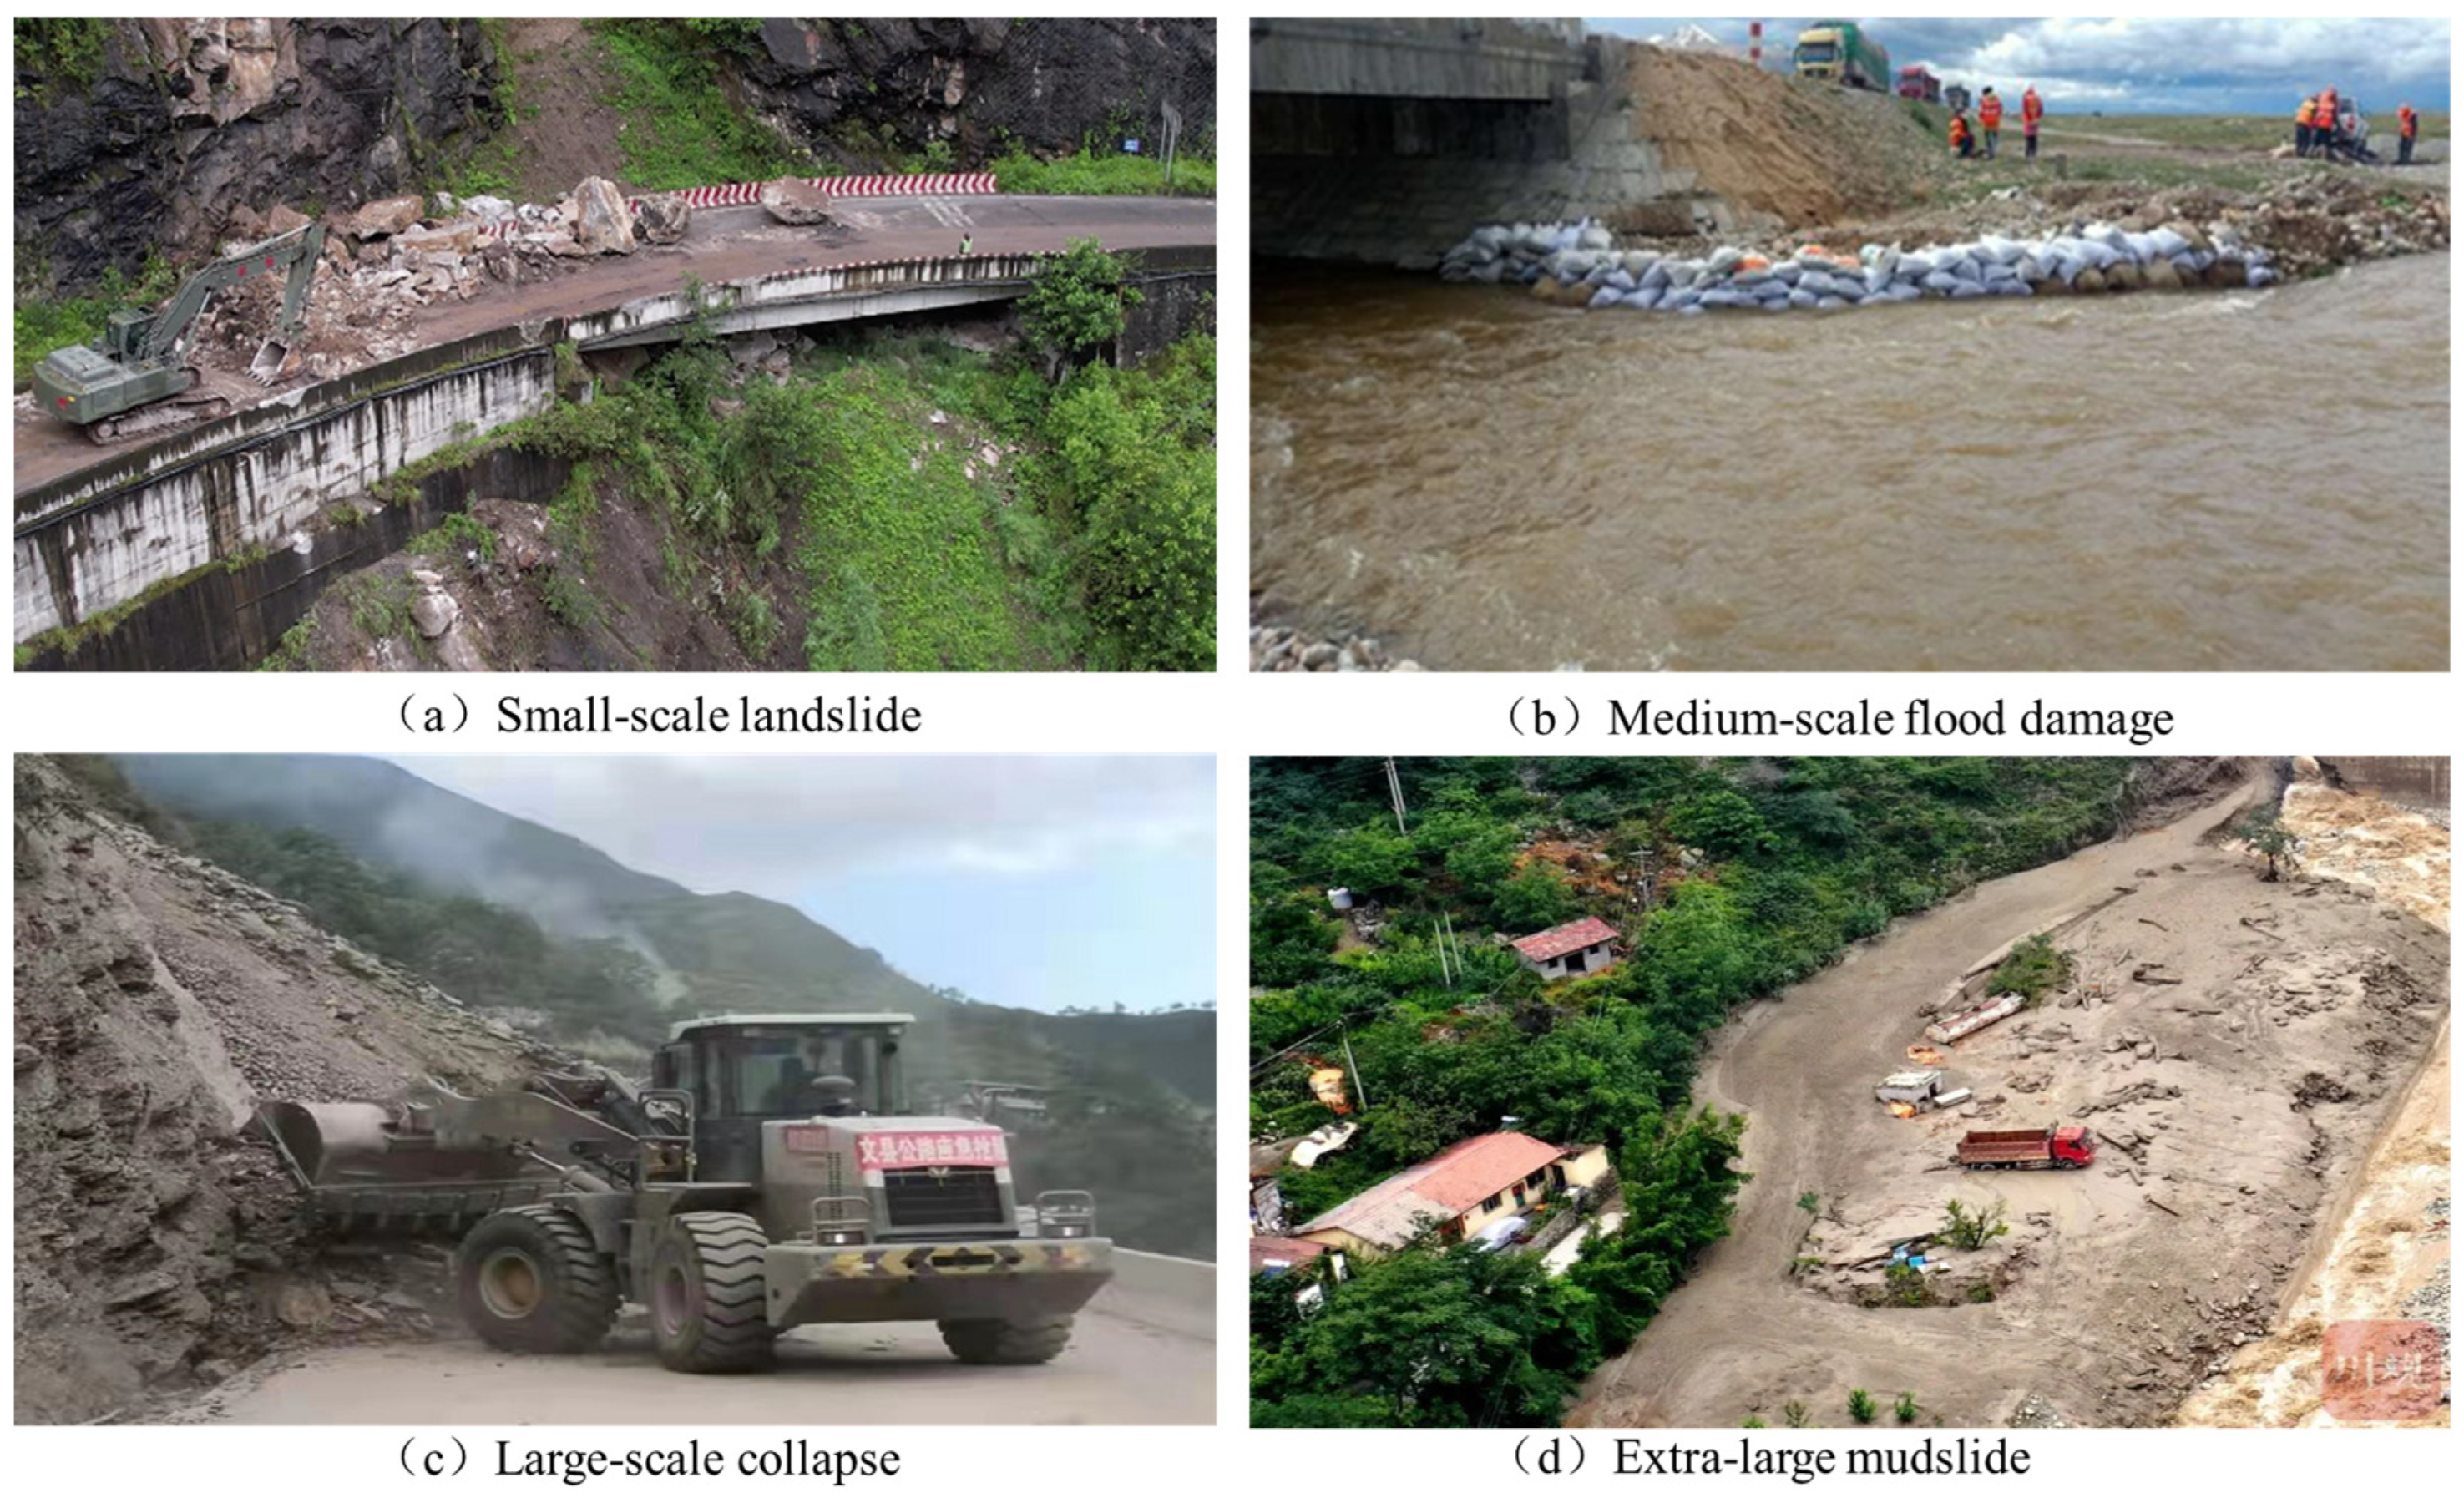
It is important to note that, according to the Geological Hazard Risk Assessment Specification (GB/T 40112-2021) [50], geological disasters are classified into four categories: small-scale, medium-scale, large-scale, and extra-large-scale disasters. Examples of these four types of disaster events in Tibet are shown in Figure 13.

4.3. Simulation Process

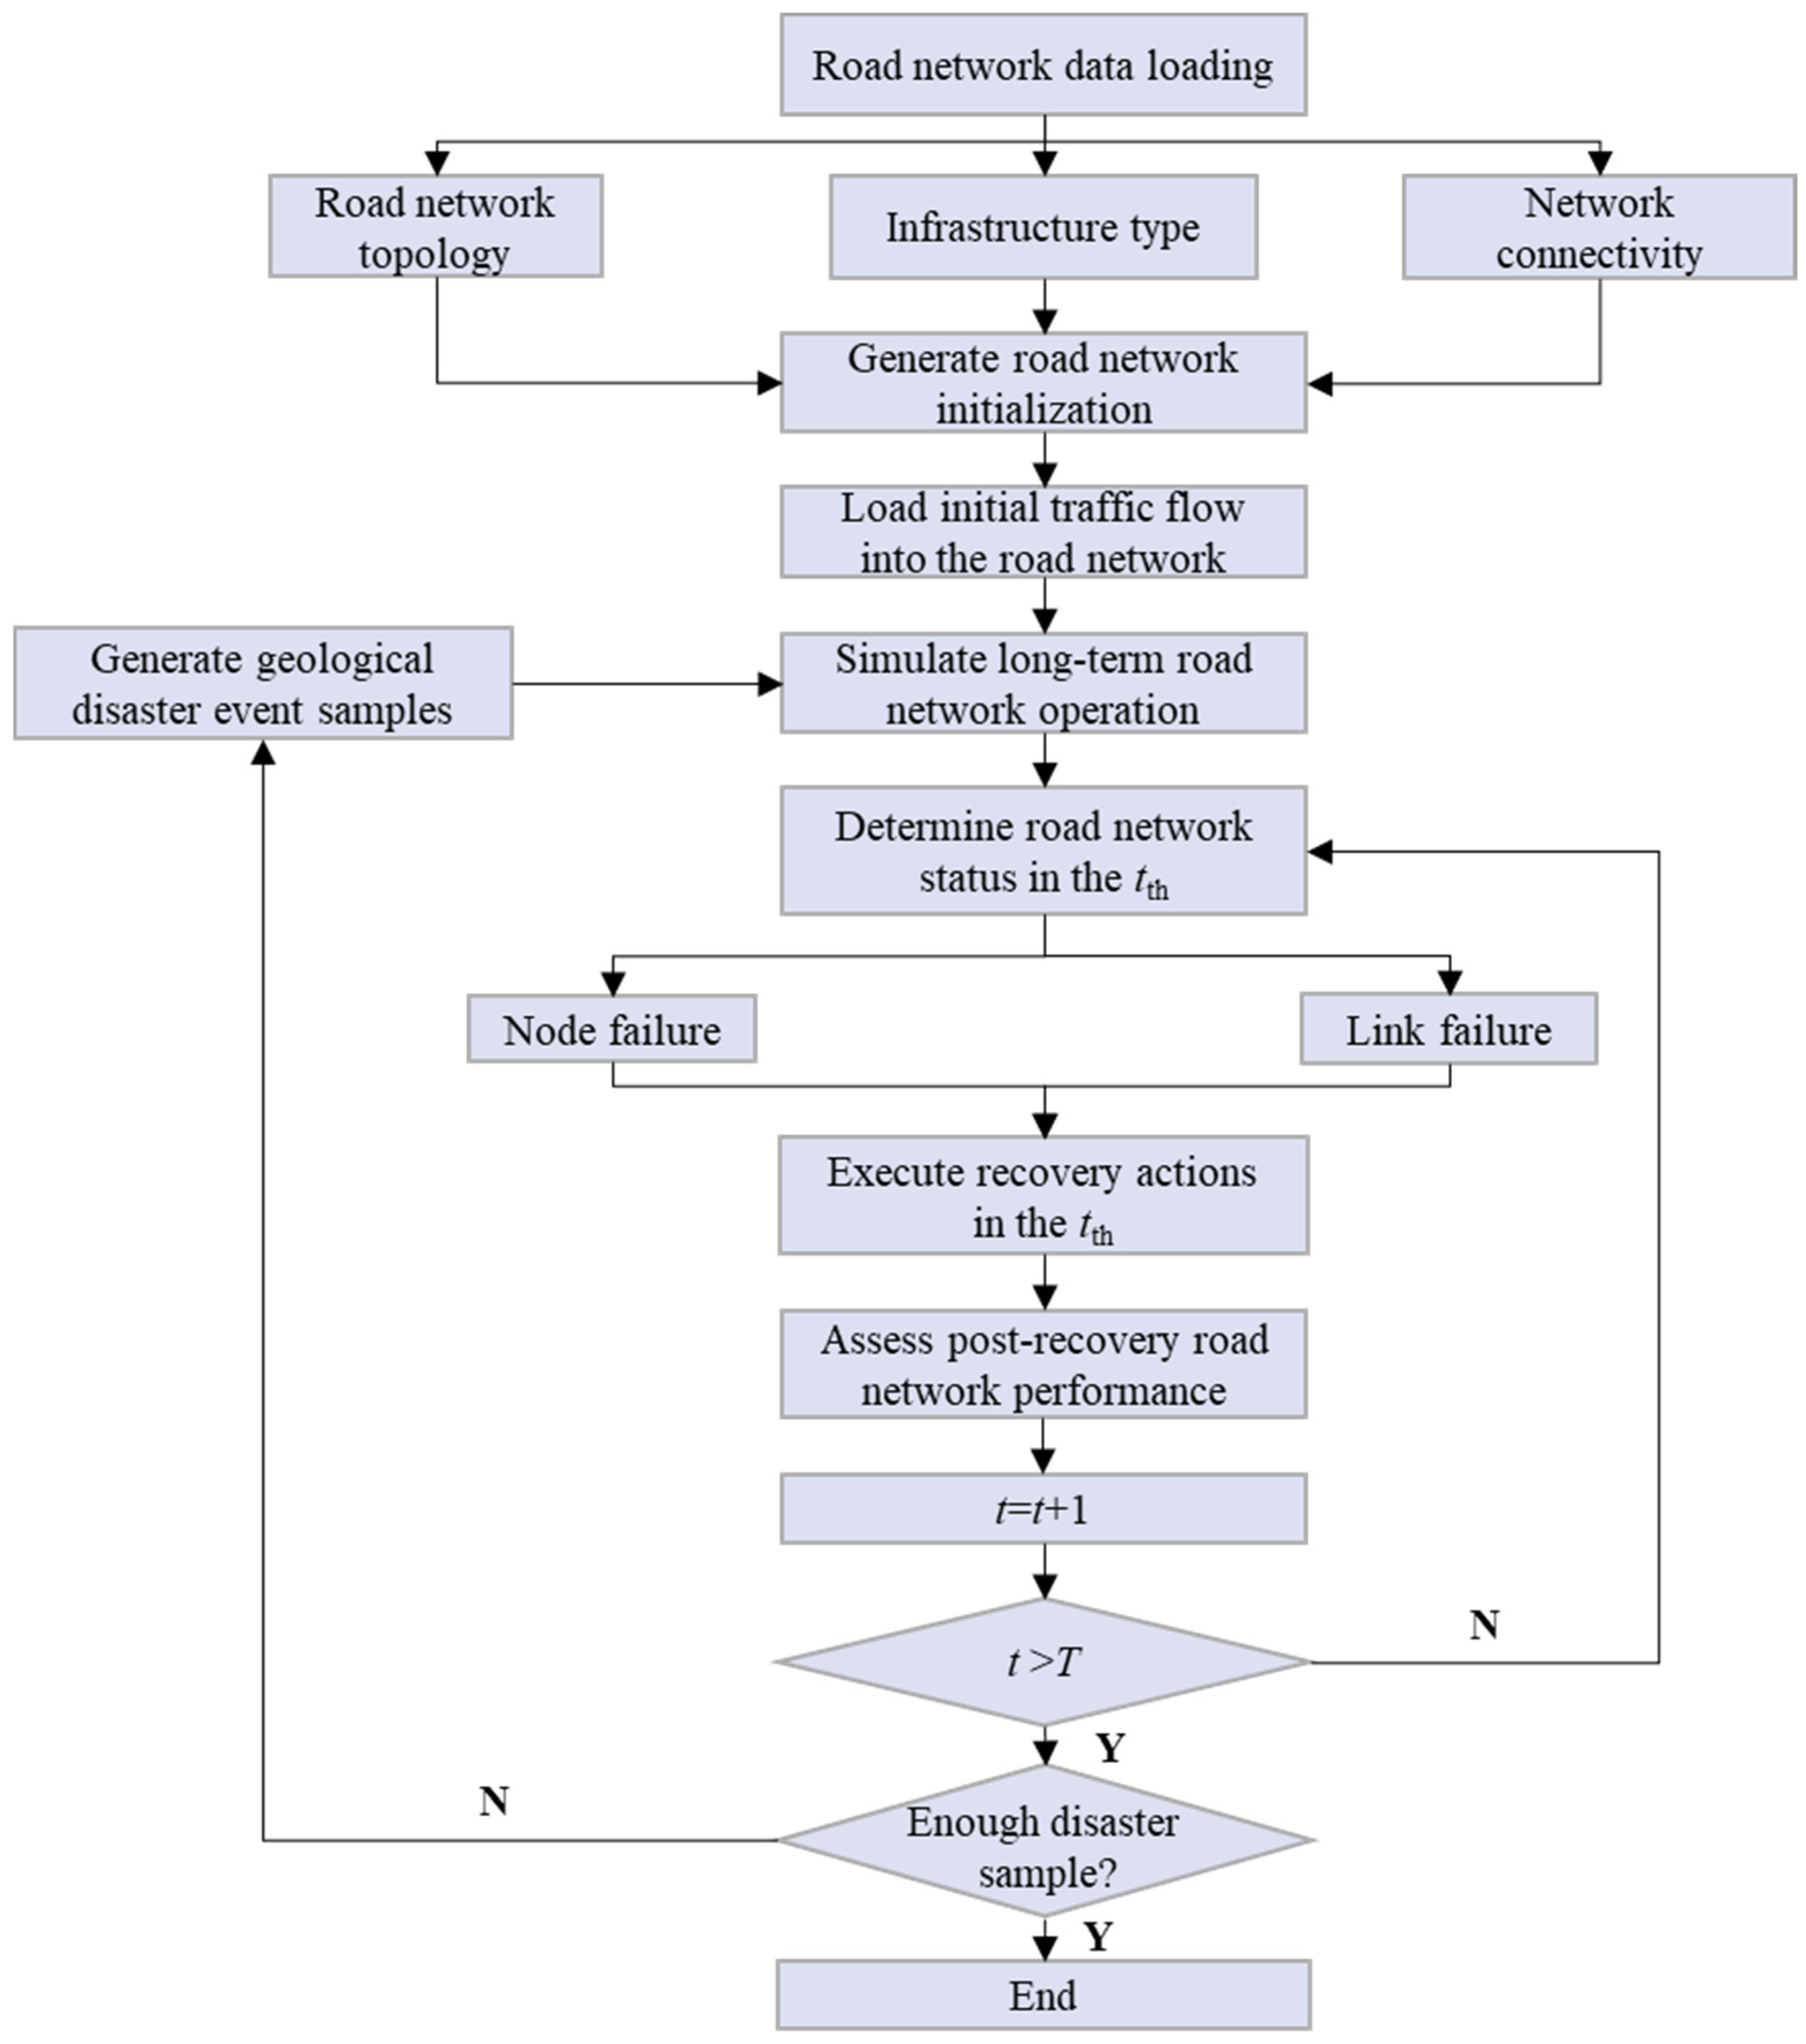
To evaluate the performance of the road network after a disaster, the SUMO 1.19.0 software is used to simulate and generate post-disaster travel times for each road segment, while the ArcGIS 10.8.2 software processes the road network data. The main simulation program is implemented using Python 3.8.8. The workflow for the dynamic resilience assessment of the road network under disaster conditions is illustrated in Figure 14.
Step 1: Road network initialization. Construct a two-layer topological structure for the road network.
Step 2: Loading initial traffic data. Obtain daily average traffic volumes for each road segment by analyzing traffic flow statistics from Tibet’s transportation data sources.
Step 3: Loading disaster event samples. Simulate five types of geohazard events, including rockfalls, landslides, debris flows, collapses, and water damage.
Step 4: Road network performance calculation at time t. Compute road segment performance using Equations (1)–(9).
Step 5: Road network recovery during t. Estimate the repair time required for all damaged infrastructure components based on Table 3, reflecting the clearance process under geohazard conditions.
Step 6: Post-recovery road network performance calculation. Recalculate the network performance function after repairs.
Step 7: Simulation termination condition. If the simulation period T has not yet been exceeded, proceed to the next disaster event cycle; otherwise, terminate the simulation.
For the simulation scenario in this study, the relevant parameters and assumptions are set as follows:
With reference to the secondary national highway design standard in Chinese Highway Engineering Technical Standard (JTGB01-2014) [51], the free-flow speed of all road is assumed to be νf = 60 km/h, and the traffic capacity is 15,000 pcu/day. The simulation duration is set to 35 days, with a single time step of 1 h, resulting in a total of 840 time steps.
The road network consists of 12 OD pairs, 30 nodes, and 52 road segments. Among them, nodes 1, 2, and 3 serve as traffic demand attraction points, while Nodes 4, 5, 6, and 7 function as traffic demand generation points. The maximum demand flow for each OD pair is provided in Table 4.

4.4. Model Results

4.4.1. Sparse Road Network Topology Models

By collecting data on node cities and connecting roads in the study area, 14 states (cities/districts) were selected. Using the Space L model, the relationships between nodes and edges were defined to abstract the highway network into a topological structure composed of nodes and edges. In the GIS platform, it is convenient to analyze the topological relationships of geographic entities (topological connections, associations, etc.) to automatically generate a node–road segment association matrix. The attributes of each road segment can be associated through visual graphic editing and table data editing. The road segment table and node table can be stored as the edges and nodes of a directed graph G, respectively, to construct a static road network model. Using functions such as directed graph visualization, a regional highway dual-network topological model of Tibet under normal conditions (without geological disasters) is established, as shown in Figure 15.
The simplified topological structure of the sparse road network consists of 31 nodes and 52 edges, with a total length of 19,823 km, including highways, national roads, provincial roads, and county roads (Figure 16). The numbers in the figure represent the node IDs. It can be observed that the road segments in the regional network are relatively long, with critical nodes widely distributed. At critical nodes (such as county towns), there are relatively dense small networks. At the mesoscopic level, by using the innovative two-layer topological model, the regional road network can be approximated as nodes, significantly improving the simulation running speed.

4.4.2. Analyzing Sparse Road Network Resilience

(1)
Sparse Road Network Structure
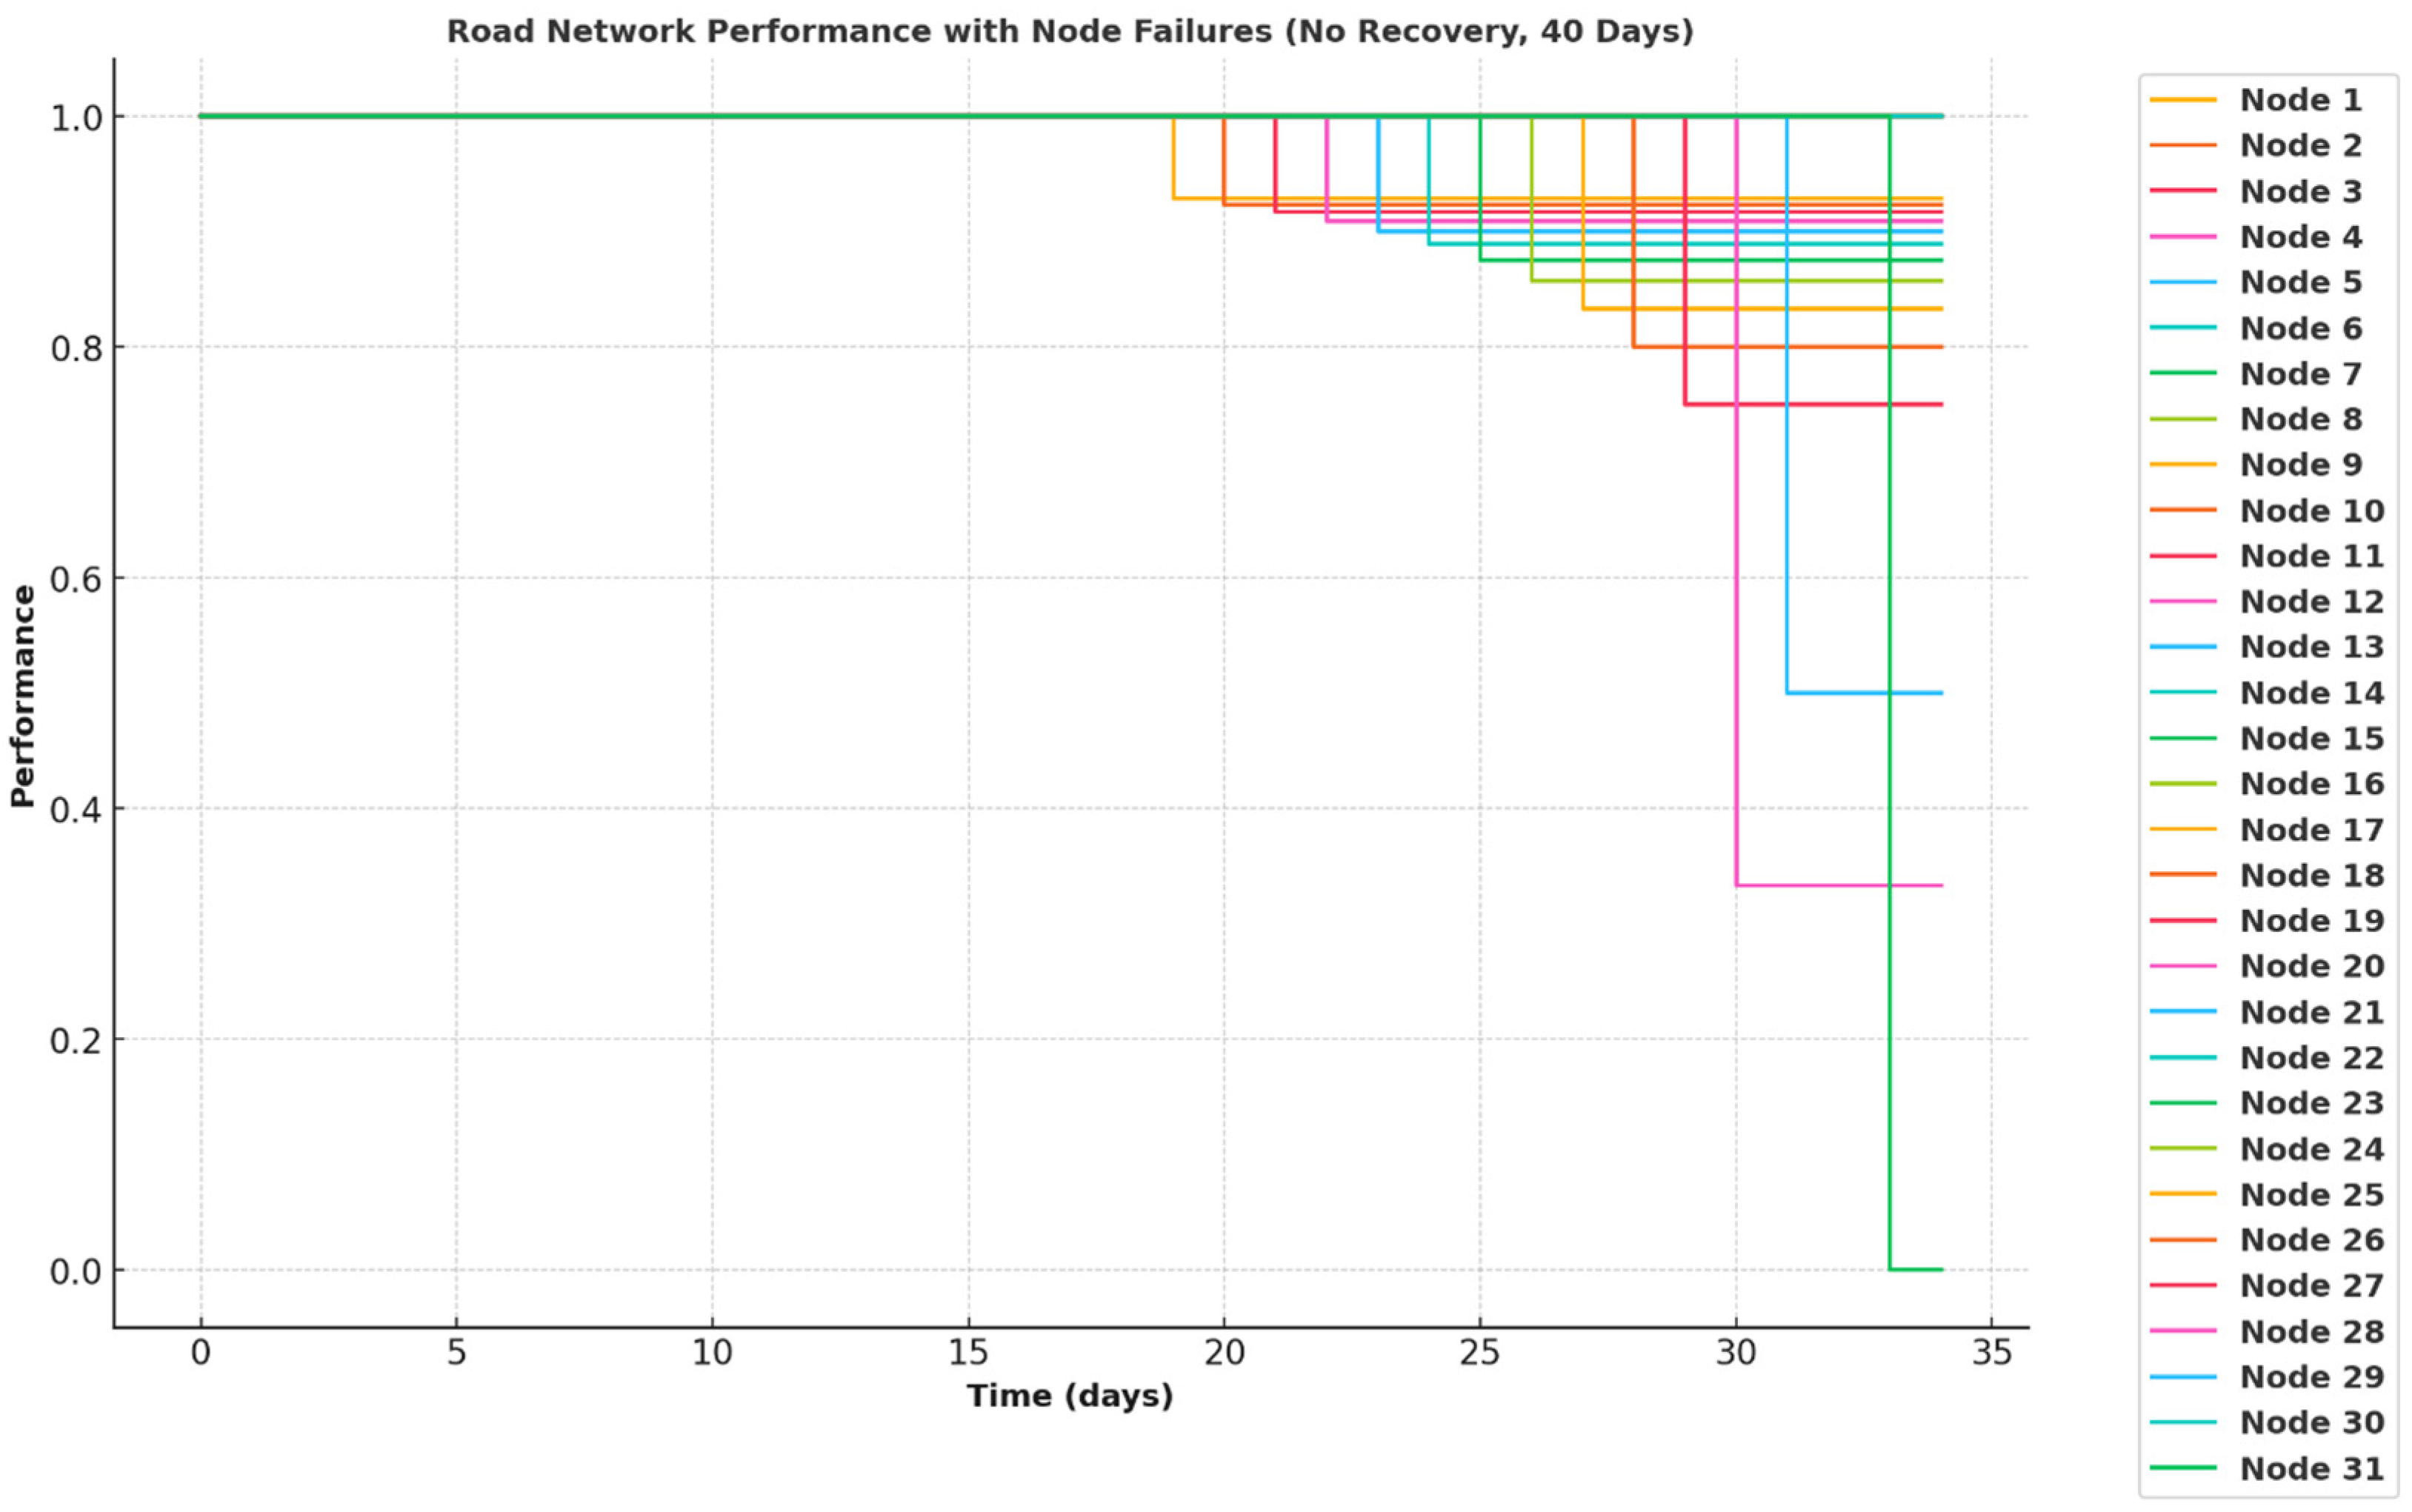
Assuming that the nodes of the road network are randomly damaged without recovery, we simulate the network resilience under continuous natural disaster events or extreme environments (Figure 17). The results show that the network’s performance gradually declines with the continuous destruction of nodes, and the rate of performance decline increases as more nodes are damaged.
In the early stages of damage, Nodes 1 to 7 are destroyed. Although the damage to these nodes results in some performance decline, it does not lead to severe network failure, thus having a relatively minor impact on the overall performance of the sparse road network. However, the destruction of Nodes 9 to 16 significantly accelerates the decline in network performance. In the later stages, the destruction of Nodes 17 to 31 fragments the network into multiple isolated segments, severely affecting its usability and connectivity, causing a sharp performance decline, approaching zero.
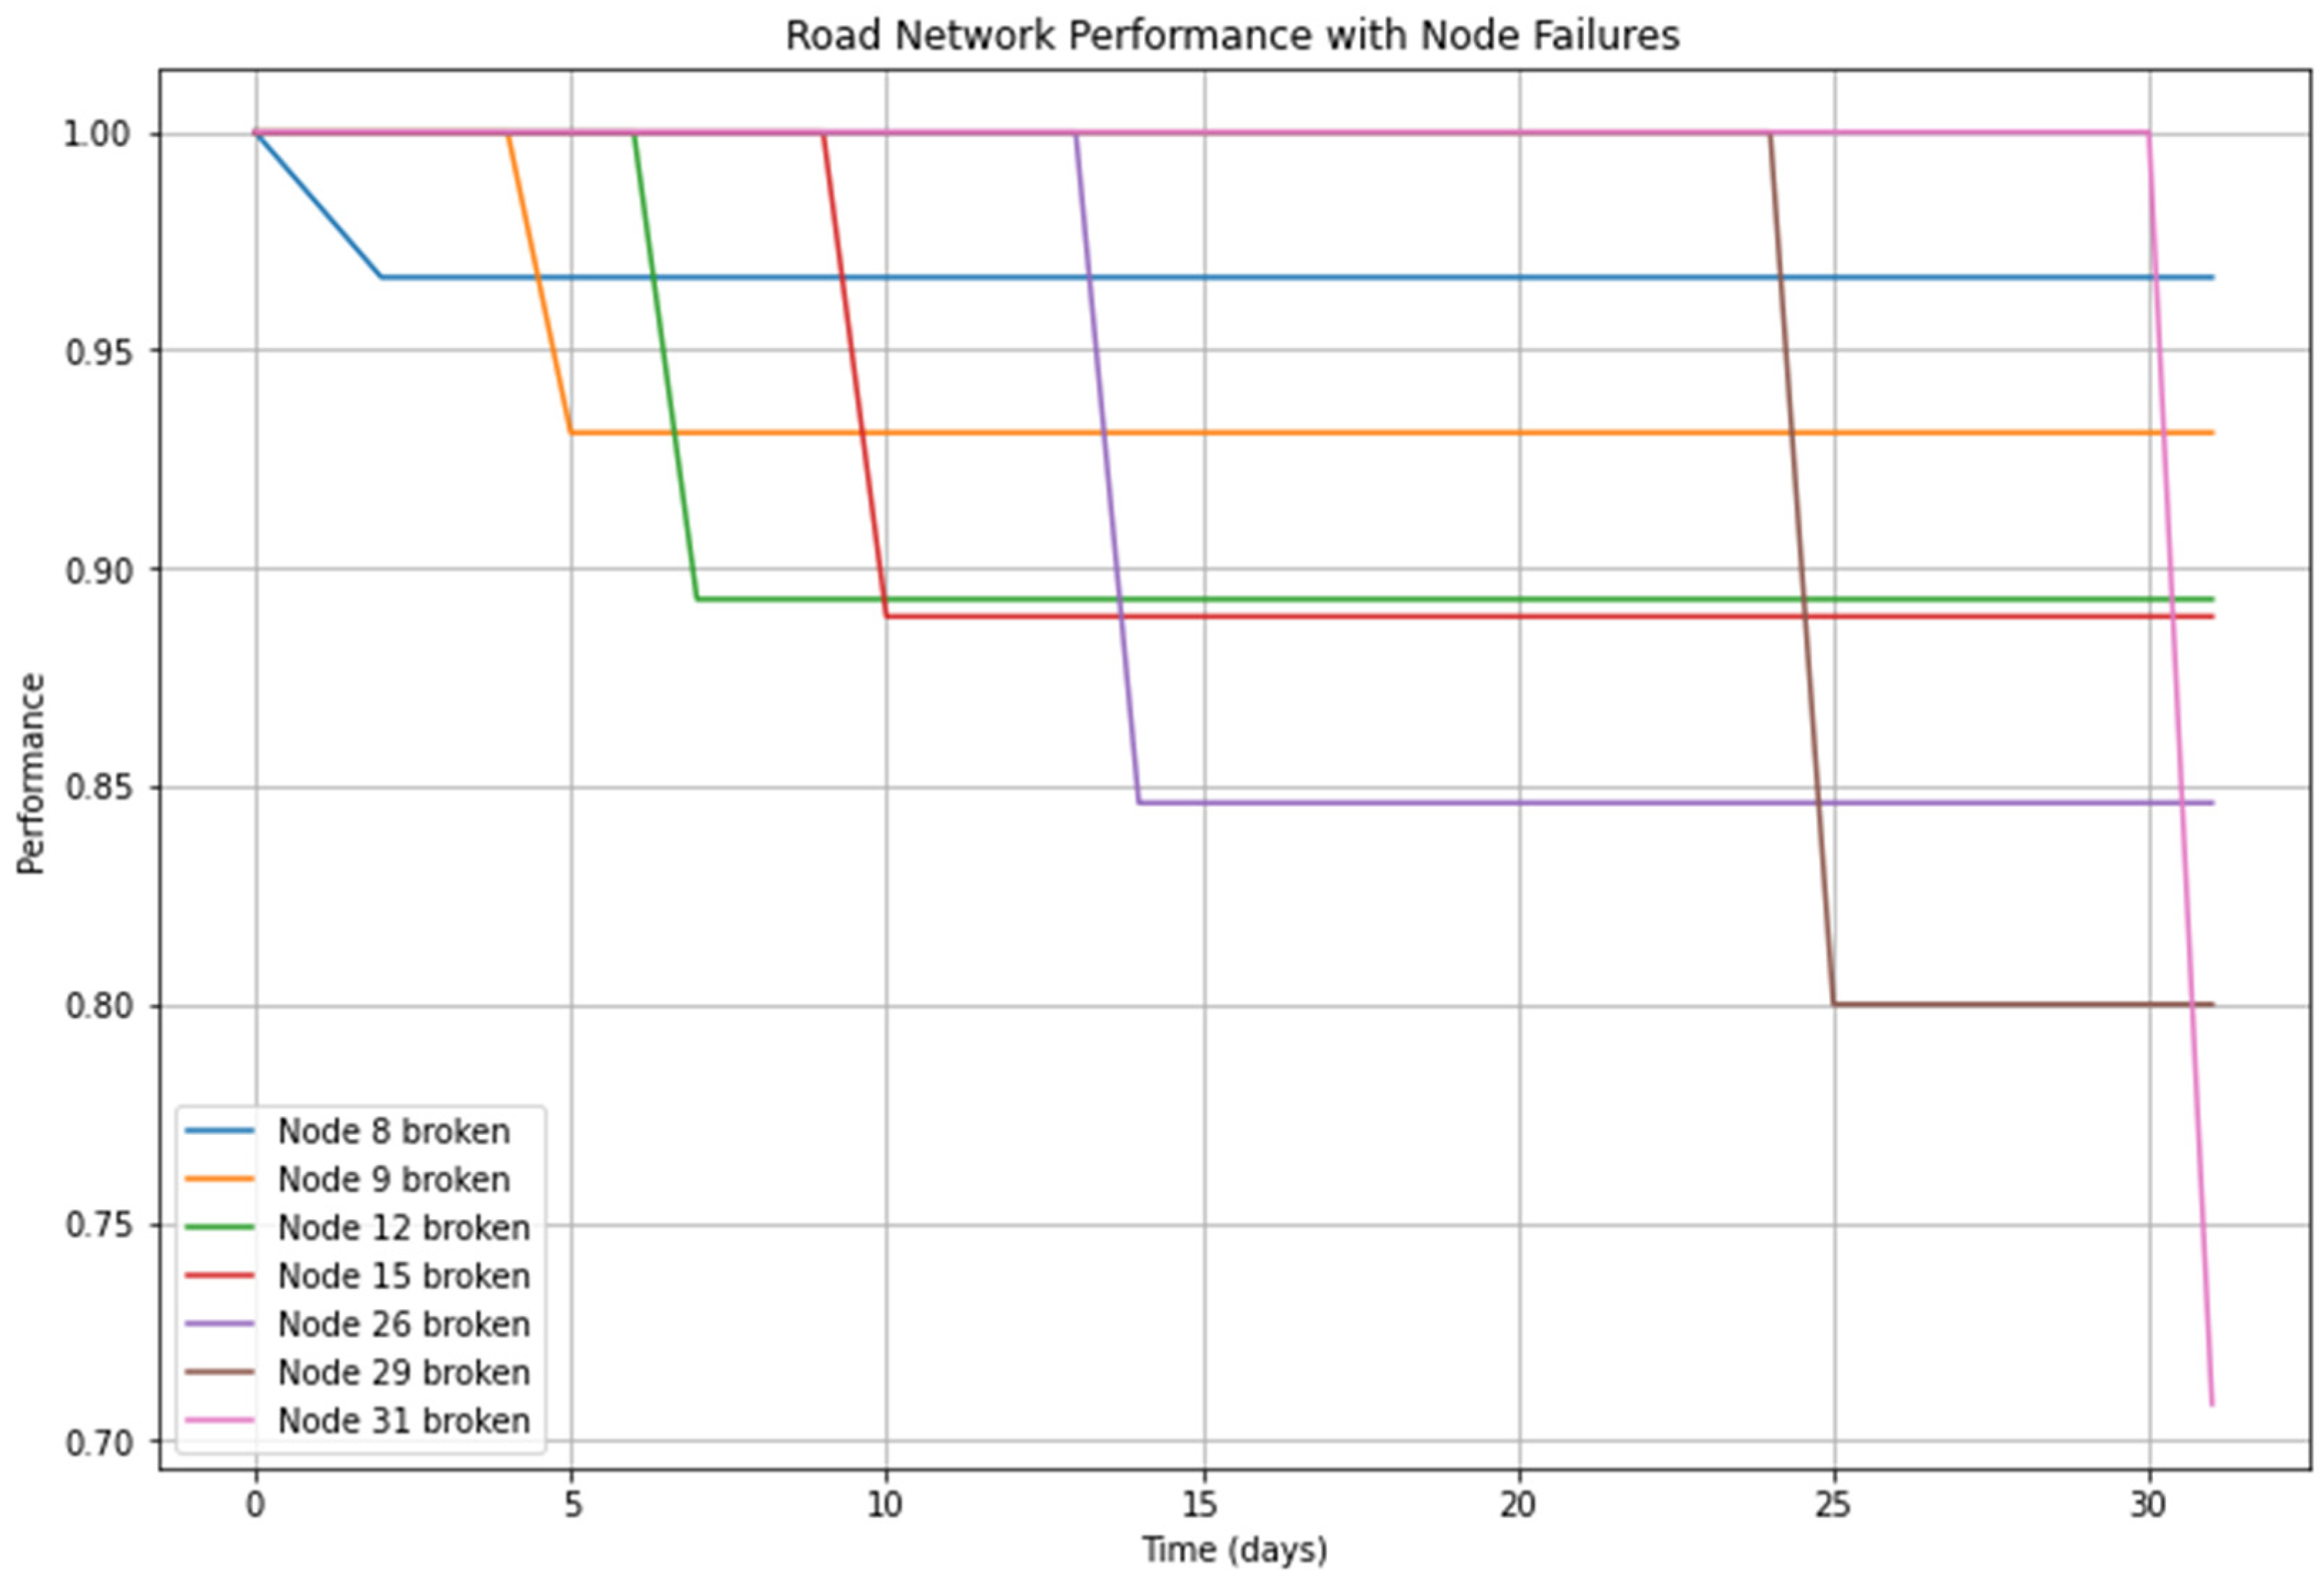
A detailed analysis of critical nodes (Figure 18) reveals that Nodes 26, 29, and 31, being interchanges, tunnels, and bridges, respectively, are the most vulnerable links in the network. In a sparse road network primarily composed of two-lane roads, these nodes are the only paths connecting two regions, having a decisive impact on network connectivity. Damage to these nodes rapidly weakens network connectivity and efficiency. Nodes 8, 9, 12, and 15, which are located in villages and county towns, are characterized by having only one main road with no alternative routes. Damage or disruption to these nodes leads to traffic bottlenecks or congestion, severely affecting the overall network flow and transport efficiency.
(2)
Duration of the Disaster Event
To reflect the impact of disaster duration on the recovery phase of the road network, we assume an initial network performance of 1 and a rescue vehicle arrival time of 2 h. Based on the average debris clearance times for different disaster events shown in Figure 12, we adjusted disaster durations from 5 h to 70 h to simulate five different disaster scenarios. As shown in Figure 19, the fluctuation trend of network resilience over time t with varying disaster durations is displayed.
From Table 5, it can be seen that the resilience of the sparse road network during collapse events is relatively high (0.6880), with good adaptability (0.80) but slow recovery speed (0.047). Frequent collapses in sparse road networks require large equipment to handle falling rocks, resulting in longer disaster durations. Debris flows have low survivability (0.45) but fast recovery speed (0.075) and adaptability (0.55). Subsidence disasters show moderate survivability (0.35) and evacuability (0.62), with a fast recovery speed (0.04) and good adaptability (0.65). Overall, the resilience is relatively balanced, exhibiting some recovery capability within the sparse road network. Water damage shows moderate survivability, a slow recovery speed, and moderate adaptability. Due to the long disaster duration, the overall resilience is the lowest.
Overall, when the disaster duration increases to 69 h, the resilience of the road network significantly decreases throughout the disaster period. For instance, the overall resilience of the network during a 69 h landslide event is nearly 10% lower than during a 6 h event. This is mainly because water damage often leads to extensive scour of bridge piers and roadbeds, requiring long-term repairs. Over time, unrepaired sections will lead to traffic congestion, increased delays, and higher accident probabilities, further weakening the network’s resilience.
(3)
Remaining Capacity
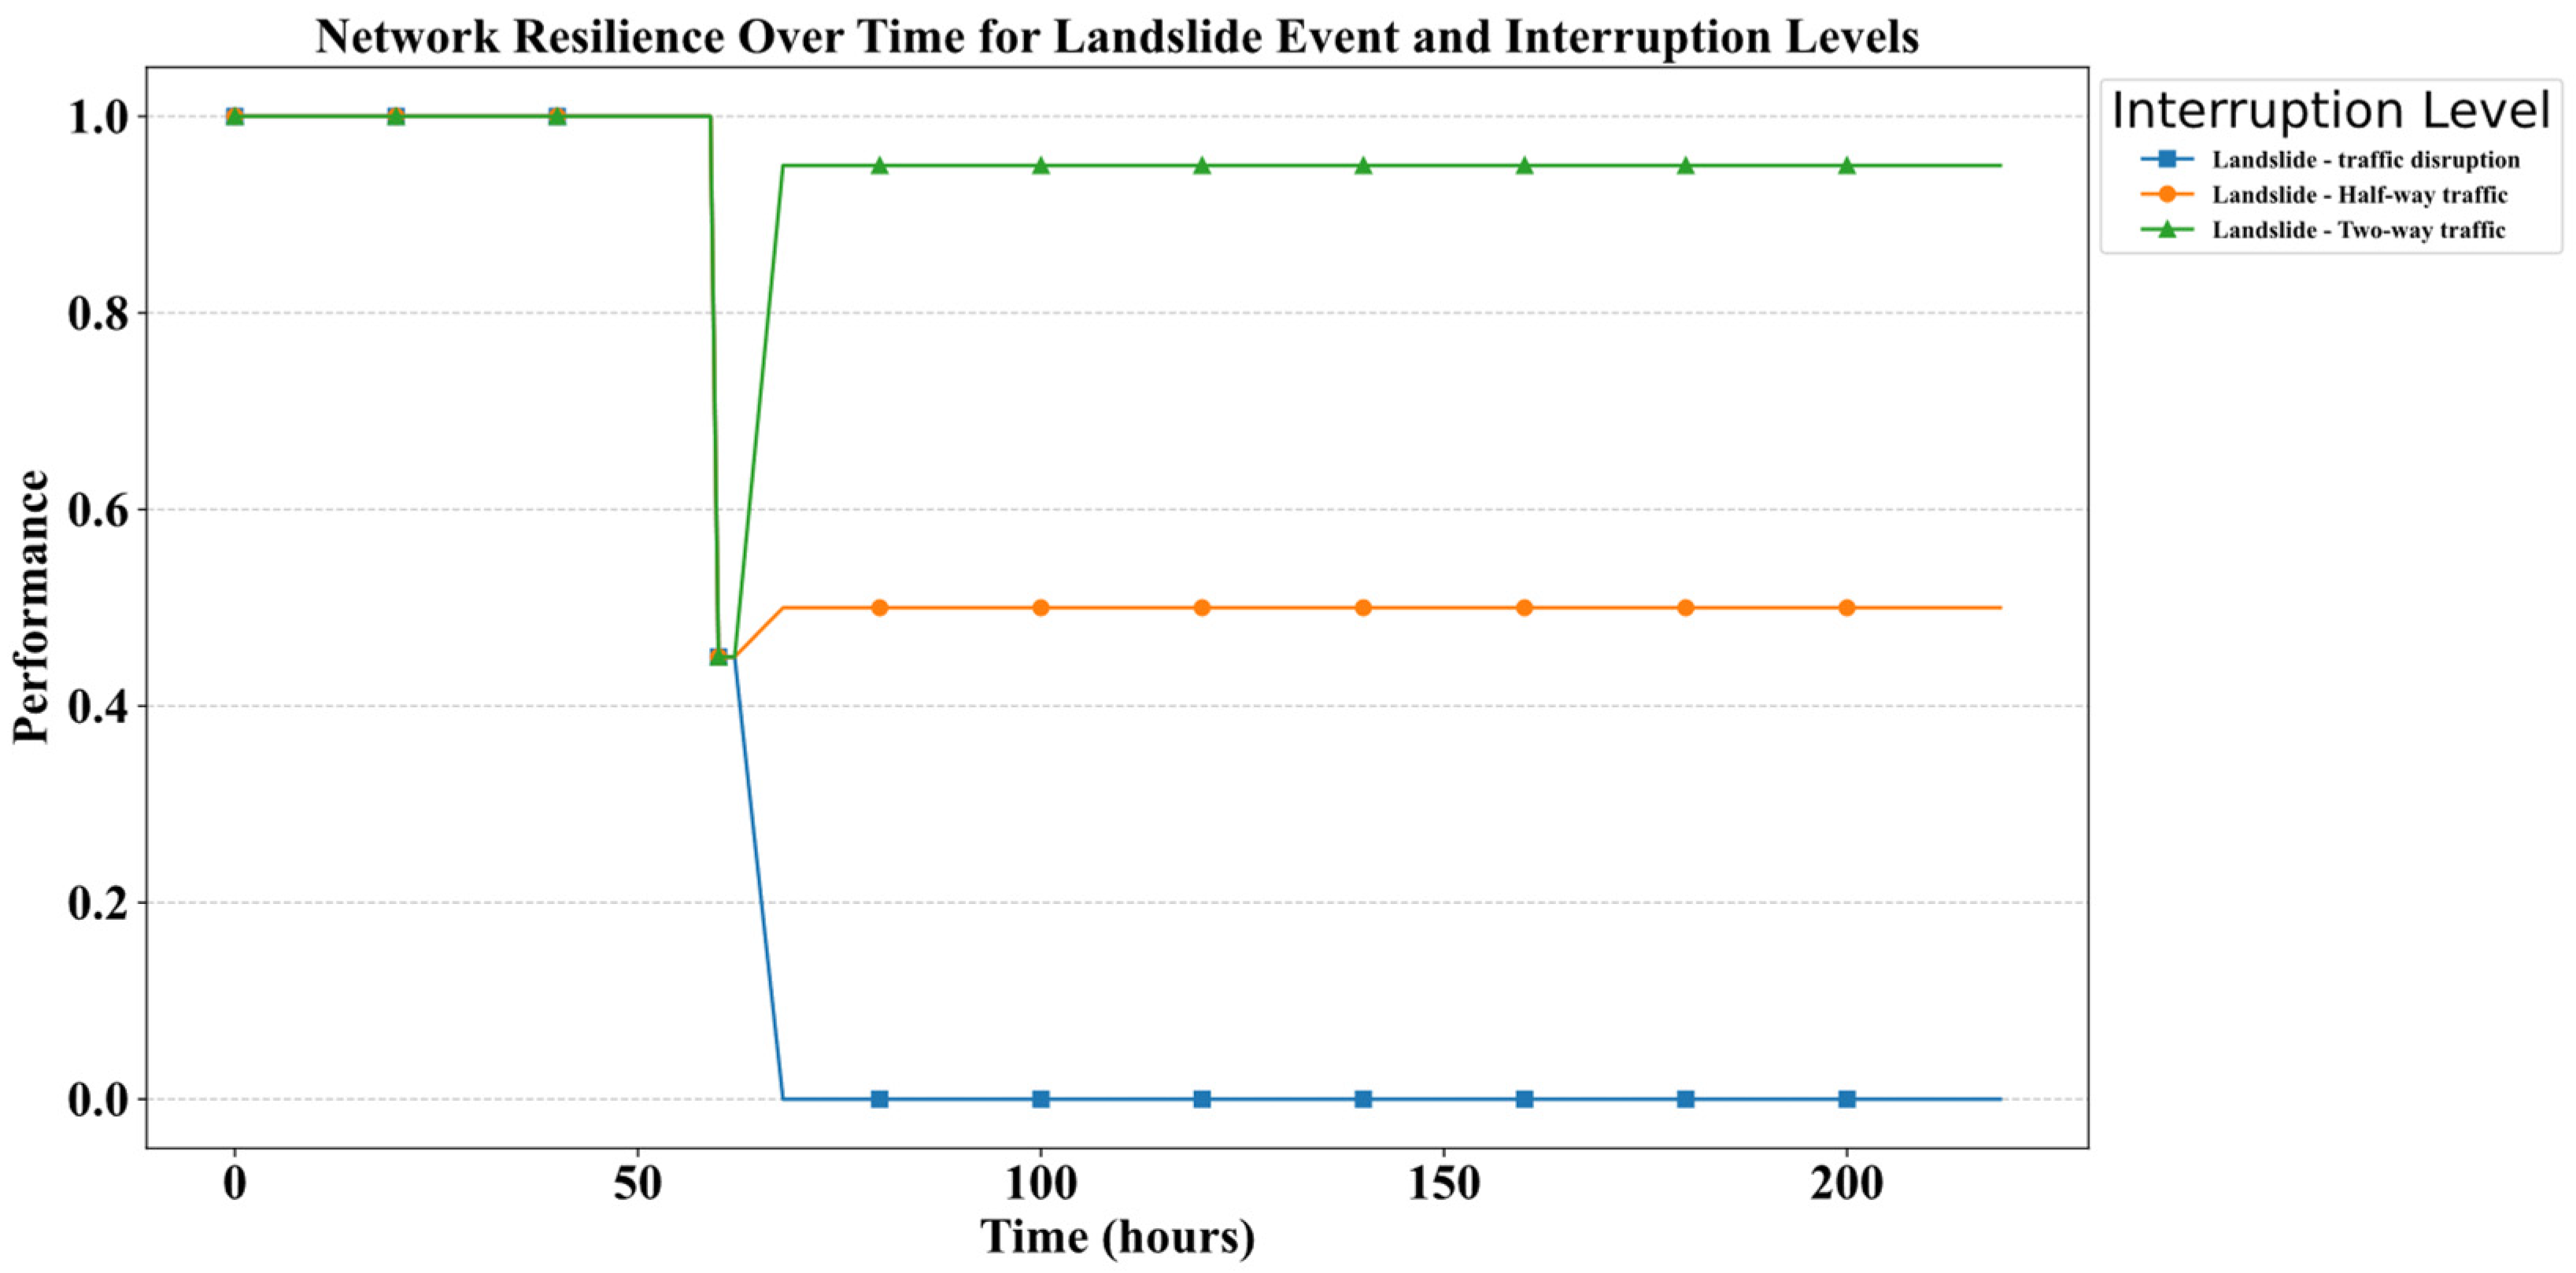
The resilience levels of the road network are simulated under three scenarios, i.e., complete blockage, partial blockage, and two-way traffic, caused by a landslide event (Figure 20).
In the traffic disruption scenario, the landslide causes the road segment to be entirely impassable, leading to a total loss of network performance and very poor overall resilience (0.4142). Sparse road networks, lacking alternative routes, experience a significant decline in traffic capacity when a critical segment is fully blocked, often resulting in complete network failure. This highlights the vulnerability of sparse road networks to complete blockages and underscores the need for optimized emergency response and recovery measures.
In the half-way traffic scenario, the network performance declines but still provides partial service, with higher evacuability and adaptability, resulting in the highest overall resilience (0.7294). This indicates that partial blockage is the most resilient scenario among the three. Although partial blockage reduces the network’s traffic capacity, it maintains a certain level of service.
In the two-way traffic scenario, the landslide has the least impact on the road segment’s traffic capacity, with performance only slightly declining before quickly returning to near-normal levels. This scenario demonstrates good adaptability (0.95) and recovery (0.075), leading to high overall resilience (0.6712). Ensuring two-way traffic in sparse road networks significantly enhances post-disaster resilience.

5. Conclusions and Recommendations

5.1. Conclusions

This paper proposes a dynamic resilience assessment and optimization framework for sparse road networks in regions prone to geological disasters. The effectiveness of this framework was validated using road networks in Tibet. The study reveals that sparse road networks, characterized by long segments, few nodes, and a lack of alternative routes, are particularly susceptible to severe impacts from geological disasters. When critical segments are completely blocked, the network’s traffic capacity significantly decreases or even fails entirely. Compared to dense networks, sparse networks are more vulnerable to frequent geological disasters, with greater recovery difficulty and longer recovery times. The simulation results also indicate that the damage to critical nodes, especially interchanges, tunnels, and bridges, significantly affects the performance of sparse road networks, potentially causing a sharp decline in network connectivity.
The duration of the disaster, disaster type, and remaining traffic capacity significantly impact network resilience. In the case of partial blockage, sparse road networks exhibit higher evacuability and adaptability, achieving the highest overall resilience (0.7294). However, as disaster duration increases, network resilience notably decreases, with a nearly 10% drop in resilience when disaster duration extends to 69 h compared to 6 h. Additionally, sparse road networks show high resilience to collapse events but have slower recovery speeds. In contrast, they have low survivability but fast recovery speed and adaptability when facing debris flows. Subsidence disasters result in moderate survivability and evacuability, fast recovery speeds, and relatively balanced overall resilience. Water damage events lead to the lowest overall resilience.
Finally, it is important to note that this study assumes a uniformly distributed failure probability for infrastructure components within the road network at the time of disaster occurrence. It does not account for the time-dependent risks associated with aging or accumulated load effects on critical nodes such as bridges and tunnels. In recent years, emerging technologies such as MTInSAR and UAV have been widely and successfully applied to long-term displacement monitoring and pre-disaster risk assessment of infrastructure. Therefore, future research could explore integrating early warning data obtained from MTInSAR and UAV monitoring technologies with dynamic resilience assessment models to establish a closed-loop framework encompassing pre-disaster risk prediction, real-time resilience quantification, and post-disaster recovery optimization. This integration would further enhance the overall disaster resistance of sparse mountainous road networks. Meanwhile, this study has not yet considered the impact of traffic congestion, information accessibility, and service availability on network performance. In future research, we plan to further integrate dynamic traffic flow models into the resilience framework, incorporating congestion effects, information dissemination, and essential service facilities (e.g., fuel stations, rest areas, etc.). This will enable us to assess how disruptions affect route choices, delays, and detours, ultimately developing a resilience assessment framework that accounts for traveler behavior.

5.2. Recommendations

It is evident that the critical nodes and segments in sparse road networks play a crucial role during disasters. To enhance the resilience of sparse road networks, the following points should be emphasized.
Firstly, the protection and maintenance of critical nodes and segments should be strengthened. Resilience weak points (nodes and segments) within the network should be identified and categorized, and regular structural safety inspections and maintenance should be conducted. Secondly, the emergency response and recovery speed should be improved. During disasters, measures such as partial road closures should be implemented to mitigate their negative impacts on the network. Post-disaster, two-way traffic capacity should be promptly restored to enhance network resilience and adaptability. Thirdly, resource allocation should be optimized. Resources should be allocated based on resilience assessment results, ensuring the reserve of critical materials and equipment, such as rapid deployment bridges and debris removal vehicles. Fourthly, the redundancy of sparse road networks should be increased by leveraging the advantages of macroscopic topological nodes in regional networks. This enables the quick diversion of mainline traffic during emergencies, ensuring the rapid arrival of emergency response vehicles. Additionally, network connectivity should be improved through road upgrades and new construction, especially near critical nodes and segments, to provide more alternative routes and options, enhancing network resilience in the event of complete interruptions.

Author Contributions

Conceptualization, S.X. and Z.Y.; data curation, S.X. and G.X.; formal analysis, S.X.; funding acquisition, Z.Y.; investigation, S.X., M.W., G.X. and S.B.; methodology, S.X. and Z.Y.; project administration, Z.Y.; resources, Z.Y.; software, S.X. and M.W.; supervision, Z.Y.; validation, S.X. and M.W.; visualization, S.X.; writing—original draft, S.X.; writing—review and editing, Z.Y. All authors have read and agreed to the published version of the manuscript.

Funding

This research was funded by the National Key Research and Development Program of China (funding number: 2022YFC3002604).

Institutional Review Board Statement

Not applicable.

Informed Consent Statement

Not applicable.

Data Availability Statement

The datasets presented in this article are not readily available because the data are part of an ongoing study or due to technical. Requests to access the datasets should be directed to the corresponding author.

Acknowledgments

This manuscript is an extended version of our conference paper originally published as: Xie, S., et al. Construction Method for a Dual-Layer Topological Model of Sparse Road Networks in Geological and Meteorological Disaster-Prone Areas. First published in The Proceedings of the 11th International Conference on Traffic and Transportation Studies, pp. 436-444, 2025, by Springer Nature Singapore. The current manuscript includes over 75% new material, focusing on expanded resilience concepts, new quantification methods, advanced evaluation metrics, and in-depth case study analysis, which significantly differ from the original conference paper. The authors would like to thank the organizers of the 11th International Conference on Traffic and Transportation Studies for their support. Furthermore, we acknowledge the support of the China Scholarship Council (CSC) program (Project ID: 202406260266).

Conflicts of Interest

The authors declare no conflicts of interest.

References

  1. Zhang, J. Transport policymaking that accounts for COVID-19 and future public health threats: A PASS approach. Transp. Policy 2020, 99, 405–418. [Google Scholar] [CrossRef] [PubMed]
  2. Wang, H.-W.; Peng, Z.-R.; Wang, D.; Meng, Y.; Wu, T.; Sun, W.; Lu, Q.-C. Evaluation and prediction of transportation resilience under extreme weather events: A diffusion graph convolutional approach. Transp. Res. Part C Emerg. Technol. 2020, 115, 102619. [Google Scholar] [CrossRef]
  3. Yu, G.; Lin, D.; Xie, J.; Wang, Y.K. A Novel Approach for Modeling and Evaluating Road Operational Resilience Based on Pressure-State-Response Theory and Dynamic Bayesian Networks. Appl. Sci. 2023, 13, 7481. [Google Scholar] [CrossRef]
  4. McMichael, A.J.; Lindgren, E. Climate change: Present and future risks to health, and necessary responses. J. Intern. Med. 2011, 270, 401–413. [Google Scholar] [CrossRef] [PubMed]
  5. Shabani, K.; Nassiri, H. Reliability of Tehran transportation network during earthquakes. Sci. Iran. 2016, 23, 1618–1626. [Google Scholar] [CrossRef]
  6. Younes, S.; Oloufa, A. Applying Topological Information for Routing Commercial Vehicles Around Traffic Congestion. Appl. Sci. 2024, 14, 10134. [Google Scholar] [CrossRef]
  7. Esfeh, M.A.; Kattan, L.; Lam, W.H.; Salari, M.; Esfe, R.A. Road network vulnerability analysis considering the probability and consequence of disruptive events: A spatiotemporal incident impact approach. Transp. Res. Part C Emerg. Technol. 2022, 136, 103549. [Google Scholar] [CrossRef]
  8. Cats, O. Topological evolution of a metropolitan rail transport network: The case of Stockholm. J. Transp. Geogr. 2017, 62, 172–183. [Google Scholar] [CrossRef]
  9. Cui, Y.; Liu, Z.; Wu, H.; Sun, P.; Zhou, F. Evaluation of Urban Transportation Resilience under Extreme Weather Events. Appl. Sci. 2024, 14, 4947. [Google Scholar] [CrossRef]
  10. Liu, C.; Su, X.; Wu, Z.; Zhang, Y.; Zhou, C.; Wu, X.; Huang, Y. Exploration of the Mountainous Urban Rail Transit Resilience Under Extreme Rainfalls: A Case Study in Chongqing, China. Appl. Sci. 2025, 15, 735. [Google Scholar] [CrossRef]
  11. Gao, W.; Hu, X.; Wang, N. Resilience analysis in road traffic systems to rainfall events: Road environment perspective. Transp. Res. Part D Transp. Environ. 2024, 126, 104000. [Google Scholar] [CrossRef]
  12. Silva-Lopez, R.; Baker, J.W. Use of corridors to select bridges to retrofit in road networks in seismic regions. Sustain. Resil. Infrastruct. 2022, 7, 901–917. [Google Scholar] [CrossRef]
  13. Mebarki, A.; Jerez, S.; Prodhomme, G.; Reimeringer, M. Natural hazards, vulnerability and structural resilience: Tsunamis and industrial tanks. Geomat. Nat. Hazards Risk 2016, 7, 5–17. [Google Scholar] [CrossRef]
  14. Watson, G.; Ahn, J.E. A systematic review: To increase transportation infrastructure resilience to flooding events. Appl. Sci. 2022, 12, 12331. [Google Scholar] [CrossRef]
  15. Singh, P.; Sinha, V.S.P.; Vijhani, A.; Pahuja, N. Vulnerability assessment of urban road network from urban flood. Int. J. Disaster Risk Reduct. 2018, 28, 237–250. [Google Scholar] [CrossRef]
  16. Tong, J.; Zhang, W.; Li, C.; Yuan, D.; Lou, H.; Wang, Q.; Wang, H.; Zhai, J. Review of Resilience Evaluation Methods in Operational Highway Tunnel: Analysis of Index Systems and Evaluation Frameworks. J. Adv. Transp. 2024, 2024, 9273719. [Google Scholar] [CrossRef]
  17. Xu, C.; Hu, H.; Wang, H. A theoretical study on the resilience evaluation method of operational road tunnel systems. Appl. Sci. 2023, 13, 13279. [Google Scholar] [CrossRef]
  18. Allen, E.; Costello, S.B.; Henning, T.F.; Chamorro, A.; Echaveguren, T. Integration of resilience and risk to natural hazards into transportation asset management of road networks: A systematic review. Struct. Infrastruct. Eng. 2023, 1–19. [Google Scholar] [CrossRef]
  19. Serdar, M.Z.; Koç, M.; Al-Ghamdi, S.G. Urban transportation networks resilience: Indicators, disturbances, and assessment methods. Sustain. Cities Soc. 2022, 76, 103452. [Google Scholar] [CrossRef]
  20. Li, C.; Fang, Q.; Ding, L.; Cho, Y.K.; Chen, K. Time-dependent resilience analysis of a road network in an extreme environment. Transp. Res. Part D Transp. Environ. 2020, 85, 102395. [Google Scholar] [CrossRef]
  21. Zhong, C.; Arisona, S.M.; Huang, X.; Batty, M.; Schmitt, G. Detecting the dynamics of urban structure through spatial network analysis. Int. J. Geogr. Inf. Sci. 2014, 28, 2178–2199. [Google Scholar] [CrossRef]
  22. Wang, S.; Yu, D.; Kwan, M.-P.; Zhou, H.; Li, Y.; Miao, H. The Evolution and Growth Patterns of the Road Network in a Medium-Sized Developing City: A Historical Investigation of Changchun, China, from 1912 to 2017. Sustainability 2019, 11, 5307. [Google Scholar] [CrossRef]
  23. Tian, J.; Guo, Q. A progressive approach to the generalization of an urban street network. In Geoinformatics 2007: Cartographic Theory and Models; SPIE: Nanjing, China, 2007; pp. 134–143. [Google Scholar] [CrossRef]
  24. Ji, T.; Yao, Y.; Dou, Y.; Deng, S.; Yu, S.; Zhu, Y.; Liao, H. The Impact of Climate Change on Urban Transportation Resilience to Compound Extreme Events. Sustainability 2022, 14, 3880. [Google Scholar] [CrossRef]
  25. Calò, M.; Ruggieri, S.; Nettis, A.; Uva, G. A MTInSAR-based early warning system to appraise deformations in simply supported concrete girder bridges. Struct. Control Health Monit. 2024, 2024, 8978782. [Google Scholar] [CrossRef]
  26. Calò, M.; Ruggieri, S.; Doglioni, A.; Morga, M.; Nettis, A.; Simeone, V.; Uva, G. Probabilistic-based assessment of subsidence phenomena on the existing built heritage by combining MTInSAR data and UAV photogrammetry. Struct. Infrastruct. Eng. 2024, 1–16. [Google Scholar] [CrossRef]
  27. Vugrin, E.D.; Warren, D.E.; Ehlen, M.A.; Camphouse, R.C. A framework for assessing the resilience of infrastructure and economic systems. In Sustainable and Resilient Critical Infrastructure Systems: Simulation, Modeling, and Intelligent Engineering; Springer: Berlin/Heidelberg, Germany, 2010; pp. 77–116. [Google Scholar] [CrossRef]
  28. Pregenzer, A.L. Systems Resilience: A New Analytical Framework for Nuclear Nonproliferation; Sandia National Laboratories (SNL): Albuquerque, NM, USA; Livermore, CA, USA, 2011. [Google Scholar]
  29. Zhang, M.; Yang, X.; Zhang, J.; Li, G. Post-earthquake resilience optimization of a rural “road-bridge” transportation network system. Reliab. Eng. Syst. Saf. 2022, 225, 108570. [Google Scholar] [CrossRef]
  30. Calvert, S.C.; Snelder, M. A methodology for road traffic resilience analysis and review of related concepts. Transp. A Transp. Sci. 2018, 14, 130–154. [Google Scholar] [CrossRef]
  31. Zhu, C.; Wu, J.; Liu, M.; Luan, J.; Li, T.; Hu, K. Cyber-physical resilience modelling and assessment of urban roadway system interrupted by rainfall. Reliab. Eng. Syst. Saf. 2020, 204, 107095. [Google Scholar] [CrossRef]
  32. Allenby, B.; Fink, J. Toward inherently secure and resilient societies. Science 2005, 309, 1034–1036. [Google Scholar] [CrossRef]
  33. Azolin, L.G.; da Silva, A.N.R.; Pinto, N. Incorporating public transport in a methodology for assessing resilience in urban mobility. Transp. Res. Part D Transp. Environ. 2020, 85, 102386. [Google Scholar] [CrossRef]
  34. Janić, M. Reprint of “Modelling the resilience, friability and costs of an air transport network affected by a large-scale disruptive event”. Transp. Res. Part A Policy Pract. 2015, 81, 77–92. [Google Scholar] [CrossRef]
  35. Barker, K.; Ramirez-Marquez, J.E.; Rocco, C.M. Resilience-based network component importance measures. Reliab. Eng. Syst. Saf. 2013, 117, 89–97. [Google Scholar] [CrossRef]
  36. Ouyang, M.; Dueñas-Osorio, L.; Min, X. A three-stage resilience analysis framework for urban infrastructure systems. Struct. Saf. 2012, 36, 23–31. [Google Scholar] [CrossRef]
  37. Bruneau, M.; Chang, S.E.; Eguchi, R.T.; Lee, G.C.; O’Rourke, T.D.; Reinhorn, A.M.; Shinozuka, M.; Tierney, K.; Wallace, W.A.; Von Winterfeldt, D. A framework to quantitatively assess and enhance the seismic resilience of communities. Earthq. Spectra 2003, 19, 733–752. [Google Scholar] [CrossRef]
  38. Ma, F.; Ao, Y.; Wang, X.; He, H.; Liu, Q.; Yang, D.; Gou, H. Assessing and enhancing urban road network resilience under rainstorm waterlogging disasters. Transp. Res. Part D Transp. Environ. 2023, 123, 103928. [Google Scholar] [CrossRef]
  39. Zobel, C.W.; Khansa, L. Characterizing multi-event disaster resilience. Comput. Oper. Res. 2014, 42, 83–94. [Google Scholar] [CrossRef]
  40. Barabási, A.-L.; Albert, R. Emergence of scaling in random networks. Science 1999, 286, 509–512. [Google Scholar] [CrossRef]
  41. Hoff, P.D.; Raftery, A.E.; Handcock, M.S. Latent space approaches to social network analysis. J. Am. Stat. Assoc. 2002, 97, 1090–1098. [Google Scholar] [CrossRef]
  42. Geisberger, R.; Sanders, P.; Schultes, D.; Vetter, C. Exact routing in large road networks using contraction hierarchies. Transp. Sci. 2012, 46, 388–404. [Google Scholar] [CrossRef]
  43. Faturechi, R.; Miller-Hooks, E. Travel time resilience of roadway networks under disaster. Transp. Res. Part B Methodol. 2014, 70, 47–64. [Google Scholar] [CrossRef]
  44. Aghababaei, M.T.S.; Costello, S.B.; Ranjitkar, P. Measures to evaluate post-disaster trip resilience on road networks. J. Transp. Geogr. 2021, 95, 103154. [Google Scholar] [CrossRef]
  45. Luathep, P.; Sumalee, A.; Ho, H.; Kurauchi, F. Large-scale road network vulnerability analysis: A sensitivity analysis based approach. Transportation 2011, 38, 799–817. [Google Scholar] [CrossRef]
  46. Henry, E.; Furno, A.; Faouzi, N.-E.E. Approach to quantify the impact of disruptions on traffic conditions using dynamic weighted resilience metrics of transport networks. Transp. Res. Rec. 2021, 2675, 61–78. [Google Scholar] [CrossRef]
  47. Xu, Z.; Ramirez-Marquez, J.E.; Liu, Y.; Xiahou, T. A new resilience-based component importance measure for multi-state networks. Reliab. Eng. Syst. Saf. 2020, 193, 106591. [Google Scholar] [CrossRef]
  48. Li, S. Dynamic traffic flow-based post-earthquake road network restoration and relief logistics. Acta Tech. 2017, 62, 149–160. [Google Scholar]
  49. Duque, P.A.M.; Dolinskaya, I.S.; Sörensen, K. Network repair crew scheduling and routing for emergency relief distribution problem. Eur. J. Oper. Res. 2016, 248, 272–285. [Google Scholar] [CrossRef]
  50. GB/T 40112-2021; Specifications for Risk Assessment of Geological Hazard. Standards Press of China: Beijing, China, 2021.
  51. JTG B01-2014; Technical Standard of Highway Engineering. China Communications Press: Beijing, China, 2015.
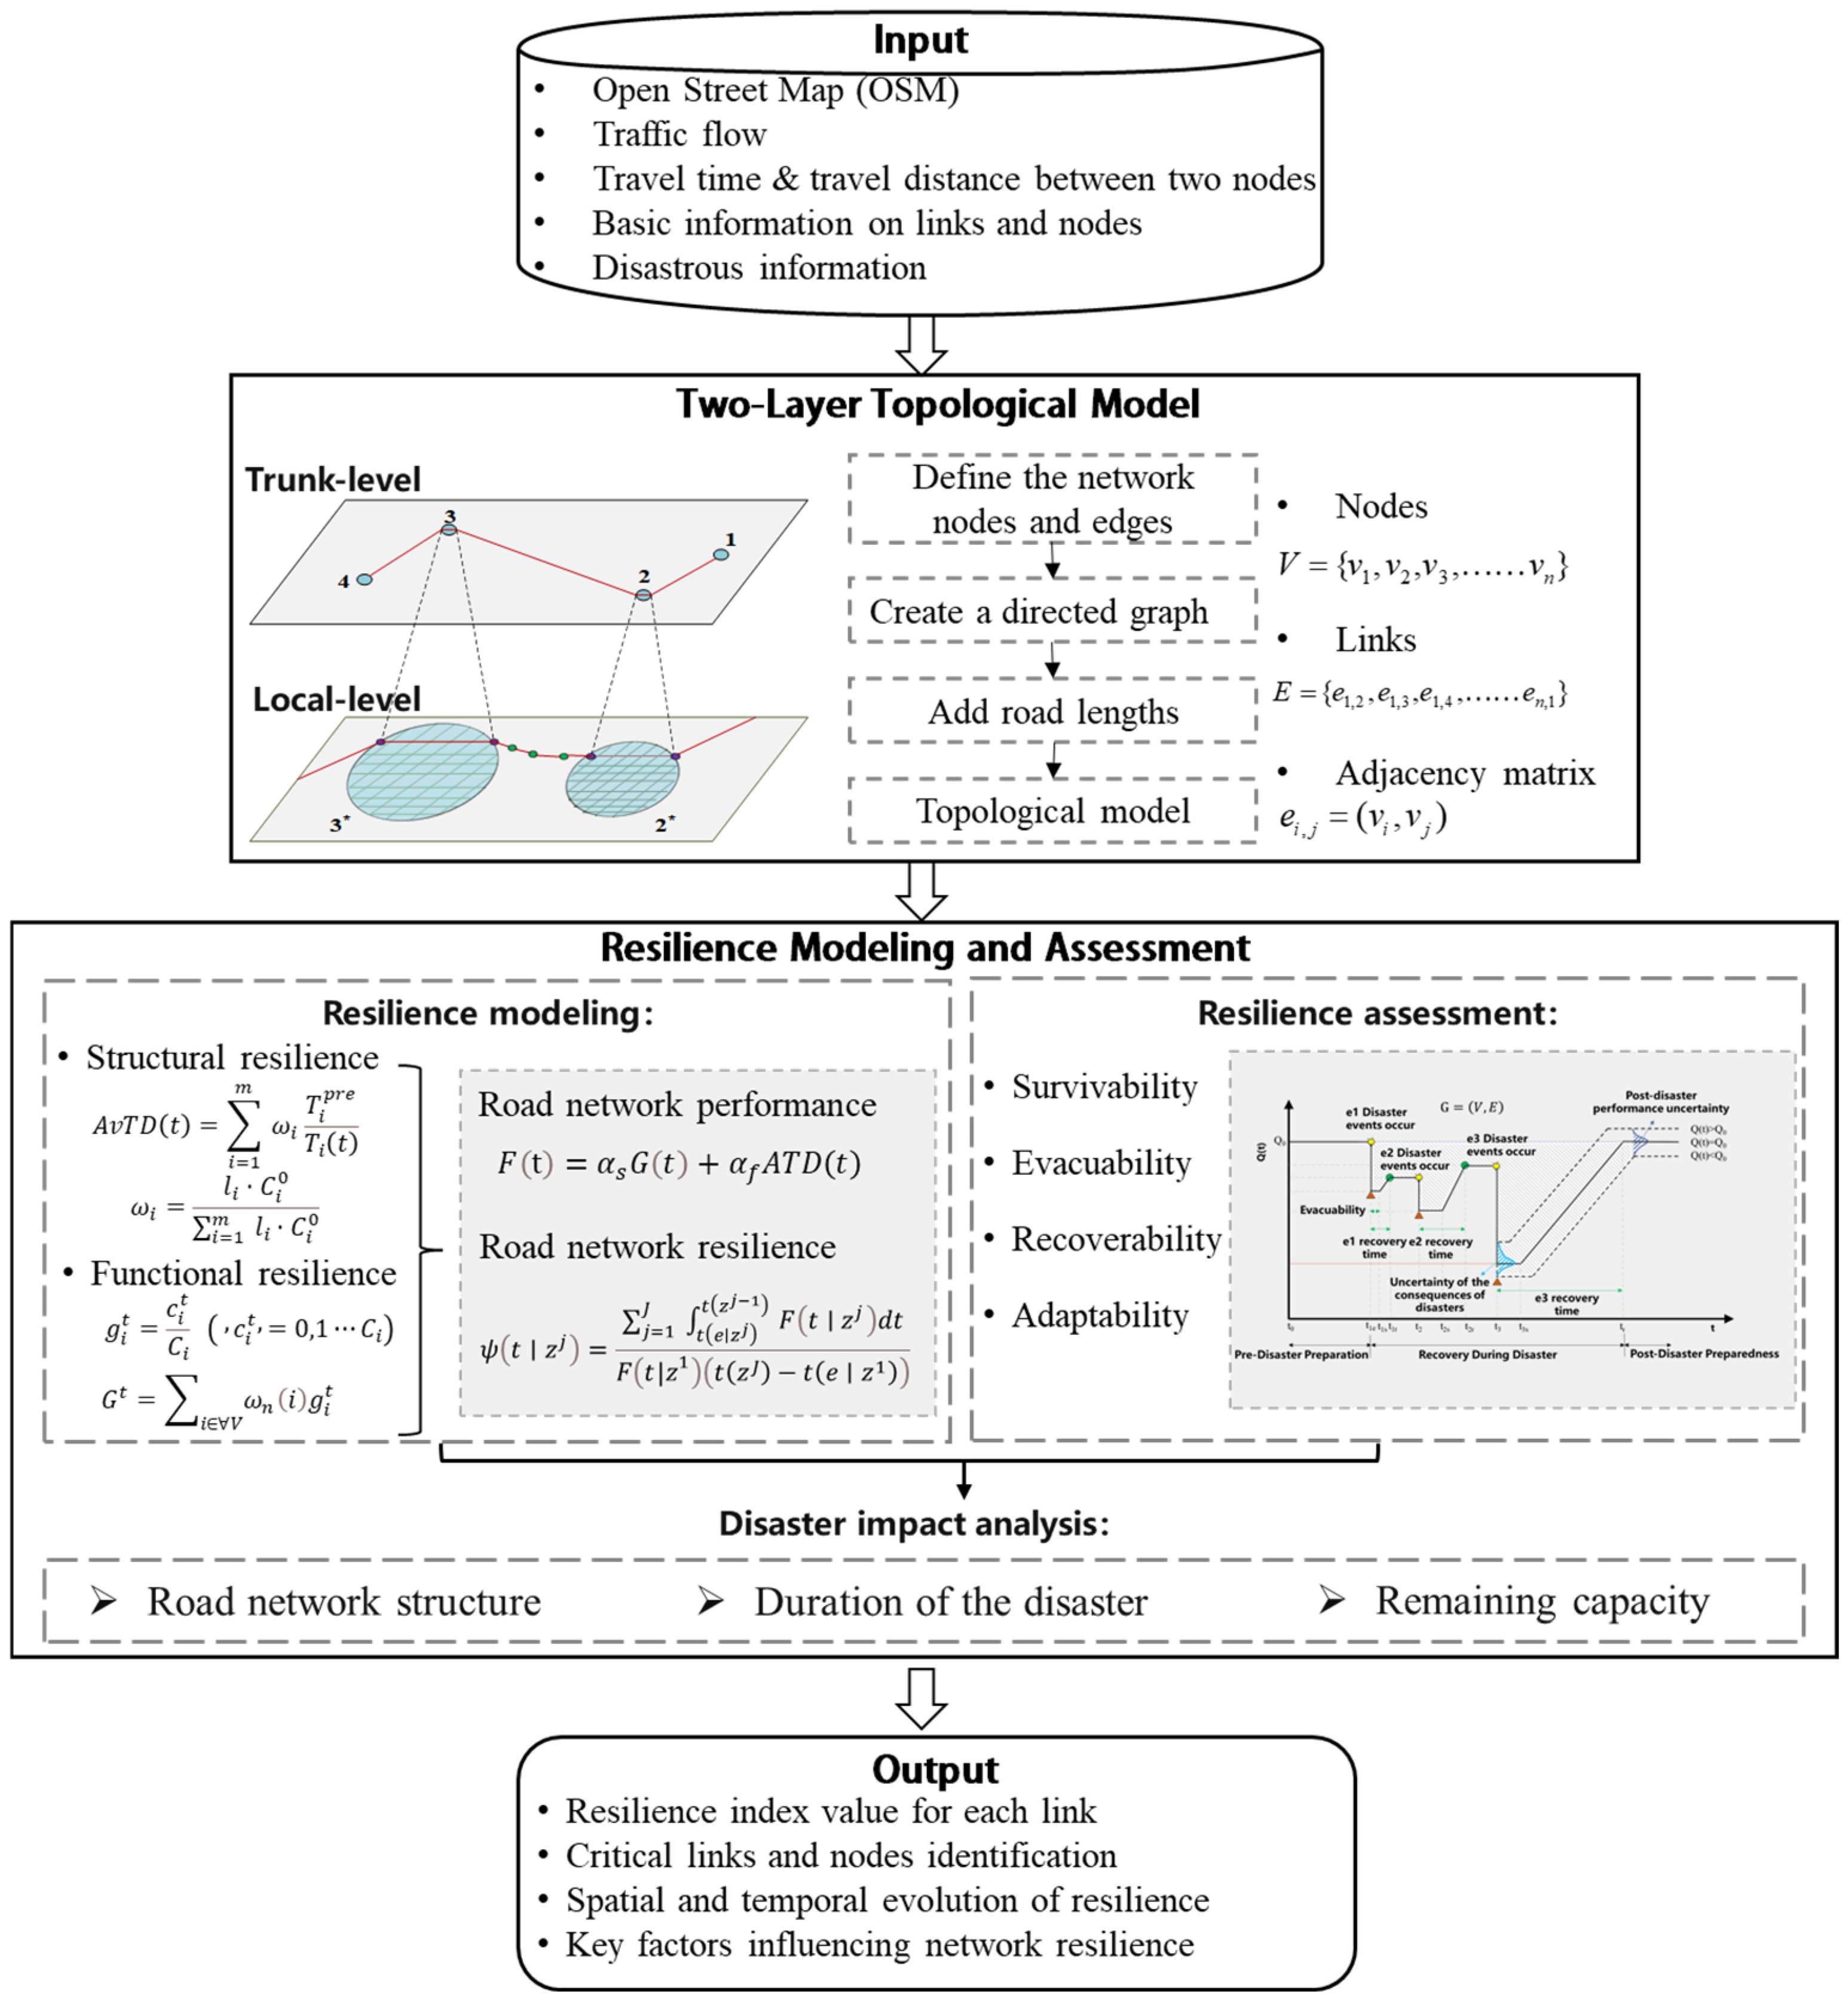
Figure 1. Research framework.
Applsci 15 02688 g001
Figure 2. Sparse road network with two layers.
Applsci 15 02688 g002
Figure 3. Main layer network topology.
Applsci 15 02688 g003
Figure 4. The local topological structure of the nodes.
Applsci 15 02688 g004
Figure 5. The local topological structure of the segments.
Applsci 15 02688 g005
Figure 6. The schematic diagram of the resilience recovery process of sparse road network.
Applsci 15 02688 g006
Figure 7. Study area and road network distribution.
Applsci 15 02688 g007
Figure 8. Traffic flow data collection diagram.
Applsci 15 02688 g008
Figure 9. Frequency of geological hazards.
Applsci 15 02688 g009
Figure 10. Level of geological hazards.
Applsci 15 02688 g010
Figure 11. The degree of disruption for geological disasters.
Applsci 15 02688 g011
Figure 12. Average debris clearance duration of geological disasters.
Applsci 15 02688 g012
Figure 13. Four types of geological disaster classification examples.
Applsci 15 02688 g013
Figure 14. Simulation process for road network resilience assessment under disaster events.
Applsci 15 02688 g014
Figure 15. The two-layer structure of the regional sparse road network.
Applsci 15 02688 g015
Figure 16. Simplified topology of sparse road network.
Applsci 15 02688 g016
Figure 17. The resilience curve of the road network after a random node is broken.
Applsci 15 02688 g017
Figure 18. Resilience curve after random failures of critical nodes.
Applsci 15 02688 g018
Figure 19. Road network resilience values under varying disaster durations.
Applsci 15 02688 g019
Figure 20. Road network resilience with different residual capacities.
Applsci 15 02688 g020
Table 1. Definition of resilience.
DefinitionsReferences
Resilience is the ability of a system to maintain its function and structure in the face of internal and external changes, and to gracefully degrade when necessary.Allenby and Fink et al. [32]
Resilience encompasses the system’s ability to resist, adapt to, and absorb the consequences of interruptions, maintain normal function levels, and recover from shocks.Azolin et al. [33]
Network resilience is the ability to maintain planned functions under the influence of disruptive events and the speed at which the network returns to its expected state.Janic et al. [34]
Resilience is categorized into four stages: anticipation, absorption, adaptation, and recovery, based on the system’s performance characteristics at different phases of disturbance.Barker et al. [35]
Dynamic resilience comprises four key attributes: robustness, redundancy, resourcefulness, and recovery speed.Ouyang et al. [36]
Resilience is the dynamic service capacity of a road network under frequent disaster impacts.Li et al. [20]
Table 2. Sample of daily average traffic volume.
Site NameAnduo BangeNagquXijiaoNaijiSigong
Date1 January 20211 March 20211 December 20211 July 20225 January 20231 June 2023
Vehicles (units)Light Trucks69175403596548
Medium Trucks151140151661326
Heavy Trucks93651291614
Extra-Heavy Trucks86631774994411461513
Containers000000
Small Passenger Vehicles46456025412391337695
Large Passenger Vehicles1188331823
Subtotal143422361071287025952319
Motorcycles (units)281817731322
Tractors (units)201000
Total (units)146422541089294326082341
Table 3. Average repair time for different disaster types (days).
Disaster Type 1Road SegmentBridgeTunnel
small-scale11.52
medium-scale234
large-scale57.510
extra-large-scale1522.530
The repair time for bridges and tunnels is adjusted based on engineering complexity, ranging from 1.5 to 2 times that of road segments.
Table 4. Travel demand assumptions for OD pairs (pcu/day).
O-DTravel DemandO-DTravel DemandO-DTravel DemandO-DTravel Demand
(4,1)6000(5,1)6000(6,1)4500(7,1)5000
(4,2)6500(5,2)5500(6,2)5500(7,2)6000
(4,3)7000(5,3)6000(6,3)6500(7,3)8000
Table 5. Resilience assessment indicators.
Disaster TypeSurvivabilityEvacuabilityRecoverabilityAdaptability
Duration of disaster
Collapse (42 h)0.650.890.00360.35
Debris flow (14 h)0.200.780.0470.80
Landslide (6 h)0.450.730.0750.55
Subsidence (10 h)0.350.620.040.65
Water damage (69 h)0.500.550.00690.50
Acceptable service level
Traffic disruption0.00000.686400
Half-way traffic0.45000.72730.00080.9500
Two-way traffic0.45000.72730.0750.5500
Disclaimer/Publisher’s Note: The statements, opinions and data contained in all publications are solely those of the individual author(s) and contributor(s) and not of MDPI and/or the editor(s). MDPI and/or the editor(s) disclaim responsibility for any injury to people or property resulting from any ideas, methods, instructions or products referred to in the content.