Article

Mechanical Behaviour of Rock Samples with Burst Liability Under Different Pre-Cycling Thresholds

1
School of Energy and Mining Engineering, China University of Mining and Technology (Beijing), Beijing 100083, China
2
Engineering Research Center of Green and Intelligent Mining for Thick Coal Seam, Ministry of Education, Beijing 100083, China
3
Faculty of Civil Engineering and Resource Management, AGH University of Krakow, Mickiewicza 30 Av., 30-059 Kraków, Poland
4
Faculty of Mechanical Engineering and Robotics, AGH University of Krakow, Mickiewicza 30 Av., 30-059 Kraków, Poland
5
Research Centre in Kraków, Institute of Geological Sciences, Polish Academy of Science, Senacka 1, 31-002 Kraków, Poland
*
Authors to whom correspondence should be addressed.
Appl. Sci. 2025, 15(5), 2760; https://doi.org/10.3390/app15052760
Submission received: 16 December 2024 / Revised: 20 February 2025 / Accepted: 1 March 2025 / Published: 4 March 2025
(This article belongs to the Section Civil Engineering)

Abstract

:
To study the influence of the main roof period pressure on the instability mechanism of rock pillars with burst liability, the composite loading mode of “pre-cycling loading + continuous loading with a constant rate” was used to conduct compression experiments on rock samples. Meanwhile, the mechanical behaviour response characteristics of rock samples were discussed. Experiment results are shown as follows: (1) mechanical properties of rock samples were strengthened by closing primary pores under pre-cycling loading. The surface roughness and secondary crack number decreased gradually with the pre-cycling threshold; (2) the Kaiser effect of AE (Acoustic Emission) signals was significant in the second and third pre-cycling loading and unloading stages. The Kaiser effect disappeared in the continuous loading stage; (3) AF-RA (Average Frequency-Risetime Amplitude) signals were distributed in a dense-sparse-dense form. Low AF and high RA shear type cracks were more common. Shear failure was the dominant failure mode in rock samples.

1. Introduction

The rapid development of society relies on energy supply. As China’s primary energy resource, coal is still the dominant energy [1]. Shallow resources have been increasingly depleted with the huge coal resource demand. It is common to exploit deep resources [2]. However, rock burst caused massive threat to safe and efficient mining of deep coal resources with increasing mining depth [3,4]. After conducting the literature review on mines where rock burst occurred, massive coal and rock mass had burst liability. As an inherent attribute of coal and rock mass, burst liability was a necessary factor for rock burst [5]. Currently, there is no unified and clear theoretical explanation about the mechanical behaviour of rocks with burst liability. This is also applicable to the instability mechanism of rocks with burst liability. Therefore, under different pre-cycling thresholds, studying the mechanical behaviour of rocks with burst liability could reveal their instability mechanism under pre-cycling loading and unloading.
Massive research has been conducted on mechanical properties and AE evolution characteristics of conventional rock samples under pre-cycling loading and unloading. To explore pore closure characteristics in the initial stage during cyclic loading and unloading (CLU), Liu et al. [6] analysed pore closure characteristics by constructing a correlation model between permeability and load. To define the fatigue deformation type under CLU, Jiang et al. [7] divided fatigue deformation into creep plastic deformation and loading plastic deformation. Zheng et al. [8] studied fatigue failure characteristics of cement by conducting CLU experiments on thick-walled cylinder specimens. The peak stress of rock samples was different between monotonic loading and CLU. Ren and Wu [9] discussed the evolution characteristics of stress–strain curves under two loading methods. The peak stress of rock samples was higher under CLU. Damage was a deterioration characteristic parameter of rock materials. Long et al. [10] revealed the CLU mechanism of weakly cemented rock mass based on the fatigue damage evolution law. Changes in load caused cracks to open and develop within rock samples. Zhao et al. [11] described the morphological deterioration characteristics of rock sample cracks in the three-dimensional space based on Griffith’s criterion theory. Based on the changing stress state trend of rock samples under CLU, Xu et al. [12] believed that the elastic stage was the stress-hardening process. The plastic stage was the stressing-softening process. There was a certain relationship between deep rock failure modes and failure characteristics under CLU. Then, Zhang and Song [13] believed that deep rock failure modes were dominated by shear. However, there were still significant differences in rock failure characteristics at different depths.
AE technology can accurately describe AE event distribution. It can analyse the structural failure mode and microcrack development. Based on AE technology, Li et al. [14] discussed the initial cyclic peak stress effect. Xu et al. [15] used the AE apparatus to explore fracture evolution characteristics in rock samples. Under CLU, the AE count corresponded to the stress state of rock samples. Wang et al. [16] divided stress–time curves into stages based on the AE count changing law. Meng et al. [17] divided the AE evolution process into the resting period, transitional period, active period and decay period based on AE characteristics. AE characteristics during the unloading stage were different from those in the loading stage. Wang et al. [18] believed that there was no AE count in the unloading stage before peak stress. Until now, the determination of the Kaiser effect points has not been unified. Liu and Qin [19] determined the Kaiser effect points based on the stress-counting criterion. Zhang et al. [20] judged the Kaiser effect points based on the AE counting time difference and cumulative counting curve inclination. The judging criteria for shear and tension rupture were divided. Gan et al. [21] took moment tensor as a criterion for dividing the shear rupture source and tension rupture source of rocks. Ge et al. [22] used AE parameter values as criteria for dividing shear and tension cracks, namely AF-RA.
As the coal face advances, the periodic failure of the main roof has loading and unloading effects on rock pillars. Mechanical properties of rocks change under loading and unloading effects [23,24,25]. Xiao et al. [26] conducted cyclic loading experiments on rocks. They found that cyclic loading had a significant effect on rock strength, deformation behaviour and failure type. Wang et al. [27] believed that the strength characteristics, failure characteristics and damage accumulation degree of rocks were different with different cyclic loads. Additionally, mechanical properties of rocks were different due to different loading methods and burst liability [28,29]. Chen et al. [30] conducted uniaxial compression and pre-cycling loading experiments on sandstone with burst liability. They found that pre-cycling loading can strengthen rock mechanical properties and increase rock compressive strength. Under the same external environment, stronger burst liability leaded to the result that rock samples were easier to be damaged. Yang et al. [31] conducted uniaxial compression experiments on coal samples with strong burst liability, weak burst liability and no burst liability. They found that the crack initiation stress, damage stress and peak strength of coal with strong burst liability were higher than those of coal with weak burst liability and without burst liability. Pan et al. [32] believed that the peak strength of coal samples with burst liability was high. Meanwhile, failure instability was unstable. Under high vertical stress, coal samples with burst liability showed obvious dynamic failure characteristics compared with coal samples without burst liability. As a special rock that induced rock burst disaster, loading modes of rock pillars were different. However, previous studies mainly focused on the mechanical behaviour of conventional rocks under conventional uniaxial loading (CLU). Few studies were conducted on the mechanical behaviour and instability mechanism of rocks with burst liability under different pre-cycling thresholds.
This study conducted cyclic loading experiments with multiple thresholds, revealing the instability mechanism of sandstone with burst liability under complex stress paths. The multi-cycle threshold controlling method and a scanning electron microscope were used to quantitatively analyse the microstructure failure characteristics of sandstone under different pre-cycling thresholds. Based on the evolution characteristics of AF-RA parameters, the quantitative discrimination of tensile and shear cracks was realised. It solved the limitation that traditional AE analysis only relied on a single parameter. This study enhanced the theoretical understanding of the rock failure mechanism under pre-cycling loading. It provided new theoretical basis for rock instability criteria establishment considering the pre-cycling loading effect. In engineering practice, the proposed pre-cycling threshold effect law can be used to predict early warnings of roof weighting in coal mines. Through real-time monitoring of AE characteristic parameters for roof strata, forewarning information of rock burst can be accurately identified. It provided key technical support for deep mine support structure design and dynamic disaster prevention.

2. Materials and Methods

2.1. Preparation of Sandstones with Burst Liability

In this paper, sandstone samples were taken from the Nalinhe coal mine 2# located in Erdos City, Inner Mongolia Autonomous Region, China. Based on “the standard for test methods of engineering rock mass (GB/T50266-2013) [33]”, the rock sample size was 50 mm × 100 mm. The unevenness error of rock samples was less than 0.05 mm. The maximum perpendicular deviation of rock samples was less than 0.25°.
Following “Methods for test, monitoring and prevention of rock burst. Part 2: Classification and laboratory test method on burst liability of coal (GB/T25217.1-2010) [34]”, the burst liability of rock samples was determined with the bending energy index. Therefore, the bending energy index (UWQ) was calculated with Equation (1). It was 90.627 kJ. It satisfied the following range: 15 kJ < UWQ < 120 kJ. Therefore, rock samples had weak burst liability (Table 1):
U W Q = 102.6 R t 5 2 h 2 E t p l 1 2
where Rt is the tensile strength of rocks; h is the roof thickness; Et is the elastic modulus of rocks; pl is the loading force of overlying rock strata.
To obtain experimental parameters, uniaxial compression experiments were conducted on rock samples at a loading rate of 3 μm/s (Figure 1). The peak stress of A-0-3 rock samples was removed by eliminating rock samples with a large stress dispersion. Therefore, the average peak stress (σc) of rock samples was 43.33 MPa. Table 2 lists basic static mechanical parameters of sandstone. It aims at providing basic data for subsequent experiments.

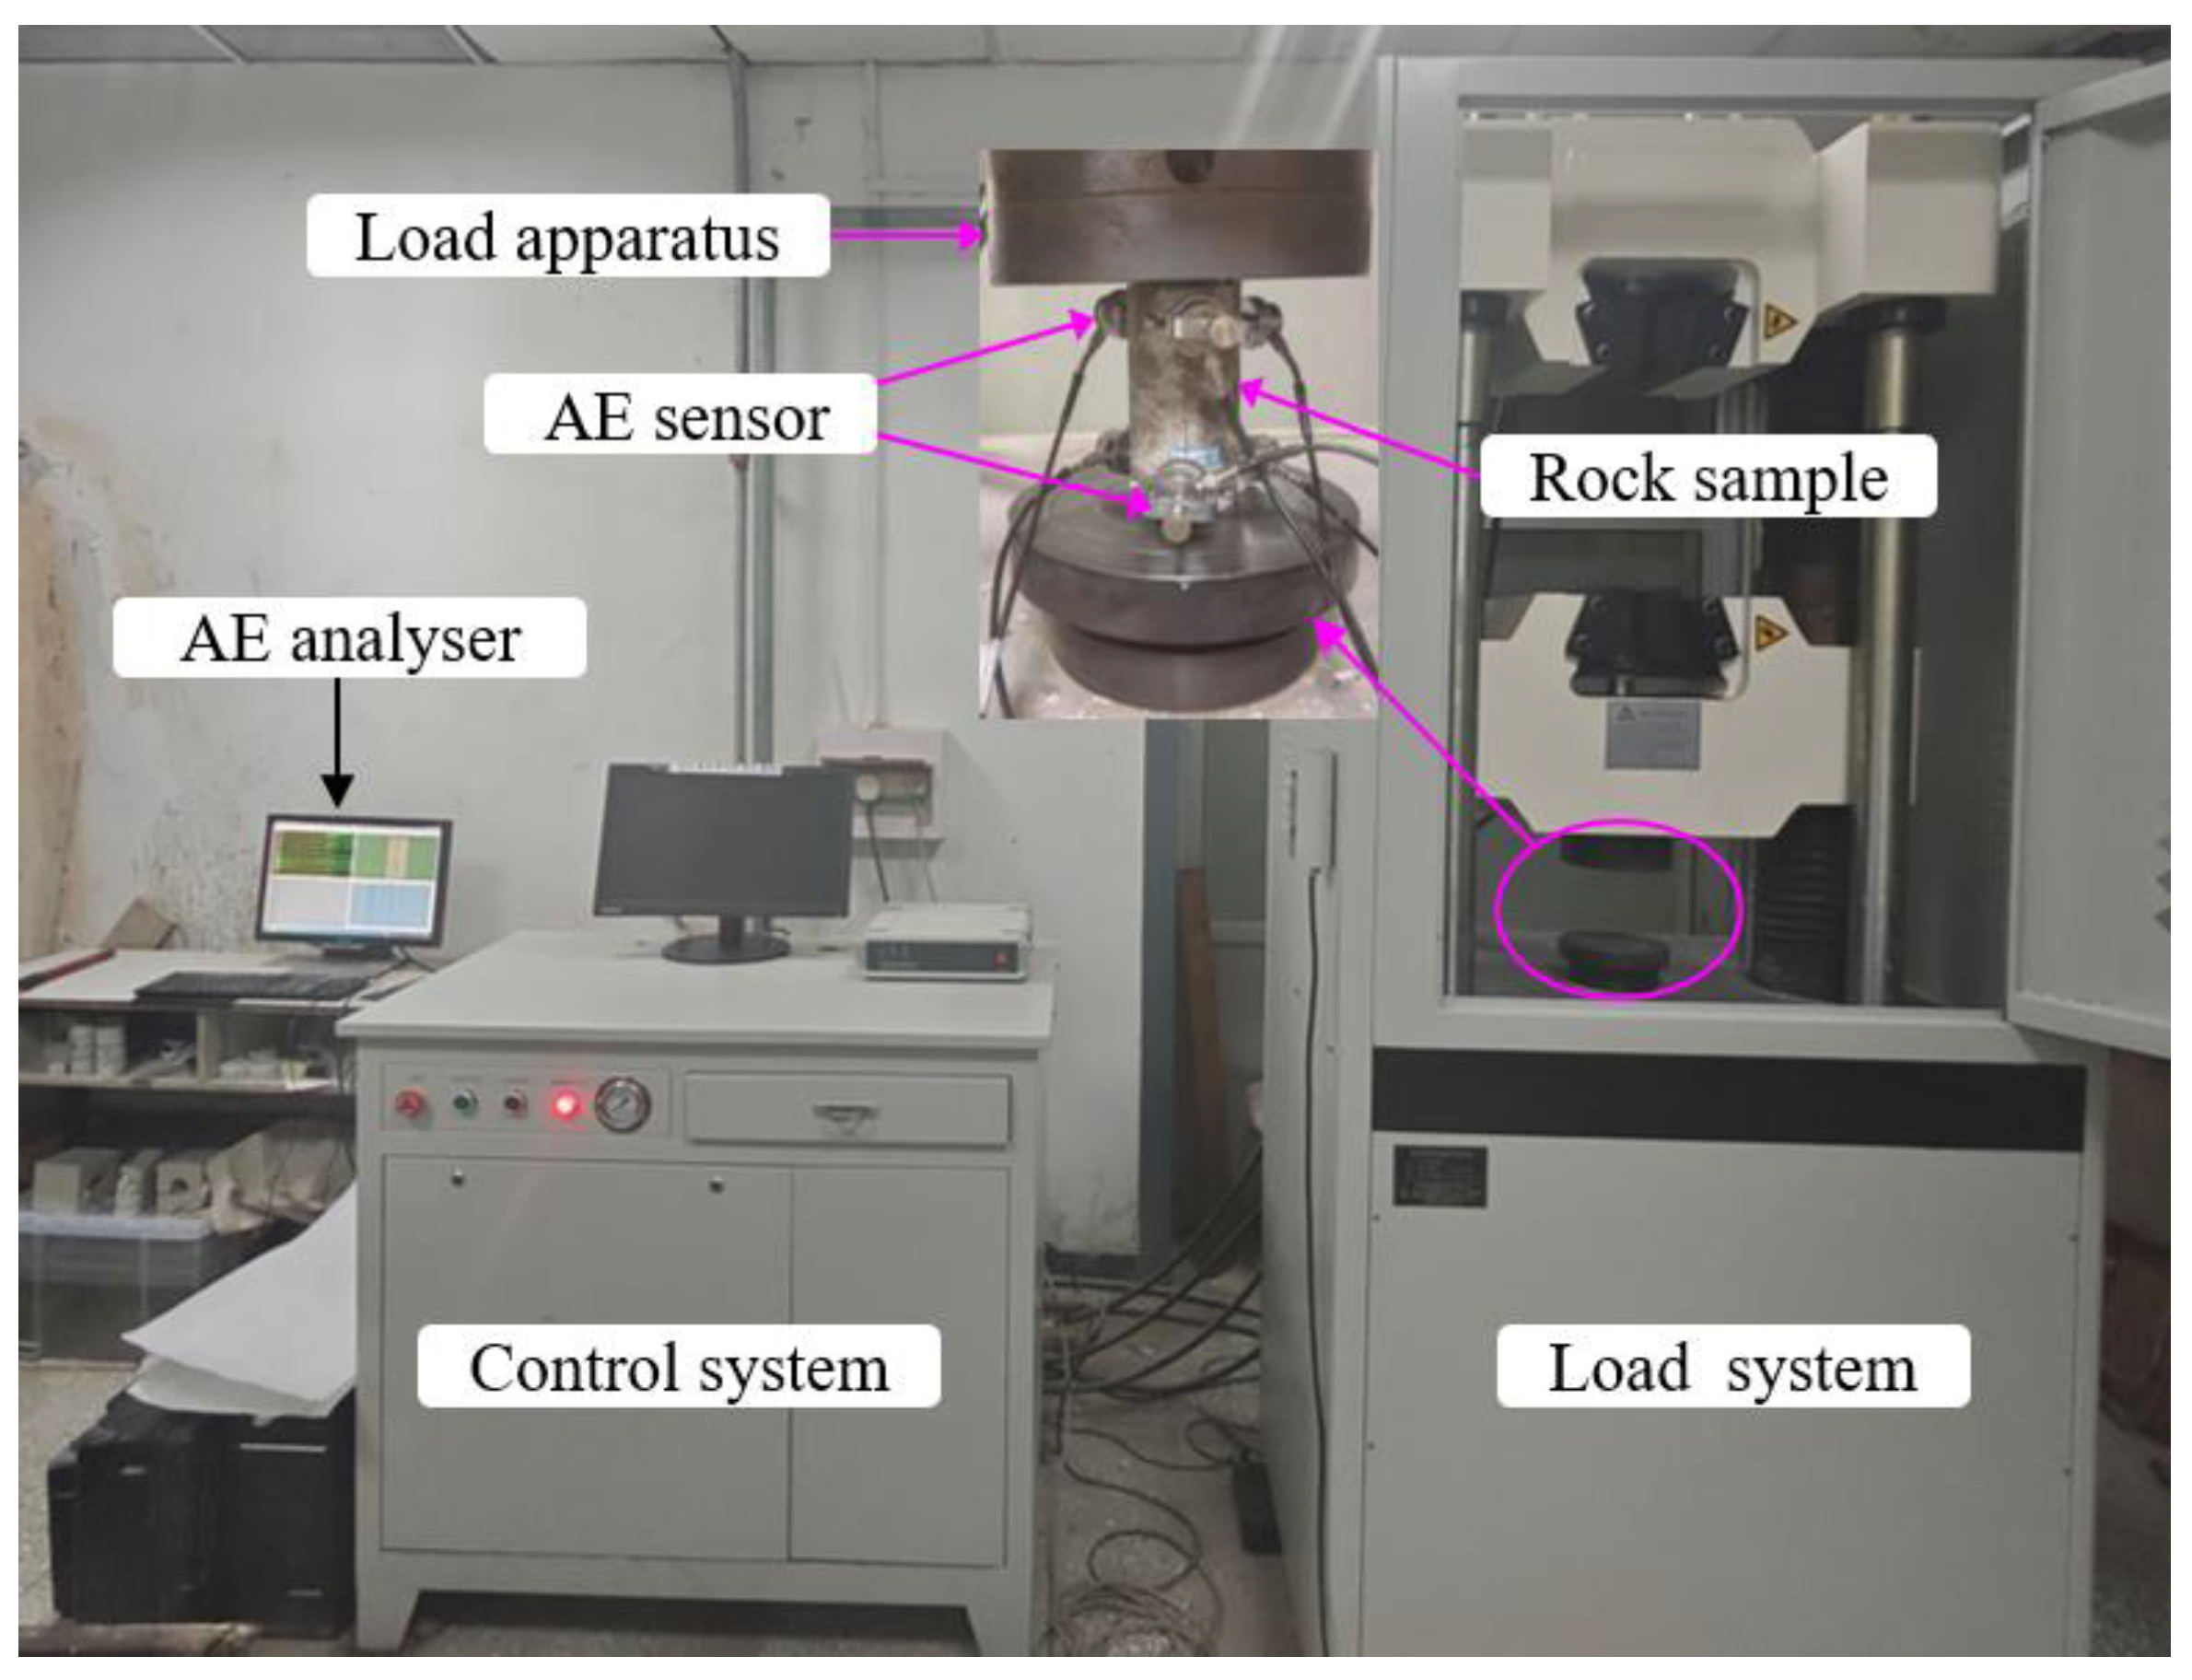
2.2. Experimental Apparatus

A microcomputer-controlled electronic universal testing machine of WDW-300 was used. The AE signal was collected by an AE analyser. The AE analyser was equipped with an AE sensor, a coaxial line and an external adapter [35]. The AE sensor coated with a Vaseline coupling agent was uniformly glued to rock samples. It could ensure a normal connection between AE sensors and AE analysers. After the gap was cleared, the loading started. During the loading process, the deformation and crack development of rock samples were observed until the rock sample failure. Currently, the stress, strain and AE signal evolution characteristics of rock samples were monitored and recorded in real time (Figure 2).

2.3. Experimental Methods

Zeng [28] believed that for sandstone samples with burst liability, when the cycling threshold is less than 60% of peak stress, sandstone samples with burst liability will not be destabilised. Therefore, to explore the mechanical behaviour of rock samples with burst liability under different pre-cycling thresholds, loading and unloading were repeated for 3 times on rock samples. The main purpose was to evaluate the influence of different pre-cycling thresholds on the mechanical behaviour of sandstone. By fixing the number of pre-cycling, this study aimed at eliminating other confounding factors.
The loading and unloading rate were 3 μm/s. The pre-cycling thresholds were 6 MPa, 12 MPa and 18 MPa. After the pre-cycling loading and unloading ended, continuous uniaxial loading was conducted on rock samples with a constant rate (3 μm/s) until the rock sample failure (Figure 3). PD was the pre-cycling threshold. PC was the continuous load.

3. Results

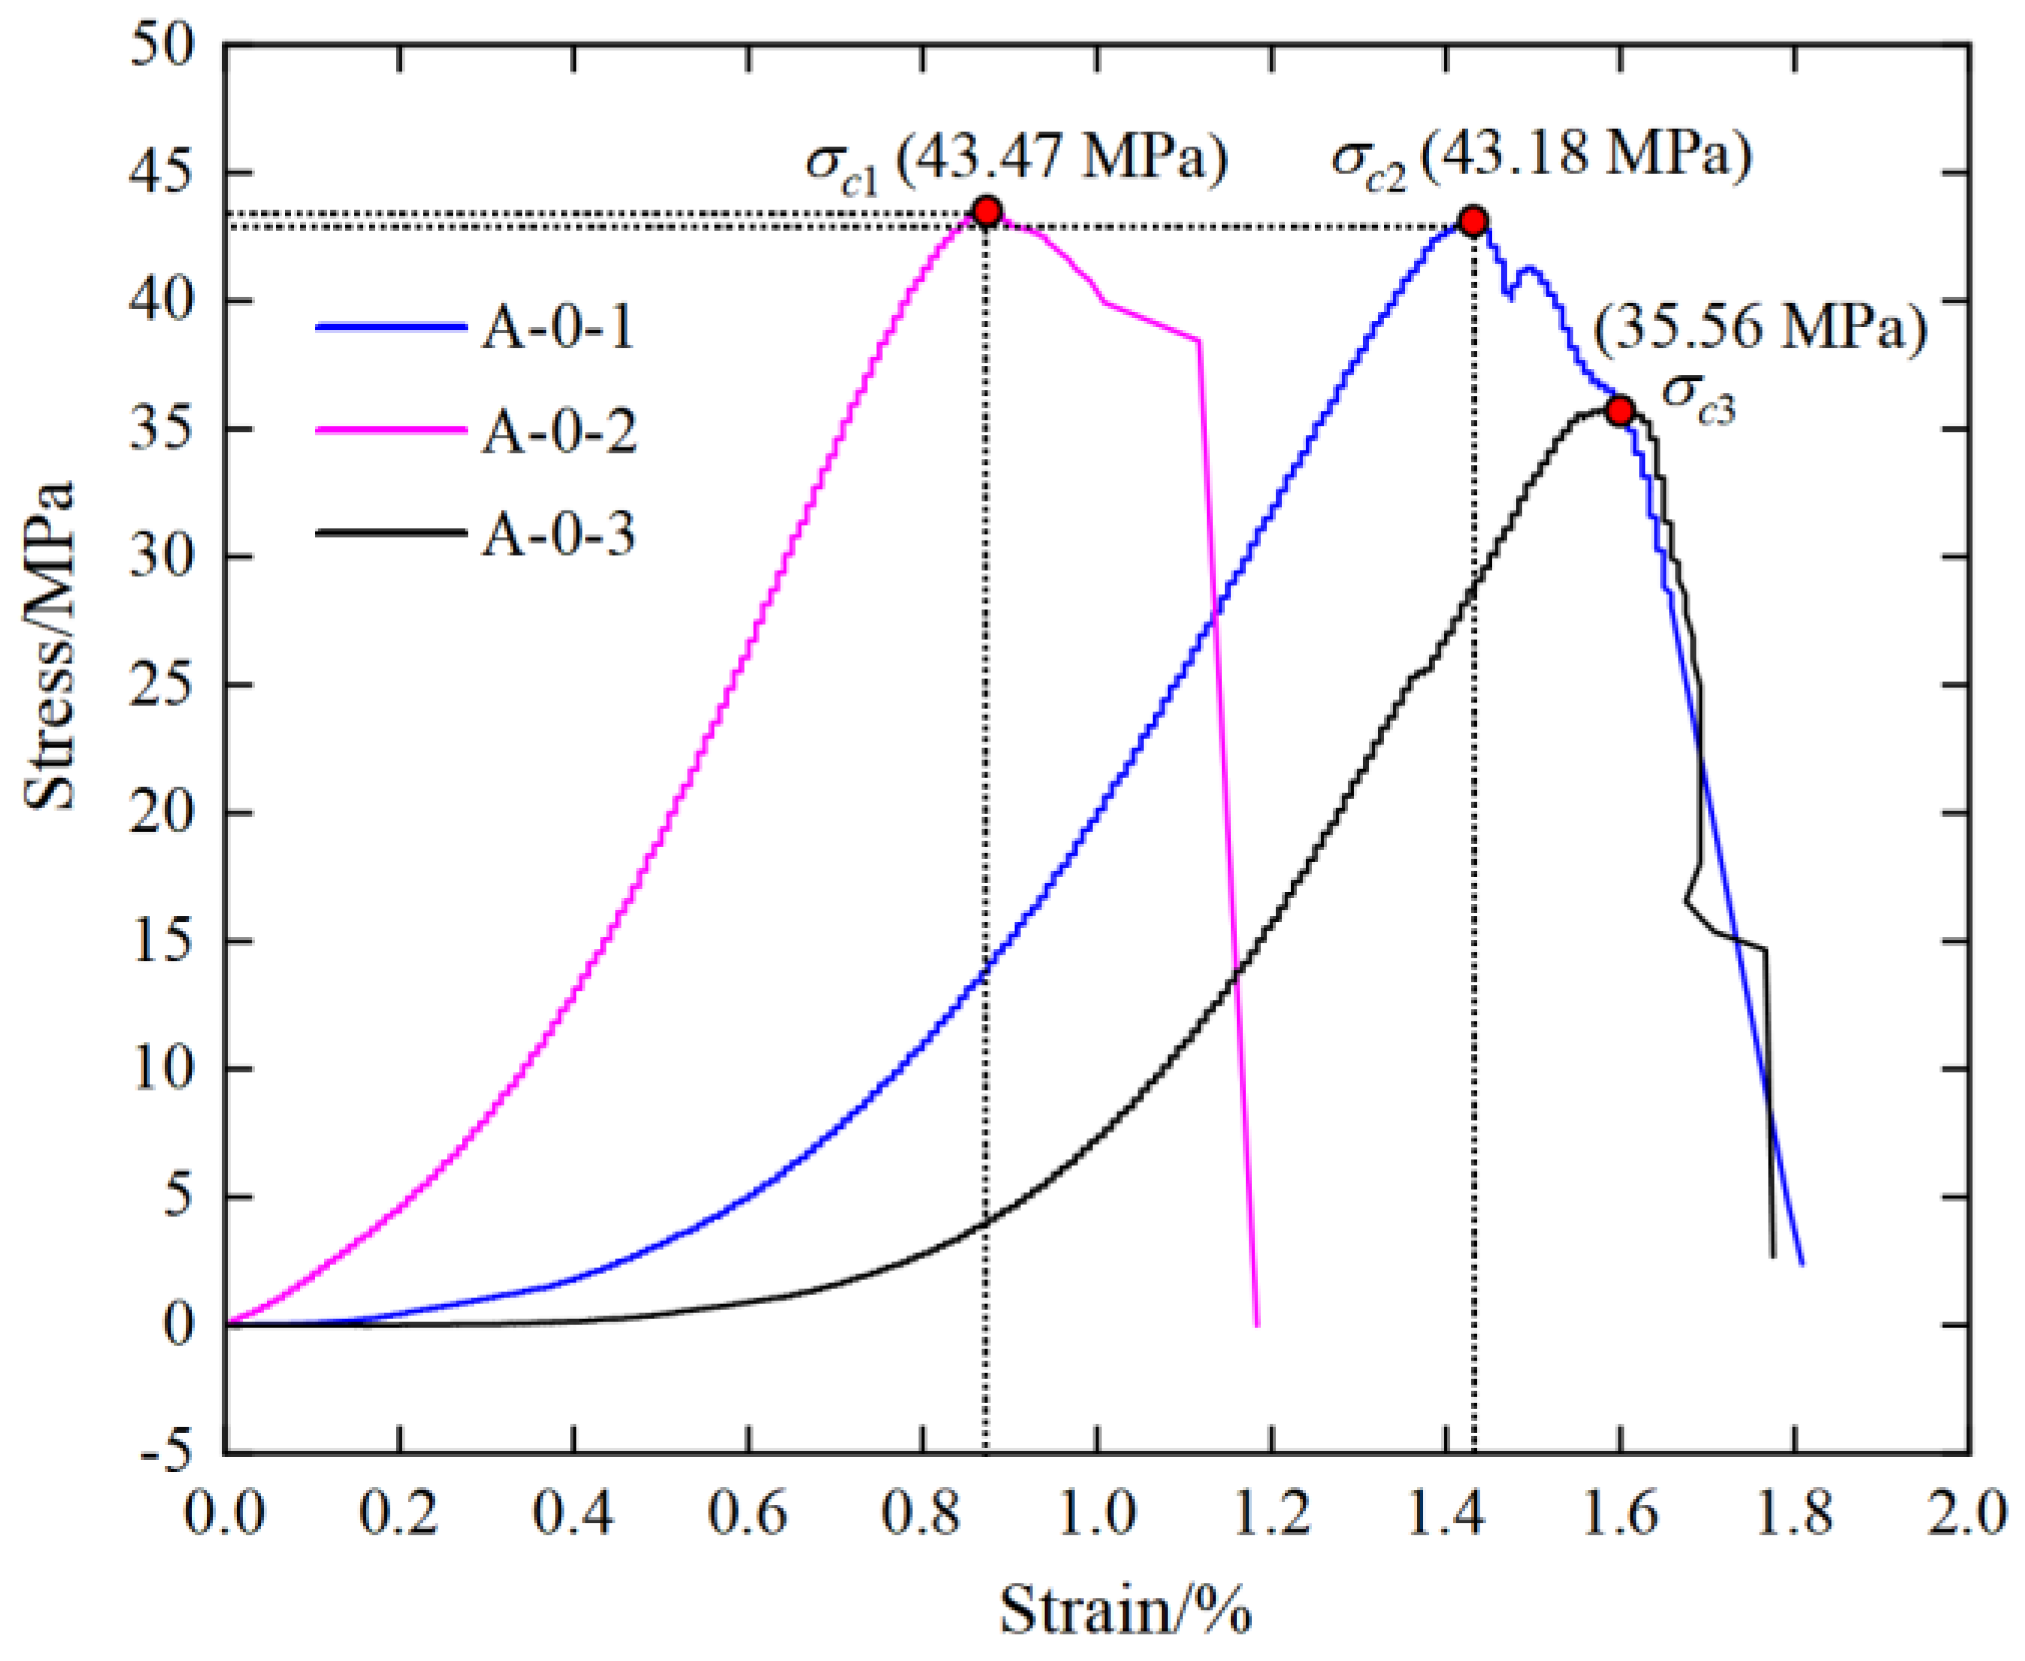
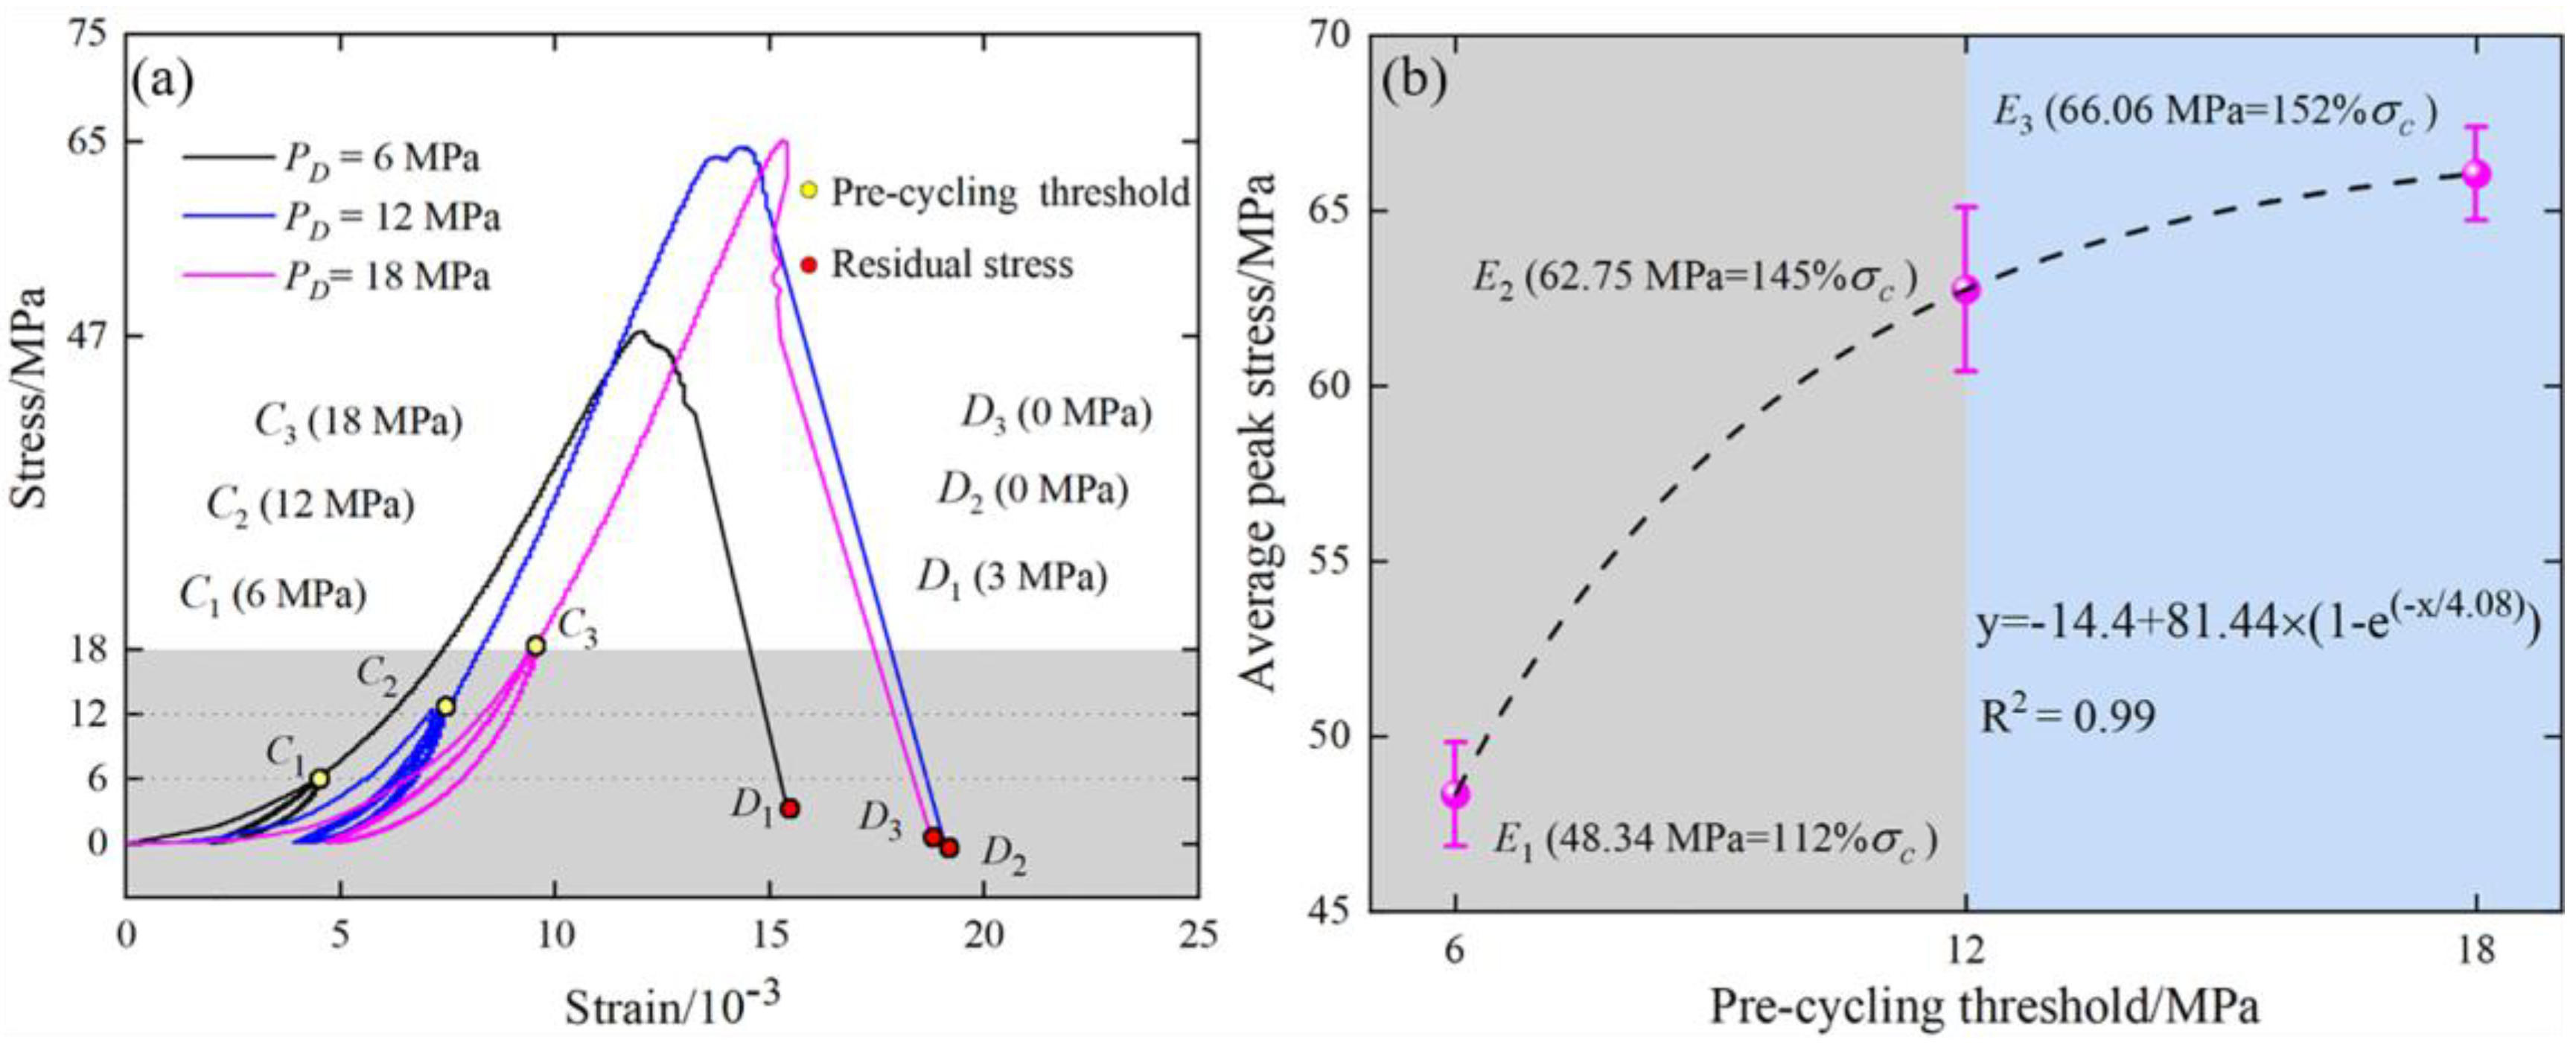
3.1. Strength Characteristics of Rock Samples with Burst Liability

Figure 4a shows the stress–strain curves of rock samples under pre-cycling thresholds. The hysteresis loop represented irreversible deformation caused by crack closure and development. It indicated that greater pre-cycling thresholds leaded to a faster accumulation rate of fatigue damage in rock samples.
Figure 4b shows the relationship between average peak stress and pre-cycling thresholds. The average peak stress increased exponentially with the pre-cycling thresholds. However, the increasing trend became gentle. It showed that the pre-cycling load had a stress-strengthening effect. However, the stress-strengthening effect was gradually weakened with the increase in pre-cycling thresholds. This was similar to results obtained by Wang et al. [36]. Wang et al. [36] believed that when the pre-cycling thresholds were less than 75% of the peak stress, the peak stress gradually increased with the pre-cycling thresholds. There were three main reasons for the phenomenon occurring in this study:
  • There was rock debris in rock samples in the disturbance stage during pre-cycling loading and unloading. After the rock debris filled primary pores in rock samples under pre-cycling load, the inter-pore density was enhanced. The compressive performance of rock samples was improved.
  • For rock samples, within the limiting closure stress of the original pore, pre-cycling thresholds could increase the bearing capacity of rock samples.
  • The maximum pre-cycling threshold was smaller than the damage threshold. Therefore, the accumulated fatigue was not enough to cause damage to rocks. Then, under the pre-cycling threshold, the uniaxial compressive strength (UCS) gradually increased with the pre-cycling threshold. As for the reason, it was explained that the compaction strengthening effect of the internal structure was prominent under the pre-cycling threshold. Moreover, the compaction degree was greater than the fatigue degree.

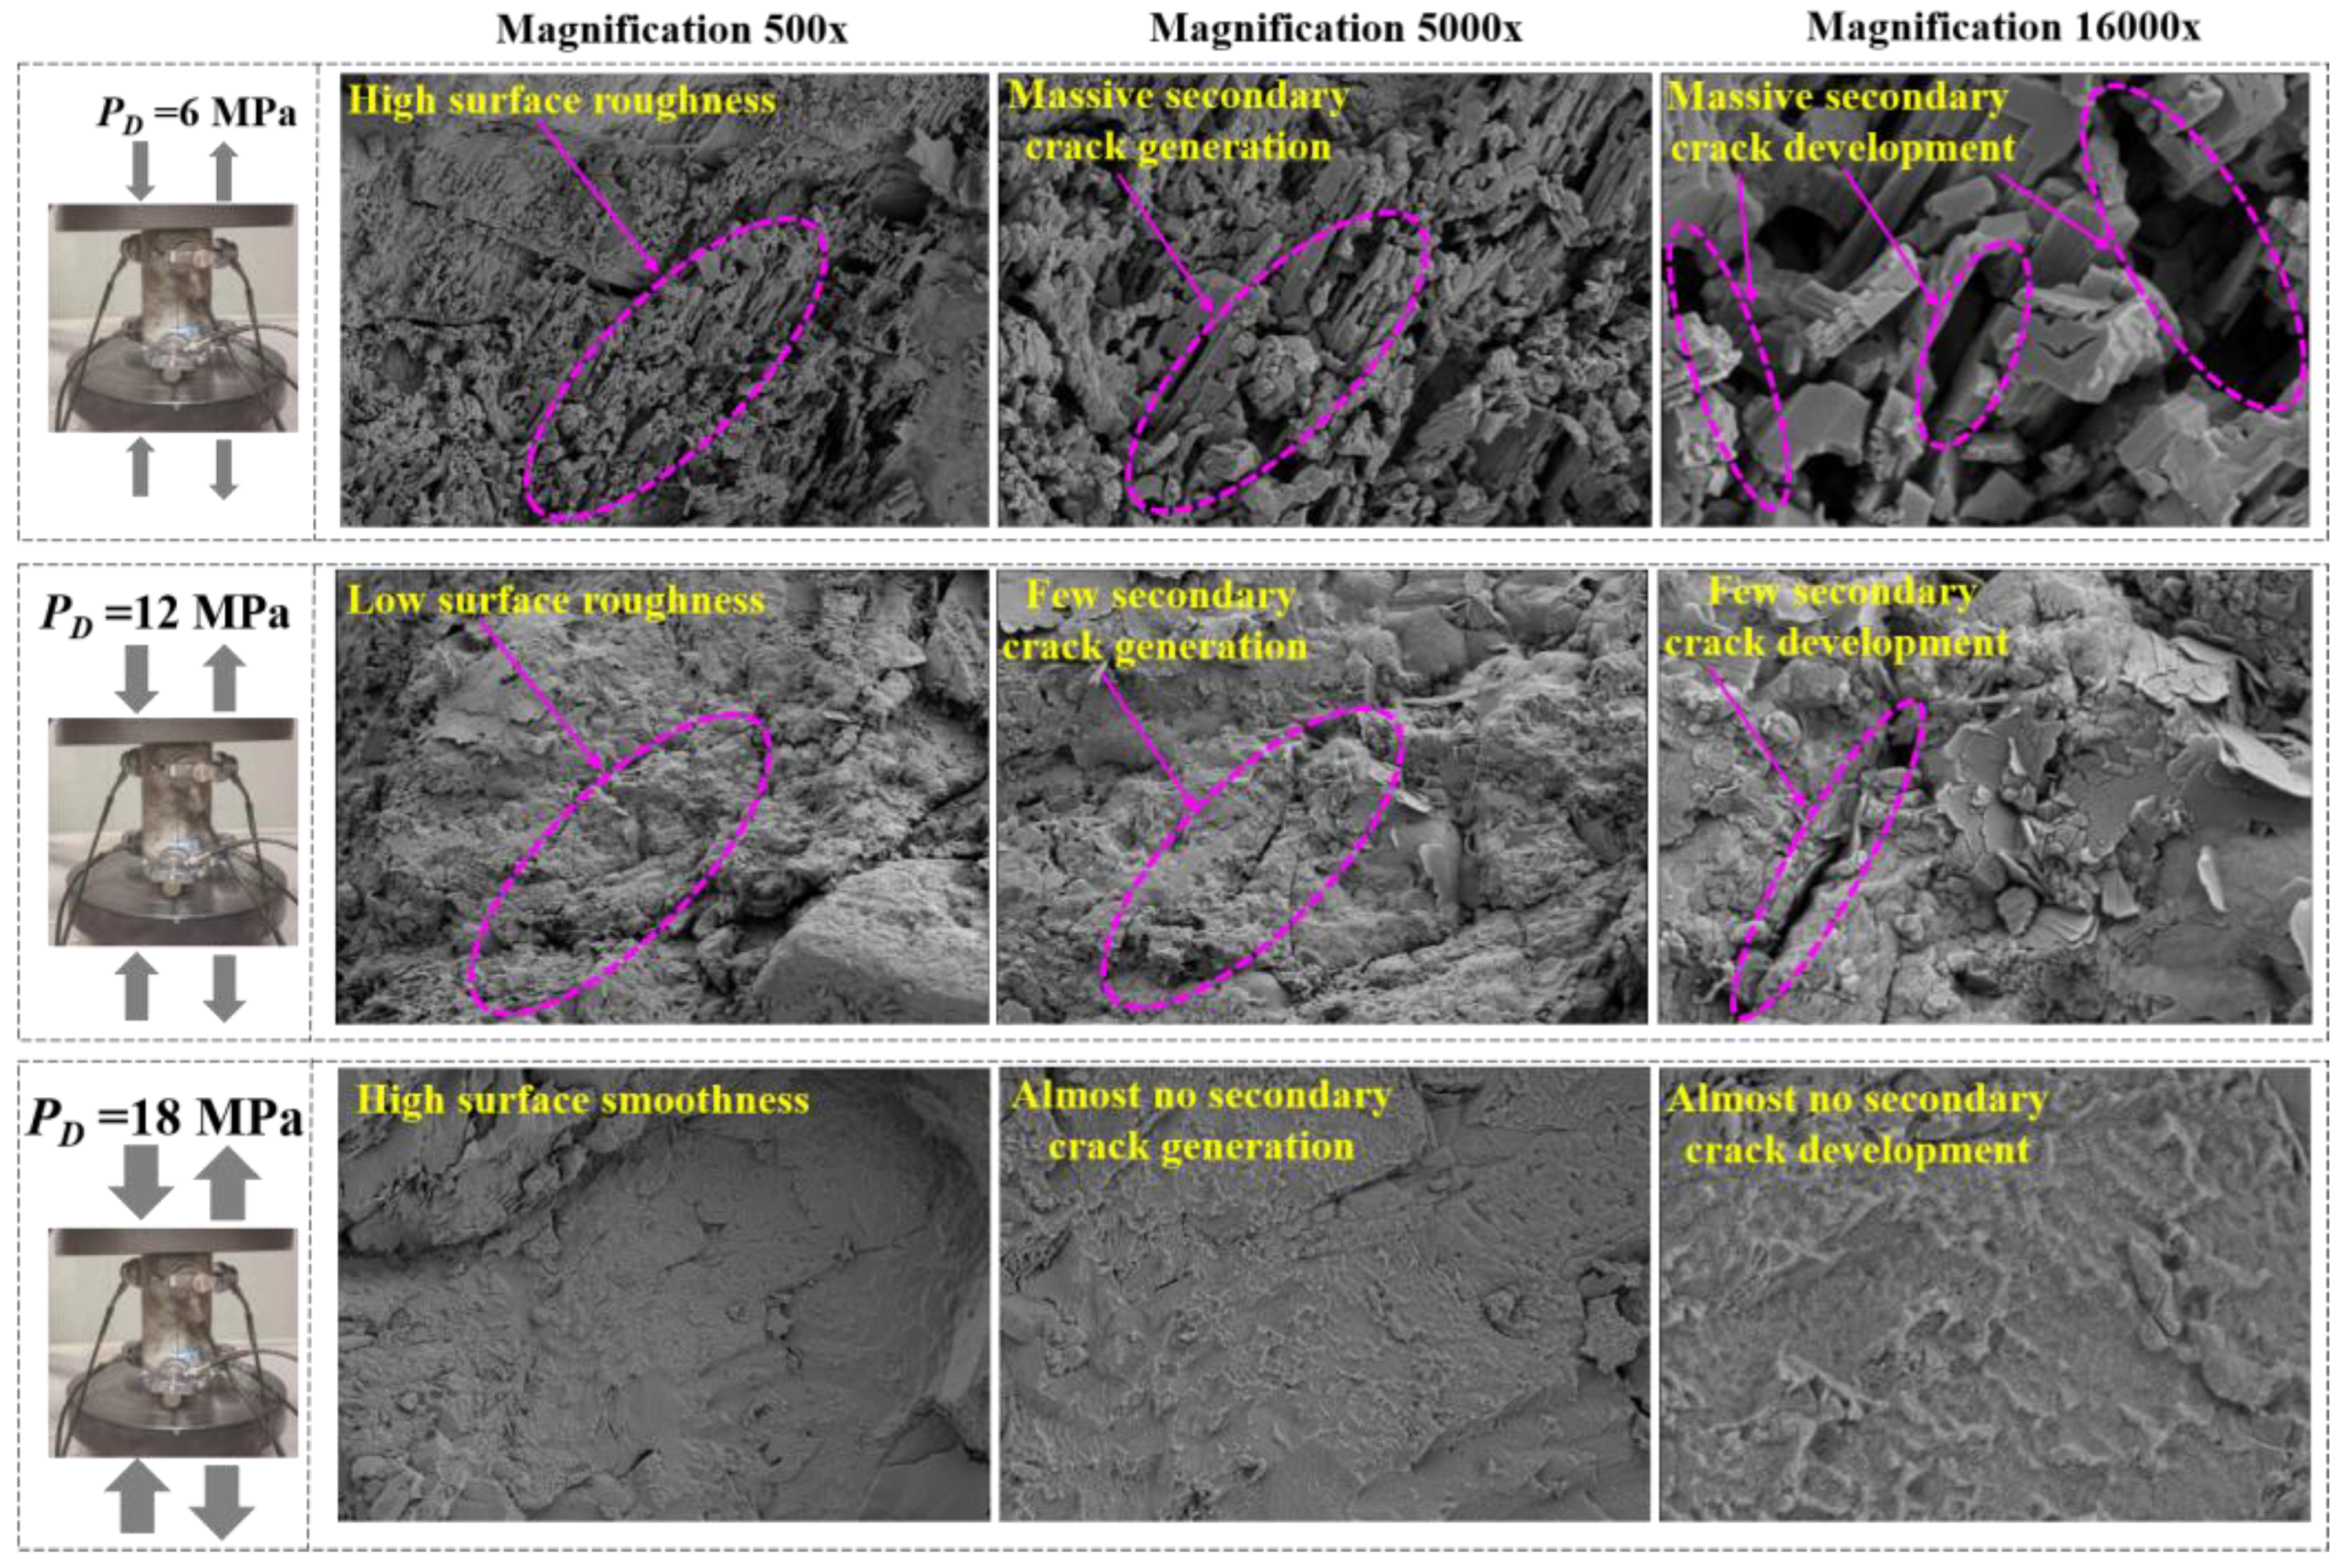
3.2. Microstructure Characteristics of Rock Samples with Burst Liability

With increasing pre-cycling thresholds, the surface roughness of rock samples gradually decreased. The number of secondary cracks gradually decreased (Figure 5). Additionally, the crack development phenomenon of rock samples gradually disappeared with increasing pre-cycling thresholds. This indicated that when pre-cycling thresholds were small, massive primary pores remained in rock samples after the pre-cycling loading and unloading ended. Therefore, the internal deterioration of rock samples was serious. For rock samples, the continuous loading would cause the repeated friction of internal structures along primary pore interfaces. This could destroy primary internal structures and weaken the bonding force between sample particles. Therefore, the surface roughness of rock samples was high, and the number of secondary cracks increased. Meanwhile, secondary crack generation and development were obvious after continuous loading. When the pre-cycling thresholds were large, the massive primary pores of rock samples closed after pre-cycling loading and unloading. Residual primary pores reduced. The bonding force between structural particles in rock samples was enhanced. The structural characteristics of rock samples became better. Massive elastic energies were stored within rock samples. This phenomenon was consistent with energy evolution laws of sandstones under cyclic loading and unloading which were obtained by Li et al. [37]. Li et al. [37] believed that massive elastic energies in rock sample pores were stored after they were compacted in the early stage of cyclic loading and unloading. Meanwhile, if rock samples continued to be loaded with a constant rate, massive elastic energies would be released through debris ejection and massive spalling. Therefore, rock samples would be destroyed and become unstable instantly.

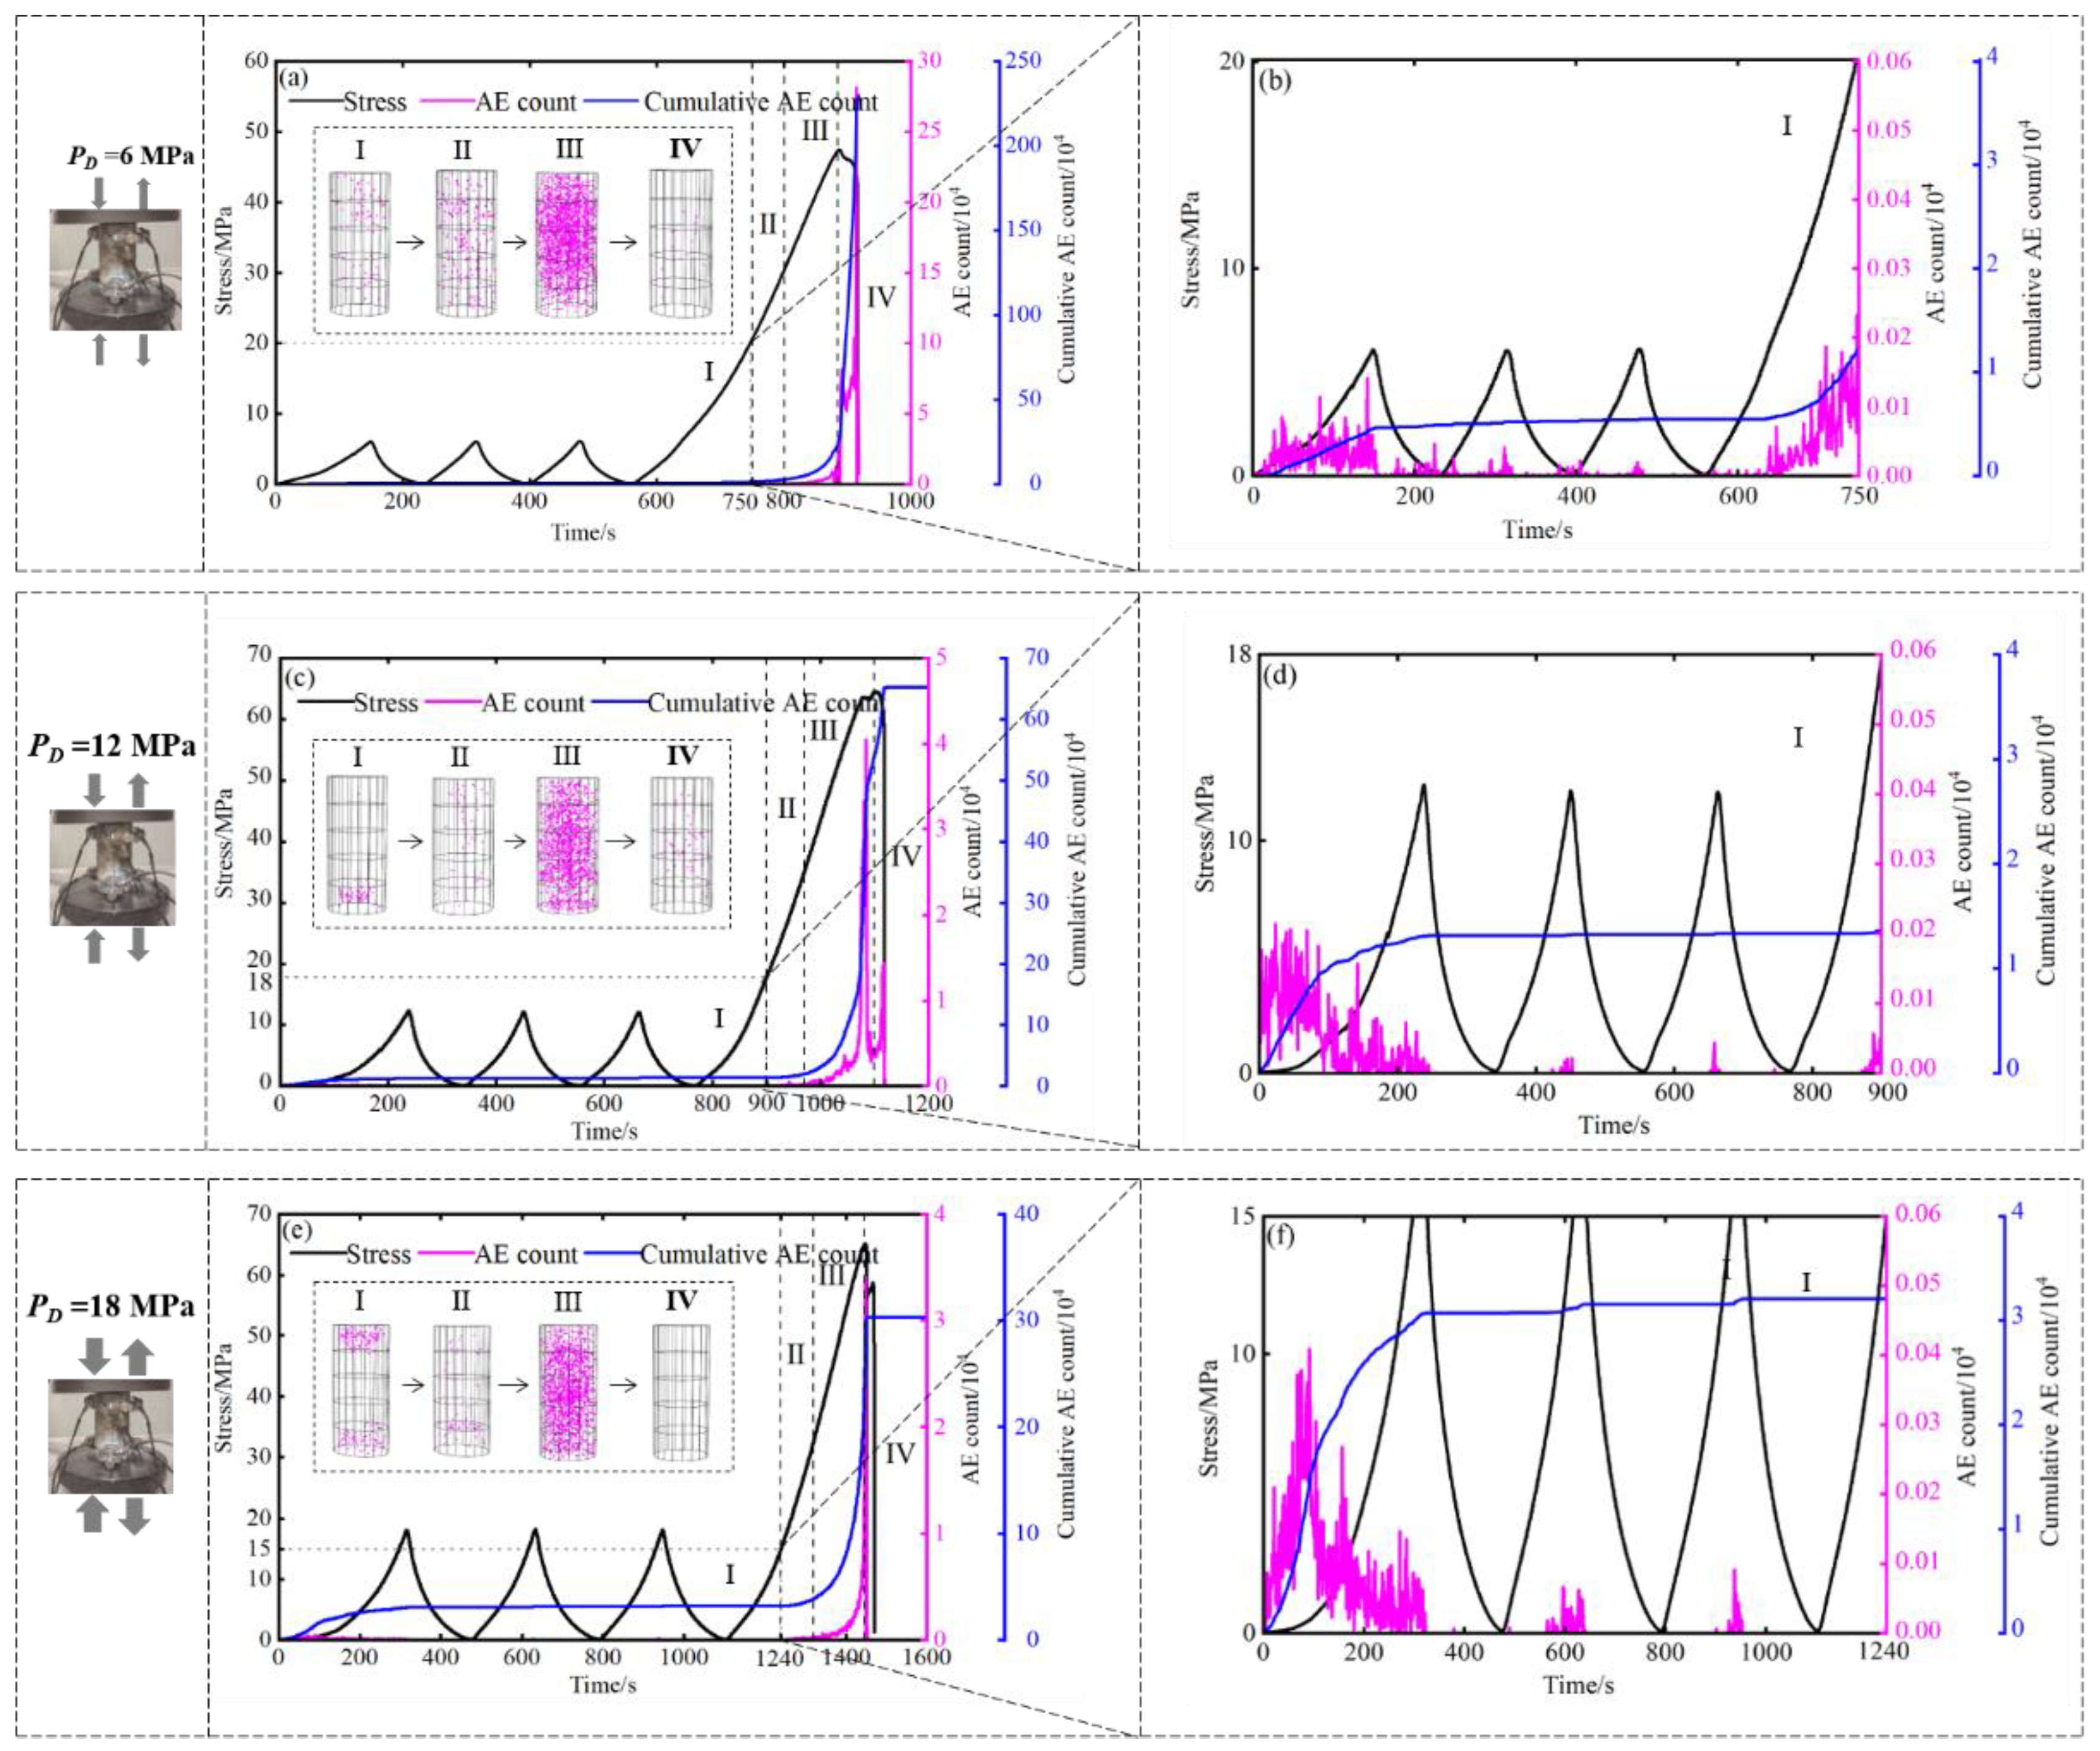
3.3. AE Signal Characteristics of Rock Samples with Burst Liability

Figure 6 shows AE signal characteristics of rock samples with burst liability. Different pre-cycling thresholds had a certain effect on AE count and cumulative AE count. The AE count and cumulative AE count were different in details. However, their evolution trends were basically consistent. The AE count and cumulative AE count showed the same changing trend: slow increase → gentle development → sharp rise. The sub-figures in Figure 6a,c,e are the AE failure source location in each stage under different pre-cycling thresholds. Pink dots were used to represent the failure dislocation of rock samples.
AE signals can reflect crack generation and development of rock sample failure. The evolution trend obviously corresponded to the deformation and stress changes of rock samples during the loading process [38]. Based on AE frequency differences, Wu et al. [39] divided the stress state curves of rock samples into the compaction stage, elastic stage, plastic stage and post-peak stage. Wang and Yuan [40] divided stress–strain curves into the compaction stage, elastic stage, stable crack growth stage, unstable crack growth stage and post-peak failure stage. Based on the evolution characteristics of stress–strain curves, Liu et al. [41] divided the stress–time curves of rock samples into the compaction stage, elastic stage, accelerated failure stage and complete failure stage.
Based on above research results, the stress–time curves of rock samples were divided into four stages. Stage I was the compaction stage. Stage II was the elastic stage. Stage III was the crack development stage. Stage IV was the failure stage (Figure 6). The mechanical properties of the stress–time curves under each pre-cycling threshold were further analysed.
(1)
Compaction stage (I)
Primary pores of rock samples were compacted by load. The primary pore opening decreased with the increasing load. For rock samples, the AE count and cumulative AE count in the first cyclic loading and unloading stage gradually increased with the increasing pre-cycling thresholds (Figure 6b,d,f). The trend was convex. Additionally, the AE count and cumulative AE count in the loading stage were significantly greater than those in the unloading stage. This indicated that crystal particles of rock samples underwent dislocation and extrusion during the loading stage. The primary pore closure effect was significant. The bonding force between crystal particles increased.
(2)
Elastic stage (II)
The curve was approximately linear. The stress increased linearly with the increasing time. AE signals were generated in the elastic stage. However, AE signals were scarce (Figure 6a,c,e). It showed that AE signals could still be detected after primary pores were not completely compacted in the compaction stage.
(3)
Crack development stage (III)
When the stress reached the stress level of the secondary crack development, plastic deformation occurred. Rock samples changed from the elastic state to the nonlinear plastic state. The nonlinear plastic hardening phenomenon was obvious. The AE count and cumulative AE count showed a surge trend with the increasing time (Figure 6a,c,e). It showed that the increasing rate of dissipated energy accelerated in stage III [42]. Secondary cracks accelerated the development under the influence of energy. It caused a rapid deterioration of the crystal particle bonding ability in rock samples. Meanwhile, the load bearing performance decreased.
(4)
Failure stage (IV)
A rapid stress decreasing trend was obvious. Several AE counts and pink points were generated in stage IV. It showed that the AE activity was not active and AE signals decreased rapidly in this stage. Therefore, the instability failure of rock samples occurred.

3.4. The Kaiser Effect Characteristics of Rock Samples with Burst Liability

Figure 7 shows the evolution characteristics of the Kaiser effect. “Stage A” represented the first pre-cycling loading and unloading stage. “Stage B” represented the second pre-cycling loading and unloading stage. “Stage C” represented the third pre-cycling loading and unloading stage. “Stage D” represented the continuous loading stage. Under each pre-cycling threshold, AE signals showed a trend of rapid growth, rapid decline and sharp rise as time increased. There were almost no AE signals in stage B. Additionally, under each pre-cycling threshold, no macroscopic secondary cracks were generated in rock samples during pre-cycling loading and unloading. The secondary crack development and rock sample failure were obvious during continuous loading.
AE signals were not generated when stress was below the previous maximum stress. This phenomenon was called the Kaiser effect [43]. To clarify the Kaiser effect points, Shi et al. [44] identified the Kaiser effect points based on the DRA (Deformation Rate Analysis) method. Zhao et al. [45] proposed a method to judge the Kaiser effect points by the correlation dimension of the G-P algorithm.
Therefore, based on previous research, the Kaiser effect existed in stage B and stage C. It indicated that rock samples had a loaded history memory. Before reaching the maximum pre-cycling stress, particles in rock samples did not slip. Meanwhile, secondary cracks did not develop. After the pre-cycling loading and unloading stage ended, rock samples were continuously loaded. When the load stress was greater than the pre-cycling stress, AE signals increased rapidly and AE signal activity was active. This indicated that the Kaiser effect disappeared and secondary cracks developed significantly in this stage.

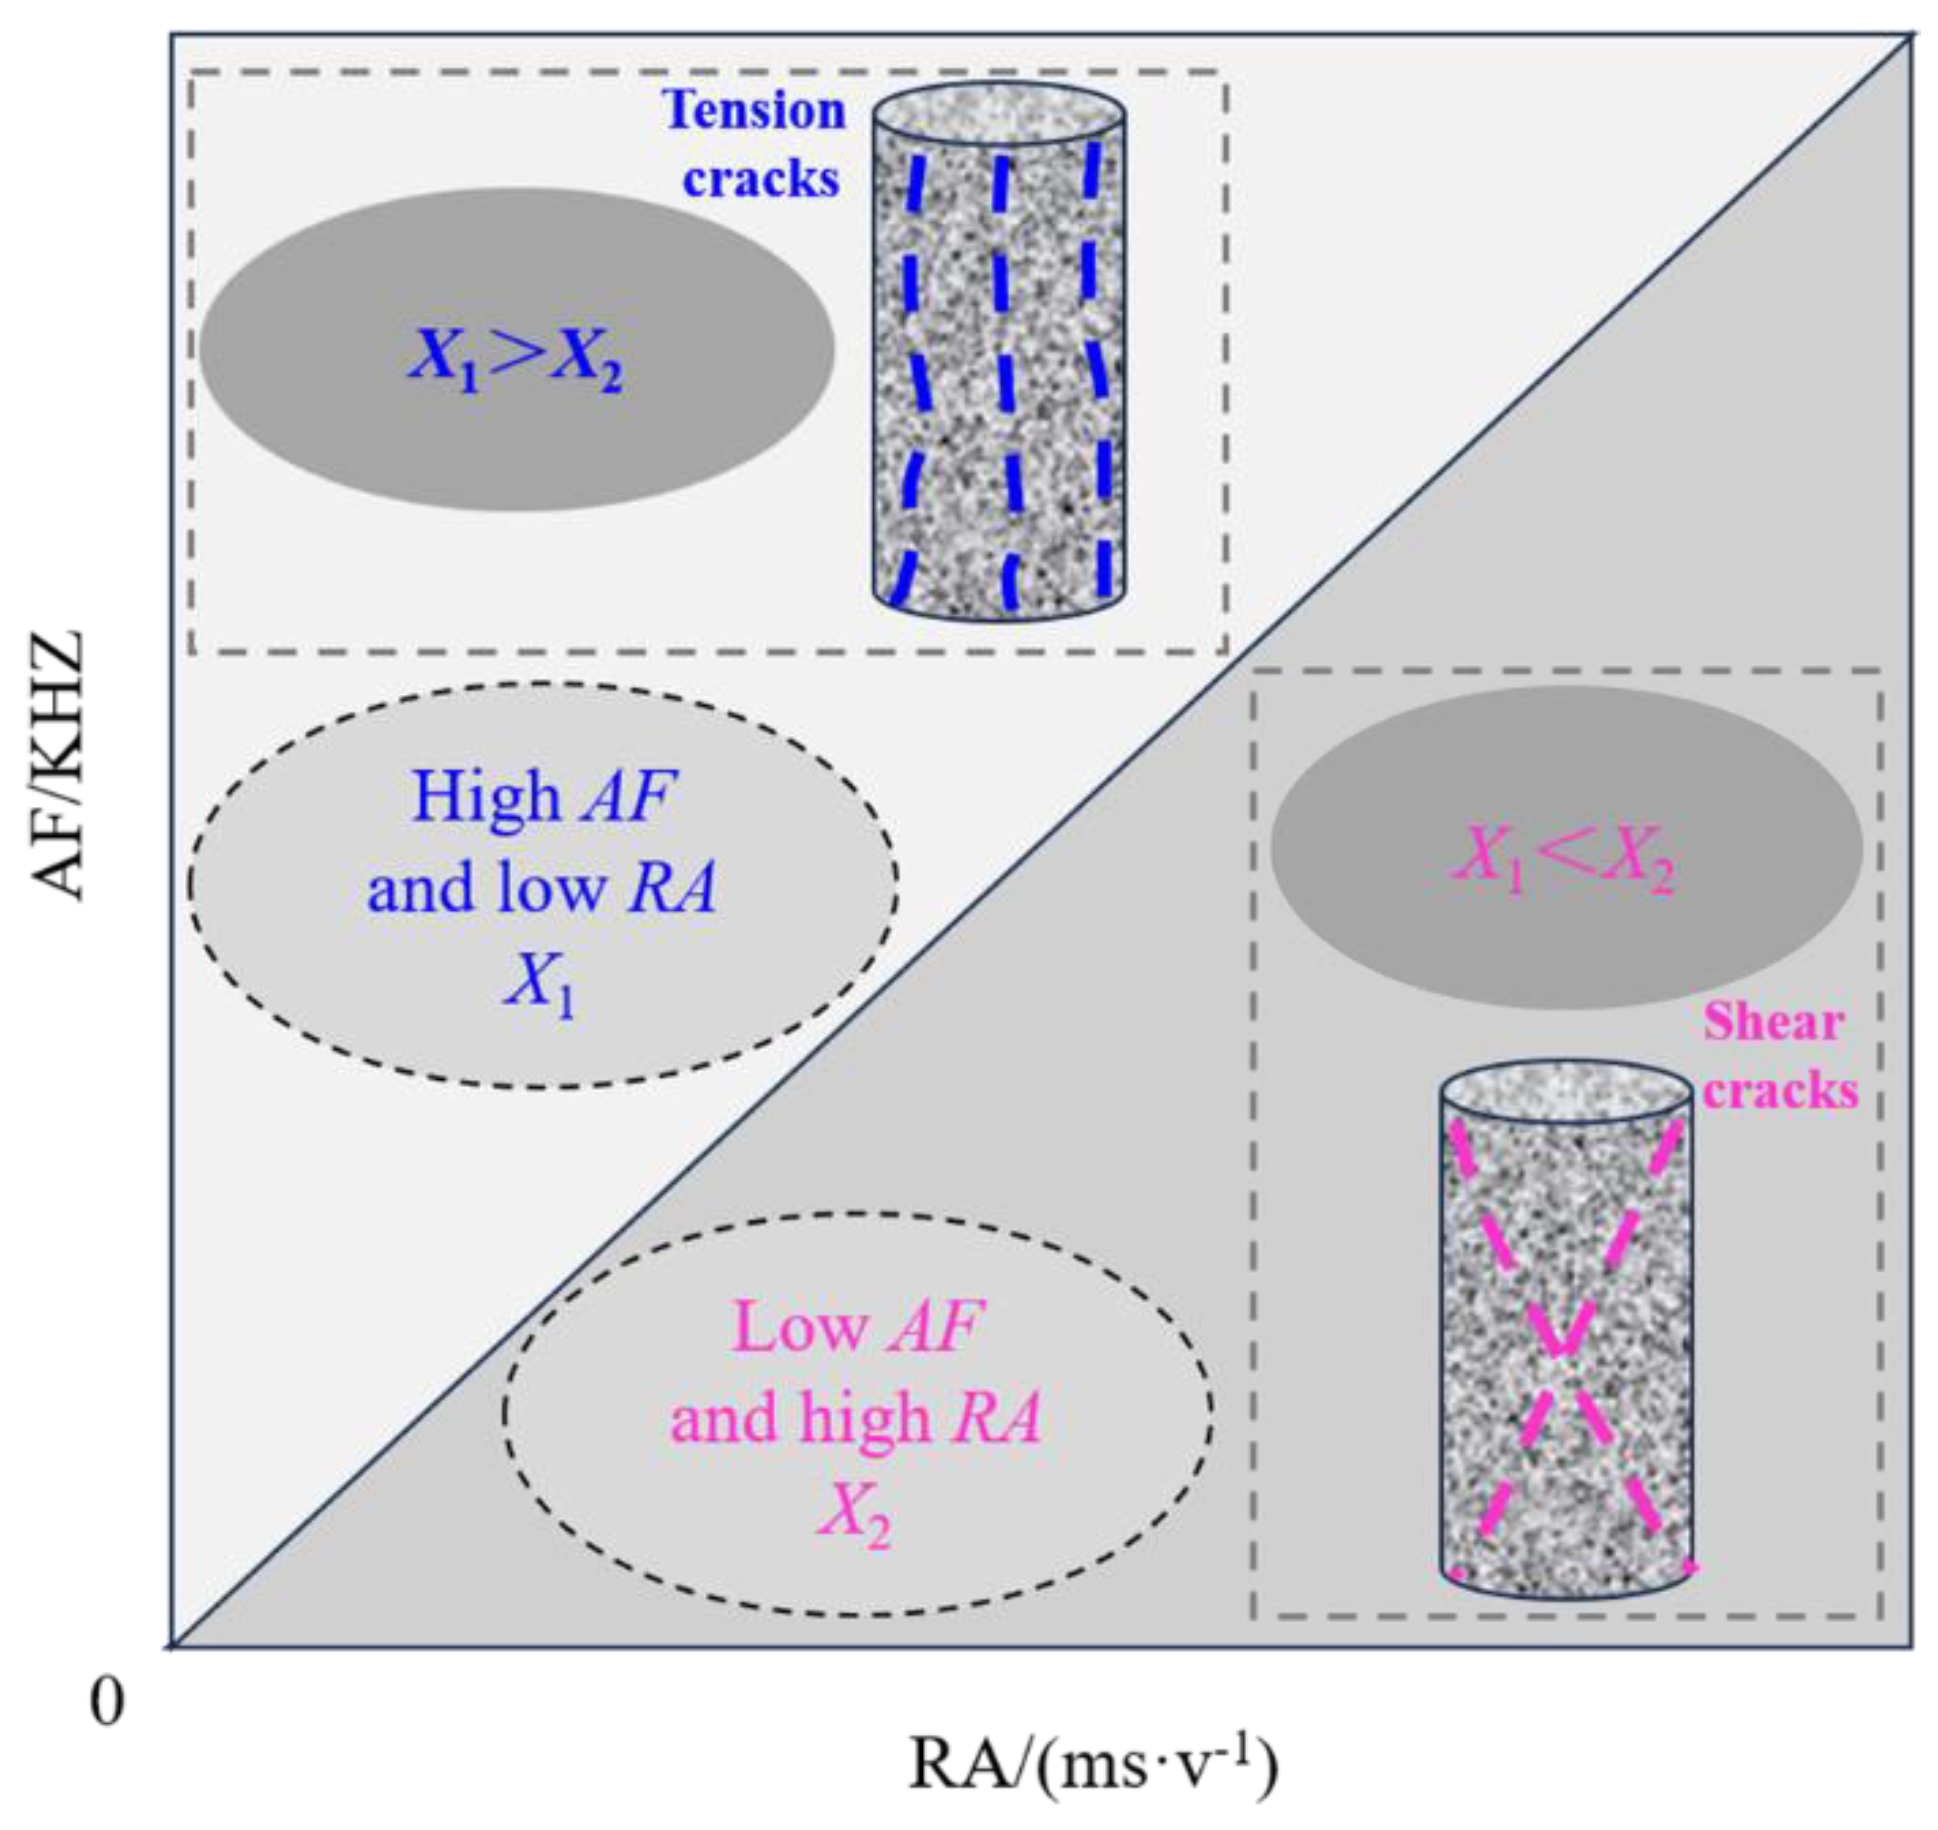
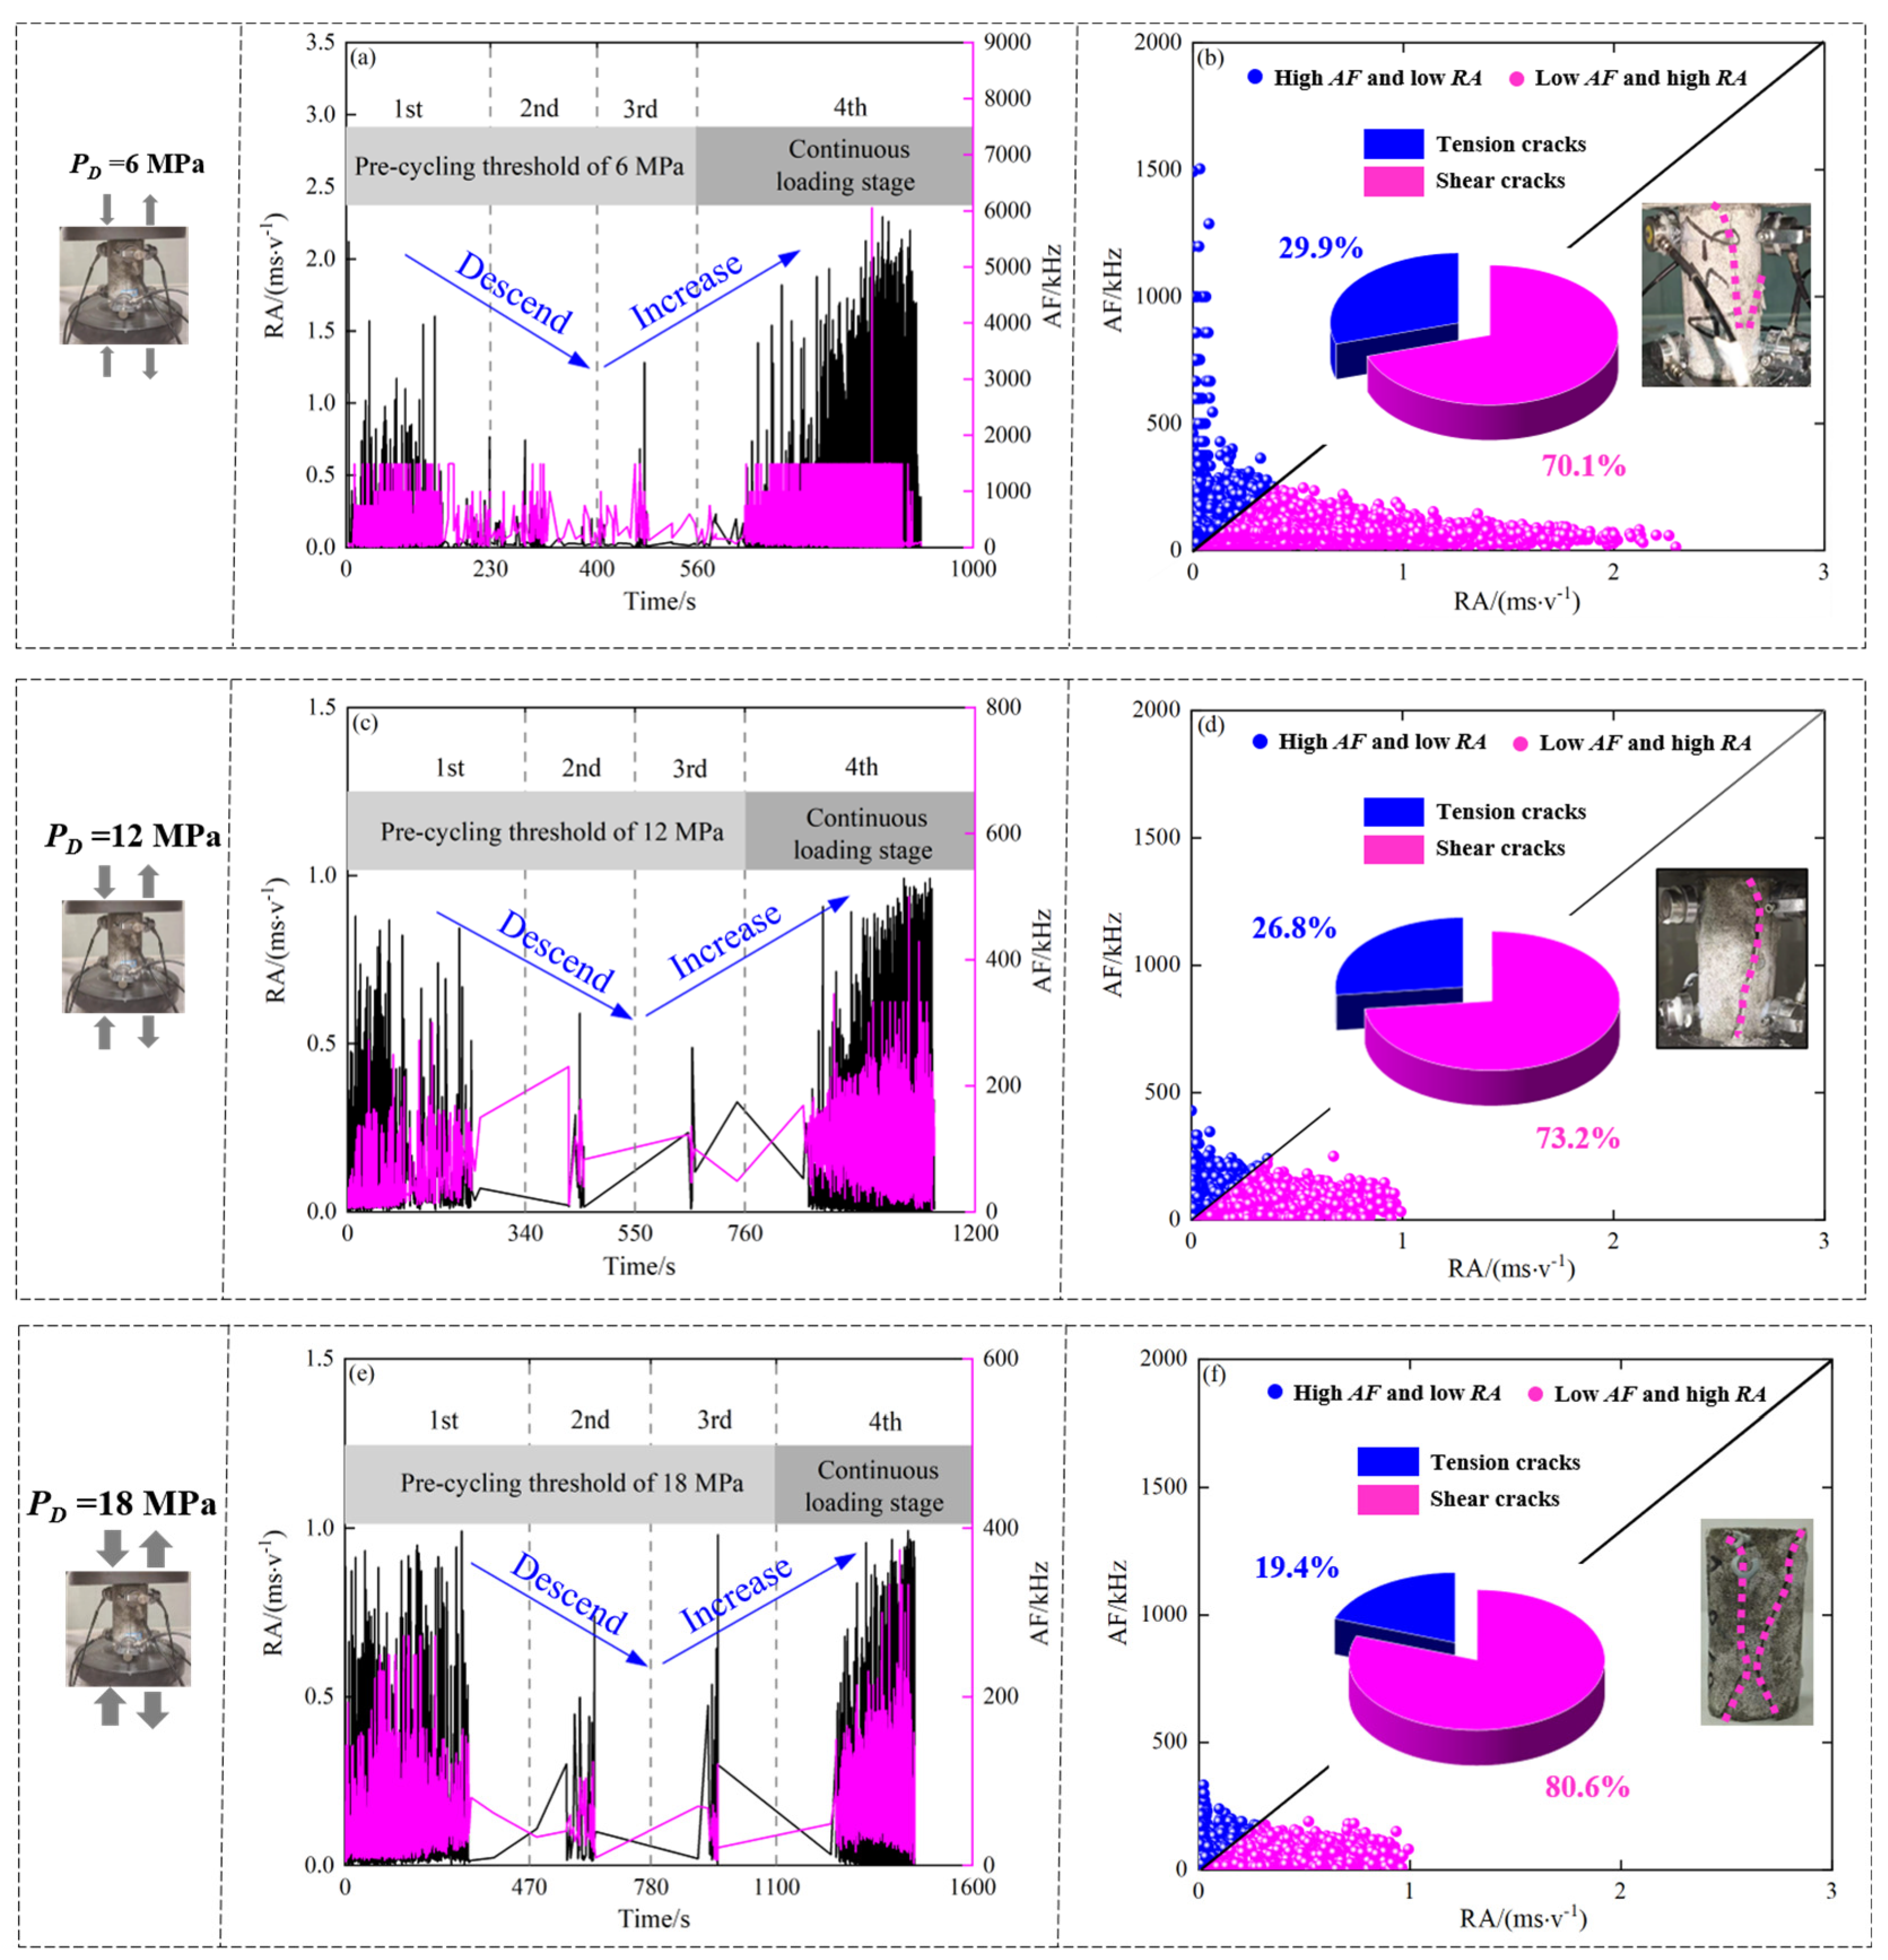
3.5. AF-RA Characteristics of Rock Samples with Burst Liability

RA was obtained based on rise time (T1) and AE amplitude (F). AF was obtained based on AE count (Z) and duration time (T2) [46]. AF-RA could characterise the development and evolution of cracks under pre-cycling loading and unloading. When the proportion between low AF and high RA (X2) was greater than that between high AF and low RA (X1), shear cracks developed. It caused shear failure. Otherwise, tension failure occurred [47] (Figure 8).
Figure 9a,c,e show that AF-RA decreased first and then increased with the increasing time. Additionally, the AF-RA distribution was different in different time periods. It was mainly distributed in stage A and stage D. The distribution form was “dense-sparse-dense”. In stage A, the AF-RA distribution was concentrated. However, the AF-RA value was small. AF was mainly distributed between 0 and 1500 kHz. RA was mainly distributed between 0 and 1.6 ms/v. The main reasons were friction and slippage between microparticles in rock samples. AF-RA was sparsely distributed in stage B and stage C. It was due to the Kaiser effect. AE signals were not active. AF-RA was widely and intensively distributed in stage D. AF was mainly distributed between 0 and 6000 kHz. RA was mainly distributed between 0 and 2.2 ms/v. In this stage, massive AE signals increased sharply, and highly frequent AE signals were generated. The AF value increased by 75%, and the RA increased by 27.3%. It showed that, with the increasing stress, the plastic deformation characteristics of rock samples became more prominent.
Additionally, Figure 9a had the largest AF-RA. Figure 9c had the second largest AF-RA. Figure 9b had the smallest AF-RA value. It indicated that the structural mechanical properties of rock samples were improved when the pre-cycling threshold was 18 MPa. However, AE signals were still not positive when the loading stress increased near the peak stress. Low frequent signals were mostly distributed. However, under this condition, secondary cracks of rock samples could still develop rapidly to form macro failure surfaces.
Figure 9b,d,f show the AF-RA distribution of each pre-cycling threshold. Figure 9b shows 70.1% > 20.9%. This indicated that shear cracks developed and shear failure occurred. The main reasons were that the weak surface existed in the middle and lower parts of rock samples under pre-cycling loading and unloading. Meanwhile, secondary cracks developed. With the increasing loading stress, secondary cracks of rock samples extended to the upper end to form two macroscopic cracks. Therefore, shear failure was predominant in rock samples.
Figure 9d shows 73.2% > 26.8%. This indicated that the shear crack distribution was concentrated. Therefore, shear failure occurred in rock samples. After rock samples entered the crack generation stage, due to the significant Poisson effect in the middle section of rock samples, secondary cracks were generated first to form low-strength slip zones. When the loading stress was near the peak stress, secondary cracks developed to form a left low-strength slip zone. Shear failure occurred. Meanwhile, massive debris particles and stripping were generated.
Figure 9f shows 80.6% > 19.4%. This indicated that the distribution density of shear cracks was dense. Shear failure occurred in rock samples. The main reasons were that secondary cracks developed to the upper and lower terminals of rock samples. Due to the serious damage of the weak surface in the middle and lower parts, shear cracks crossed the weak surface, forming an “X”-shaped distribution. Additionally, due to the rock sample anisotropy, shear cracks did not develop linearly. It caused shear failure along the “X”-shaped shear cracks.

4. Discussion

In deep mining, the periodic failure of the main roof will cause loading and unloading impact on rock pillars. It directly affects mechanical behaviour and long-term stability of rock mass. Pre-cycling loading experiments can simulate actual conditions and reflect the mechanical response of rocks under the complex stress path. By setting different pre-cycling thresholds, the mechanical behaviour characteristics of rocks under different pre-cycling thresholds were studied. Meanwhile, during the process from microstructural changes to macroscopic failure, the evolution mechanism was revealed.
Burst liability is an inherent property of rocks during instantaneous energy releasing under disturbance. It is a necessary condition to induce rock burst. Pre-cycling loading can improve compressive properties of rocks through closing primary pores and enhancing the intergranular bonding force. However, this also causes an increasing in elastic energy storage. When the loading stress exceeds the pre-cycling threshold, energy storage is released rapidly. Meanwhile, shear failure occurs in rocks. This phenomenon is consistent with the failure process of deep rock mass under periodic pressure. It indicates that pre-cycling loading experiments can effectively simulate the rock burst evolution process. Unconfined pre-cycling loading was used because it simplified experimental conditions. It focused on the independent influence of the pre-cycling threshold on the mechanical response. Although the actual deep rock mass was in a confined condition, in this experimental design, the confining pressure variable was removed based on uniaxial loading conditions. Meanwhile, the direct correlation between pre-cycling threshold parameters and rock strength was clarified. It provided a theoretical foundation for the subsequent triaxial loading experiment and in-situ stress field coupling analysis [48]. Based on this study, further research will be conducted with triaxial tests to evaluate the performance of rocks under confined conditions. It simulates in situ confined stress conditions. Vasyliev et al. [49] suggested analytical graphic techniques ensure consistency in compressive strength and elastic modulus parameters for rocks with burst liability. Winkler et al. [50] utilised uniaxial compression analytical solutions to study the transverse isotropic parameter impact on elastic strain distribution. Skrzypkowski et al. [51] linked goaf collapses to abutment load increases and burst risks. It emphasised the understanding of mechanical performance for disaster prevention. The bending energy index may be influenced by mineral composition, such as quartz content and cement type. It evaluated sandstone burst liability, with rock brittleness, tensile strength and energy storage capacity affecting instantaneous energy release. Although the dynamic loading effect was not studied, it theoretically accelerated crack propagation and energy outburst. Therefore, further dynamic experiments and mineral analysis will be conducted. Three pre-cycling thresholds (6 MPa, 12 MPa and 18 MPa) revealed peak strength evolution with negative exponential growth. It indicated a diminishing strengthening effect. No clear critical threshold for mechanical degradation was observed. Therefore, further intensive experiments should be conducted. Moreover, further research will be performed to correlate critical thresholds with sample properties based on experimental tests and numerical simulations [52]. This study addressed previous limitations by analysing multiple thresholds, characterising shear failure via the AF-RA distribution and identifying the Kaiser effect disappearance during continuous loading. It offered a theoretical foundation for threshold warning systems.

5. Conclusions

This paper conducted the research on sandstones with burst liability. The strength characteristics, microstructure characteristics, Kaiser effect characteristics and AF-RA characteristics of sandstones were obtained. These characteristics are significant for preventing and controlling rock burst. By sorting and analysing experimental data, the following conclusions were summarised:
(1)
The average peak stress increased linearly with the increasing pre-cycling thresholds. However, the increasing trend became gentle. The stress-strengthening effect was gradually weakened with the increasing pre-cycling threshold.
(2)
With the increasing pre-cycling threshold, the surface roughness of rock samples gradually decreased. The number of secondary cracks gradually decreased. Additionally, the crack development phenomenon of rock samples gradually disappeared with the increasing pre-cycling threshold.
(3)
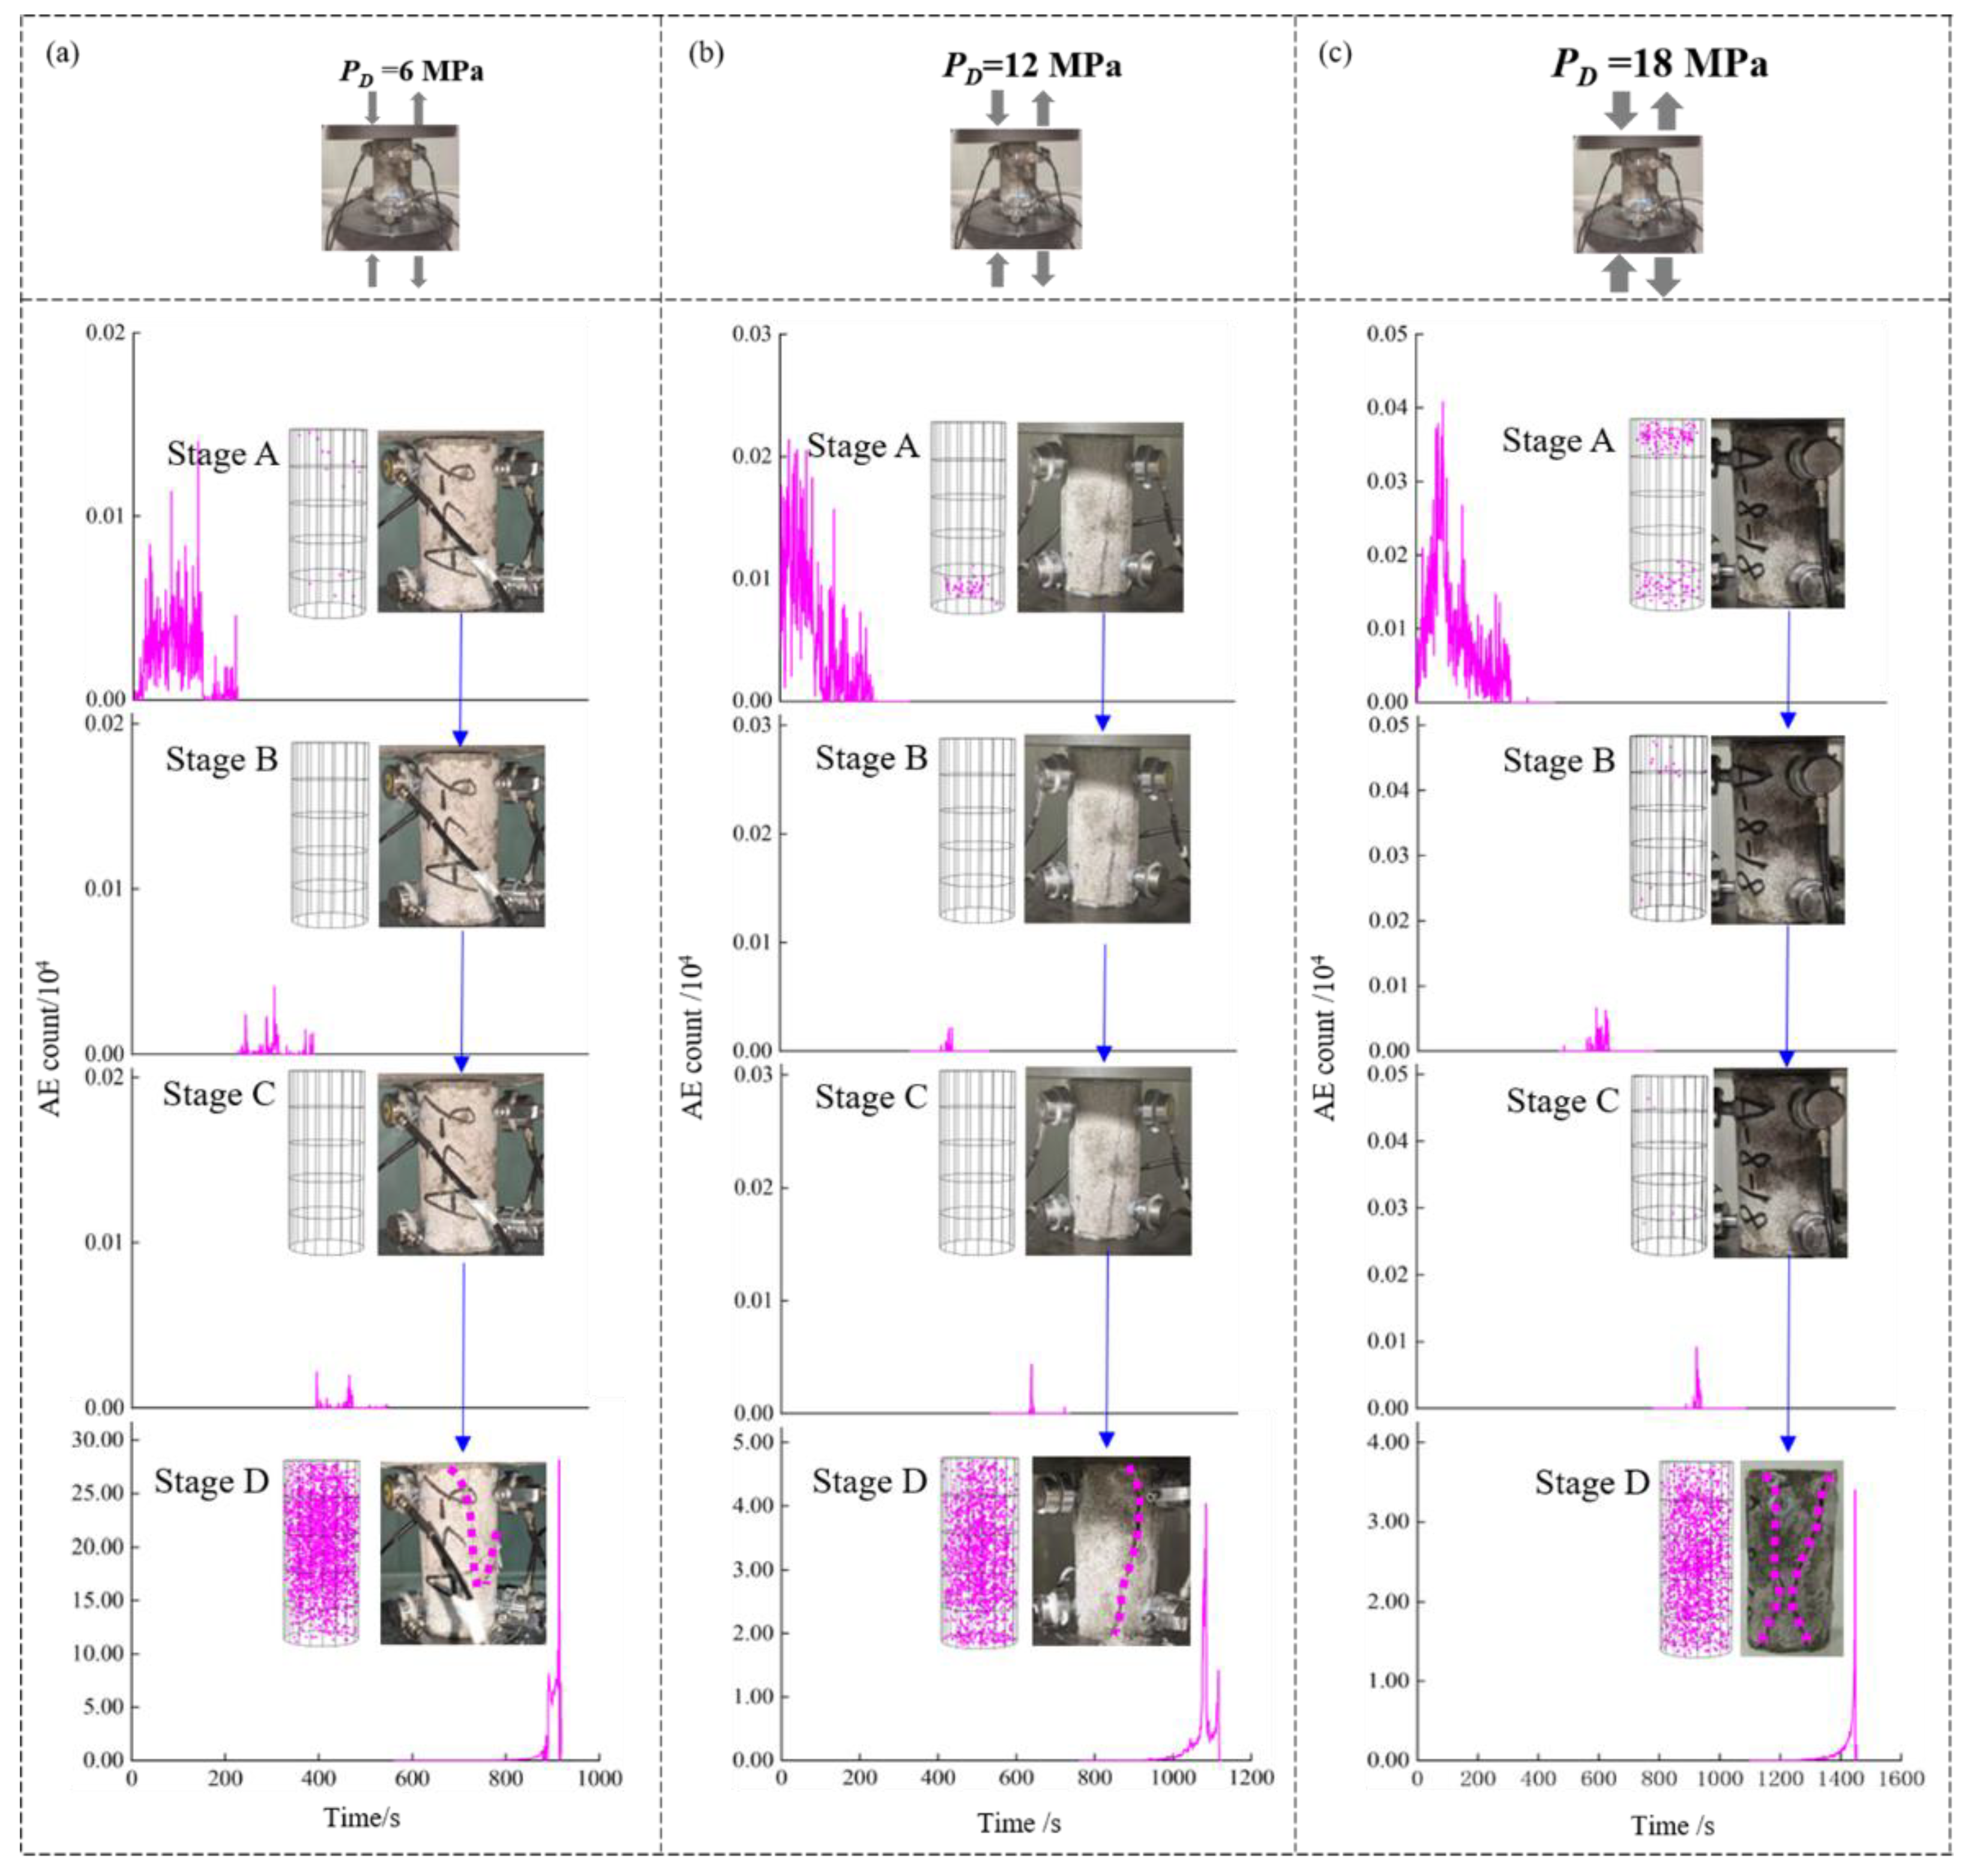
Under each pre-cycling threshold, AE signals show an initial rapid growth trend, a rapid decline trend and a final sharp rise trend with the increasing time. There was almost no AE signal in stage B. Under each pre-cycling threshold, no macroscopic secondary crack was generated in rock samples during pre-cycling loading and unloading.
(4)
AF-RA decreased first and then increased with the increasing time. The AF-RA distribution was different in different time periods. It was mainly distributed in stage A and stage D. The distribution form was “dense-sparse-dense”.

Author Contributions

Funding acquisition, supervision, validation and writing, K.S., K.Z., A.Z. and Z.R.; writing and investigation, J.C., B.Z. and W.X.; writing and conceptualisation: K.W. All authors have read and agreed to the published version of the manuscript.

Funding

It is funded by the National Natural Science Foundation of China (52174093 and 52034009) and Fundamental Research Funds for the Central Universities (2024ZKPYNY01, 2023ZKPYNY03 and 2023YQTD02).

Institutional Review Board Statement

Not applicable.

Informed Consent Statement

Not applicable.

Data Availability Statement

Data can be provided upon the request to the correspondence authors.

Conflicts of Interest

The authors declare no conflicts of interest.

References

  1. Cui, F.; Zhang, S.; Lai, X.; Fang, X.; Dong, S. Mechanical characteristics and energy regulation evolution mechanisms of cavity filling of rock samples from roof with strong bursting liability. Chin. J. Rock Mech. Eng. 2020, 39, 2439–2450. [Google Scholar]
  2. Zuo, J.; Song, H. Energy evolution law and differential energy instability model of coal-rock combined body. J. China Coal Soc. 2022, 47, 3037–3051. [Google Scholar]
  3. Chen, G.; Li, T.; Zhang, G.; Li, J.; Liu, G.; He, Y.; Li, Y. Determination of bursting liability of coal-rock combined body based on residual energy release rate index. Chin. J. Rock Mech. Eng. 2023, 42, 1366–1383. [Google Scholar]
  4. Skrzypkowski, K. Case studies of rock bolt support loads and rock mass monitoring for the room and pillar method in the Legnica-Gogow copper district in Poland. Energies 2020, 13, 2998. [Google Scholar] [CrossRef]
  5. Ding, X.; Xiao, X.; Pan, Y.; Di, W. Study on damage evolution and fracture energy of coal with different bursting liability under uniaxial compressive test. J. Min. Saf. Eng. 2022, 39, 517–526. [Google Scholar]
  6. Liu, X.; Pan, Y.; Li, M.; Kang, Z.; Zhou, H.; Qiao, S. Permeability of hydrated shale rocks under cyclic loading and unloading conditions. J. China Coal Soc. 2022, 47, 103–114. [Google Scholar]
  7. Jiang, D.; Yang, Z.; Fan, J.; Li, Z.; Suo, J.; Chen, J. Experimental study of load rate effect of salt rock during loading and unloading. Rock Soil Mech. 2023, 44, 403–414. [Google Scholar]
  8. Zheng, D.; Ozbayoglu, E.; Miska, S.; Baldino, S. An experimental study on the influence of cyclic loading and eccentric casing geometry on cement sheath integrity. In Proceedings of the ARMA US Rock Mechanics/Geomechanics Symposium, Golden, CO, USA, 23–26 June 2024; p. D041S048R001. [Google Scholar]
  9. Ren, Y.; Wu, Y. Study on mechanical properties of sandstone under different cyclic loading and unloading rates. Nonferrous Met. Eng. 2022, 12, 111–119. [Google Scholar]
  10. Long, Y.; Sun, L.; Cai, Z.; Jiang, Z.; Wang, Z.; He, Q.; Bai, Z. Cyclic loading and unloading of weakly consolidated sandstone with various water contents. Sustainability 2023, 15, 13866. [Google Scholar] [CrossRef]
  11. Zhao, G.; Liu, Z.; Meng, X.; Zhang, R.; Gu, Q.; Qi, M. Energy evolution of sandstone under true triaxial cyclic principal stress. Rock Soil Mech. 2020, 44, 1875–1890. [Google Scholar]
  12. Xu, W.; Zhao, G.; Meng, X.; Liu, Z.; Liu, C.; Qi, M. Anisotropy and energy evolution mechanism of rock mass under true triaxial loading-unloading. J. China Coal Soc. 2023, 48, 1502–1515. [Google Scholar]
  13. Zhang, J.; Song, Z. Mechanical response and failure characteristics of deep sandstone under triaxial loading and unloading. J. Min. Saf. Eng. 2020, 37, 409–418+428. [Google Scholar]
  14. Li, J.; Hong, L.; Zhou, K.; Xia, C.; Zhu, L. Limestone acoustic emission evolution characteristics under different experimental loading and unloading conditions. Front. Phys. 2020, 8, 590710. [Google Scholar] [CrossRef]
  15. Xu, H.; Ma, L.; Cao, K.; Khan, N.M.; Hussain, S.; Niu, D.; Alarifi, S.S.; Bacha, S. Precursors of cyclic loading and unloading sandstone failure based on “acoustic-thermal” loading-unloading response ratio. Sustainability 2023, 15, 10158. [Google Scholar] [CrossRef]
  16. Wang, T.; Wang, C.; Xue, F.; Wang, L.; Teshome, B.H.; Xue, M. Acoustic emission characteristics and energy evolution of red sandstone samples under cyclic loading and unloading. Shock Vib. 2021, 2021, 1–15. [Google Scholar] [CrossRef]
  17. Meng, Q.; Chen, Y.; Zhang, M.; Han, L.; Pu, H.; Liu, J. On the kaiser effect of rock under cyclic loading and unloading conditions: Insights from acoustic emission monitoring. Energies 2019, 12, 3255. [Google Scholar] [CrossRef]
  18. Wang, Z.; Zhou, H.; An, L.; Wang, C. Failure process characteristics and energy evolution of granite under cyclic loading and unloading condition. J. China Univ. Min. Technol. 2020, 49, 874–881. [Google Scholar]
  19. Liu, H.; Qin, T. Study on damage characteristics and acoustic emission Kaiser effect of sandstone under cyclic loading and unloading conditions. Coal Sci. Technol. 2019, 47, 73–80. [Google Scholar]
  20. Zhang, D.; Bai, X.; Qi, X.; Zhang, X.; Yi, L. Acoustic emission characteristics and in-situ stresses of bedding rock based on Kaiser effect. Chin. J. Rock Mech. Eng. 2016, 35, 87–97. [Google Scholar]
  21. Gan, Y.; Wu, S.; Ren, Y.; Zhang, G. Evaluation indexes of granite splitting failure based on RA and AF of AE parameters. Rock Soil Mech. 2020, 41, 2324–2332. [Google Scholar]
  22. Ge, Z.; Sun, Q.; Wang, M.; Zhao, C. Fracture feature recognition of sandstone after high temperature based on RA/AF. Coal Geol. Explor. 2021, 49, 176–183. [Google Scholar]
  23. Jiang, C.; Wei, C.; Zhuang, W.; Duan, M.; Chen, Y.; Yu, T. Research on deformation characteristics and energy evolution mechanisms of shale under constant amplitude cyclic loading. Chin. J. Rock Mech. Eng. 2020, 39, 2416–2428. [Google Scholar]
  24. Liu, Z.; Dong, X.; Zhang, X. Experimental study on mechanical properties of bedding coal and rock under graded cyclic loading. Chin. J. Rock Mech. Eng. 2021, 40, 2593–2602. [Google Scholar]
  25. Wu, Z.; Song, Z.; Tan, J.; Zhang, Y.; Qi, Z. The evolution law of rock energy under different graded cyclic loading and unloading modes. J. Min. Saf. Eng. 2020, 37, 836–844+851. [Google Scholar]
  26. Xiao, F.; Jiang, D.; Wu, F.; Zou, Q.; Chen, J.; Chen, B.; Sun, Z. Effects of prior cyclic loading damage on failure characteristics of sandstone under true-triaxial unloading conditions. Int. J. Rock Mech. Min. Sci. 2020, 132, 104379. [Google Scholar] [CrossRef]
  27. Wang, Z.; Yang, Y.; Xu, Y.; Xin, C.; Liang, P.; Guo, N. Analysis of energy evolution and acoustic emission characteristics of rocks under cyclic loading and unloading. Appl. Sci. 2023, 13, 10453. [Google Scholar] [CrossRef]
  28. Zeng, P. Correlation on Frequency Characteristics of Acoustic Emission with Stress State of Bump-Prone Rocks. Ph.D. thesis, University of Science and Technology Beijing, Beijing, China, 2017. [Google Scholar]
  29. Zhao, Y.; Jiang, Y.; Han, Z. Experimental study on acoustic and thermal infrared characteristics of bump-prone coal. Chin. J. Rock Mech. Eng. 2007, 27, 2416–2428. [Google Scholar]
  30. Chen, J.; Zeng, B.; Hu, S.; Xu, W.; Wang, S.; Liu, Z. Mechanical behaviour and instability mechanism of sandstones with impact tendency under different loading paths. Int. J. Min. Reclam. Environ. 2024; 38, 1–20. [Google Scholar] [CrossRef]
  31. Yang, L.; Wang, X.; Li, J. Energy evolution and damage characteristics of coal with different bursting liability under uniaxial compression. Coal Sci. Technol. 2021, 49, 111–118. [Google Scholar]
  32. Pan, Y.; Yang, Y.; Luo, H.; Li, Z.; Zhu, X. Impulse propensity coal force—Electric induction Rule test study. J. Saf. Environ. 2018, 18, 119–123. [Google Scholar]
  33. GB/T 50266-2013; Standard for Test Methods of Engineering Rock Mass. China Planning Press: Beijing, China, 2013; pp. 1–64.
  34. GB/T 25217.1-2010; Methods for Test, Monitoring and Prevention of Rock Burst—Part 1: Classification and Laboratory Test Method on Bursting Liability of Roof Strata. Standards Press of China: Beijing, China, 2010; pp. 1–8.
  35. Chen, J.; Zeng, B.; Xu, W.; Wang, K.; Wang, S.; Hu, S.; Song, Z.; Wu, S. Progressive failure characteristics and damage constitutive model of rock samples under immersion conditions. J. China Coal Soc. 2024, 135, 1–19. [Google Scholar] [CrossRef]
  36. Wang, R.; Wei, C.; Liu, J.; Li, Z.; Tan, Y. Macro and micro characteristics of jointed sandstone under cyclic loading and unloading. Chin. J. Rock Mech. Eng. 2023, 42, 810–820. [Google Scholar]
  37. Li, X.; Yao, Z.; Huang, X.; Liu, Z.; Zhao, X.; Mu, K. Investigation of deformation and failure characteristics and energy evolution of sandstone under cyclic loading and unloading. Rock Soil Mech. 2021, 42, 1693–1704. [Google Scholar]
  38. Jia, P.; Qian, Y.; Wang, Y.; Wang, Q. Fracture mechanism and precursors of thermally damaged granite uniaxial compression based on acoustic emission information. Chin. J. Eng. 2023, 45, 2129–2139. [Google Scholar]
  39. Wu, B.; Wang, W.; Guo, D. Strength damage and AE characteristics of fractured sandstone under the influence of water intrusion times. J. Min. Saf. Eng. 2020, 37, 1054–1060. [Google Scholar]
  40. Wang, J.; Yuan, G. Acoustic emission and fracture characteristics of deep sandstone under different loading rates. J. Min. Saf. Eng. 2023, 5, 65–76. [Google Scholar]
  41. Liu, Y.; Qiu, L.; Lou, Q.; Wei, M.; Yin, S.; Li, P.; Cheng, X. Research on time-frequency characteristics of acoustic-electric signals in process of rock failure under load. J. Mine Autom. 2020, 46, 87–91. [Google Scholar]
  42. Zhu, X.; Tang, Y.; Fan, J.; Hu, J.; Liu, J.; He, C. Experimental study on failure precursors of fine sandstone based on critical slowing down theory. Chin. J. Rock Mech. Eng. 2022, 41, 53–61. [Google Scholar]
  43. Zhang, Y.; Cao, L.; Li, Z.; Chen, T. Experimental study on Kaiser effect characteristics of granite under different cyclic loading stresses. J. Exp. Mech. 2021, 36, 123–132. [Google Scholar]
  44. Shi, K.; Mei, F.; Chen, M.; Yang, Z.; Luo, W. Experimental study on the effect of high stress cyclic loading on Kaiser effect in marble. Chin. J. Rock Mech. Eng. 2017, 36, 2906–2916. [Google Scholar]
  45. Zhao, K.; Yan, D.; Zhong, C.; Zhi, X.; Wang, X.; Xiong, X. Comprehensive analysis method and experimental verification for in-situ stress measurement by acoustic emission tests. Chin. J. Geotech. Eng. 2012, 34, 1403–1411. [Google Scholar]
  46. Chen, J.; Zeng, B.; Xu, W.; Hu, S.; Wang, S.; Wang, K.; Zhang, W.; Wu, S.; Song, Z. Mechanical behaviour and damage constitutive model of semi-circular arch tunnels with straight walls under soaking conditions. Eng. Fail. Anal. 2025, 169, 1–23. [Google Scholar] [CrossRef]
  47. Du, K.; Li, X.; Tao, M.; Wang, S. Experimental study on acoustic emission (AE) characteristics and crack classification during rock fracture in several basic lab tests. Int. J. Rock Mech. Min. Sci. 2020, 133, 104411. [Google Scholar] [CrossRef]
  48. Song, Z.; Zhang, J.; Dong, X.; Wang, Y. Characterization and evaluation of brittleness of deep bedded sandstone from the perspective of the whole life-cycle evolution process. Int. J. Min. Sci. Technol. 2023, 33, 481–502. [Google Scholar] [CrossRef]
  49. Vasyliev, L.; Malich, M.; Vasyliev, D.; Katan, V.; Rizo, Z. Improving a technique to calculate strength of cylindrical rock samples in terms of uniaxial compression. Min. Miner. Depos. 2023, 17, 43–50. [Google Scholar] [CrossRef]
  50. Winkler, M.B.; Fruehwirt, T.; Marcher, T. Elastic behavior of transversely isotropic cylindrical rock samples under uniaxial compression considering ideal and frictional boundary conditions. Appl. Sci. 2024, 14, 17. [Google Scholar] [CrossRef]
  51. Skrzypkowski, K.; Gomez, R.; Zagorski, K.; Zagorska, A.; Gomez-Espina, R. Review of underground mining methods in world-class base metal deposits: Experiences from Poland and Chile. Energies 2023, 16, 148. [Google Scholar] [CrossRef]
  52. Zhang, C.; Chen, Y.; Wang, Y.; Bai, Q. Discrete element method simulation of granular materials considering particle breakage in geotechnical and mining engineering: A short review. Green Smart Min. Eng. 2024, 1, 190–207. [Google Scholar] [CrossRef]
Figure 1. Experimental stress–strain curves.
Applsci 15 02760 g001
Figure 2. Experimental apparatus.
Applsci 15 02760 g002
Figure 3. Experimental loading mode.
Applsci 15 02760 g003
Figure 4. Stress–strain and peak stress evolution curves: (a) stress–strain curves of rock samples; (b) relationship between average peak stress and pre-cycling thresholds.
Applsci 15 02760 g004
Figure 5. Microstructure characteristics of rock samples with burst liability.
Applsci 15 02760 g005
Figure 6. AE signal characteristics of rock samples with burst liability: (a) AE count was 0–30 × 104 and the pre-cycling threshold was 6 MPa; (b) AE count was 0–0.06 × 10⁴ and the pre-cycling threshold was 6 MPa; (c) AE count was 0–5 × 10⁴ and the pre-cycling threshold was 12 MPa; (d) AE count was 0–0.06 × 10⁴ and the pre-cycling threshold was 12 MPa; (e) AE count was 0–4 × 10⁴ and the pre-cycling threshold was 18 MPa; (f) AE count was 0–0.06 × 10⁴ and the pre-cycling threshold was 18 MPa.
Applsci 15 02760 g006
Figure 7. Evolution characteristics of the Kaiser effect: (a) pre-cycling threshold was 6 MPa; (b) pre-cycling threshold was 12 MPa; (c) pre-cycling threshold was 18 MPa.
Applsci 15 02760 g007
Figure 8. Relationship between AF-RA and crack type.
Applsci 15 02760 g008
Figure 9. Evolution characteristics of AF-RA and crack types: (a) Relationship between AF-RA and time when pre-cycling threshold was 6 MPa; (b) Relationship between AF and RA when pre-cycling threshold was 6 MPa; (c) Relationship between AF-RA and time when pre-cycling threshold was 12 MPa; (d) Relationship between AF and RA when pre-cycling threshold was 12 MPa; (e) Relationship between AF-RA and time when pre-cycling threshold was 18 MPa; (f) Relationship between AF and RA when pre-cycling threshold was 18 MPa.
Applsci 15 02760 g009
Table 1. Burst liability classification of rock samples.
Burst Liability
Category
Burst Liability
Amplitude
Bending Energy Index UWQ/kJ
INoUWQ < 15
IIWeak15 ≤ UWQ ≤ 120
IIIStrongUWQ > 120
Table 2. Static mechanical parameters of rock samples.
SampleHeight (mm)Diameter (mm)Density (kg/m3)Peak Stress (MPa)
A-0-1100.0449.98243643.47
A-0-299.9849.96245143.18
Mean100.0149.97244443.33
Disclaimer/Publisher’s Note: The statements, opinions and data contained in all publications are solely those of the individual author(s) and contributor(s) and not of MDPI and/or the editor(s). MDPI and/or the editor(s) disclaim responsibility for any injury to people or property resulting from any ideas, methods, instructions or products referred to in the content.

