Abstract
Prefabricated cantilever systems (PCSs) are essential for mountainous road infrastructure, yet their structural behavior under traffic loads remains insufficiently studied. This study innovatively integrates scaled experiments, finite element simulations, and field test data to develop and validate a full-scale PCS model under extreme traffic conditions. The results reveal that the beam–column junction is highly vulnerable to stress concentrations, risking concrete cracking. To address this, a novel prestressed reinforcement design is proposed, optimizing rebar placement to reduce local stresses and enhance structural integrity. Ultimate load analysis confirms that prestressing improves stiffness, load resistance, and ductility. This study provides a systematic framework for PCS optimization, promoting its application in complex engineering environments.
1. Introduction
The construction of roads in mountainous regions is often complicated by steep and uneven terrain. To minimize excavation and earthworks, cantilever structures have gained widespread adoption as a key solution for roadbed support [1,2]. Conventionally, such structures are built using cast-in-place techniques, necessitating extensive on-site concrete pouring and curing. These processes not only demand substantial labor but also prolong construction schedules [3,4]. In response to these challenges, prefabricated cantilever structures (PCSs) have been developed as an efficient and practical alternative.
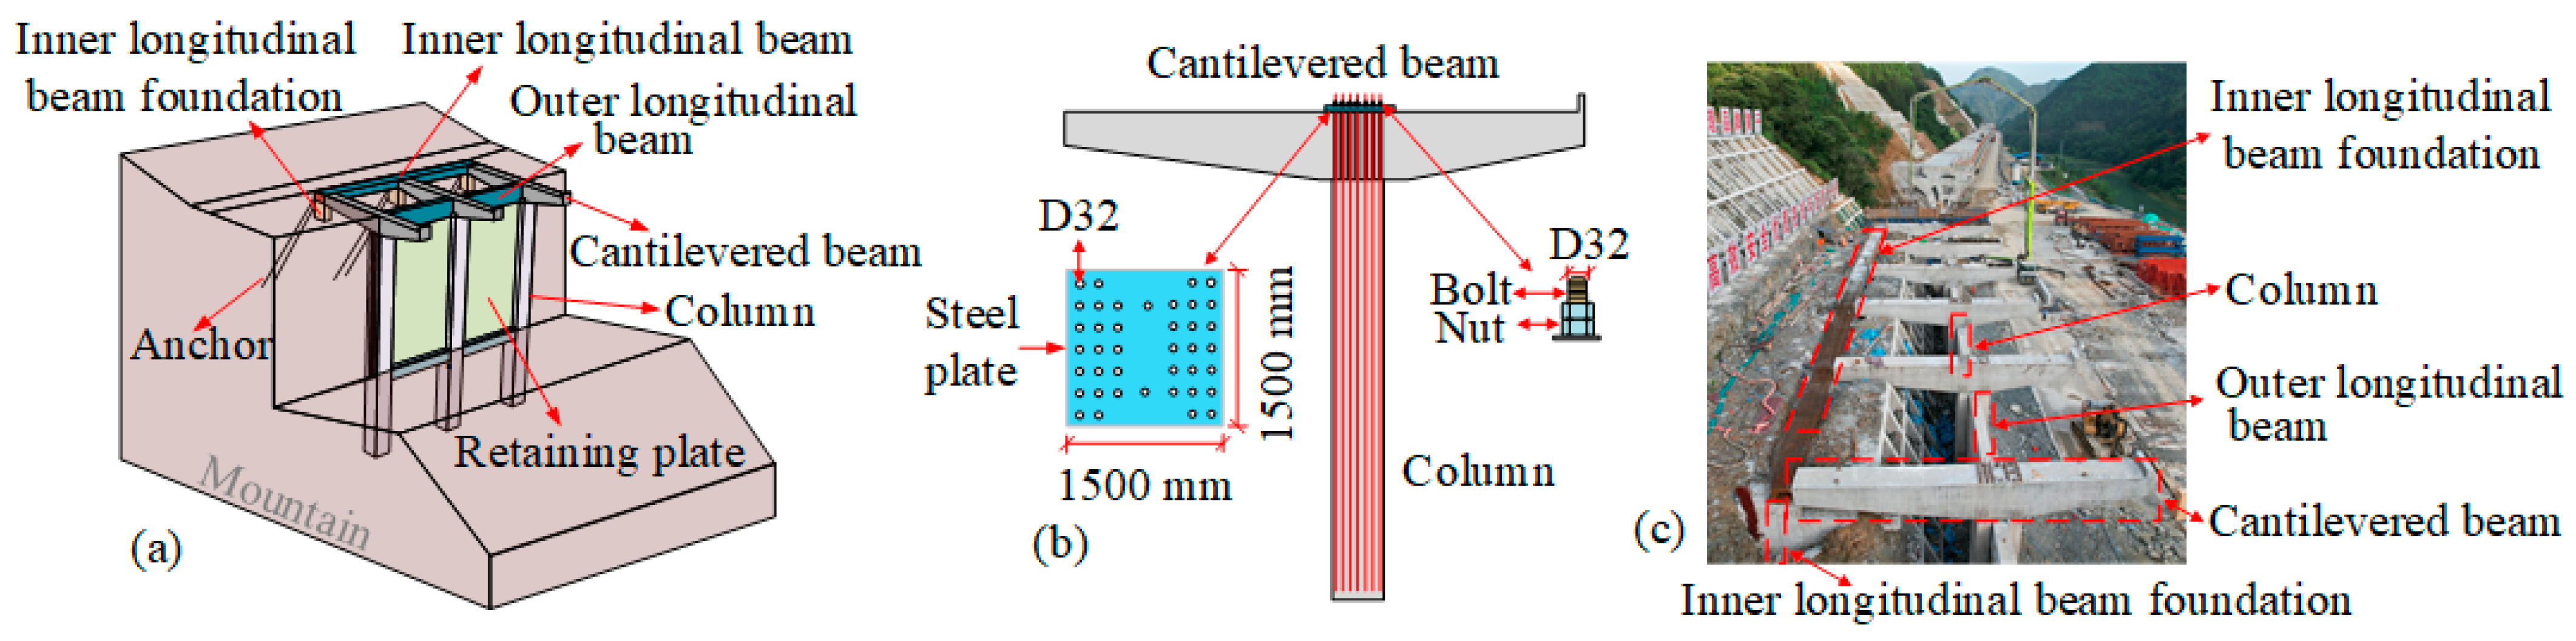
PCSs are highly adaptable to rugged mountainous landscapes and have become the preferred structural solution for mountain road construction [5,6,7]. As illustrated in Figure 1, these systems are composed of multiple prefabricated elements, including inner and outer longitudinal beams, cantilever beams, anchor rods, columns, retaining plates, and their corresponding foundations. Unlike conventional cast-in-place methods, these prefabricated components are produced in a controlled factory environment, ensuring consistent quality and precision. Once transported to the construction site, they are rapidly assembled, significantly improving construction speed while minimizing on-site labor requirements [8]. The assembly process also enhances overall safety, particularly in hazardous construction settings [9]. In contrast to conventional roadbeds, such as those formed by cutting slopes or filling embankments, prefabricated cantilever roadbeds are less influenced by topographical variations, leading to smoother roadway alignments and minimized elevation discrepancies, thereby demonstrating superior adaptability [10,11,12,13].
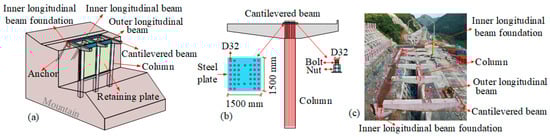
Figure 1.
Prefabricated cantilever structure (PCS). (a) Schematic of the PCS roadbed; (b) details of the beam–column joint; and (c) PCS roadbed in a real construction case.
Several studies have explored the structural performance of PCSs [14,15,16,17,18,19,20,21,22,23,24]. Given that the beam–column connection plays a crucial role in the stability of these systems, research on their seismic behavior has shown that while various connection techniques have negligible effects on the longitudinal seismic response and risk distribution of primary structural elements, they substantially influence the transverse seismic behavior and associated risk patterns [14]. Regarding connection strategies for PCSs, Chen et al. [15] conducted both scaled physical tests and finite element (FE) simulations to examine the mechanical properties of bolted joints, demonstrating their effectiveness in preserving structural stability. Moreover, factors such as cantilever beam width and internal reinforcement grid configurations have a notable impact on the beams’ ultimate load-bearing capacity [16,17,18]. Different cantilever beam types also exhibit varying responses under extreme loading conditions [19,20]. Collectively, these findings offer essential insights for optimizing the design of prefabricated cantilever structures.
Studies have shown that vehicle loads play a critical role in the fatigue deterioration and potential failure of cantilever structures. Consequently, accurately evaluating and predicting the influence of traffic load distribution is essential for ensuring the long-term structural performance of these systems [22,23,24,25,26]. At present, the impact of vehicular loads on cantilever structures is primarily examined through numerical simulations [27,28,29,30,31]. Large-scale vehicle load testing is vital for assessing structural integrity and has been employed to detect potential deficiencies arising from material imperfections, construction inconsistencies, or long-term operational wear [32,33,34]. Pinkney et al. [32] analyzed the behavior of modular truss structures under varying vehicular loads, highlighting that different loading approaches significantly affect bridge performance. Additionally, the static and dynamic responses of structures subjected to various vehicle types, including heavy trucks and emergency vehicles, have been extensively investigated, demonstrating that both vehicle classification and loading configurations lead to distinct stress patterns within the structure [35,36,37,38]. Sun et al. [39] utilized FE modeling to simulate vehicle and lane loading conditions, concluding that FE-based approaches offer superior accuracy and cost efficiency compared to conventional static load testing. These studies provide crucial insights for refining vehicle load simulation methodologies. Since PCS represents an innovative type of cantilever structure, its distinctive connection mechanisms will inevitably influence internal stress distributions under traffic-induced forces. However, comprehensive research on the overall stress behavior of PCS under traffic loads remains lacking. In conclusion, while considerable advancements have been achieved in the analysis of cantilever structures, there is still a notable gap in understanding the performance of PCSs under extreme traffic loading conditions.
Thus, this research systematically fills the existing gap by integrating experimental studies with advanced simulations, focusing on the innovative design of PCSs. This study develops and validates a novel scaled-down finite element (FE) model for PCSs, established through rigorous experimental testing. Furthermore, a pioneering full-scale PCS FE model is created and validated using real paving test data, enabling a comprehensive analysis of structural responses under diverse traffic-induced effects. Three critical loading scenarios—external eccentric load, internal eccentric load, and full load—are meticulously evaluated. Additionally, the research introduces a groundbreaking approach to structural optimization by proposing the incorporation of prestressed rebars to mitigate stress concentrations in cantilever beams. These findings not only enhance our understanding of PCS behavior but also provide valuable insights for optimizing and practically applying PCS roadbeds in the challenging context of mountainous road construction, setting a new benchmark for future research in this domain.
2. Development and Validation of the Scaled-Down PCS Model
This section begins by confirming the model’s reliability through a combination of simulations and experimental tests on a scaled-down PCS. Following this, a full-scale model is developed to analyze and optimize the structural response under varying traffic load distributions.
2.1. Design and Testing of the Scaled-Down PCS
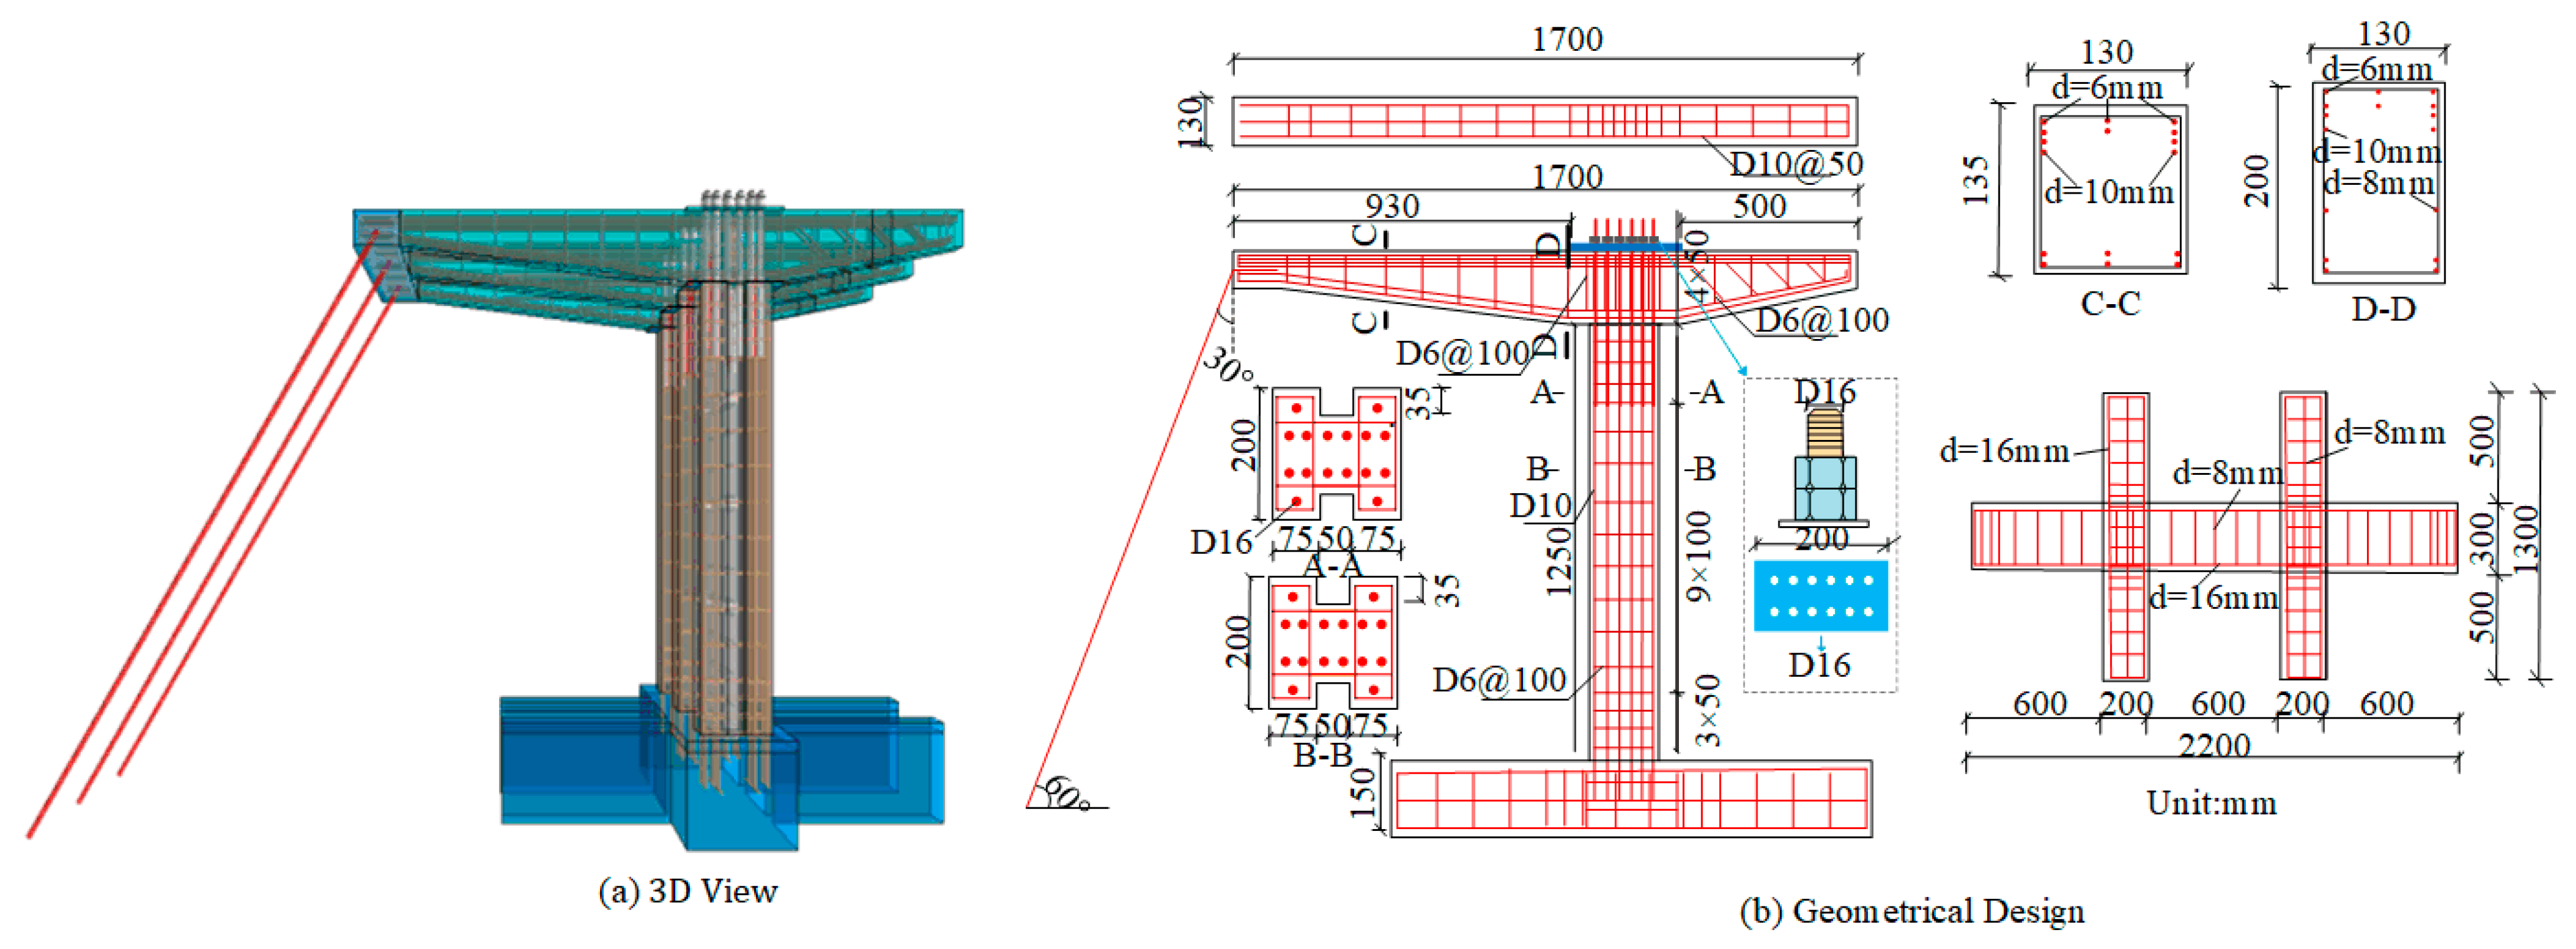
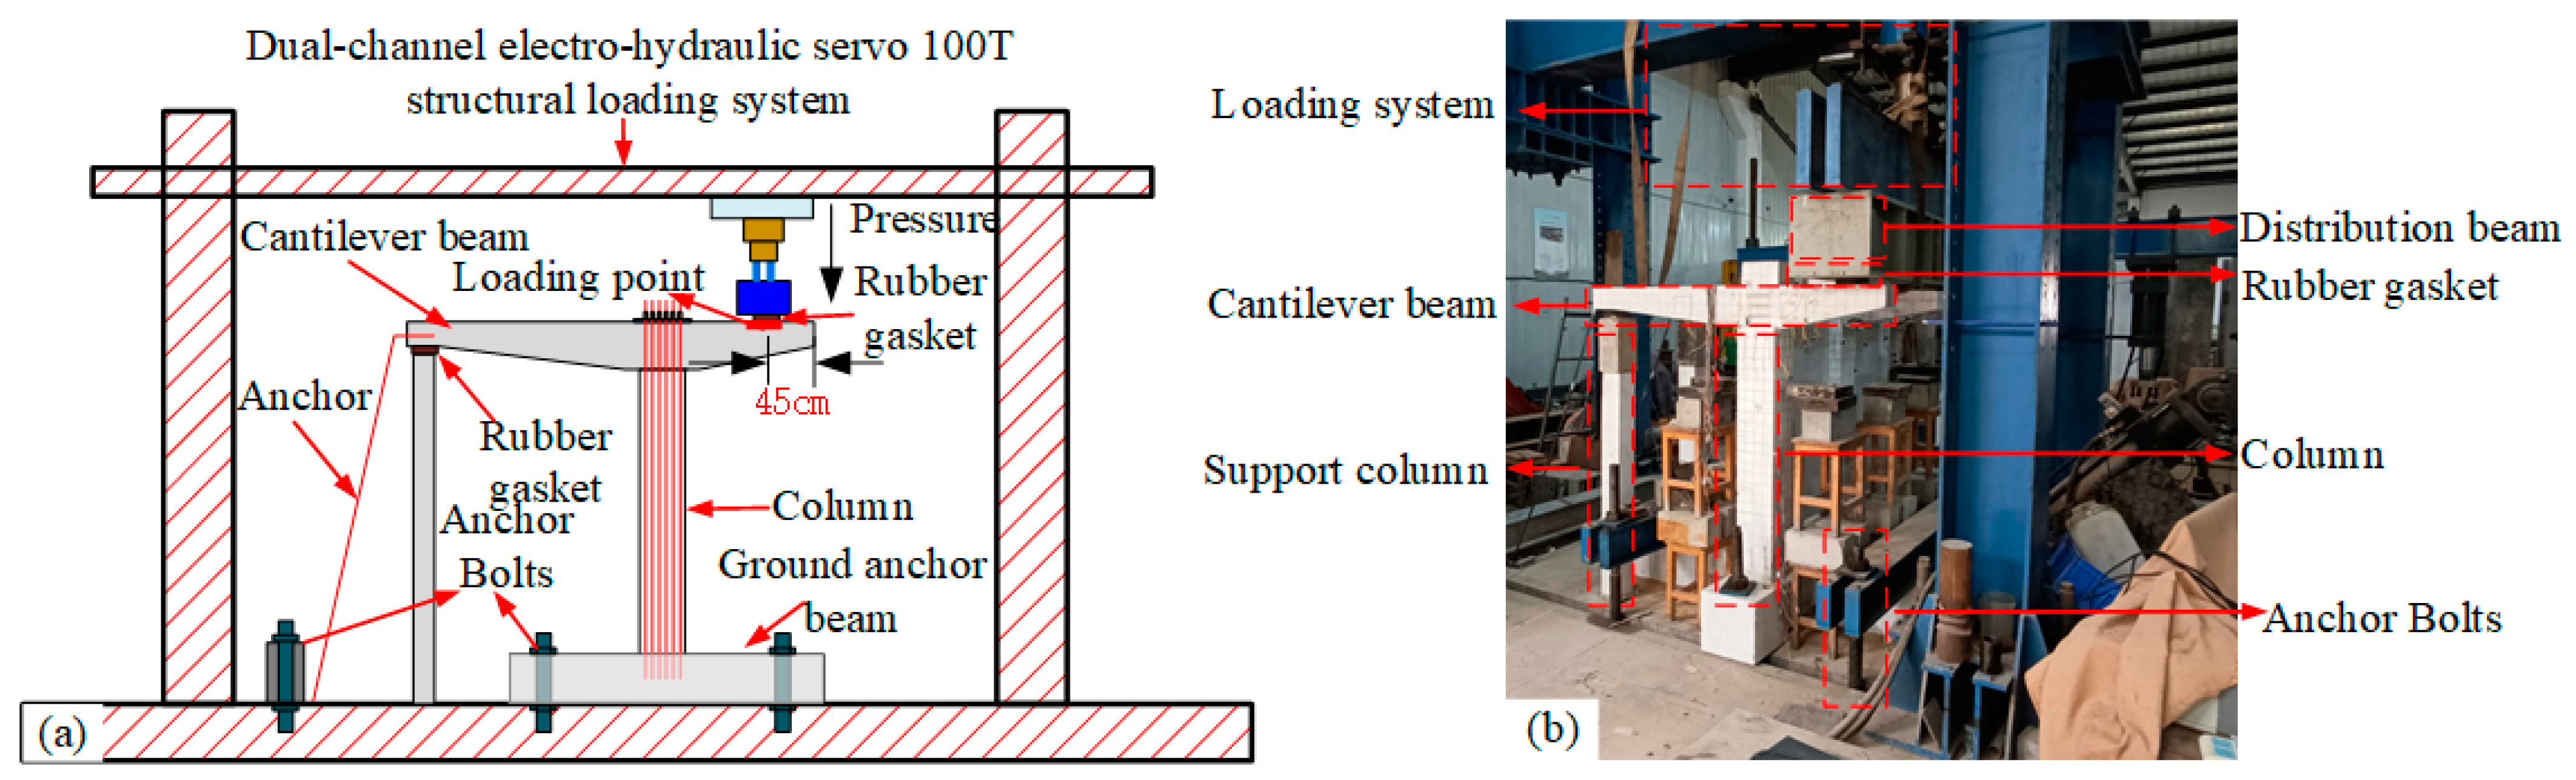
Drawing from the actual engineering structure depicted in Figure 1c, a 1:7.5 scaled-down model of the PCS was designed for both experimental testing and finite element (FE) simulation. As shown in Figure 2a, the scaled structure adopts a three-beam, two-span configuration. The geometric dimensions of the scaled model are presented in Figure 2b. The columns stand at a height of 1250 mm, with a rectangular cross-section measuring 200 mm × 200 mm. The cantilever beams feature a variable cross-section and have a total length of 1700 mm, with the smallest cross-section measuring 130 mm × 100 mm and the largest measuring 130 mm × 200 mm. The cantilever beams are spaced 600 mm apart. The connection between the cantilever beams and the columns is made using 12 bolts, each with a diameter of 16 mm, which are secured with double nuts to prevent loosening. To replicate the anchoring effect of the mountainous terrain on the structure, ground anchor beams were incorporated. These anchor beams are connected to ground anchor rods, which are secured with bolts and steel sections, and are inclined at an angle of 60° relative to the ground. In the constructed test structure, the cantilever beams and columns were made from C50 concrete, while the other components were constructed using C30 concrete. The experimental loading configuration is illustrated in Figure 3. A dual-channel electro-hydraulic servo system with a 100 T capacity was employed for loading. The load was applied to the three cantilever beams via a distribution beam, with the loading points located 45 cm from the column center. During the test, the loading rate was initially set at 0.5 mm/min, which was reduced to 0.2 mm/min once cracks were detected. The loading process was terminated when the structural load capacity fell to 85% of the peak load, after surpassing the peak value.

Figure 2.
Scaled-down PCS: (a) 3D view; (b) geometrical design.
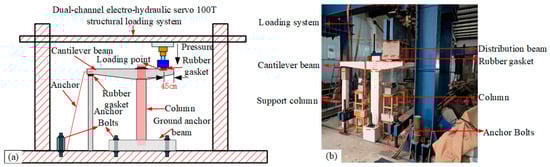
Figure 3.
Testing for the scaled-down PCS: (a) loading schematic; and (b) loading in testing.
2.2. Scaled-Down PCS Model Construction
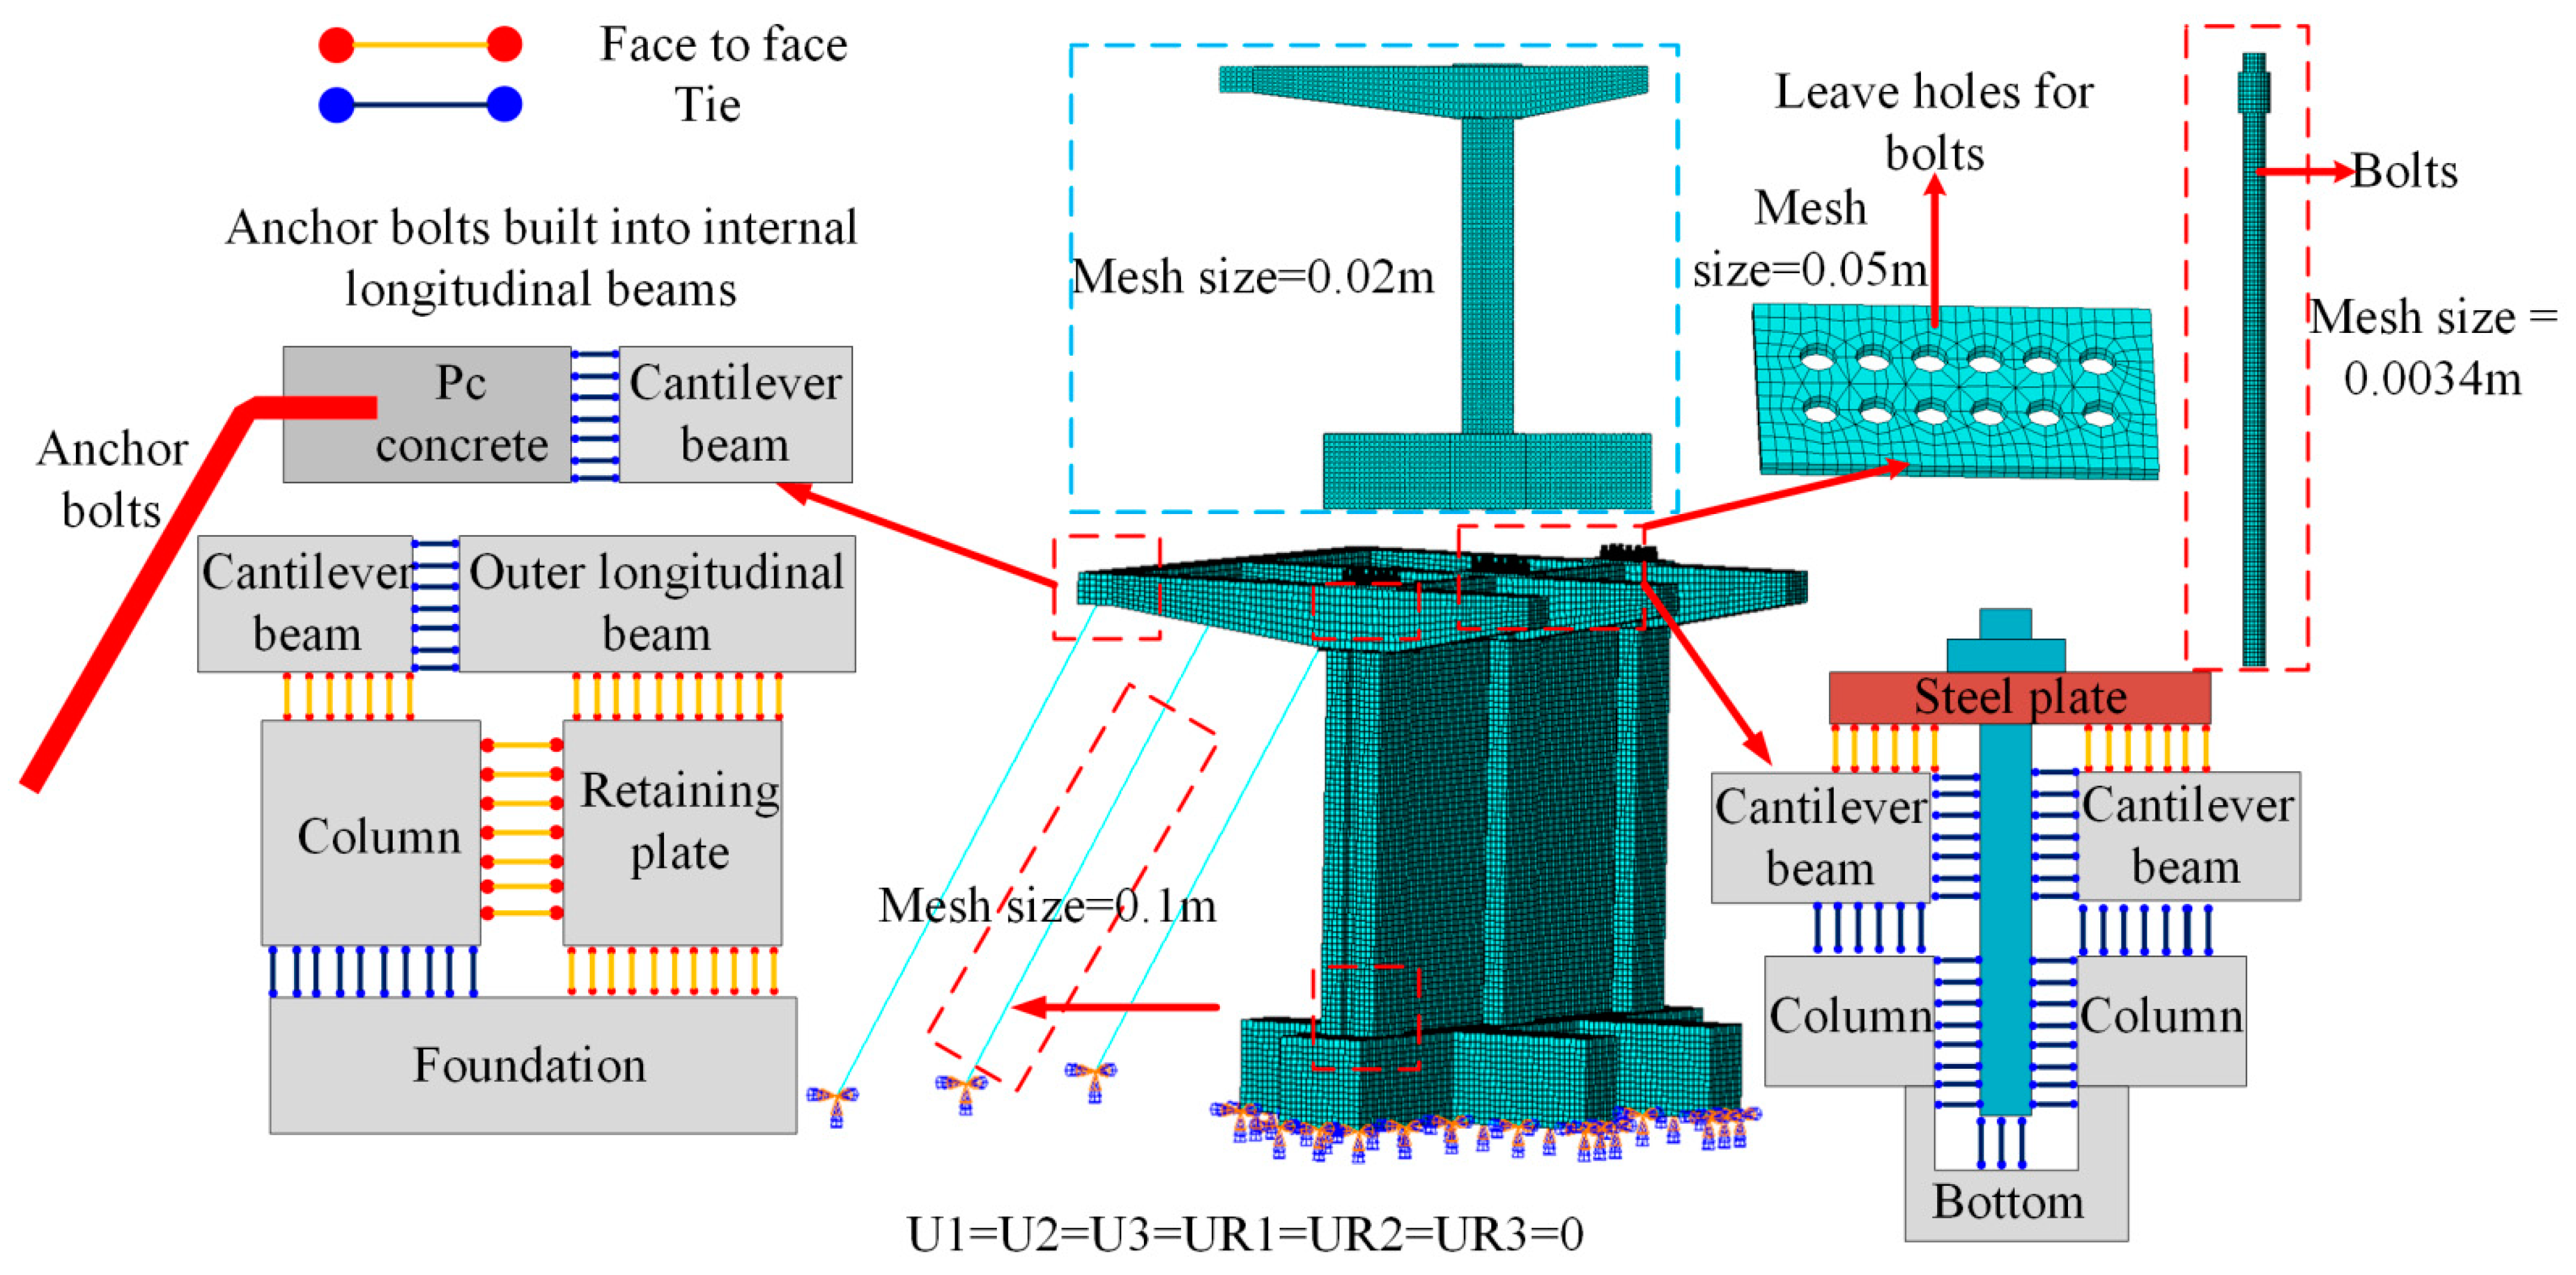
The finite element (FE) model developed for this study is depicted in Figure 4. Concrete, bolts, and nuts are modeled using eight-node hexahedral elements with reduced integration (C3D8R). Reinforcement bars are represented by two-node linear truss elements (T3D2), while anchor rods are modeled using two-node spatial linear beam elements (B31). Steel plates are discretized with four-node quadrilateral surface elements with reduced integration (S4R). The interaction between concrete (host element) and embedded elements (reinforcement and anchor rods) is simulated using the embedded element method. The base of the structure and the inclined anchor rods are fixed to prevent displacement and rotation.

Figure 4.
Developed FE model of a scaled-down PCS.
Surface-to-surface contact is implemented to model interactions between key components, such as cantilever beams and columns, columns and retaining plates, outer longitudinal beams and columns, retaining plates and foundation, and steel plates and cantilever beams. A penalty friction coefficient of 0.4 is assigned to tangential behavior, while normal behavior is represented by hard contact. Binding constraints are applied to prevent relative displacement and rotation between columns and foundation, inner longitudinal beams and cantilever beams, bolts and prefabricated holes, and cantilever beams and external longitudinal beams. The anchor rods are embedded within the internal longitudinal beams.
In constructing the scaled model, particular attention was given to mesh size selection to ensure both accuracy and computational efficiency. Since ABAQUS 2020 uses dimensionless units, we defined the basic unit as meters. The mesh sizes were set as follows: 0.0034 m for bolts, 0.05 m for perforated steel plates, 0.1 m for anchor rods and reinforcement, and 0.02 m for concrete components. These mesh sizes were chosen to satisfy the dual requirements of precision and computational efficiency, enabling reliable finite element analysis while minimizing computational time.
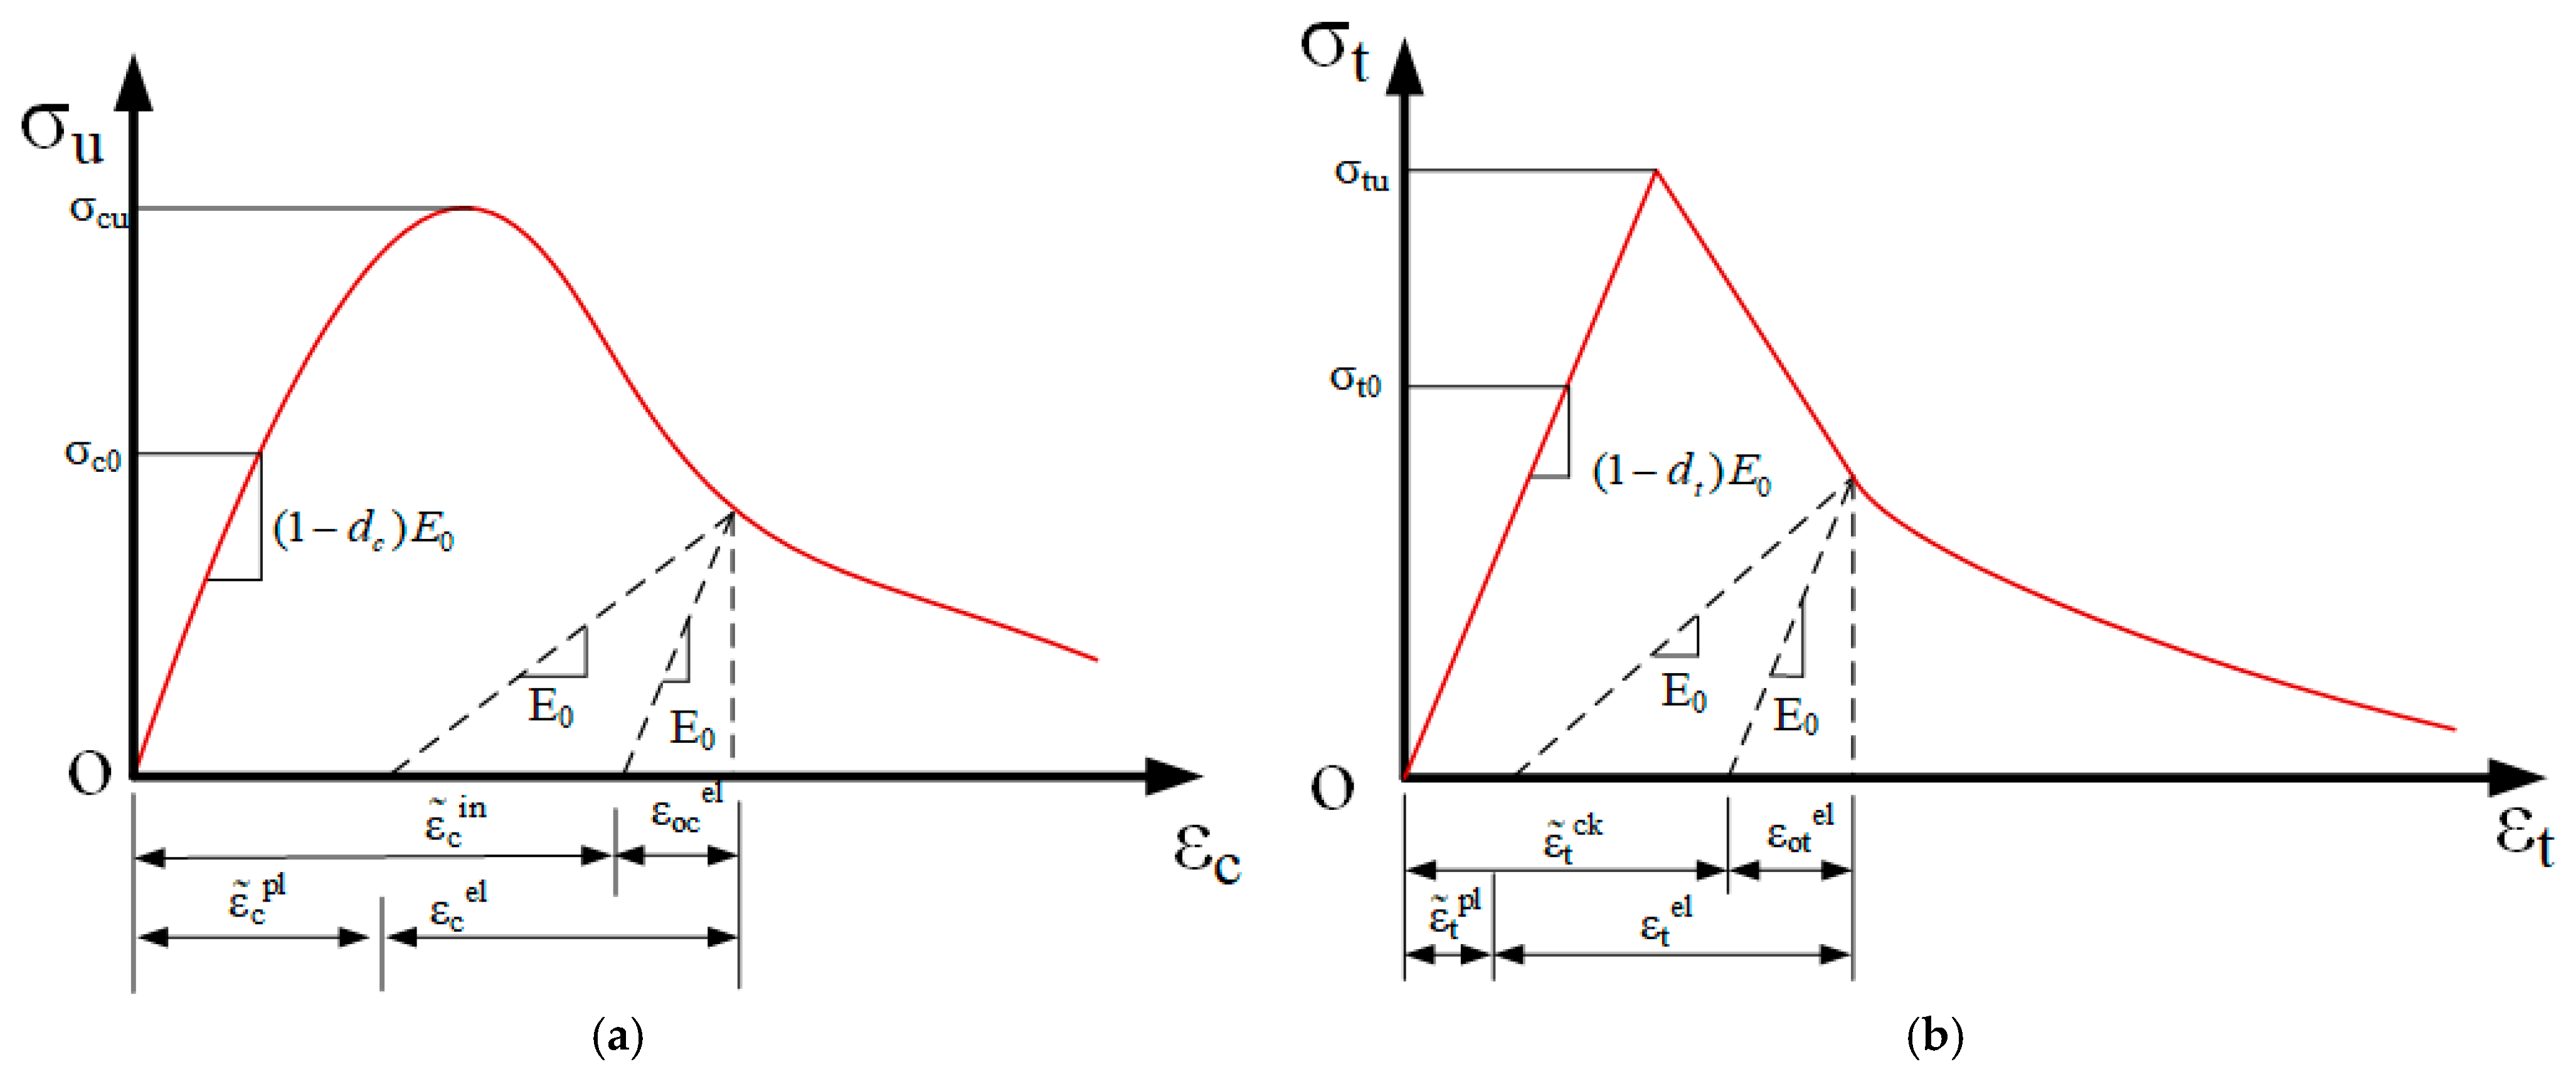
Concrete specimens subjected to loading undergo both tensile cracking and compressive failure [15]. To model the stress–strain behavior of concrete, the Concrete Damage Plasticity (CDP) model available in ABAQUS is employed [40,41]. By incorporating damage variables, the CDP model effectively captures the mechanical response of concrete under monotonic, low-cycle, and dynamic loads, demonstrating favorable convergence. Figure 5 presents the uniaxial compressive and tensile stress–strain curves, as specified by the GB50011-2010 [42] Concrete Structure Design Code. The compressive stress–strain relationship is defined as follows:
where is the tensile stress; is the uniaxial tensile strength of concrete; is the peak tensile strain corresponding to ; and is the parameter for the descending branch of the uniaxial tensile stress–strain curve. The tensile stress–strain relationship is given by
where is the tensile stress; is the uniaxial tensile strength of concrete; is the peak tensile strain corresponding to ; and is the parameter for the descending branch of the uniaxial tensile stress–strain curve. In the CDP model, concrete failure is represented by tensile cracking following tensile yield and compressive crushing following compressive yield. The yield function incorporates equivalent plastic strain () and compressive equivalent plastic strain (). The model uses non-elastic strains, including tensile cracking strain () and compressive inelastic strain (). The compressive inelastic strain, as illustrated in Figure 5a, is computed as follows:
where and are the compressive stress and strain, respectively; is the elastic deformation under compression; is the equivalent plastic strain under compression; and is the damage factor. The tensile inelastic strain, shown in Figure 5b, is calculated as follows:
where and are the tensile stress and strain, respectively, is the elastic deformation under tension, is the equivalent plastic strain under tension, is the damage factor. The method for calculating the concrete damage factor follows Lee and Fenves [43], expressed as follows:
where represents the tensile or compressive damage factor, is the tensile or compressive stress of the concrete, and is the tensile or compressive strain of the concrete.
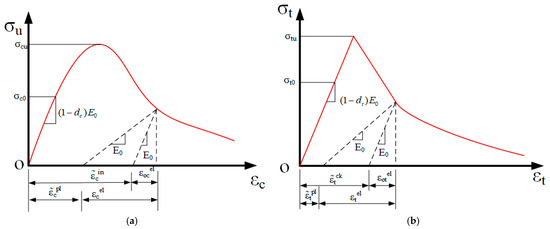
Figure 5.
Stress–strain curve of CDP model for concrete. (a) Compressive behavior; and (b) tensile behavior.
In this study, C30 concrete is modeled as an elastic material, whereas C50 concrete is treated as elasto-plastic. For C50 concrete, the compressive and tensile strains are inserted into Equations (1)–(6) to derive the corresponding stresses, thereby accurately representing its stress–strain relationship. Additionally, Equation (7) is used to calculate the damage factors associated with non-elastic strains, which account for the material’s degradation under loading conditions. The detailed damage data for C50 concrete are summarized in Table 1 and Table 2, where the compressive strength () is 50 MPa with a corresponding strain () of 0.00192, and the tensile strength () is 3.3 MPa with a strain () of 0.000128.

Table 1.
Parameters of the CDP model for C50 concrete.
Table 2.
Parameters of the CDP model for concrete.
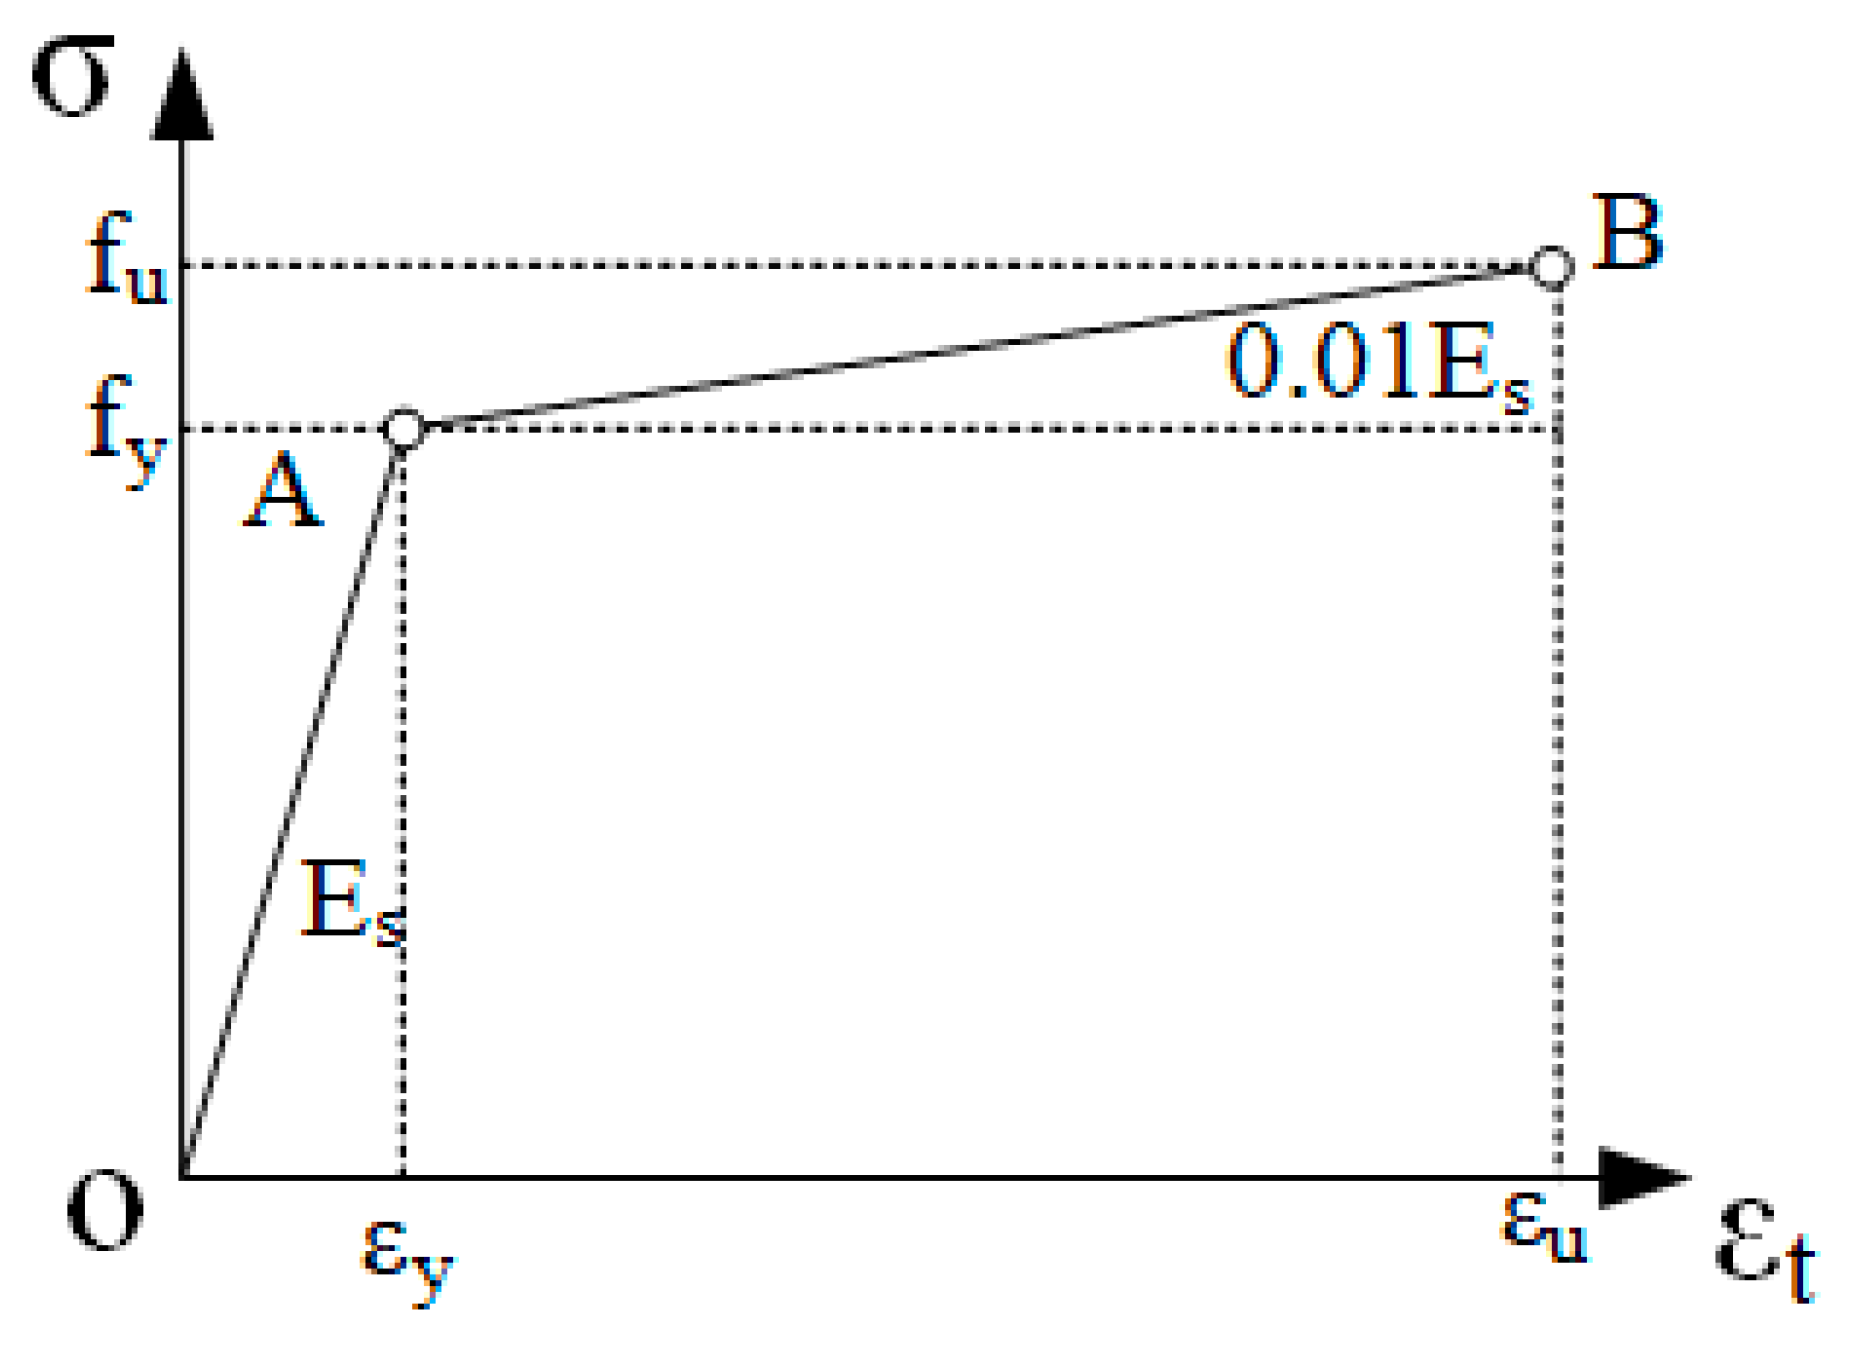
The steel plates in the structure are made of Q345 steel with a yield strength of 345 MPa, and the reinforcing bars are HRB400. Both the steel plates and reinforcing bars are modeled using a bilinear hardening model, as follows:
where is the stress in the steel; is the strain in the steel; is the initial elastic modulus of the steel; and is the ratio of the hardening modulus to the initial elastic modulus, taken as 0.01 in this study. The material parameters used are summarized in Table 3. Figure 6 depicts the stress–strain curve of the bilinear hardening model, which includes an elastic segment (OA) and a hardening segment (AB). The Von Mises yield criterion is used to define the yield stress as follows:
where is the yield stress; and , and are the first, second, and third principal stresses, respectively.
Table 3.
Used material parameters.
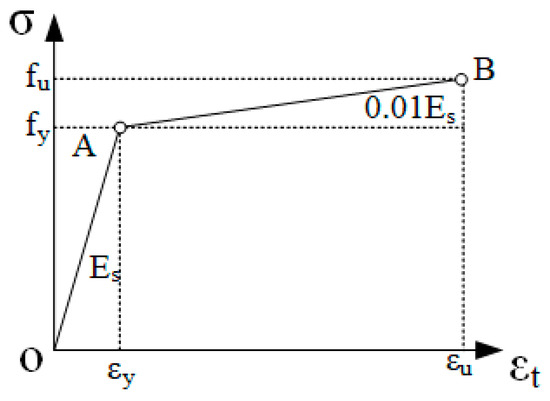
Figure 6.
Stress–strain curve of the bilinear hardening model for steel and reinforcement. Note: and represent the ultimate strength and yield strength of the steel, corresponding to the yield strain and ultimate strain , respectively.
2.3. Scaled-Down PCS Model Validation
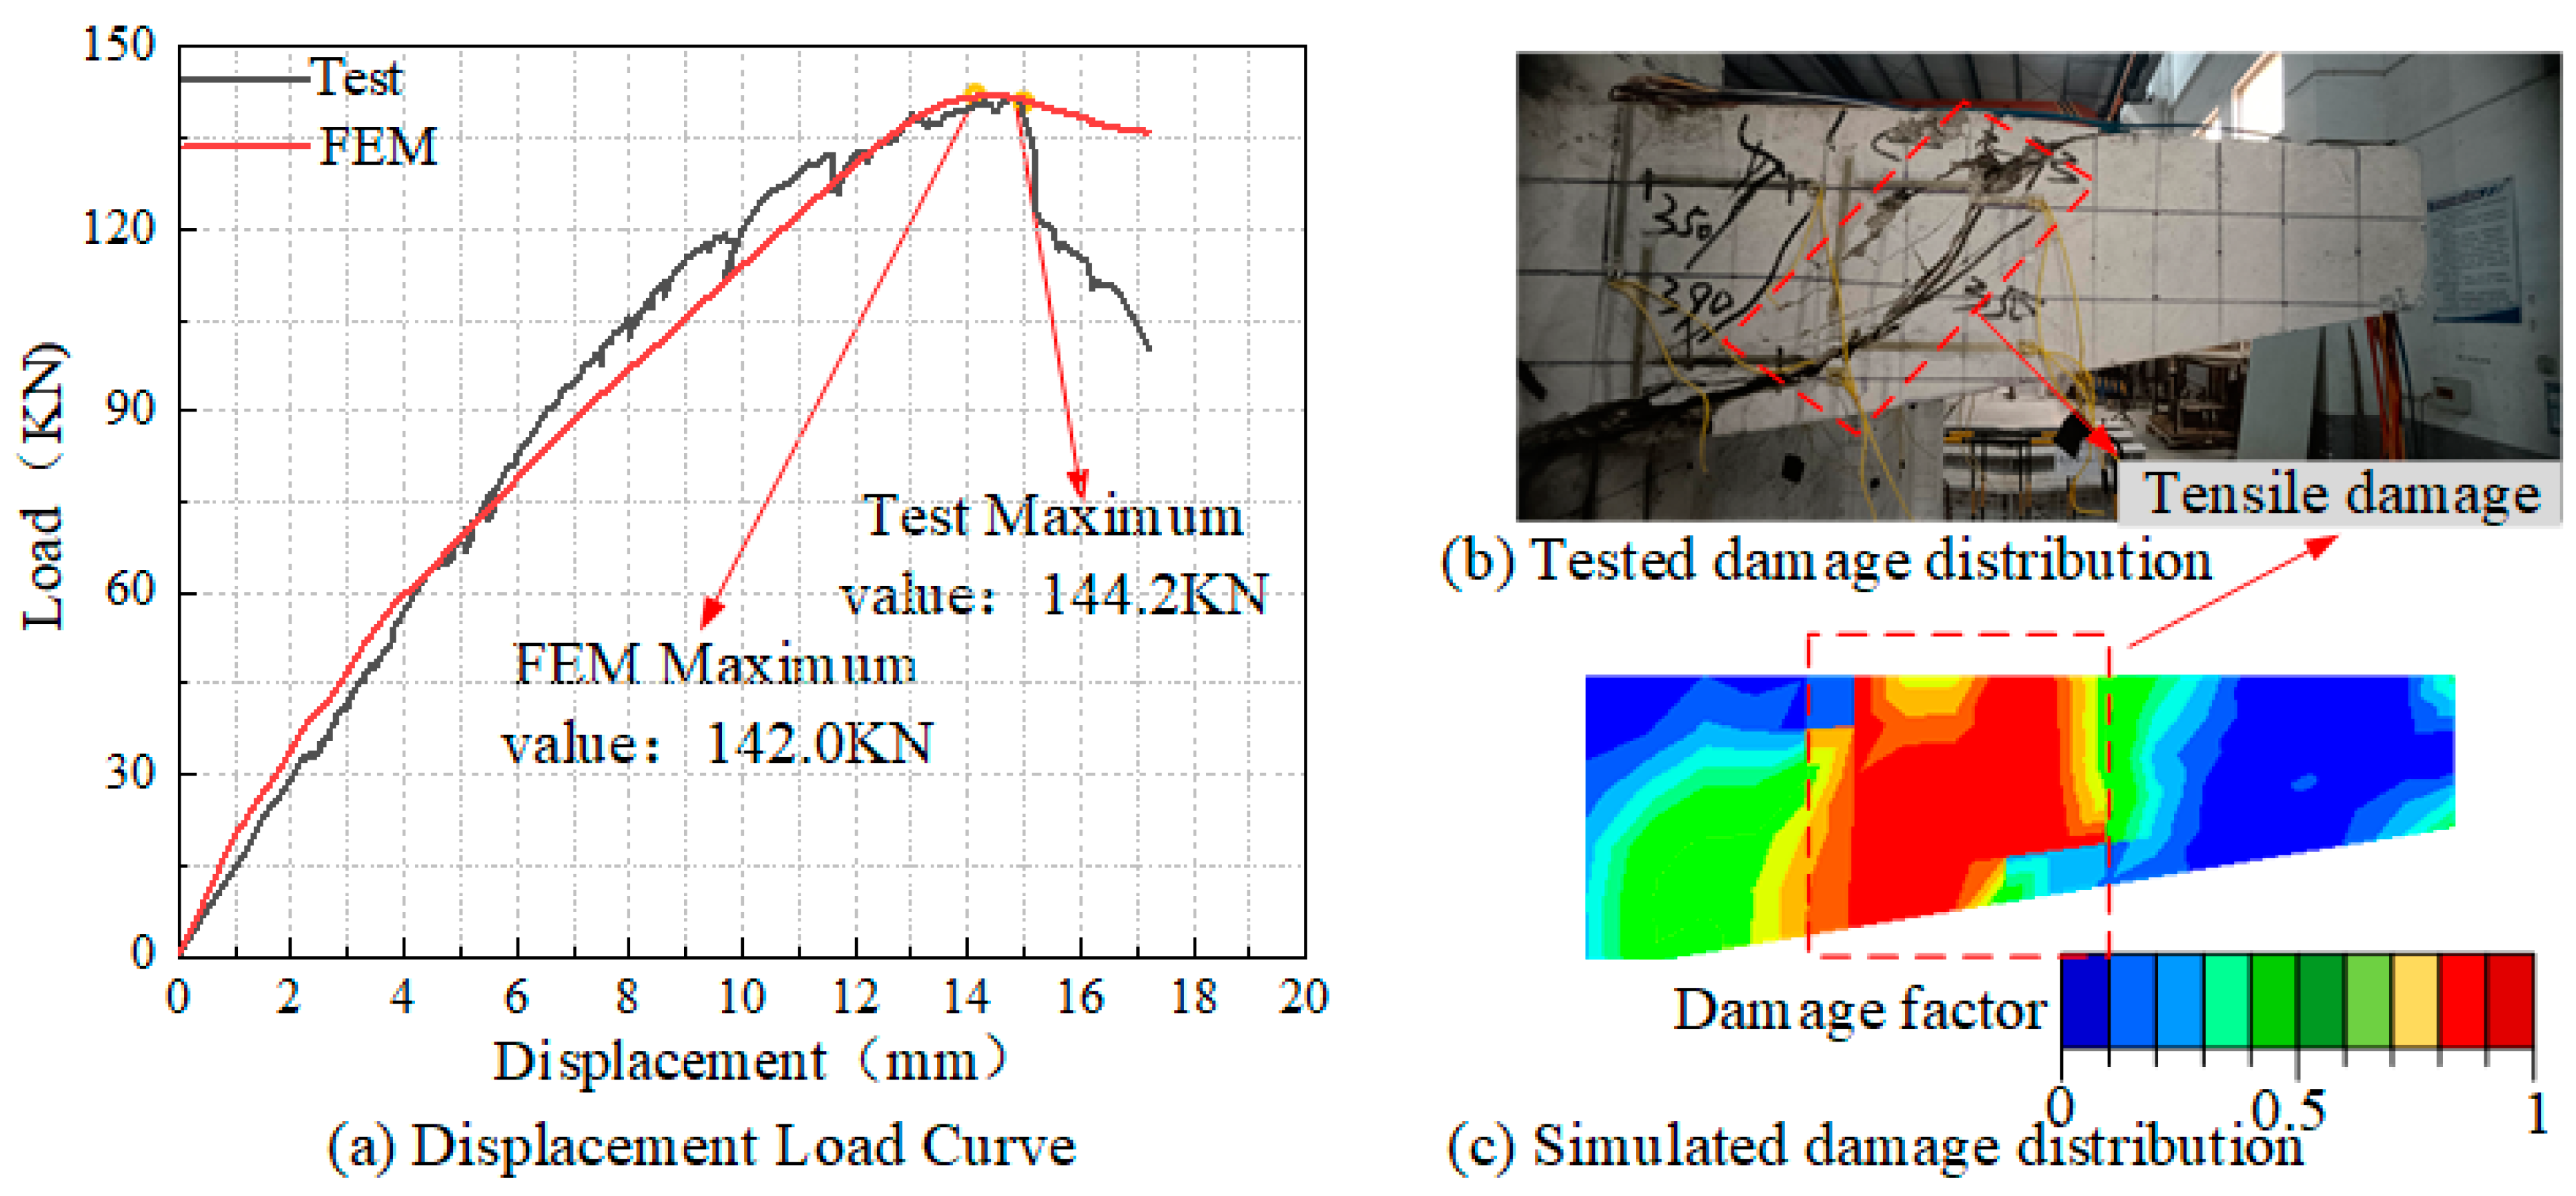
Figure 7 compares the simulated and experimental results for the scaled-down PCS model. The load–displacement curve in Figure 7a shows that the simulation results closely match the experimental data, especially before reaching the maximum load capacity. The ultimate load capacities obtained from the simulation and experiment are 144.1 kN and 142 kN, respectively, with a simulation error of only 1.47%. Figure 7b,c illustrates the damage distributions of the cantilever beam, as observed experimentally and in the simulation, respectively. Under vertical displacement loading, cracks propagate from the loading point toward the base of the cantilever beam, resulting in failure. The simulation results accurately reflect the experimental damage pattern. The high degree of similarity between the simulated and experimental results validates the accuracy of the developed model, which effectively captures the actual stress and damage behavior of the structure. Therefore, the material models and boundary conditions applied in the scaled-down model can be extended to the full-scale PCS model.

Figure 7.
Comparison of simulation and experimental results: (a) load–displacement curve; (b) experimental cantilever beam damage distribution; and (c) simulated cantilever beam damage distribution.
3. Full-Scale PCS Model Development and Validation
This section details the stress measurement process conducted during the paving of the full-scale PCS roadbed structure. Following this, the construction and validation of the full-scale model, which is derived from the scaled-down model and experimental data, are discussed.
3.1. Full-Scale PCS Testing
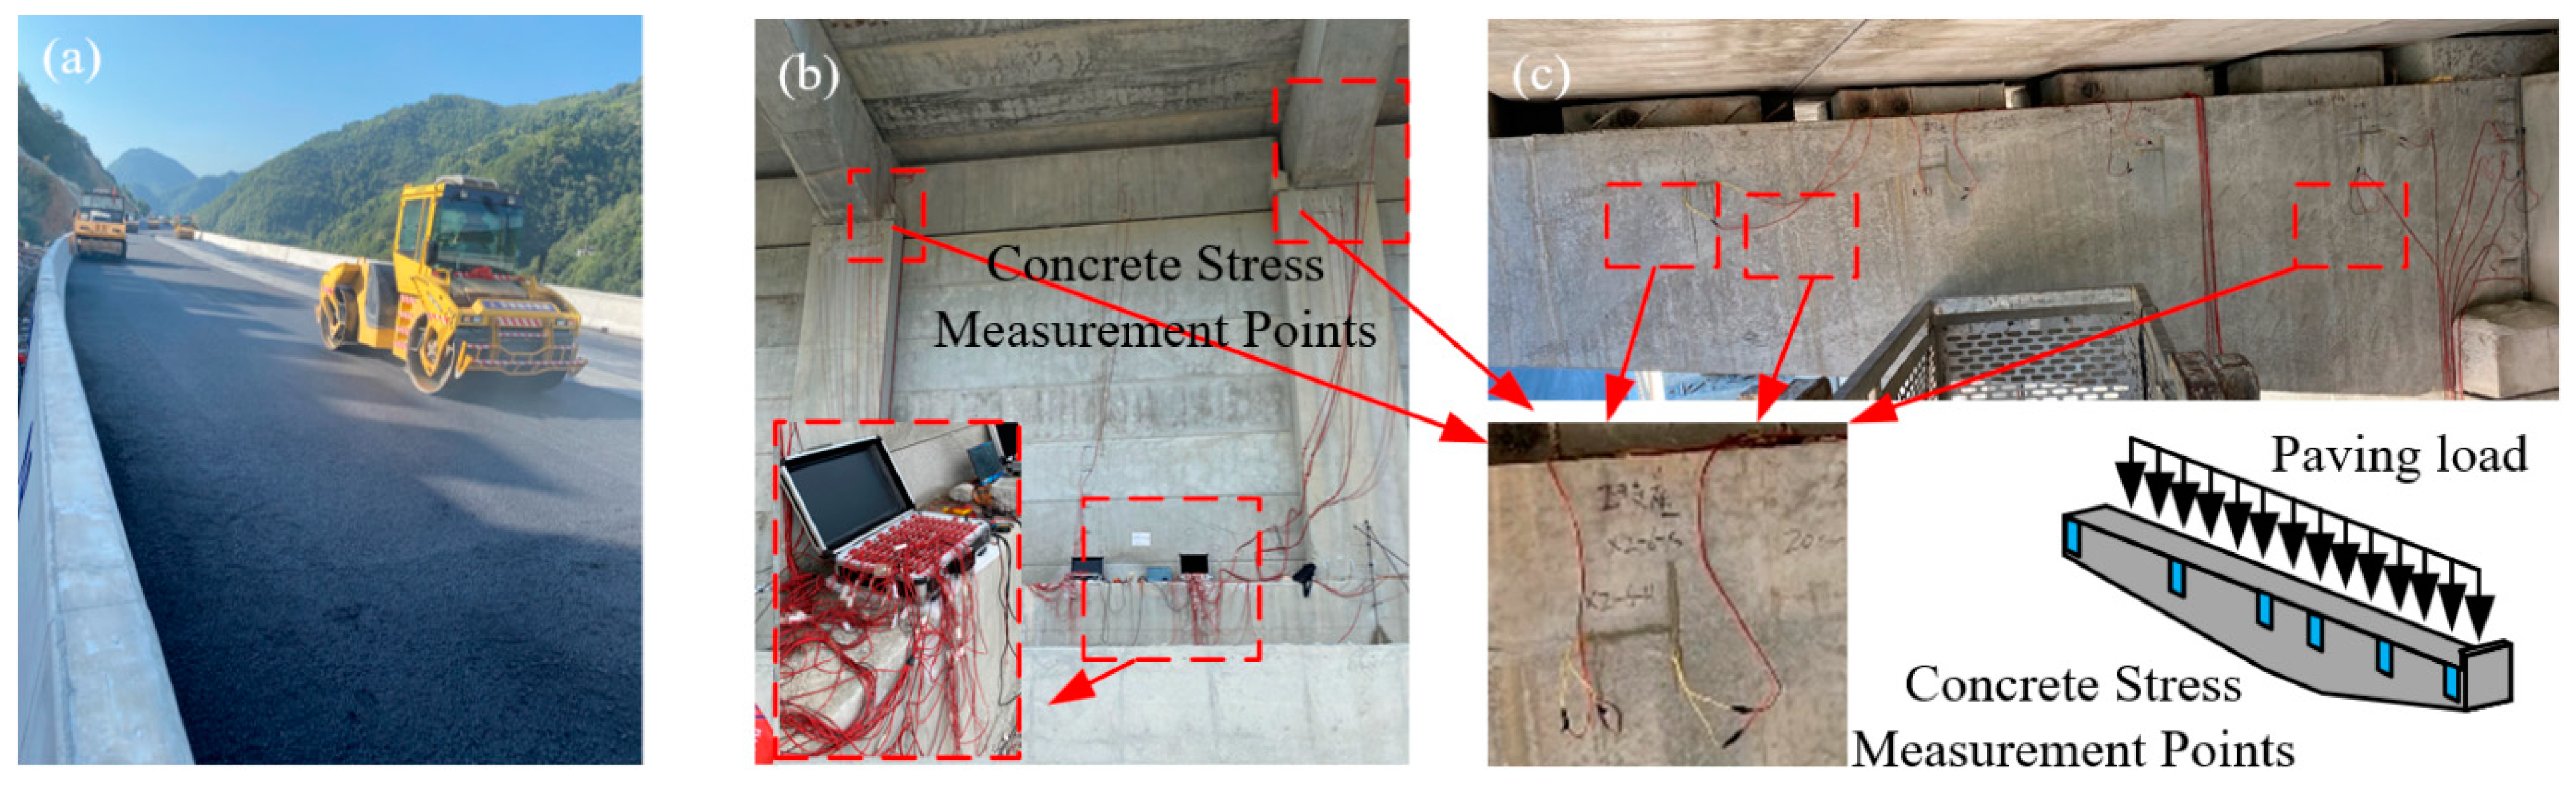
Figure 8a depicts the onsite paving procedure for the full-scale PCS roadbed. Figure 8b illustrates the stress measurement locations on the cantilever beams. Six critical measurement points are identified in Figure 8c as follows: the two beam ends, the junction between varying and constant cross-sections, and the midpoint of the varying cross-section. Stress concentrations are anticipated at the beam ends and at the junction between varying and constant cross-sections. Moreover, notable bending and shear stresses may develop at the midpoint of the varying cross-section due to the paving loads.

Figure 8.
Paving and testing layout of the PCS roadbed: (a) onsite paving; (b) stress measurement; and (c) measurement point layout diagram.
3.2. Full-Scale PCS Development
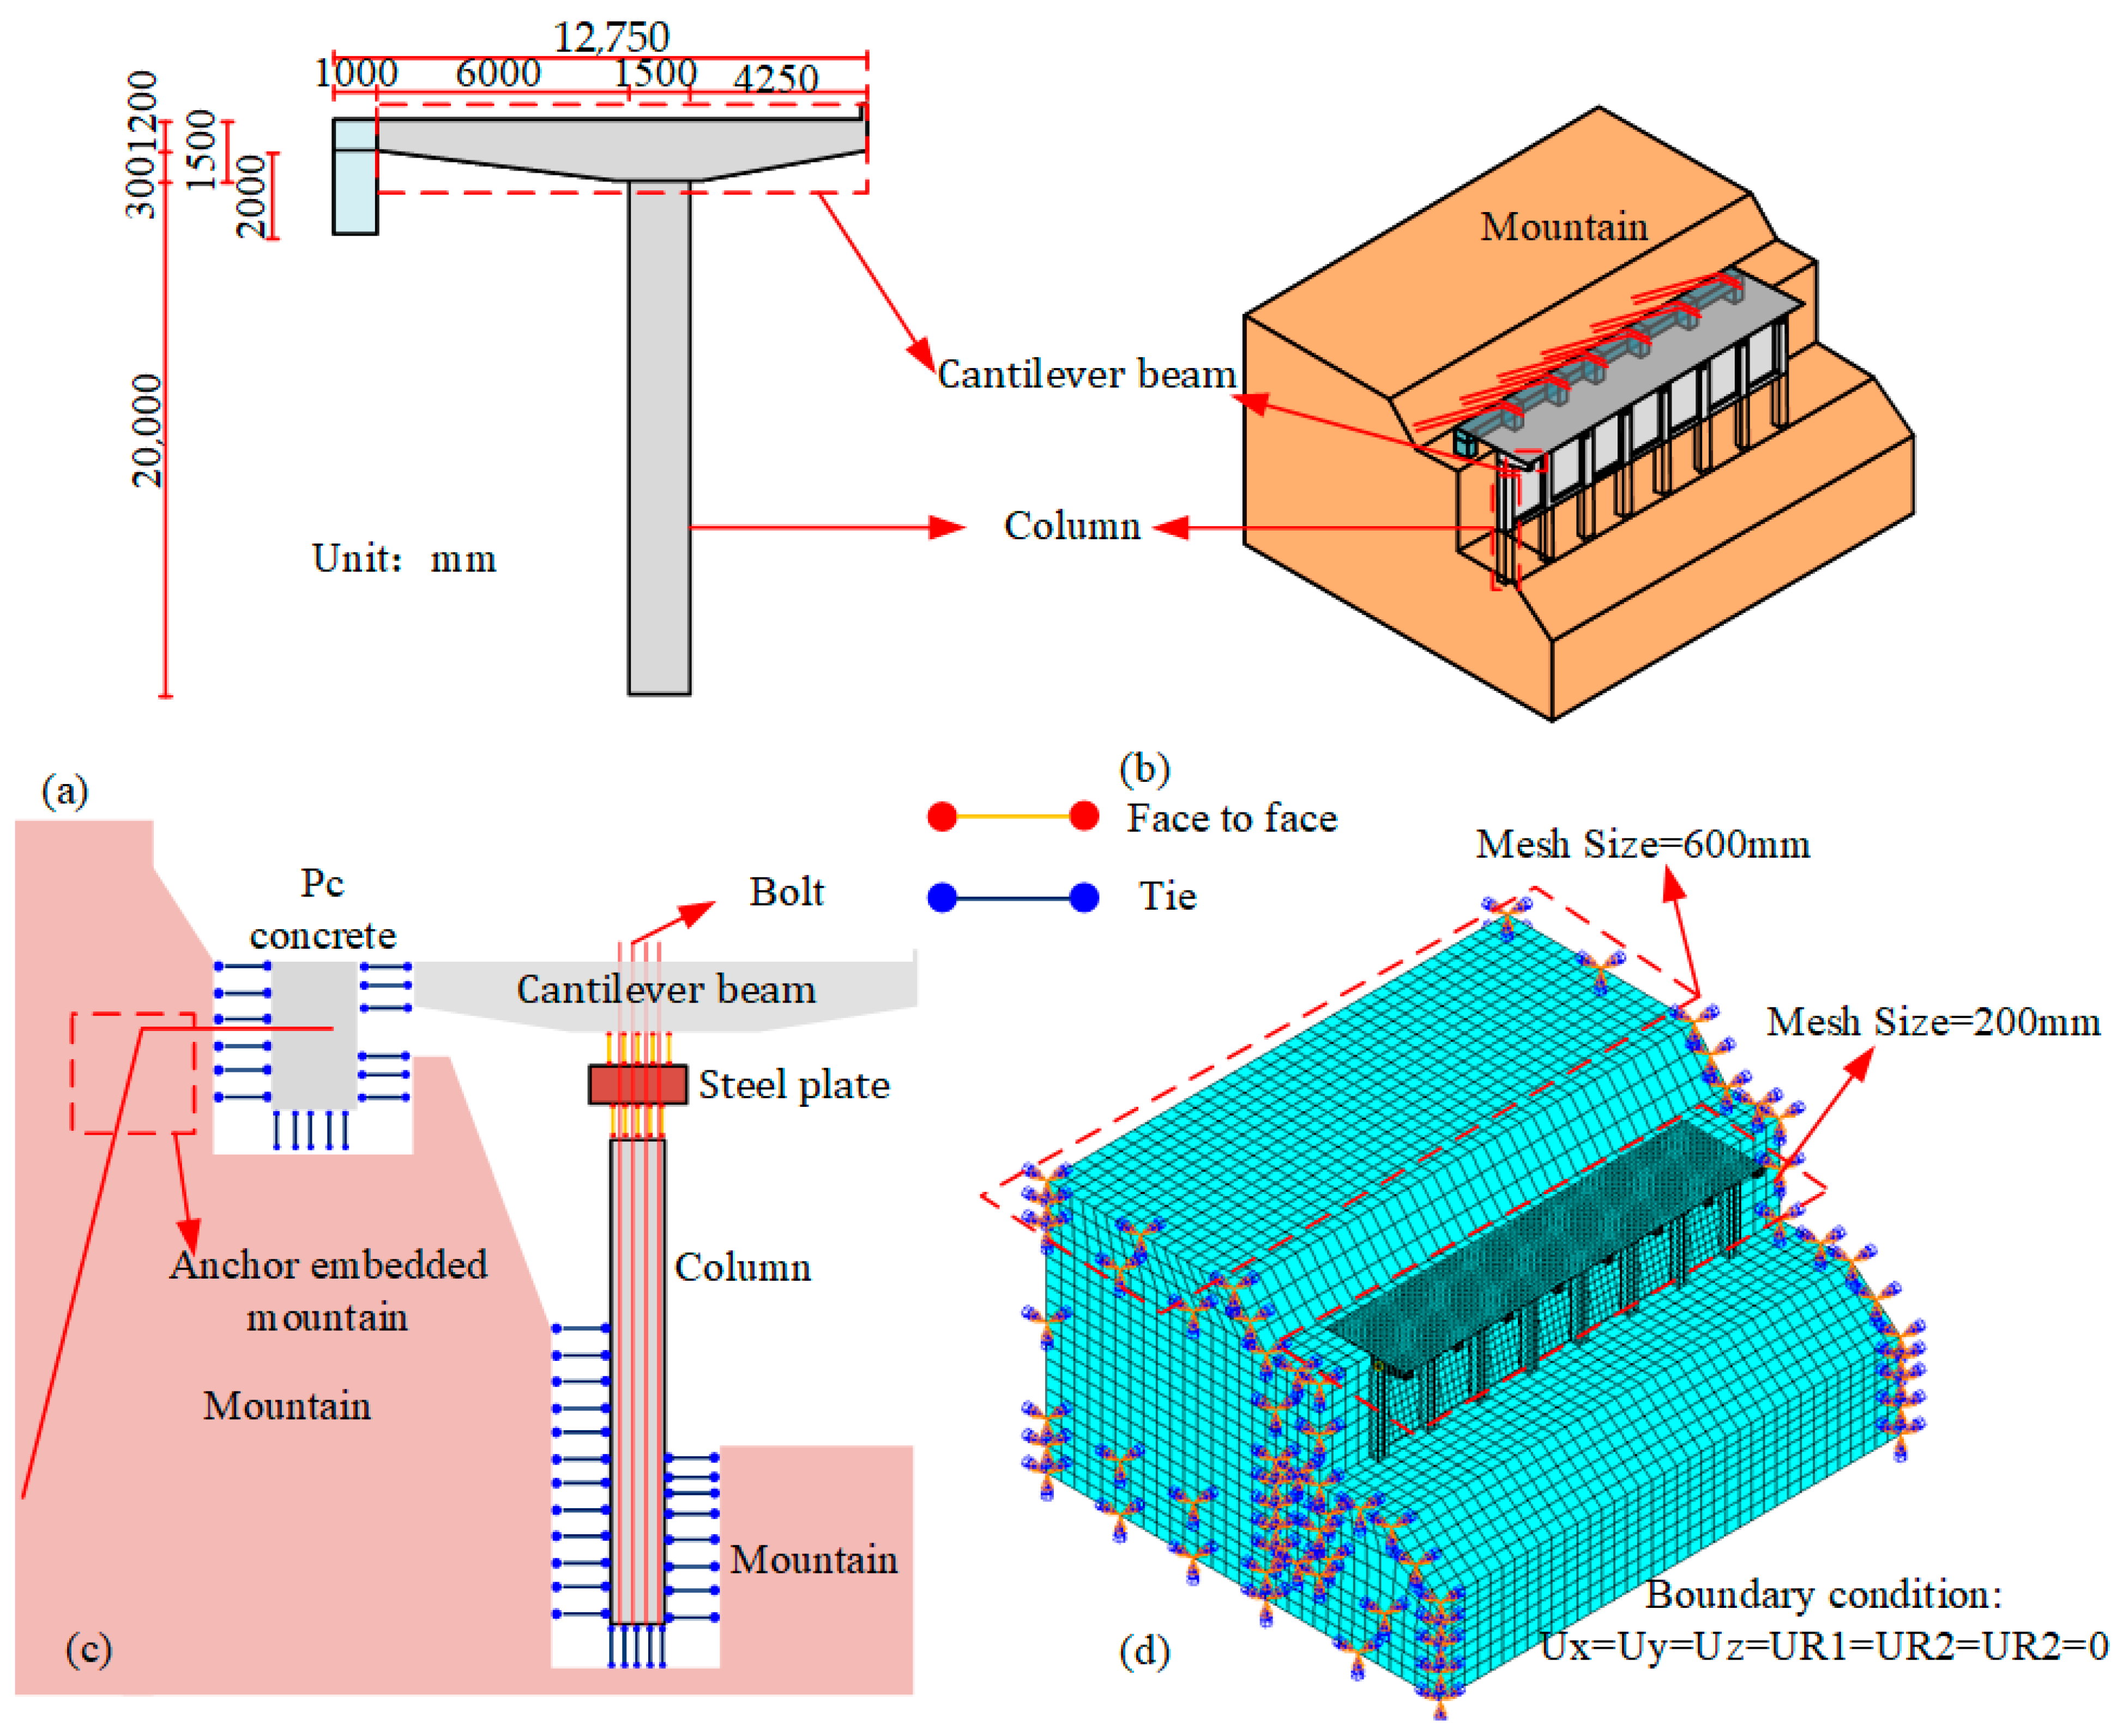
Figure 9 shows the developed FE model for the full-scale PCS roadbed. To minimize the impact of mountain size on the structural response, the mountain body is modeled to be three times the size of the PCS. Figure 9b,c illustrate that the interactions between the cantilever structures, concrete, and reinforcement in the model are consistent with those in the scaled-down model. The bottom and corners of the mountain body are fixed to restrict rotation and displacement, as depicted in Figure 9d.

Figure 9.
Constructed PCS roadbed model: (a) beam–column dimension diagram; (b) full-scale model; (c) interaction details diagram; and (d) mesh size diagram and boundary conditions diagram.
3.3. Full-Scale PCS Model Validation
Figure 10a presents the stress distribution derived from the FE simulation, while Figure 10b compares the stress measurements obtained from both the FE simulation and onsite experiments. The stress values at the measured points show strong consistency between the simulation and experimental results. Although the FE simulation generally predicts slightly lower stress values compared to the onsite measurements, the similar trends and closely aligned stress values validate the model’s accuracy. It is important to note that variations in material properties and uncertainties in boundary conditions can impact both field test outcomes and numerical simulations [44,45]. Future studies should incorporate statistical considerations to account for these variabilities, enhancing the reliability of the findings. Discrepancies between the test and simulation results may also be attributed to environmental factors, such as temperature, humidity, and wind, which can influence onsite tests. Incorporating probabilistic analyses in future work could help evaluate the effects of load variations and diverse environmental conditions on the structure by integrating long-term monitoring data, providing deeper insights into the fatigue and durability of prefabricated cantilever systems under real-world traffic conditions.
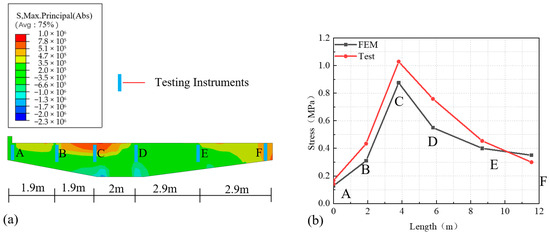
Figure 10.
Comparison of pavement monitoring and simulation results: (a) simulated cantilever beam stress distribution; and (b) comparison of simulated and tested stress.
4. Full-Scale PCS Response Analysis and Optimization Under Traffic Load
4.1. Structural Response Analysis
The following three distinct traffic load conditions are considered in this study: (1) external eccentric loading, (2) internal eccentric loading, and (3) full loading. Eccentric loading is considered the most critical stress condition [46,47,48,49]. External eccentric loading applies the load to the outer side of the cantilever, away from the mountain, resulting in outward bending moments. In contrast, internal eccentric loading places the load on the cantilever’s inner side, near the mountain, generating inward bending moments. Full loading distributes the load evenly across the entire structure, representing the maximum load the structure experiences during regular operation. Figure 11a illustrates the schematic of load distributions for these three scenarios. The lane load and vehicle load are determined according to highway design requirements, as shown in Figure 11b,c. The final applied traffic loads for each scenario are presented in Figure 11d through Figure 11f.
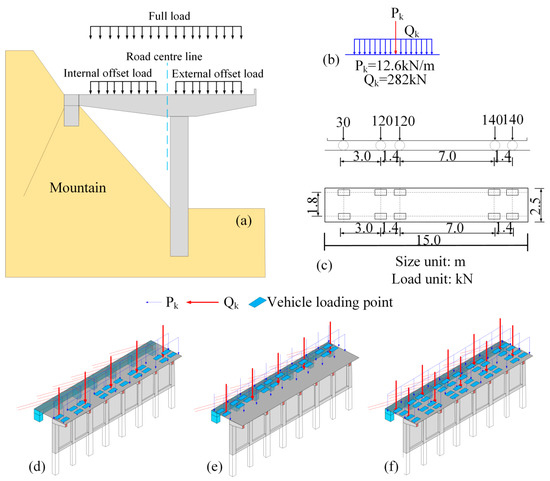
Figure 11.
Traffic loading diagrams: (a) three loading scenarios; (b) lane load diagram; (c) vehicle load diagram; (d) external eccentric loading diagram; (e) internal eccentric loading diagram; and (f) full load distribution diagram.
In the PCS, the cantilever beams are responsible for bearing a variety of loads, including both vertical and horizontal forces, making them the primary load-bearing components. On the other hand, the columns predominantly resist axial forces and are less influenced by these loads. As a result, the analysis is primarily focused on the cantilever beams.
Figure 12, Figure 13 and Figure 14 present the stress responses of the cantilever beam under the following three distinct loading conditions: external eccentric loading, internal eccentric loading, and full loading. Figure 12 illustrates that, under external eccentric loading, the concrete stress in the cantilever beam is predominantly concentrated at the joint between the cantilever beam and the column, with lower stress observed at the two ends of the cantilever beam. The maximum concrete stress value is 1.9 MPa (Figure 12a). The maximum stress in the reinforcement mesh is concentrated at the bottom of the beam–column joint, with a peak stress of 11.2 MPa (Figure 12b). Bolts exhibit significant stress concentrations at their top sections, with a maximum stress value of 18.7 MPa (Figure 12c).
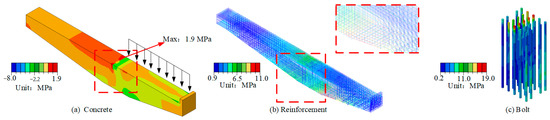
Figure 12.
Stress distribution of the cantilever beam under external eccentric loading.
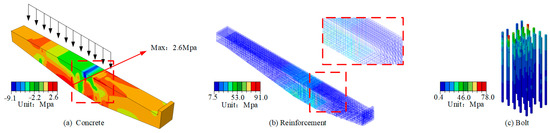
Figure 13.
Stress distribution of the cantilever beam under internal eccentric loading.

Figure 14.
Stress distribution of the cantilever beam under full loading.
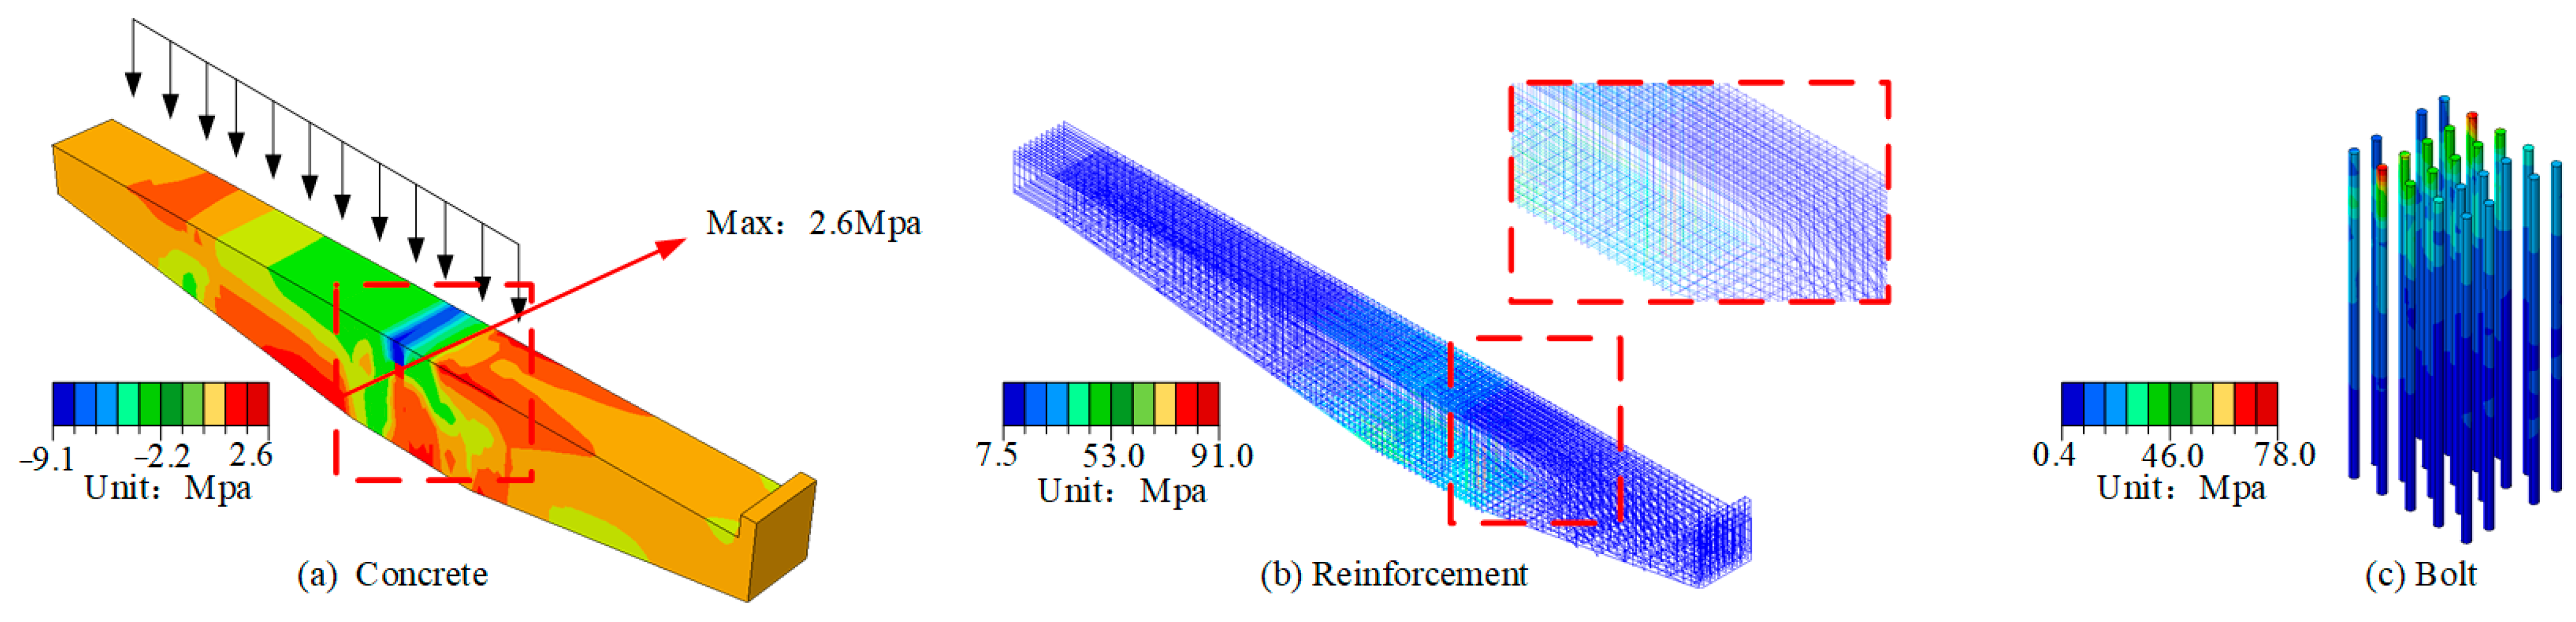
Figure 13 shows that, compared to external eccentric loading, internal eccentric loading results in higher stress values and a larger stress area in the concrete at the cantilever-column joint, with a maximum principal stress of 2.6 MPa (Figure 13a). The stress in the reinforcement mesh and bolts significantly increases, reaching the maximum principal stresses of 90.5 MPa (Figure 13b) and 77.8 MPa (Figure 13c), respectively. These findings indicate that internal eccentric loading exerts a greater impact on the structure’s stability, highlighting its critical role in the overall performance of the cantilever beam. It is noteworthy that under external eccentric loading, the stress in the concrete is lower than that under internal eccentric loading. This is because the internal section of the beam is longer than the external section. Therefore, even though the internal section is adjacent to the mountainside, the longer internal side leads to higher stress in the internal part, whereas the external section experiences comparatively lower stress under external eccentric loading.
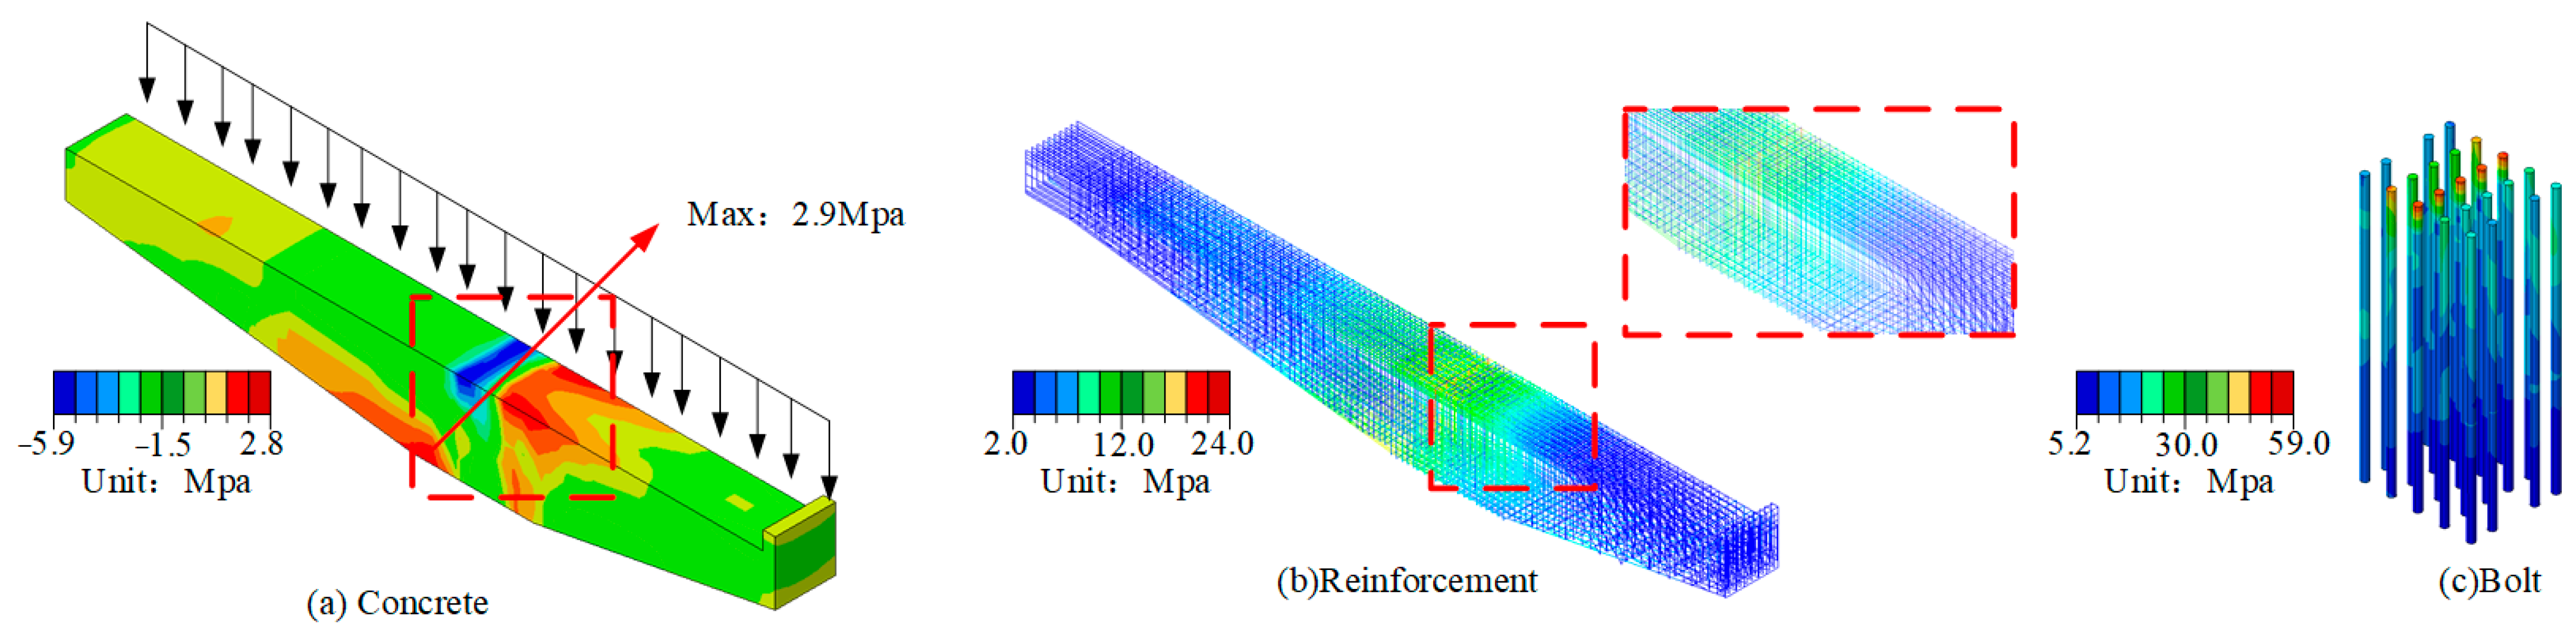
Under full loading, the concrete stress distribution in the cantilever beam is uniform across its middle and upper sections, with the highest principal stress observed at the bottom of the joint, reaching a peak value of 2.9 MPa (Figure 14a). The maximum stress in the reinforcement mesh is similarly concentrated at the bottom of the joint, with a value of 24.4 MPa (Figure 14b). The bolts experience significant stress at their top sections, with the maximum stress reaching 59.2 MPa (Figure 14c).
The stress analysis across different loading conditions reveals that the beam–column joint experiences the highest stress concentration under internal eccentric loading. In this case, both the reinforcement mesh and bolts exhibit significantly higher stress compared to other scenarios, while the concrete also endures considerable stress. However, given that the reinforcement’s yield strength is 345 MPa, the structural reinforcement remains highly reliable. On the other hand, the maximum tensile strength of C50 concrete, at only 4.1 MPa [50,51,52], indicates that the safety margin of the concrete is considerably lower than that of the reinforcement. Consequently, to enhance the structure’s performance under long-term traffic loads, further optimization efforts are incorporated in this study.
4.2. Structural Optimization Based on the Numerical Design
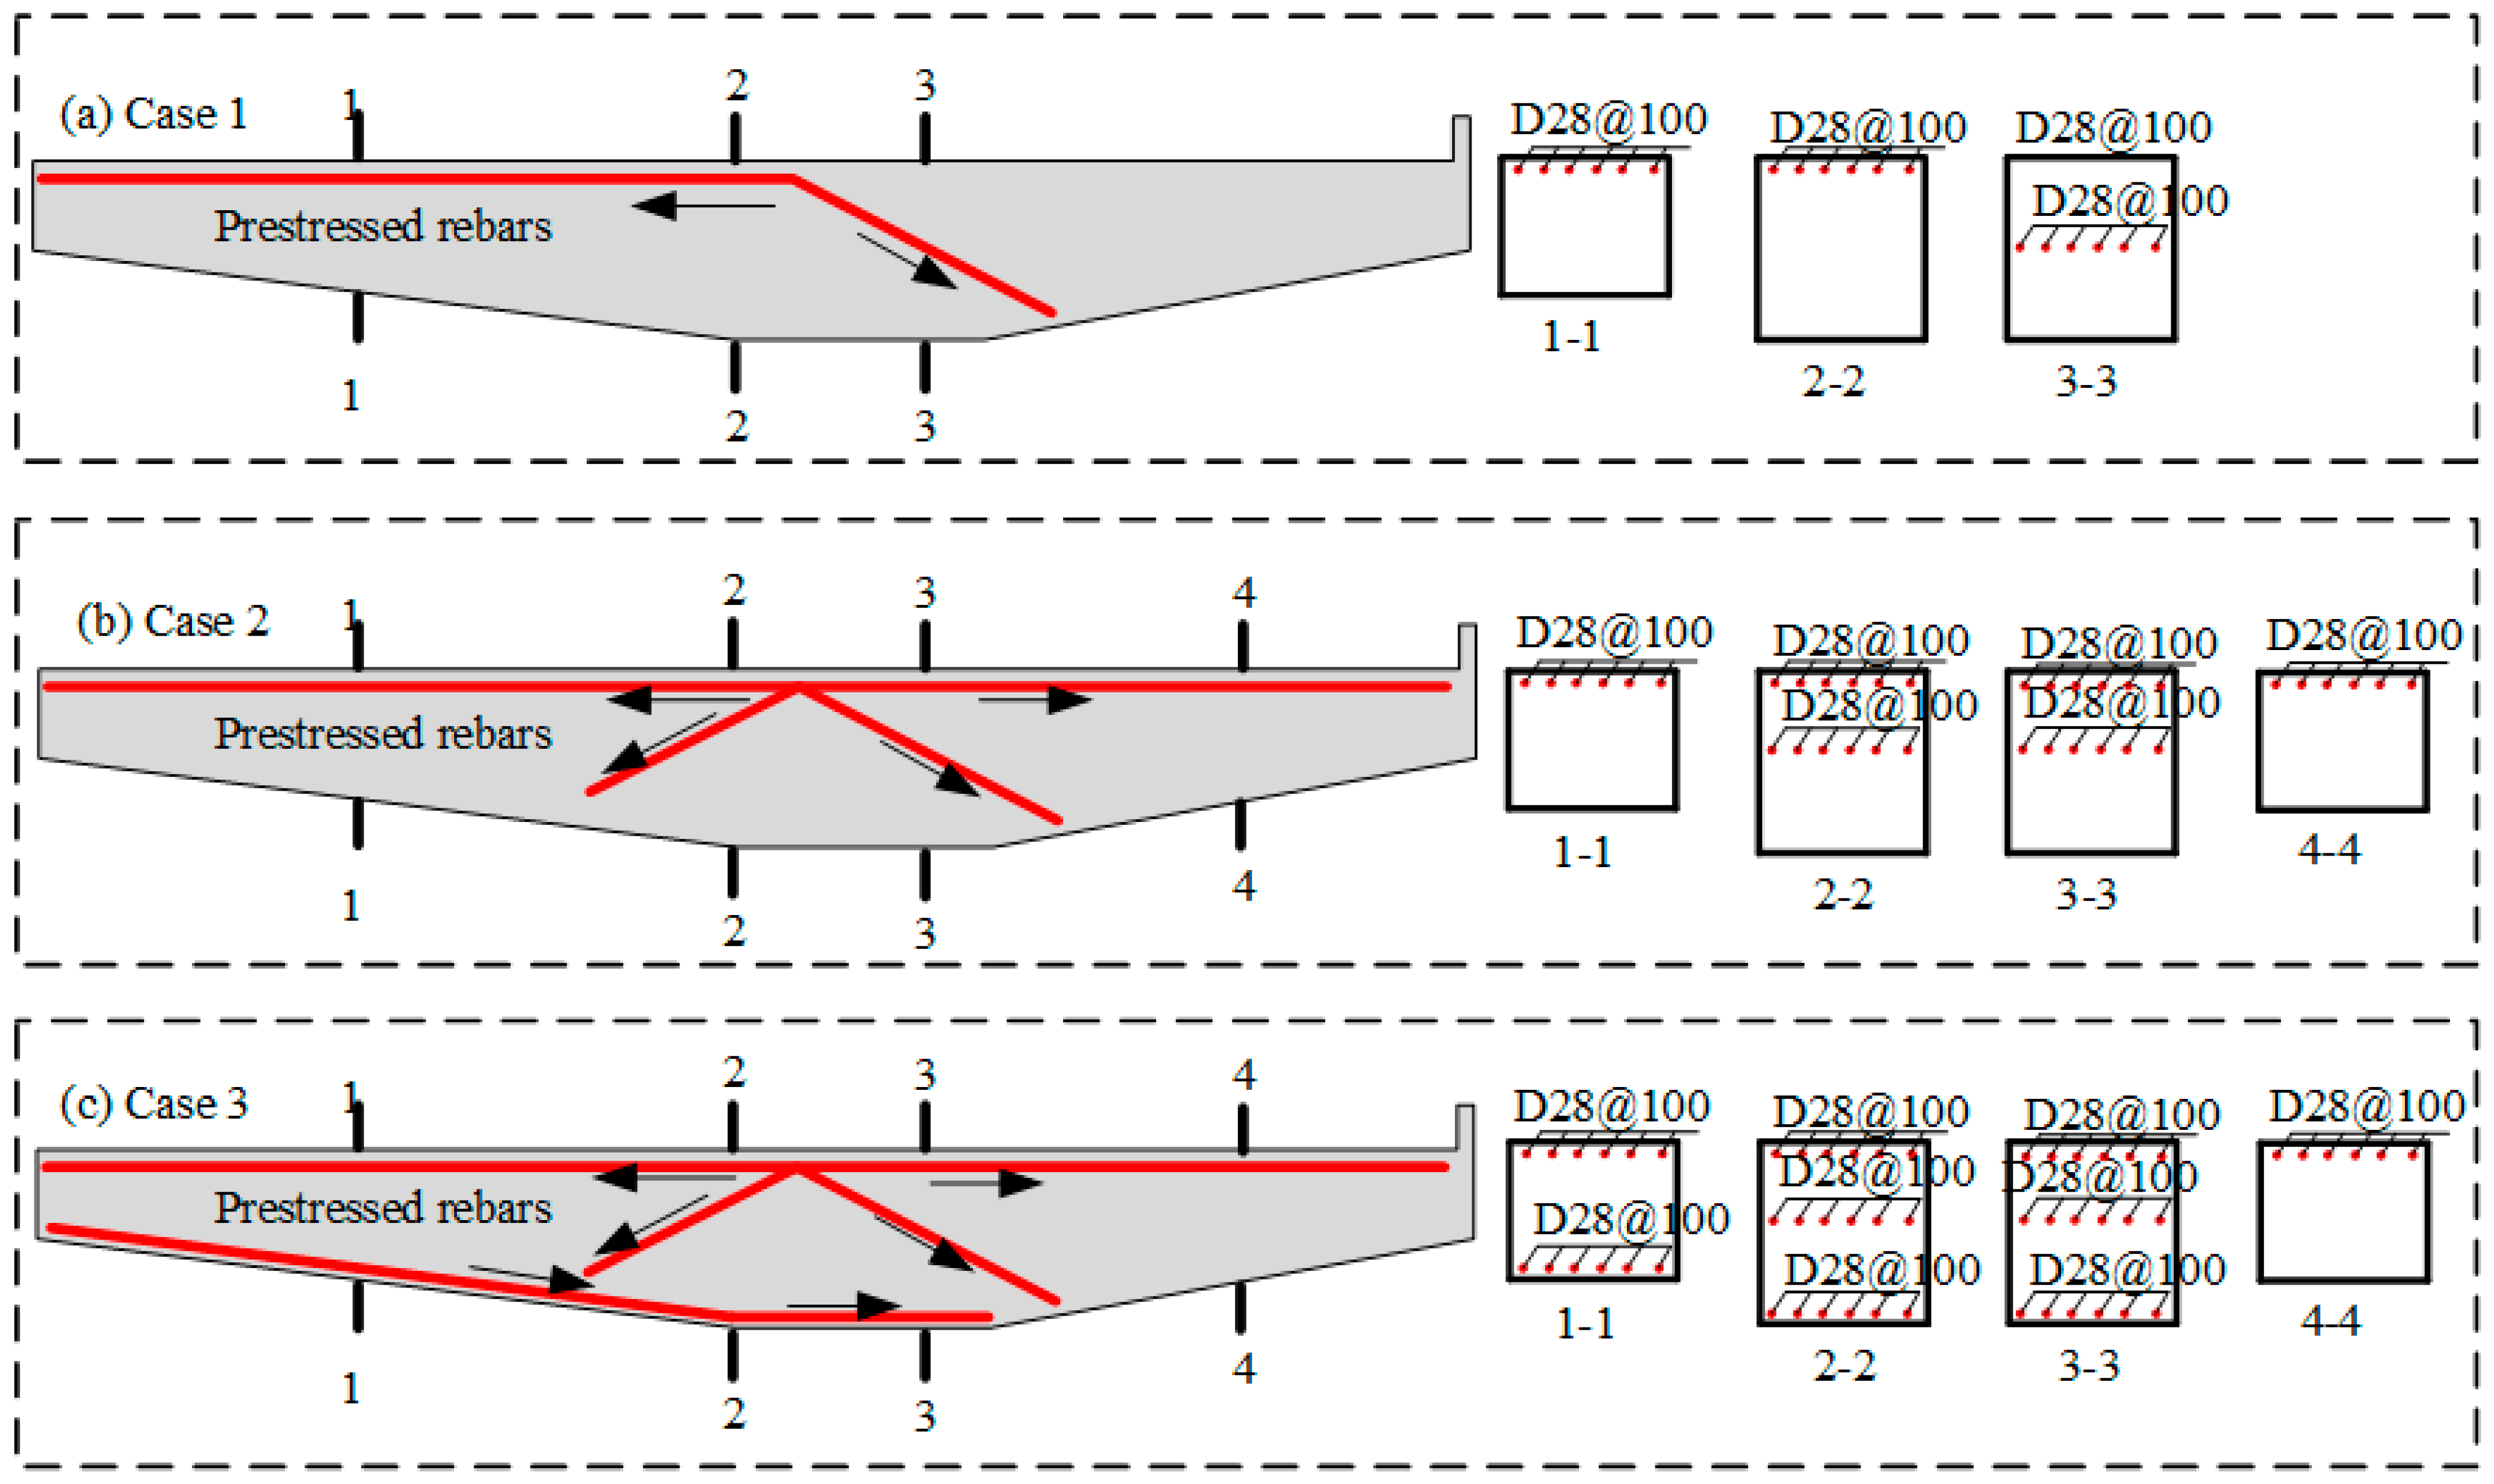
The analysis reveals that the concrete in the cantilever beam experiences relatively high stress, with significant stress concentration and limited safety margins. To improve these safety margins, it is essential to reduce stress in the concrete. One effective solution is the addition of prestressed rebars, which help improve stress distribution and mitigate stress concentration. Prestressing not only counteracts tensile stress in the concrete but also significantly enhances the structure’s crack resistance and overall stiffness [53,54,55]. Based on the findings from Section 3.1, where concrete stress is mainly concentrated at the bottom of the inner end of the beam, three configurations for prestressed rebar placement are proposed, which are illustrated in Figure 15, as follows: Case 1, where prestressed rebars are placed at the upper inner side of the cantilever beam; Case 2, where prestressed rebars are positioned on both the upper inner and outer sides of the cantilever beam; and Case 3, which builds on Case 2 with additional prestressed rebars at the bottom of the inner beam. Each configuration includes six rebars with a 28 mm diameter, spaced 100 mm apart (D28@100), and prestressed to 300 MPa. The main reason for adopting a very low prestress level (300 MPa) in prestressed elements is to prevent the occurrence of unacceptable cracks due to excessive stresses on the components during transportation [22,56]. A lower prestress level reduces the risk of damage during transportation, especially when the components are subjected to transportation vibrations or other external loads. The reduced stress helps effectively decrease stress concentration in the material, thus preventing cracks from forming.
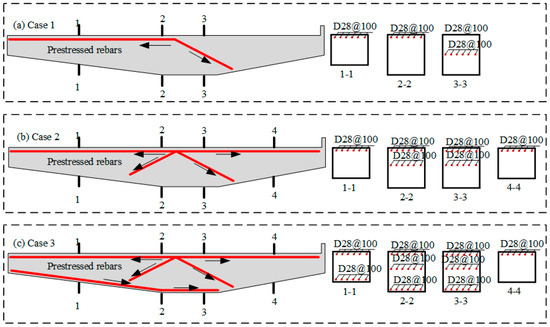
Figure 15.
Prestressed rebar arrangement in cantilever beam.
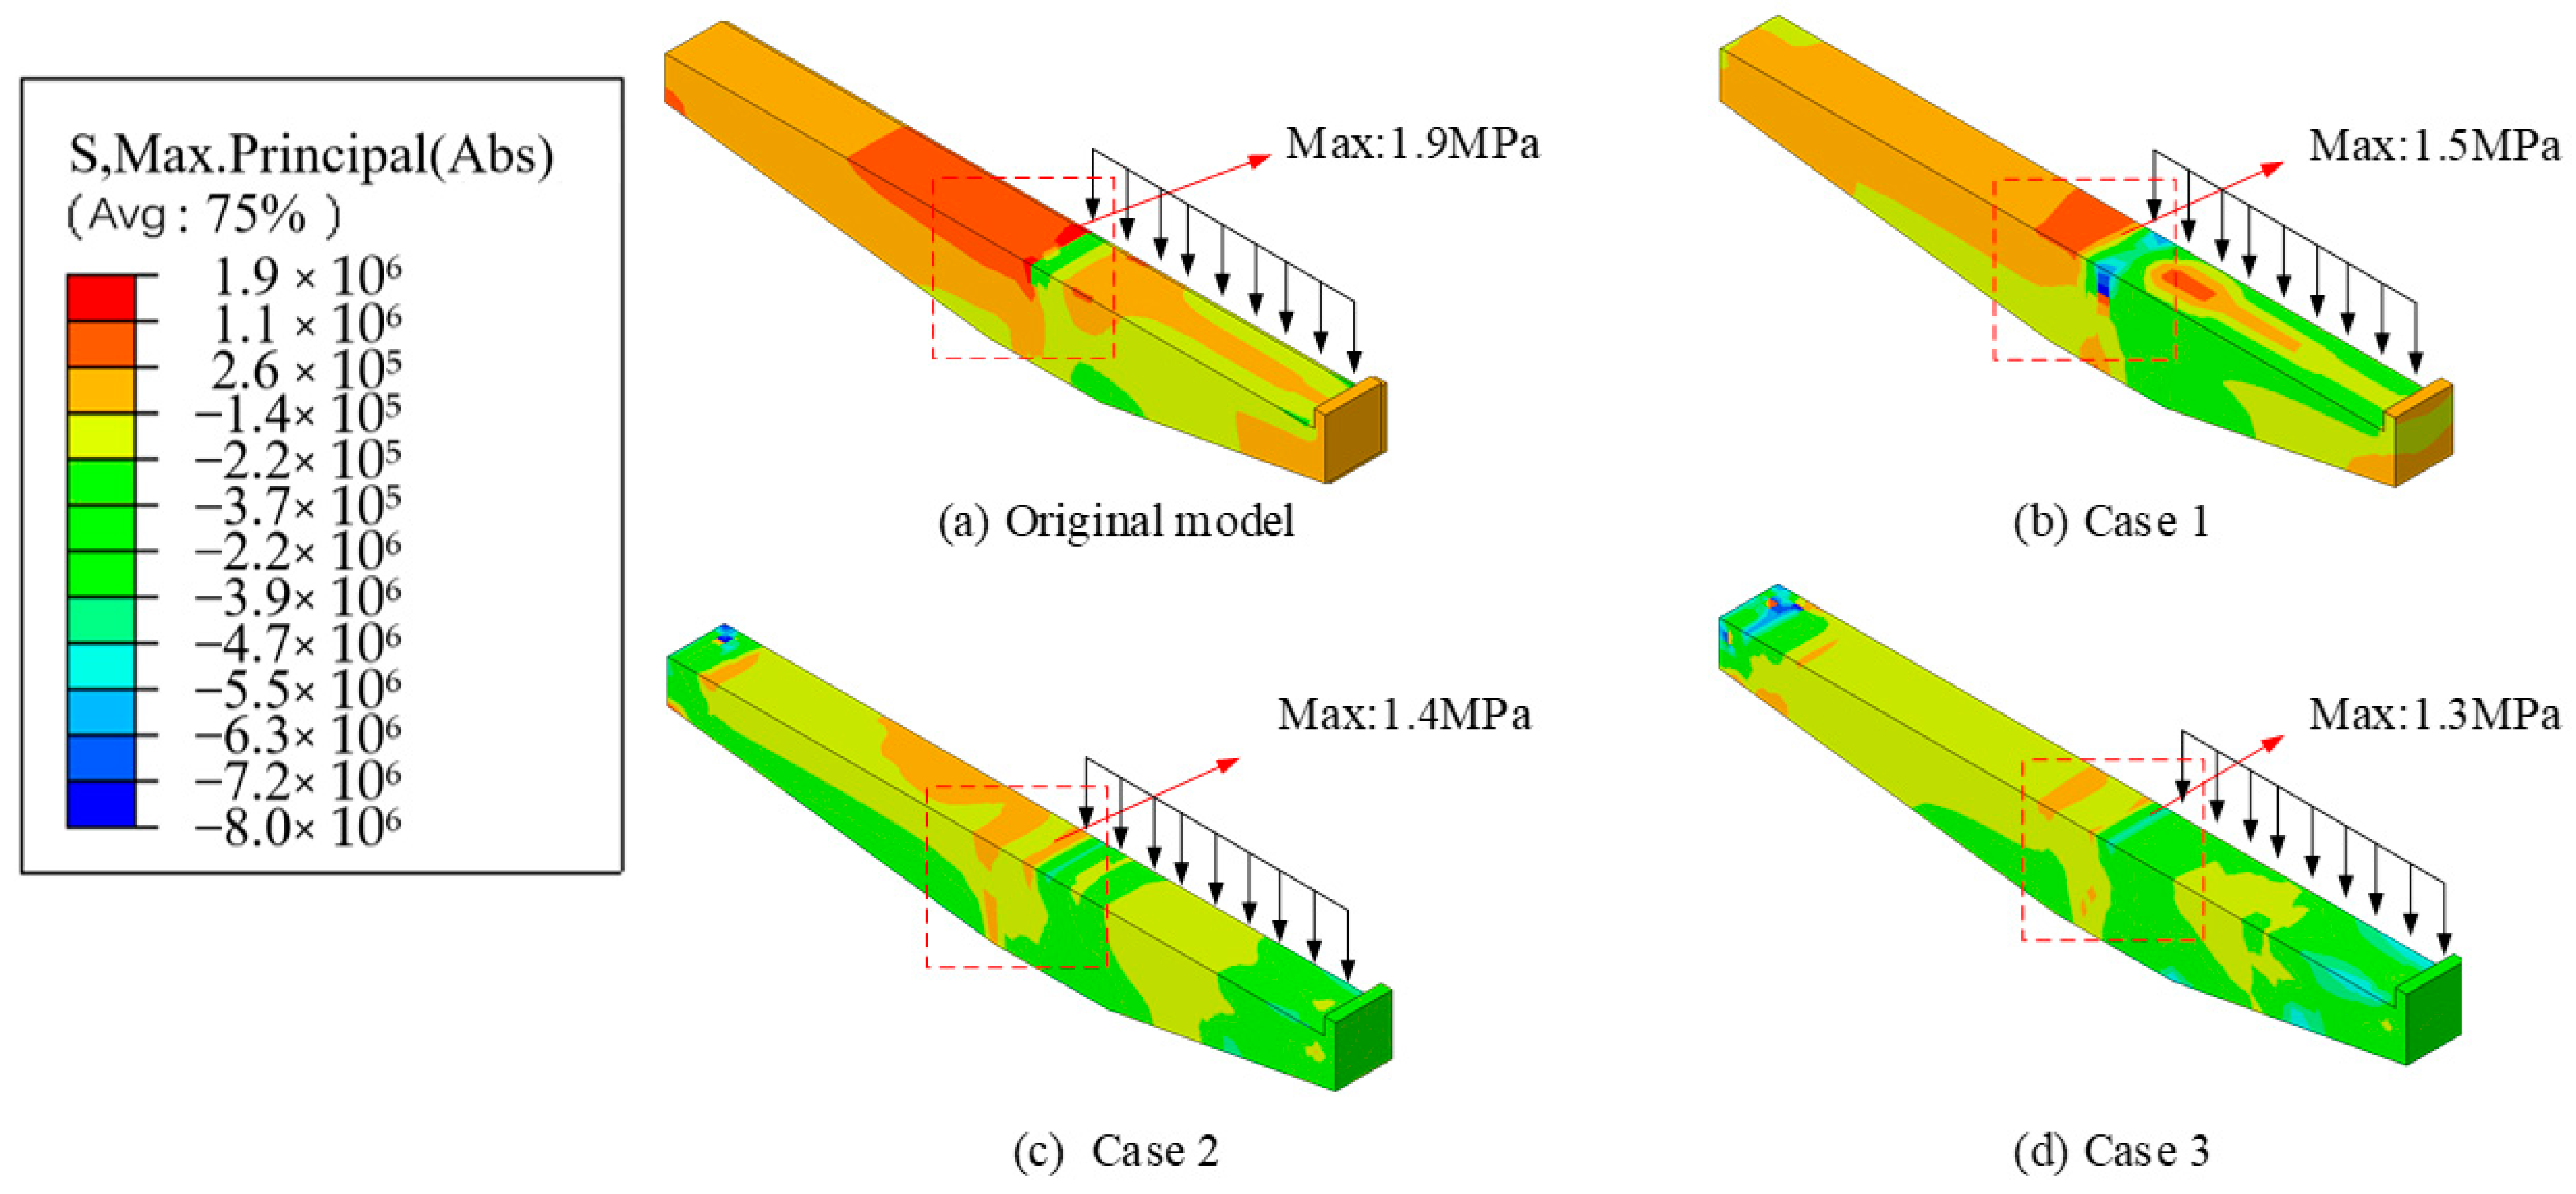
Figure 16, Figure 17 and Figure 18 display the stress distribution of both the original and optimized cantilever beams with prestressed rebars under the following three loading conditions: external eccentric load, internal eccentric load, and full load. Figure 16 illustrates the impact of prestressed rebars on the stress distribution under external eccentric loading. The addition of prestressed rebars significantly reduces the tensile stress at the top of the inner side of the beam and the beam–column joint. In Case 1, where prestressed rebars are placed only on the inner side of the beam, the maximum stress is reduced to 1.5 MPa (Figure 16b), although stress concentration remains, particularly at the top of the beam–column joint. In Cases 2 and 3, where rebars are added to both the inner and outer top surfaces, the stress concentration is notably decreased, with the maximum stress values dropping to 1.4 MPa (Figure 16c) and 1.3 MPa (Figure 16d), respectively. This demonstrates that positioning prestressed rebars on both the inner and outer top surfaces significantly reduces stress concentration, thereby improving the bending and shear resistance of the cantilever beam under external eccentric loading.
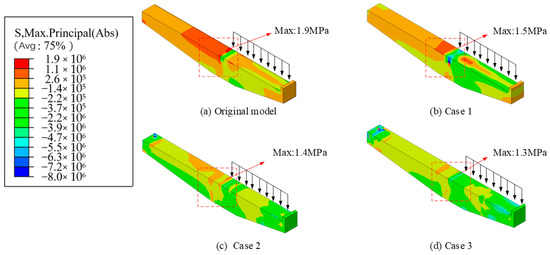
Figure 16.
Concrete stress distribution under external eccentric load.
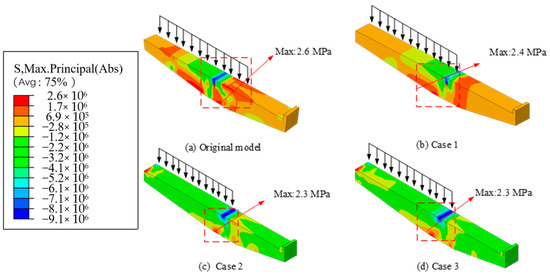
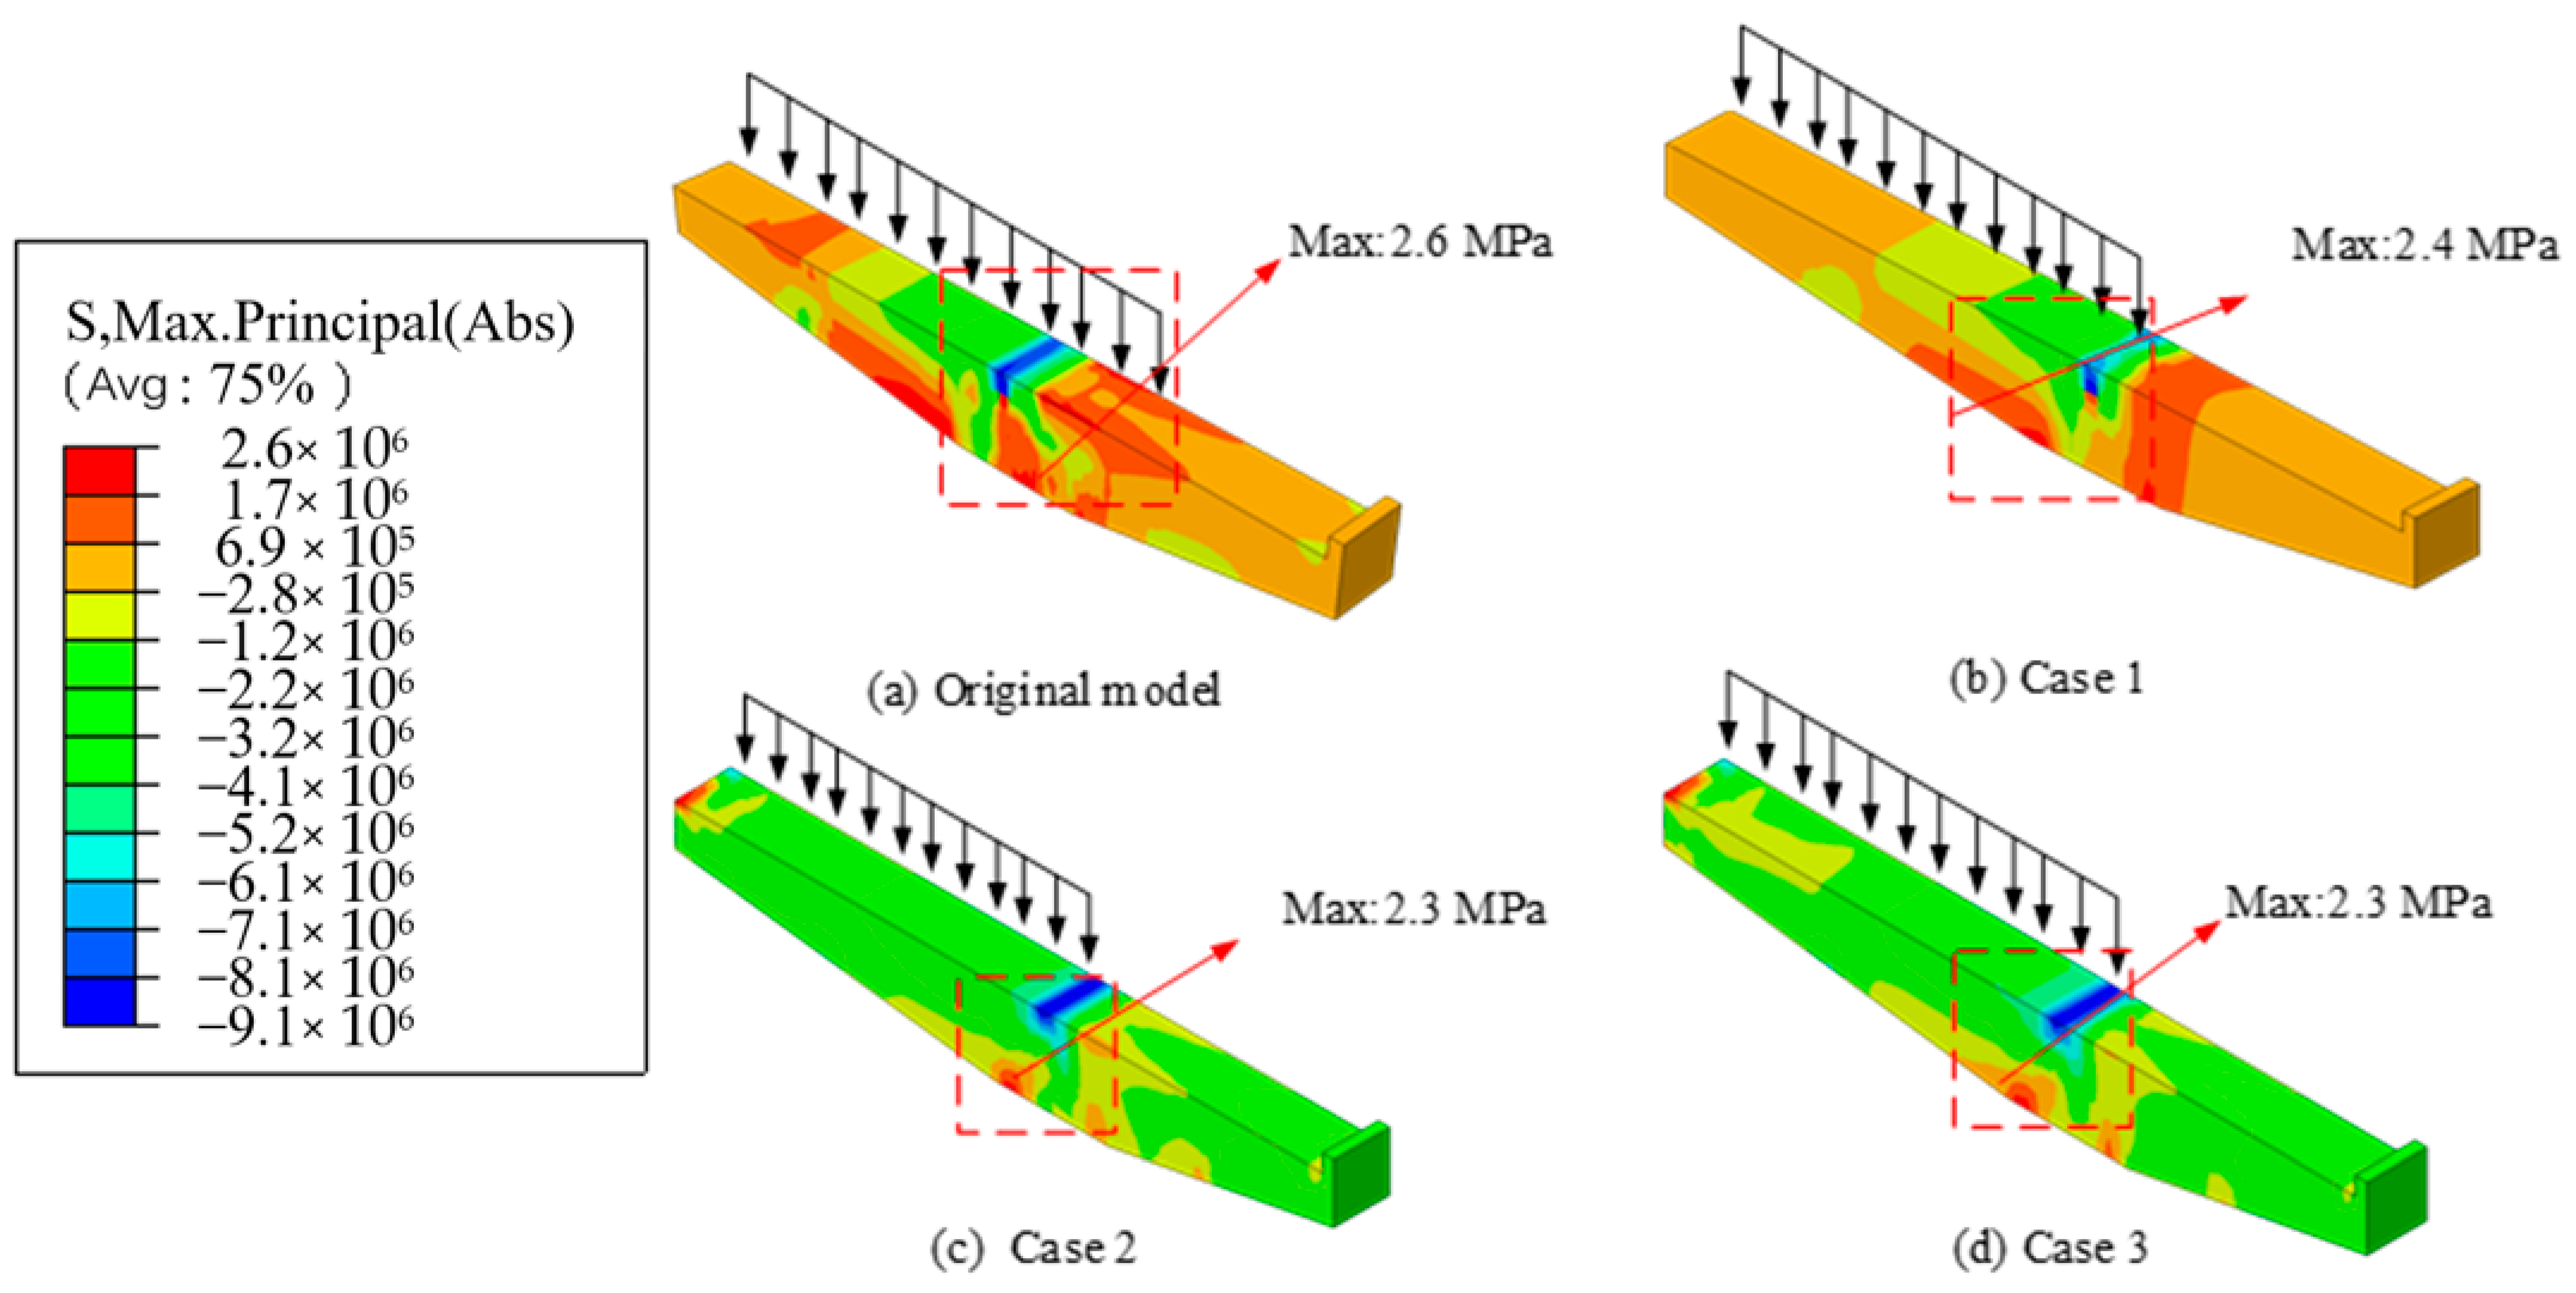
Figure 17.
Concrete stress distribution under internal eccentric load.

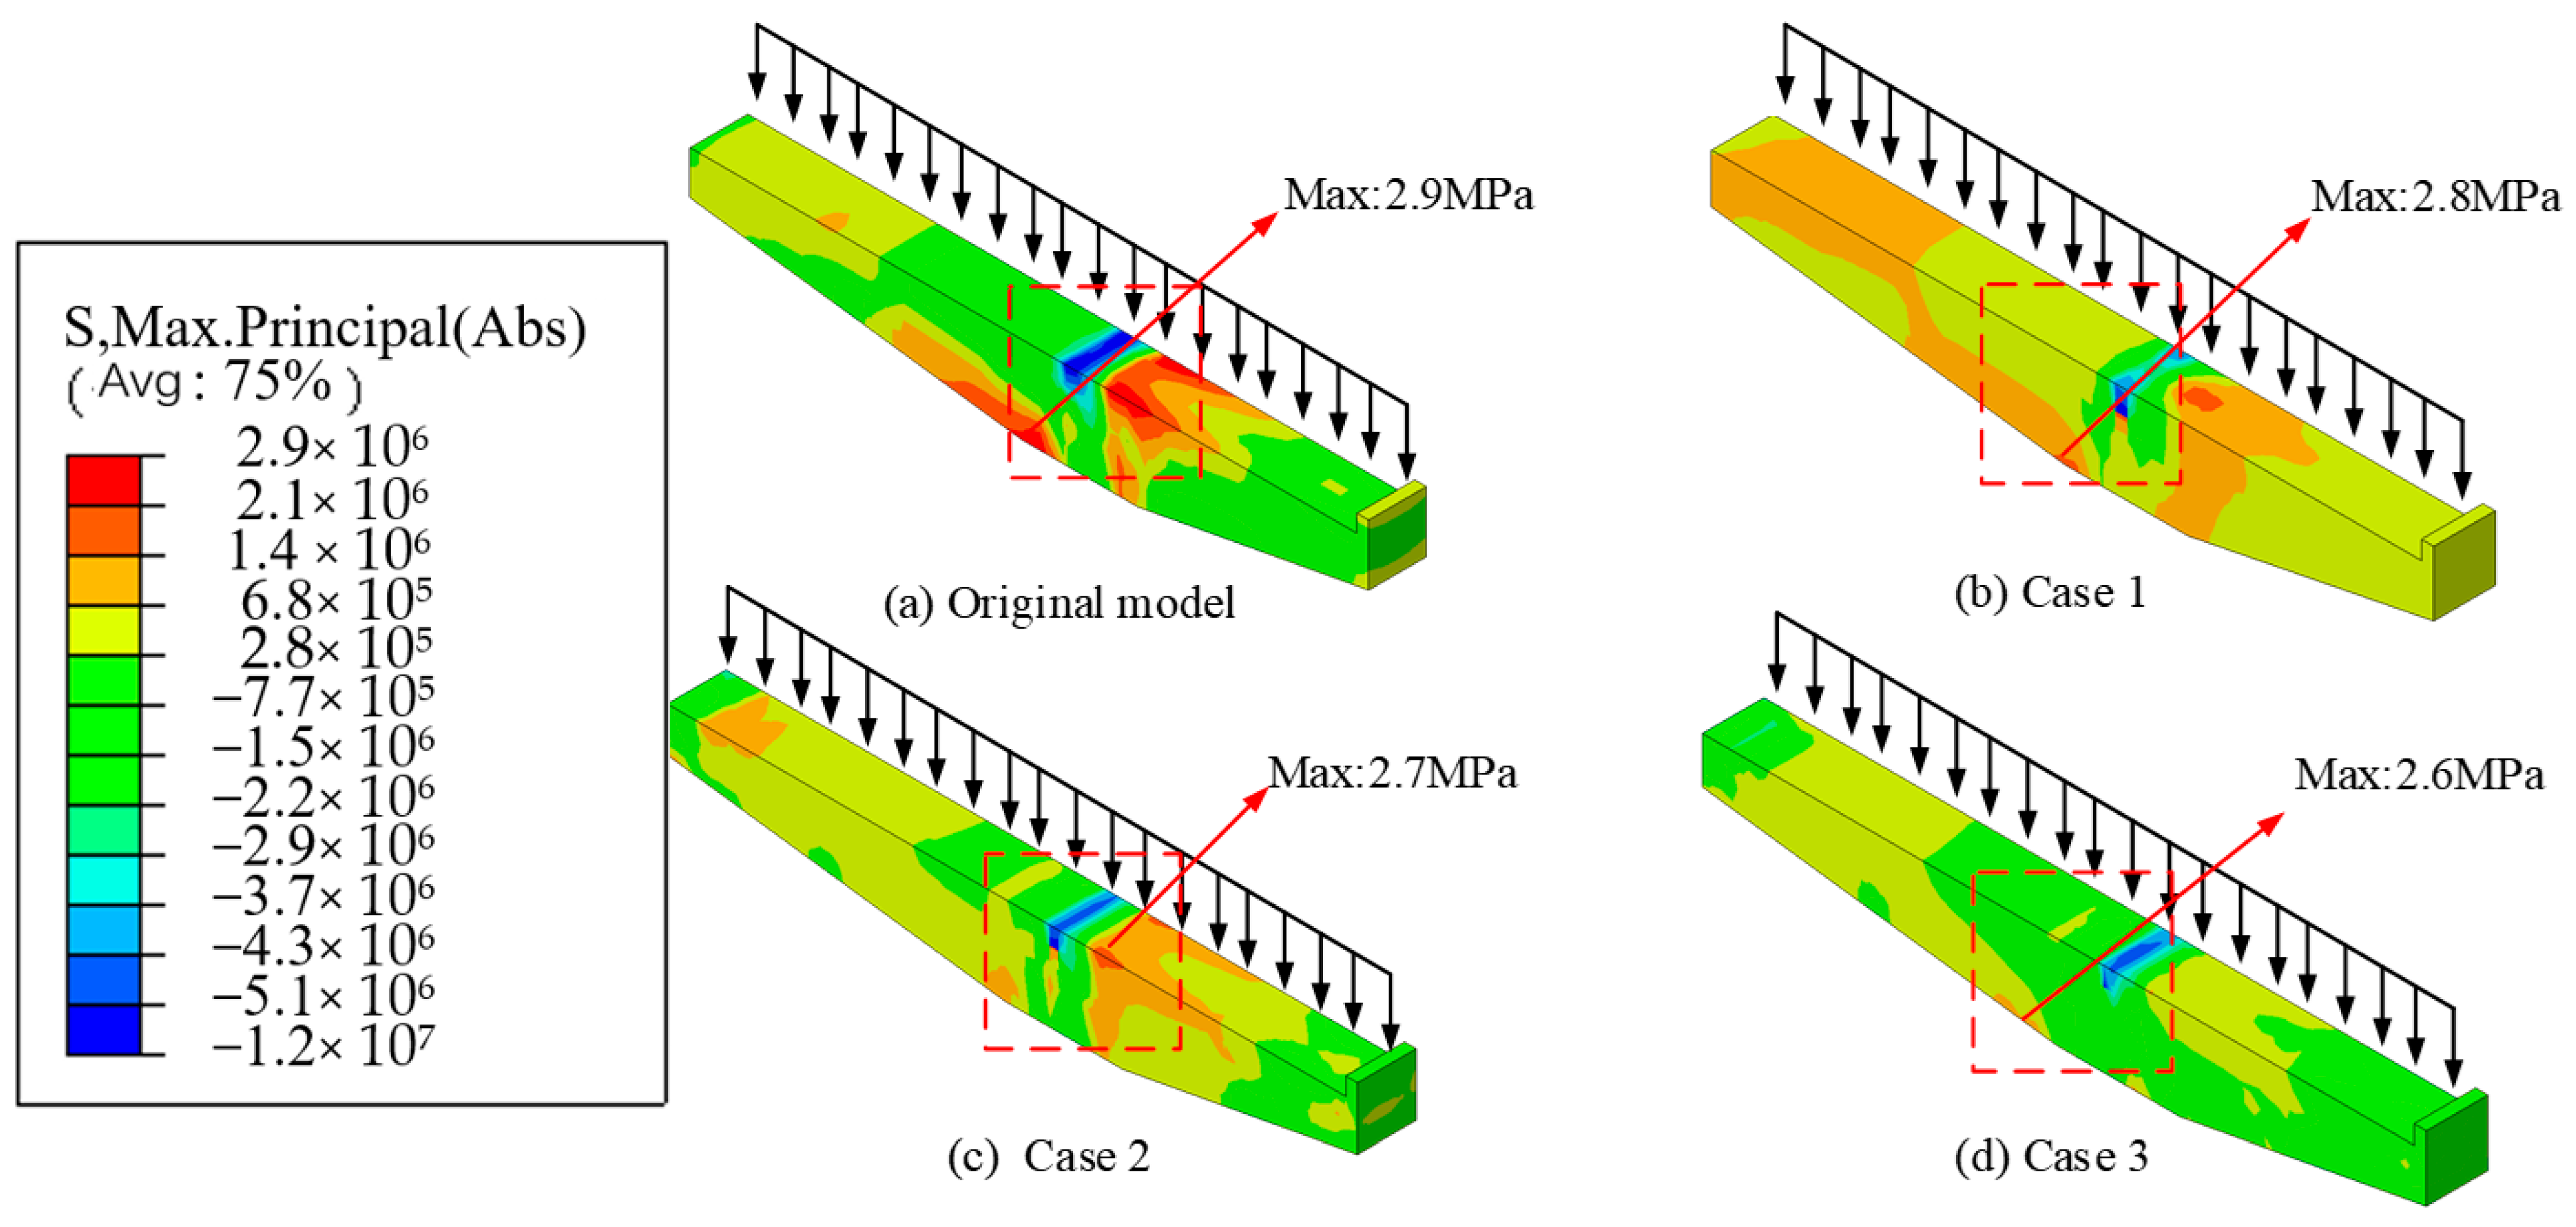
Figure 18.
Concrete stress distribution under full load.
Figure 17 demonstrates that the addition of prestressed rebars greatly reduces stress levels in the cantilever beam, particularly at the midsection and the bottom of the beam–column joint, under internal eccentric loading. In Case 1, where prestressed rebars are positioned only on the inner side, the high-stress area at the beam–column joint is reduced, but a concentrated stress zone still exists (Figure 17b). In contrast, Cases 2 and 3, where additional prestressed rebars are placed on the outer beam, further decrease the high-stress area, improving the overall uniformity of stress distribution and reducing the maximum stress. These cases show only a small high-stress region at the bottom of the inner beam–column joint (Figure 17c,d). This suggests that positioning prestressed rebars on both the upper inner and outer sides of the beam significantly improves the uniformity of stress distribution under internal eccentric loading.
Figure 18 illustrates that the inclusion of prestressed rebars significantly lowers stress levels at both the bottom of the outer beam–column joint and the tensile zone at the inner beam–column joint under full loading. In Case 1, with prestressed rebars only on the inner side, the maximum stress is reduced to 2.8 MPa (Figure 18b), but the stress in the high-stress area remains notable. In Case 2, the further optimization of prestressed rebar placement lowers the maximum stress to 2.7 MPa (Figure 18c), alleviating stress concentration and achieving a more uniform distribution of tensile stress, although some significant stress remains at the outer beam–column joint. In Case 3, the addition of prestressed rebars at the bottom of the inner beam further reduces maximum stress to 2.6 MPa (Figure 18d), completely eliminating the high-stress area at the outer beam–column joint. These findings demonstrate that positioning prestressed rebars on the upper inner and outer surfaces, as well as the bottom inner beam, optimizes stress distribution under full loading. The results above demonstrate that placing prestressed rebars on the top inner and outer surfaces of the cantilever beam (Case 2) significantly improves stress distribution under both internal and external eccentric loading.
4.3. Load-Bearing Capacity of Optimized Structures
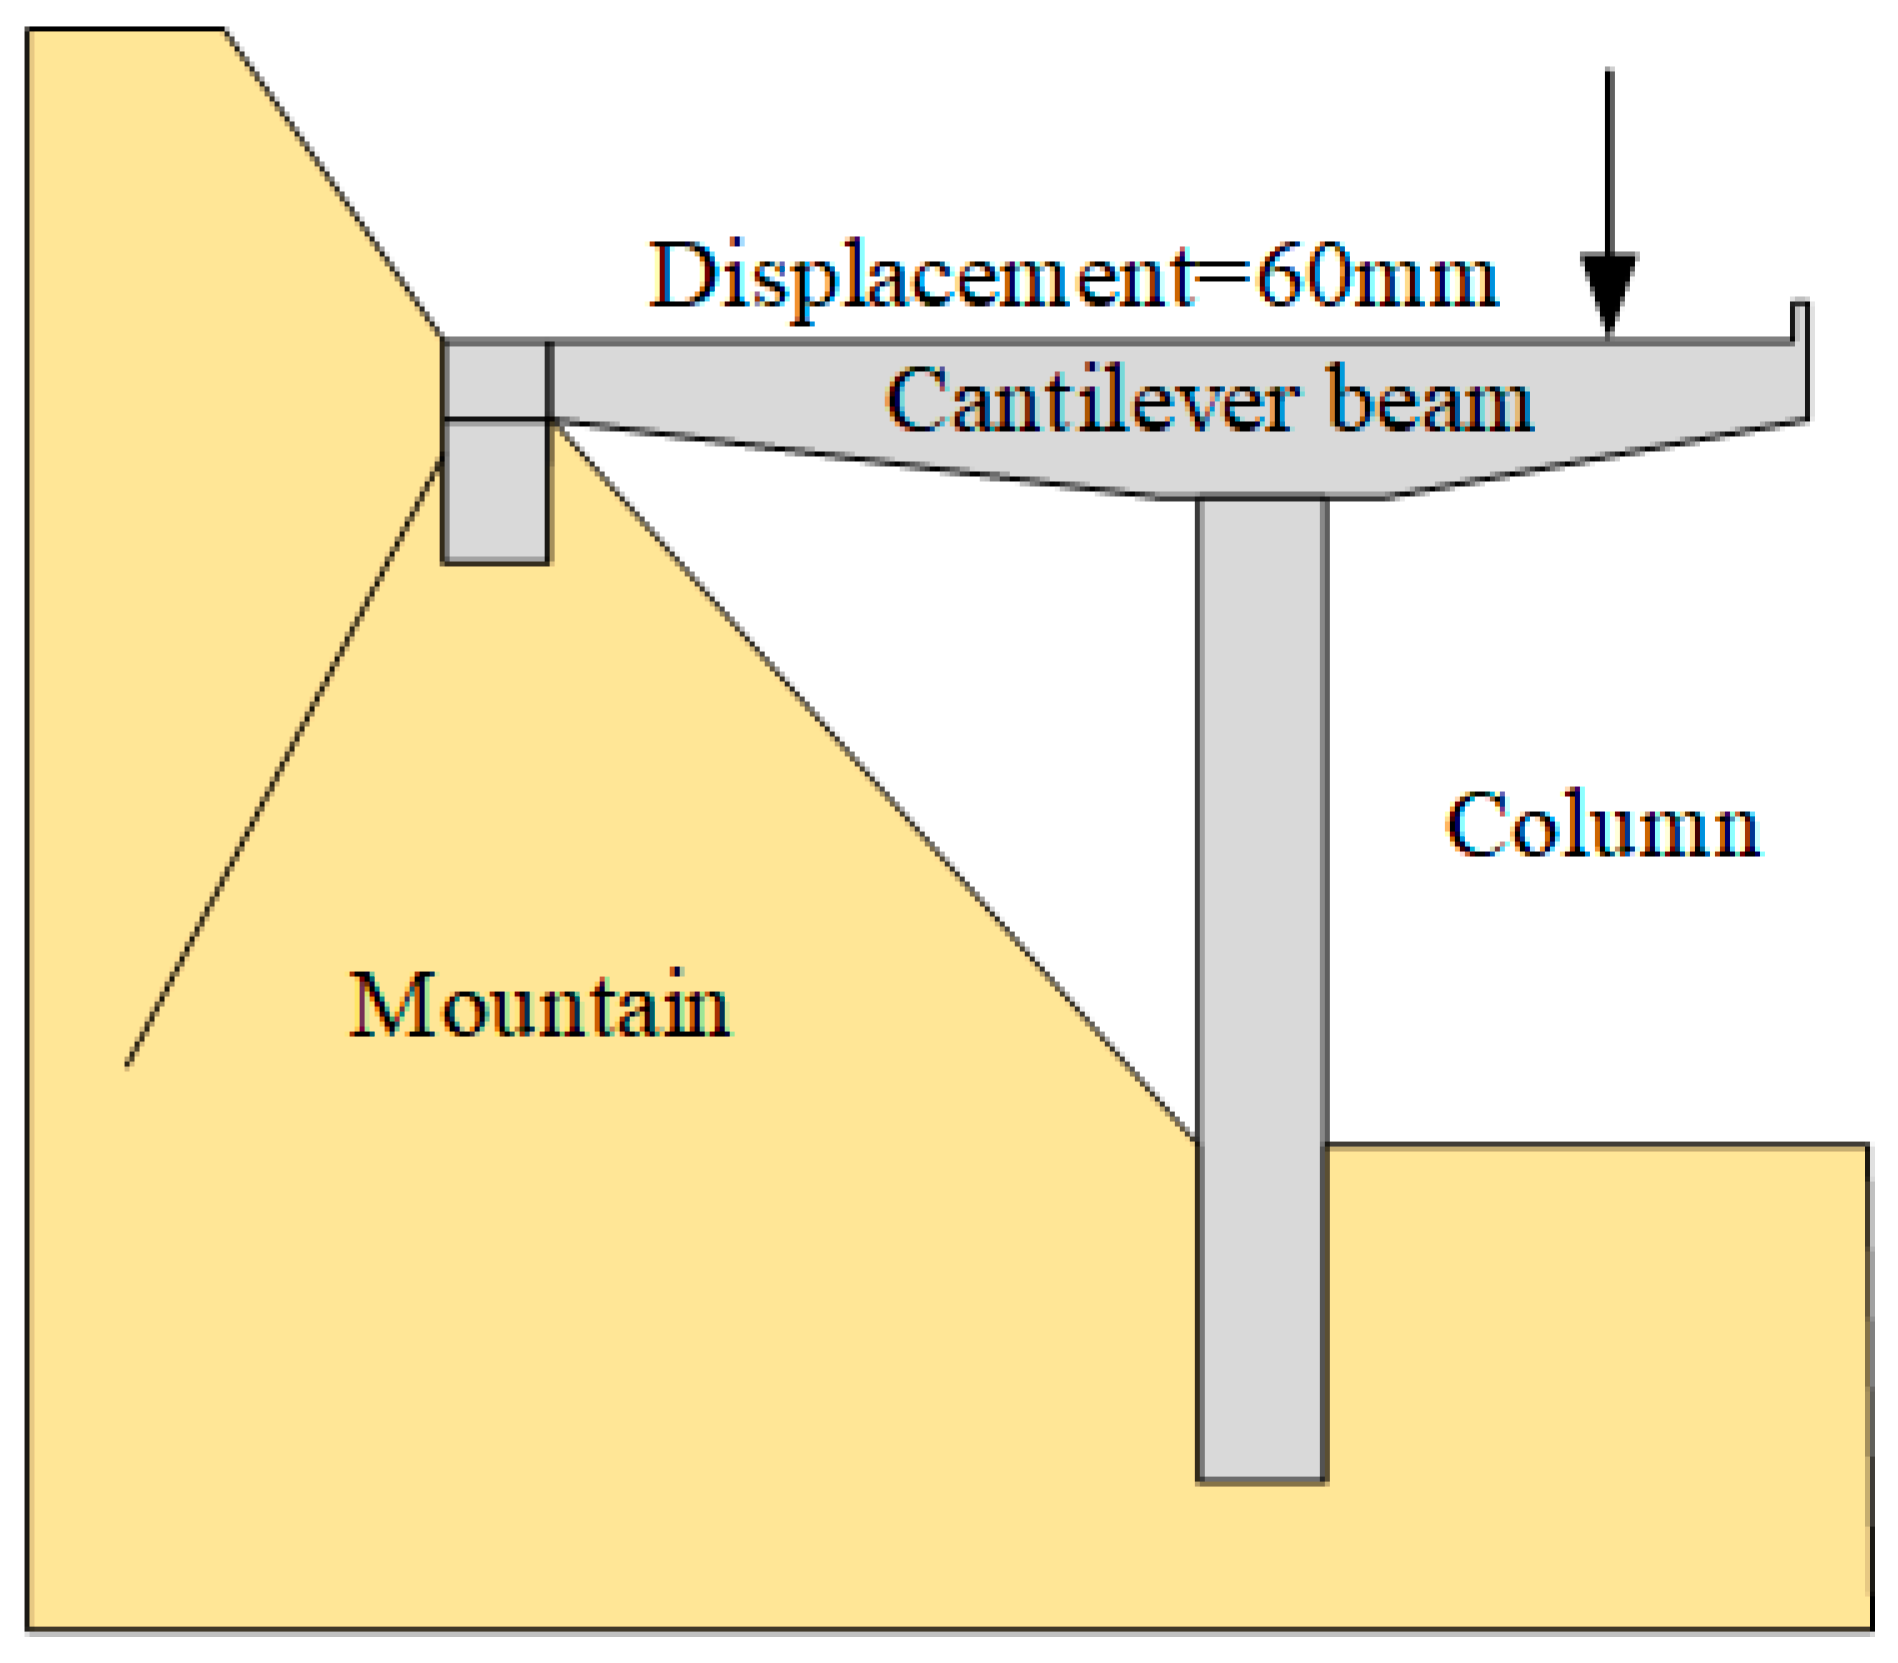
The incorporation of prestressed rebars and the application of prestressing have a substantial effect on the load-bearing capacity of cantilever structures [57,58,59]. To fully assess the performance of the optimized cantilever structure, further simulation analysis of its load-bearing capacity was conducted. As illustrated in Figure 19, a displacement control method was employed to apply a downward vertical displacement at the most unfavorable position of the entire structure. This method facilitates the investigation of the load-bearing capacity and overall stability of the structure under various optimization scenarios.
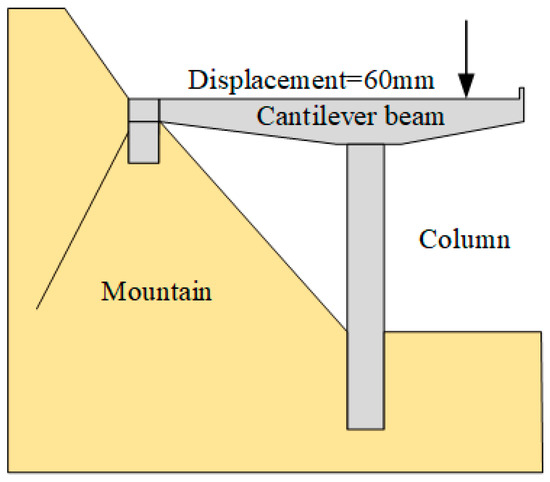
Figure 19.
Schematic diagram of the loading method.
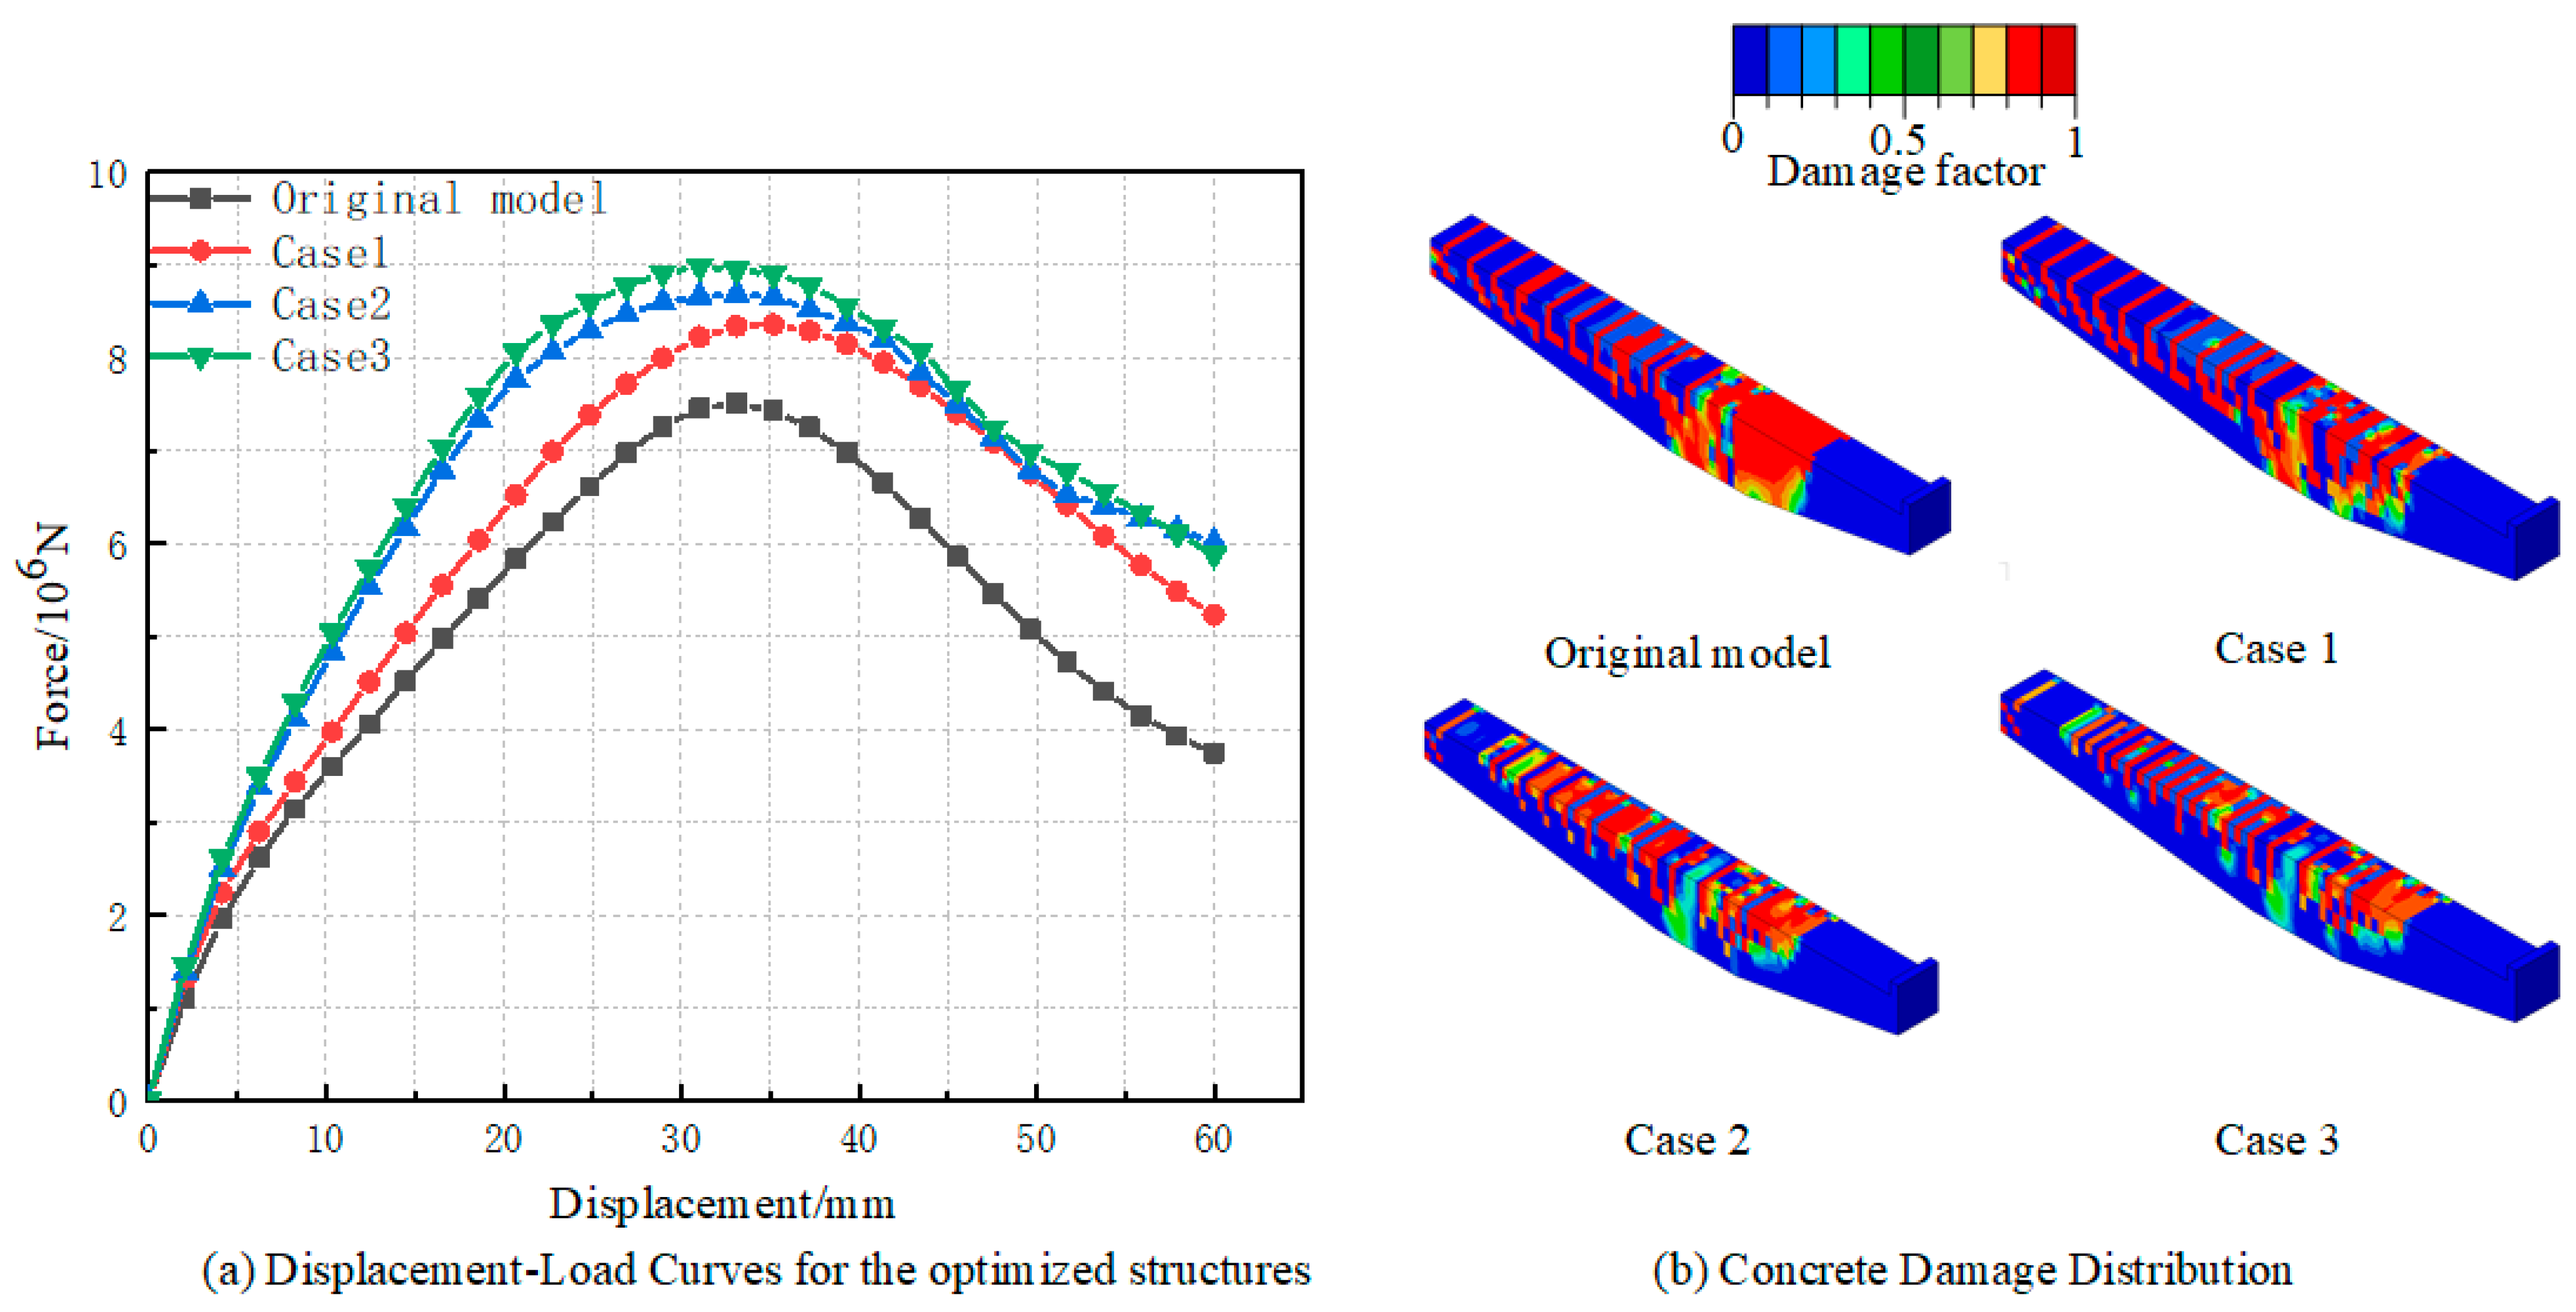
Figure 20 presents the displacement-load curves and final damage distribution for both the original and optimized cantilever structures. As shown in Figure 20a, during the initial loading phase, the original model exhibits the smallest slope, reflecting its lowest initial stiffness. With the addition of prestressed rebars, the initial stiffness of Cases 1, 2, and 3 gradually increases. Notably, Cases 2 and 3 demonstrate significantly higher initial stiffness compared to both the original model and Case 1, emphasizing the positive effect of prestressed rebars on the overall stiffness of the structure. Regarding peak load, the original model has the lowest capacity, while the optimized models show progressive improvements, with Case 3 achieving the highest peak load, indicating a substantial enhancement in load-bearing capacity. Finally, the analysis of the descending segment reveals that the original model’s load-bearing capacity declines the fastest, while the optimized models exhibit a more gradual reduction. Cases 2 and 3, which have the lowest descending segments, suggest that the optimized structures offer superior ductility. The damage distribution shown in Figure 20b reveals that, in the original model, damage is primarily concentrated at the upper part of the inner beam and the beam–column joint. In Case 1, the prestressed rebars placed at the upper inner side of the beam significantly alleviate damage at the beam–column joint, demonstrating the effectiveness of prestressed rebars in mitigating stress concentration and enhancing the overall structural integrity. In Cases 2 and 3, a further reduction in the damage of the beam–column joint is observed, indicating that placing prestressed rebars on both the inner and outer sides of the beam effectively reduces damage at this critical junction, improves stress distribution, and prevents the propagation of damage. In summary, the analysis demonstrates that placing prestressed rebars at the top of the cantilever beam significantly enhances the overall structural stiffness, peak load capacity, and ductility, while also delaying the onset of structural damage. This optimization leads to a more balanced stress distribution, thereby playing a vital role in improving the stability and safety of the structure.
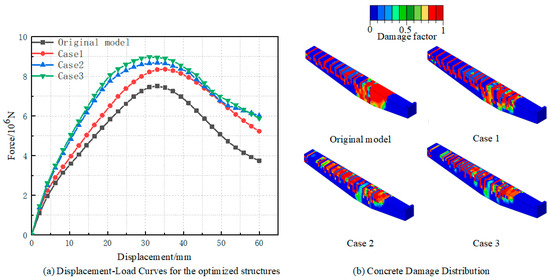
Figure 20.
Finite element calculation results.
5. Conclusions
This research investigates the performance of a novel prefabricated cantilever structure (PCS) roadbed subjected to various traffic load distributions, incorporating laboratory and field tests along with numerical simulations, all based on an actual mountainous road construction case. The mechanical behavior of the structure was examined under the following three extreme vehicle loading conditions: (1) external eccentric load, (2) internal eccentric load, and (3) full load. Based on the findings, the structure underwent optimization by incorporating prestressed rebars into the cantilever beams. The key conclusions are as follows:
- (1)
- The prefabricated cantilever structure model presented in this study effectively replicates the real-world stress and failure characteristics of the structure. In the scaled model, the load-bearing capacity curves derived from both simulations and laboratory experiments demonstrate a high degree of consistency. For the full-scale model, comparisons between simulated and actual stresses on the cantilever beams during paving further corroborate the model’s accuracy, verifying its robustness and reliability.
- (2)
- Under varying vehicular loads, the connection between the cantilever beam and the column is identified as a critical weak point, characterized by significant stress concentration. While the reinforcements in this region endure high stress, the tensile strength of the concrete is relatively low. However, once cracking occurs in the concrete, the tensile stress will be borne by the steel bars, and failure could result from either the yielding of the steel bars or the failure of the concrete compression surface, potentially leading to the collapse of the entire structure.
- (3)
- The incorporation of prestressed rebars in the tension zone of the cantilever beams optimizes the internal stress distribution, alleviating stress concentration, and leading to a more uniform overall stress distribution, thus improving the structural performance. Positioning prestressed rebars at both the inner and outer top surfaces of the cantilever beams significantly enhances stress distribution under both external and internal eccentric loads. Additionally, adding prestressed rebars at the bottom of the inner cantilever beam further refines stress distribution under full loading conditions.
- (4)
- Incorporating prestressed rebars into the cantilever beams improves the structure’s overall stiffness, load-bearing capacity, and ductility, while delaying the initiation of structural damage. Simulations of the optimized structure under ultimate load conditions show that the inclusion of prestressed rebars, especially at the top inner and outer cantilever beam surfaces, notably enhances the initial slope and peak load of the displacement-load curve, along with a reduced descending slope. The damage distribution analysis indicates that adding prestressed rebars, particularly at the top inner and outer sides, significantly mitigates damage at critical beam–column connections, improving stress distribution and preventing rapid damage propagation.
This study presents a reliable approach for assessing and optimizing the performance of innovative prefabricated cantilever structures, significantly advancing their practical engineering application. The proposed structure offers a cost-effective and reliable solution for highway construction in mountainous regions with challenging terrain. By simplifying the construction process and reducing costs, this structure provides a practical alternative for engineers facing complex topographical constraints. However, certain limitations exist in the current research. For instance, variations in material properties and uncertainties in boundary conditions were not considered. Additionally, the long-term effects of environmental factors on structural performance were not addressed. Future research will build on the models developed here to explore the structure’s performance under various factors, such as environmental conditions, materials, and geometry. Furthermore, our finite element model will incorporate seismic effects and conduct partial structural failure analyses, such as stability assessments after anchor rod failure, to provide further support for the safety and reliability of the structure. Long-term monitoring of actual structures will also be conducted to gain deeper insights into their fatigue and durability performance.
Author Contributions
Conceptualization, L.C. and S.Y.; methodology, S.Y. and Z.T.; software, S.Y.; validation, S.Y. and H.X.; formal analysis, S.Y. and Z.T.; investigation, S.Y. and H.X.; resources, S.Y. and Z.T.; data curation, S.Y. and Z.T.; writing—original draft preparation, S.Y.; writing—review and editing, Z.T.; visualization, H.X. and Z.T.; supervision, S.Y. and H.X.; project administration, H.X. and Z.T.; funding acquisition, L.C. All authors have read and agreed to the published version of the manuscript.
Funding
This project is supported by the Joint Funds of the National Natural Science Foundation of China (Grant No.: U22A20231). Additionally, the research is funded by the National Natural Science Foundation of China (Grant No.: 52208476 and 52308493), the Fundamental Research Funds for the Central Universities (Grant No.: JZ2023HGQA0095 and JZ2024HGTB0257), and the Science Foundations of Anhui Province (Grant No.: 2208085ME151). These supports are gratefully acknowledged.
Institutional Review Board Statement
Not applicable.
Informed Consent Statement
Not applicable.
Data Availability Statement
The raw data supporting the conclusions of this article will be made available by the authors on request.
Conflicts of Interest
The authors declare no conflicts of interest.
References
- Lou, C.H.; Dong, F.H. Study of overturning stability safety factors of continuous girder bridges during cantilever construction. Eng. J. Wuhan Univ. 2017, 50, 2. (In Chinese) [Google Scholar]
- Jeon, B.S.; Yoon, H.H.; Bollinger, K.; Jeong, Y.K. Design and Construction of the 85 m Cantilever Roof: Busan Cinema Centre, Korea. Struct. Eng. Int. 2012, 22, 62–65. [Google Scholar] [CrossRef]
- Bakholdin, B.V.; Dranitsyn, A.V. Procedure for monitoring the bearing capacity of cast-in-place piles from results of their. Soil Mech. Found. Eng. 2007, 44, 18–23. [Google Scholar] [CrossRef]
- Kazakov, Y.N.; Bulankin, N.F. Experience with Installation of Cast-In-Place Piles of Increased Bearing Capacity. Soil Mech. Found. Eng. 2015, 52, 15–17. [Google Scholar] [CrossRef]
- Chen, Z.; Li, H.; Chen, A.; Yu, Y.; Wang, H. Research on pretensioned modular frame test and simulations. Eng. Struct. 2017, 151, 774–787. [Google Scholar] [CrossRef]
- Li, X.; Li, Y.; Yan, M.; Meng, W.; Lu, X.; Chen, K.; Bao, Y. Cyclic behavior of joints assembled using prefabricated beams and columns with Engineered Cementitious Composite (ECC). Eng. Struct. 2021, 247, 113115. [Google Scholar] [CrossRef]
- Wang, J.X.; Shen, Y.J.; Gao, S.; Wang, W.D. Anti-collapse performance of concrete-filled steel tubular composite frame with assembled tensile steel brace under middle column removal. Eng. Struct. 2022, 266, 114635. [Google Scholar] [CrossRef]
- Pan, J.; Lu, W.; Tang, X. Nonlinear stability analysis of cable-stayed bridges in cantilever construction state. J. Wuhan Univ. Technol. Transp. Sci. Eng. 2008, 32, 225–228. (In Chinese) [Google Scholar]
- Singh, A.P.; Chatterjee, K. Ground Settlement and Deflection Response of Cantilever Sheet Pile Wall Subjected to Surcharge Loading. Indian Geotech. J. 2020, 50, 540–549. [Google Scholar] [CrossRef]
- Qin, X.; Wang, Y.; Cui, S.; Liu, S.; Liu, S.; Wangari, V.W. Post-assessment of the eco-environmental impact of highway construction- A case study of Changbai Mountain Ring Road. Environ. Impact Assess. Rev. 2023, 98, 106963. [Google Scholar] [CrossRef]
- Yan, G.; Liu, B.; Li, Y.; Wang, M.; Yan, T. Antecedents of Electricity-Saving Behavior in Mountain Road Tunnel-Construction Sites: A Multi-Level Modeling Analysis. Sustainability 2024, 16, 2593. [Google Scholar] [CrossRef]
- Choudhari, S.; Tindwani, A. Logistics optimisation in road construction project. Constr. Innov. 2017, 17, 158–179. [Google Scholar] [CrossRef]
- Donaldson, L. Concrete revolutionises road construction. Mater. Today 2010, 13, 10. [Google Scholar] [CrossRef]
- Qi, H.; Li, Y.; Chen, X.; Duan, J.; Sun, J. Nonlinear analysis of a tall building with large cantilevered steel truss under expected rare earthquake through ABAQUS. World Earthq. Eng. 2015, 31, 210–215. [Google Scholar]
- Chen, P.; Cao, P.; Shi, F.T.; Chen, L.; Pei, X.; Tan, Z.F. Bolted connections in prefabricated cantilevered cap beam-column structures: A comprehensive experimental and numerical study. Eng. Struct. 2024, 310, 118124. [Google Scholar] [CrossRef]
- Veganzones, J.J.; Pacoste, C.; Karoumi, R. Width and Edge Beam Effects on the Ultimate Behaviour of RC Bridge Overhangs. Nord. Concr. Res. 2019, 61, 131–152. [Google Scholar] [CrossRef]
- Bu, L.T.; Wang, W.Y.; He, F.L. Shear behavior of RC overhanging beams strengthened with PVA-ECC. J. Hunan Univ. Nat. Sci. 2014, 41, 52–56. (In Chinese) [Google Scholar]
- Munoz, J.J.V.; Pacoste, C.; Pettersson, L.; Karoumi, R. Influence of Edge Beam on Behavior of Bridge Overhangs. ACI Struct. J. 2018, 115, 957–970. [Google Scholar] [CrossRef]
- Donduren, M.S. Determination of displacement and failure loads formed in reinforced concrete construction with overhang and without overhang by ANN modeling. Sci. Eng. Compos. Mater. 2012, 19, 169–176. [Google Scholar] [CrossRef]
- Kim, S.H.; Heo, W.H.; You, D.W.; Choi, J.-G. Vehicle Loads for Assessing the Required Load Capacity Considering the Traffic Environment. Appl. Sci. 2017, 7, 365. [Google Scholar] [CrossRef]
- Lu, Y.; Li, D.; Wang, K.; Jia, S. Study on Solar Radiation and the Extreme Thermal Effect on Concrete Box Girder Bridges. Appl. Sci. 2021, 11, 6332. [Google Scholar] [CrossRef]
- Wang, X.; Ruan, X.; Casas, J.R.; Zhang, M. Probabilistic Modeling of Congested Traffic Scenarios on Long-Span Bridges. Appl. Sci. 2024, 14, 9525. [Google Scholar] [CrossRef]
- Desrosiers, J.; Laporte, G.; Sauve, M.; Soumis, F.; Taillefer, S. Vehicle routing with full loads. Comput. Oper. Res. 1988, 15, 219–226. [Google Scholar] [CrossRef]
- Li, M.; Liu, Y.; Yang, X.S. Random vehicle flow load effect considering axle load. J. Zhejiang Univ. Eng. Sci. 2019, 53, 78–88. (In Chinese) [Google Scholar]
- Wang, B.L.; Lu, P.M. Treatment of vehicle load and axle load model. J. Zhengzhou Univ. Eng. Sci. 2008, 29, 127–131. (In Chinese) [Google Scholar]
- Deng, L.; Wang, W.; Cai, C.S. Effect of pavement maintenance cycle on the fatigue reliability of simply-supported steel I-girder bridges under dynamic vehicle loading. Eng. Struct. 2017, 133, 124–132. [Google Scholar] [CrossRef]
- Ding, L.; Hao, H.; Xia, Y.; Deeks, A.J. Evaluation of Bridge Load Carrying Capacity Using Updated Finite Element Model and Nonlinear Analysis. Adv. Struct. Eng. 2012, 15, 1739–1750. [Google Scholar] [CrossRef]
- Chi, M.R.; Zhang, W.H.; Zeng, J. Influence of partial load on riding quality of vehicle. J. Traffic Transp. Eng. 2010, 10, 38–41. [Google Scholar]
- Gong, J.; Li, W.; Zhao, J.; Feng, M. Research on Probabilistic Model of Highway Bridge Vehicle Loads Non-controlling Area. J. Highw. Transp. Res. Dev. 2010, 27, 40–45, 57. [Google Scholar]
- Lv, G.; Lv, H.; Chen, Z.; Chu, W.; Mao, J. Research on inertia transfer in load simulation of tracked vehicle under complex working conditions. Front. Mater. 2023, 10, 1188411. [Google Scholar] [CrossRef]
- Sun, H.; Guan, X.; Bao, Y.; Xu, Y.; Li, H. Normalising flow-based vehicle load modeling for bridges. Struct. Infrastruct. Eng. 2023. [Google Scholar] [CrossRef]
- Pinkney, B.; Dagenais, M.A.; Wight, G. Dynamic load testing of a modular truss bridge using military vehicles. Eng. Struct. 2022, 254, 113822. [Google Scholar] [CrossRef]
- Chen, Z.; Bao, Y.; Chen, J.; Li, H. Modelling the spatial distribution of heavy vehicle loads on long-span bridges based on undirected graphical model. Struct. Infrastruct. Eng. 2019, 15, 1485–1499. [Google Scholar] [CrossRef]
- Sun, J.S.; Yang, C.F.; Dou, Y.M.; Li, B. Study on the vehicle load of bridge design on heavy traffic highway based on traffic investigation. J. Hebei Univ. Technol. 2009, 38, 91–95. (In Chinese) [Google Scholar]
- Zhang, Y.; Wong, R.C.K. Static and dynamic responses of buried steel pipe under truck load: An experimental study. Eng. Struct. 2024, 312, 118253. [Google Scholar] [CrossRef]
- Ndong, A.K.; Sherif, M.M.; Kassner, B.; Ozbulut, O.E.; Harris, D.K. Refined analysis of steel girder bridges for computation of live load distribution factors considering effects of freight and emergency vehicles. Eng. Struct. 2023, 293, 116630. [Google Scholar] [CrossRef]
- Zou, S.; Cao, R.; Deng, L.; Wang, W. Effect of stress reversals on fatigue life evaluation of OSD considering the transverse distribution of vehicle loads. Eng. Struct. 2022, 265, 114400. [Google Scholar] [CrossRef]
- Yuan, Y.; Han, W.; Li, G.; Xie, Q.; Guo, Q. Time-dependent reliability assessment of existing concrete bridges including non-stationary vehicle load and resistance processes. Eng. Struct. 2019, 197, 109426. [Google Scholar] [CrossRef]
- Sun, Z.; Siringoringo, D.M.; Fujino, Y. Load-carrying capacity evaluation of girder bridge using moving vehicle. Eng. Struct. 2021, 229, 111645. [Google Scholar] [CrossRef]
- Luccioni, B.; Oller, S.; Danesi, R. Coupled plastic-damaged model. Comput. Methods Appl. Mech. Eng. 1996, 129, 81–89. [Google Scholar] [CrossRef]
- Sarikaya, A.; Erkmen, R.E. A plastic-damage model for concrete under compression. Int. J. Mech. Sci. 2019, 150, 584–593. [Google Scholar] [CrossRef]
- GB50011-2010; Concrete Structure Design Code. China Academy of Building Research: Beijing, China, 2010.
- Lee, J.; Fenves, G.L. Plastic-Damage Model for Cyclic Loading of Concrete Structures. J. Eng. Mech. 1998, 124, 892–900. [Google Scholar] [CrossRef]
- Zarate Garnica, G.I.; Lantsoght, E.O.L.; Yang, Y. Monitoring structural responses during load testing of reinforced concrete bridges: A review. Struct. Infrastruct. Eng. 2022, 18, 1558–1580. [Google Scholar] [CrossRef]
- De Domenico, D.; Messina, D.; Recupero, A. Quality control and safety assessment of prestressed concrete bridge decks through combined field tests and numerical simulation. Structures 2022, 39, 1135–1157. [Google Scholar] [CrossRef]
- Sun, X.Y.; Xu, C.; Wang, H.L.; Chu, J.F. Overloading simulation fatigue experiment of bridge member with and without CFRP reinforcement. J. Zhejiang Univ. Eng. Sci. 2012, 46, 1585–1591. [Google Scholar]
- Shi, Y.; Li, S.; Cong, Y.A. Influence of Dead-load Based Overload on Reliability of Flexural Members of In-service Bridges. J. Highw. Transp. Res. Dev. 2009, 26, 77–81. [Google Scholar]
- Janga, B.; Mohammadi, J. Impact of fatigue damage from overloads on bridge life-cycle cost analysis. Bridge Struct. 2019, 15, 181–186. [Google Scholar] [CrossRef]
- Deng, L.; Yan, W.; Nie, L. A simple corrosion fatigue design method for bridges considering the coupled corrosion-overloading effect. Eng. Struct. 2019, 178, 309–317. [Google Scholar] [CrossRef]
- Ahmed, M.; El Hadi, K.M.; Hasan, M.A.; Mallick, J.; Ahmed, A. Evaluating the co-relationship between concrete flexural tensile strength and compressive strength. Int. J. Struct. Eng. 2014, 5, 115–131. [Google Scholar] [CrossRef]
- Liao, W.C.; Chen, P.S.; Hung, C.W.; Wagh, S.K. An Innovative Test Method for Tensile Strength of Concrete by Applying the Strut-and-Tie Methodology. Materials 2020, 13, 2776. [Google Scholar] [CrossRef]
- Sadovskaya, E.A.; Leonovich, S.N.; Zhdanok, S.A.; Polonina, E.N. Tensile Strength of Nanofibrous Concrete. J. Eng. Phys. Thermophys. 2020, 93, 1015–1019. [Google Scholar] [CrossRef]
- Shen, X.; Li, B.; Chen, Y.T. Seismic performance of reinforced concrete beam-column joints with diagonal bars wrapped by steel tubes: Experimental, numerical and analytical study. Structures 2024, 59, 105734. [Google Scholar] [CrossRef]
- Shen, X.; Li, B.; Chen, Y.T.; Tizani, W. Experimental and numerical study on reinforced concrete beam-column joints with diagonal bars: Effects of bonding condition and diameter. Structures 2022, 37, 905–918. [Google Scholar] [CrossRef]
- Shen, X.; Li, B.; Chen, Y.T.; Tizani, W.; Jiang, Y. Relocating plastic hinges in reinforced concrete beam-column joints by mechanically anchored diagonal bars. Eng. Struct. 2022, 251, 113468. [Google Scholar] [CrossRef]
- Wang, Z.; Wang, B.; Jiang, H.; Zhuge, P. Experimental Study on the Flexural and Shear Performance of Concrete Beams Strengthened with Prestressed CFRP Tendons. Appl. Sci. 2024, 14, 1237. [Google Scholar] [CrossRef]
- Zhao, L.; Dou, T.; Cheng, B.; Xia, S.; Yang, J.; Zhang, Q.; Li, M.; Li, X. Theoretical Study and Application of the Reinforcement of Prestressed Concrete Cylinder Pipes with External Prestressed Steel Strands. Appl. Sci. 2019, 9, 5532. [Google Scholar] [CrossRef]
- Kim, S.H.; Joung, J.Y.; Choi, K.T.; Jung, C.Y. Experimental load-carrying capacity evaluation of thermal prestressed H beam with steel brackets. J. Constr. Steel Res. 2013, 88, 309–320. [Google Scholar] [CrossRef]
- Osofero, A.I.; Wadee, M.A.; Gardner, L. Numerical Studies on the Buckling Resistance of Prestressed Stayed Columns. Adv. Struct. Eng. 2013, 16, 487–498. [Google Scholar] [CrossRef]


Disclaimer/Publisher’s Note: The statements, opinions and data contained in all publications are solely those of the individual author(s) and contributor(s) and not of MDPI and/or the editor(s). MDPI and/or the editor(s) disclaim responsibility for any injury to people or property resulting from any ideas, methods, instructions or products referred to in the content. |
© 2025 by the authors. Licensee MDPI, Basel, Switzerland. This article is an open access article distributed under the terms and conditions of the Creative Commons Attribution (CC BY) license (https://creativecommons.org/licenses/by/4.0/).