Abstract
Policy space response oracles (PSRO) is an important algorithmic framework for approximating Nash equilibria in two-player zero-sum games. Enhancing policy diversity has been shown to improve the performance of PSRO in this approximation process significantly. However, existing diversity metrics are often prone to redundancy, which can hinder optimal strategy convergence. In this paper, we introduce the policy similarity measure (PSM), a novel approach that combines Gaussian and cosine similarity measures to assess policy similarity. We further incorporate the PSM into the PSRO framework as a regularization term, effectively fostering a more diverse policy population. We demonstrate the effectiveness of our method in two distinct game environments: a non-transitive mixture model and Leduc poker. The experimental results show that the PSM-augmented PSRO outperforms baseline methods in reducing exploitability by approximately 7% and exhibits greater policy diversity in visual analysis. Ablation studies further validate the benefits of combining Gaussian and cosine similarities in cultivating more diverse policy sets. This work provides a valuable method for measuring and improving the policy diversity in two-player zero-sum games.
1. Introduction
Two-player zero-sum games are a prominent setting in multi-agent reinforcement learning (MARL) [1] due to their analytical tractability and symmetry, making them a central focus of theoretical and applied research. In this context, self-play has emerged as a promising approach to addressing the inherent complexities of MARL in competitive scenarios. By training an agent against copies or past versions of itself [2,3], self-play offers a stable and tractable framework for learning. This framework has been successfully applied in various game domains, such as Go [4,5,6,7], chess [6,7], poker [8,9], and video games [10,11,12], often surpassing human-level performance.
Despite these successes, two-player zero-sum games often exhibit non-transitive policy spaces [13], where the superiority of one policy does not guarantee universal dominance [14,15]. Consequently, each player must acquire a diverse set of winning strategies to ensure robust performance against potential exploitation [16,17]. A key challenge in these non-transitive games is identifying a Nash equilibrium (NE), which ensures optimal worst-case performance across the policy space. Traditional self-play [18,19,20] often fails to converge to an NE in the presence of strong non-transitivity [16,17,21].
One prominent framework for approximating the NE is policy space response oracles (PSRO) [21]. PSRO integrates conventional game-theoretic equilibrium computation with policy learning and iteratively expands a restricted game constructed from a limited set of policies. Ideally, the restricted game is significantly smaller than the original game, enabling a more tractable equilibrium approximation. Improving the capacity of PSRO to approximate the NE remains an active area of research. A promising direction involves promoting policy diversity within the restricted population, which is often accomplished by adding diversity regularization to the best response oracle of PSRO [17,22,23,24,25].
Encouraging policy diversity is crucial for achieving high-performance learning in non-transitive games. Diversity prevents agents from repeatedly exploring the same policies, thus enabling more efficient exploration of the policy space [26,27]. Furthermore, ensuring a diverse policy repertoire mitigates exploitability, as any dominant policy is likely to be defeated by an alternative, but also fosters the adaptation necessary to maintain robust performance over time [28]. Existing methods attempt to quantify diversity by analyzing the differences in agent behaviors and response patterns [23,24,29,30,31]. The unified diversity measure (UDM) [24] further unifies these methods, offering a more effective means of quantifying population diversity. While the UDM provides a comprehensive and unified method for measuring population diversity, it is susceptible to redundant policies, which can cause it to converge to a local optimum.
In this work, we propose the policy similarity measure (PSM), which focuses on measuring policy similarity. The PSM uses Gaussian and cosine similarities to quantify the similarity between payoff vectors, generating a similarity matrix for the population. This similarity matrix visually represents the population’s diversity, allowing for an intuitive understanding of the differences between policies. Moreover, the PSM can be integrated as a regularization term during policy optimization, effectively guiding the learning process toward more heterogeneous policy sets. In brief, the PSM enhances the diversity of the overall population while providing a visual measure for assessing diversity. Furthermore, we demonstrate how redundant policies undermine the effectiveness of the UDM as an accurate measure of population diversity.
In summary, this work makes the following contributions:
- We point out the shortcomings of the UDM in handling redundant policies.
- We propose the PSM, an effective method for quantifying and visualizing population diversity simultaneously, and, by incorporating it as a regularization term in the optimization objective, it significantly reduces the similarity between policies, thereby enhancing population diversity.
- We empirically verify the effectiveness of the PSM and the limitations of the UDM on a non-transitive mixture model and in Leduc poker. The results demonstrate that, compared to baseline methods, our approach achieves lower exploitability and reduced population similarity.
The remainder of this paper is organized as follows. Section 2 provides a review of related work on PSRO and diversity. Section 3 presents the necessary theoretical preliminaries. Section 4 describes the PSM method in detail, including its design motivation. Section 5 offers extensive empirical evaluations and analysis, accompanied by comprehensive ablation studies, to assess each PSM component’s contribution. Finally, Section 6 concludes this paper with a summary of the key findings and a discussion of potential directions for future research.
2. Related Work
PSRO [21] is a population-based framework that extends the double oracle [18]. It provides a unified game-theoretic approach by iteratively expanding a restricted game through reinforcement learning [32], significantly improving scalability to large and complex games in MARL.
Building upon PSRO, several adaptations have emerged to enhance its computational efficiency and approximation performance. For example, Pipeline-PSRO [16] employs parallelization to accelerate the training of multiple best response oracles, while neural fictitious self-play [19] integrates neural approximations of the best response into traditional fictitious play. These advances provide scalable solutions but often fail to fully exploit the policy space, especially in non-transitive settings.
A critical direction for advancing PSRO involves promoting population diversity. Policy diversity encourages the discovery of robust strategies, facilitating better exploration of the policy space and, in turn, mitigating exploitability [17,22,30]. Various diversity-enhancing mechanisms have been proposed, often incorporating diversity metrics into the best response computation. Behavioral diversity (BD) [23,29,33] quantifies differences in trajectories or state distributions, drawing on concepts such as maximum entropy [34] and skill discovery [33]. While BD provides insights into policy behaviors, its limitations become apparent when minor behavioral differences result in significant reward disparities [23,25].
To address these challenges, response diversity (RD) [17,24,35] leverages empirical payoff matrices to capture the strategic effectiveness of policies against diverse opponents. Recent works, such as determinantal point processes [17] and effective diversity [36], have further refined RD-based methods by emphasizing geometric and payoff-driven diversity measures. The UDM [24], a unified diversity framework, consolidates prior diversity measures into a generalized approach. However, it may overestimate population diversity when faced with highly similar strategies that yield little genuine variation in payoffs. This susceptibility to repeated or near-duplicate policies ultimately undermines the objective of cultivating a truly diverse policy set. Moreover, an effective visualization method for assessing diversity differences among policies remains absent, further limiting the interpretability and evaluation of policy diversity.
Table 1 presents a concise summary of these main approaches. As illustrated, the primary unresolved challenge is the inability to effectively filter out redundant policies and visualize policy diversity. In response, we introduce the PSM, which is specifically designed to measure redundancy while offering a visual method for assessing policy diversity. By leveraging Gaussian similarity to measure Euclidean distance and cosine similarity to assess angular alignment, the PSM captures both the magnitude and direction of payoff differences, enabling a more precise differentiation of policies that might otherwise appear indistinguishable. Integrated into the policy optimization process, this method reduces population redundancy and enhances robustness against exploitation. Furthermore, the PSM facilitates the construction of a visual similarity matrix, providing a more interpretable assessment of diversity differences among policies.

Table 1.
Comparison of policy diversity methods.
3. Preliminaries
3.1. Two-Player Normal-Form Games
A two-player normal-form game [37] involves two players, indexed by . Each player selects an action from a finite set , and the pair of chosen actions then determines their payoffs through utility functions . A mixed strategy represents a probability distribution over player i’s actions. The expected utility for the joint strategy profile is expressed as
where denotes the mixed strategy of the opponent. The best response against is
which reflects the strategy that maximizes player i’s expected utility against the opponent’s strategy. Extensive-form games extend these formalisms to the multi-step sequential case (e.g., poker). Every finite extensive-form game has an equivalent normal form [38] but, due to its exponential size, most algorithms must be adapted to handle the sequential setting directly.
To evaluate how much a strategy profile deviates from the equilibrium in a two-player zero-sum game, the exploitability metric known as NashConv [21] can be used. It is defined as
When , no player can improve their expected payoff by unilaterally deviating from , which indicates that is an NE.
3.2. Meta-Game
Although exploitability is a critical metric for evaluating proximity to an NE, enumerating every possible action in extensive settings can be computationally prohibitive in MARL. A common solution is to treat each learned policy as a meta-level action, forming a meta-game among a set of candidate policies. Suppose that each player i maintains a policy pool . A payoff matrix is constructed by evaluating all pairwise interactions among policies, where
A meta-strategy is a probability distribution over . By assigning mixture weights to each policy in , the meta-game is an elevated game in which the actions are entire policies rather than atom actions.
3.3. Policy Space Response Oracles
Building on these insights, PSRO [21] iteratively expands a meta-game by adding best responses, refining the policy pool to approach an NE more effectively. Given a policy pool for each player i, PSRO constructs a payoff matrix M by evaluating existing policies against one another. A meta-strategy solver, such as an NE solver, then computes a meta-strategy over these pools. Each player then identifies a best response oracle policy in response to the opponent’s meta-strategy, written as
This newly identified policy is added to the pool, and the process repeats.
3.4. Unified Diversity Measures
Quantifying the diversity of a policy population is a crucial aspect of multi-agent learning. A diverse policy set enables more comprehensive strategic coverage, accelerates exploration, and strengthens robustness against adversarial opponents. The UDM effectively unifies diversity measures [17,23,30,35], providing a cohesive and robust framework for population diversity evaluation. Below, we present the methodology of the UDM.
The UDM employs a diversity kernel to quantify the pairwise features of policies:
where is a kernel function and represents the feature embedding of the i-th policy. The determinant of reflects the volume of the policy space, offering an intuitive measure of diversity.
After, policies are represented as a diversity kernel. The UDM computes eigenvalues of and aggregates them as follows:
where is a bounded concave function, and , such as ; here, is a hyperparameter that controls the shape of the bounded concave function. encourages novelty while avoiding overemphasis on dominant policies. Although the UDM captures policy diversity in principle, it can overestimate population diversity when multiple near-duplicate policies yield similar payoffs.
4. Methodology
4.1. Design Motivation: Limitations of UDM
To illustrate the issue of redundant policies and their impact on the UDM, consider the example of the rock–paper–scissors game. The payoff matrices for two different versions of this game are shown below:
The first matrix represents the traditional rock–paper–scissors interactions, while the second matrix is identical except for the inclusion of two additional scissors strategies. In both cases, the diversity kernels, which quantify the diversity of strategies based on the corresponding payoff tables, are computed using the feature vector .
The diversity kernels for each payoff matrix are as follows:
The eigenvalues of and are and , respectively. Here, the eigenvalues reflect the RD of the populations. Using a linear kernel function , the UDM values are computed as follows:
These results indicate that the emergence of redundant strategies contributes to an increase in population diversity, which may, in turn, lead the agent to converge toward suboptimal strategies, thereby limiting the overall effectiveness of the learning process. To address this issue, an improved approach is necessary to measure strategy redundancy and facilitate policy diversification.
4.2. Policy Similarity Measure
To address this limitation, we introduce the PSM, which quantifies policy redundancy by integrating two distinct metrics: the Gaussian and cosine similarities. The Gaussian similarity captures the pairwise distances between payoff vectors, utilizing a Gaussian function to quantify the degree of similarity between policies. Simultaneously, the cosine similarity measures the angular distance between payoff vectors, reflecting their directional alignment. By combining these two measures, we derive a unified similarity matrix that captures both the magnitude of differences and the alignment of policies. This consolidated metric provides a comprehensive evaluation of policy similarity, and the resulting similarity matrix offers a visually intuitive representation, facilitating a clear analysis of the relationships between different policies.
Gaussian similarity is computed by applying the Gaussian function to measure the pairwise distances between the payoff vectors of different policies. Specifically, for each pair of payoff vectors and , the Euclidean distance is calculated. The Gaussian similarity between the two vectors is defined as follows:
where is the bandwidth parameter controlling the decay rate of the similarity. The resulting Gaussian similarity matrix S is a symmetric matrix with elements , where for all i, indicating perfect self-similarity.
Simultaneously, we compute the cosine similarity between the same pair of payoff vectors. This measure captures the angular distance between the vectors, reflecting the directional alignment of the policies. Specifically, for each pair of payoff vectors and , the cosine similarity is defined as follows:
where · represents the dot product and denotes the Euclidean norm of the vectors. The resulting cosine similarity matrix is symmetric, with elements , where for all i, indicating perfect self-similarity.
To integrate these two similarity measures, we combine the similarity values at corresponding positions in the two matrices, thus capturing both the relative distances and the directional alignment of the vectors. The resulting unified similarity measure is expressed as follows:
This consolidated metric provides a more comprehensive evaluation of policy similarity, accounting for both the magnitude of the differences and the directional alignment of the policies. The similarity matrix obtained through the PSM provides a visually intuitive representation, facilitating a straightforward analysis of the relationships between different policies.
We incorporate the PSM as a regularization term into the policy optimization process. Specifically, for a policy pool and a newly introduced policy , the regularization term is defined as follows:
This term penalizes similar policies, encouraging the learning process to focus on exploring a more diverse set of policies. By incorporating the combined similarity measure into the PSRO optimization objective, we refer to this approach as PSM-PSRO. For player i, the best response oracle of PSM-PSRO is expressed as follows:
where is a hyperparameter that controls the weight of the regularization term. This formulation ensures that redundant policies, which are similar both in magnitude and direction, incur a larger penalty, ultimately promoting a more diverse policy set.
4.3. Practical Analysis of PSM
We demonstrate the PSM approach on the policy sets from and (introduced in Equation (8)).The similarity matrix corresponding to each payoff matrix, as defined in Equation (12), is as follows:
Compared with the diversity kernel matrices (see and in Equation (9)), the Gaussian-based similarity matrices and provide a more direct visualization of how closely pairs of strategies resemble each other. Specifically, the similarity between each pair of strategies in is minimal, with off-diagonal entries approaching zero. By contrast, indicates that the two duplicated strategies yield maximum mutual similarity (i.e., an entry of 1) while showing near-zero similarity with the remaining strategies. Hence, and enable a more intuitive analysis of redundancy within the policy population.
Furthermore, computing the PSM values of and reveals that the addition of redundant strategies significantly increases the overall PSM value. This underscores the importance of mitigating policy redundancy in order to maintain a genuinely diverse and robust set of strategies.
5. Experiments
5.1. Experimental Setup
The primary purpose of these experiments is to compare PSM-PSRO with existing state-of-the-art PSRO variants in terms of approximating a full-game NE. The baseline methods include PSRO [21], BD&RD-PSRO [23], UDM-PSRO [24], and PSD-PSRO [25]. The benchmarks consist of a single-state game (non-transitive mixture model) and a complex extensive game (Leduc poker). However, since BD&RD-PSRO is not available for complex games and is challenging to implement, we omit the comparison of PSM-PSRO with BD&RD-PSRO in Leduc poker.
We employ exploitability, the PSM, the UDM, and similarity matrices to provide a comprehensive analysis and comparison of the methods. Lower exploitability values indicate that the learned policies are more robust and closer to an NE, making them less vulnerable to exploitation. A lower PSM value suggests greater heterogeneity within the policy population, signifying a reduction in redundant strategies. A higher UDM value reflects a greater diversity across the policy population. To visually interpret similarity matrices, we utilize heatmaps, where red regions (high similarity) denote clusters of highly similar policies, whereas blue regions (low similarity) indicate a more diverse and well-distributed policy.
All experiments were implemented in Python (version 3.8.0), using PyTorch (version 1.10.0) for neural network training and optimization, NumPy (version 1.21.2) and Pandas (version 1.3.3) for data processing, and Matplotlib (version 3.4.3) for result visualization. The experiments were conducted on a server equipped with an Intel(R) Xeon(R) CPU E5-2690 v4 processor, 220 GB of RAM, and no GPU (NVIDIA, Santa Clara, CA, USA). This computational setup ensured efficient model training, simulation, and evaluation. Additional details regarding the environments and hyperparameters are provided in Appendix A. Code is available at https://github.com/QrowBranwen/PSM_PSRO, accessed on 5 March 2025.
5.2. Experimental Environment
5.2.1. Non-Transitive Mixture Model
The non-transitive mixture model is a single-state game environment designed to probe the dynamics of policy optimization in games with inherent non-transitive structures. In the non-transitive mixture model, strategies are distributed across a two-dimensional Gaussian plane, with payoffs determined by a positional reflected function. This construction introduces complex optimization challenges, as agents must navigate the interplay between exploration and exploitation within a continuously evolving policy space. The optimal policy is to remain close to the center of the Gaussian humps and explore all the distributions. This model contains both a transitive component and a non-transitive component, which can be reflected in the payoff:
5.2.2. Leduc Poker
Leduc poker is a simplified yet strategically rich two-player zero-sum poker variant [39], widely used in game-theoretic and MARL research. Players must infer opponents’ hidden cards and intentions while adapting their strategies. This interplay between bluffing, value betting, and risk management introduces significant strategic depth, enabling researchers to test algorithms for NE approximation, regret minimization [40], and policy optimization. The goal is to maximize rewards by leveraging imperfect information and probabilistic reasoning.
5.3. Results and Analysis
5.3.1. Non-Transitive Mixture Model
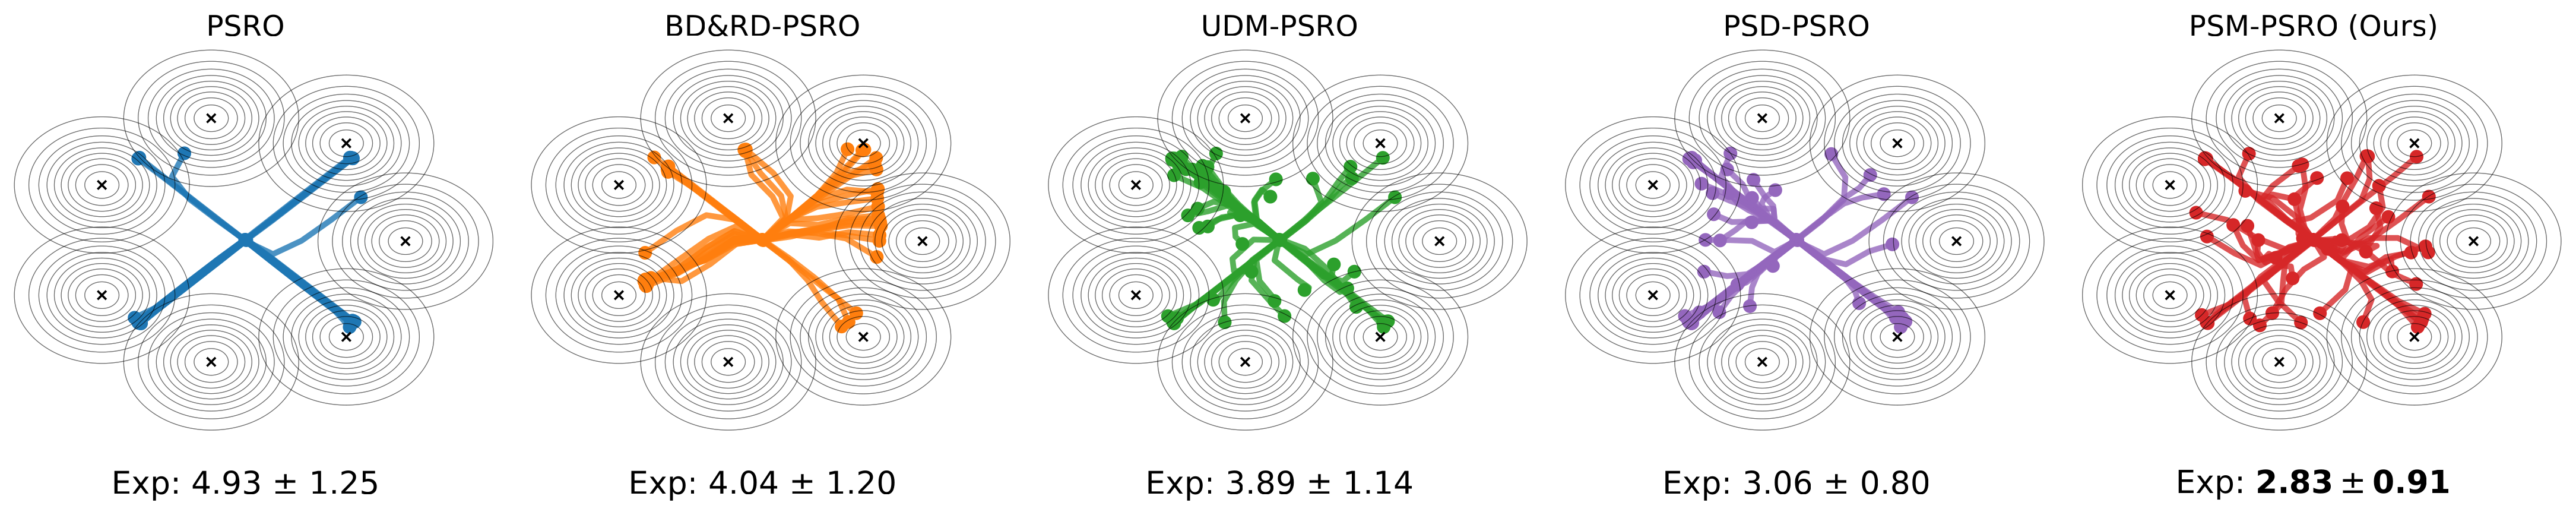
The exploration trajectories and final exploitability values for the non-transitive mixture model environment are presented in Figure 1. The trajectory of explored strategies visually illustrates the ability of each algorithm to navigate the Gaussian humps. PSM-PSRO exhibited a well-distributed exploration pattern, effectively covering the policy space compared to baseline methods. In quantitative terms, PSM-PSRO achieves the lowest exploitability (Exp = 2.83 ± 0.91), which is approximately 7% lower than that of the best-performing baseline method (Exp = 3.06 ± 0.80). This highlights the effectiveness of PSM-PSRO in mitigating exploitability by reducing policy redundancy and promoting diversity.

Figure 1.
Non-transitive mixture model. Exploration trajectories during training. The final exploitability ×100 (Exp) is reported at the bottom for each method.The bold values in the figure represent the best-performing results.
The trends of the PSM and UDM during training are shown in Figure 2. In Figure 2a, the PSM value for PSM-PSRO is lower than those of all baseline methods, indicating reduced redundancy within the policy population. Figure 2b reveals that UDM values for PSM-PSRO stabilize at higher levels than other methods, confirming its superior ability to promote and sustain diversity throughout the training process. This result supports the PSM method, demonstrating that minimizing payoff vector similarity leads to more diverse and robust policy sets.
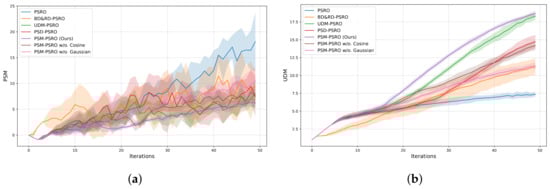
Figure 2.
Non-transitive mixture model: (a) PSM vs. iterations, with lower values indicating lower policy redundancy; (b) UDM vs. iterations, with higher values reflecting greater diversity.
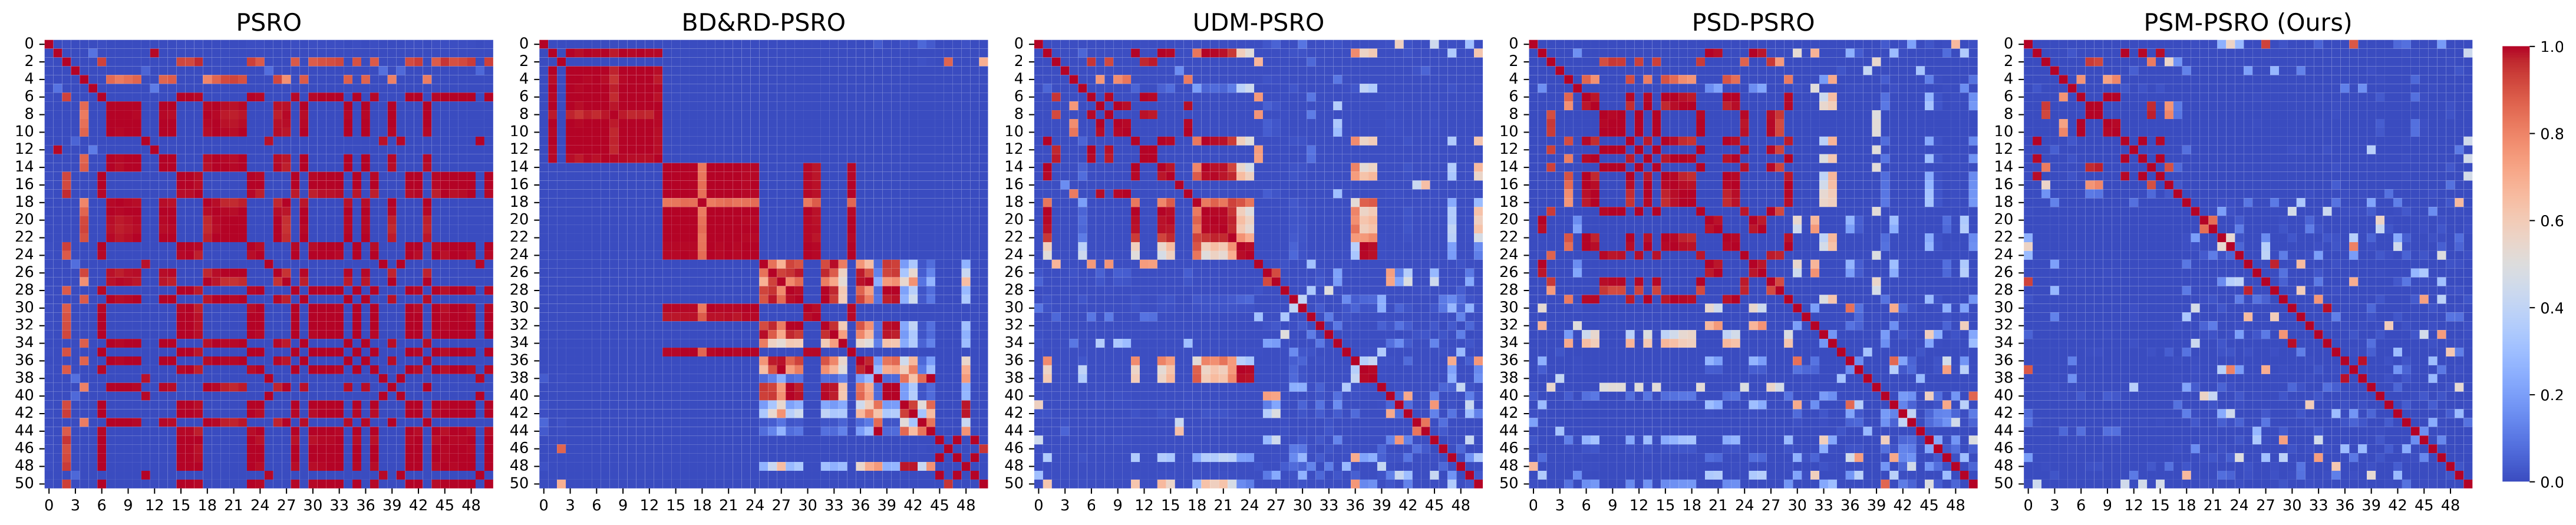
The final policy similarity matrices, visualized as heatmaps in Figure 3, further validate the efficacy of PSM-PSRO. Unlike baseline methods, which exhibit significant clusters of high-similarity policies (highlighted in red), PSM-PSRO generates a more heterogeneous policy population, as indicated by the dominance of cooler tones (blue) in its heatmap. This visual evidence aligns with the quantitative findings, demonstrating that PSM-PSRO effectively reduces intra-population redundancy while fostering a diverse policy set.
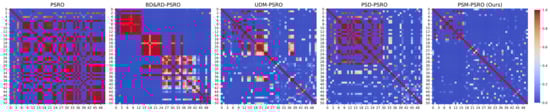
Figure 3.
Non-transitive mixture model: similarity matrix heatmaps of policy populations after 50 PSRO iterations. The heatmaps display the pairwise similarity between policies, with red indicating higher similarity.
This improvement can be attributed to the susceptibility of existing diversity algorithms to producing redundant policies, as evidenced by the visual results in Figure 1 and Figure 3. In contrast, PSM-PSRO effectively alleviates policy redundancy by penalizing excessively similar strategies, thereby fostering a more diverse and robust policy population.
5.3.2. Leduc Poker
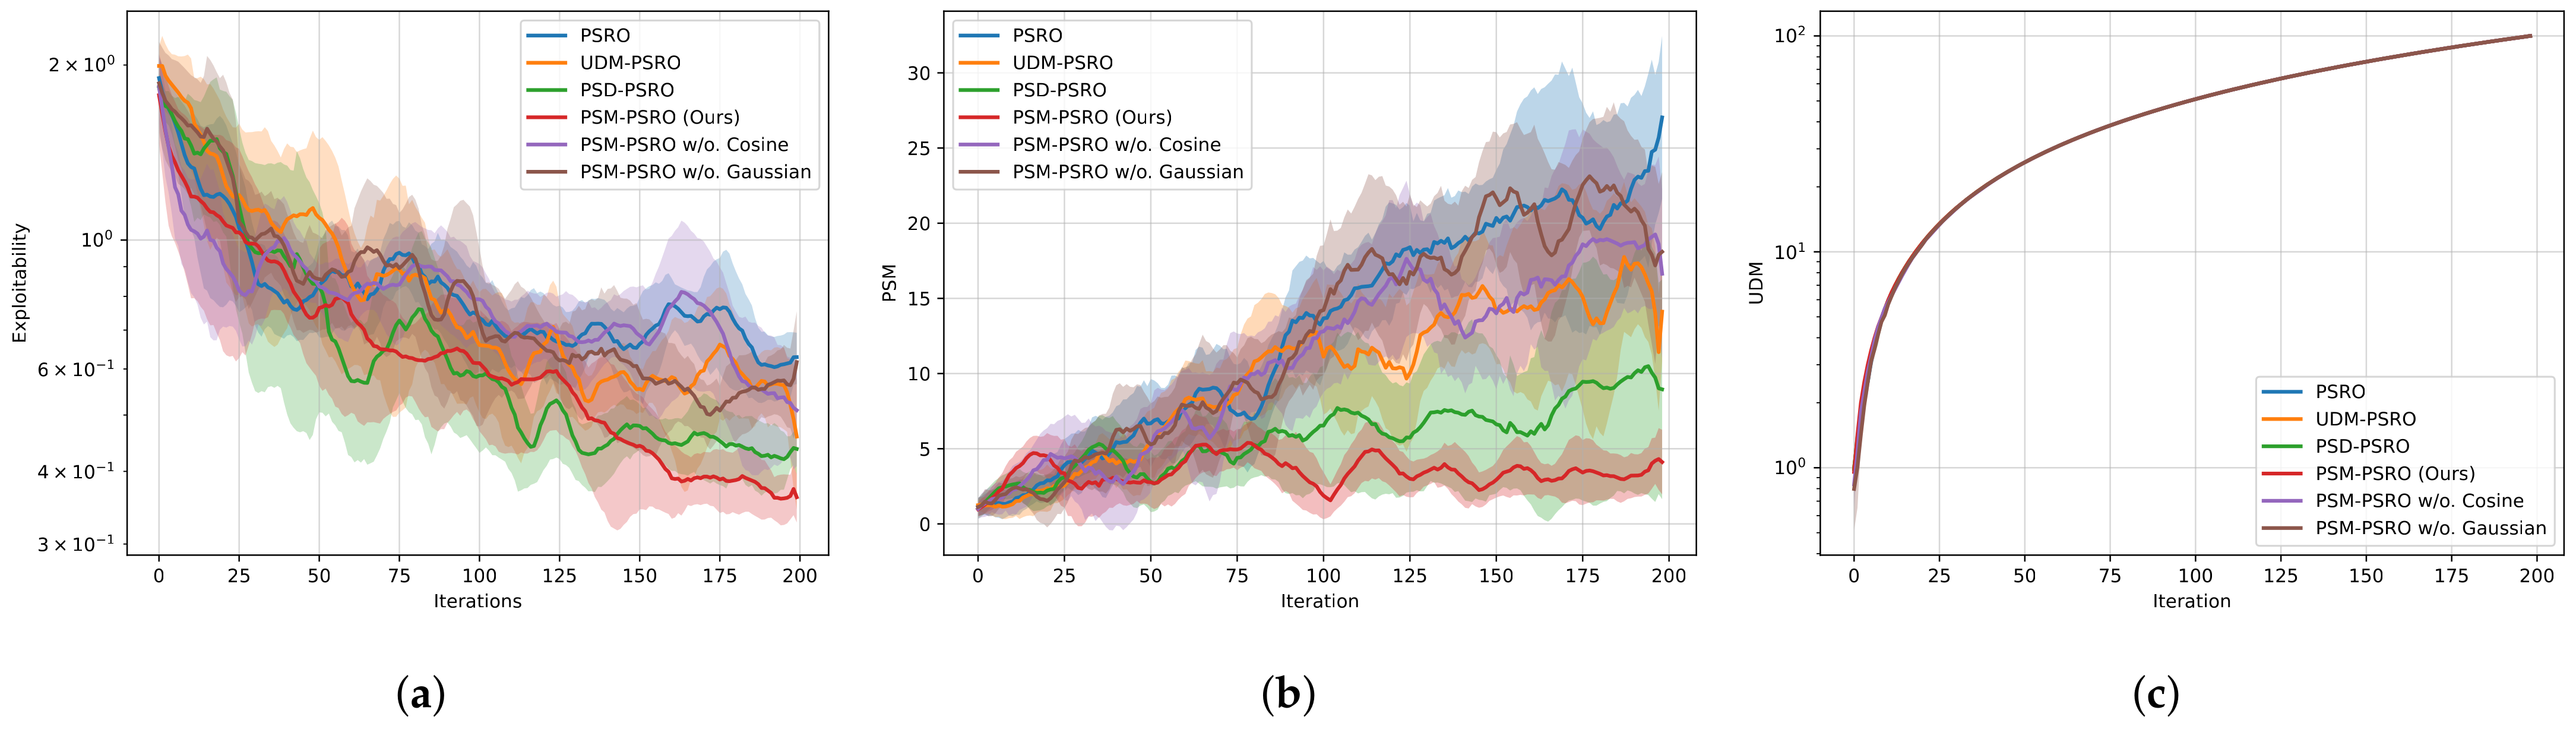
The exploitability results presented in Figure 4a highlight the performance gains achieved by PSM-PSRO. Our approach achieves the lowest exploitability scores compared to baseline methods, confirming that minimizing policy similarity through the PSM contributes to more robust and less exploitable policies. The significantly reduced exploitability indicates that PSM-PSRO has succeeded in mitigating the convergence to suboptimal strategies, thus enhancing the overall effectiveness of the reinforcement learning process.
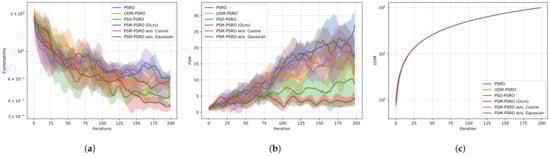
Figure 4.
Leduc poker experiment: (a) exploitability vs. iterations, with lower exploitability indicating better performance; (b) PSM vs. iterations, with lower PSM indicating reduced policy redundancy; (c) UDM vs. iterations, with higher UDM reflecting greater policy diversity.
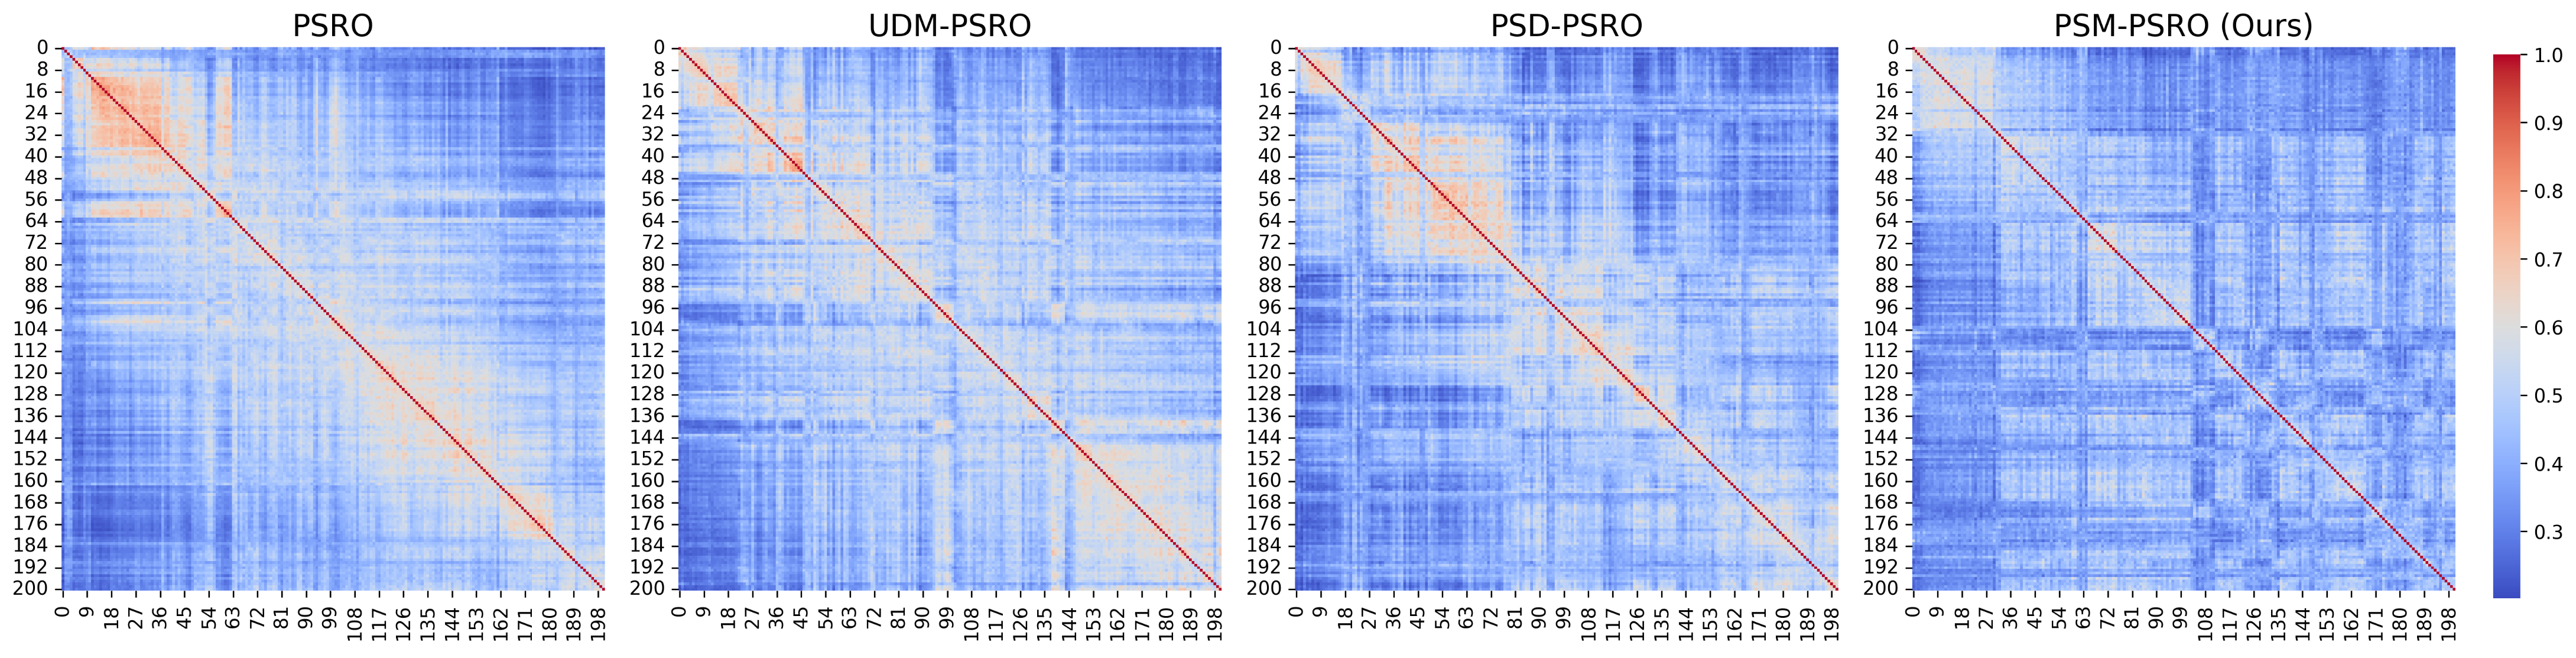
Concerning the PSM, Figure 4b highlights the distinct advantages of our approach. PSM-PSRO consistently maintains a lower similarity value than other methods, signifying a reduction in redundant policies and a more diverse policy set. This aligns with fostering strategic heterogeneity to mitigate exploitability. The policy similarity matrix in Figure 5 is presented as a heatmap, and the results show that PSM-PSRO generates a policy population with lower similarity, as indicated by the predominance of cooler colors (blue) in its heatmap. This intuitive evidence is consistent with the quantitative findings, suggesting that PSM-PSRO effectively reduces within-group redundancy while promoting diversity in the policy set.

Figure 5.
Leduc poker experiment: similarity matrix heatmaps of policy populations after 200 PSRO iterations. The heatmaps display the pairwise similarity between policies, with red indicating higher similarity.
Furthermore, our experiments reveal that the UDM struggles to measure diversity in more complex policy spaces effectively. As shown in Figure 4c, whenever a newly trained policy is added to the population, it consistently causes a maximal increase in population diversity. In complex decision spaces, the payoff vectors vary significantly, especially in the later iterations of each PSRO, where the current policy against the historical policy leads to large changes in payoffs, making the diversity kernel and eigenvalues computed by the UDM much larger, diminishing the effectiveness of the UDM metric. In other words, the UDM relies too heavily on mathematical feature metrics, overlooking the actual payoff differences of policies in the environment and resulting in an incomplete reflection of diversity within the policy space. This highlights the limitations of the UDM in capturing diversity in complex environments, whereas our approach enables a more refined and meaningful exploration of the policy space.
In summary, the results from the Leduc poker experiments support the advantages of our proposed PSM-based regularization. By reducing policy similarity and encouraging greater diversity, our approach fosters a more comprehensive exploration of the policy space and leads to more robust and less exploitable solutions. This demonstrates the potential of PSM-PSRO to improve strategic optimization in complex adversarial environments.
5.4. Ablation Studies
To investigate the individual contributions of the Gaussian and cosine similarity components in our proposed PSM-PSRO framework, we perform an ablation study by systematically removing each of these components. Specifically, we evaluate two variants of our approach: PSM-PSRO w/o. cosine, where the cosine similarity component is removed, and PSM-PSRO w/o. Gaussian, where the Gaussian similarity component is excluded.
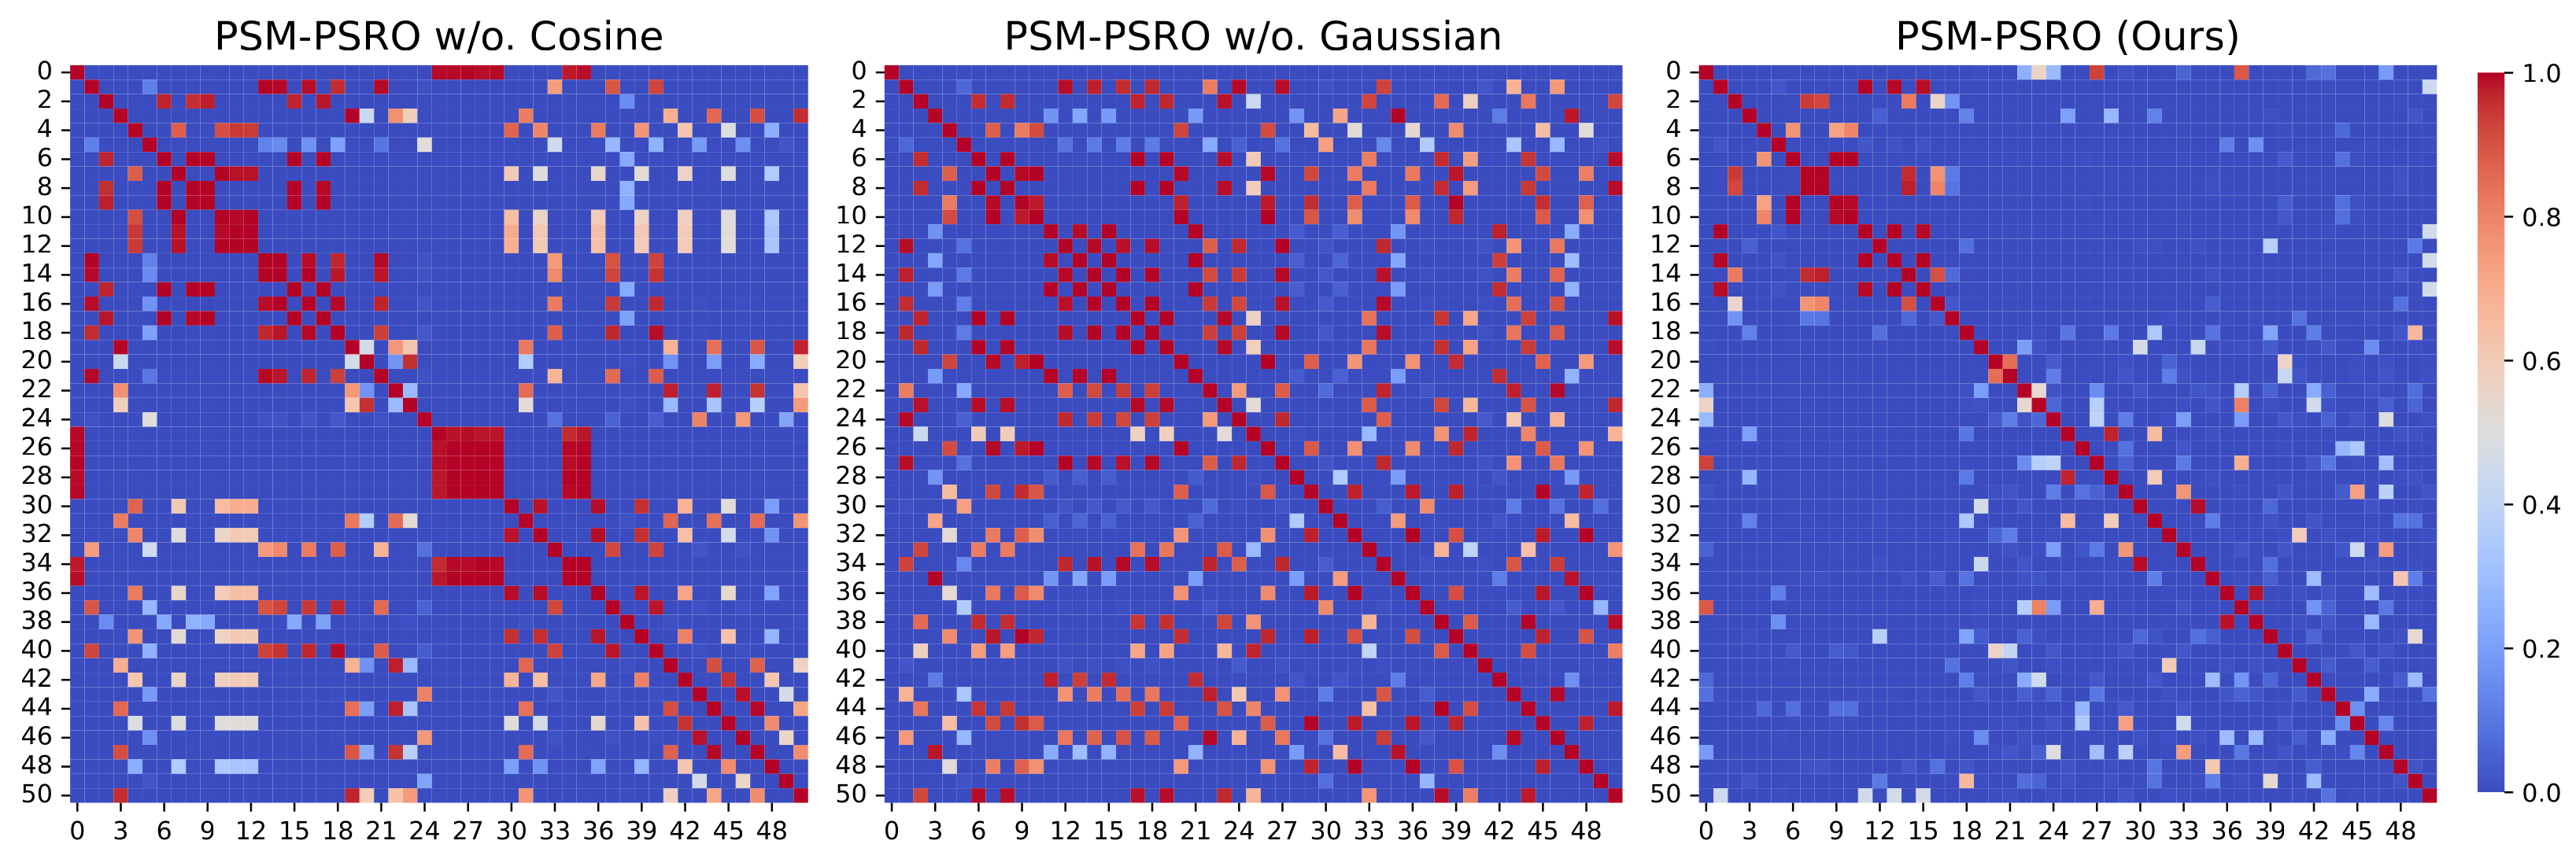
As illustrated in Figure 4a and Figure 6, both PSM-PSRO w/o. Gaussian and PSM-PSRO w/o. cosine exhibit higher exploitability than the full method, underscoring the critical role of each similarity measure in mitigating exploitability. Figure 2a and Figure 4b further demonstrate that removing either similarity component increases PSM values, indicating a rise in redundant policies within the population. Simultaneously, Figure 2b shows that the absence of either similarity component results in a decline in UDM values, reflecting a relative reduction in overall policy diversity. Moreover, the heatmaps in Figure 7 and Figure 8 reveal that the full PSM-PSRO consistently yields a more heterogeneous and well-distributed policy population, whereas the removal of either similarity measure leads to greater policy clustering.
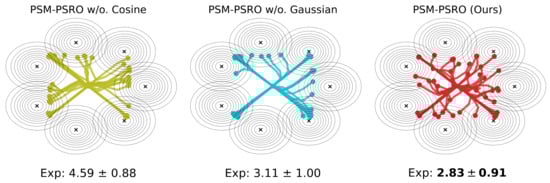
Figure 6.
Non-transitive mixture model ablation experiment: exploration trajectories during training. The final exploitability ×100 (Exp) for each method is reported at the bottom. The bold values in the figure represent the best-performing results.
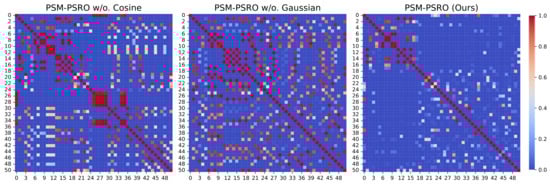
Figure 7.
Non-transitive mixture model ablation experiment: similarity matrix heatmaps of policy populations after 50 PSRO iterations. The heatmaps display the pairwise similarity between policies, with red indicating higher similarity.
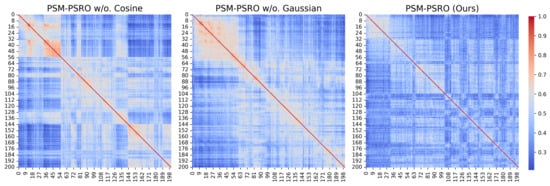
Figure 8.
Leduc poker ablation experiment: similarity matrix heatmaps of policy populations after 200 PSRO iterations. The heatmaps display the pairwise similarity between policies, with red indicating higher similarity.
Overall, these findings highlight that Gaussian and cosine similarity capture complementary aspects of policy redundancy, and their combination is essential for ensuring a well-distributed and strategically diverse policy population. While each component individually improves diversity to some extent, only their joint application effectively mitigates both magnitude- and direction-based redundancy, leading to lower exploitability and a more diverse population.
6. Conclusions
In this work, we presented a novel approach to promoting policy diversity in two-player zero-sum games. By introducing the PSM and incorporating it as a regularization term into the PSRO framework, we have demonstrated a significant improvement in mitigating redundancy within policy populations. In our experiments on the non-transitive mixture model and Leduc poker, PSM-PSRO consistently outperforms baseline methods across multiple evaluation metrics, demonstrating its superior effectiveness in enhancing policy diversity and reducing exploitability.
Our findings contribute to improving agent performance in competitive environments, especially those characterized by non-transitive dynamics, such as game AI and cyber defense, where agents must continuously adapt and diversify strategies in the face of unknown adversaries. By minimizing policy similarity, the PSM offers a more intuitive and practical method for ensuring diversity in policy sets, which is crucial for exploring complex strategy spaces and achieving robust performance.
Although the PSM has demonstrated its effectiveness in controlled simulation environments, applying it in real-world multi-agent contexts, such as autonomous driving, drone coordination, and financial trading, may introduce considerable computational overhead when constructing similarity matrices. To mitigate this bottleneck, our future work will focus on developing more efficient similarity metrics, approximation schemes, and parallelized algorithms. These enhancements aim to improve both the scalability and practical deployment of our method in complex, real-world settings.
Author Contributions
Conceptualization, H.T.; methodology, H.T.; software, H.T. and L.X.; validation, L.X. and Z.H.; formal analysis, L.X.; investigation, H.T.; resources, Z.H.; data curation, H.T.; writing—original draft preparation, H.T. and L.X.; writing—review and editing, H.T., L.X. and Z.H.; visualization, H.T. and L.X.; supervision, Z.H. and L.X.; project administration, Z.H. All authors have read and agreed to the published version of the manuscript.
Funding
This research received no external funding.
Institutional Review Board Statement
Not applicable.
Informed Consent Statement
Not applicable.
Data Availability Statement
The data used in this paper are all simulated. The code inquiries can be directed to the first author.
Conflicts of Interest
The authors declare no conflicts of interest.
Appendix A
Table A1.
Hyperparameters for non-transitive mixture model.
Table A1.
Hyperparameters for non-transitive mixture model.
| Setting | Value | Description |
|---|---|---|
| Oracle function | Gradient ascent | Function for obtaining oracles. |
| Optimizer | Adam | Gradient ascent optimizer. |
| Learning rate | 0.1 | Learning rate for agents. |
| etas | (0.9, 0.99) | Solves the NE policy. |
| Covariance matrix for Gaussians. | ||
| (2.871, −0.025) | Position of the first Gaussians. | |
| (1.8105, 2.2298) | Position of the second Gaussians. | |
| (1.8105, −2.2298) | Position of the third Gaussians. | |
| (−0.61450, 2.8058) | Position of the fourth Gaussians. | |
| (−0.61450, −2.8058) | Position of the fifth Gaussians. | |
| (−2.5768, 1.2690) | Position of the sixth Gaussians. | |
| (−2.5768, −1.2690) | Position of the seventh Gaussians. | |
| Meta-strategy | NE | Meta-strategy solver. |
| 4 | Bandwidth parameter for Gaussian similarity. | |
| Iterations | 50 | Number of PSRO training iterations. |
| at Iteration t | Weight of the diversity in the oracle. | |
| Random seeds | 10 | Number of random seeds. |
Table A2.
Hyperparameters for Leduc poker.
Table A2.
Hyperparameters for Leduc poker.
| Setting | Value | Description |
|---|---|---|
| Oracle | PPO | The reinforcement learning algorithm used for oracle. |
| Policy network | state-64-64-64-action | Neural network for actor. |
| Value network | state-64-64-64-1 | Neural network for critic. |
| PSRO iterations | 200 | Number of policies added to the population. |
| Meta-strategy | NE | Meta-strategy solver. |
| Discount factor () | 0.99 | Discounting for future rewards. |
| Learning rate | Adam optimizer step size. | |
| Entropy coefficient | 0.2 | Encourages exploration in PPO. |
| PPO clip parameter | 0.2 | Clipping range for ratio. |
| BR episodes | 2 × 10⁴ | Episodes for each BR training. |
| Batch size | 2048 | Number of sampled transitions per update. |
| Number of mini-batches | 1 | Number of mini-batches per epoch in MAPPO. |
| PPO epochs | 10 | Number of times each sample is reused. |
| GAE lambda | 0.95 | Exponential decay factor for GAE advantage. |
| 4 | Bandwidth parameter for Gaussian similarity. | |
| Value loss weighting | 1.0 | Trade-off coefficient for value function loss. |
| Random seed | 3 | Number of random seeds used. |
References
- Albrecht, S.V.; Christianos, F.; Schäfer, L. Multi-Agent Reinforcement Learning: Foundations and Modern Approaches; MIT Press: Cambridge, MA, USA, 2024. [Google Scholar]
- Samuel, A.L. Some Studies in Machine Learning Using the Game of Checkers. IBM J. Res. Dev. 1959, 3, 210–229. [Google Scholar] [CrossRef]
- Bansal, T.; Pachocki, J.; Sidor, S.; Sutskever, I.; Mordatch, I. Emergent complexity via multi-agent competition. arXiv 2017, arXiv:1710.03748. [Google Scholar]
- Silver, D.; Huang, A.; Maddison, C.J.; Guez, A.; Sifre, L.; Van Den Driessche, G.; Schrittwieser, J.; Antonoglou, I.; Panneershelvam, V.; Lanctot, M.; et al. Mastering the game of Go with deep neural networks and tree search. Nature 2016, 529, 484–489. [Google Scholar] [CrossRef] [PubMed]
- Silver, D.; Schrittwieser, J.; Simonyan, K.; Antonoglou, I.; Huang, A.; Guez, A.; Hubert, T.; Baker, L.; Lai, M.; Bolton, A.; et al. Mastering the game of go without human knowledge. Nature 2017, 550, 354–359. [Google Scholar] [CrossRef]
- Silver, D.; Hubert, T.; Schrittwieser, J.; Antonoglou, I.; Lai, M.; Guez, A.; Lanctot, M.; Sifre, L.; Kumaran, D.; Graepel, T.; et al. Mastering chess and shogi by self-play with a general reinforcement learning algorithm. arXiv 2017, arXiv:1712.01815. [Google Scholar]
- Schrittwieser, J.; Antonoglou, I.; Hubert, T.; Simonyan, K.; Sifre, L.; Schmitt, S.; Guez, A.; Lockhart, E.; Hassabis, D.; Graepel, T.; et al. Mastering atari, go, chess and shogi by planning with a learned model. Nature 2020, 588, 604–609. [Google Scholar] [CrossRef]
- Moravčík, M.; Schmid, M.; Burch, N.; Lisỳ, V.; Morrill, D.; Bard, N.; Davis, T.; Waugh, K.; Johanson, M.; Bowling, M. Deepstack: Expert-level artificial intelligence in heads-up no-limit poker. Science 2017, 356, 508–513. [Google Scholar] [CrossRef]
- Heinrich, J.; Lanctot, M.; Silver, D. Fictitious self-play in extensive-form games. Proc. Int. Conf. Mach. Learn. 2015, 37, 805–813. [Google Scholar]
- Berner, C.; Brockman, G.; Chan, B.; Cheung, V.; Debiak, P.; Dennison, C.; Farhi, D.; Fischer, Q.; Hashme, S.; Hesse, C.; et al. Dota 2 with large scale deep reinforcement learning. arXiv 2019, arXiv:1912.06680. [Google Scholar]
- Vinyals, O.; Babuschkin, I.; Czarnecki, W.M.; Mathieu, M.; Dudzik, A.; Chung, J.; Choi, D.H.; Powell, R.; Ewalds, T.; Georgiev, P.; et al. Grandmaster level in StarCraft II using multi-agent reinforcement learning. Nature 2019, 575, 350–354. [Google Scholar] [CrossRef]
- Ye, D.; Chen, G.; Zhang, W.; Chen, S.; Yuan, B.; Liu, B.; Chen, J.; Liu, Z.; Qiu, F.; Yu, H.; et al. Towards playing full moba games with deep reinforcement learning. Adv. Neural Inf. Process. Syst. 2020, 33, 621–632. [Google Scholar]
- Czarnecki, W.M.; Gidel, G.; Tracey, B.; Tuyls, K.; Omidshafiei, S.; Balduzzi, D.; Jaderberg, M. Real world games look like spinning tops. Adv. Neural Inf. Process. Syst. 2020, 33, 17443–17454. [Google Scholar]
- Candogan, O.; Menache, I.; Ozdaglar, A.; Parrilo, P.A. Flows and decompositions of games: Harmonic and potential games. Math. Oper. Res. 2011, 36, 474–503. [Google Scholar] [CrossRef]
- Balduzzi, D.; Racaniere, S.; Martens, J.; Foerster, J.; Tuyls, K.; Graepel, T. The mechanics of n-player differentiable games. Proc. Int. Conf. Mach. Learn. 2018, 80, 354–363. [Google Scholar]
- McAleer, S.; Lanier, J.B.; Fox, R.; Baldi, P. Pipeline psro: A scalable approach for finding approximate nash equilibria in large games. Adv. Neural Inf. Process. Syst. 2020, 33, 20238–20248. [Google Scholar]
- Perez-Nieves, N.; Yang, Y.; Slumbers, O.; Mguni, D.H.; Wen, Y.; Wang, J. Modelling behavioural diversity for learning in open-ended games. Proc. Int. Conf. Mach. Learn. 2021, 139, 8514–8524. [Google Scholar]
- McMahan, H.B.; Gordon, G.J.; Blum, A. Planning in the presence of cost functions controlled by an adversary. In Proceedings of the 20th International Conference on Machine Learning (ICML-03), Washington, DC, USA, 21–24 August 2003; pp. 536–543. [Google Scholar]
- Heinrich, J.; Silver, D. Deep reinforcement learning from self-play in imperfect-information games. arXiv 2016, arXiv:1603.01121. [Google Scholar]
- Hernandez, D.; Denamganaï, K.; Gao, Y.; York, P.; Devlin, S.; Samothrakis, S.; Walker, J.A. A generalized framework for self-play training. In Proceedings of the 2019 IEEE Conference on Games (CoG), London, UK, 20–23 August 2019; pp. 1–8. [Google Scholar]
- Lanctot, M.; Zambaldi, V.; Gruslys, A.; Lazaridou, A.; Tuyls, K.; Pérolat, J.; Silver, D.; Graepel, T. A unified game-theoretic approach to multiagent reinforcement learning. Adv. Neural Inf. Process. Syst. 2017, 30, 4190–4203. [Google Scholar]
- Pugh, J.K.; Soros, L.B.; Stanley, K.O. Quality diversity: A new frontier for evolutionary computation. Front. Robot. AI 2016, 3, 40. [Google Scholar] [CrossRef]
- Liu, X.; Jia, H.; Wen, Y.; Hu, Y.; Chen, Y.; Fan, C.; Hu, Z.; Yang, Y. Towards Unifying Behavioral and Response Diversity for Open-ended Learning in Zero-sum Games. Adv. Neural Inf. Process. Syst. 2021, 34, 941–952. [Google Scholar]
- Liu, Z.; Yu, C.; Yang, Y.; Wu, Z.; Li, Y. A Unified Diversity Measure for Multiagent Reinforcement Learning. Adv. Neural Inf. Process. Syst. 2022, 35, 10339–10352. [Google Scholar]
- Yao, J.; Liu, W.; Fu, H.; Yang, Y.; McAleer, S.; Fu, Q.; Yang, W. Policy space diversity for non-transitive games. Adv. Neural Inf. Process. Syst. 2024, 36, 67771–67793. [Google Scholar]
- Wortsman, M.; Ilharco, G.; Gadre, S.Y.; Roelofs, R.; Gontijo-Lopes, R.; Morcos, A.S.; Namkoong, H.; Farhadi, A.; Carmon, Y.; Kornblith, S.; et al. Model soups: Averaging weights of multiple fine-tuned models improves accuracy without increasing inference time. Proc. Int. Conf. Mach. Learn. 2022, 162, 23965–23998. [Google Scholar]
- Zhou, M.; Chen, J.; Wen, Y.; Zhang, W.; Yang, Y.; Yu, Y.; Wang, J. Efficient Policy Space Response Oracles. arXiv 2022, arXiv:2202.00633. [Google Scholar]
- Wu, Z.; Li, K.; Xu, H.; Zang, Y.; An, B.; Xing, J. L2E: Learning to exploit your opponent. In Proceedings of the 2022 International Joint Conference on Neural Networks (IJCNN), Padua, Italy, 18–23 July 2022; pp. 1–8. [Google Scholar]
- Liu, M.; He, T.; Xu, M.; Zhang, W. Energy-based imitation learning. arXiv 2020, arXiv:2004.09395. [Google Scholar]
- Parker-Holder, J.; Pacchiano, A.; Choromanski, K.M.; Roberts, S.J. Effective diversity in population based reinforcement learning. Adv. Neural Inf. Process. Syst. 2020, 33, 18050–18062. [Google Scholar]
- Li, C.; Wang, T.; Wu, C.; Zhao, Q.; Yang, J.; Zhang, C. Celebrating diversity in shared multi-agent reinforcement learning. Adv. Neural Inf. Process. Syst. 2021, 34, 3991–4002. [Google Scholar]
- Sutton, R.S. Reinforcement Learning: An Introduction; A Bradford Book; MIT Press: Cambridge, MA, USA, 2018. [Google Scholar]
- Eysenbach, B.; Gupta, A.; Ibarz, J.; Levine, S. Diversity is all you need: Learning skills without a reward function. arXiv 2018, arXiv:1802.06070. [Google Scholar]
- Levine, S. Reinforcement learning and control as probabilistic inference: Tutorial and review. arXiv 2018, arXiv:1805.00909. [Google Scholar]
- Balduzzi, D.; Garnelo, M.; Bachrach, Y.; Czarnecki, W.; Perolat, J.; Jaderberg, M.; Graepel, T. Open-ended learning in symmetric zero-sum games. Proc. Int. Conf. Mach. Learn. 2019, 97, 434–443. [Google Scholar]
- Brantley, K.; Sun, W.; Henaff, M. Disagreement-regularized imitation learning. In Proceedings of the International Conference on Learning Representations, New Orleans, LA, USA, 6–9 May 2019. [Google Scholar]
- Fudenberg, D.; Tirole, J. Game Theory; MIT Press: Cambridge, MA, USA, 1991. [Google Scholar]
- Kuhn, H.W. Extensive games and the problem of information. Contrib. Theory Games 1953, 2, 193–216. [Google Scholar]
- Southey, F.; Bowling, M.P.; Larson, B.; Piccione, C.; Burch, N.; Billings, D.; Rayner, C. Bayes’ bluff: Opponent modelling in poker. arXiv 2012, arXiv:1207.1411. [Google Scholar]
- Daskalakis, C.; Deckelbaum, A.; Kim, A. Near-optimal no-regret algorithms for zero-sum games. In Proceedings of the Twenty-Second Annual ACM-SIAM Symposium on Discrete Algorithms, San Francisco, CA, USA, 23–25 January 2011; pp. 235–254. [Google Scholar]


Disclaimer/Publisher’s Note: The statements, opinions and data contained in all publications are solely those of the individual author(s) and contributor(s) and not of MDPI and/or the editor(s). MDPI and/or the editor(s) disclaim responsibility for any injury to people or property resulting from any ideas, methods, instructions or products referred to in the content. |
© 2025 by the authors. Licensee MDPI, Basel, Switzerland. This article is an open access article distributed under the terms and conditions of the Creative Commons Attribution (CC BY) license (https://creativecommons.org/licenses/by/4.0/).