Abstract
Maritime transport is a pivotal logistics mode for the long-distance and bulk transportation of goods. However, the intricate planning involved in this mode is often hindered by uncertainties, including weather conditions, cargo diversity, and port dynamics, leading to increased costs. Consequently, accurate estimation of the total (stay) time of the vessel and any delays at the port are essential for efficient planning and scheduling of port operations. This study aims to develop predictive analytics to address the shortcomings in the previous works of port operations for a vessel’s Stay Time and Delay Time, offering a valuable contribution to the field of maritime logistics. The proposed solution is designed to assist decision-making in port environments and predict service delays. This is demonstrated through a case study on Brazil’s ports, where the best performance is observed for tree-based methods. Additionally, feature analysis is used to understand and interpret key factors impacting maritime logistics, enhancing the overall understanding of the complexities involved in port operations.
1. Introduction
In the intricate landscape of global maritime logistics, an often overlooked yet substantial segment of a vessel’s journey unfolds within the confines of port facilities. While traditional narratives tend to focus on vessels (ships) navigating the open waters [1,2,3], a substantial portion of their journey involves complex maneuvers, cargo handling, and operational intricacies within ports [4]. Surprisingly, although there is a dualistic nature of a vessel’s journey, at sea and within port, the latter is relatively under explored in the existing literature. The temporal dynamics, efficiency challenges, and optimization opportunities inherent in the port-centric leg of a vessel’s journey warrant closer scrutiny [5]. This gap in scholarly exploration calls for an in-depth examination, shedding light on the pivotal role that port activities play in the broader context of maritime transportation, supply chain efficiency, and global trade networks [6].
The optimization of port operations holds critical importance in the context of globalization, where nations strive to maintain their competitiveness and economic resilience in an interconnected world. Efficient port operations are essential not only for facilitating trade and commerce but also for accommodating the growing flow of goods and passengers associated with global tourism and cultural exchanges. The integration of marine traffic information through an Application Programming Interface (API) [7,8,9] has emerged as a key technological advancement, offering real-time insights into vessel movements and enabling proactive decision-making to enhance port efficiency on a global scale.
While the specific focus of this project is on Brazil’s ports, the broader implications extend to a global context. The main objective of this study is to analyze and optimize port operations through predictive analysis of data obtained from Brazilian ports, applying recognized approaches to derive actionable insights. This research addresses a critical gap in the literature for integrating comprehensive data analysis with operational optimization strategies, an area that remains underexplored in maritime logistics [10,11]. The novelty of this study lies in its application of advanced statistical techniques to assess port efficiency, as well as its emphasis on feature analysis to improve port operations. By studying the case of Brazil, with its rich maritime history and strategic positioning in global trade, valuable insights can be gained that are applicable to port operations and maritime logistics across diverse regions and economies. The findings would be particularly relevant to port authorities, policymakers, and supply chain analysts seeking data-driven approaches to enhance port efficiency and global trade integration.
The main contribution of the paper is as follows:
- Defining the problem for predictive analysis for port operations which is lacking in the current literature.
- Exhaustive comparison of methods with multiple metrics for prediction and classification of Total Time (Stay Time) and Delay Time at the port to obtain a holistic view.
- Discovery of key factors that affect port operations using feature importance.
- SHAP (Shapley Additive Explanations) analysis to understand the contribution of these key factors on the output.
- The combined analysis and inference is used to improve decision-making for effective port operations.
By providing tools to accurately predict and classify vessel behavior, this research contributes greatly to improving our understanding of various methods, which can be used to make more efficient and effective predictive analytics-based decision-making in port management.
The paper is structured as follows: Section 2 provides a comprehensive review of the literature relevant to the study. Section 3 discusses Brazil’s port case study and outlines the proposed methods used for port predictive analysis. Section 4 dives into the results and shares key features that impact the port operations, while Section 5 discusses key observations. Section 6 offers conclusions from the study and suggests avenues for future research.
2. Literature Review
Predictive Model Scheduling (PMS) is an important area of interest in port operations, focusing on the development of predictive models to optimize scheduling processes for port activities [12,13]. By leveraging predictive analytics for Total Time and Delay Time, PMS aims to enhance the efficiency and effectiveness of port operations by forecasting demand, optimizing resource allocation, and improving overall performance [14]. These papers have explored the application of machine learning and optimization algorithms for predictive scheduling in container terminals, demonstrating the potential of these methods in improving port productivity. Effective PMS relies on accurate estimates of vessel turnaround times and potential delays to make informed scheduling decisions. In this work, we extend these efforts by exploring more advanced methods, including deep learning, to achieve more accurate estimates for Total Time and Delay Time. These improved predictions can further enhance PMS by enabling better decision-making, optimizing scheduling, and ultimately improving the efficiency of port operations.
The Berth Allocation Problem (BAP) is another critical challenge in port operations, aiming to optimize the allocation of berthing facilities for the incoming ships while considering various restrictions and objectives [2,15]. The estimation of different durations for the vessels is a crucial factor in BAP mathematical formulations, as it directly influences berth allocation decisions. Therefore, the development of efficient prediction and classification models for Total Time is strategically important for addressing the BAP. Studies by Guo et al. and Rodrigues et al. [16,17] have explored novel algorithms and optimization techniques to address the BAP, emphasizing the importance of accurate Total Time predictions in optimizing berth allocations.
Performance management of ports and vessels is a critical aspect of maritime logistics, involving the monitoring, analysis, and optimization of Key Performance Indicators (KPIs) to ensure operational efficiency and competitiveness. Farag et al. and López-Bermúdez et al. [18,19] emphasize the importance of performance management systems for ports, highlighting the need for real-time data analytics and decision support tools to enhance operational performance. Regarding port and ship characteristics related to faults and accidents, the literature has focused on risk assessment and mitigation strategies to improve safety and reliability in port operations [20,21].
In addition to the aforementioned areas, recent literature has also emphasized the importance of sustainability and green practices in port operations [11,22]. With increasing global awareness of environmental issues, there has been a growing focus on developing sustainable and eco-friendly port operations. Sustainable port initiatives aim to minimize the environmental impact of port activities, reduce carbon emissions, and promote the use of renewable energy sources.
Despite the significant work on port operations, there is an absence of studies on models for predicting and classifying the Total Time and Delay Time of vessels at ports, which highlights the need for research in this area [23,24]. By addressing this gap, the proposed study aims to contribute insightful information for the decision-making processes in port management, ultimately improving the efficiency and effectiveness of port operations. This information will be crucial for solving other port-related problems, such as the BAP, as accurate predictions of Total Time and Delay Time can enhance the applicability of BAP solutions in real-world port environments. Moreover, these insights can support management decisions related to the planning, allocation, and scheduling of loading and unloading operations, contributing to overall operational excellence in port logistics.
Prediction and classification both play important roles in this context. Classification is a relatively easier task to complete and is useful for implementing measures that impact operations on a global scale. In contrast, prediction, though more challenging, is more valuable and precise, as it can help improve operations by addressing minute details. A similar analogy applies to Total Time and Delay Time, as they are approximate values and depend on different operations and the information available. Depending on the modeling task and the variables used, different features impact them to varying extents, providing valuable insights in the predictive analysis of port operations. The combination of these approaches ensures a comprehensive strategy, where classification enables broad decision-making and prediction drives detailed, data-driven improvements. By addressing these dimensions, the study offers a well-rounded approach to enhancing port operations.
3. Case Study and Methodology
The Brazil case study data is from Abreu et al. [5,25]. Brazil’s marine logistics and port operations are crucial components of its economy due to the country’s extensive coastline and reliance on maritime transport for international trade. Brazil boasts one of the world’s most extensive coastlines, stretching over 7400 km, with numerous ports facilitating the import and export of goods. The country’s ports play a pivotal role in connecting Brazil to global markets, serving as crucial gateways for international trade [19,26]. However, port logistics in Brazil are complex due to inflexible regulations and the need for extensive information, impacting delivery times and costs [27,28]. Overall, the efficient functioning of Brazil’s marine logistics and port operations is essential for the country’s economic prosperity, trade competitiveness, and integration into the global economy [29,30]. It represents a critical component of Brazil’s infrastructure and contributes significantly to its overall development.
The authors have translated the data from Portuguese to English. The data encompasses a wide array of characteristics related to maritime cargo transportation and port operations from a period of 11/2017–12/2018. They are categorized into four main groups: Cargo characteristics, Geographic characteristics, Operation characteristics, and Stay (Total) time characteristics.
Starting with Cargo characteristics, the dataset includes details such as the type of cargo (ST Nature Cargo), the quantity of cargo moved in Twenty-foot Equivalent Units (TEUs), the net weight of containerized cargo (VL Containerized Load Weight), and the overall weight of transported cargo in tons (Moved Value). These variables provide essential insights into the nature and volume of cargo being transported, which are crucial for understanding the logistical demands of port operations.
Moving on to Geographic characteristics, the dataset encompasses information about the source and destination of the cargo, the classification of inland transportation routes, the specific mooring berth utilized, the name of the mooring port and port complex, the city and province where the port is located, and the geographical region (such as Southeast, Northeast, North, or South). These variables offer geographic context and detail the locations and routes involved in the transportation process, which can impact logistical planning and operational decision-making.
The Operation characteristics section includes variables that detail various aspects of the cargo operations themselves. This includes the classification of cargo operations, the status of containers (whether they are full, empty, or carrying loose cargo), indicators for cabotage and long course operations, the sense of the operation (whether it is disembarked or embarked), the type of port authority (public or private), the classification of mooring navigation, and the nationality of the shipowner (whether Brazilian or foreign). These variables provide insights into the operational dynamics and regulatory aspects of cargo transportation.
Finally, the Stay (Total) time characteristics section includes variables related to the duration of a vessel’s stay in port. This encompasses details such as the arrival date and hour of the ship, the mooring date and hour, the unblocking date and hour, the start date, end date and hours of operations, the month of mooring, and various time durations (T1—Wait time for the moat, T2—Wait time for start of operation, T3—Operation Time, T4—Wait time for unberthing, T2+T3+T4—Mooring time, and T1+T2+T3+T4—Total Time) that reflect different aspects of the vessel’s stay at port. These variables are critical for understanding the temporal aspects of port operations, including the time spent waiting, in operation, and overall stay duration. Delay Time is defined as Total Time-Operation Time (T1+T2+T4).
The Total Time (stay time) distribution can be seen in Figure 1a, and the class is defined similarly to [5]. Class 0 (Low) is defined for vessels with Total Time at port for 0–25 h, Class 1 (Medium) is defined for 25–50 h, Class 2 (High) includes 50–75 h, and Class 3 (Very High) is >75 h. For the Delay Class shown in Figure 1b, the plots and summary statistics (mean Delay Time ≈ 10 h, variance of Delay Time ≈ 125) are used to define class 0 as Delay Time < 24 h and Class 1 as Delay Time > 24 h.
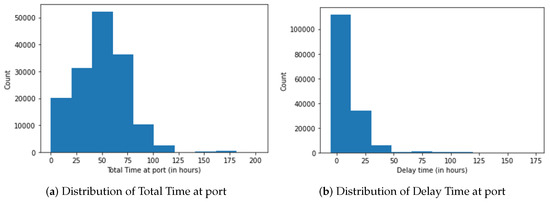
Figure 1.
Distribution of Total Time and Delay Time at port.
In the realm of supervised learning for prediction and classification, tree-based methods, statistics-based methods, and deep learning represent three prominent approaches, each with its own strengths and applications. In this study, we apply these methods for the predictive analysis of ports, focusing on modeling vessel Stay (Total) Time and Delay Time. We will briefly explore these different approaches and discuss the metrics used to evaluate their performance.
Tree-based algorithms, such as Random Forest, Extreme Gradient Boosting (XGBoost), AdaBoost, Light Gradient Boosting Machine (LightGBM), and Extra Trees, are known for their ability to handle complex relationships in data and provide robust predictions. Random Forest, for instance, constructs multiple decision trees and aggregates their outputs to improve accuracy and reduce overfitting [31]. XGBoost is a gradient boosting algorithm that excels in optimizing complex objective functions and has been widely used in competitions and industry applications for its performance [32]. AdaBoost focuses on iteratively boosting the performance of weak learners to achieve strong predictive models [33]. LightGBM is known for its efficiency in handling large datasets and has become popular for its speed and accuracy [34]. Extra Trees or Extremely Randomized Trees is an ensemble learning method that builds multiple decision trees and averages their predictions, providing robustness against noise and overfitting [35].
Additionally, feature importance analysis in tree-based models helps identify the most influential variables in the prediction process, providing insights into the underlying patterns in the data [36].
On the other hand, statistics-based methods like regression, Support Vector Machine (SVM), Bayesian classifiers, k-Nearest Neighbor (kNN), and Elastic Net offer a different set of tools for prediction and classification tasks. Regression techniques, including linear regression and its variants, are widely used for predicting continuous outcomes based on the relationships between variables [37]. SVM is a powerful predictive method that aims to find the optimal hyperplane that best separates data points into different regions in a high-dimensional space [38]. Bayesian classifiers are based on Bayes’ theorem and are probabilistic models that calculate the probability of a sample belonging to a particular class [39]. kNN is a simple yet effective algorithm that classifies a data point based on the majority class of its nearest neighbors in the feature space [40]. Elastic Net is a regularization technique combining L1 (Lasso) and L2 (Ridge) penalties, which is particularly useful for feature selection and dealing with multicollinearity in regression and classification problems [41]. Each of these statistics-based methods has its own assumptions, strengths, and limitations, making them suitable for different types of datasets and prediction tasks.
In contrast, deep learning approaches like neural networks [42,43] and ResNet (Residual Network) [44] can learn complex relationships present in the data. Neural networks consist of layers of interconnected nodes that can model intricate patterns and interactions between variables, making them highly effective for both classification and prediction tasks. ResNet is a type of deep neural network that introduces skip connections to enable the training of very deep models by mitigating the vanishing gradient problem, allowing it to capture even more complex data relationships. These deep learning models are particularly powerful for handling large and high-dimensional datasets, offering a complementary approach to traditional statistics-based methods.
In both prediction and classification tasks, various metrics are used to evaluate the performance of machine learning models. For the prediction tasks, common metrics like Root Mean Squared Error (RMSE), Mean Absolute Error (MAE), Mean Squared Error (MSE), R-squared (), Root Mean Squared Logarithmic Error (RMSLE), and Mean Absolute Percentage Error (MAPE) are used. MAE measures the average magnitude of the errors between predicted and actual values. MSE is the average of the squared differences between predicted and actual values (RMSE is the square root of MSE). represents the proportion of the variance in the dependent variable that is predictable from the independent variables. RMSLE is particularly useful for tasks where the target variable spans several orders of magnitude. MAPE measures the percentage difference between predicted and actual values. For all the metrics, lower values indicate better fit, whereas for , values close to 1 are considered good.
For classification tasks, metrics such as Accuracy, Precision, Recall, Area Under the Receiver Operating Characteristic Curve (AUC), F1 score, and Cohen’s Kappa are computed. All these values can be derived from the confusion matrix. Accuracy measures the proportion of correctly classified instances over the total number of instances. Precision measures the proportion of true positive predictions among all positive predictions, focusing on the accuracy of positive predictions. Recall (also known as sensitivity) measures the proportion of true positive predictions among all actual positives, focusing on the model’s ability to detect positive instances. AUC measures the model’s ability to distinguish between the classes. F1 score is the harmonic mean of precision and recall, providing a balance between the two metrics. Cohen’s Kappa measures the agreement between predicted and actual classifications, accounting for the possibility of the agreement occurring by chance. For all the metrics, higher values indicate good performance.
Cross-validation [45] is used to assess the model’s performance and tune its hyperparameters by repeatedly splitting the dataset into subsets for training and validation. It helps prevent overfitting by evaluating the model’s performance on multiple subsets of the data, allowing for more reliable hyperparameter tuning and regularization.
Feature analysis is performed using Feature Importance [46] and SHAP [47]. They provide valuable insights into how individual features impact the model and the outcomes. Feature Importance ranks the variables based on their contribution to the model’s performance, helping to identify which factors are most influential in the decision-making process. SHAP, on the other hand, explains how each feature impacts the outcome for each individual instance, highlighting both the global and local effects. However, SHAP does not measure the contribution of a feature to the overall model performance but instead focuses on the direction and magnitude of a feature’s impact on specific outcomes. This dual approach enables a deeper understanding of the underlying dynamics in the data, allowing for more informed decisions and targeted improvements in complex systems like port operations.
In the context of predictive analytics for port operations, the aforementioned machine learning and deep learning methods are applied to predict and classify Total Time and Delay Time, which are critical factors in port logistics. By leveraging these techniques, valuable insights are gained towards the intricate dynamics of port operations.
4. Results
The data (n = 153,331) are split into 80% (122,664) for training and 20% (30,667) for testing. The analysis considers 24 (out of 35) features as independent variables, and the other features related to the calculation of Total Time and Delay Time at the port are removed. Seventeen are categorical variables, which are transformed using one hot encoding (low cardinality variables like Month, Type of Mooring, Geographic Region, etc.) or target encoding (high cardinality variables like Berth, Source, Destination, Port, etc.). To avoid overfitting and pick the best hyperparameters, 10-fold cross-validation (CV) is performed. Let us first look into the prediction of Total Time and Delay Time, followed by the classification of Total Time and Delay Time. Feature analysis is performed for a comprehensive understanding of the key factors influencing port operations. The experiments were performed on an 8-core M2 CPU.
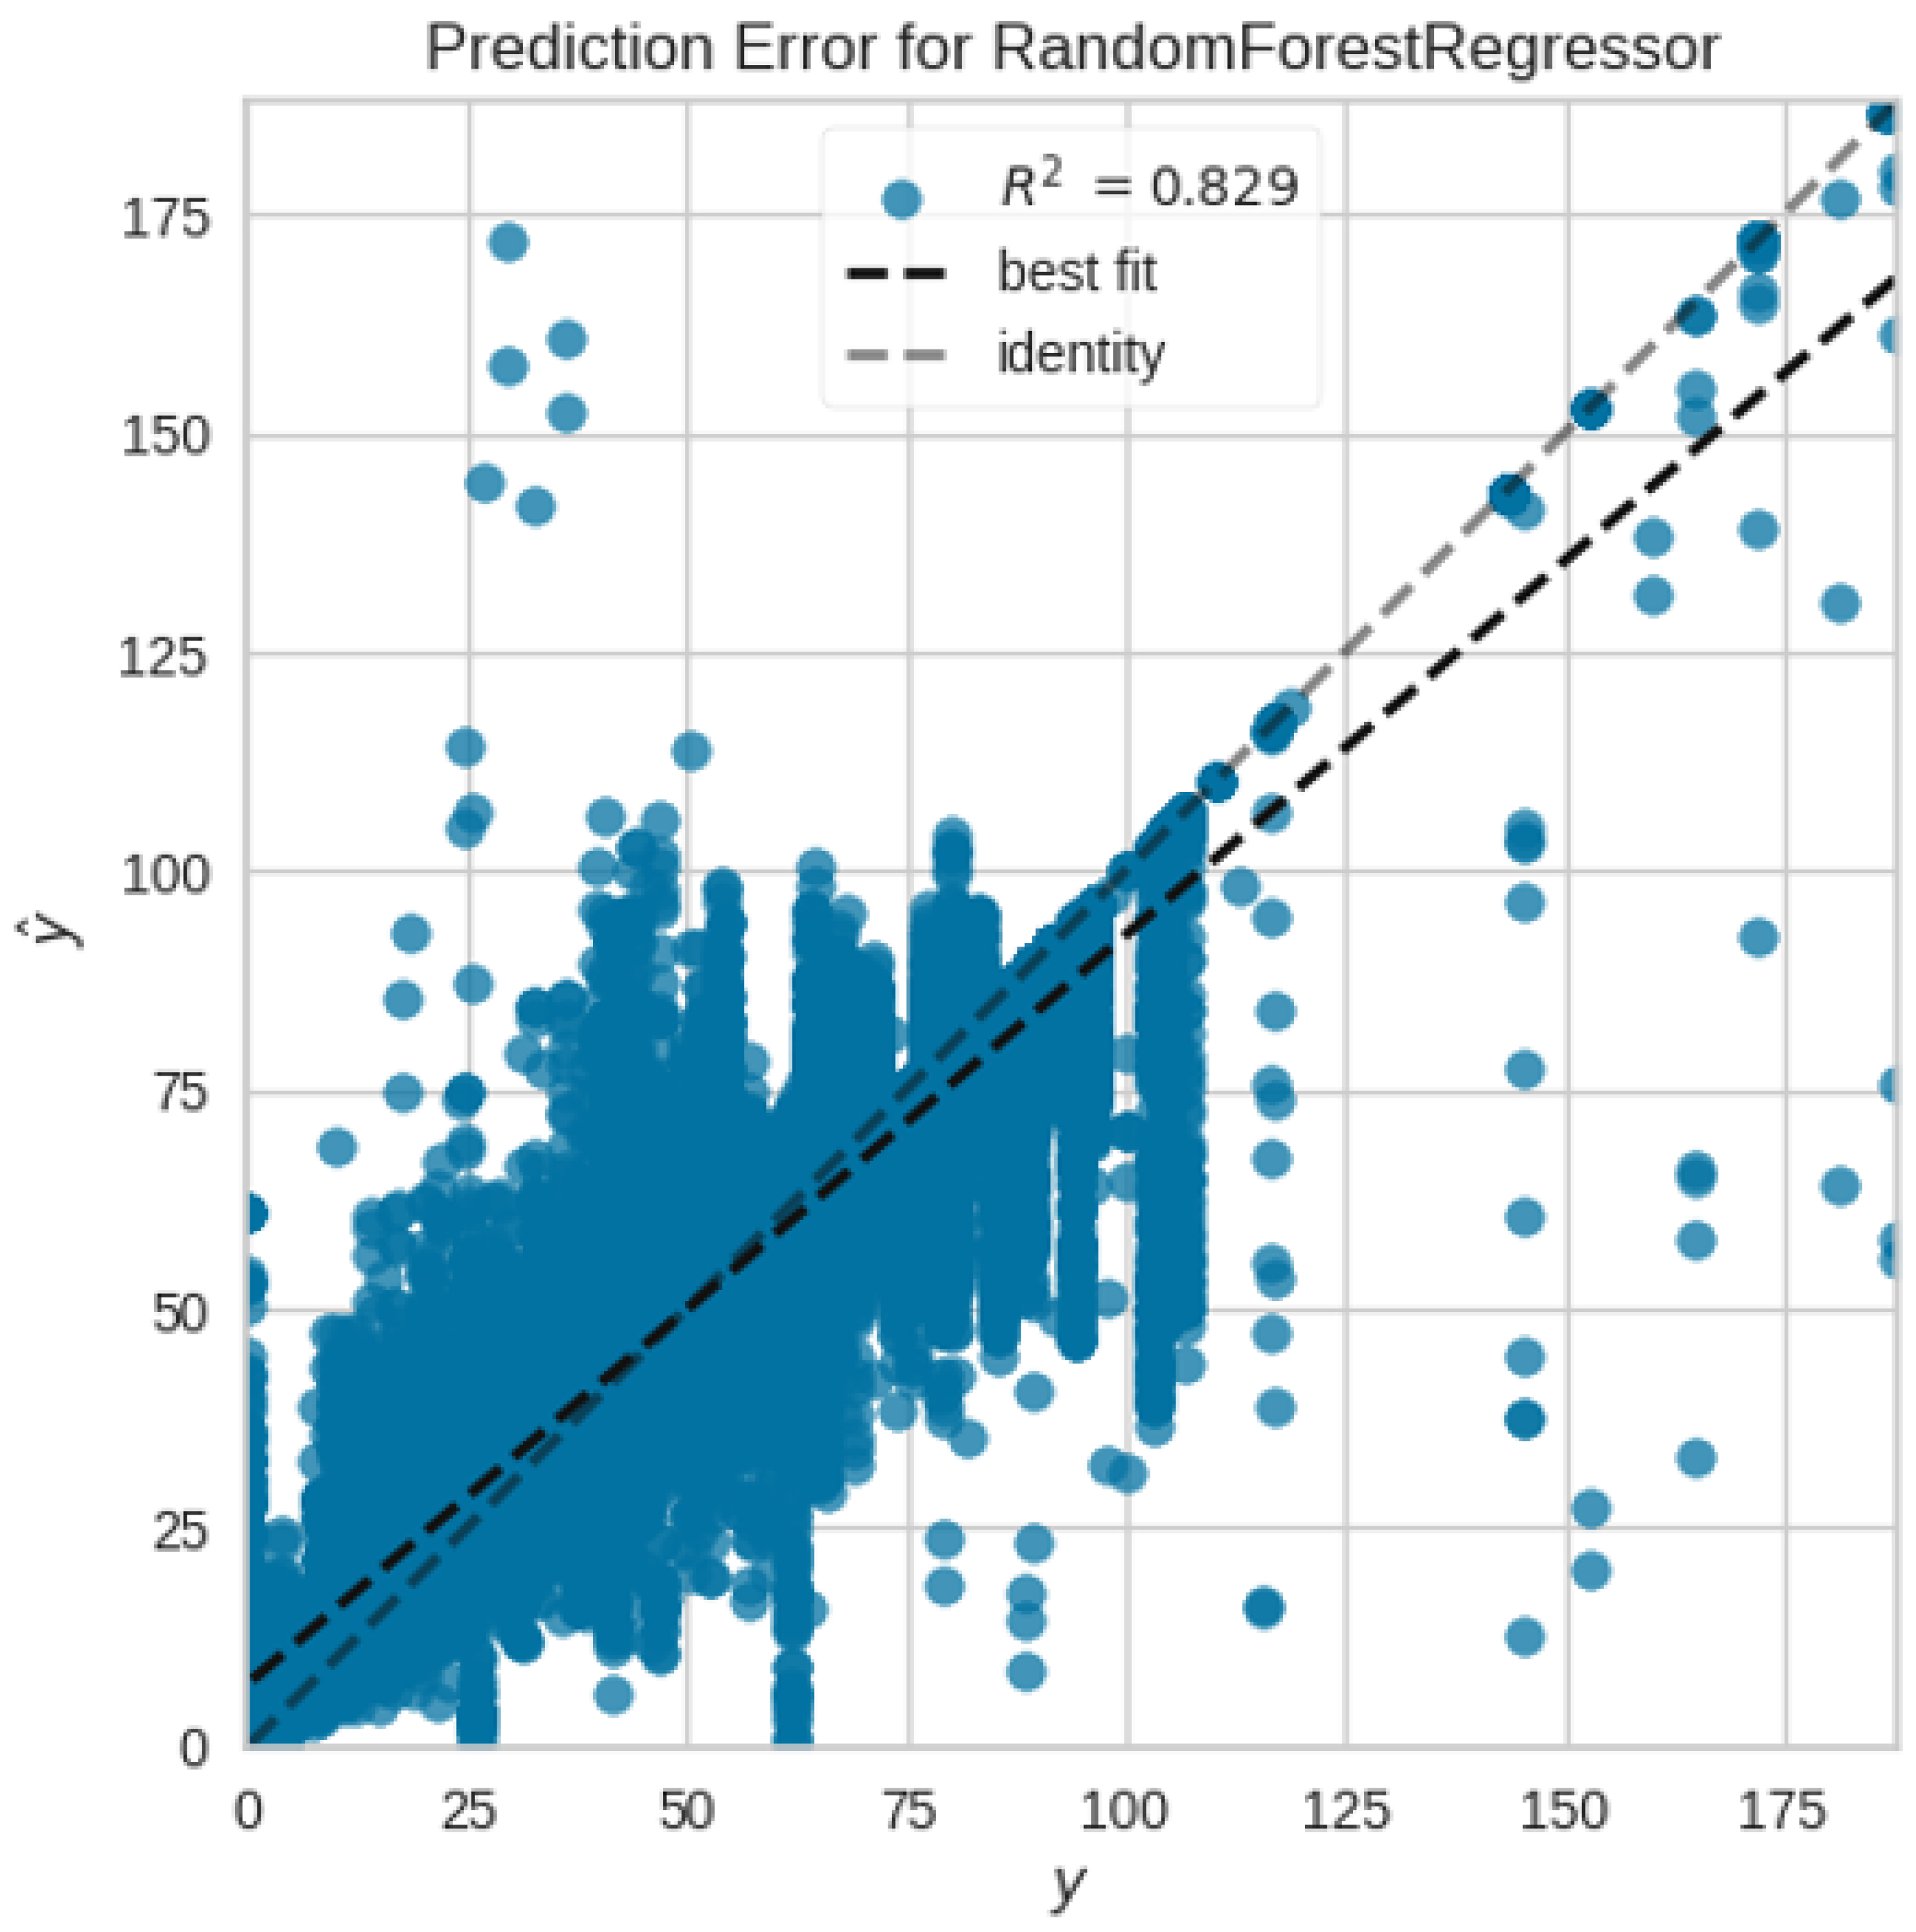
Table 1 shows the performance of different Machine Learning and Deep Learning approaches for Total Time prediction. The general trend observed is that tree-based methods perform better than statistical approaches on this task. This might be because of the complex nature of the data and their superiority in handling categorical variables. Surprisingly, neural network and ResNet performance is a bit underwhelming, the main reason for this is the presence of many categorical features in the data [48,49]. The high cardinality, non-ordinal nature, and insufficient sample per category hamper the deep learning performance. Random Forest (RF) performs the best in this task, has the lowest RMSE (10.4377), and also has better values in other metrics in comparison to the rest of the methods. Performance on the test set for RF is similar, where the RMSE is 10.2577 (other metrics are also in close range). This is visible from Figure 2, where the predicted values and true values are near the identity line with an value of 0.8287.

Table 1.
Comparing 10-fold CV results of different methods with multiple metrics (sorted using RMSE) for Total Time prediction at port.

Figure 2.
R-squared plot on test data for Total Time prediction.
Figure 3 shows the feature importance for the Total Time prediction, and it is observed that the Berth feature plays the most crucial role due to some berths being more busy and less efficient compared to others, followed by other features like Moved Value, VL Containerized Load Weight, Type of Mooring Navigation, Source, Destination, Month, etc. Since Berths play a vital role in port operations, efficient berth management is essential for optimizing port capacity, throughput, and overall smooth operations.

Figure 3.
Random Forest feature importance for Total Time prediction.
The SHAP analysis helps obtain deeper insights, as seen in Figure 4. It indicates that features like Berth, Type of Mooring Navigation, and Nationality have a high impact on the outcomes for the Random Forest model. The horizontal spread indicates the magnitude of the effect that a feature has on the outcome, whereas the color represents if the feature value is high or low. For example, the Berth feature (target encoded) denotes that, generally, a high value of this feature leads to a higher positive impact on the outcome. This means that it will lead to a higher Total Time value.
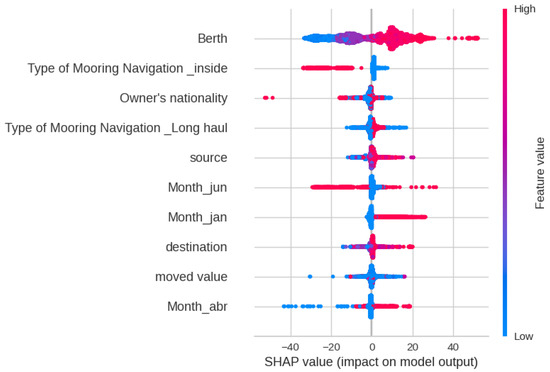
Figure 4.
SHAP feature analysis plot for Total Time prediction.
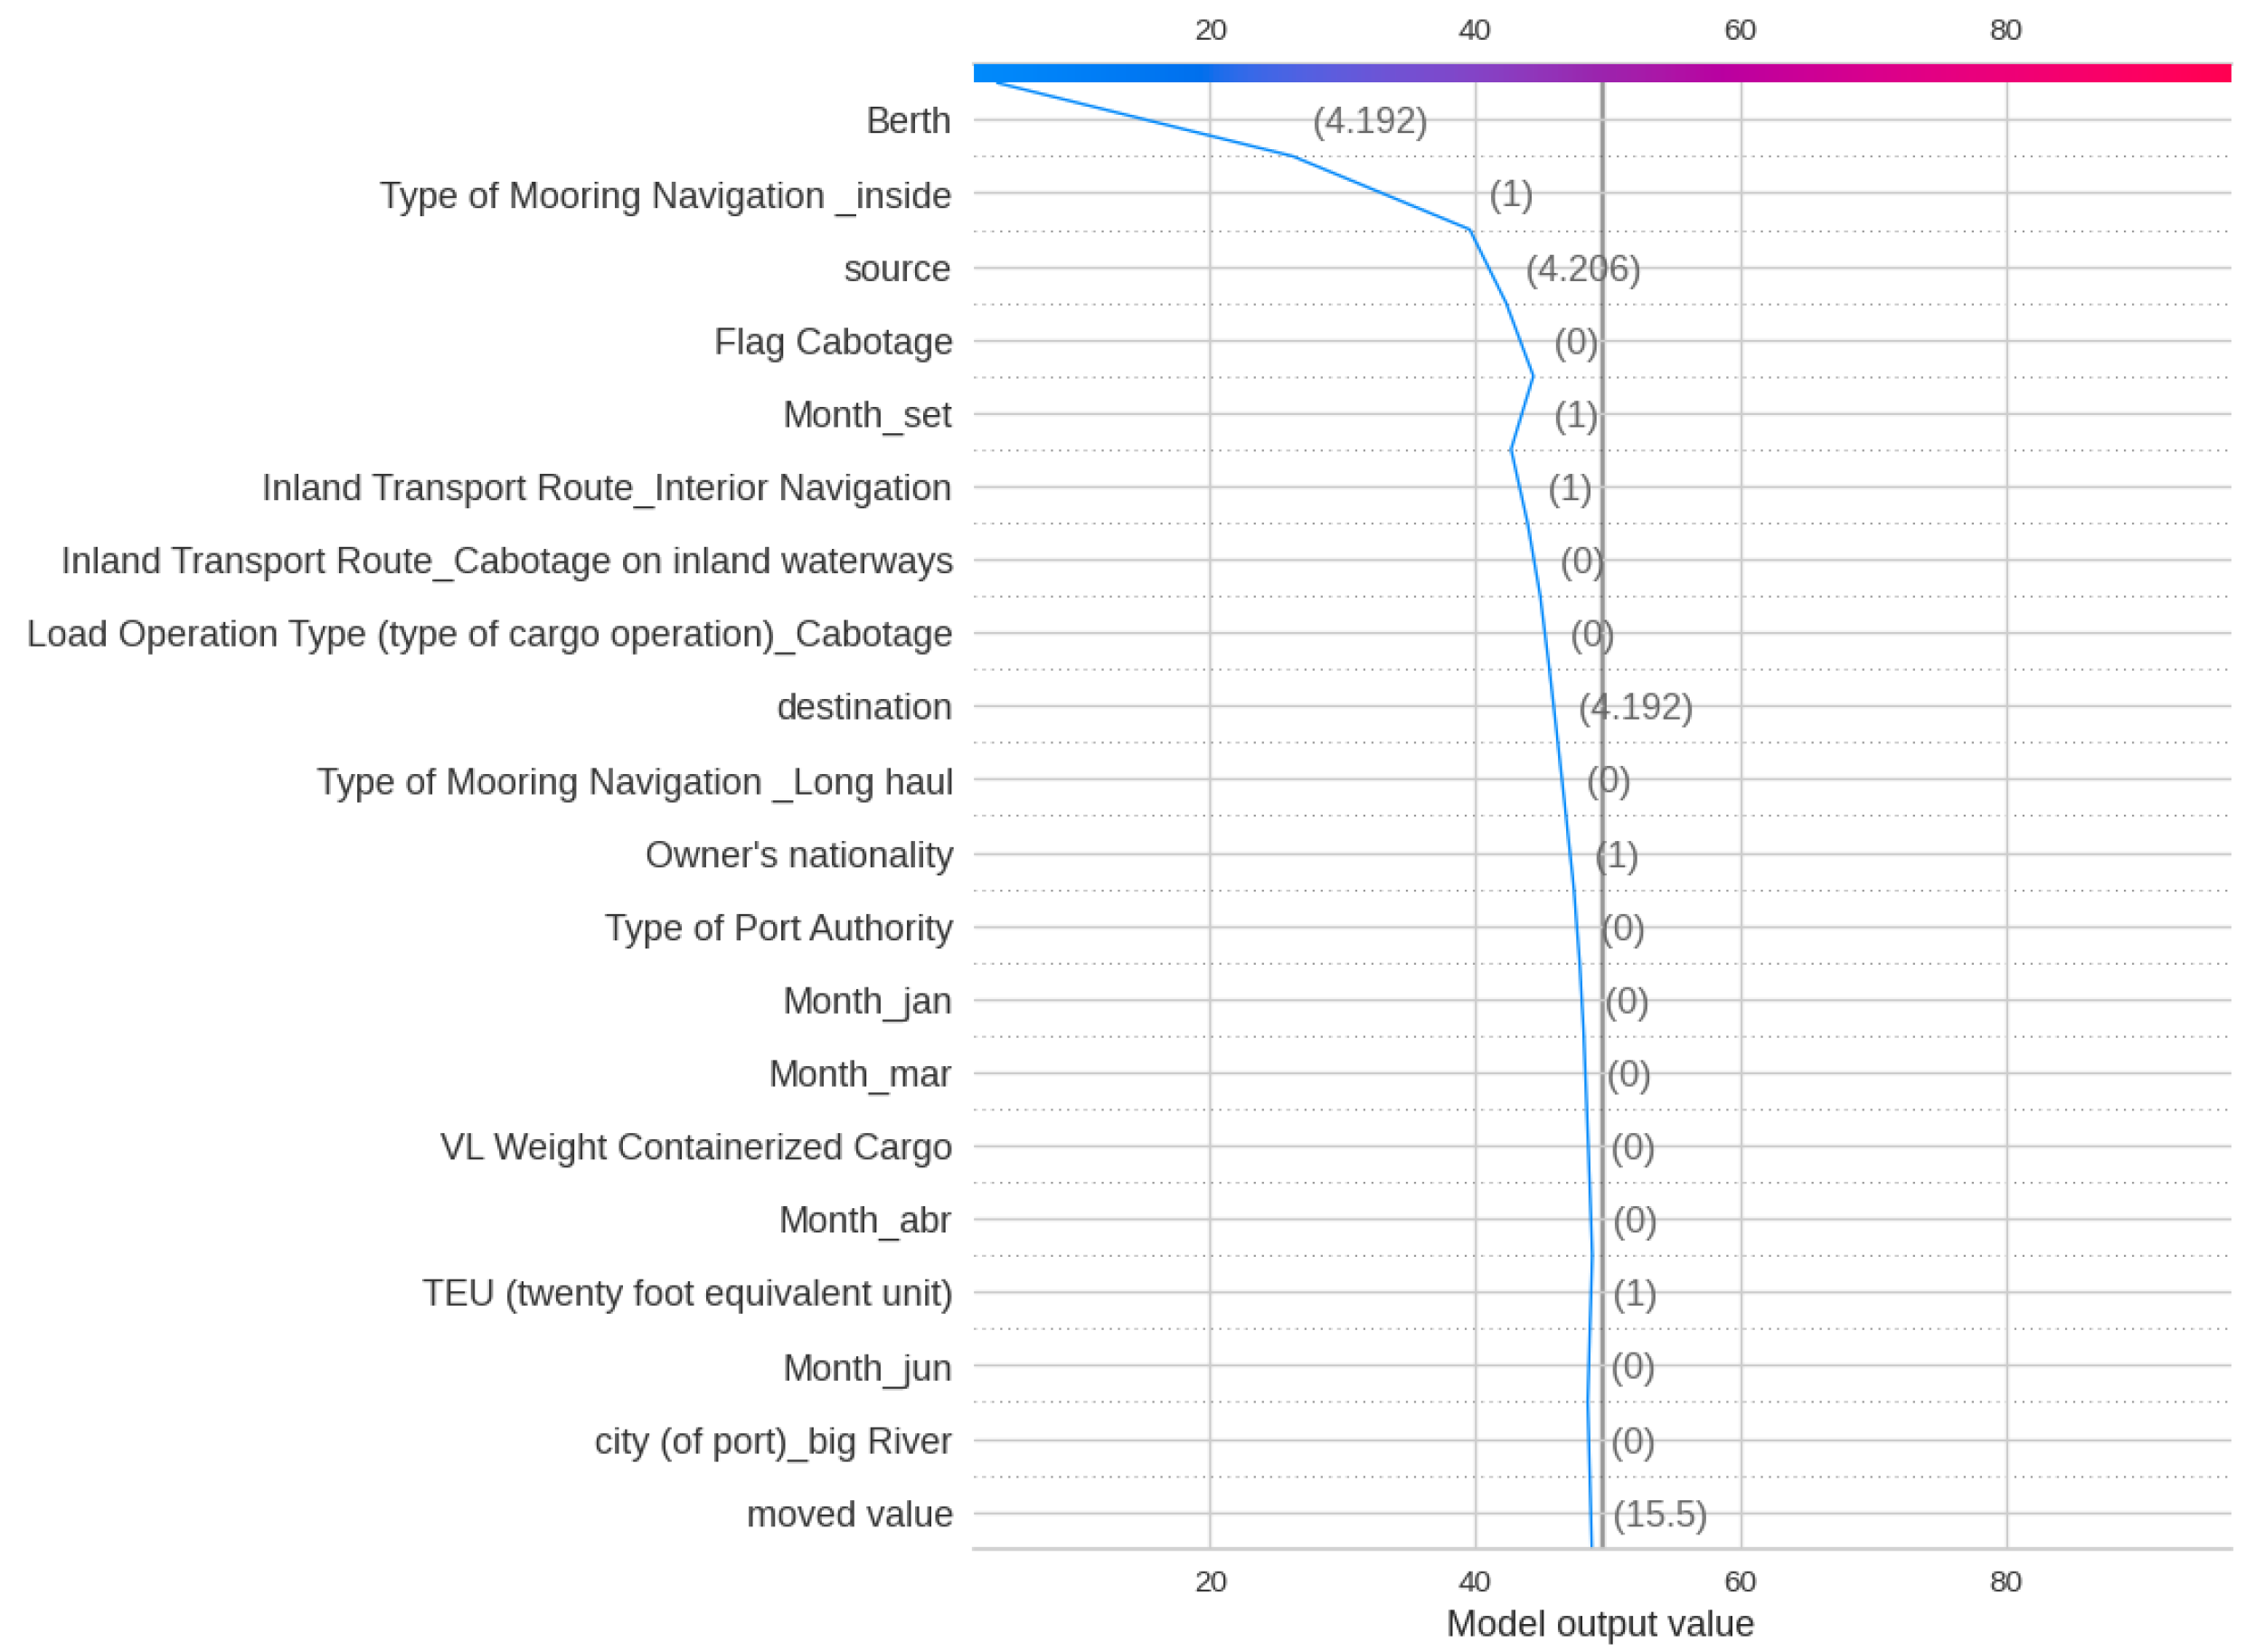
Figure 5 and Figure 6 show the Decision and Force plot for a particular sample with a true Total Time of 4.50 h. The base value (49.52) represents the expected value of the model’s output before any features are considered. The model output is 4, which is near the truth. Features like Berth, Type of Mooring Navigation, and Source are observed to have the highest impact on obtaining the right output for this sample. Since Berth and Source are fixed features, changing the Type of Mooring Navigation for this sample might help to reduce the Total Time. Note that for a different sample, some other features might be important.

Figure 5.
SHAP decision plot for Total Time prediction of a sample observation.

Figure 6.
SHAP force plot for Total Time prediction of a sample observation.
Similar results are observed from Table 2, where the tree-based methods perform better for predicting the Delay Time at the port compared to other methods. Random Forest (RF) again performs the best with an RMSE of 4.2179 followed closely by ResNet. The test set performance for RF gives an RMSE of 4.3707 (other metrics are also in a similar range). From Figure 7, it looks like the predicted and true values are not close to the identity line ( is 0.6086). The prediction of Delay Time might be limited by the feature set, as it is known that weather information and other external factors play a key role with respect to delay.
Table 2.
Comparing 10-fold CV results of different methods with multiple metrics (sorted using RMSE) for Delay Time prediction at port.
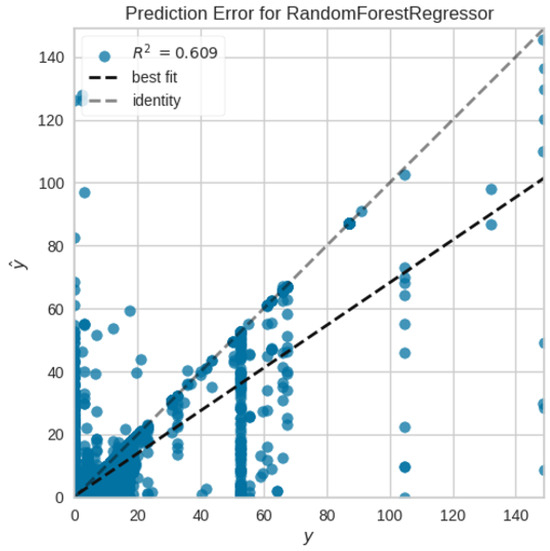
Figure 7.
R-squared plot on test data for Delay Time prediction.
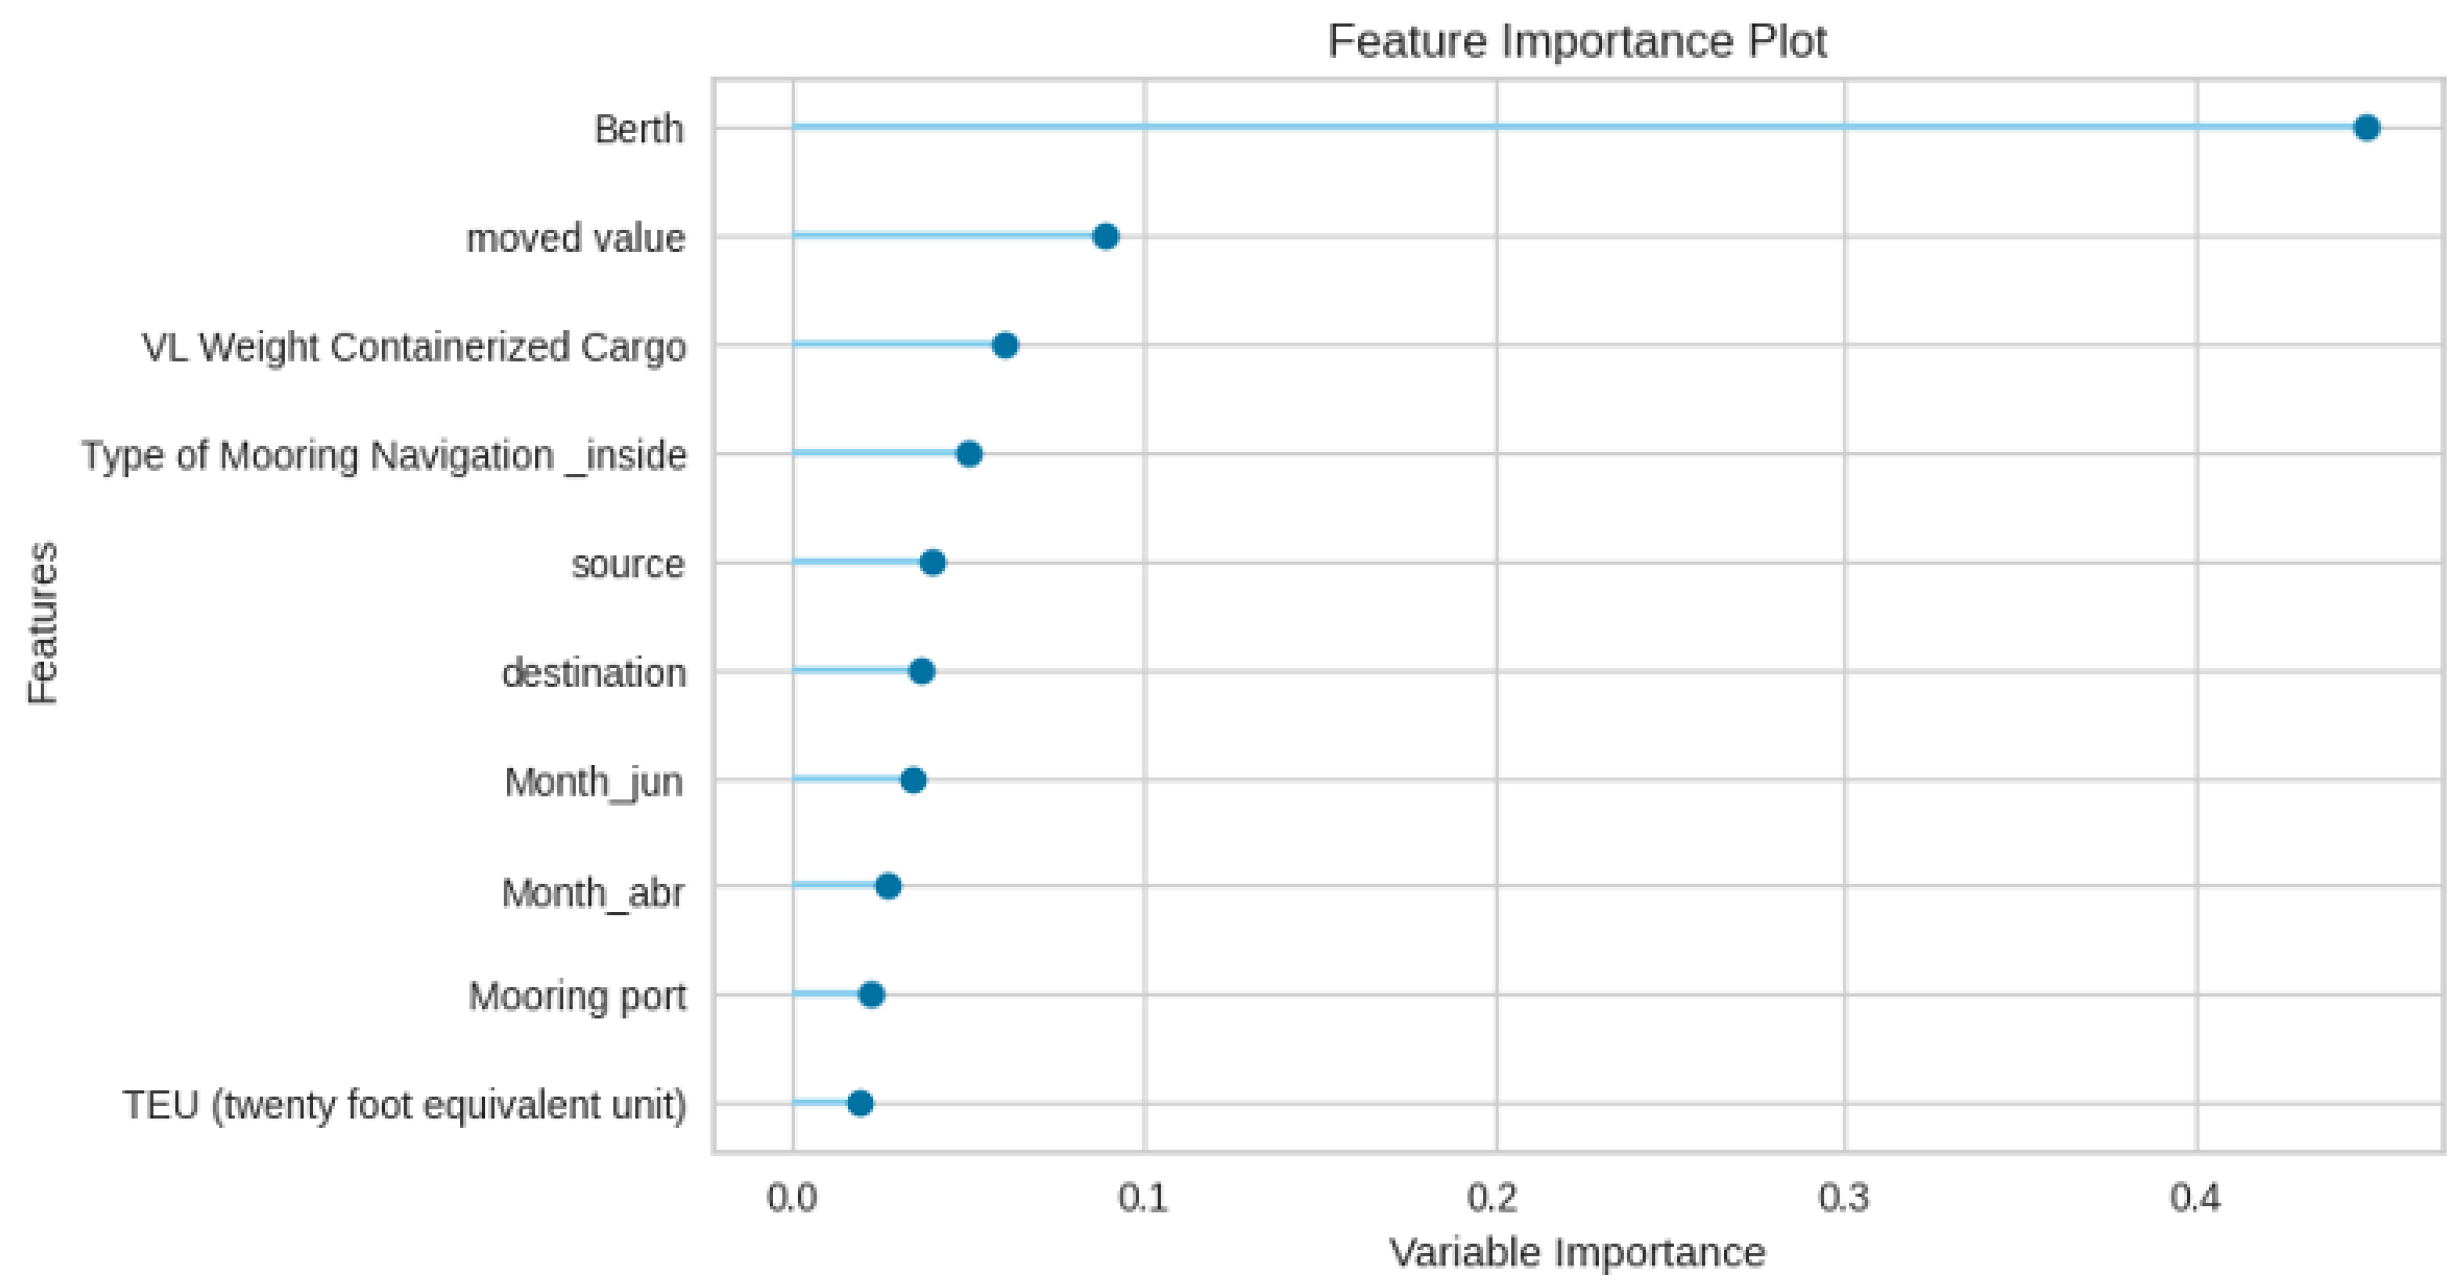
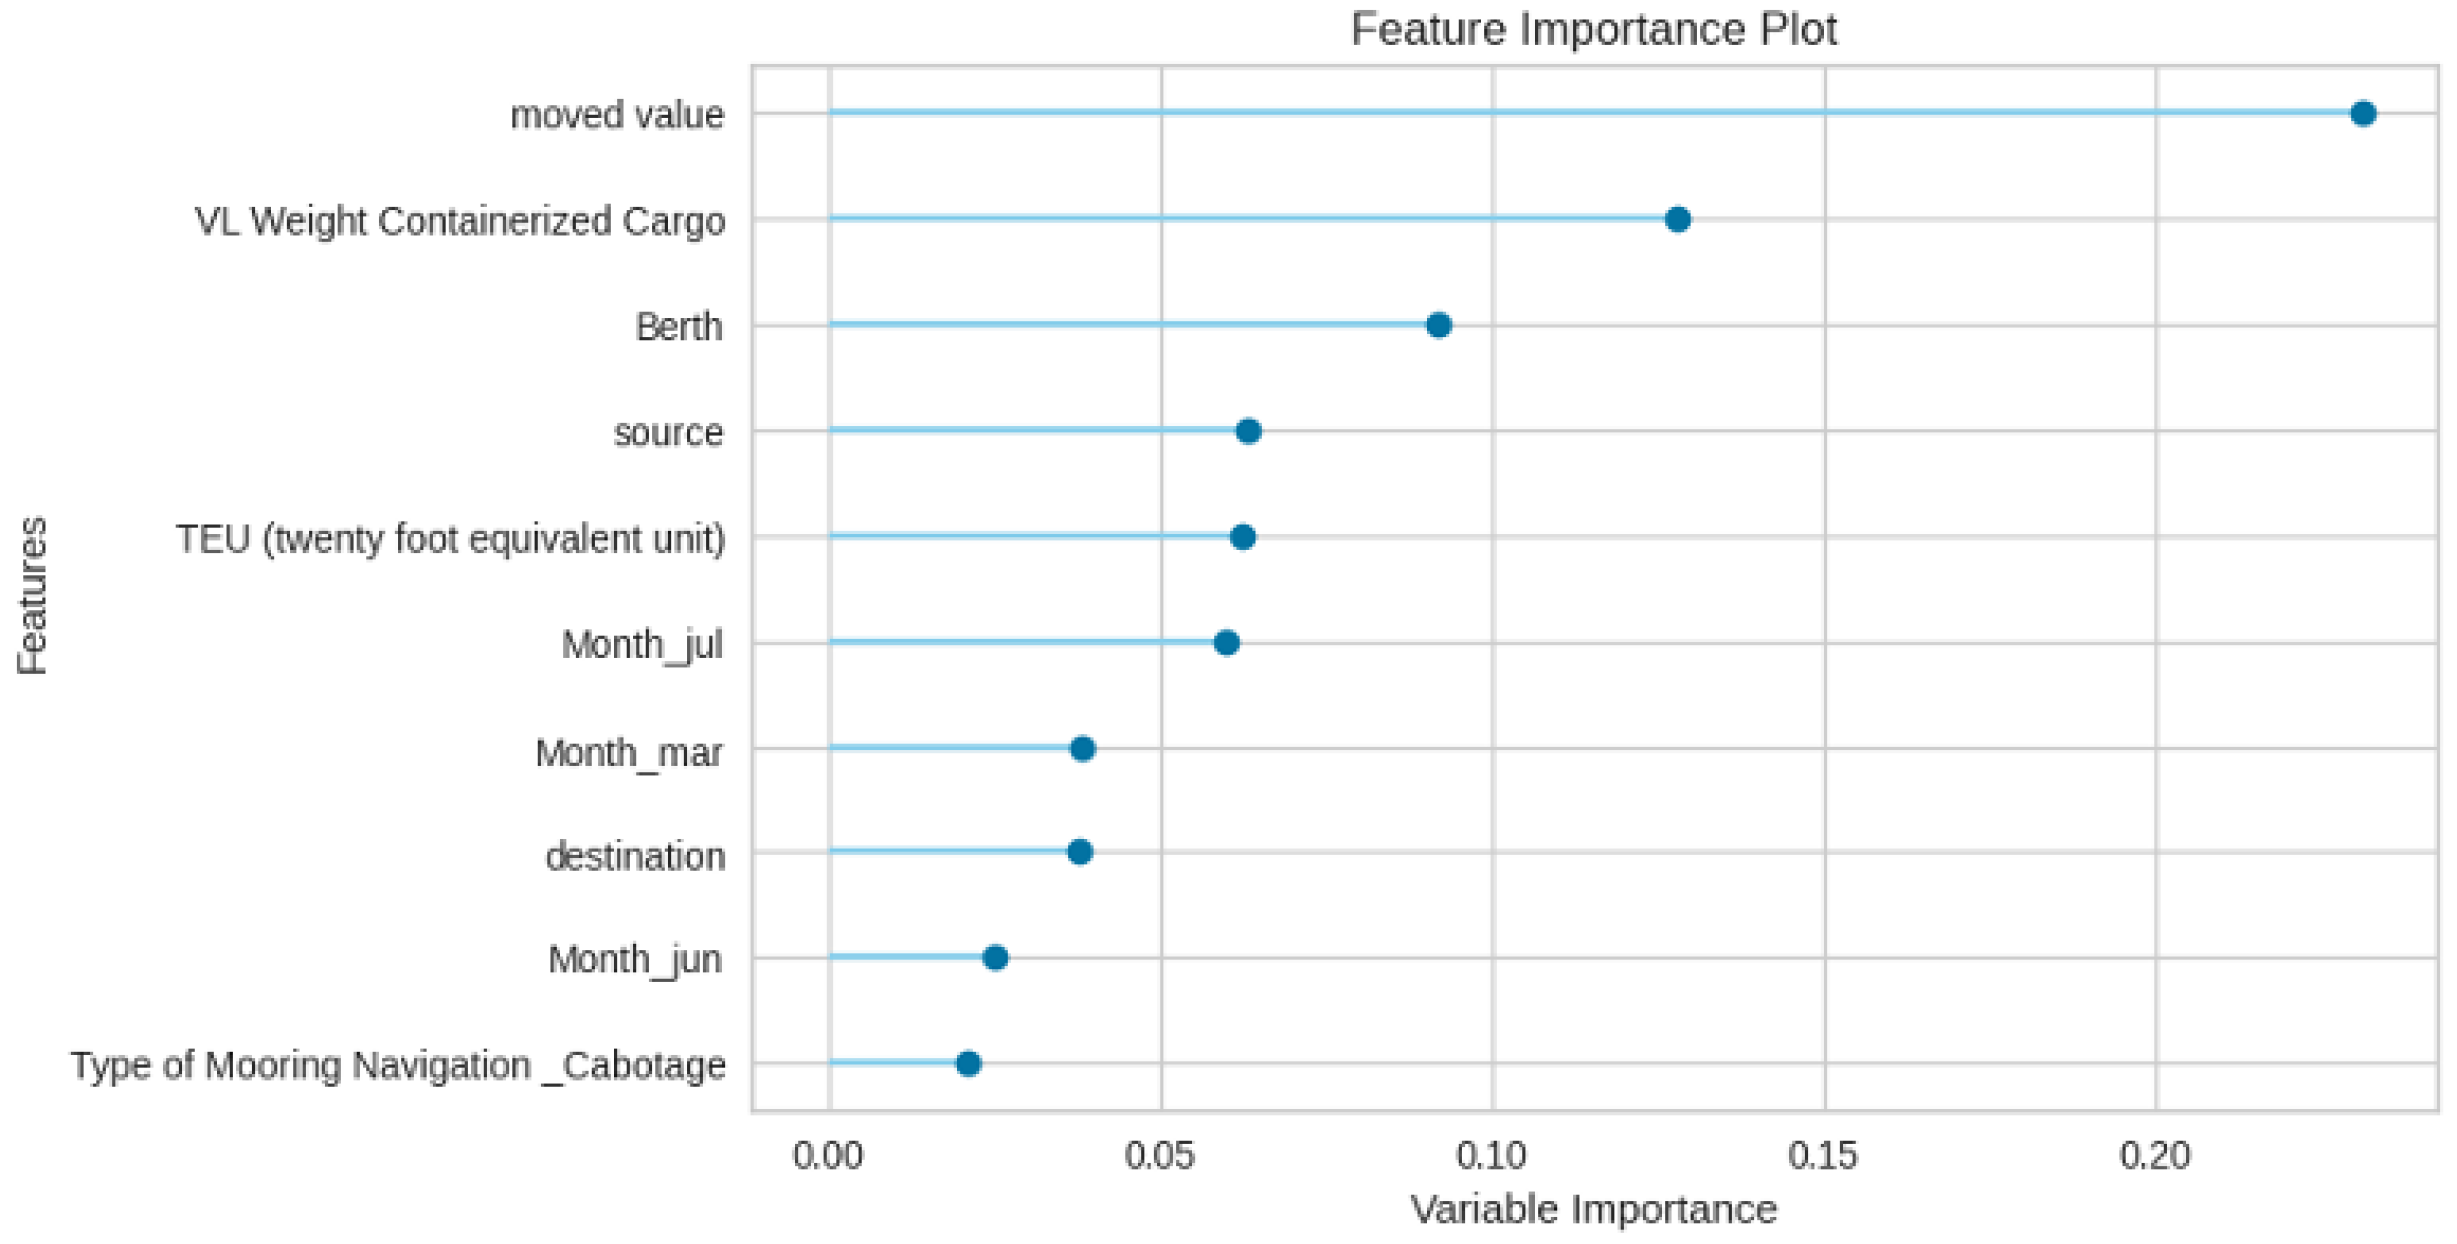
Figure 8 shows the feature importance for the Delay Time prediction, and it is observed that the Moved Value, VL Weight Containerized Cargo, and Berth are key features, followed by other features like Source, Destination, Month, etc. It is intuitive that vessels with higher Moved Values and VL Containerized Load Weight go through longer operations, leading to a build up in Delay Time. However, some Berths are not run efficiently, which contribute to the delays.
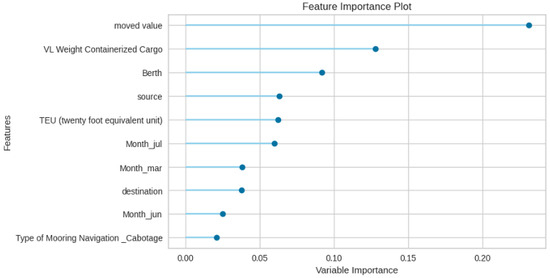
Figure 8.
Random Forest feature importance for Delay Time prediction.
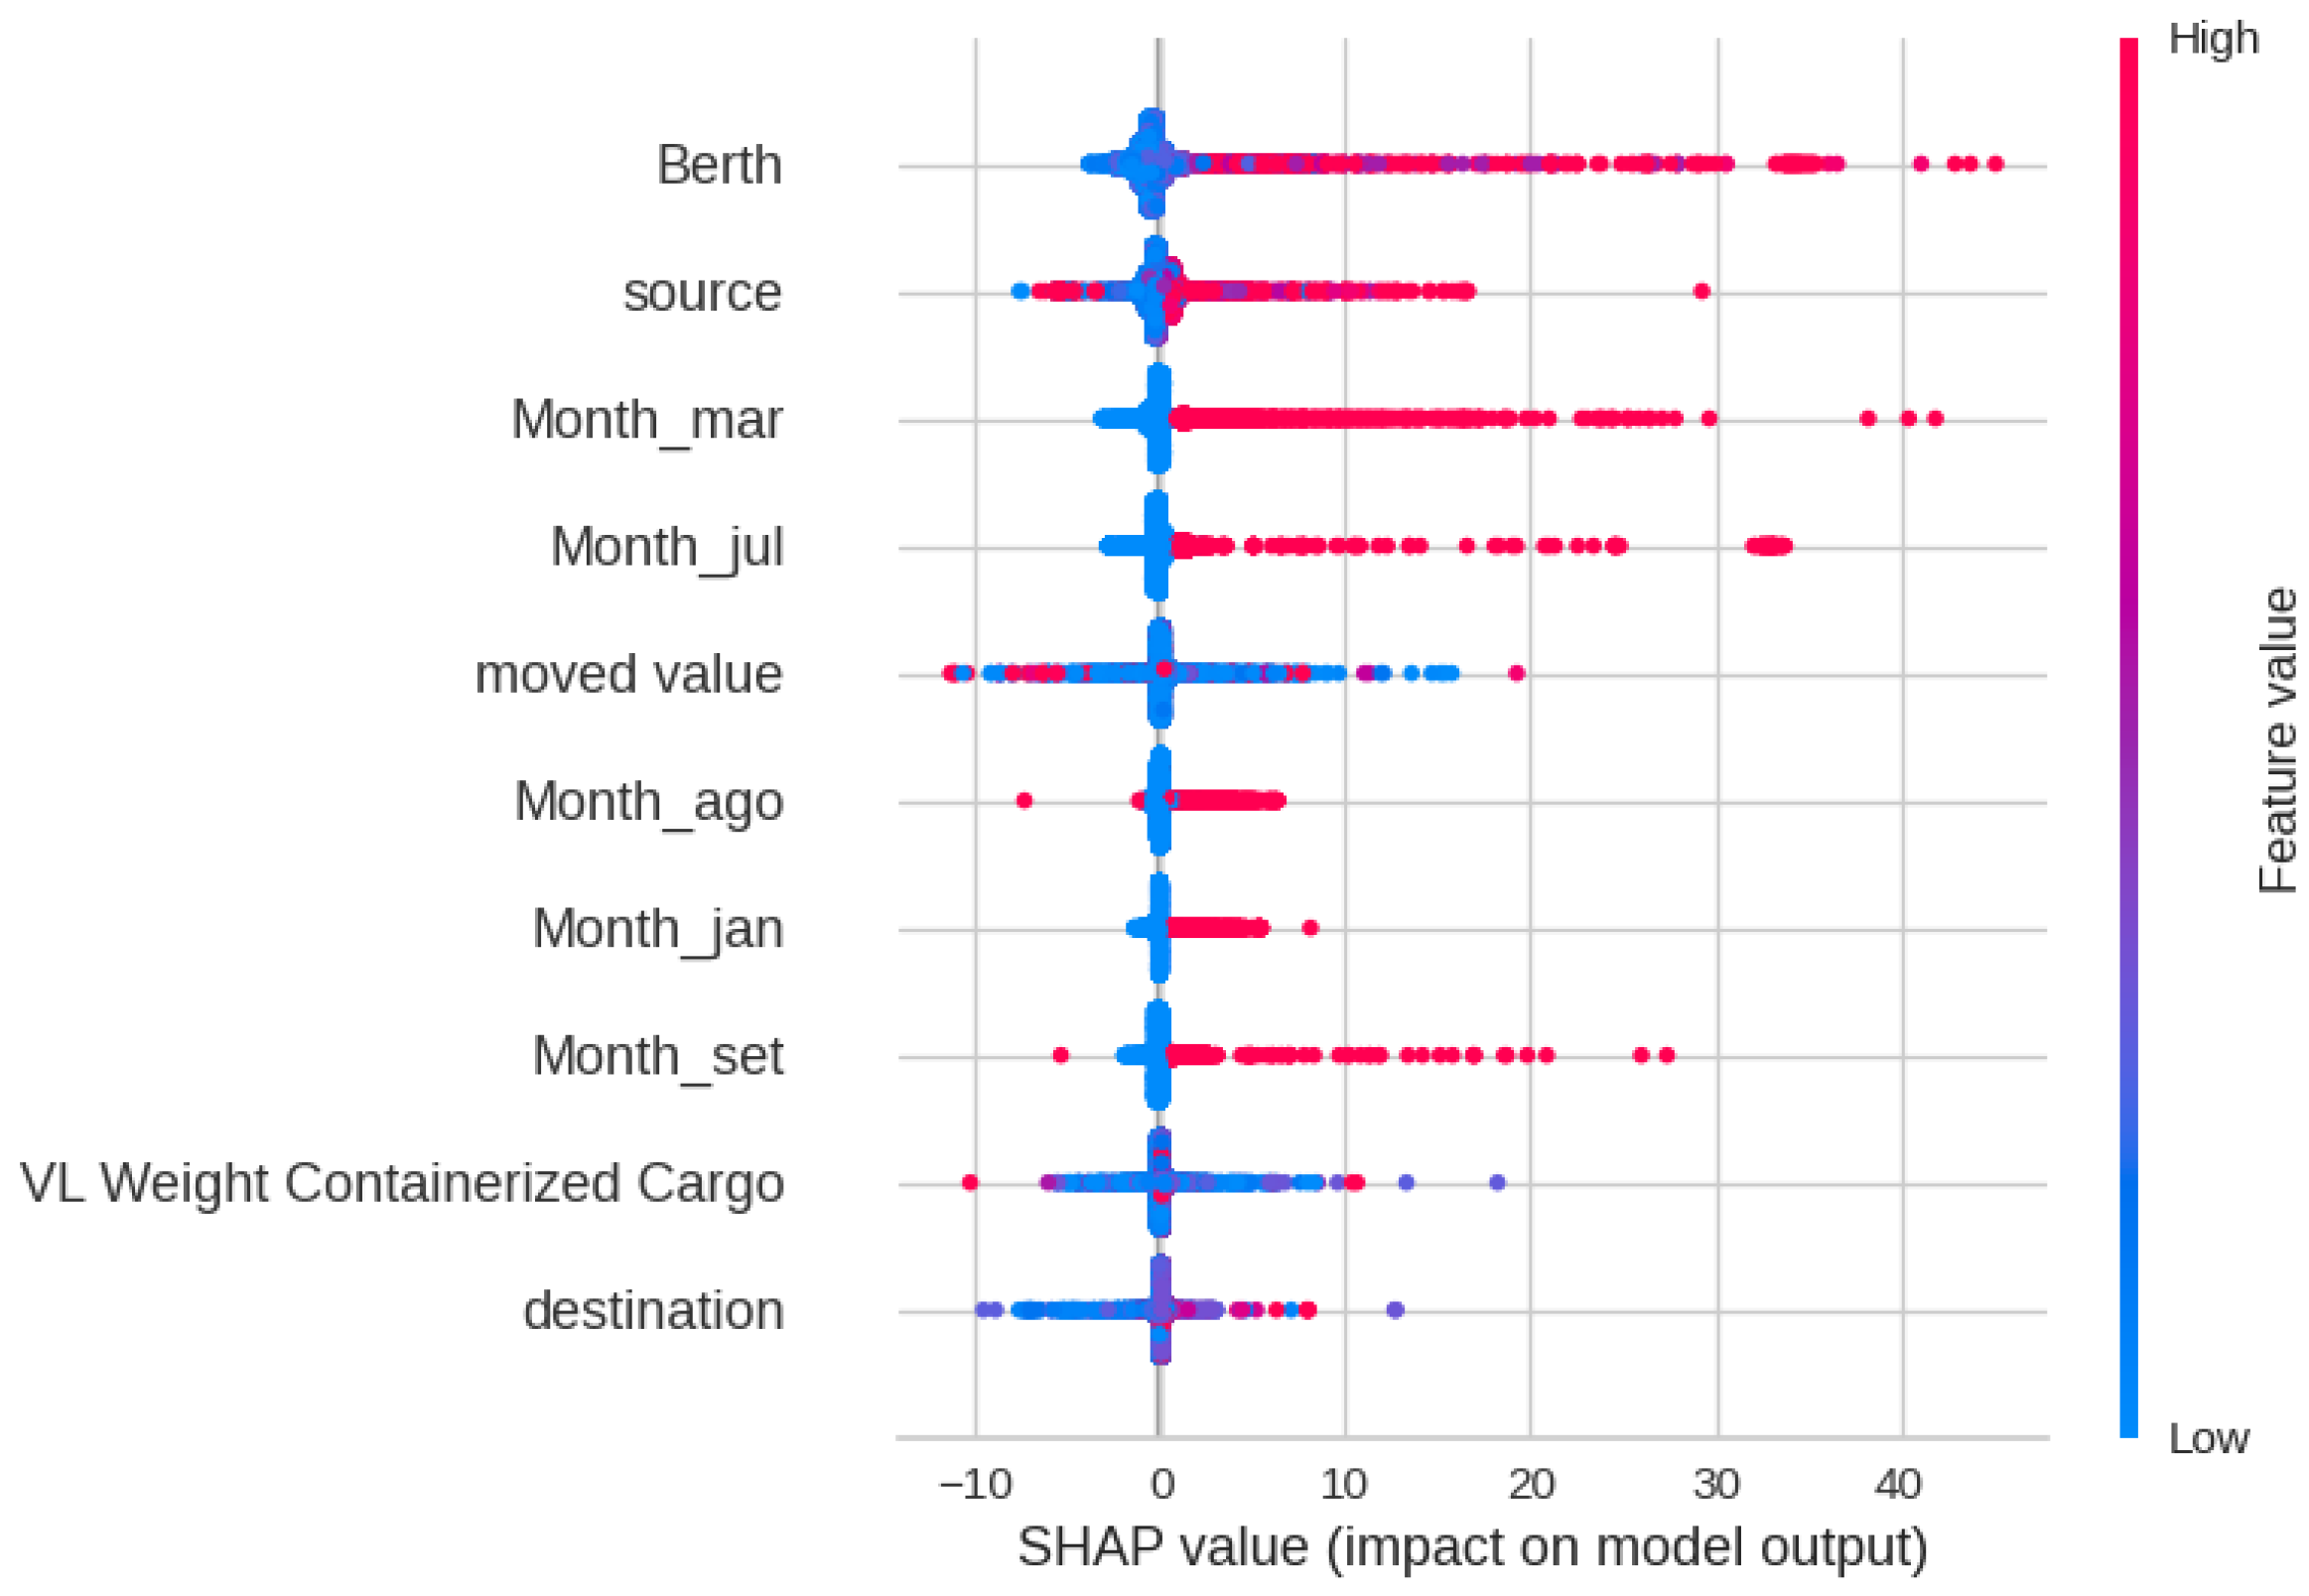
The SHAP analysis in Figure 9 shows that the Berth, Source, Month, and Moved Value have the greatest impact on the outcomes of the Random Forest model. This clearly indicates that some Berths, Sources, and Months lead to higher Delay Times. Figure 10 and Figure 11 show the Decision and Force plot for a particular sample with a true Delay Time of 16 h. The predicted value is 15.17, which is very close to the truth. It can be seen that features like Month, Source, and Berth have the most impact towards obtaining the correct output for this sample. For this sample, there is no potential for the outcome to be changed as the top features are fixed unless there is flexibility to change the Month, Source, or Berth.
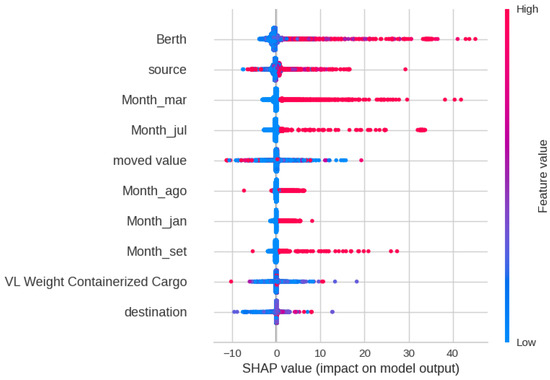
Figure 9.
SHAP feature analysis plot for Delay Time prediction.
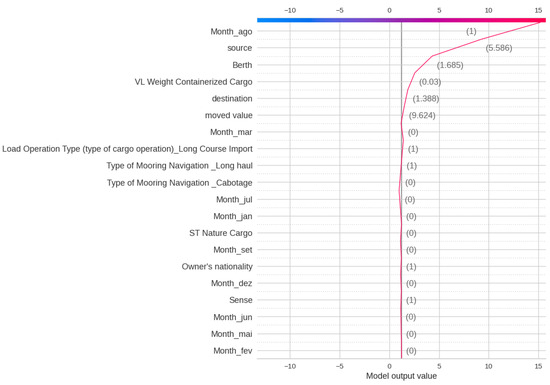
Figure 10.
SHAP decision plot for Delay Time prediction of a sample observation.

Figure 11.
SHAP force plot for Delay Time prediction of a sample observation.
In the classification task, the performance of various Machine Learning methods for (Multi-Class) classification of Total Time is depicted in Table 3. A consistent trend is observed where tree-based methods outperform statistical approaches as well as deep learning methods again, potentially due to the complex and tabular nature of the data along with the high number of categorical features. Specifically, Extreme Gradient Boosting (XGBoost) demonstrates the best performance, achieving the highest Accuracy (0.8424) and superior values across other metrics compared to alternative methods. This is 10% higher than the result in [5]. The test set results further confirm XGBoost’s efficacy with an Accuracy of 0.8415 and other metrics exhibiting similarly favorable performance, derived from the confusion matrix seen in Figure 12. Also, it is easier to detect the outer classes, Class 0 (Low) and Class 3 (Very High), compared to the other two for this case study.
Table 3.
Comparing 10-fold CV results of different methods with multiple metrics (sorted using Accuracy) for Total Time classification at port.
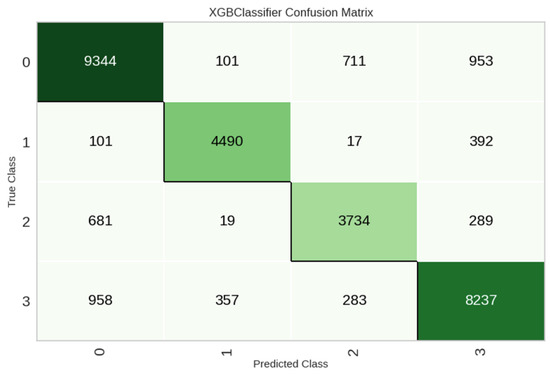
Figure 12.
Confusion matrix on test data for Total Time classification.
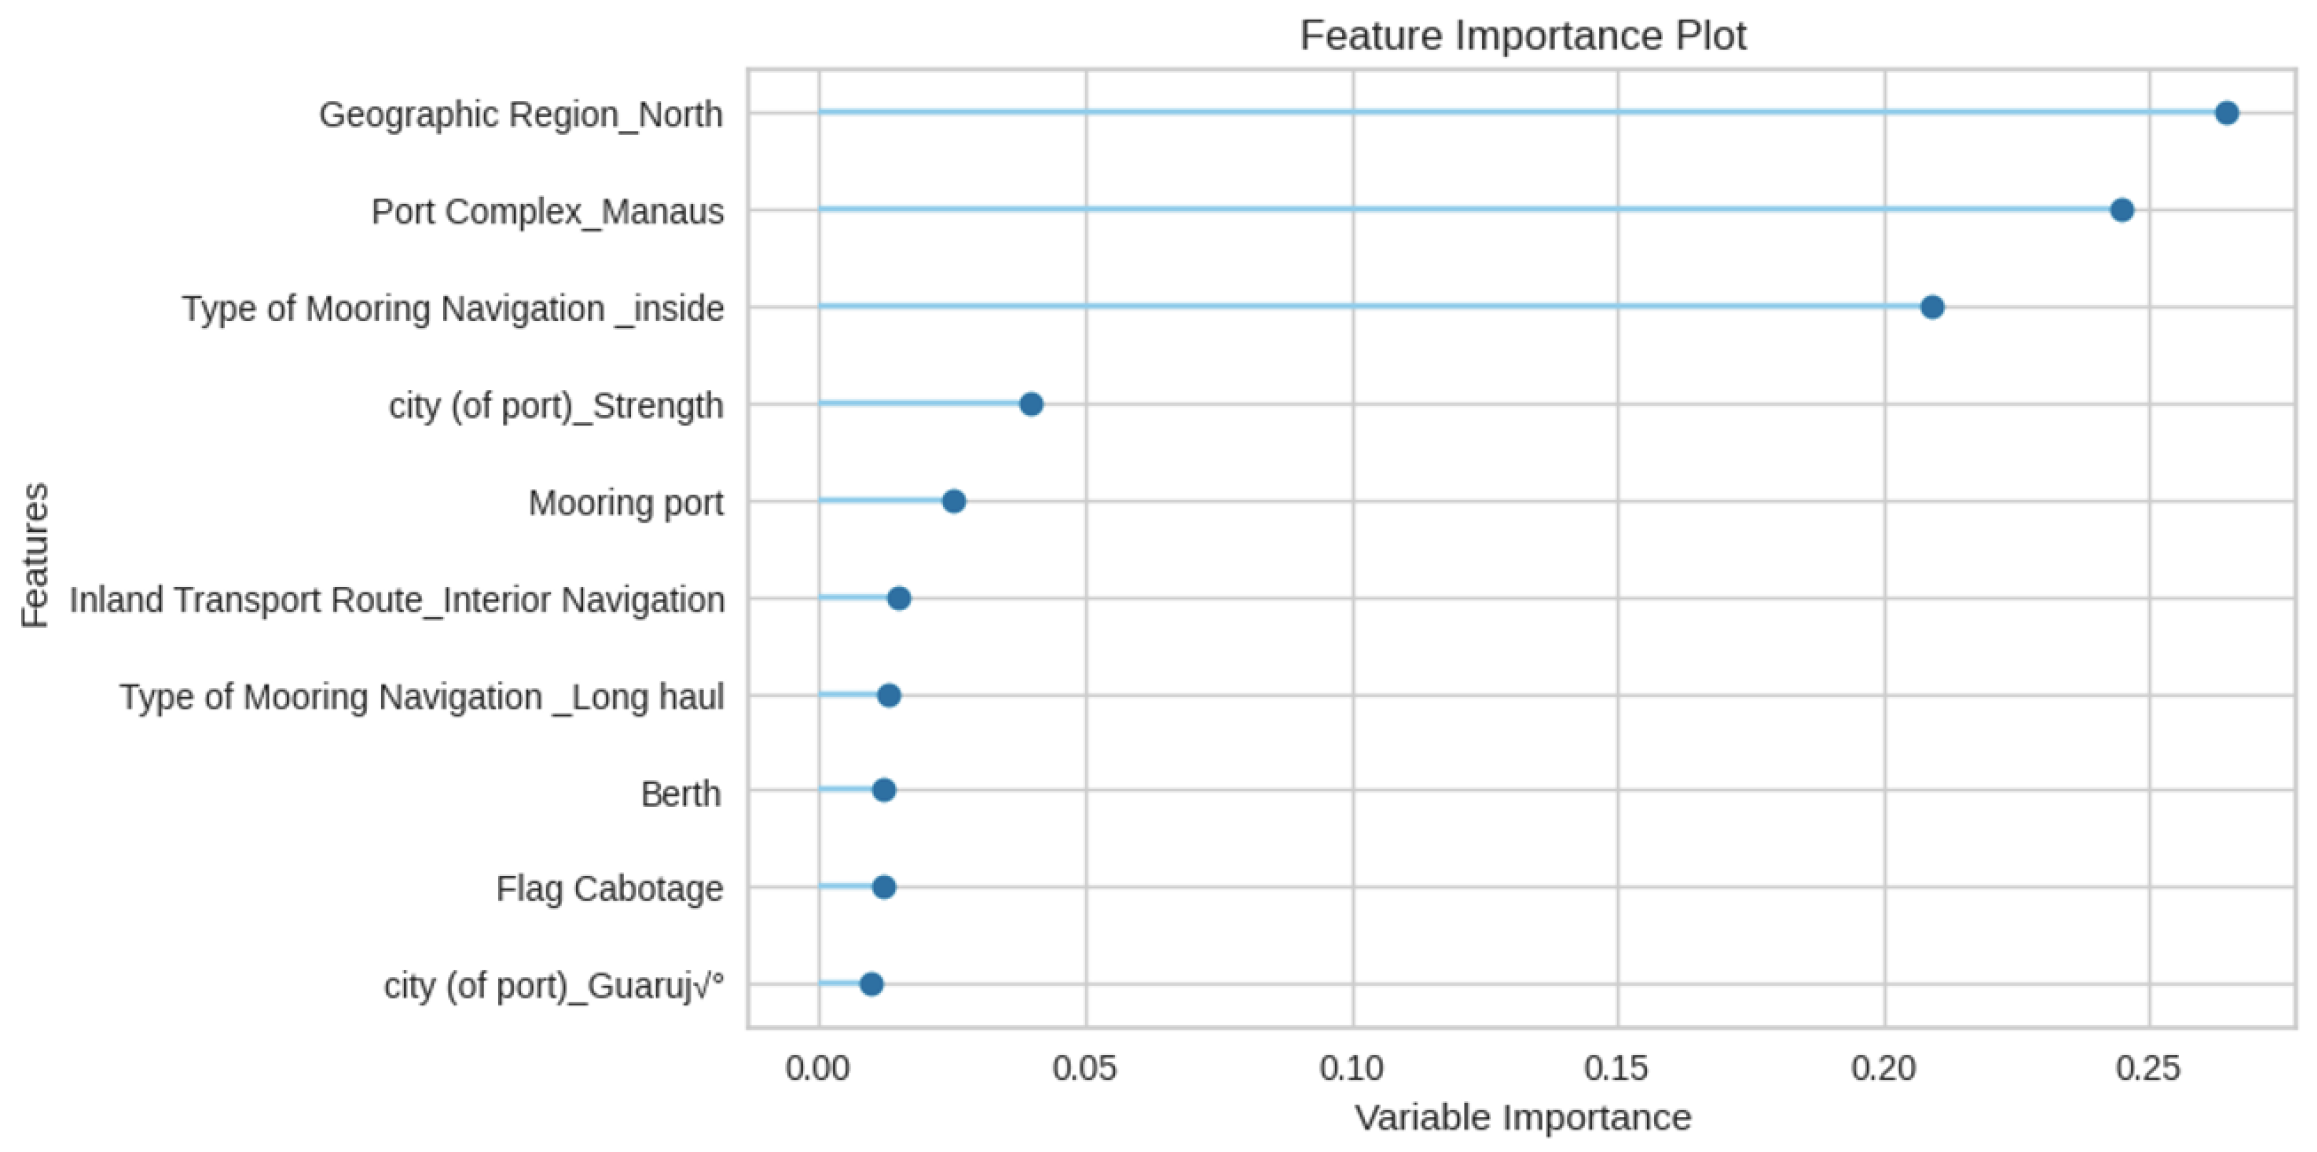
Additionally, Figure 13 showcases the key features influencing Total Time classification. Notably, the Geographical Region (North), Port Complex (Manaus), and Type of Mooring Navigation (inside) emerge as the most influential features, followed by factors such as City, Mooring port, Inland Transportation route, Type of Mooring Navigation (Long Haul), Berth, etc. The significance of the geographical features is related to the huge coastline of Brazil and the complex dynamics of port operations.
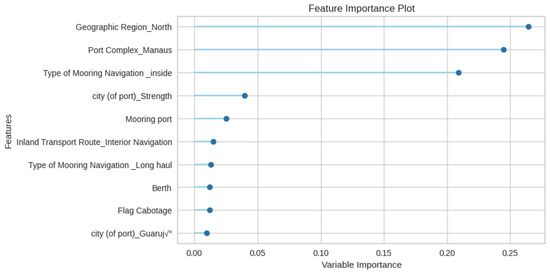
Figure 13.
Random Forest feature importance for Total Time classification.
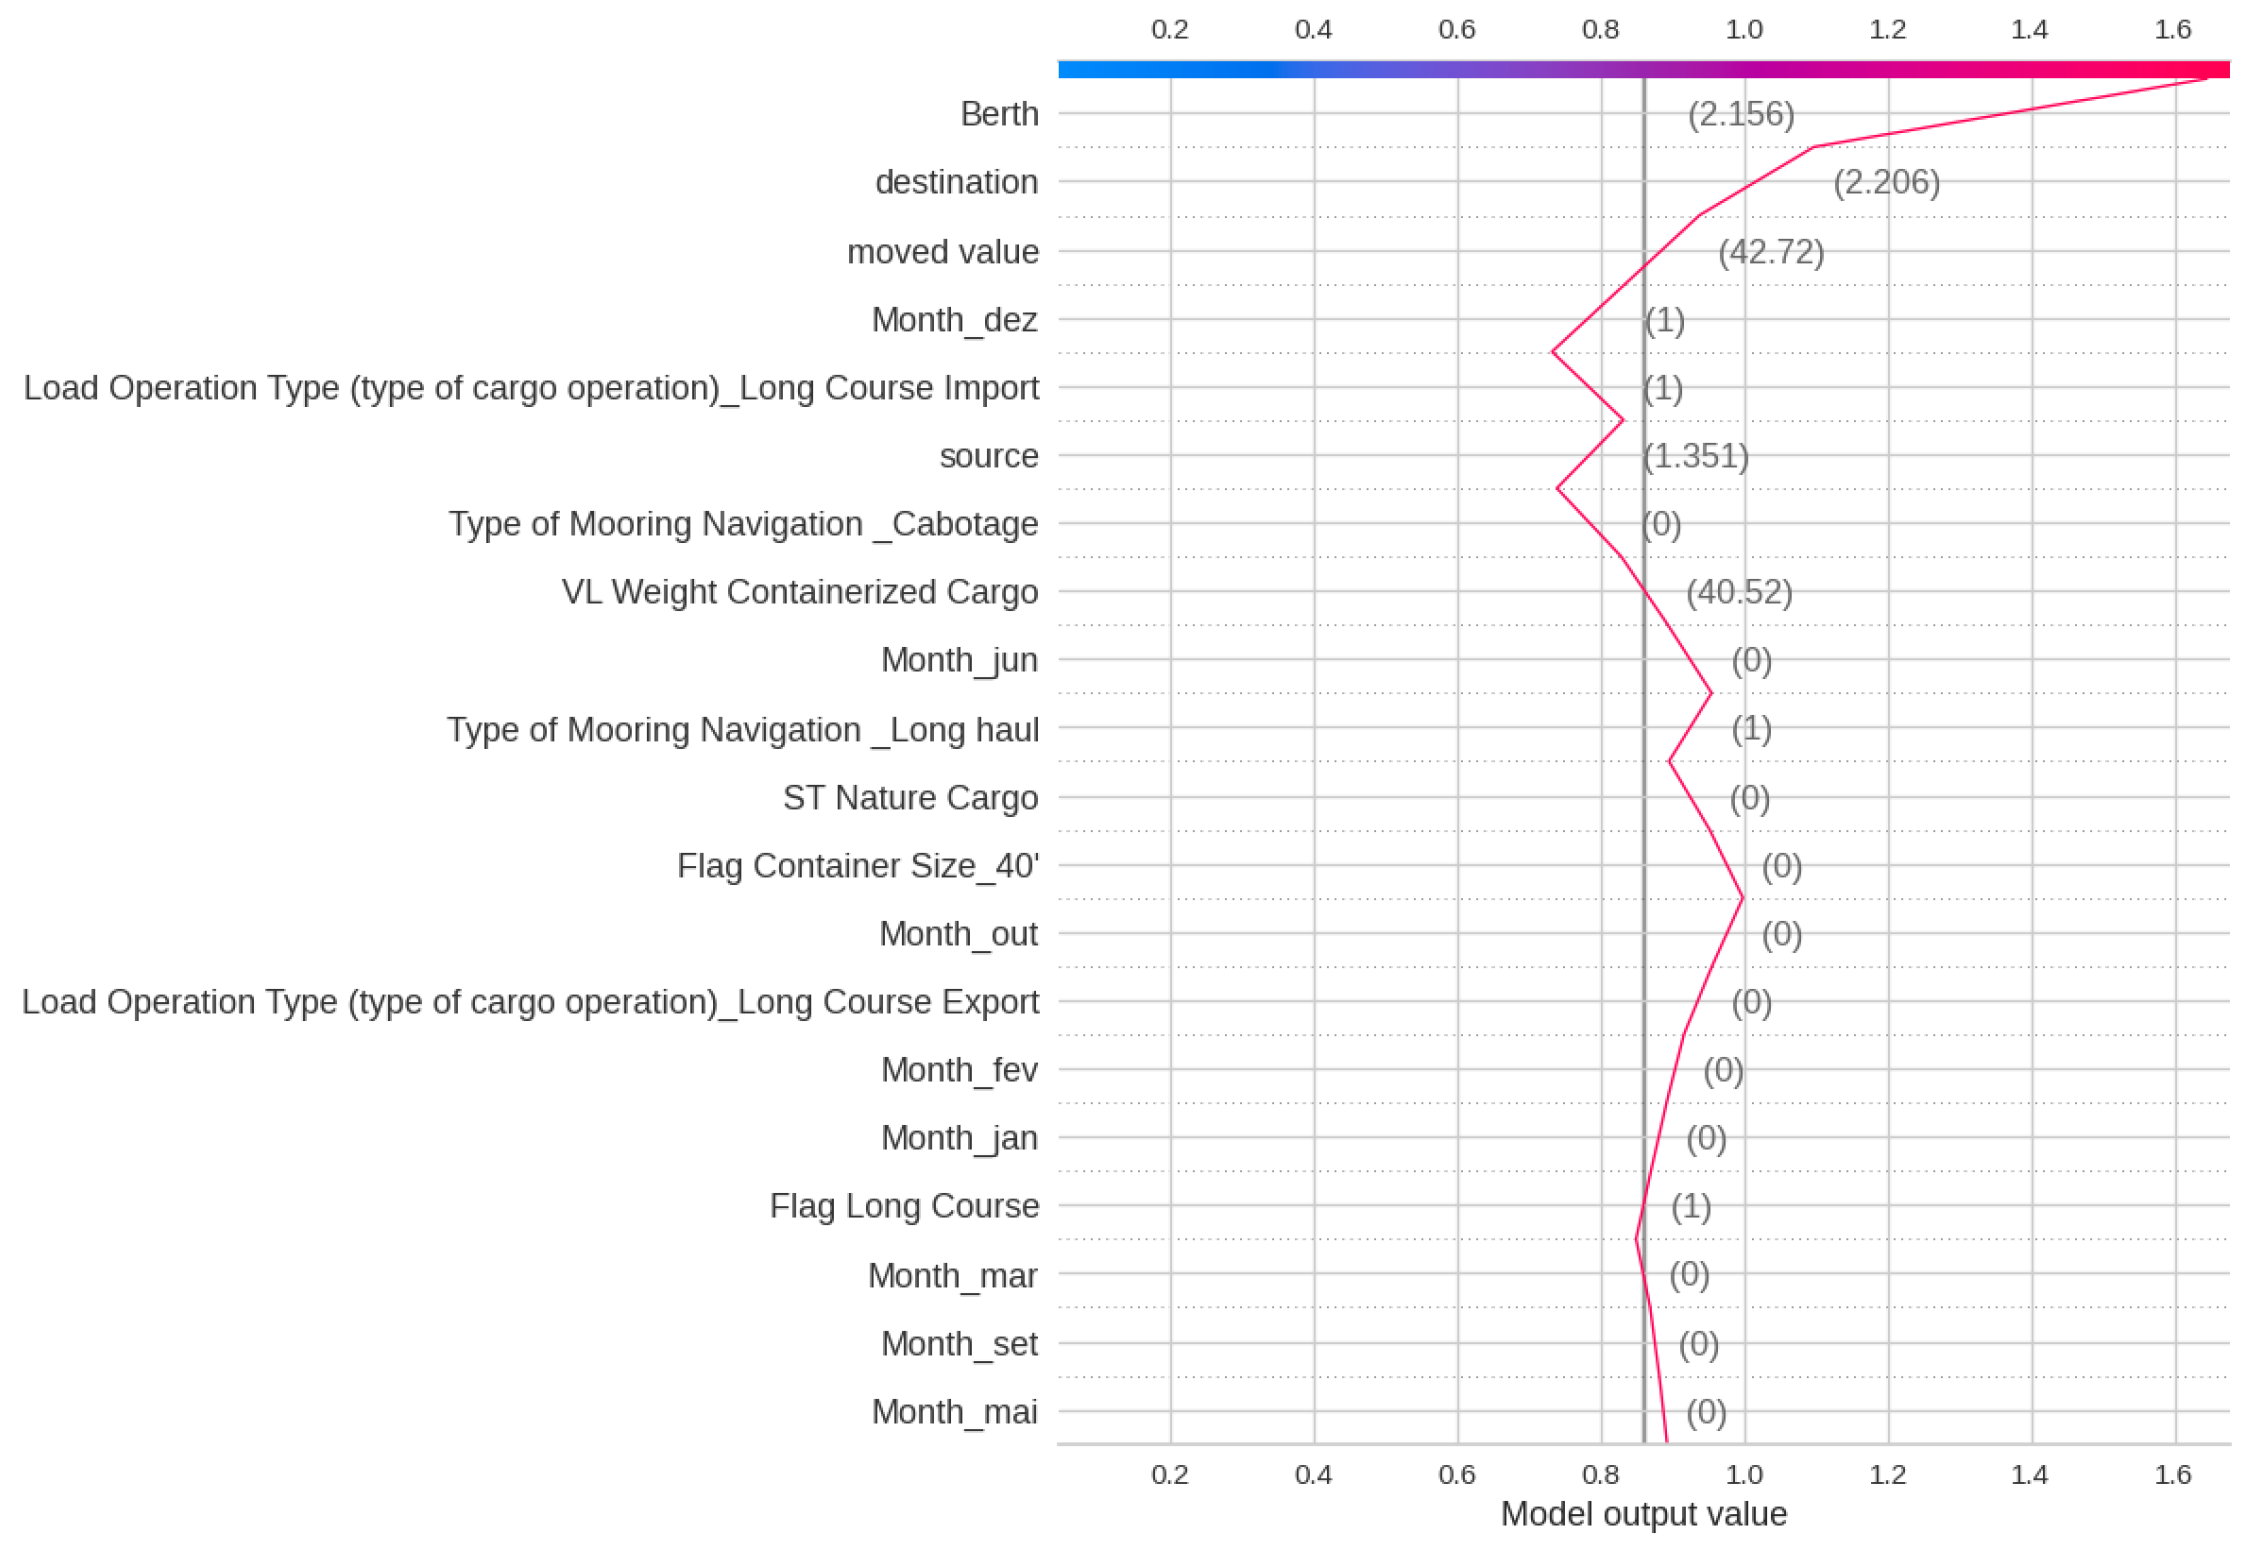
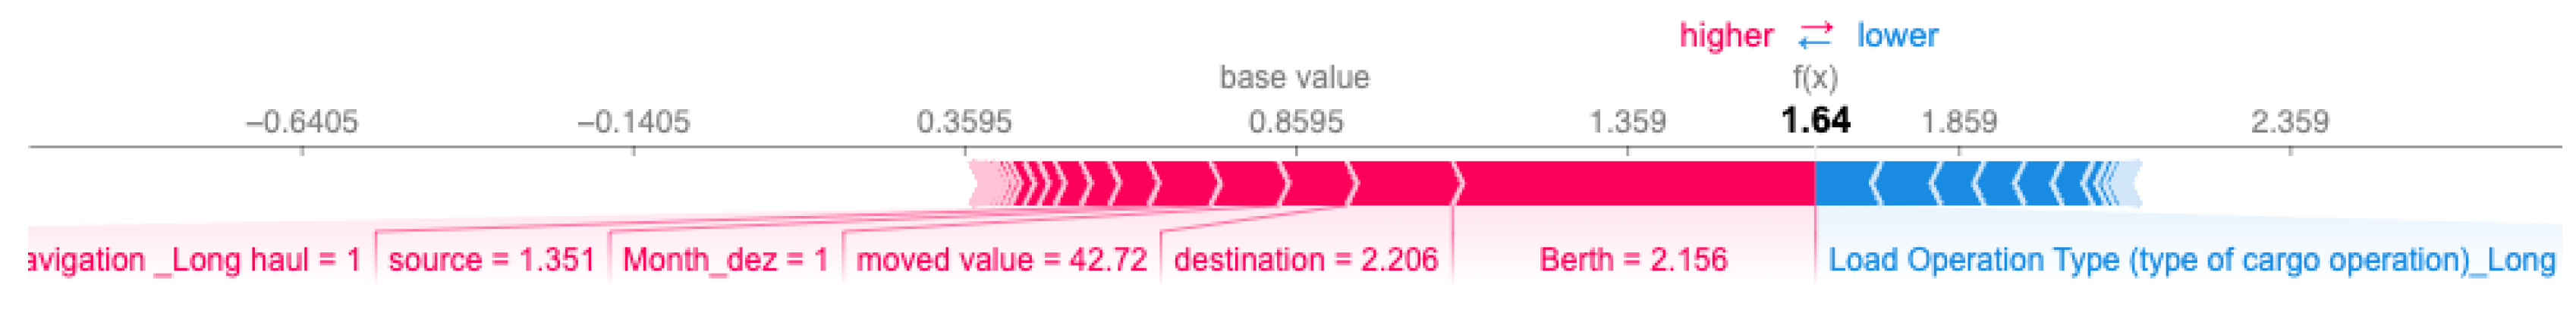
The SHAP analysis illustrated in Figure 14 demonstrates that features such as Berth, Destination, Moved Value, and Month have the most significant impact on the outcomes of the XGBoost model. Each sample will have four Decision and Force plots, one for each class since the sample considered has a class of 1, the shared plots are of Class 1. Figure 15 and Figure 16 present the Decision and Force plots for Class 1 for a particular sample with a true Total Time class as 1 (Medium). The model output is 1.64, which is the highest among the four classes and hence this sample is correctly classified as class 1. These plots reveal that features like Berth, Destination, and Moved Value play a crucial role in producing the accurate classification for this specific sample. Reducing the Moved Value for this sample should push it towards Class 0 (Low), which intuitively makes sense but may not be feasible.
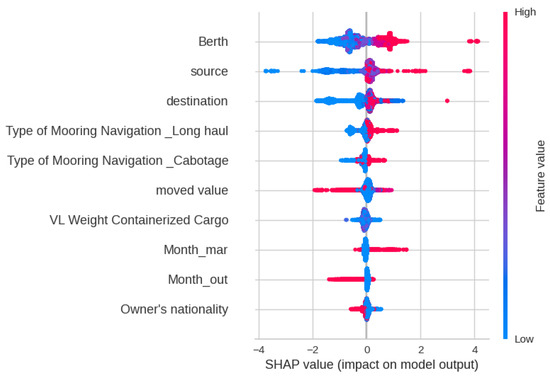
Figure 14.
SHAP feature analysis plot for Total Time classification.

Figure 15.
SHAP decision plot for Total Time classification of a sample observation.
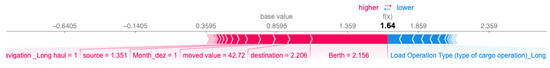
Figure 16.
SHAP force plot of a sample observation for Class 1.
Table 4 presents the binary classification task performance for Delay Time. The tree-based methods again outperform other approaches in most of the metrics. XGBoost gives the best performance by achieving the highest Accuracy (0.9511) and best values across the different metrics compared to other methods. It achieves an accuracy of 0.9505 on the test set and other metrics showing close performance, as illustrated by the confusion matrix in Figure 17. The higher performance for Delay Time compared to Total Time is because the task is simpler, as here, the classification is binary compared to four classes for Total Time.
Table 4.
Comparing 10-fold CV results of different methods with multiple metrics (sorted using Accuracy) for Delay Time classification at port.
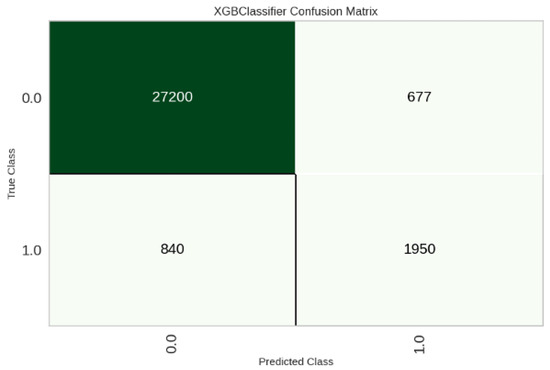
Figure 17.
Confusion matrix on test data for Delay Time classification.
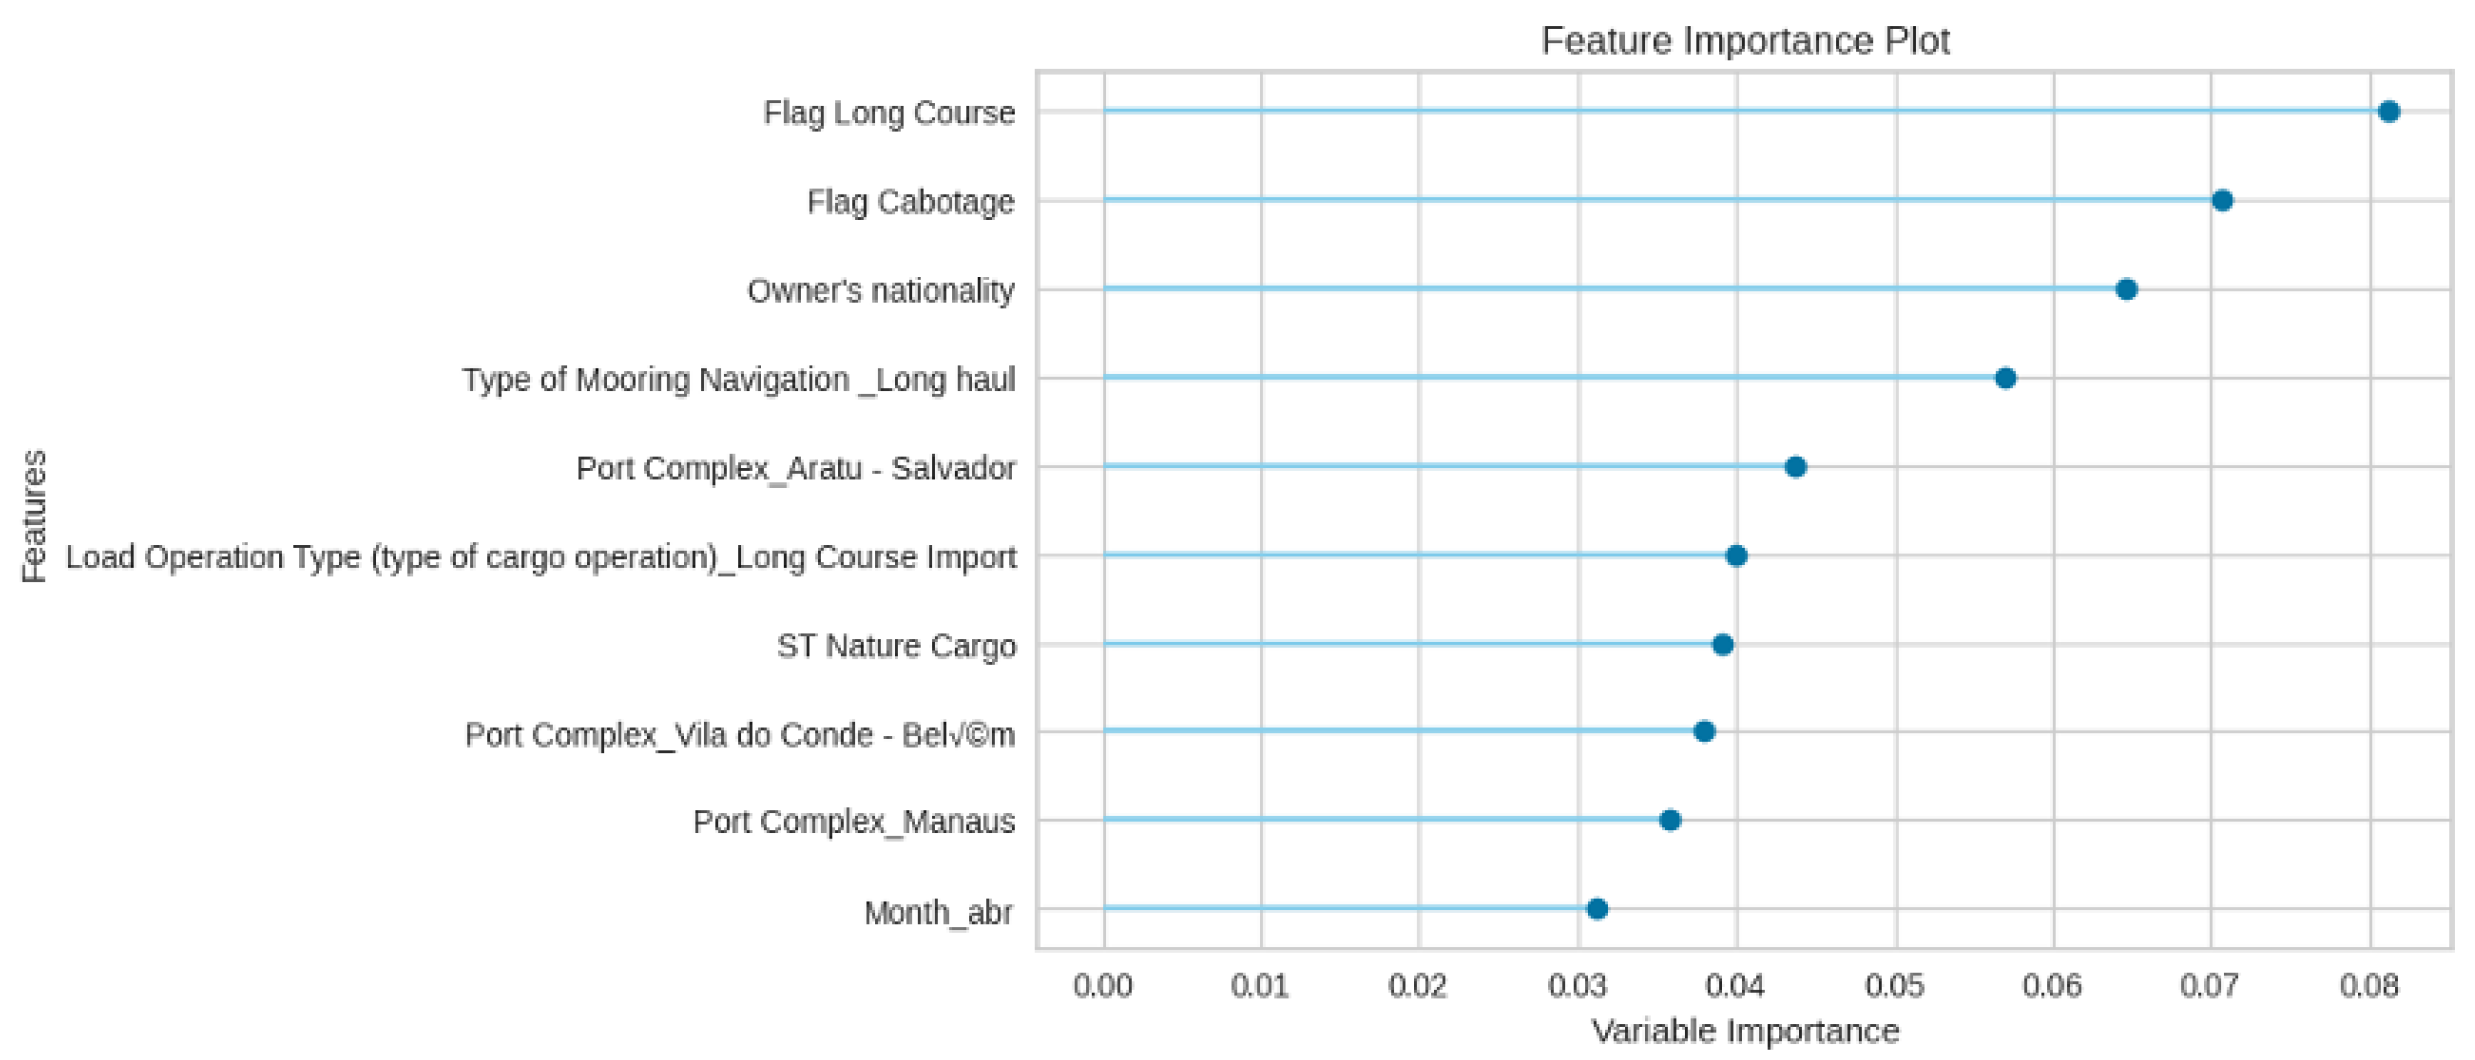
Furthermore, Figure 18 highlights the key features influencing Delay Time classification, factors such as Flag Long Course, Flag Cabotage, Owner’s Nationality, and Type of Mooring Navigation (Long Haul) emerge as the most influential. This is followed by variables like Port Complex, Load Operation Type, ST Cargo Nature, and Month. Features related to operation characteristics have the most impact on the Delay Class.
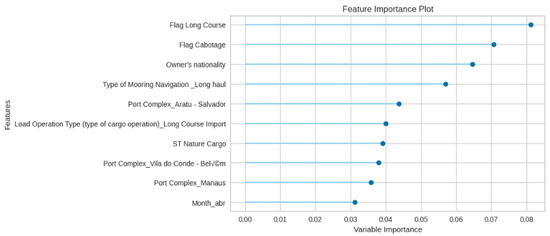
Figure 18.
Random Forest feature importance for Delay Time classification.
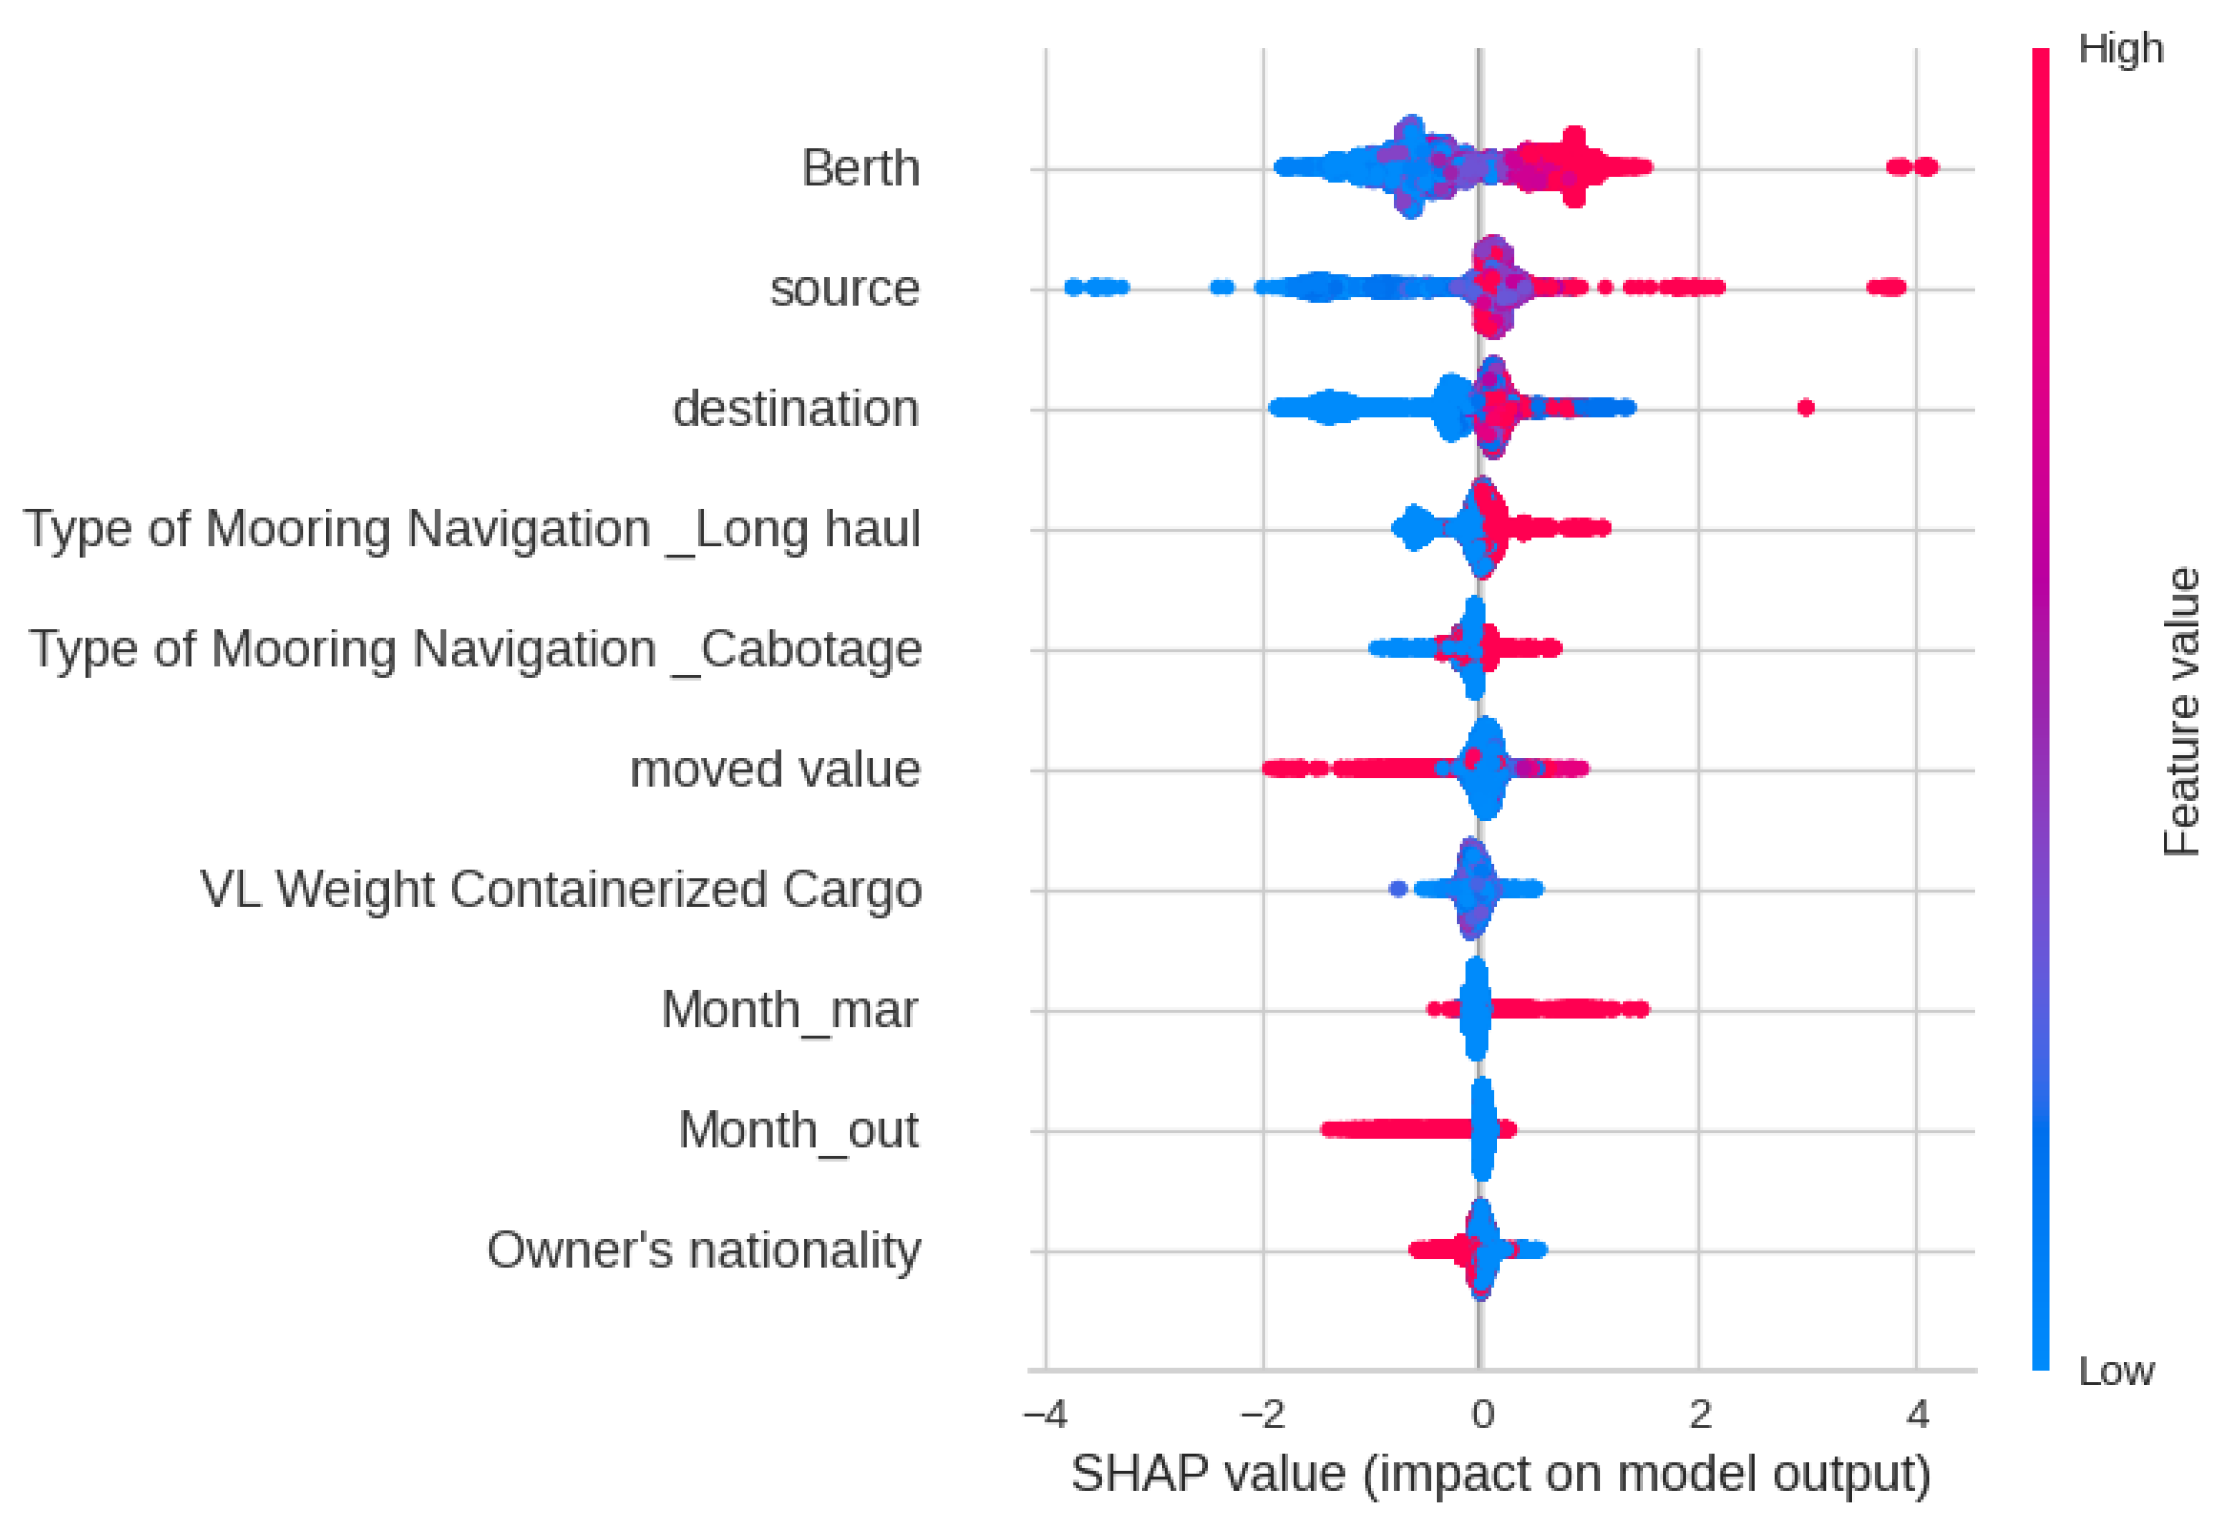
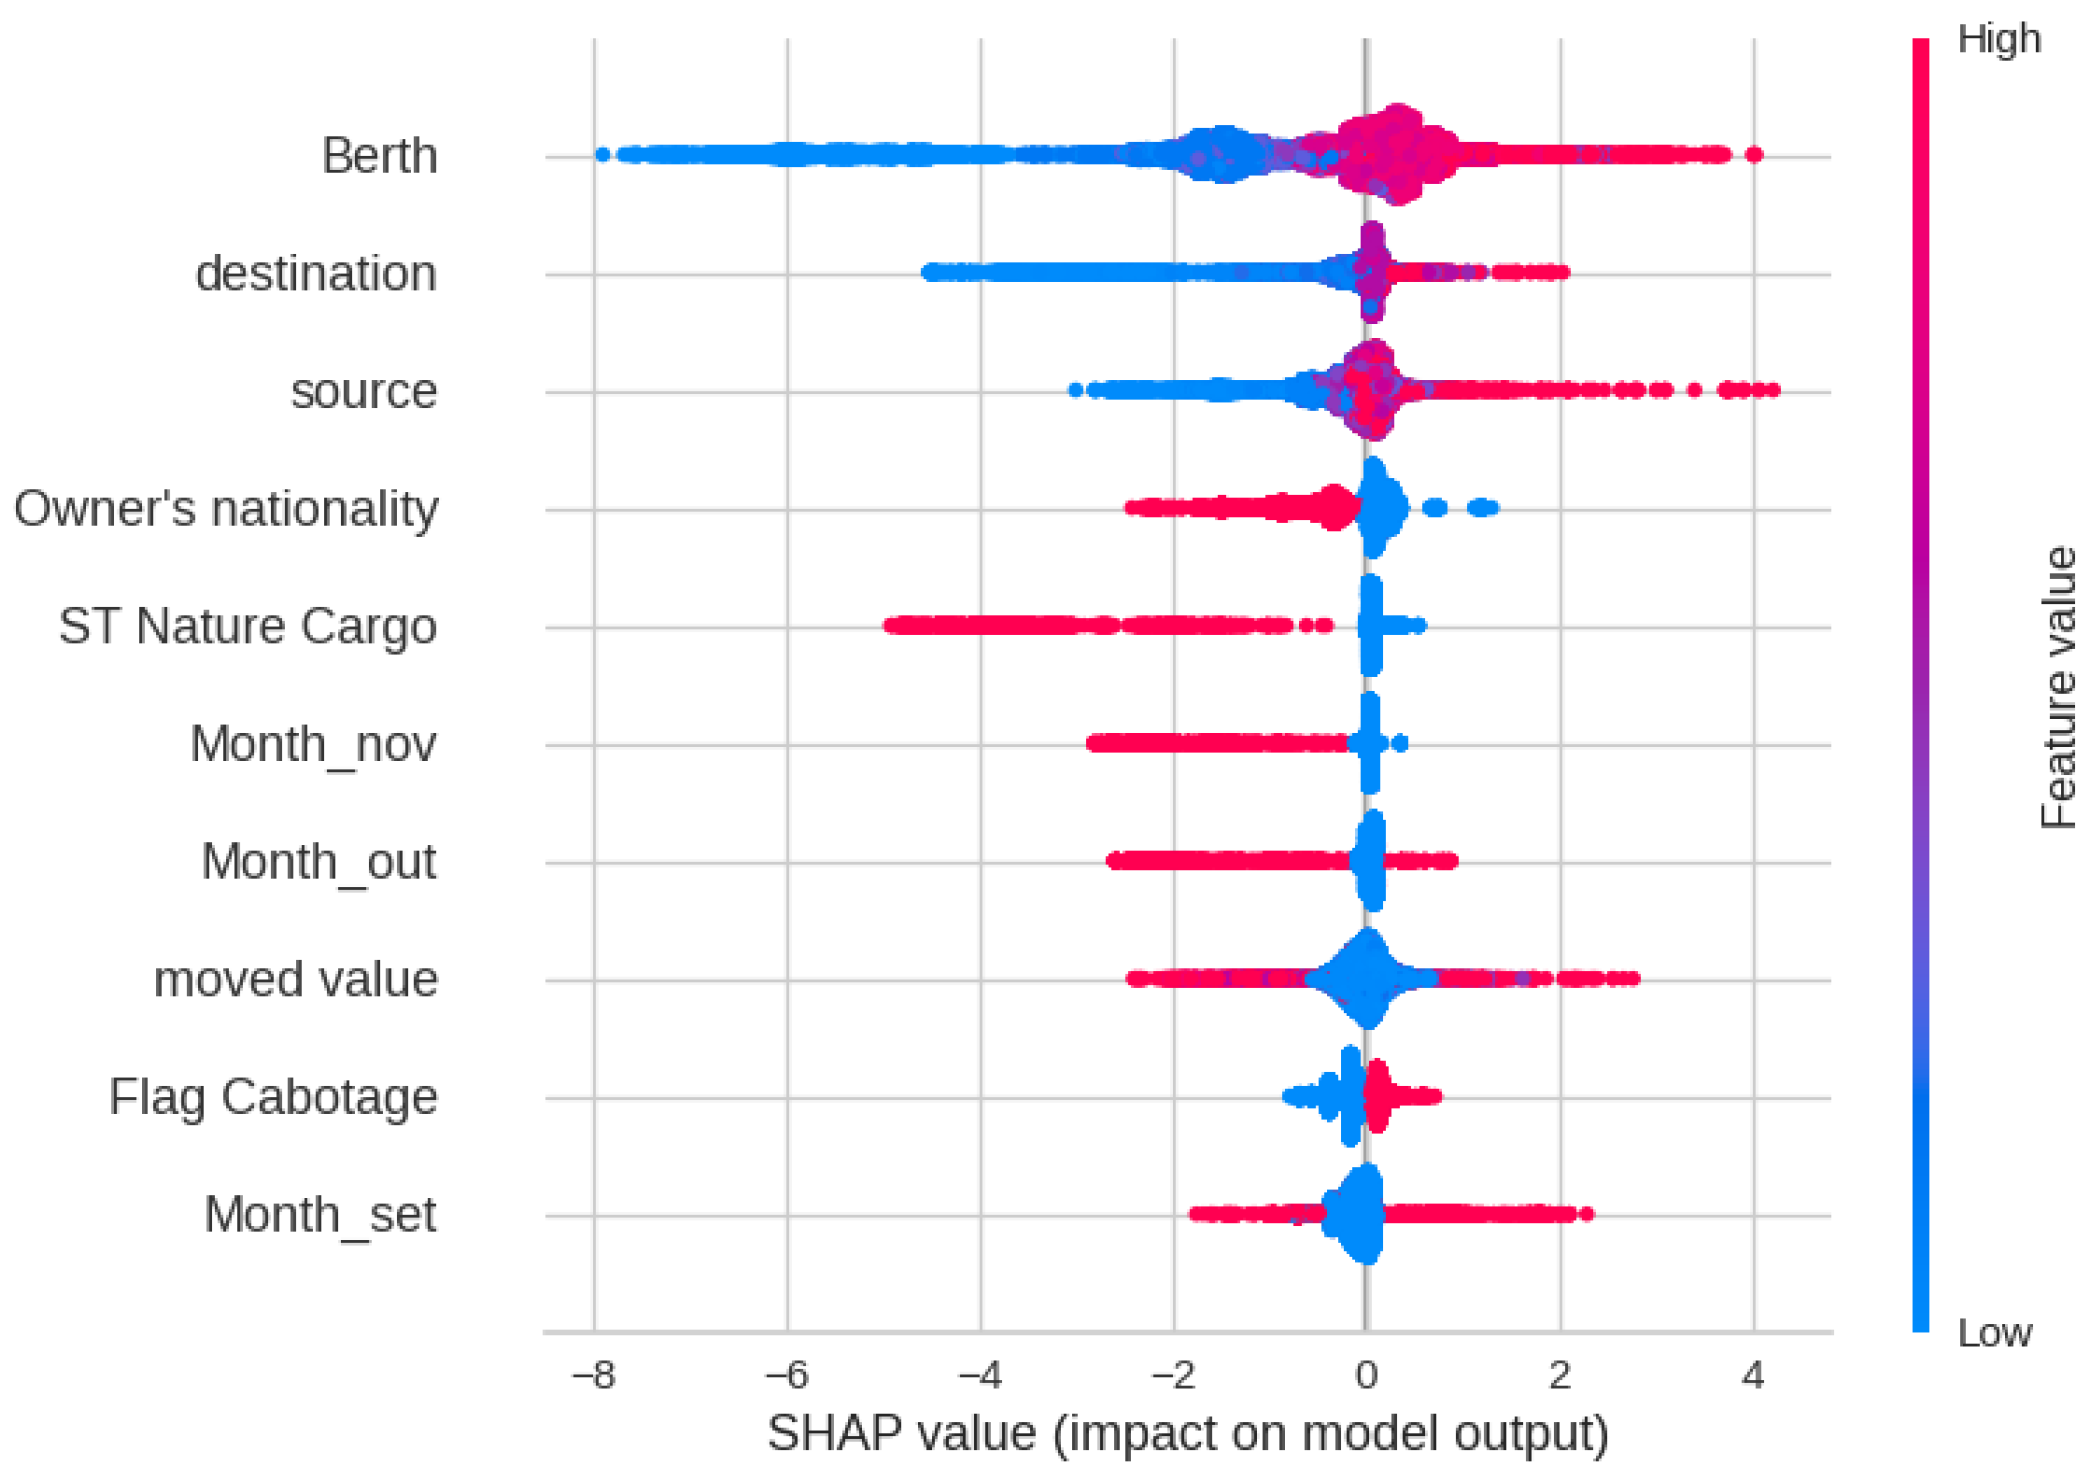
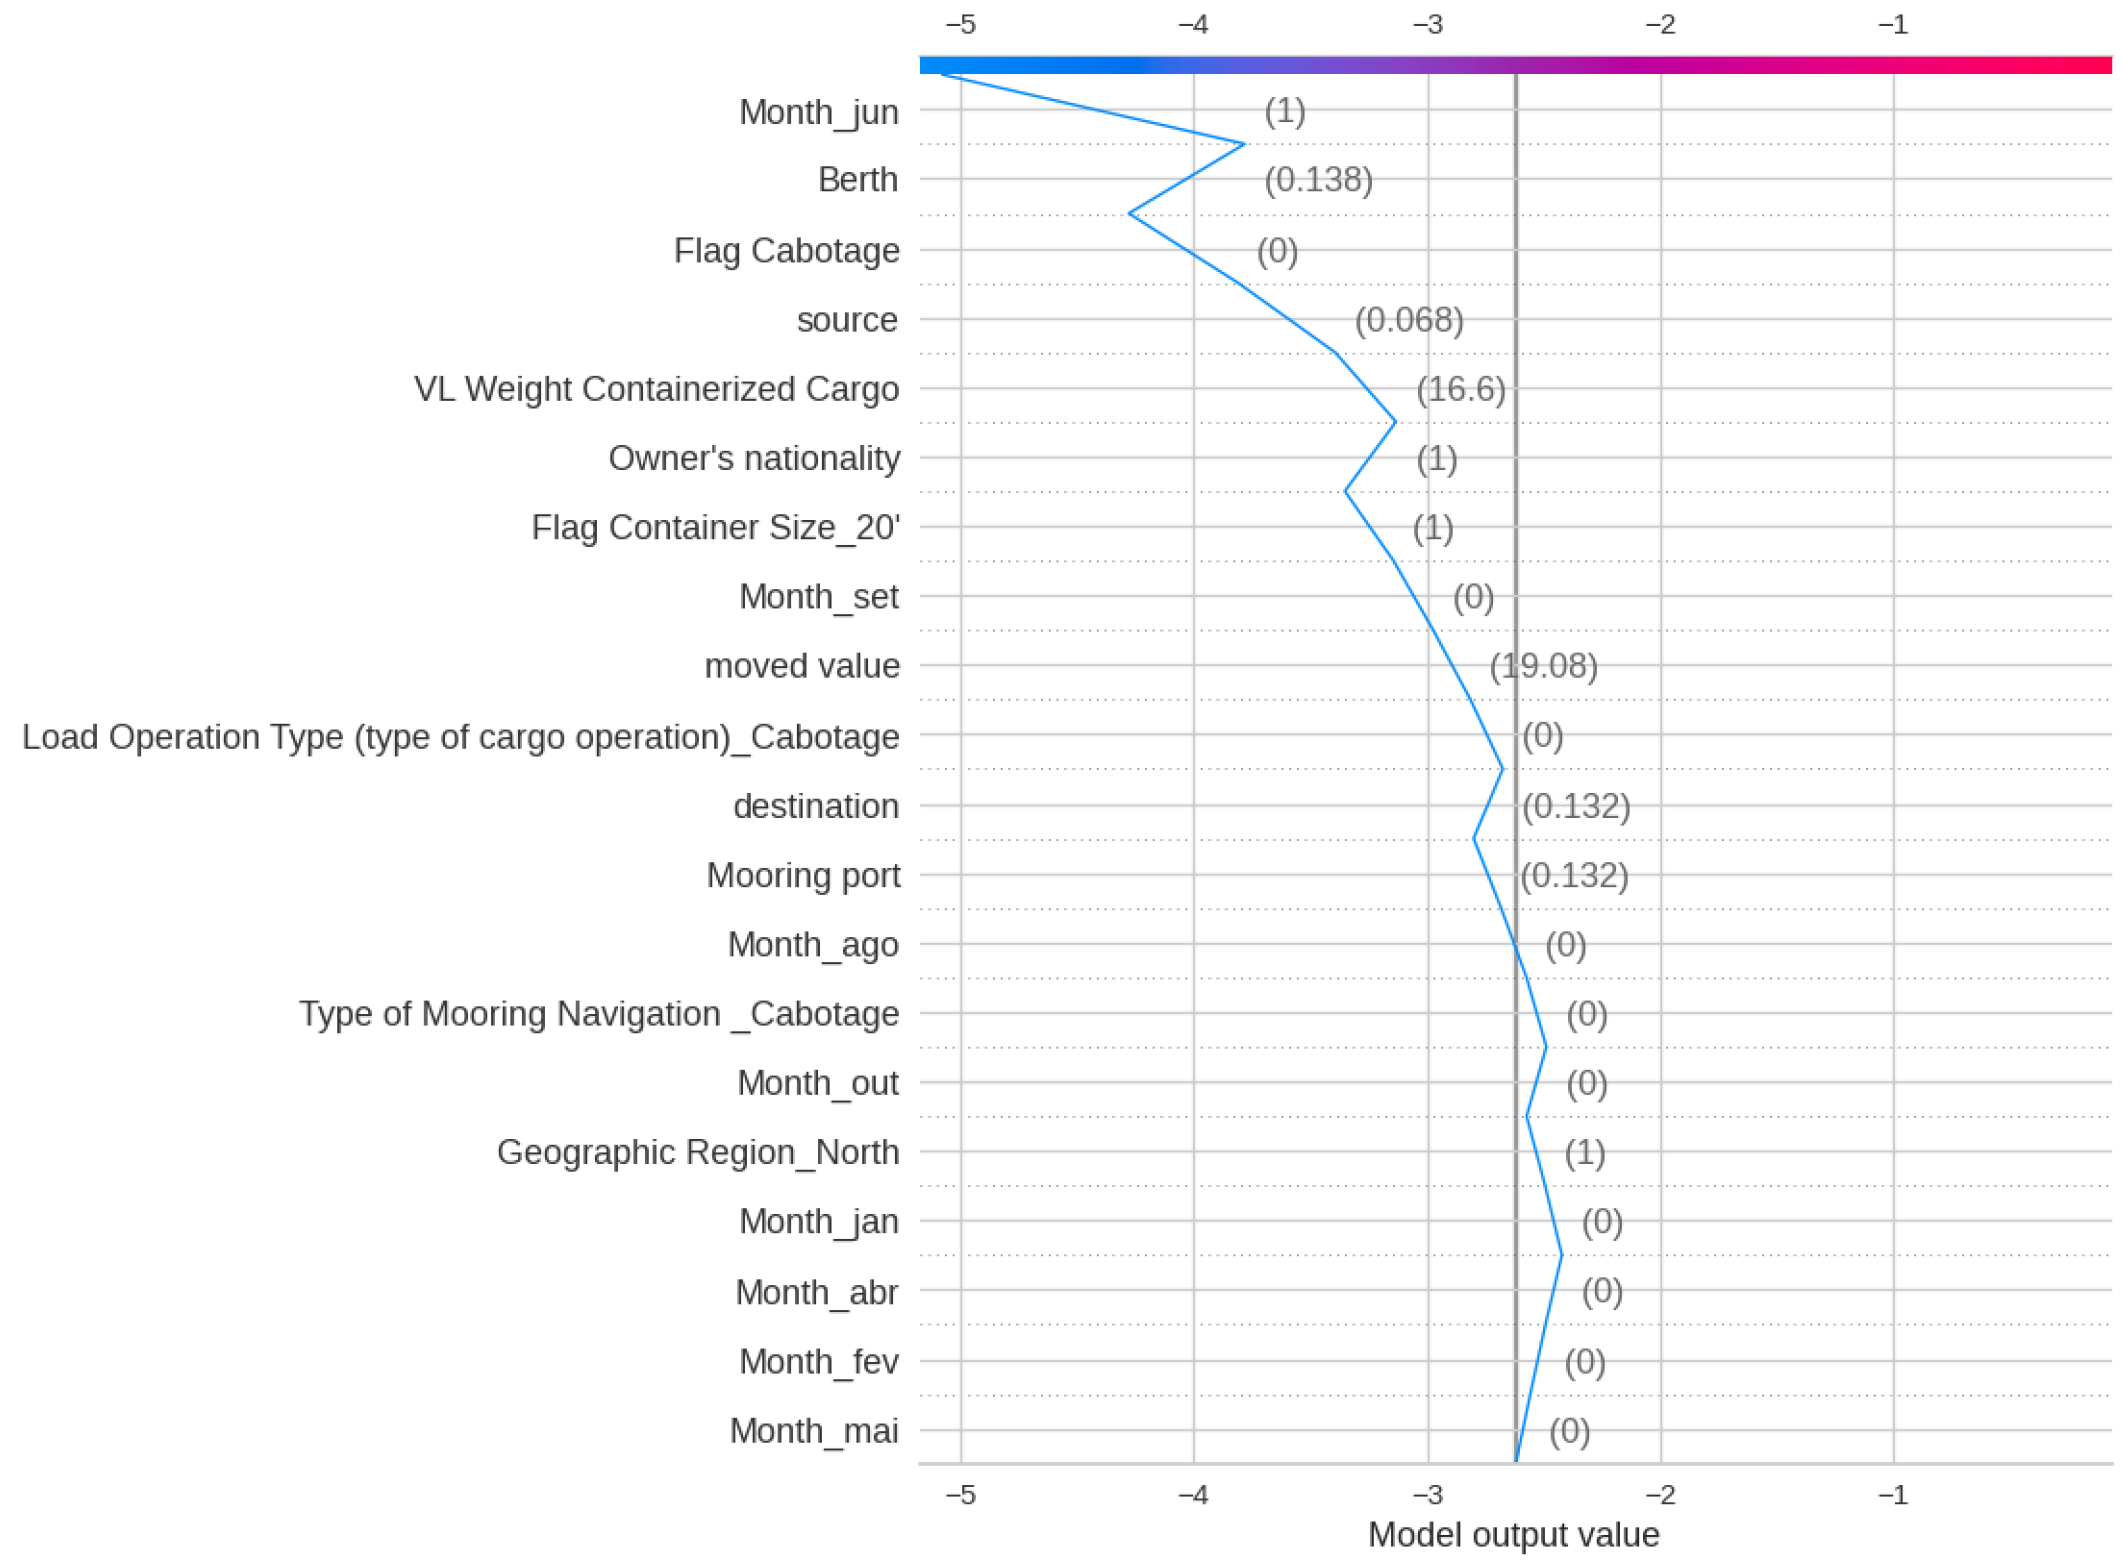
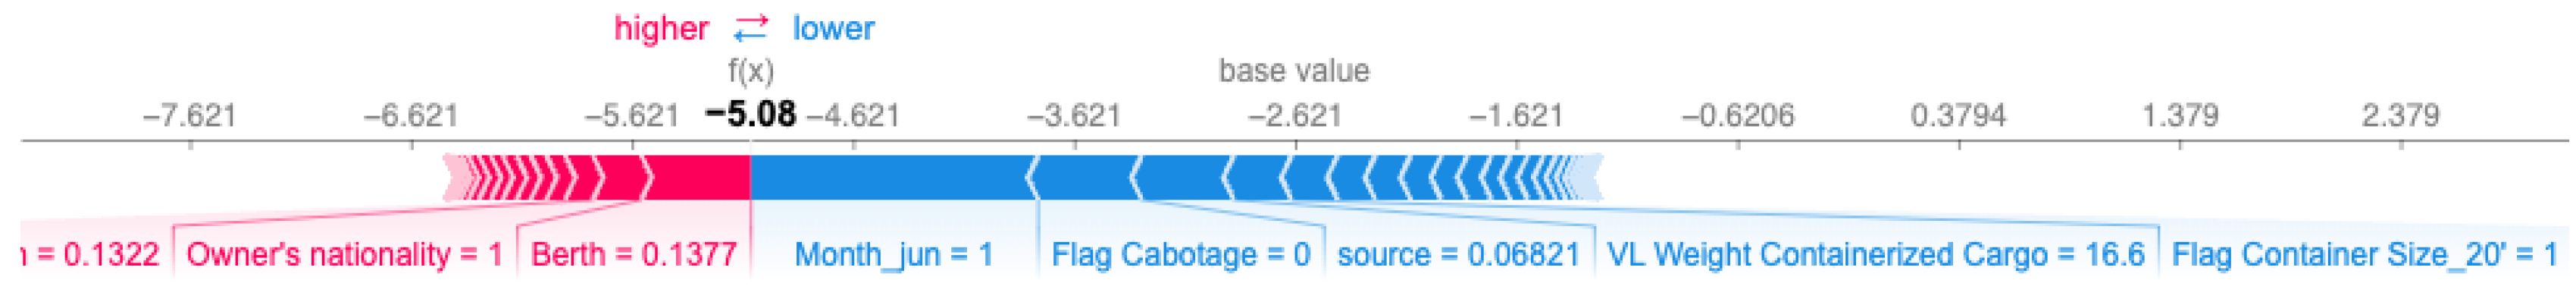
Figure 19 shows the SHAP analysis for Delay Class, indicating that the most significant impact on the XGBoost output is by Berth, Source, destination, and Nationality. This indicates that geographical features play a key role in Delay. Figure 20 and Figure 21 show the Decision plot and Force plot for a specific sample, where the actual Delay Class is 0. The SHAP output is −5.08, indicating the output is class 0 since it has a low value, with features such as Month, Berth, and Flag Cabotage having the most influence on this sample. Since this sample is Class 0, meaning no delay, there is no need to change any feature in this case.

Figure 19.
SHAP feature analysis plot for Delay Class.
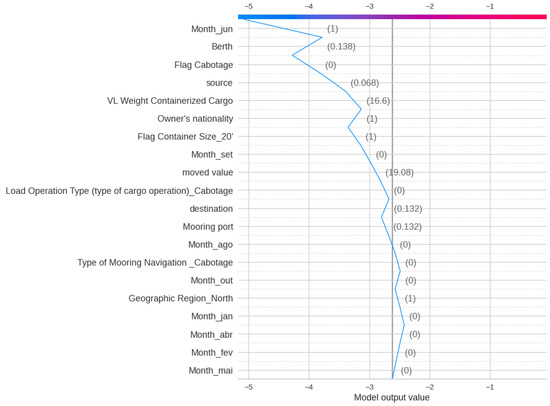
Figure 20.
SHAP Decision plot for Delay Class of a sample observation.

Figure 21.
SHAP force plot for Delay Class of a sample observation.
5. Discussion
From the results, tree-based methods exhibit the best performance, particularly in predicting Total Time and Delay Class. By providing tools to accurately predict and classify vessel behavior, this research contributes greatly to improving our understanding of various methods, which can be used to make more efficient and effective predictive analytics-based decision-making in port management. The proposed solution has wide-ranging applications and integration into different aspects of maritime logistics, from ship scheduling to service delay predictions to risk assessment, demonstrating its potential to enhance overall port performance and optimize supply chain operations.
Additionally, the incorporation of feature analysis through feature importance enriches our understanding of the factors influencing maritime logistics, where predictions are influenced by Berth and Cargo Characteristics features while classification tasks are impacted by Geographical features (Total Time and Delay Time) and operation characteristic features (Delay Time). This offers insights that can be leveraged to further improve the efficiency of port operations and make them more resilient. Since Berth plays a key role in the prediction of Total Time and Delay Time, using a Top–Bottom approach for developing individual models for ports and then berths would be beneficial in understanding how these ports and berths can be made more efficient.
SHAP (Shapley Additive Explanations) analysis plays a crucial role in this process by helping us understand how these features contribute to the outcomes, providing deeper insights into each individual case. This allows for the identification of specific mitigation steps that can be taken accordingly. Features like Berth, Source, Destination, and Month usually come out as key features impacting outcomes. Learning from this, a suggestion for an optimal Berth–Source–Destination combination, along with travel month, can be made and checked to see if it is operationally feasible. SHAP helps us address the predictive analytics of port operations at both the global and local levels, ensuring that the models are both comprehensive and precise.
Overall, this approach, enhanced by Feature Importance and SHAP analysis, contributes to a more nuanced understanding of port logistics and supports the development of more effective and resilient port management strategies, which can help with optimizing the Berth Allocation Problem (BAP), Predictive Model Scheduling (PMS), and port risk assessment. By enhancing these aspects, ports can achieve greater sustainability, aligning with the goal of promoting green practices.
The current set of features is limited, and there is a huge potential for performance gain by accounting for additional variables of maritime logistics. It could involve integrating various other data sources, such as weather forecasts, vessel tracking, and other vessel information, to enhance the accuracy, responsiveness, and scope of the models. These expanded features will lead to enhanced feature analysis as well.
Another observation is that Deep Learning methods do not currently perform well due to the abundance of categorical data. In the future, the authors plan to address this issue by exploring alternative methods for handling categorical data, such as binary encoding, deep embedding (Cat2Vec), and other techniques, to see if they can improve the performance of deep learning models.
6. Conclusions
This paper presents a comprehensive solution for predicting vessel Stay (Total) Time and Delay Time in maritime logistics, using Brazilian port data. This represents a significant step forward in addressing the complexities of port operations. The study demonstrates the effectiveness of predictive analytics in port operations, with tree-based methods performing best, especially in predicting Total Time and Delay Class. Feature importance analysis, including SHAP, highlights that Berth and Cargo Characteristics influence Total Time, while geographical and operational features affect Delay Time.
This work has the potential to be extended to benefit port operations worldwide, offering opportunities for improved efficiency and effectiveness in maritime logistics on a global scale. Another avenue for exploration is integrating this work with BAP, PMS, yard allocation, and crane scheduling to assess its overall impact on port operations.
Additional experimentation and verification are necessary to ensure feature importance, robustness, and broader applicability, along with the exploration of additional predictors and advanced models. Another direction is to address challenges in deep learning caused by categorical data as well as explore more advanced methods. Additionally, incorporating more features and real-time data streams, such as weather and vessel tracking, will improve model accuracy and responsiveness. Overall, continued research in this area has the potential to drive significant advancements in maritime logistics, leading to more efficient and resilient port operations in the future.
Author Contributions
Conceptualization, A.R.R., H.W. and C.G.; methodology, A.R.R. and H.W.; validation, A.R.R. and H.W.; formal analysis, A.R.R.; investigation, A.R.R.; writing—original draft, A.R.R.; writing—review and editing, A.R.R., H.W. and C.G.; supervision, H.W. and C.G. All authors have read and agreed to the published version of the manuscript.
Funding
This research received no external funding.
Institutional Review Board Statement
Not applicable.
Informed Consent Statement
Not applicable.
Data Availability Statement
The original contributions presented in this study are included in the article. Further inquiries can be directed to the corresponding author.
Conflicts of Interest
Authors Aniruddha Rajendra Rao, Haiyan Wang and Chetan Gupta were employed by the company Hitachi America, Ltd. All authors declare there is no conflicts of interest.
Abbreviations
The following abbreviations are used in this manuscript:
| API | Application Programming Interface |
| BAP | Berth Allocation Problem |
| PMS | Predictive Model Scheduling |
| KPI | Key Performance Indicator |
| SHAP | Shapley Additive Explanations |
| TEU | Twenty-foot Equivalent Unit |
| XGBoost | Extreme Gradient Boosting |
| LightGBM | Light Gradient Boosting Machine |
| SVM | Support Vector Machine |
| RF | Random Forest |
| KNN | k-Nearest Neighbor |
| ResNet | Residual Network |
| MAE | Mean Absolute Error |
| MSE | Mean Squared Error |
| RMSE | Root Mean Squared Error |
| RMSLE | Root Mean Squared Logarithmic Error |
| R-squared | |
| MAPE | Mean Absolute Percentage Error |
| AUC | Receiver Operating Characteristic Curve |
References
- Ogura, T.; Inoue, T.; Uchihira, N. Prediction of Arrival Time of Vessels Considering Future Weather Conditions. Appl. Sci. 2021, 11, 4410. [Google Scholar] [CrossRef]
- Kolley, L.; Rückert, N.; Kastner, M.; Jahn, C.; Fischer, K. Robust berth scheduling using machine learning for vessel arrival time prediction. Flex. Serv. Manuf. J. 2022, 35, 29–69. [Google Scholar] [CrossRef]
- Mekkaoui, S.E.; Benabbou, L.; Berrado, A. Machine Learning Models for Efficient Port Terminal Operations: Case of Vessels’ Arrival Times Prediction. IFAC-PapersOnLine 2022, 55, 3172–3177. [Google Scholar] [CrossRef]
- Nguyen, T.; Zhang, J.; Zhou, L.; He, Y. A data-driven optimization of large-scale dry port location using the hybrid approach of data mining and complex network theory. Transp. Res. Part E Logist. Transp. Rev. 2019, 134, 101816. [Google Scholar] [CrossRef]
- Abreu, L.; Maciel, I.; Alves, J.; Braga, L.; Pontes, H. A decision tree model for the prediction of the stay time of ships in Brazilian ports. Eng. Appl. Artif. Intell. 2022, 117, 105634. [Google Scholar] [CrossRef]
- Dimitrios, D.; Nikitakos, N.; Papachristos, D.; Dalaklis, A. Opportunities and Challenges in Relation to Big Data Analytics for the Shipping and Port Industries; Palgrave Macmillan: Cham, Switzerland, 2023; pp. 267–290. [Google Scholar] [CrossRef]
- Reggiannini, M.; Righi, M.; Tampucci, M.; Duca, A.L.; Bacciu, C.; Bedini, L.; D’Errico, A.; Paola, C.D.; Marchetti, A.; Martinelli, M.; et al. Remote Sensing for Maritime Prompt Monitoring. J. Mar. Sci. Eng. 2019, 7, 202. [Google Scholar] [CrossRef]
- Bautista-Sánchez, R.; Barbosa-Santillán, L.I.; Sánchez-Escobar, J.J. Statistical Approach in Data Filtering for Prediction Vessel Movements Through Time and Estimation Route Using Historical AIS Data. In Proceedings of the Mexican International Conference on Artificial Intelligence, Xalapa, Mexico, 27 October–2 November 2019. [Google Scholar]
- Eriksen, T.; Hoye, G.; Narheim, B.T.; Meland, B.J. Maritime traffic monitoring using a space-based AIS receiver. Acta Astronaut. 2006, 58, 537–549. [Google Scholar] [CrossRef]
- Iris, Ç.; Lam, J.S.L. A review of energy efficiency in ports: Operational strategies, technologies and energy management systems. Renew. Sustain. Energy Rev. 2019, 112, 170–182. [Google Scholar] [CrossRef]
- Izaguirre, C.; Losada, I.J.; Camus, P.; Vigh, J.L.; Stenek, V. Climate change risk to global port operations. Nat. Clim. Chang. 2020, 11, 14–20. [Google Scholar] [CrossRef]
- Dulebenets, M.A. A comprehensive multi-objective optimization model for the vessel scheduling problem in liner shipping. Int. J. Prod. Econ. 2018, 196, 293–318. [Google Scholar] [CrossRef]
- van Boetzelaer, F.B.; van den Boom, T.; Negenborn, R.R. Model predictive scheduling for container terminals. IFAC Proc. Vol. 2014, 47, 5091–5096. [Google Scholar] [CrossRef]
- Weerasinghe, B.A.; Perera, H.N.; Bai, X. Optimizing container terminal operations: A systematic review of operations research applications. Marit. Econ. Logist. 2023, 26, 307–341. [Google Scholar] [CrossRef]
- Bierwirth, C.; Meisel, F. A follow-up survey of berth allocation and quay crane scheduling problems in container terminals. Eur. J. Oper. Res. 2015, 244, 675–689. [Google Scholar] [CrossRef]
- Guo, L.; Zheng, J.F.; Liang, J.; Wang, S. Column generation for the multi-port berth allocation problem with port cooperation stability. Transp. Res. Part B Methodol. 2023, 171, 3–28. [Google Scholar] [CrossRef]
- Rodrigues, F.; Agra, A. Berth allocation and quay crane assignment/scheduling problem under uncertainty: A survey. Eur. J. Oper. Res. 2022, 303, 501–524. [Google Scholar] [CrossRef]
- Farag, Y.B.; Ölçer, A.I. The development of a ship performance model in varying operating conditions based on ANN and regression techniques. Ocean Eng. 2020, 198, 106972. [Google Scholar] [CrossRef]
- López-Bermúdez, B.; Freire-Seoane, M.J.; González-Laxe, F. Efficiency and productivity of container terminals in Brazilian ports (2008–2017). Util. Policy 2019, 56, 82–91. [Google Scholar] [CrossRef]
- Wang, H.; Liu, Z.; Wang, X.; Graham, T.L.; Wang, J. An analysis of factors affecting the severity of marine accidents. Reliab. Eng. Syst. Saf. 2021, 210, 107513. [Google Scholar] [CrossRef]
- Cao, Y.; Wang, X.; Yang, Z.; Wang, J.; Wang, H.; Liu, Z. Research in marine accidents: A bibliometric analysis, systematic review and future directions. Ocean Eng. 2023, 284, 115048. [Google Scholar] [CrossRef]
- Lim, S.; Pettit, S.; Abouarghoub, W.; Beresford, A. Port sustainability and performance: A systematic literature review. Transp. Res. Part D Transp. Environ. 2019, 72, 47–64. [Google Scholar] [CrossRef]
- Chu, Z.; Yan, R.; Wang, S. Vessel turnaround time prediction: A machine learning approach. Ocean. Coast. Manag. 2024, 249, 107021. [Google Scholar] [CrossRef]
- Štepec, D.; Martinčič, T.; Klein, F.; Vladušič, D.; Costa, J.P. Machine Learning based System for Vessel Turnaround Time Prediction. In Proceedings of the 2020 21st IEEE International Conference on Mobile Data Management (MDM), Versailles, France, 30 June–3 July 2020; pp. 258–263. [Google Scholar] [CrossRef]
- Abreu, L.; Maciel, I.; Alves, J.; Braga, L.; Pontes, H. Dataset—Stay Time of Ships in Brazilian Ports in 2018. 2022. Available online: https://www.researchgate.net/publication/365589683_Dataset_-_Stay_Time_of_Ships_in_Brazilian_Ports_in_2018?channel=doi&linkId=6379043e54eb5f547ce6ee87&showFulltext=true (accessed on 4 March 2025). [CrossRef]
- Cabral, A.M.R.; Ramos, F.S. Efficiency Container Ports In Brazil: A DEA And FDH Approach. Cent. Eur. Rev. Econ. Manag. (CEREM) 2018, 2, 43–64. [Google Scholar] [CrossRef]
- da Veiga Lima, F.; de Souza, D. Climate change, seaports, and coastal management in Brazil: An overview of the policy framework. Reg. Stud. Mar. Sci. 2022, 52, 102365. [Google Scholar] [CrossRef]
- Galvao, C.B.; Robles, L.T.; Guerise, L.C. 20 years of port reform in Brazil: Insights into the reform process. Res. Transp. Bus. Manag. 2017, 22, 153–160. [Google Scholar] [CrossRef]
- Costa, W.; Soares-Filho, B.; Nobrega, R. Can the Brazilian National Logistics Plan Induce Port Competitiveness by Reshaping the Port Service Areas? Sustainability 2022, 14, 14567. [Google Scholar] [CrossRef]
- Cacho, J.; Tokarski, A.; Thomas, E.; Chkoniya, V. Port Dada Integration: Opportunities for Optimization and Value Creation; IGI Global: Hershey, PA, USA, 2021; pp. 1–22. [Google Scholar] [CrossRef]
- Breiman, L. Random Forests. Mach. Learn. 2001, 45, 5–32. [Google Scholar] [CrossRef]
- Chen, T.; Guestrin, C. XGBoost: A Scalable Tree Boosting System. In Proceedings of the 22nd ACM SIGKDD International Conference on Knowledge Discovery and Data Mining, San Francisco, CA, USA, 13–17 August 2016. [Google Scholar]
- Freund, Y.; Schapire, R. A Decision-Theoretic Generalization of On-Line Learning and an Application to Boosting. J. Comput. Syst. Sci. 1997, 55, 119–139. [Google Scholar] [CrossRef]
- Ke, G.; Meng, Q.; Finley, T.; Wang, T.; Chen, W.; Ma, W.; Ye, Q.; Liu, T.Y. LightGBM: A Highly Efficient Gradient Boosting Decision Tree. In Proceedings of the Advances in Neural Information Processing Systems, Long Beach, CA, USA, 4–9 December 2017; Guyon, I., Luxburg, U.V., Bengio, S., Wallach, H., Fergus, R., Vishwanathan, S., Garnett, R., Eds.; Curran Associates, Inc.: New York, NY, USA, 2017; Volume 30. [Google Scholar]
- Geurts, P.; Ernst, D.; Wehenkel, L. Extremely randomized trees. Mach. Learn. 2006, 63, 3–42. [Google Scholar] [CrossRef]
- Louppe, G.; Wehenkel, L.; Sutera, A.; Geurts, P. Understanding variable importances in forests of randomized trees. In Proceedings of the Neural Information Processing Systems, Lake Tahoe, NV, USA, 5–8 December 2013. [Google Scholar]
- James, G.M.; Witten, D.M.; Hastie, T.J.; Tibshirani, R. An Introduction to Statistical Learning. In Springer Texts in Statistics; Springer: New York, NY, USA, 2013. [Google Scholar]
- Cortes, C.; Vapnik, V.N. Support-Vector Networks. Mach. Learn. 1995, 20, 273–297. [Google Scholar] [CrossRef]
- Hand, D.J.; Yu, K. Idiot’s Bayes—Not So Stupid After All? Int. Stat. Rev. 2001, 69, 385–398. [Google Scholar]
- Altman, N.S. An Introduction to Kernel and Nearest-Neighbor Nonparametric Regression. Am. Stat. 1992, 46, 175–185. [Google Scholar] [CrossRef]
- Zou, H.; Hastie, T.J. Addendum: Regularization and variable selection via the elastic net. J. R. Stat. Soc. Ser. B (Stat. Methodol.) 2005, 67, 768. [Google Scholar] [CrossRef]
- Abiodun, O.I.; Jantan, A.B.; Omolara, A.E.; Dada, K.V.; Mohamed, N.; Arshad, H. State-of-the-art in artificial neural network applications: A survey. Heliyon 2018, 4, e00938. [Google Scholar] [CrossRef] [PubMed]
- Schmidhuber, J. Deep learning in neural networks: An overview. Neural Netw. Off. J. Int. Neural Netw. Soc. 2014, 61, 85–117. [Google Scholar] [CrossRef] [PubMed]
- He, K.; Zhang, X.; Ren, S.; Sun, J. Deep Residual Learning for Image Recognition. In Proceedings of the 2016 IEEE Conference on Computer Vision and Pattern Recognition (CVPR), Las Vegas, NV, USA, 27–30 June 2016; pp. 770–778. [Google Scholar]
- Kohavi, R. A Study of Cross-Validation and Bootstrap for Accuracy Estimation and Model Selection. In Proceedings of the International Joint Conference on Artificial Intelligence, Montreal, QC, Canada, 20–25 August 1995. [Google Scholar]
- Menze, B.H.; Kelm, B.M.; Masuch, R.; Himmelreich, U.; Bachert, P.; Petrich, W.; Hamprecht, F.A. A comparison of random forest and its Gini importance with standard chemometric methods for the feature selection and classification of spectral data. BMC Bioinform. 2009, 10, 213. [Google Scholar] [CrossRef]
- Lundberg, S.M.; Lee, S.I. A Unified Approach to Interpreting Model Predictions. In Proceedings of the Neural Information Processing Systems, Long Beach, CA, USA, 4–9 December 2017. [Google Scholar]
- Dahouda, M.K.; Joe, I. A Deep-Learned Embedding Technique for Categorical Features Encoding. IEEE Access 2021, 9, 114381–114391. [Google Scholar] [CrossRef]
- Grinsztajn, L.; Oyallon, E.; Varoquaux, G. Why do tree-based models still outperform deep learning on typical tabular data? In Proceedings of the Neural Information Processing Systems, New Orleans, LA, USA, 28 November–9 December 2022.


Disclaimer/Publisher’s Note: The statements, opinions and data contained in all publications are solely those of the individual author(s) and contributor(s) and not of MDPI and/or the editor(s). MDPI and/or the editor(s) disclaim responsibility for any injury to people or property resulting from any ideas, methods, instructions or products referred to in the content. |
© 2025 by the authors. Licensee MDPI, Basel, Switzerland. This article is an open access article distributed under the terms and conditions of the Creative Commons Attribution (CC BY) license (https://creativecommons.org/licenses/by/4.0/).