Abstract
In urbanized environments, the expansion of urban areas has led to the creation of fragmented green spaces such as gardens and parks. While these areas provide essential habitats for pollinators, they may also inadvertently concentrate specimens of different species, increasing opportunities for pathogen transmission. This study highlights the importance of investigating pathogen dynamics in urban ecosystems, focusing on managed pollinators, such as Apis mellifera Linnaeus, 1758, and their wild counterparts. Over a two-year monitoring period in Milan, Italy, we examined the interactions between pollinator populations in urban green spaces and the spillover of honeybee pathogens. Our findings confirm widespread RNA virus transmission between honeybees and wild pollinators, supporting the previous studies. Notably, the Acute Bee Paralysis Virus (ABPV) exhibited the highest prevalence across both sampling years, underscoring its significant role in pathogen dynamics. These results emphasize the need for regular research to mitigate pathogen spillover risks in urban pollinator communities and inform conservation strategies.
1. Introduction
In urbanized environments, the expansion of urban areas has led to the creation of isolated green spaces such as gardens and parks [1]. These spatially constrained habitats are characterized by high biodiversity, hosting a variety of animals, among which are bees, birds, bats, and other mammals that traverse between urban and extra-urban spaces, including rural areas [2,3,4,5,6]. While urban gardens have been identified as places of refuge that provide resources for threatened species [7,8,9,10], urban beekeeping has gained popularity, especially in metropolises and cities. New dimensions to the public debates on bees and beekeeping, the diversification of beekeeping opportunities, and novel motivations for beekeeping have clearly emerged based on social studies [11]. However, honeybees also contribute to a niche overlap [12] and increased opportunities for pathogen transmission [13].
Such dynamics underscore the importance of studying the presence and impact of pathogens in urban ecosystems, particularly in managed pollinators like Apis mellifera Linnaeus, 1758, and its wild counterparts. The extensive documentation of pathogens in honeybees, including over 70 different species of viruses [14], bacteria [15], and microsporidia [16], has revealed that many of these pathogens also infect other pollinator species [17,18,19,20]. These data highlight that pathogens may significantly contribute to the observed decline in wild bee populations [21,22]. However, for numerous wild bee species, particularly solitary ones, the role of these infectious agents in their survival remains poorly understood. For example, while it is known that wild bumblebees can be adversely affected by Deformed Wing Virus (DWV), Kashmir Bee Virus (KBV), and Israeli Acute Paralysis Virus (IAPV) [18,23,24], the impact of such viruses in solitary bees is largely unexplored [25,26]. Similarly, Nosema ceranae Fries et al., 1996, initially associated with Apis cerana Fabricius, 1793, and actually a global disease of A. mellifera [27], has also been documented to spill over into stingless bee species [28,29], bumblebees [30,31], and Osmia bicornis (Linnaeus, 1758) [32].
A recent review [33] updated the knowledge on the route of virus transmission in honeybees, with both horizontal and vertical transmission being considered. Most viruses first described in the Apis spp. have also been detected in other bee species. Indeed, bee viruses can infect multiple hosts, and horizontal transmission seems to play a crucial role in the viral distribution patterns of bee species with different habits, with cleptoparasitic, communal, and ground-nesting species being more susceptible to infections [34]. Natural interspecies horizontal transmission can occur via several different routes, but oral–fecal transmission is most likely the main route. Several studies have pointed out the role of shared flowers in transmitting various bee pathogens (e.g., infected bees visiting flowers can contaminate the flower surface, nectar, and pollen with the virus particles they shed via their feces). Other less frequent interactions between bee species that could promote the transmission of viruses include robbing from other nests or colonies, brood parasitism, the reuse of nesting sites, and drifting. Finally, vector-mediated horizontal transmission could also be due to parasitoids, parasites, and commensals living in, on, or with the host bee or its nest structures [33].
Whatever the transmission route, the effectiveness of transmission is conditioned by the magnitude of the infectious load and the intrinsic resistance characteristics of the different viruses, which are differentiated and highly variable in relation to the environmental conditions [34].
The mite Varroa destructor Anderson & Trueman, 2000, is the primary driver of viral epidemics in honeybee populations for different viruses. It plays a central role in the transmission of viral pathogens in honeybee populations, particularly facilitating the spread of Deformed Wing Virus (DWV) and Acute Bee Paralysis Virus (ABPV) [14,35]. The mite worldwide invasion process and its strict relationship with honeybees have intensified viral infections, contributing to its diffusion through honeybee colonies and subsequent increases in the viral load [36]. Varroa mites feeding on the hemolymph of honeybees not only results in the bees becoming physically weakened but also acts as a mechanical vector, injecting viruses directly into the bee systems [37]. This transmission mode circumvents the honeybees’ natural immune defenses, leading to a rapid increase in viral loads and the development of more severe symptoms, such as wing deformities, paralysis, and colony collapse [35]. Without effective management, these mites can decimate honeybee colonies through their dual impact of parasitism and virus transmission. However, the potential role of V. destructor in transmitting viruses to wild bees is not yet fully understood and remains the subject of ongoing investigations. The current evidence indicates that while varroa mites have a specific impact on honeybees, they directly parasitize wild bees, including species such as the social Bombus (bumblebees) or some solitary Apoidea.
Other viruses, such as the Chronic Bee Paralysis Virus (CBPV), can easily spread within colonies, with infected bees showing symptoms such as tremors, hair loss, swollen abdomens, and flight inability, often leading to widespread mortality. Despite its efficient transmission within colonies, CBPV has not been linked to V. destructor infestations, as it is not associated with this parasite. Indeed, transmission appears to be primarily determined by direct contact between infected and healthy bees, as infected individuals are often attacked or nibbled by their nest mates [38].
In addition, it has been hypothesized [19,39] that wild bees may contract honeybee viruses such as DWV through the sharing of foraging environments rather than through direct interactions with varroa mites. Similarly, ref. [40] highlighted that although the mites cause significant virus amplification in honeybee colonies, their ability to affect wild bee populations is likely to be related to the indirect amplification of viral loads in honeybee colonies, thus increasing the likelihood of highly infected honeybees interacting with wild pollinators that share the same niche. The detection of different viruses in glandular secretions of worker bees and in colony resources such as pollen, honey, and bee feces [41,42] highlight the potential transmission pathways, including food-borne and fecal–oral routes. Such indirect transmission could occur via contaminated floral surfaces and, in detail, through pollen and nectar contamination, feeding in the same flowers, through trophallaxis, and by a fecal route [42,43,44]. DWV was found to be a frequent component of pollen pellets and was also present in bee feces, suggesting that honeybee foragers and colonies could facilitate horizontal virus transmission to the broader pollinator community [45]. Infected foragers may consequently contaminate pollen, nectar, and floral organs with pathogens, further increasing the risk of transmission [17]. Spillovers could also involve species that are not expected to come into direct contact with bees, such as wasps, which predate the infected bees and cannibalize their carcasses [17,46,47].
In urban gardens where bee populations may be artificially concentrated, the risk of disease transmission is heightened due to the increased contact and proximity of bees with other pollinators [5,12]. These dynamics underscore the importance of studying disease transmission in urban environments to mitigate the threat to managed and wild bee pollinator populations while promoting biodiversity conservation and/or urban beekeeping. This study investigates the ecological dynamics of pathogen spillover between managed honeybees and wild pollinators in urban ecosystems, focusing on shared foraging niches within green spaces. By combining field-based ecological assessments with viral load analysis, we examine how urban landscapes and plant biodiversity are related to pathogen transmission. Milan, with its extensive urbanization and interspersed green spaces, provides a valuable setting to study how biodiversity, habitat connectivity, and species interactions shape disease dynamics. The results will contribute to a better understanding of the ecological factors influencing pathogen spread and provide insights into the complex relationships among urbanization, pollinator communities, and disease dynamics.
2. Materials and Methods
2.1. Area of Study
Milan is the largest city in Northern Italy, covering an area of 18,200 ha [48]. Its green areas amount to over 25.03 km2 or around 13.75% of the urban surface [49,50]. These green spaces vary greatly, from large urban parks to smaller areas, including roundabouts and street lines. Such diverse ecological environments support a wide range of pollinator species and are ideal sites for studying the interactions of A. mellifera with wild bees.
Six green areas in Milan were selected for intensive monitoring to study the transmission of honeybee viruses to wild bee species. Diverse types of urban green spaces were included and are as follows: Two historic city parks (Parco Sempione 45°28′20″ N 9°10′37″ E (A) Giardini Pubblici “Indro Montanelli”, 45°28′29″ N 9°12′02′ E (B)), three modern parks (Parco CityLife, 45°28′38″ N 9°09′22″ E (C), Biblioteca degli Alberi, 45°29′02″ N 9°11′32″ E (D), and Piazza Leonardo da Vinci, 45°28′40″ N 9°13′34″ E (E)), and one small green space included in a roundabout (Piazzale Udine, 45°29′27″ N 9°14′12″ E (F)) (Figure 1).
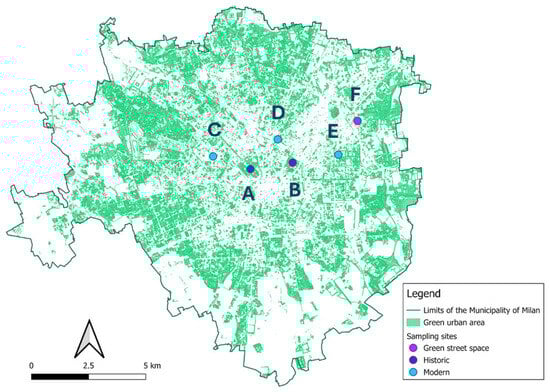
Figure 1.
Localization of the six monitored areas overlapping the map of the municipality of Milan [49] using QGIS v. 3.36.1 Maidenhead. Dot colors refer to the urban green type: blue = modern parks; dark violet = historic parks, and purple = green street spaces; the letters refer to the site Parco Sempione (A) Giardini Pubblici “Indro Montanelli” (B) Parco CityLife (C), Biblioteca degli Alberi (D), Piazza Leonardo da Vinci (E) Piazzale Udine (F).
Two different monitoring sets were carried out during the research; the first set focused on identifying pollinators and their interaction with plants, and the second evaluated the presence of honeybee pathogens in the wild pollinator assemblage at each site.
2.2. Plant–Pollinator Interaction
All the six green areas in Figure 1 were monitored in 2020 and 2021. Monitoring was carried out from February to late July in 2020 and from March to the beginning of October in 2021. In 2020, the survey schedule was, unfortunately, partly affected by the restrictions imposed by the government in response to the global COVID-19 pandemic. The implementation of public health measures, including the imposition of lockdowns and the restriction of access to certain sites, resulted in a reduction in the number of surveys conducted during the period.
During each survey, the green areas were explored to identify the presence of flowering plants. The parks were investigated through direct observation, where the researchers traversed the parks on foot and then paused in front of each flowering plant. Monitoring of bees was conducted at a distance of 30–50 cm in front of the plant in a randomized flowered portion with a projected area of 1/4 m2 during a period of five minutes. The number and the taxa of all the bees visiting the flowers for nectar or pollen collection were recorded. In the case of herbaceous plants, we recorded the number and taxa of the bees visiting the flowers from the soil to the tip of the canopy. Conversely, when the plant was arboreal, we recorded the bees visiting the lower part of the canopy from the basal branches up to a height of two meters. When feasible, the bees and plants were classified directly in the field, but when the determination was uncertain, the samples were photographed and/or collected for subsequent determination in the laboratory at the genus or species level.
Classification of the plants was facilitated by the dataset produced by the Municipality of Milan, which provides information about arboreal plants in the city green areas [49]. In addition, the website of modern park “D” was consulted to identify some of the plants sampled [51].
2.3. Pathogen Spillovers
To assess the presence of the eight honeybee viruses and two microsporidia (Table 1) in the different bee species, we sampled specimens at the six parks and, in the second year, we ran a single collection in an additional roundabout (Piazzale Ohm “G” 45°26′35″ N 9°08′52″ E).

Table 1.
Reports on the green area, the date of collection, the species collected, and the plants on which they were collected.
We selected the taxa and species to investigate among the ones identified as the most prevalent in a preliminary survey conducted in 2019 (see dataset). These were the social Apidae Apis mellifera, Bombus terrestris and Bombus pascuorum Scopoli, 1763, and the solitary Megachilidae Anthidium florentinum Fabricus, 1775 (wool carder bee). Attention was also focused on the exotic Megachilidae Megachile sculpturalis Smith, 1853, whose nests were found in historic city park “B” in 2019, and (solely in 2021) the solitary Osmia cornuta Latreille, 1805 (the mason bee), which exhibits a relatively short flight period at the beginning of the honeybee foraging season [52,53].
The sampling in 2020 focused on the spread of bee viruses in the summer, especially throughout July, as the level of varroa mite infestation in beehives before summer tends to rapidly increase thereafter [54]. In 2021, sampling was carried out during a wider period (March, May, June, July, and August) to evaluate the spread throughout the flowering season (Table 1).
The honeybees, bumblebees, wool carder bees, and mason bees were collected in the field on flowering plants during their foraging activity, with the aid of 50 mL sterile Falcon tubes. As M. sculpturalis was never observed foraging on the plants in the green areas monitored, specimens were collected directly at the nesting site.
After collection, all specimens were directly labeled with the location, date of collection, their specific name, and the plant species on which they were collected. Then, the bees were placed in a container and kept in darkness at a low temperature (less than 15 °C). A camping ice pack was used to refresh the container and to maintain a cool environment. The bees were then transported as quickly as possible to the laboratory, where they were transferred into a 5 mL sterile vial for conservation at −80 °C. The bees were identified in the field before the collections. However, the species determination was also verified in the laboratory on the live specimens in the falcon before freezing. Table 2 presents the list of honeybee pathogens searched in both the honeybees and wild bees. It also provides an overview of the methods employed for detecting these pathogens, with a particular focus on the specific techniques used in relation to the agent under investigation.
Table 2.
List of honeybee pathogens searched and the methods used for their detection in relation to the specific pathogen being studied [DWV = Deformed Wing Virus; ABPV = Acute Bee Paralysis Virus; CBPV = Chronic Bee Paralysis Virus; BQCV = Black Queen Cell Virus; SBV = Sac Brood Virus; KBV = Kashmir Bee Virus; IAPV = Israeli Acute Paralysis Virus].
2.4. Spore Count of Microsporidia Nosema spp.
The detection and quantification of Nosema spp. were performed using light microscopy, and the infection levels were estimated using a hemocytometer to count spores according to [55]. Positive samples were then subjected to species identification using a PCR endpoint.
2.5. Viral Investigations
Virus identification, i.e., the determination of the presence of any virus, was performed either by negative staining, i.e., the IEM (Immune Electron Microscopy) method involving the use of specific polyclonal sera [56] was employed for the sole DWV and ABPV, or by molecular methods specific for the following seven viruses, which are among the main causes of hive death or damage: Deformed Wing Virus (DWV), Acute Bee Paralysis Virus (ABPV), Chronic Paralysis Virus (CBPV), Black Queen Cell Virus (BQCV), Sac Brood Virus (SBV), Kashmir Bee Virus (KBV), and Israeli Acute Paralysis Virus (IAPV) [33,57]. Moreover, the seasonal trends of the ABPV, CBPV, and DWV complex in Italian-managed honeybee (A. mellifera) colonies were analyzed by quantitative RT-PCR.
2.5.1. Negative Staining Electron Microscopy (nsEM)
All the samples taken in 2020 and 2021 (Table 3) were used for the nsEM analyses. The extracts were prepared and treated using the method commonly applied to honeybees [58]. Each specimen was placed in 2.4 mL 0.001 M potassium buffer (BP), pH 6.7, containing 0.2% sodium diethyldithiocarbamate (Dieca) to prevent melanization and then mechanically homogenized (Ultraturrax—Ika Werk, Staufen, Germany). The extracts were emulsified with 0.3 mL chloroform and 0.3 mL diethyl ether and then cleared by low-speed centrifugation at 4500× g for 30 min. The supernatants were separated and again centrifuged at 9500× g for 30 min. Next, 100 μL of each supernatant was ultracentrifuged with an Airfuge (Beckman, Indianapolis, IN, USA) operating at 21 psi 82,000× g for 15 min, which was fitted with an A100 rotor that could hold six 175 μL test tubes and was equipped with specific plastic adapters that would enable the direct pelleting of virions onto 3 mm carbon-coated Formvar copper grids. The grids were negatively stained with 2% sodium phosphotungstate (NaPT) at pH 6.8 for 90 s and observed with a FEI Tecnai G2 Biotwin transmission electron microscope (FEI Company, Hillsboro, OR, USA) operating at 85 kV at 16,500–43,000 magnifications. Morphological differences in viral particles (shape, size, presence of structural elements, symmetry, etc.) were recorded and described. The identification of DWV and ABPV species was performed by means of an IEM method using anti-DWV (produced in IZSLER) and an anti-ABPV polyclonal serum produced in rabbits, respectively [56,59,60]. Compared to the method described above, an aliquot (50 µL) of the test sample was incubated with an equal amount of serum for 1 h at 37 °C under gentle agitation before ultracentrifugation. On observation, a positive reaction was expressed by the formation of immunoaggregates, i.e., dense clusters consisting of numerous antibody-coated particles. These EM methods allow for a semi-quantitative evaluation of viral particles. As the observation support (grid) is divided into meshes, the results are expressed by referring to them as follows: 1+ = 1–5 particles in the observed grid as a whole; 2+ = 1–5 particles in each of the observed grid meshes; 3+ = 20–50 particles in the grid as a whole; 4+ = 20–50 particles for each of the observed grid meshes; and 5+ = more than 50 particles for each of the observed grid meshes. The semi-quantitative IEM results consider the number and size of the immunoaggregates on the grid, as follows: 1+ = 1–5 small aggregates (2–10 particles) in the grid as a whole; 2+ = 1–5 small aggregates (2–10 particles) for each of the observed grid meshes; 3+ = 5–20 variable-sized aggregates in the grid as a whole; 4+ = 5–20 larger aggregates 10–50 particles) for each of the observed grid meshes; and 5+ = many aggregates (more than 20) or larger aggregates (more than 50 particles) for each of the observed grid meshes.
Table 3.
Summary of the samples collected and analyzed for virus presence in the seven green areas (Historic city parks: A, B; Modern parks: C, D, E; Roundabout: F, G) during the two consecutive years of surveys (2020 and 2021). The total number of individuals collected, those extracted for molecular analyses, their total weight, and the amount of diluent (physiological saline) used are reported. The remaining individuals were used for nsEM examination.
2.5.2. Molecular Analyses
Each sample was homogenized by maintaining the rate of 1–1.5 individuals in 1 mL of physiological saline depending on the amount of matrix available (Table 3). The total RNA was purified from 100 µL (for ABPV/CBPV/DWN) and from 230 µL (for SBV/BQCV/IAPV/KBV) of clarified homogenate using the RNeasy Mini Kit (Qiagen, Mississauga, ON, Canada). The RNA were recovered in 40 µL of the elution buffer. DNA extraction was also performed on the samples using GenElute™ Bacterial Genomic DNA Kits (Sigma-Aldrich, Buchs, Switzerland) with a lysozyme pre-incubation step.
Complementary DNA synthesis and amplification reactions were performed using different amplification kits and sets of primers depending on the pathogen under investigation (Table 4).
Table 4.
Primers and Taqman probes used for RT-PCR/PCR real-time and RT-PCR/PCR end-point assays [ABPV = Acute Bee Paralysis Virus; CBPV = Chronic Bee Paralysis Virus; DWV = Deformed Wing Virus; BQCV = Black Queen Cell Virus; SBV = Sac Brood Virus; KBV = Kashmir Bee Virus; IAPV = Israeli Acute Paralysis Virus].
ABPV/CBPV/DWV viruses: A one-step Real-Time RT-qPCR was performed using 20 μL of Master mix of QuantiFast® Pathogen RT-PCR + IC (QIAGEN) and 5 μL of RNA, according to the listed thermal cycling conditions: 30 min at 50 °C (reverse transcription), 15 min at 95 °C (initial denaturation) followed by 45 denaturation cycles at 95 °C for 15 s and annealing/extension at 60 °C for 1 min for ABPV and CBPV; while for DWV the reverse transcription lasted only 20 min and the annealing/extension 70 s. Ten-fold serial dilution of cRNA transcripts, produced as described in Martinello et al. (2017) [61], (106–102 viral RNA copies/μL) were used to generate a standard curve and to quantify the RNA in the samples. Threshold cycles from our samples were compared with the standard curve, establishing a linear relation. The results were expressed in viral genome copies per individual using the following equation: copies/individual = 80 × copies and (80/1.5) × copies. This conversion factor was calculated based on the volume used at each step of the real-time RT-qPCR method.
SBV/BQCV viruses: The one-step RT-PCR Kit (QIAGEN, Hilden, Germany) was used, with 22.5 µL of Master Mix and 2.5 µL of RNA, according to the listed thermal cycling conditions. The reverse transcription took place at 50 °C for 30 min and was followed by a denaturation and polymerase activation step at 95 °C for 15 min, and then 40 cycles of PCR, each consisting of 30 s at 94 °C, 50 s at 55 °C, and 1 min at 72 °C. Reactions were completed by a final elongation step at 72 °C for 7 min. The PCR products were electrophoresed in a 2.5% Tris-acetate-EDTA–agarose gel and stained with GelRed Nucleic Acid Stain (BIOTIUM, Fremont, CA, USA). UV transillumination was used to visualize the DNA bands. The size of the DNA fragments was estimated by comparison with a 100 bp DNA Ladder (Invitrogen, San Jose, CA, USA).
IAPV/KBV viruses: The one-step RT-PCR Kit (Qiagen, Hilden, Germany) was used (following the manufacturer’s recommendations), with 22.5 µL of Master Mix and 2.5 µL of RNA, according to the listed thermal cycling conditions. The reverse transcription at 50 °C for 30 min was followed by a denaturation and polymerase activation step at 95 °C for 15 min and then by 35 cycles of PCR, each consisting of 30 s at 94 °C, 50 s at 55 °C (IAPV) and at 50.5 °C (KBV), and 1 min at 72 °C. Reactions were completed by a final elongation step for 7 min at 72 °C. The PCR products were electrophoresed in a 2.5% Tris-acetate-EDTA–agarose gel and stained with GelRed Nucleic Acid Stain (Biotium, Fremont, CA, USA). UV transillumination was used to visualize the DNA bands. The size of the DNA fragments was estimated by comparison with a 100 bp DNA Ladder (Invitrogen, San Jose, CA, USA).
Microsporidia N. apis and N. ceranae: Two different PCR reactions were performed in a total volume of 25 µL containing a final concentration of 1x GoTaq Hot Start Master Mix 2x Promega, 1 mM MgCl2, 0.1 µM each set of primers, and 5 µL of DNA.
PCR was carried out according to the following thermal cycling conditions: Denaturation step at 95 °C for 2 min and then 40 cycles of PCR, each consisting of 30 s at 95 °C, 30 s at 55 °C (N. apis) or 62 °C (N. ceranae), and 1 min at 73 °C. Reactions were completed by a final elongation step for 5 min at 73 °C. The PCR products were electrophoresed in a 2% Tris-acetate-EDTA–agarose gel and stained with GelRed Nucleic Acid Stain (BIOTIUM, Fremont, CA, USA). UV transillumination was used to visualize the DNA bands. The size of the DNA fragments was estimated by comparison with a 100 bp DNA Ladder (Invitrogen, San Jose, CA, USA).
2.6. Statistical Analyses
Statistical analyses were performed using Rstudio v. 4.4.0 [67]. Plant–pollinator networks were obtained using the R bipartite package [68]. Networks were built with the total number of specimens per pollinator taxa per area for the whole monitoring period and the plant species to which they were associated. In this analysis, plants were considered as the lower level and pollinators as the higher level. For each network, the following metrics at the network level were calculated: the number of taxa at both levels, links per taxa, the mean number of shared partners, the niche overlap as the mean similarity in interaction between taxa of each level, the partner diversity as the mean Shannon diversity index for the number of interactions, and the Shannon diversity index of interactions [68], and the modularity. Modularity is a measure of how well links and interactions can be separated into different groups or modules of plant and pollinator species that interact more within their module than between modules. It ranges from 0 to 1, and it is higher when each module appears isolated from the rest of the network [69,70,71]. To better understand the variations in each network metric with urban greenery, ANOVA, Welch’s ANOVA, and the Kruskal–Wallis test were performed based on the satisfaction of the normality and homoscedasticity assumptions. To study the differences in each network metric over the two sampling years, the t-test and Wilcoxon–Mann–Whitney test were performed based on the satisfaction of the normality and homoscedasticity assumptions. Pairwise comparisons were then performed. To further elucidate the competitive dynamics among pollinator taxa, defined as the utilization of shared plant resources by different pollinators within a network, Müller’s index was calculated through the Potential for Apparent Competition (PAC), as outlined by [68,72] within the bipartite package. This index was calculated as the potential influence of an acting bee (here A. mellifera) on a target bee via shared plant species [73]. Müller’s index ranges from zero, indicating no plant sharing and thus no competition between pollinators, to one, denoting high plant sharing and high competition between the acting and target bees [73,74]. Müller’s index was calculated for all the taxa in the six areas for each year. Apis mellifera was the acting bee, and the target bees selected were the ones that, in 2019, resulted as dominant and the ones that were also selected for pathogen spillover. The target bees were Anthidium spp., An. florentinum, B. terrestris, B. pascuorum, M. sculpturalis, and O. cornuta. For the year 2020, the index was not calculated for An. florentinum as the identification at the species level for this genus was not available. The variations in Müller’s index between the selected bees and the different urban greenery were analyzed with the Kruskal–Wallis test. To understand whether the apparent competition changed over the years, we used the Wilcoxon–Mann–Whitney test.
Finally, linear discriminant analysis was used to group the green areas according to virus presence and load and the biodiversity.
3. Results
3.1. Plant–Pollinator Interactions
In total, 17 bee genera and 78 taxa of plants were monitored throughout 2020 and 2021. Among the bee taxa, the highest percentage of observations in 2020 was represented by A. mellifera (51.6%), followed by the Anthidium spp. (25%), the Bombus spp. (12.9%) (with individual percentages of 8.6% for B. terrestris, 3.8% for B. pascuorum, 0.1% for B. argillaceus), and the Lasioglossum spp (4.5%). The less represented taxa included O. cornuta (1.7%), the unique representative of the genus, Megachile spp. (1.5%), with 0.2% of M. sculpturalis, and Halictus spp. (1.2%), primarily represented by H. scabiosae, which accounted for 0.9% of the total. Among the least represented genera were Hylaeus (0.9%), Heriades (0.3%), Stelis (0.2%), Andrena (0.1%), and Xylocopa (0.1%). In 2021, the highest percentage of observation was again A. mellifera (44.9%), the Anthidium spp. (27.1%), with a major contribution from An. florentinum (15.7%), and the Bombus spp. (11.6%), especially B. terrestris (6.1%) and B. pascuorum (3%). Osmia spp. raised its presence (5.4%), with O. cornuta accounting for 3.4% and O. bicornis for 1.2%, followed by the Halictus spp. (3.9%), with H. scabiosae accounting for 3.4%, the Anthophora spp. (2.1%), the Megachile spp. (1.6%), with M. sculpturalis accounting for 0.1%, and the Lasioglossum spp. (1.4%). The taxa with a percentage of less than 1% were, in descending order of prevalence, the Andrena spp. (0.9%), (A. cineraria with 0.1%, and A. haemorrhoa (Fabricius, 1781) with 0.3%), the Hylaeus spp. (0.3%), the Xylocopa spp. (0.3%), the Anthidiellum spp. (0.1%), the Ceratina spp. (0.1%), the Heriades spp. (0.1%), the Nomiapis spp. (0.1%), and the sole species of genus, Stelis, S. punctulatissima (0.1%).
The network analysis allowed for the detection of 2649 plant–bee interactions. In 2020, we recorded 1147 plant–bee associations, with 12 Apoidea and 39 plant taxa, while in 2021, we recorded 1502 plant–pollinator associations, with 17 Apoidea 72 plant taxa. Figure 2 and Figure 3 show the networks for each monitoring site in 2020 and 2021, respectively, with larger bars indicating a greater number of interactions. In all the green areas, A. mellifera and Anthidium spp. were confirmed to be the dominant species.
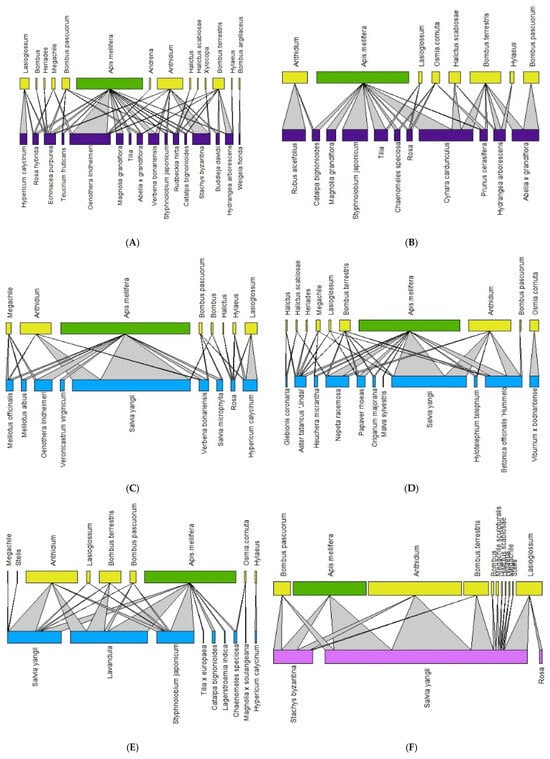
Figure 2.
Pollination network for each site in 2020 (Historic city parks: (A,B); Modern parks: (C–E); Roundabout: (F). The upper lines refer to the pollinators (green = Apis mellifera; yellow = wild pollinators), and the basal lines refer to the plant on which bees were observed. The color of the basal line refers to the urban green type (blue = modern parks; dark violet = historic parks, and purple = green street spaces).
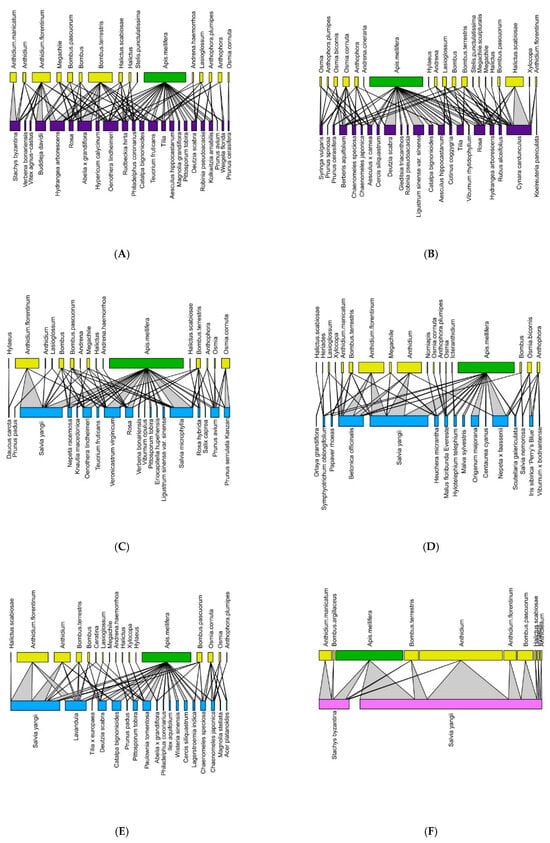
Figure 3.
Pollination network for each site in 2021 (Historic city parks: (A,B); Modern parks: (C–E); Roundabout: (F). The upper lines refer to the pollinators (green = Apis mellifera; yellow = wild pollinators), and the lower lines refer to the plant on which bees were observed. The color of the basal line refers to the urban green type (blue = modern parks; dark violet = historic parks, and purple = green street spaces).
Table 5 reports the results of the network analysis over the two years for each green area. The number of pollinator taxa varied significantly between the years (t = −3.71, df = 10, p = 0.004), while no differences emerged in the number of plant taxa (t = −1.91, df = 10, p = 0.08), the number of links per species (t = 1.27, df = 10, p = 0.23), the mean number of shared partners between pollinators (t = 1.28, df = 10, p = 0.22), the niche overlap of plants (t = 1.14, df = 10, p = 0.27), the partner diversity for plants (t = −0.97, df = 10, p = 0.35), the partner diversity for pollinators (t = −0.84, df = 10, p = 0.41), the Shannon diversity index of interactions (t = −1.76, df = 10, p = 0.10), modularity (t = −1.06, df = 10, p = 0.31), the mean number of shared partners of plants (W = 21.5, p = 0.63), and the niche overlap of pollinators (W = 21, p = 0.68).
Table 5.
Results of network analysis expressed as Plant and Pollinator Taxa over the two years, Links per Taxa, Mean Shared Partners, Niche Overlap, Partner Diversity for both levels, Shannon Diversity Index, and Modularity.
About the variation in network metrics in relation to urban green areas, there was a significant difference in the number of plants among the different types of areas (F = 26.99, p = 0.001), with a notable distinction between the green street spaces and the historic (p = 0.0012) and modern parks (p = 0.051). The same trend was found in modularity (F = 56.128, p = 0.01), with a significant difference between the green street space and the historic (p = 0.0003) and modern parks (p = 0.039), as well as between the historic and modern parks (p = 0.002). Additionally, there was significance in the Shannon diversity index of interactions (F = 6.71, p = 0.016), with a notable difference between the green street spaces and the historic areas (p = 0.017). For the pollinator niche overlap (chi-squared = 8.88, df = 2, p = 0.01) and the plant niche overlap (F = 4. 139, p = 0.053), a slightly statistically significant difference in the variation was found between the historic and modern parks (p = 0.056). No differences emerged across the urban green spaces in the mean number of pollinator taxa (F = 0.549, p = 0.59) and that of the shared pollinator partners (F = 1.65, p = 0.24), while the shared plant partners showed a slightly statistically significant difference (chi-squared = 5.78, df = 2, p = 0.055).
Table 5 reports the results of the network analysis performed over the two years. The difference in the number of plant and bee pollinator taxa between the two years is primarily attributed to the longer observation period in 2021 compared to 2020, which allowed for the recording of interactions with a greater variety of flowering plants.
A substantial degree of niche overlap (0.94 in 2020 and 0.65 in 2021) was observed among the pollinators in roundabout “F”, where a limited range of plant species was present.
The Shannon diversity index revealed notable differences according to the sites. Index values higher than three were recorded in historic city park “A” in both years and in modern park “E” and historic city park “B” in 2021. The lowest values were observed in roundabout “F” over both years and in modern park “C” in 2020. Furthermore, the roundabout “F” revealed a low number of interactions due to the restricted number of flowered plant species (three in 2020 and two in 2021).
The potential for apparent competition was plotted for each site for the two sampling years (Figure 4). In all the sites, A. mellifera had the highest Müller’s index, except for the green street space where Anthidium spp. had the highest index.
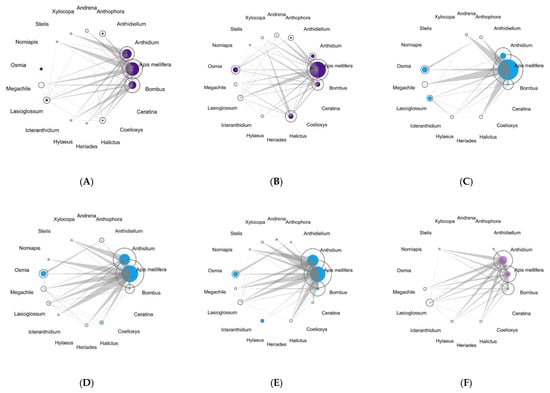
Figure 4.
Visualization of potential for apparent competition for bees in each area (Historic city parks: (A,B); Modern parks: (C–E); Roundabout: (F). The area of the circles represents the abundance of pollinator taxa, which are proportional to the number of interactions that have been realized for each bee taxa, while the solid circles are proportional to the potential for apparent competition at the genus level (except A. mellifera). The bars connecting the taxa are proportional to the potential for apparent competition that is being exerted by the acting bee taxa on shared plant taxa.
The Muller’s index of A. mellifera on the selected target bees displayed a significant difference according to target bees (chi-squared = 42.977, df = 6, p < 0.001, but not according to the year (W = 852.5, p = 0.79) and to the urban greenery (chi-squared = 4.4982, df = 2, p = 0.10).
With regard to bee taxa, the pairwise comparison evidenced that Apis mellifera had a Müller’s index that was statistically significant for all the target selected bees (p < 0.001). In contrast, the two species of Bombus (B. terrestris and B. pascuorum) had a Müller’s index that was statistically different from M. sculpturalis (Figure 5). In detail, the Müller’s index in A. mellifera was the highest, with a minimum of 0.31 and maximum of 0.8 (means ± SD = 0.63 ± 0.16). The Anthidium spp. had a higher Müller’s index than An. florentinum (p = 0.029), M. sculpturalis (p = 0.015), and O. cornuta (p = 0.07). The Anthidium spp. reached the maximum value of 0.74 (means ± SD = 0.31 ± 0.22), while An. florentinum peaked at 0.4 (means ± SD = 0.11 ± 0.15). Regarding the Bombus spp., B. terrestris reached a maximum of 0.57 (means ± SD = 0.31 ± 0.17), while B. pascuorum reached a maximum of 0.65 (means ± SD = 0.29 ± 0.22). For the two species belonging to the family of Megachilidae, M. sculpturalis reached a maximum of 0.28 (means ± SD = 0.03 ± 0.09) and O. cornuta reached a maximum of 0.43 (means ± SD = 0.14 ± 0.17).

Figure 5.
Müller’s index variability in the taxa subjected to spillover analysis.
In 2020, Müller’s index ranged from 0 to 0.78 (mean ± SD = 0.27 ± 0.27, n = 42); in 2021, it ranged from 0 to 0.8 (mean ± SD = 0.25 ± 0.23, n = 42) (Table 6).
Table 6.
Müller’s index calculated from the plant–pollinator networks in each area for the selected target bees in the different sites over the two years.
The green areas category exhibited a minimum value of 0 but displayed a range of maximum values. In the case of the historic parks, the maximum value of the Müller’s index was 0.8 (means ± SD = 0.19 ± 0.26, n = 28), followed by the modern parks with a maximum of 0.77 (means ± SD = 0.32 ± 0.26, n = 42), and the green street spaces showed the lowest maximum value at 0.34 (means ± SD = 0.22 ± 0.14, n = 14). Among the sites, the maximum values were noted; in the three modern parks, for “D”, the Müller’s index maximum was 0.64 (means ± SD = 0.3 ± 0.26), for “C”, it was 0.77 (means ± SD = 0.35 ± 0.31), and for “E”, it was 0.62 (means ± SD = 0.31 ± 0.21), while in the historic parks, “B” had a maximum of 0.8 (means ± SD = 0.2 ± 0.27) and “A” had 0.75 (means ± SD =0.18 ± 0.25), while roundabout “F” had a maximum of 0.34 (means ± SD = 0.22 ± 0.14) (Table 6).
3.2. Pathogen Spillover
Details of the results obtained are shown in Table 7 and Table 8 for the first (2020) and second (2021) sampling years, respectively. In honeybees, the threshold of 105 infectious virions/individual for ABPV and DWV was considered significant in terms of pathogenic effects, especially when combined with the presence of varroa mites, which amplifies their virulence [75].
Table 7.
Analytical details of pathogen detection in 2020: presence/absence, viral load, spores, and results of EM observation (identification of DWV/ABPV by IEM or presence of any other virus) [ABPV = Acute Bee Paralysis Virus; CBPV = Chronic Bee Paralysis Virus; DWV = Deformed Wing Virus; BQCV = Black Queen Cell Virus; SBV = Sac Brood Virus; KBV = Kashmir Bee Virus; IAPV = Israeli Acute Paralysis Virus].
Table 8.
Analytical details of pathogen detection in 2021: presence/absence; viral load; spores, and results of EM observation (identification of DWV/ABPV by IEM or presence of any other virus) [ABPV = Acute Bee Paralysis Virus; CBPV = Chronic Bee Paralysis Virus; DWV = Deformed Wing Virus; BQCV = Black Queen Cell Virus; SBV = Sac Brood Virus; KBV = Kashmir Bee Virus; IAPV = Israeli Acute Paralysis Virus].
Table 9 and Table 10 present the overall analytical data of the viral detection for each pathogen, describing its presence and frequency in the different insect species at various sampling sites and by the magnitude of their viral load.
Table 9.
Positivity data for each viral agent investigated in terms of occurrence and frequency in the different insect species at each sampling site and by viral load extent in 2020. (Low positivity: max 104 genome copies per individual; medium positivity: 105 to 107 genome copies per individual; medium-high positivity: 108 to 109 genome copies per individual; high positivity: over 109 genome copies per individual) [ABPV = Acute Bee Paralysis Virus; CBPV = Chronic Bee Paralysis Virus; DWV = Deformed Wing Virus; BQCV = Black Queen Cell Virus; SBV = Sac Brood Virus; KBV = Kashmir Bee Virus; IAPV = Israeli Acute Paralysis Virus].
Table 10.
Positivity data for each viral agent investigated, in terms of occurrence and frequency in the different insect species at each sampling site and by viral load extent in 2021. (Low positivity: max 104 genome copies per individual; medium positivity: 105 to 107 genome copies per individual; medium-high positivity: 108 to 109 genome copies per individual; high positivity: over 109 genome copies per individual) [ABPV = Acute Bee Paralysis Virus; CBPV = Chronic Bee Paralysis Virus; DWV = Deformed Wing Virus; BQCV = Black Queen Cell Virus; SBV = Sac Brood Virus; KBV = Kashmir Bee Virus; IAPV = Israeli Acute Paralysis Virus].
CBPV was identified in 5 cases in 2020 (out of 12), namely in 3 A. mellifera, 1 B. terrestris, and 1 An. florentinum, but always at low titers, and only in 2 samples out of the 21 tested in 2021, only in A. mellifera and always at low titers.
ABPV was the most frequently detected virus. In fact, all the samples in 2020 were positive, with as many as half of the samples having titers at or above the threshold value (>105), not only in bees but also in all the other pollinators. The frequency was also high in 2021, with only five negatives but with a high prevalence of medium-low titers below the threshold value (13 out of 16 positives). High positivity was found not only in honeybees but also in bumblebees.
DWV was unexpectedly identified less frequently than ABPV, with only four positives in 2020, of which one had high titer. In addition, there were 6 positives out of the 21 tested in 2021, of which 2 had high titers. However, all three high-titer positives were found in A. mellifera.
Regarding the other viruses investigated, we recorded constant negativity for KBV and IAPV. At the same time, BQCV and SBV were present with some frequency, albeit in a differentiated manner from one year to the next. BQCV was, in fact, only identified in 7 out of 12 samples in 2020, while SBV was predominant in 2021 (8 out of 21 positive samples) compared to 2020 (only 1 positive).
Of particular interest is the simultaneous presence of more viral agents in the same sample (Table 11). All the samples in 2020 were positive for at least one virus (100%), and 9 of 12 had more than one virus. More precisely, three samples (25%) were positive for a single virus, i.e., the acute paralysis virus (ABPV); four samples (33.3%) for two viruses, where in three out of four cases, the association was the ABPV + BQCV, whereas in the remaining case, it was the CBPV + ABPV association; two samples (16.7%) were simultaneously positive for three viruses, where it was the CBPV + ABPV + BQCV association; and three samples (25%) were positive for four viruses, specifically in two samples, where it was the CBPV + ABPV + DWV + BQCV association, and in one case, the CBPV + ABPV + DWV + SBV association. In 2021, among the 16 (76.2%) samples that were positive out of the 21 tested, there were 11 viral associations in the various pollinators. Specifically, five samples (23.8%) were positive for only one virus, and in all the cases, it was the acute paralysis virus (ABPV); seven samples (33.3%) were positive for two viruses, where in three cases, it was the ABPV + DWV association, and in four cases, it was the ABPV + SBV association; three samples (14.3%) were simultaneously positive for three viruses, where in two cases, it was the ABPV + DWV + SBV association, and in one case, the ABPV + CBPV + SBV association; finally, one sample (4.8%) was positive for four viruses, and it was the ABPV + CBPV + DWV + SBV association.
Table 11.
Viral associations in the different species in 2020 and 2021. The numbers in parentheses refer to the number of times the association was found [ABPV = Acute Bee Paralysis Virus; CBPV = Chronic Bee Paralysis Virus; DWV = Deformed Wing Virus; BQCV = Black Queen Cell Virus; SBV = Sac Brood Virus; KBV = Kashmir Bee Virus; IAPV = Israeli Acute Paralysis Virus].
The linear discriminant analyses applied to the virus load and the pollinator biodiversity revealed two separate groups according to the green area studied. It was evident that the modern and historic parks were grouped together, while roundabout “F” was separate (Figure 6). In this area, positivity occurred only in the second year of monitoring and was limited to a few samples.
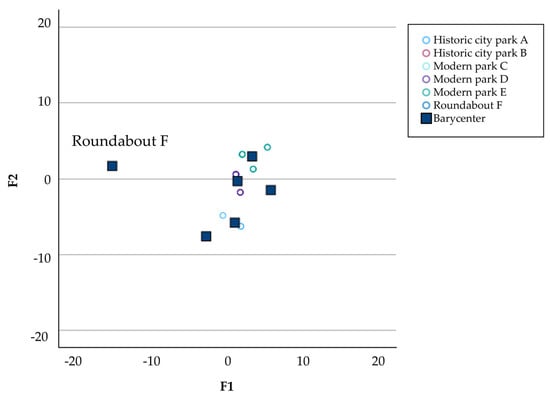
Figure 6.
Graphical representation of the Linear Discriminant Analyses (LDA) determined by discriminant factors 1 (F1) and 2 (F2).
With regard to the seasonal trends (Figure 7), and despite the limitations already mentioned in the methods, an expected trend characterized by a relatively higher incidence of positive samples, sometimes even at high titers, was observed during the summer months (June and July). However, positives were detected practically throughout the period, often at low titers, for ABPV and some sampling dates for CBPV and DWV. The trend was slightly different for BQCV, with several positive cases only in 2020, and for SBV, with only one positive case in 2020 and a constant level from May to August 2021.

Figure 7.
Seasonal trends of positivity for viruses during the two consecutive years (2020 and 2021) (Orange = Positive—P, Blue = Negative—N).
Regarding the electron microscopy (EM) results in 2020, immunoelectron microscopy for DWV identified 1 positive out of the 12 tested in one sample of a honeybee from modern park “D” with a high PCR titer >1011 (Figure 8A), while the three DWV PCR positives with titers of 103–104 were not detected by EM. Similarly, the IEM results for ABPV was positive for two samples, one of B. terrestris from modern park “D” (Figure 8B) and one from a honeybee from modern park “C” (Figure 8C), both with very high PCR titers (>1012). Of the nine IEM-negative samples, two were found to be positive for picornavirus-like particles with a low titer. In 2021, 2 IEM-positives out of the 21 tested were observed with medium and high titers (107 and 109) in RT-PCR. Remarkably, they were all from honeybees in the same green area (modern park “E”) at an interval of three months. Conversely, the four DWV positives, all from honeybees from three different green areas (two modern parks, “D” and “E”, and roundabout “F”), with a low titer of 103–104 in PCR, were not detected by EM. Among the 19 IEM-negative samples, isolated picornavirus-like particles with low titer (+/++) were visible in 3 samples. Out of these three samples, one—a B. terrestris from modern park “D”—had a high titer for ABPV in RT-PCR (108), and one—a B. terrestris from roundabout “F”—was positive for both SBV and for ABPV at a low titer (104). Finally, one sample—O. bicornis from modern park “D”—was positive only by EM investigation and negative for all PCR, thus indicating the possibility of the presence of an unidentified virus.
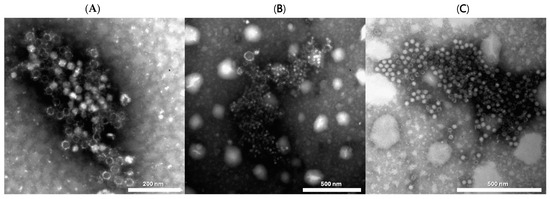
Figure 8.
Microphotograph observed by negative staining immune electron microscopy (IEM): (A) DWV (Deformed Wing Virus) in A. mellifera. (B) for ABPV (Acute Bee Paralysis Virus) in B. terrestris. (C) for ABPV (Acute Bee Paralysis Virus) in A. mellifera. Negative staining, NaPT 2%.
Concerning the detection of the Nosema spp., all the samples were negative in 2020. In contrast, in 2021, 2 out of the 21 samples (9.52%) tested were found to be positive by microscopic examination (A. mellifera from roundabout “F” and An. florentinum from modern park “E”, respectively). In both cases, the presence of N. ceranae was subsequently confirmed by one-step PCR.
4. Discussion
Monitoring the bee and plant taxa over two years yielded significant insights into the composition and interactions between the pollinators and plants in the monitored urban areas of Milan. Regarding the bee taxa, the highest percentage of observations was consistently represented by A. mellifera and the Anthidium spp., which dominated interactions across both years. The restrictions imposed by the COVID-19 pandemic in 2020 impeded the implementation of a comprehensive monitoring program, resulting in a slight alteration in the composition of the bee community between the two years. This shift can be predominantly attributed to an increased prevalence of the Osmia spp. in 2021, particularly O. cornuta and O. bicornis, which typically emerge during the spring months, precisely those heavily impacted by the COVID-19 restrictions in 2020.
The network analysis further highlighted the complexity of the plant–pollinator interactions in the urban context, as stated in previous research [76,77]. The number of pollinator taxa changed over the two years but not among the urban greenery areas. In contrast, the number of plant taxa varied between the small area (the roundabout) and the other categories. The same trend was found for the Shannon diversity index and modularity, which were lower in the green street spaces than in the historic parks. The result showed that the number of pollinator taxa did not change among the greenery areas, suggesting that, even with its low number of plant taxa, a small area was still an important landscape feature for pollinators [76,78]. Notably, our results showed many interactions concentrated on a few floral taxa, suggesting that multiple pollinator species often converged on shared plant resources. Despite the high diversity of bee species and interactions observed in most of the urban green spaces, competition between the species always seemed intense. As in the other studies [79,80], the competition network analysis in the present work revealed that, while many species contributed to pollination in these environments, only a few demonstrated strong competitive potential within each park. These species, dominating by the number of interactions, could monopolize access to floral resources and reduce the opportunities for less competitive species. This suggests that, while parks may support a broad range of pollinators, the dynamics of competition among them can result in the dominance of a few key species, with implications for the overall health and stability of pollinator communities. Among the bee taxa, A. mellifera stood out as the species with the highest number of interactions across a wide range of plant taxa. Our results confirm the great intraspecific competition of A. mellifera, as reported in [74], with pathogen transmission between and within species. This finding is particularly significant because honeybees, which are known to transmit pathogens to wild pollinator species, play a dominant role in these interactions. This underscores their potential impact on the health and stability of wild pollinator communities, emphasizing the need to manage their interactions across diverse ecological settings.
Our focus on dominant species was dictated by the following two important facts: these species are expected to have the highest number of interactions and, consequently, they may be more susceptible to pathogen spillover events. This was confirmed by the consistent positive detections throughout the monitoring period. Furthermore, the collection of Osmia bees in the second year provided evidence that spillover events can also occur early in the season for given pathogens. The collection of the exotic bee M. sculpturalis highlighted additional concerns, particularly regarding the interactions between native and exotic species, which may facilitate the cross-exchange of pathogens and exacerbate the existing challenges in pollinator health.
We recorded significant differences in the overall presence of honeybee viruses between the two years and, certainly, our monitoring schedule partly justified this result. Our aim was to intercept the highest viral load for the majority of viruses, achieved by the 2020 records that perfectly aligned with the existing literature [81,82,83]. The extended monitoring in the second year likely captured a more comprehensive picture of viral prevalence across the different phases of the colony’s life cycle. However, variability between the years can also be dependent upon fluctuating environmental conditions, colony health, and stressors that significantly impact viral dynamics in honeybee populations [83].
It has been previously shown that multiple RNA viruses associated with honeybees are frequently present in sympatric wild bumblebee populations [84] and that viruses initially thought to be specific to honeybees are much more widespread. Therefore, RNA virus transmission between the managed and wild bees should be considered a common phenomenon [85]. However, the directionality of virus transmission remains elusive in most cases [20].
Regardless of the origin and directionality of viral transmission and given the type and frequency of interactions observed (i.e., many interactions concentrated on a few floral taxa and thus convergence of many pollinator species on shared plant resources), it is highly probable that the conditions for an indirect transmission of pathogens via the fecal–oral route have been fulfilled. Concurrently, identifying individuals with elevated viral loads provided insights into the potential role of these individuals as ‘eliminators’ responsible for active contamination. Conversely, individuals with low or medium-low viral loads may indicate a ‘latent’ infection or passive contamination. Notably, viral loads exhibited substantial variation at the individual level and within population-level prevalence. The variation in viral load and prevalence among individuals within a population is a key finding of this study.
Our data from comparing the two sampling years revealed that ABPV was always the pathogen with the highest prevalence. The virus was identified in honeybees, An. florentinum and both B. terrestris and B. pascuorum in 2020, and again in A. mellifera, An. florentinum, and B. terrestris, as well as in O. cornuta and M. sculpturalis in 2021. ABPV was one of the first honeybee viruses proven to be transmissible to bumblebees [86]. Its pathogenic capacity was found to be evident in the presence of a varroa mite infestation [87], and it has therefore been associated as a co-factor in colony loss associated with varroa mites. In the study of [85], ABPV was found to be more prevalent in bumblebees than in honeybee foragers, and indeed, bumblebees were harboring a wide range of pathogen loads, including a substantial proportion of putatively high infections (>109 virus particles per individual).
ABPV is a member of a complex of three closely related viruses, including the Kashmir Bee Virus (KBV) and the Israeli Acute Paralysis Virus (IAPV), which are collectively named the AKIcomplex [88]. The AKI complex of viruses has a broader host range, being detected and found to be actively replicating in different Bombus species [42,89] and thus impairing their fitness [24]. Furthermore, IAPV was detected in bumblebees, and there was evidence that its infection was spread from the infected honeybee colonies to the non-Apis hymenopteran pollinators [42]. Additionally, the AKI complex was detected in five other wild bee genera, including species within the Halictidae family [33]. Interestingly, our study did not detect the presence of both KBV and IAPV.
DWV, one of the most prominent honeybee viruses, was identified as being exclusively associated with A. mellifera in 2021 but also associated with An. florentinum and B. terrestris in 2020. The virus was documented in at least seven wild bee genera, including stingless bees [90], bumblebees [23,91], members of the Halictidae family, and hornets [42,90,92]. The presence of the virus was already known in northern Italy for several species of wild pollinators [93]. In bumblebees, wing deformities can be determined by this virus [23], which can also reduce the survival of bumblebees artificially inoculated with DWV [18]. Deformities were also observed in some of the bumblebees collected in this study. Active replication has also been confirmed in both the Osmia and Melipona species [25,94]. However, despite the possibility of active replication, it appeared to be less widespread among the wild bees than the honeybees.
BQCV was detected only in 2020 and in association with A. mellifera, B. pascuorum, and An. florentinum. The virus was found to be prevalent in honeybees but not associated with transmission by varroa mites. It had already been detected in association with bumblebee species by colleagues [42,93,95], and BQCV has been known to efficiently replicate in different bumble bee species [96,97]. Due to the analytical method used (qualitative PCR), however, we do not have the corresponding viral load. Furthermore, even if it was widespread in the wild bumblebee populations, the foragers largely harbor low levels of such viruses [85].
CBPV was detected in A. mellifera during both years, as well as in B. terrestris and the Anthidium spp. in 2020, albeit always at low titers. CBPV is a non-classified RNA neurotropic virus. It was first isolated in 1963 from bees showing neurological symptoms of paralysis, such as the incapacity to fly, ataxia, and trembling [98]. The distribution of CBPV is widespread in A. mellifera populations on a global scale [99]. Its presence has also been documented in A. cerana [100], B. terrestris [101], and B. impatiens [89]. Furthermore, CBPV infects ants (Formica rufa L., Camponotus vagus Scopoli) and V. destructor [102], with ants representing a virus reservoir and the mite serving as a virus vector facilitating the spread of CBPV in the honeybee population.
Finally, compared with only one in 2020, eight SBV-positive samples were found in 2021 in different pollinators, namely An. florentinum, M. sculpturalis, and B. terrestris. SBV is one of the widespread viruses in the world in A. mellifera and A. cerana, and it is the etiological agent of the sacbrood disease in a bee brood. SBV is a common virus and, although sacbrood disease is lethal for infected larvae, colonies that show symptoms of sacbrood rarely collapse. Hence, SBV poses a moderate threat to managed honeybees. SBV has also been detected in varroa mites [103,104] but without replication. Unlike the other honeybee viruses, SBV seems to have a narrow range. It has been found in several Bombus species [42,85,91,105] and in the solitary bee Andrena vaga Panzer, 1799 [106], but it does not seem to replicate in these hosts. Therefore, its host range may be more limited and may not pose the same level of threat to wild pollinators as the viruses capable of replication.
By electron microscopy, additional picornavirus-like particles were observed in small quantities in the samples from the diverse pollinators. These particles were identified as isolated, scattered entities. In some cases, they could refer to the particles detected by PCR, notably ABPV and DWV. However, in at least one case in 2021, a viral positivity for picornavirus-like was detected in a mason bee, which was found to be negative by molecular methods. This potentially represents a different unidentified viral agent. The application of next-generation sequencing methods, which have recently been introduced for bee virus detection studies, leading to the identification of new agents or variants of the existing ones (reviewed by [84]) will undoubtedly allow us to better characterize new viruses in the future. Whether the recently discovered viruses in both the managed and wild bees induce mortality or merely affect the fitness of the infected bee species remains unresolved. Further studies are required to ascertain the impact of viral pathogens on the pollinator community.
The Nosema spp. was only sporadically present, with only two samples positive for N. ceranae in A. mellifera and An. florentinum in two locations. Although Nosema spp. plays a central role in the decline in honeybees worldwide [107,108], the limited detection in A. mellifera in this context suggests that Nosema spillover was probably minimal. Furthermore, it is also known that bumblebees are primarily infected by N. bombi [109,110,111], even if previous studies have proven the detrimental effects of N. ceranae infections in both the Bombus and Apis species [112,113]. Some researchers have investigated the distribution of Nosema infections in native bees (reviewed by [114]), but additional research is still needed to determine the pathology and distribution of infections in native bees and better understand the long-term consequences to native bees and the plant communities reliant on them [115,116].
5. Conclusions
Our findings support the previous studies demonstrating widespread RNA virus transmission between honeybees and wild pollinators in areas densely visited by managed and unmanaged bees. This highlights the formation of a dense, interconnected network of potential pathogen sources within and between pollinator species in urban green areas. While some viruses appear to be highly specific to A. mellifera, others are able to infect a broader range of pollinator species, with varying levels of replication and impact on host fitness. Furthermore, some viruses can be harbored by wild species and transmitted back to honeybees, further complicating the dynamics of virus transmission and creating feedback loops that increase the challenges of disease management. However, more research is needed to assess the impact of these viruses on the different developmental stages of other bee species. The same could also be true for non-viral pathogens such as Nosema spp.
These findings highlight the complexity of pathogen transmission within pollinator communities and underscore the need for deeper investigations into the dynamics of their spread between managed honeybees and wild pollinators, particularly in light of the growing concerns about pollinator decline. Limited floral resources in urban green spaces can increase competition between the managed and wild pollinators, potentially amplifying the risk of pathogen spillovers. The high foraging demand of honeybee colonies, driven by their large worker populations, may disproportionately impact wild pollinators by intensifying resource competition and increasing their exposure to pathogens within restricted foraging areas. This underscores the need for careful management of urban beekeeping, including regulating the number of colonies per area to ensure sustainable foraging conditions and to minimize negative impacts on local wild pollinator communities. In the context of the current biodiversity crisis, it is crucial to promote interdisciplinary studies that combine topics such as bee competition for resources, the range of detectable pathogens, and the host-to-host associations. The decline in pollinator populations is a major threat, which honeybees can partially overcome with the reproductive control provided by beekeepers. In contrast, wild bees face constant challenges, including limited food sources, soil degradation, loss of natural nesting sites, and pathogen spillovers. We advocate robust monitoring programs focused on the health status of wild species to improve our understanding of the environmental consequences of interspecies transmission events. Such efforts are an integral part of promoting a One Health approach.
Author Contributions
Conceptualization, D.L. and A.L.; methodology, D.L., A.L., M.G. and C.S.; investigation, C.S., S.M., E.H., M.F. and M.G.; resources, D.L.; data curation, C.S., S.M. and M.F.; writing—original draft preparation, D.L., C.S., A.L. and S.M.; writing—review and editing, D.L., C.S., A.L. and S.M.; supervision, D.L. and A.L.; project administration, D.L.; funding acquisition, D.L. All authors have read and agreed to the published version of the manuscript.
Funding
This research was funded by Cariplo Foundation, Project Api-GIS grant number 2019-4675.
Institutional Review Board Statement
According to the European and National legislations (D.Lgs 4 marzo 2014, n. 26 “Attuazione della direttiva 2010/63/UE sulla protezione degli animali utilizzati a fini scientifici”. GU n.61 del 14-3-2014), this study does not require ethical approval.
Informed Consent Statement
Not Applicable.
Data Availability Statement
Data can be downloaded from Sorvillo, Carla; Malabusini, Serena; Holzer, Erica; Matteo, Frasnelli; Giovanetti, Manuela; Lavazza, Antonio; Lupi, Daniela (2025), “Plant pollinator interactions in green areas subjected to spillover analysis”, Mendeley Data, V1, doi: 10.17632/xdppjz4674.1. Available online: https://data.mendeley.com/datasets/xdppjz4674/1 (accessed on 13 December 2024).
Acknowledgments
CS was funded from January 2023 under the National Recovery and Resilience Plan (NRRP), Mission 4 Component 2 Investment 1.4—Call for tender No. 3138 of 16 December 2021, rectified by Decree n. 3175 of 18 December 2021 of Italian Ministry of University and Research funded by the European Union—NextGenerationEU. Authors also wish to thank Brenda V. Ball from the Rothamsted Station, UK, for kindly providing us the anti-ABPV polyclonal serum produced in rabbits.
Conflicts of Interest
The authors declare no conflicts of interest.
References
- Marsh, W.M. Landscape Planning: Environmental Applications; Wiley: New York, NY, USA, 2005; Volume 4. [Google Scholar]
- Angold, P.G.; Sadler, J.P.; Hill, M.O.; Pullin, A.; Rushton, S.; Austin, K.; Small, E.; Wood, B.; Wadsworth, R.; Sanderson, R.; et al. Biodiversity in urban habitat patches. Sci. Total Environ. 2006, 360, 196–204. [Google Scholar] [CrossRef] [PubMed]
- Magle, S.B.; Reyes, P.; Zhu, J.; Crooks, K.R. Extirpation, colonization, and habitat dynamics of a keystone species along an urban gradient. Biol. Conserv. 2010, 143, 2146–2155. [Google Scholar] [CrossRef]
- Withey, J.C.; Marzluff, J.M. Dispersal by juvenile American crows (Corvus brachyrhynchos) influences population dynamics across a gradient of urbanization. Auk 2005, 122, 205–221. [Google Scholar] [CrossRef]
- Giovanetti, M.; Giuliani, C.; Boff, S.; Fico, G.; Lupi, D. A botanic garden as a tool to combine public perception of nature and life-science investigations on native/exotic plants interactions with local pollinators. PLoS ONE 2020, 15, e0228965. [Google Scholar] [CrossRef]
- Fisogni, A.; Hautekèete, N.; Piquot, Y.; Brun, M.; Vanappelghem, C.; Ohlmann, M.; Franchomme, M.; Hinnewinkel, C.; Massol, F. Seasonal trajectories of plant-pollinator interaction networks differ following phenological mismatches along an urbanization gradient. Landsc. Urban Plan. 2022, 226, 104512. [Google Scholar] [CrossRef]
- Colla, S.R.; Willis, E.; Packer, L. Can green roofs provide habitat for urban bees (Hymenoptera: Apidae)? Cities Environ. 2009, 2, 4. [Google Scholar] [CrossRef]
- Hernandez, J.L.; Frankie, G.W.; Thorp, R.W. Ecology of urban bees: A review of current knowledge and directions for future study. Cities Environ. 2009, 2, 3. [Google Scholar] [CrossRef]
- Goddard, M.A.; Dougill, A.J.; Benton, T.G. Scaling up from gardens: Biodiversity conservation in urban environments. Trends Ecol. Evol. 2010, 25, 90–98. [Google Scholar] [CrossRef]
- Quistberg, R.D.; Bichier, P.; Philpott, S.M. Landscape and local correlates of bee abundance and species richness in urban gardens. Environ. Entomol. 2016, 45, 592–601. [Google Scholar] [CrossRef]
- Lorenz, S.; Stark, K. Saving the honeybees in Berlin? A case study of the urban beekeeping boom. Environ. Sociol. 2015, 1, 116–126. [Google Scholar] [CrossRef]
- Casanelles-Abella, J.; Fontana, S.; Fournier, B.; Frey, D.; Moretti, M. Low resource availability drives feeding niche partitioning between wild bees and honeybees in a European city. Ecol. Appl. 2023, 33, e2727. [Google Scholar] [CrossRef] [PubMed]
- Dalmon, A.; Diévart, V.; Thomasson, M.; Fouque, R.; Vaissière, B.E.; Guilbaud, L.; Henry, M. Possible spillover of pathogens between bee communities foraging on the same floral resource. Insects 2021, 12, 122. [Google Scholar] [CrossRef] [PubMed]
- Beaurepaire, A.; Piot, N.; Doublet, V.; Antunez, K.; Campbell, E.; Chantawannakul, P.; Chejanovsky, N.; Gajda, A.; Heerman, M.; Panziera, D. Diversity and Global Distribution of Viruses of the Western Honey Bee, Apis mellifera. Insects 2020, 11, 239. [Google Scholar] [CrossRef] [PubMed]
- Fünfhaus, A.; Ebeling, J.; Genersch, E. Bacterial pathogens of bees. Curr. Opin. Insect Sci. 2018, 26, 89–96. [Google Scholar] [CrossRef]
- Martínez-López, V.; Ruiz, C.; Muñoz, I.; Ornosa, C.; Higes, M.; Martín-Hernández, R.; De la Rúa, P. Detection of microsporidia in pollinator communities of a mediterranean biodiversity hotspot for wild bees. Microb. Ecol. 2021, 84, 638–642. [Google Scholar] [CrossRef]
- Nanetti, A.; Bortolotti, L.; Cilia, G. Pathogens spillover from honey bees to other arthropods. Pathogens 2021, 10, 1044. [Google Scholar] [CrossRef]
- Fürst, M.A.; McMahon, D.P.; Osborne, J.L.; Paxton, R.J.; Brown, M.J.F. Disease associations between honeybees and bumblebees as a threat to wild pollinators. Nature 2014, 506, 364–366. [Google Scholar] [CrossRef]
- Manley, R.; Boots, M.; Wilfert, L. Emerging viral disease risk to pollinating insects: Ecological, evolutionary, and anthropogenic factors. Annu. Rev. Entomol. 2019, 64, 243–264. [Google Scholar] [CrossRef]
- Tehel, A.; Brown, M.J.F.; Paxton, R.J. Impact of managed honey bee viruses on wild bees. Curr. Opin. Virol. 2016, 19, 16–22. [Google Scholar] [CrossRef]
- Graystock, P.; Blane, E.J.; McFrederick, Q.S.; Goulson, D.; Hughes, W.O. Do managed bees drive parasite spread and emergence in wild bees? Int. J. Parasitol. Parasites Wildl. 2016, 5, 64–75. [Google Scholar] [CrossRef]
- Mallinger, R.E.; Gaines-Day, H.R.; Gratton, C. Do managed bees have negative effects on wild bees?: A systematic review of the literature. PLoS ONE 2017, 12, e0189268. [Google Scholar] [CrossRef] [PubMed]
- Genersch, E.; Yue, C.; Fries, I.; de Miranda, J.R. Detection of Deformed Wing Virus, a Honey Bee Viral Pathogen, in Bumble Bees (Bombus Terrestris and Bombus Pascuorum) with Wing Deformities. J. Invertebr. Pathol. 2006, 91, 61–63. [Google Scholar] [CrossRef] [PubMed]
- Meeus, I.; de Miranda, J.R.; de Graaf, D.C.; Wäckers, F.; Smagghe, G. Effect of oral infection with Kashmir bee virus and Israeli acute paralysis virus on bumblebee (Bombus terrestris) reproductive success. J. Invertebr. Pathol. 2014, 121, 64–69. [Google Scholar] [CrossRef] [PubMed]
- Mazzei, M.; Carrozza, M.L.; Luisi, E.; Forzan, M.; Giusti, M.; Sagona, S.; Felicioli, A. Infectivity of DWV associated to flower pollen: Experimental evidence of a horizontal transmission route. PLoS ONE 2014, 9, e113448. [Google Scholar] [CrossRef]
- Martin, S.J.; Brettell, L.E. Deformed wing virus in honeybees and other insects. Annu. Rev. virol. 2019, 6, 49–69. [Google Scholar] [CrossRef]
- Klee, J.; Besana, A.M.; Genersch, E.; Gisder, S.; Nanetti, A.; Tam, D.Q.; Chinh, T.X.; Puerta, F.; Ruz, J.M.; Kryger, P.; et al. Widespread dispersal of the microsporidian Nosema ceranae, an emergent pathogen of the western honey bee, Apis mellifera. J. Invertebr. Pathol. 2007, 96, 1–10. [Google Scholar] [CrossRef]
- Porrini, M.P.; Porrini, L.P.; Garrido, P.M.; de Melo e Silva Neto, C.; Porrini, D.P.; Muller, F.; Eguaras, M.J. Nosema ceranae in South American native stingless bees and social wasp. Microb. Ecol. 2017, 74, 761–764. [Google Scholar] [CrossRef]
- Purkiss, T.; Lach, L. Pathogen spillover from Apis mellifera to a stingless bee. Proc. R. Soc. B Biol. Sci. 2019, 286, 20191071. [Google Scholar] [CrossRef]
- Plischuk, S.; Martın-Hernandez, R.; Prieto, L.; Lucıa, M.; Botıas, C.; Meana, A. South American native bumblebees (Hymenoptera: Apidae) infected by Nosema ceranae (Microsporidia), an emerging pathogen of honeybees (Apis mellifera). Environ. Microbiol. Rep. 2009, 1, 131–135. [Google Scholar] [CrossRef]
- Gisder, S.; Horchler, L.; Pieper, F.; Schüler, V.; Šima, P.; Genersch, E. Rapid gastrointestinal passage may protect Bombus terrestris from becoming a true host for Nosema ceranae. Appl. Environ. Microbiol. 2020, 86, e00629-20. [Google Scholar] [CrossRef]
- Bramke, K.; Müller, U.; McMahon, D.P.; Rolff, J. Exposure of larvae of the solitary bee Osmia bicornis to the honey bee pathogen Nosema ceranae affects life history. Insects 2019, 10, 380. [Google Scholar] [CrossRef] [PubMed]
- Yañez, O.; Piot, N.; Dalmon, A.; de Miranda, J.R.; Chantawannakul, P.; Panziera, D.; Amiri, E.; Smagghe, G.; Schroeder, D.; Chejanovsky, N. Bee Viruses: Routes of Infection in Hymenoptera. Front. Microbiol. 2020, 11, 943. [Google Scholar] [CrossRef] [PubMed]
- Tiritelli, R.; Flaminio, S.; Zavatta, L.; Ranalli, R.; Giovanetti, M.; Grasso, D.A.; Leonardi, S.; Bonforte, M.; Boni, C.B.; Cargnus, E.; et al. Ecological and social factors influence interspecific pathogens occurrence among bees. Sci. Rep. 2024, 14, 5136. [Google Scholar] [CrossRef]
- Warner, S.; Pokhrel, L.R.; Akula, S.M.; Ubah, C.S.; Richards, S.L.; Jensen, H.; Kearney, G.D. A scoping review on the effects of Varroa mite (Varroa destructor) on global honey bee decline. Sci. Total Environ. 2024, 906, 167492. [Google Scholar] [CrossRef]
- Traynor, K.S.; Mondet, F.; de Miranda, J.R.; Techer, M.; Kowallik, V.; Oddie, M.A.Y.; Chantawannakul, P.; McAfee, A. Varroa destructor: A complex parasite, crippling honey bees worldwide. Trends Parasitol. 2020, 36, 592–606. [Google Scholar] [CrossRef] [PubMed]
- Le Conte, Y.; Ellis, M.; Ritter, W. Varroa mites and honey bee health: Can Varroa explain part of the colony losses? Apidologie 2010, 41, 353–363. [Google Scholar] [CrossRef]
- Ribière, M.; Lallemand, P.; Iscache, A.L.; Schurr, F.; Celle, O.; Blanchard, P.; Faucon, J.P. Spread of infectious chronic bee paralysis virus by honeybee (Apis mellifera L.) feces. Appl. Environ. Microbiol. 2007, 73, 7711–7716. [Google Scholar] [CrossRef]
- Dolezal, A.G.; Hendrix, S.D.; Scavo, N.A.; Carrillo-Tripp, J.; Harris, M.A.; Wheelock, M.J.; Toth, A.L. Honey bee viruses in wild bees: Viral prevalence, loads, and experimental inoculation. PLoS ONE 2016, 11, e0166190. [Google Scholar] [CrossRef]
- Wilfert, L.; Long, G.; Leggett, H.C.; Schmid-Hempel, P.; Butlin, R.; Martin, S.J.; Boots, M. Deformed wing virus is a recent global epidemic in honeybees driven by Varroa mites. Science 2020, 351, 594–597. [Google Scholar] [CrossRef]
- Shen, M.; Yang, X.; Cox-Foster, D.; Cui, L. The role of varroa mites in infections of Kashmir bee virus (KBV) and deformed wing virus (DWV) in honey bees. Virology 2005, 342, 141–149. [Google Scholar] [CrossRef]
- Singh, R.; Levitt, A.L.; Rajotte, E.G.; Holmes, E.C.; Ostiguy, N.; van Engelsdorp, D.; Lipkin, W.I.; de Pamphilis, C.W.; Toth, A.L.; Cox-Foster, D.L. RNA Viruses in Hymenopteran Pollinators: Evidence of Inter-Taxa Virus Transmission via Pollen and Potential Impact on Non-Apis Hymenopteran Species. PLoS ONE 2010, 5, e14357. [Google Scholar] [CrossRef] [PubMed]
- Cohen, H.; Ponisio, L.C.; Russell, K.A.; Philpott, S.M.; McFrederick, Q.S. Floral resources shape parasite and pathogen dynamics in bees facing urbanization. Mol. Ecol. 2022, 31, 2157–2171. [Google Scholar] [CrossRef] [PubMed]
- Alger, S.A.; Burnham, P.A.; Boncristiani, H.F.; Brody, A.K. RNA virus spillover from managed honeybees (Apis mellifera) to wild bumblebees (Bombus sp.). PLoS ONE 2019, 14, e0217822. [Google Scholar] [CrossRef] [PubMed]
- Balkanska, R.; Shumkova, R.; Atsenova, N.; Salkova, D.; Dundarova, H.; Radoslavov, G.; Hristov, P. Molecular Detection and Phylogenetic Analysis of Deformed Wing Virus and Sacbrood Virus Isolated from Pollen. Vet. Sci. 2023, 10, 140. [Google Scholar] [CrossRef]
- Power, K.; Altamura, G.; Martano, M.; Maiolino, P. Detection of honeybee viruses in Vespa orientalis. Front. Cell. Infect. Microbiol. 2022, 12, 896932. [Google Scholar] [CrossRef]
- Evison, S.E.F.; Roberts, K.E.; Laurenson, L.; Pietravalle, S.; Hui, J.; Biesmeijer, J.C.; Smith, J.E.; Budge, G.; Hughes, W.O.H. Pervasiveness of parasites in pollinators. PLoS ONE 2012, 7, e30641. [Google Scholar] [CrossRef]
- Comune di Milano, 2.21 Contesto Geografico. Available online: https://www.pgt.comune.milano.it/vasraall2-quadro-di-riferimento-territoriale-e-ambientale/2-analisi-dei-fattori-determinanti/22-contesto-urbano-demografico-e-socio-economico/221-contesto-geografico (accessed on 13 December 2024).
- Milano Geoportale. 2024. Available online: https://geoportale.comune.milano.it/sit/dettagli/?uuid=C_F205%3ASIT_CENTRALE_M201280017%3A20160427 (accessed on 13 December 2024).
- Staccione, A.; Essenfelder, A.H.; Bagli, S.; Mysiak, J. Connected urban green spaces for pluvial flood risk reduction in the Metropolitan area of Milan. Sustain. Cities Soc. 2024, 104, 105288. [Google Scholar] [CrossRef]
- Collezione Botanica—Bam. 2024. Available online: https://bam.milano.it/collezione-botanica/ (accessed on 13 December 2024).
- Bosch, J.; Blas, M. Foraging behaviour and pollinating efficiency of Osmia cornuta and Apis mellifera on almond (Hymenoptera, Megachilidae and Apidae). Appl. Entomol. Zool. 1994, 29, 1–9. [Google Scholar] [CrossRef]
- Vicens, N.; Bosch, J. Weather-dependent pollinator activity in an apple orchard, with special reference to Osmia cornuta and Apis mellifera (Hymenoptera: Megachilidae and Apidae). Environ. Entomol. 2000, 29, 413–420. [Google Scholar] [CrossRef]
- Messan, K.; Messan, M.R.; Chen, J.; DeGrandi-Hoffman, G.; Kang, Y. Population dynamics of Varroa mite and honeybee: Effects of parasitism with age structure and seasonality. Ecol. Model. 2021, 440, 109359. [Google Scholar] [CrossRef]
- Fries, I.; Chauzat, M.P.; Chen, Y.P.; Doublet, V.; Genersch, E.; Gisder, S.; Higes, M.; Mcmahon, D.P.; Martin-Hernandez, R.; Natsopoulou, M.; et al. Standard methods for Nosema research. J. Apic. Res. 2013, 52, 1–28. [Google Scholar] [CrossRef]
- Lavazza, A.; Botti, G.; Milani, N.; Gamba, D.; Ball, B.V.; Capucci, L. The identification and characterization of deformed wing virus in Italian Honey bees as a preliminary step for the production of specific reagents and the establishment of diagnostic methods. In Proceedings of the Abstracts 38th International Congress of Apimondia, Ljubljana, Slovenia, 24–29 August 2003. [Google Scholar]
- Cilia, G.; Tafi, E.; Zavatta, L.; Dettori, A.; Bortolotti, L.; Nanetti, A. Seasonal trends of the ABPV, KBV, and IAPV complex in Italian managed honey bee (Apis mellifera L.) colonies. Arch. Virol. 2024, 169, 43. [Google Scholar] [CrossRef] [PubMed]
- Lavazza, A.; Pascucci, S.; Gelmetti, D. Rod-shaped virus-like particles in intestinal contents of three avian species. Vet. Rec. 1990, 126, 581. [Google Scholar] [PubMed]
- Carpana, E.; Vecchi, M.A.; Lavazza, A.; Bassi, S.; Dottori, M. Prevalence of acute paralysis virus and other viral infections in honeybees in Italy. In Proceedings of the International Symposium on Recent Research on Bee Pathology, Gent, Belgium, 5–7 September 1990; pp. 155–165. [Google Scholar]
- Lavazza, A.; Tittarelli, C.; Cerioli, M. The Use of Convalescent Sera in Immune-Electron Microscopy to Detect Non-Suspected/New Viral Agents. Viruses 2015, 7, 2683–2703. [Google Scholar] [CrossRef] [PubMed]
- Martinello, M.; Baratto, C.; Manzinello, C.; Piva, E.; Borin, A.; Toson, M.; Mutinelli, F. Spring mortality in honey bees in northeastern Italy: Detection of pesticides and viruses in dead honey bees and other matrices. J. Apic. Res. 2017, 56, 239–254. [Google Scholar] [CrossRef]
- Blanchard, P.; Ribière, M.; Celle, O.; Lallemand, P.; Schurr, F.; Olivier, V.; Iscache, A.L.; Faucon, J.P. Evaluation of a real-time two-step RT-PCR assay for quantitation of Chronic bee paralysis virus (CBPV) genome in experimentally-infected bee tissues and in life stages of a symptomatic colony. J. Virol. Methods 2007, 141, 7–13. [Google Scholar] [CrossRef]
- Berényi, O.; Bakonyi, T.; Derakhshifar, I.; Köglberger, H.; Nowotny, N. Occurrence of six honeybee viruses in diseased Austrian apiaries. Appl. Environ. Microbiol. 2006, 72, 2414–2420. [Google Scholar] [CrossRef]
- Genersch, E.; Von Der Ohe, W.; Kaatz, H.; Schroeder, A.; Otten, C.; Büchler, R.; Rosenkranz, P. The German bee monitoring project: A long term study to understand periodically high winter losses of honey bee colonies. Apidologie 2010, 41, 332–352. [Google Scholar] [CrossRef]
- Webster, T.C.; Pomper, K.W.; Hunt, G.; Thacker, E.M.; Jones, S.C. Nosema apis infection in worker and queen Apis mellifera. Apidologie 2004, 35, 49–54. [Google Scholar] [CrossRef]
- Martín-Hernández, R.; Meana, A.; Prieto, L.; Salvador, A.M.; Garrido-Bailón, E.; Higes, M. Outcome of colonization of Apis mellifera by Nosema ceranae. Appl. Environ. Microbiol. 2007, 73, 6331–6338. [Google Scholar] [CrossRef]
- RStudio Team. RStudio: Integrated Development for R. 2020. Available online: http://www.rstudio.com/ (accessed on 10 January 2025).
- Dormann, C.; Gruber, B.; Fruend, J. Introducing the bipartite Package: Analysing Ecological Networks. R News 2008, 8, 8–11. Available online: https://cran.r-project.org/web/packages/bipartite/index.html (accessed on 10 January 2024).
- Olesen, J.M.; Bascompte, J.; Dupont, Y.L.; Jordano, P. The modularity of pollination networks. Proc. Natl. Acad. Sci. USA 2007, 104, 19891–19896. [Google Scholar] [CrossRef] [PubMed]
- Dormann, C.F. Using Bipartite to Describe and Plot Two-Mode Networks in R. 2020. Available online: https://cloud.r-project.org/web/packages/bipartite/vignettes/Intro2bipartite.pdf (accessed on 10 January 2025).
- Suárez-Mariño, A.; Arceo-Gómez, G.; Albor, C.; Parra-Tabla, V. Co-flowering modularity and floral trait similarity help explain temporal changes in plant–pollinator network structure. Plant Ecol. 2022, 223, 1289–1304. [Google Scholar] [CrossRef]
- Carvalheiro, L.G.; Biesmeijer, J.C.; Benadi, G.; Fründ, J.; Stang, M.; Bartomeus, I.; Kunin, W.E. The potential for indirect effects between co-flowering plants via shared pollinators depends on resource abundance, accessibility and relatedness. Ecol. Lett. 2014, 17, 1389–1399. [Google Scholar] [CrossRef]
- Zakardjian, M.; Geslin, B.; Mitran, V.; Franquet, E.; Jourdan, H. Effects of urbanization on plant–pollinator interactions in the tropics: An experimental approach using exotic plants. Insects 2020, 11, 773. [Google Scholar] [CrossRef]
- Ropars, L.; Affre, L.; Thébault, É.; Geslin, B. Seasonal dynamics of competition between honey bees and wild bees in a protected Mediterranean scrubland. Oikos 2022, 2022, e08915. [Google Scholar] [CrossRef]
- Schurr, F.; Tison, A.; Militano, L.; Cheviron, N.; Sircoulomb, F.; Rivière, M.P.; Ribière-Chabert, M.; Thiéry, R.; Dubois, E. Validation of quantitative real-time RT-PCR assays for the detection of six honeybee viruses. J. Virol. Methods 2019, 270, 70–78. [Google Scholar] [CrossRef]
- Ayers, A.C.; Rehan, S.M. Supporting bees in cities: How bees are influenced by local and landscape features. Insects 2021, 12, 128. [Google Scholar] [CrossRef]
- Graf, L.V.; Meyer, F.S.; Jeronimo, F.F.; Gonçalves, R.B. Urbanization as a driver of changes in mutualistic networks between bees and plants. Urban Ecosyst. 2025, 28, 30. [Google Scholar] [CrossRef]
- Graffigna, S.; González-Vaquero, R.A.; Torretta, J.P.; Marrero, H.J. Importance of urban green areas’ connectivity for the conservation of pollinators. Urban Ecosyst. 2024, 27, 417–426. [Google Scholar] [CrossRef]
- Threlfall, C.G.; Walker, K.; Williams, N.S.; Hahs, A.K.; Mata, L.; Stork, N.; Livesley, S.J. The conservation value of urban green space habitats for Australian native bee communities. Biol. Conserv. 2015, 187, 240–248. [Google Scholar] [CrossRef]
- Banaszak-Cibicka, W.; Ratyńska, H.; Dylewski, Ł. Features of urban green space favourable for large and diverse bee populations (Hymenoptera: Apoidea: Apiformes). Urban For. Urban Green 2016, 20, 448–452. [Google Scholar] [CrossRef]
- Dalmon, A.; Peruzzi, M.; Le Conte, Y.; Alaux, C.; Pioz, M. Temperature-driven changes in viral loads in the honey bee Apis mellifera. J. Iinvertebr. Pathol. 2019, 160, 87–94. [Google Scholar] [CrossRef]
- Chen, G.; Wu, Y.; Deng, J.; Wen, Z.; Wang, S.; Chen, Y.; Zheng, H. Seasonal variation of viral infections between the eastern honey bee (Apis cerana) and the western honey bee (Apis mellifera). Microbiologyopen 2021, 10, e1162. [Google Scholar] [CrossRef] [PubMed]
- Piot, N.; Schweiger, O.; Meeus, I.; Yañez, O.; Straub, L.; Villamar-Bouza, L.; De Miranda, J.R. Honey bees and climate explain viral prevalence in wild bee communities on a continental scale. Sci. Rep. 2022, 12, 1904. [Google Scholar] [CrossRef] [PubMed]
- Gisder, S.; Genersch, E. Viruses of commercialized insect pollinators. J. Invertebr. Pathol. 2017, 147, 51–59. [Google Scholar] [CrossRef]
- McMahon, D.P.; Fürst, M.A.; Caspar, J.; Theodorou, P.; Brown, M.J.F.; Paxton, R.J. A sting in the spit: Widespread cross-infection of multiple RNA viruses across wild and managed bees. J. Anim. Ecol. 2015, 84, 615–624. [Google Scholar] [CrossRef]
- Bailey, L.; Gibbs, A.J. Acute infection of bees with paralysis virus. J. Invertebr. Pathol. 1964, 6, 395–407. [Google Scholar]
- Ball, B.V. Acute paralysis virus isolates from honeybee colonies infested with Varroa jacobsoni. J. Apic. Res. 1985, 24, 115–119. [Google Scholar] [CrossRef]
- de Miranda, J.; Cordoni, G.; Budge, G. The acute bee paralysis virus—Kashmir bee virus—Israeli acute paralysis virus complex. J. Invertebr. Pathol 2010, 103, S30–S47. [Google Scholar] [CrossRef]
- Sachman-Ruiz, B.; Narvaez-Padilla, V.; Reynaud, E. Commercial Bombus impatiens as reservoirs of emerging infectious diseases in central Mexico. Biol. Invasions 2015, 17, 2043–2053. [Google Scholar] [CrossRef]
- Guzman-Novoa, E.; Hamiduzzaman, M.M.; Anguiano-Baez, R.; Correa-Benitez, A.; Castaneda-Cervantes, E.; Arnold, N.I. First detection of honey bee viruses in stingless bees in North America. J. Apic. Res. 2015, 54, 93–95. [Google Scholar] [CrossRef]
- Gamboa, V.; Ravoet, J.; Brunain, M.; Smagghe, G.; Meeus, I.; Figueroa, J.; Riaño, D.; de Graaf, D.C. Bee pathogens found in Bombus atratus from Colombia: A case study. J. Invertebr. pathol. 2015, 129, 36–39. [Google Scholar] [CrossRef] [PubMed]
- Gusachenko, O.N.; Woodford, L.; Balbirnie-Cumming, K.; Kyabov, E.V.; Evans, D.J. Evidence for and against deformed wing virus spillover from honey bees to bumble bees: A reverse genetic analysis. Sci. Rep. 2020, 10, 16847. [Google Scholar] [CrossRef]
- Cilia, G.; Flaminio, S.; Zavatta, L.; Ranalli, R.; Quaranta, M.; Bortolotti, L.; Nanetti, A. Occurrence of honey bee (Apis mellifera L.) pathogens in wild pollinators in northern Italy. Front. Cell. Infect. Microbiol. 2022, 12, 907489. [Google Scholar] [CrossRef]
- De Souza, R.S.; Kevill, J.L.; Correia-Aveira, M.E.; de Carvalho, C.A.L.; Martin, S.J. Occurrence of deformed wing virus variants in the stingless bee Melipona subnitida and honey bee Apis mellifera populations in Brazil. J. Gen. Virol. 2019, 100, 289–294. [Google Scholar] [CrossRef]
- Levitt, A.L.; Singh, R.; Cox-Foster, D.L.; Rajotte, E.; Hoover, K.; Ostiguy, N.; Holmes, E.C. Cross-species transmission of honey bee viruses in associated arthropods. Virus Res. 2013, 176, 232–240. [Google Scholar] [CrossRef]
- Peng, W.; Li, J.; Boncristiani, H.; Strange, J.P.; Hamilton, M.; Chen, Y. Host range expansion of honey bee black queen cell virus in the bumble bee, Bombus huntii. Apidologie 2011, 42, 650–658. [Google Scholar] [CrossRef]
- Tapia-González, J.M.; Morfin, N.; Macías-Macías, J.O.; De la Mora, A.; Tapia-Rivera, J.C.; Ayala, R.; Contreras-Escareño, F.; Gashout, H.A.; Guzman-Novoa, E. Evidence of presence and replication of honey bee viruses among wild bee pollinators in subtropical environments. J. Invertebr. Pathol. 2019, 168, 107256. [Google Scholar] [CrossRef]
- Bailey, L.; Gibbs, A.J.; Woods, R.D. Two viruses from adult honey bees (Apis mellifera Linnaeus). Virology 1963, 21, 390–395. [Google Scholar] [CrossRef]
- Ribiere, M.; Olivier, V.; Blanchard, P. Chronic bee paralysis virus: A disease and a virus like no other? J. Invertebr. Pathol. 2010, 103, S120–S131. [Google Scholar] [CrossRef] [PubMed]
- Wang, T.-S.; Shi, T.-F.; Liu, F.; Yu, L.-S.; Qi, L.; Meng, X.-J. Occurrence and distribution of seven bee viruses in Apis mellifera and Apis cerana in Anhui Province, China. Chin. J. Appl. Entomol. 2015, 52, 324–332. [Google Scholar]
- Choi, Y.S.; Lee, M.Y.; Hong, I.P.; Kim, N.S.; Kim, H.K.; Byeon, K.H.; Yoon, H. Detection of honey bee virus from bumblebee (Bombus terrestris and Bombus ignitus). Korean J. Apic. 2010, 25, 259–266. [Google Scholar]
- Celle, O.; Blanchard, P.; Olivier, V.; Schurr, F.; Cougoule, N.; Faucon, J.P.; Ribiere, M. Detection of chronic bee paralysis virus (CBPV) genome and its replicative RNA form in various hosts and possible ways of spread. Virus Res. 2008, 133, 280–284. [Google Scholar] [CrossRef] [PubMed]
- Mondet, F.; de Miranda, J.R.; Kretzschmar, A.; Le Conte, Y.; Mercer, A.R. On the front line: Quantitative virus dynamics in honey bee (Apis mellifera L.) colonies along a new expansion front of the parasite Varroa destructor. PloS Pathog. 2014, 10, e1004323. [Google Scholar] [CrossRef]
- Shen, M.; Cui, L.; Ostiguy, N.; Cox-Foster, D. Intricate transmission routes and interactions between picorna-like viruses (Kashmir bee virus and sacbrood virus) with the honeybee host and the parasitic varroa mite. J. Gen. Virol. 2005, 86, 2281–2289. [Google Scholar] [CrossRef]
- Reynaldi, F.J.; Sguazza, G.H.; Albicoro, F.J.; Pecoraro, M.R.; Galosi, C.M. First molecular detection of co-infection of honey bee viruses in asymptomatic Bombus atratus in South America. Braz. J. Biol. 2013, 73, 797–800. [Google Scholar] [CrossRef]
- Ravoet, J.; De Smet, L.; Meeus, I.; Smagghe, G.; Wenseleers, T.; de Graaf, D.C. Widespread occurrence of honey bee pathogens in solitary bees. J. Invertebr. Pathol. 2014, 122, 55–58. [Google Scholar] [CrossRef]
- Chaimanee, V.; Warrit, N.; Chantawannakul, P. Infections of Nosema ceranae in four different honeybee species. J. Invertebr. Pathol. 2010, 105, 207–210. [Google Scholar] [CrossRef]
- Forsgren, E.; Fries, I. Comparative virulence of Nosema ceranae and Nosema apis in individual European honey bees. Vet. Parasitol. 2010, 170, 212–217. [Google Scholar] [CrossRef]
- Shykoff, J.A.; Schmid-Hempel, P. Incidence and effects of four parasites in natural populations of bumble bees in Switzerland. Apidologie 1991, 22, 117–125. [Google Scholar] [CrossRef]
- Otti, O.; Schmid-Hempel, P. Nosema bombi: A pollinator parasite with detrimental fitness effects. J. Invertebr. Pathol. 2007, 96, 118–124. [Google Scholar] [CrossRef] [PubMed]
- Li, J.; Chen, W.; Wu, J.; Peng, W.; An, J.; Schmid-Hempel, P.; Schmid-Hempel, R. Diversity of Nosema associated with bumblebees (Bombus sp.) from China. Int. J. Parasitol. 2012, 42, 49–61. [Google Scholar] [CrossRef] [PubMed]
- Brown, M.J.F. Microsporidia: An Emerging Threat to Bumblebees? Trends Parasitol. 2017, 33, 754–762. [Google Scholar] [CrossRef]
- Martín-Hernández, R.; Bartolomé, C.; Chejanovsky, N.; Le Conte, Y.; Dalmon, A.; Dussaubat, C.; Higes, M. Nosema ceranae in Apis mellifera: A 12 years post detection perspective. Environ. Microbiol. 2018, 1302–1329. [Google Scholar] [CrossRef]
- Grupe, A.C., II; Quandt, C.A. A growing pandemic: A review of Nosema parasites in globally distributed domesticated and native bees. PLoS Pathog. 2020, 16, e1008580. [Google Scholar] [CrossRef]
- Maurer, C.; Schauer, A.; Yañez, O.; Neumann, P.; Gajda, A.; Paxton, R.J.; Pellissier, L.; Schweiger, O.; Szentgyörgyi, H.; Vanbergen, A.J.; et al. Species traits, landscape quality and floral resource overlap with honeybees determine virus transmission in plant–pollinator networks. Nat. Ecol. Evol. 2024, 8, 2239–2251. [Google Scholar] [CrossRef]
- Bosco, L.; Yañez, O.; Schauer, A.; Maurer, C.; Cushman, S.A.; Arlettaz, R.; Schläppi, D. Landscape structure affects temporal dynamics in the bumble bee virome: Landscape heterogeneity supports colony resilience. Sci. Total Environ. 2024, 946, 174280. [Google Scholar] [CrossRef]
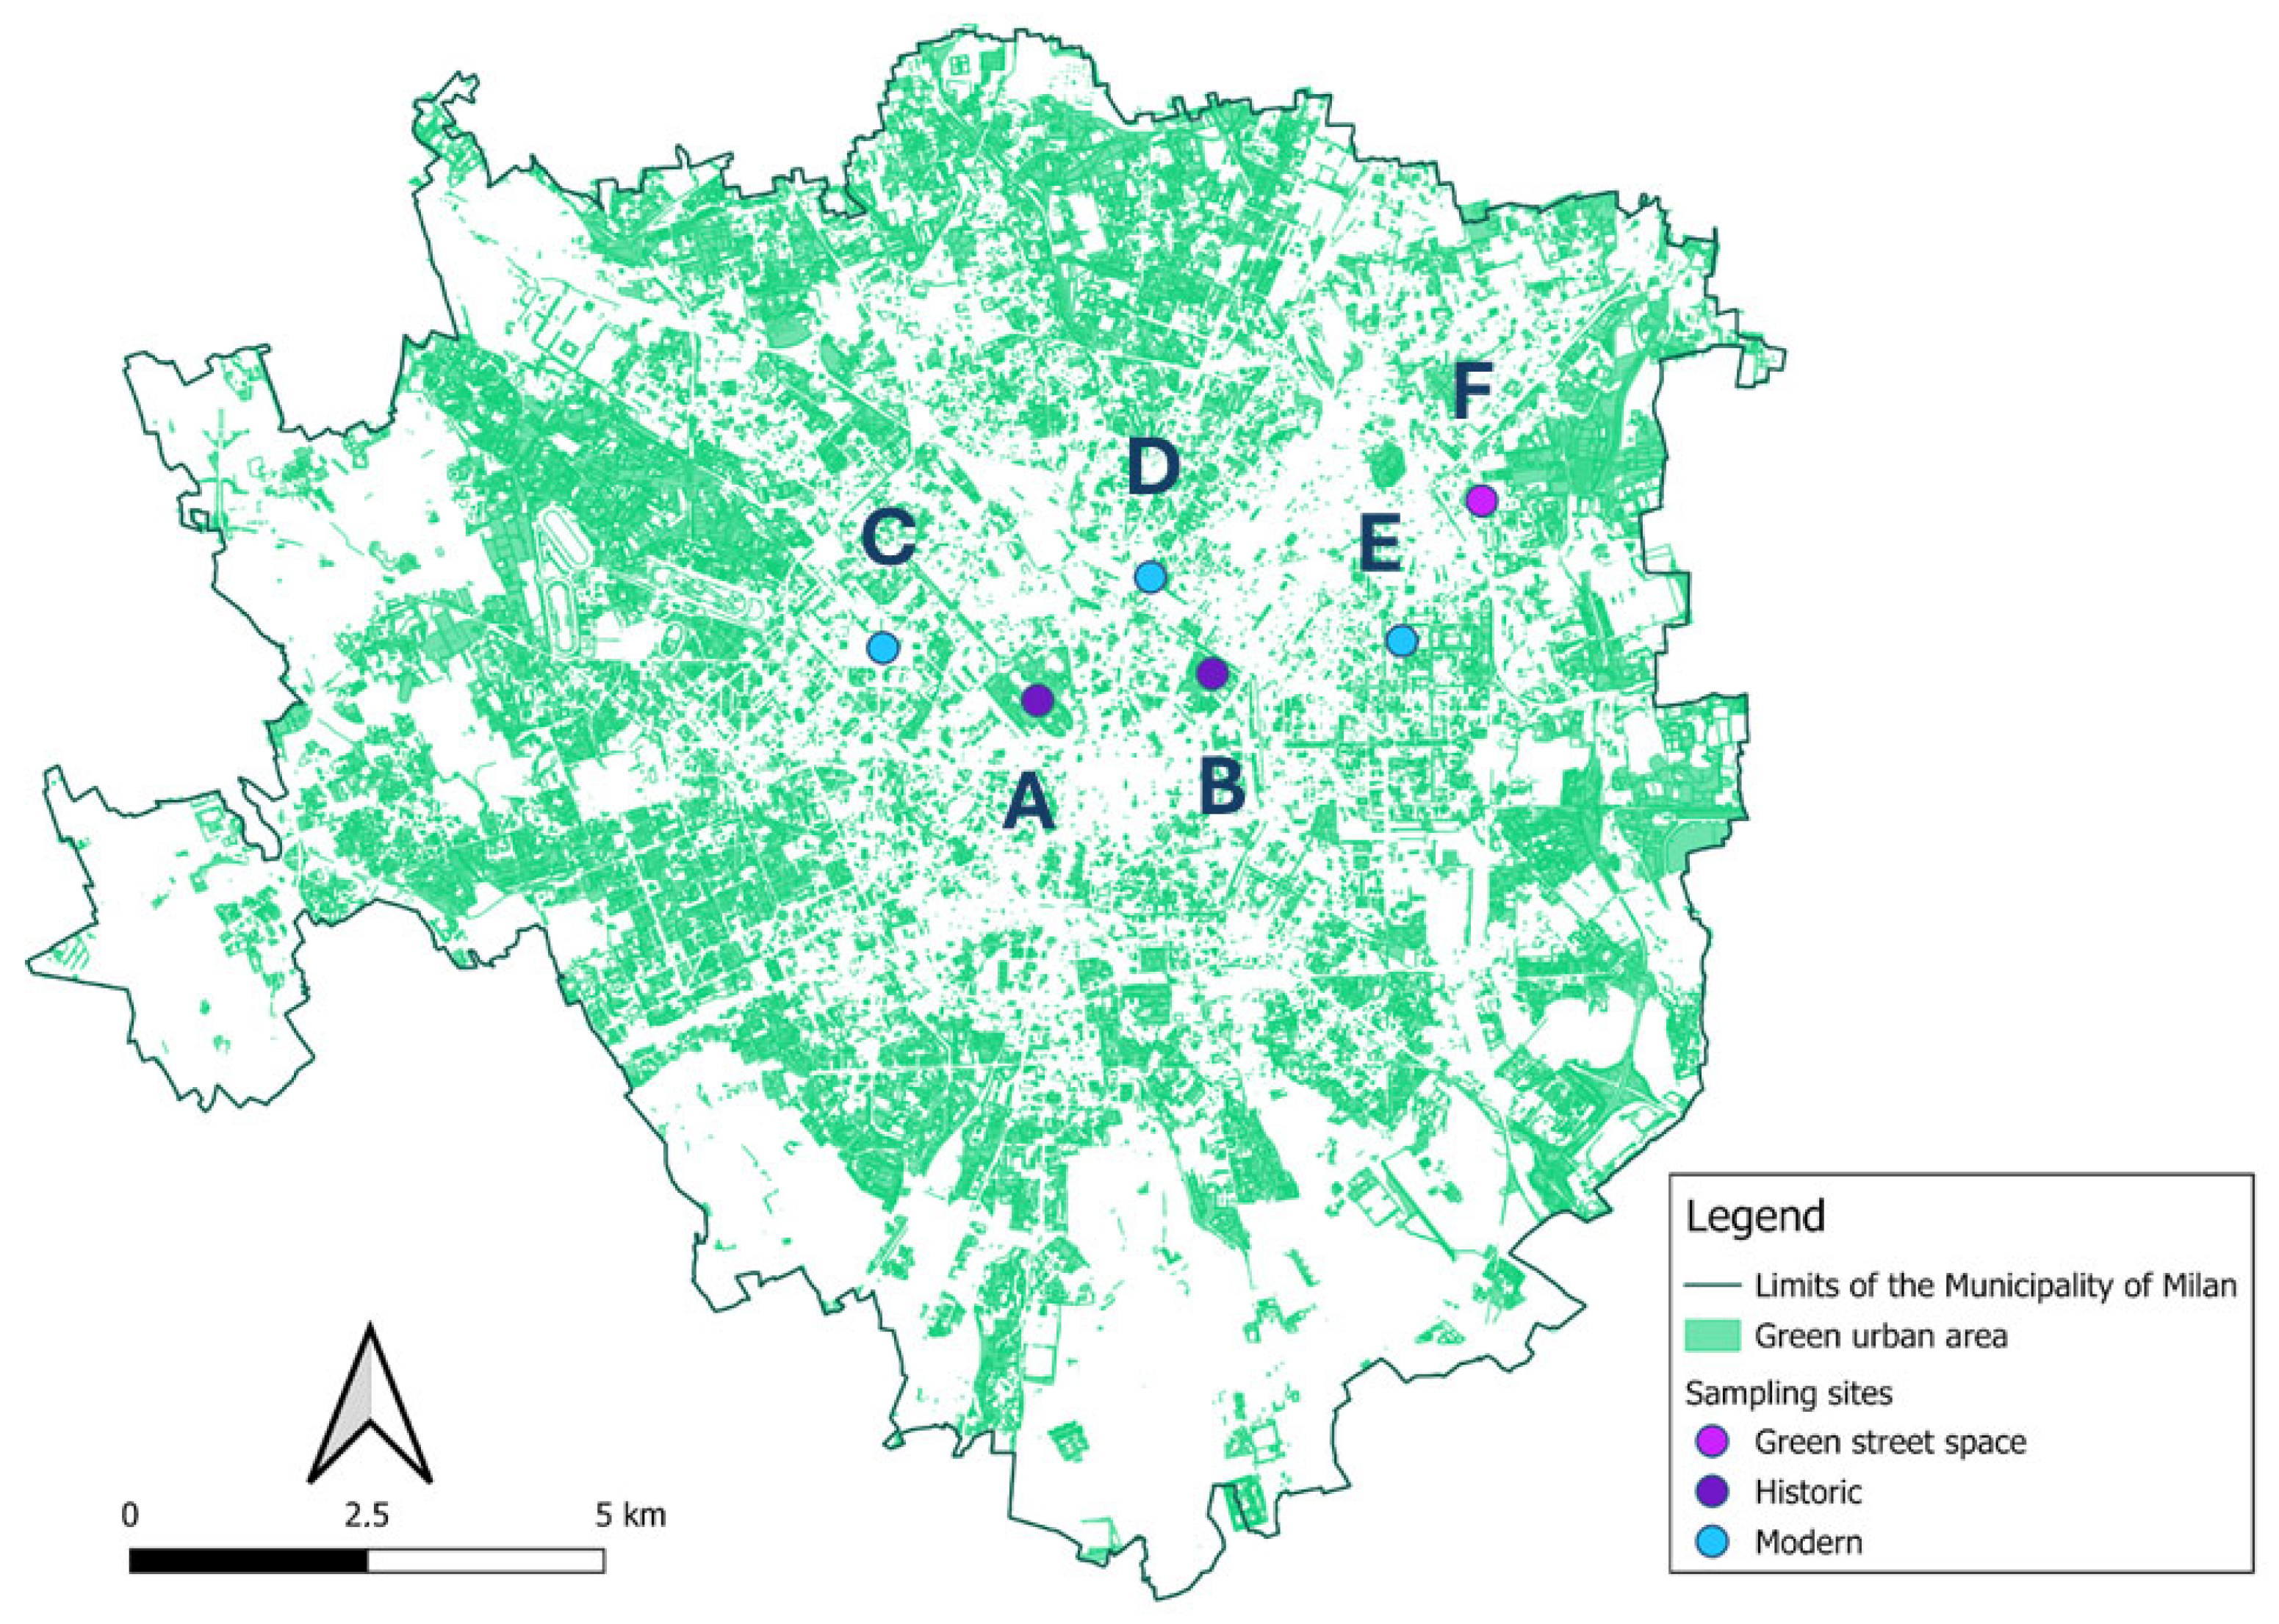
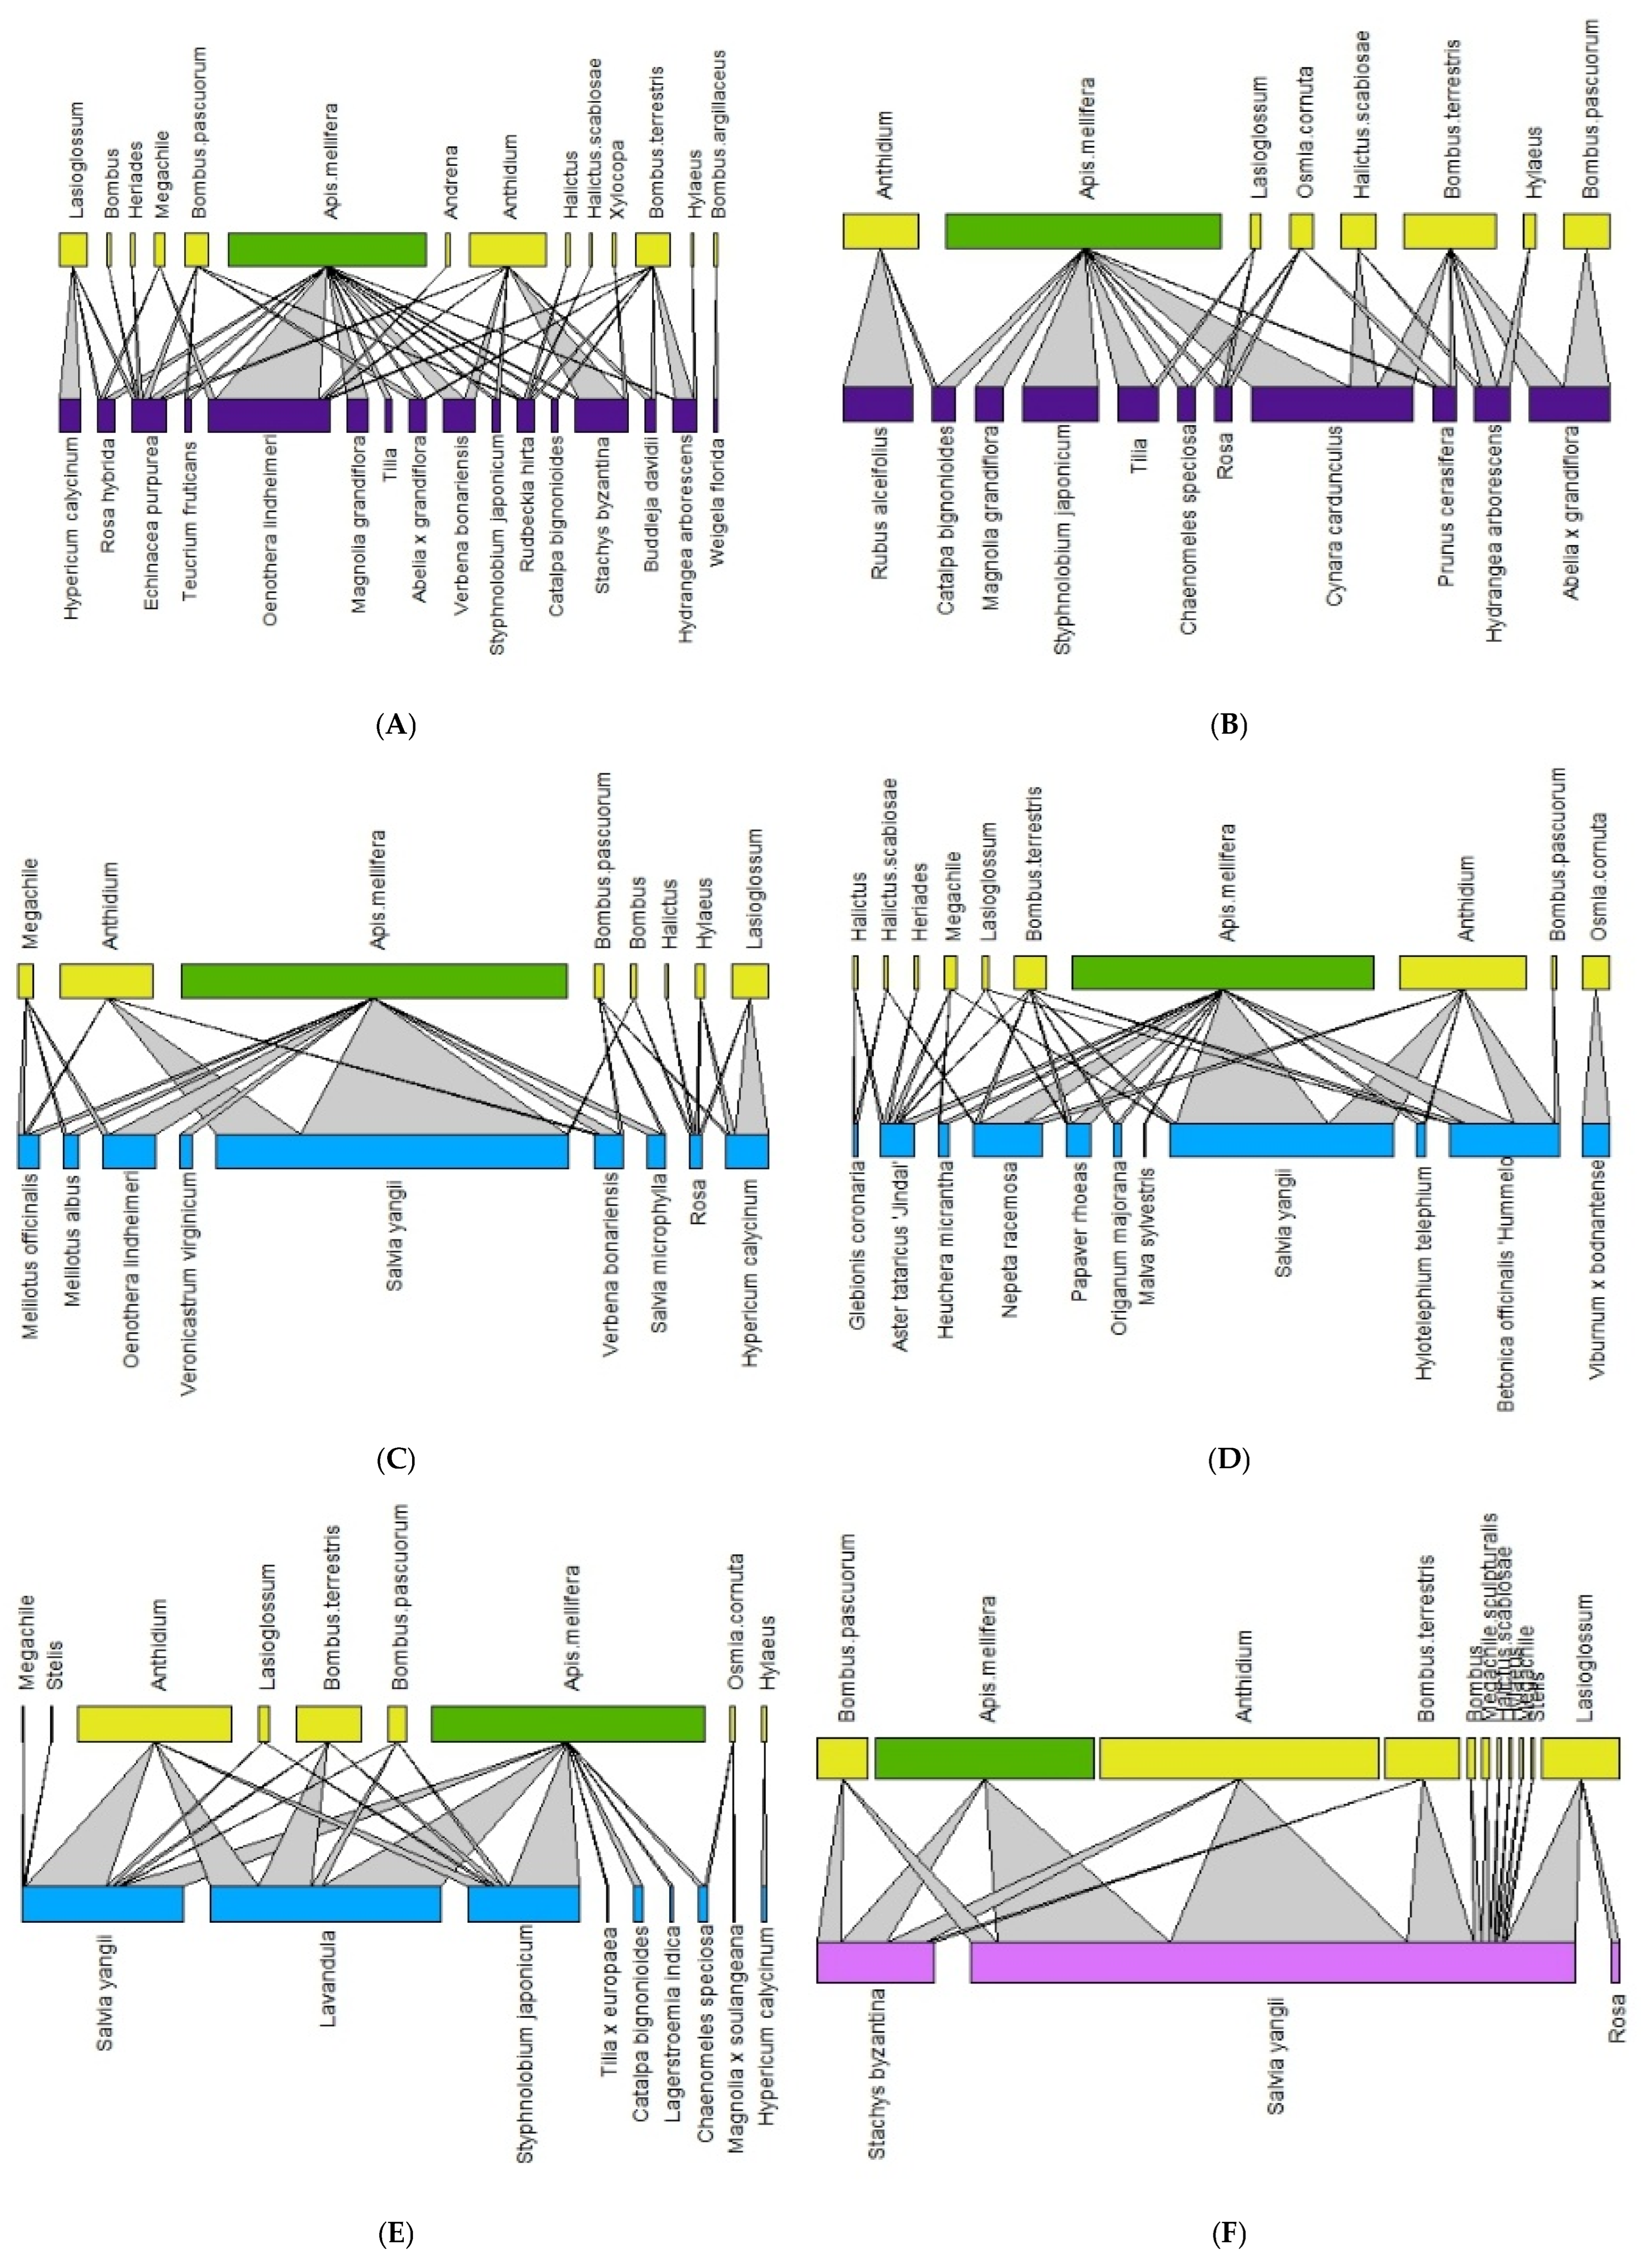
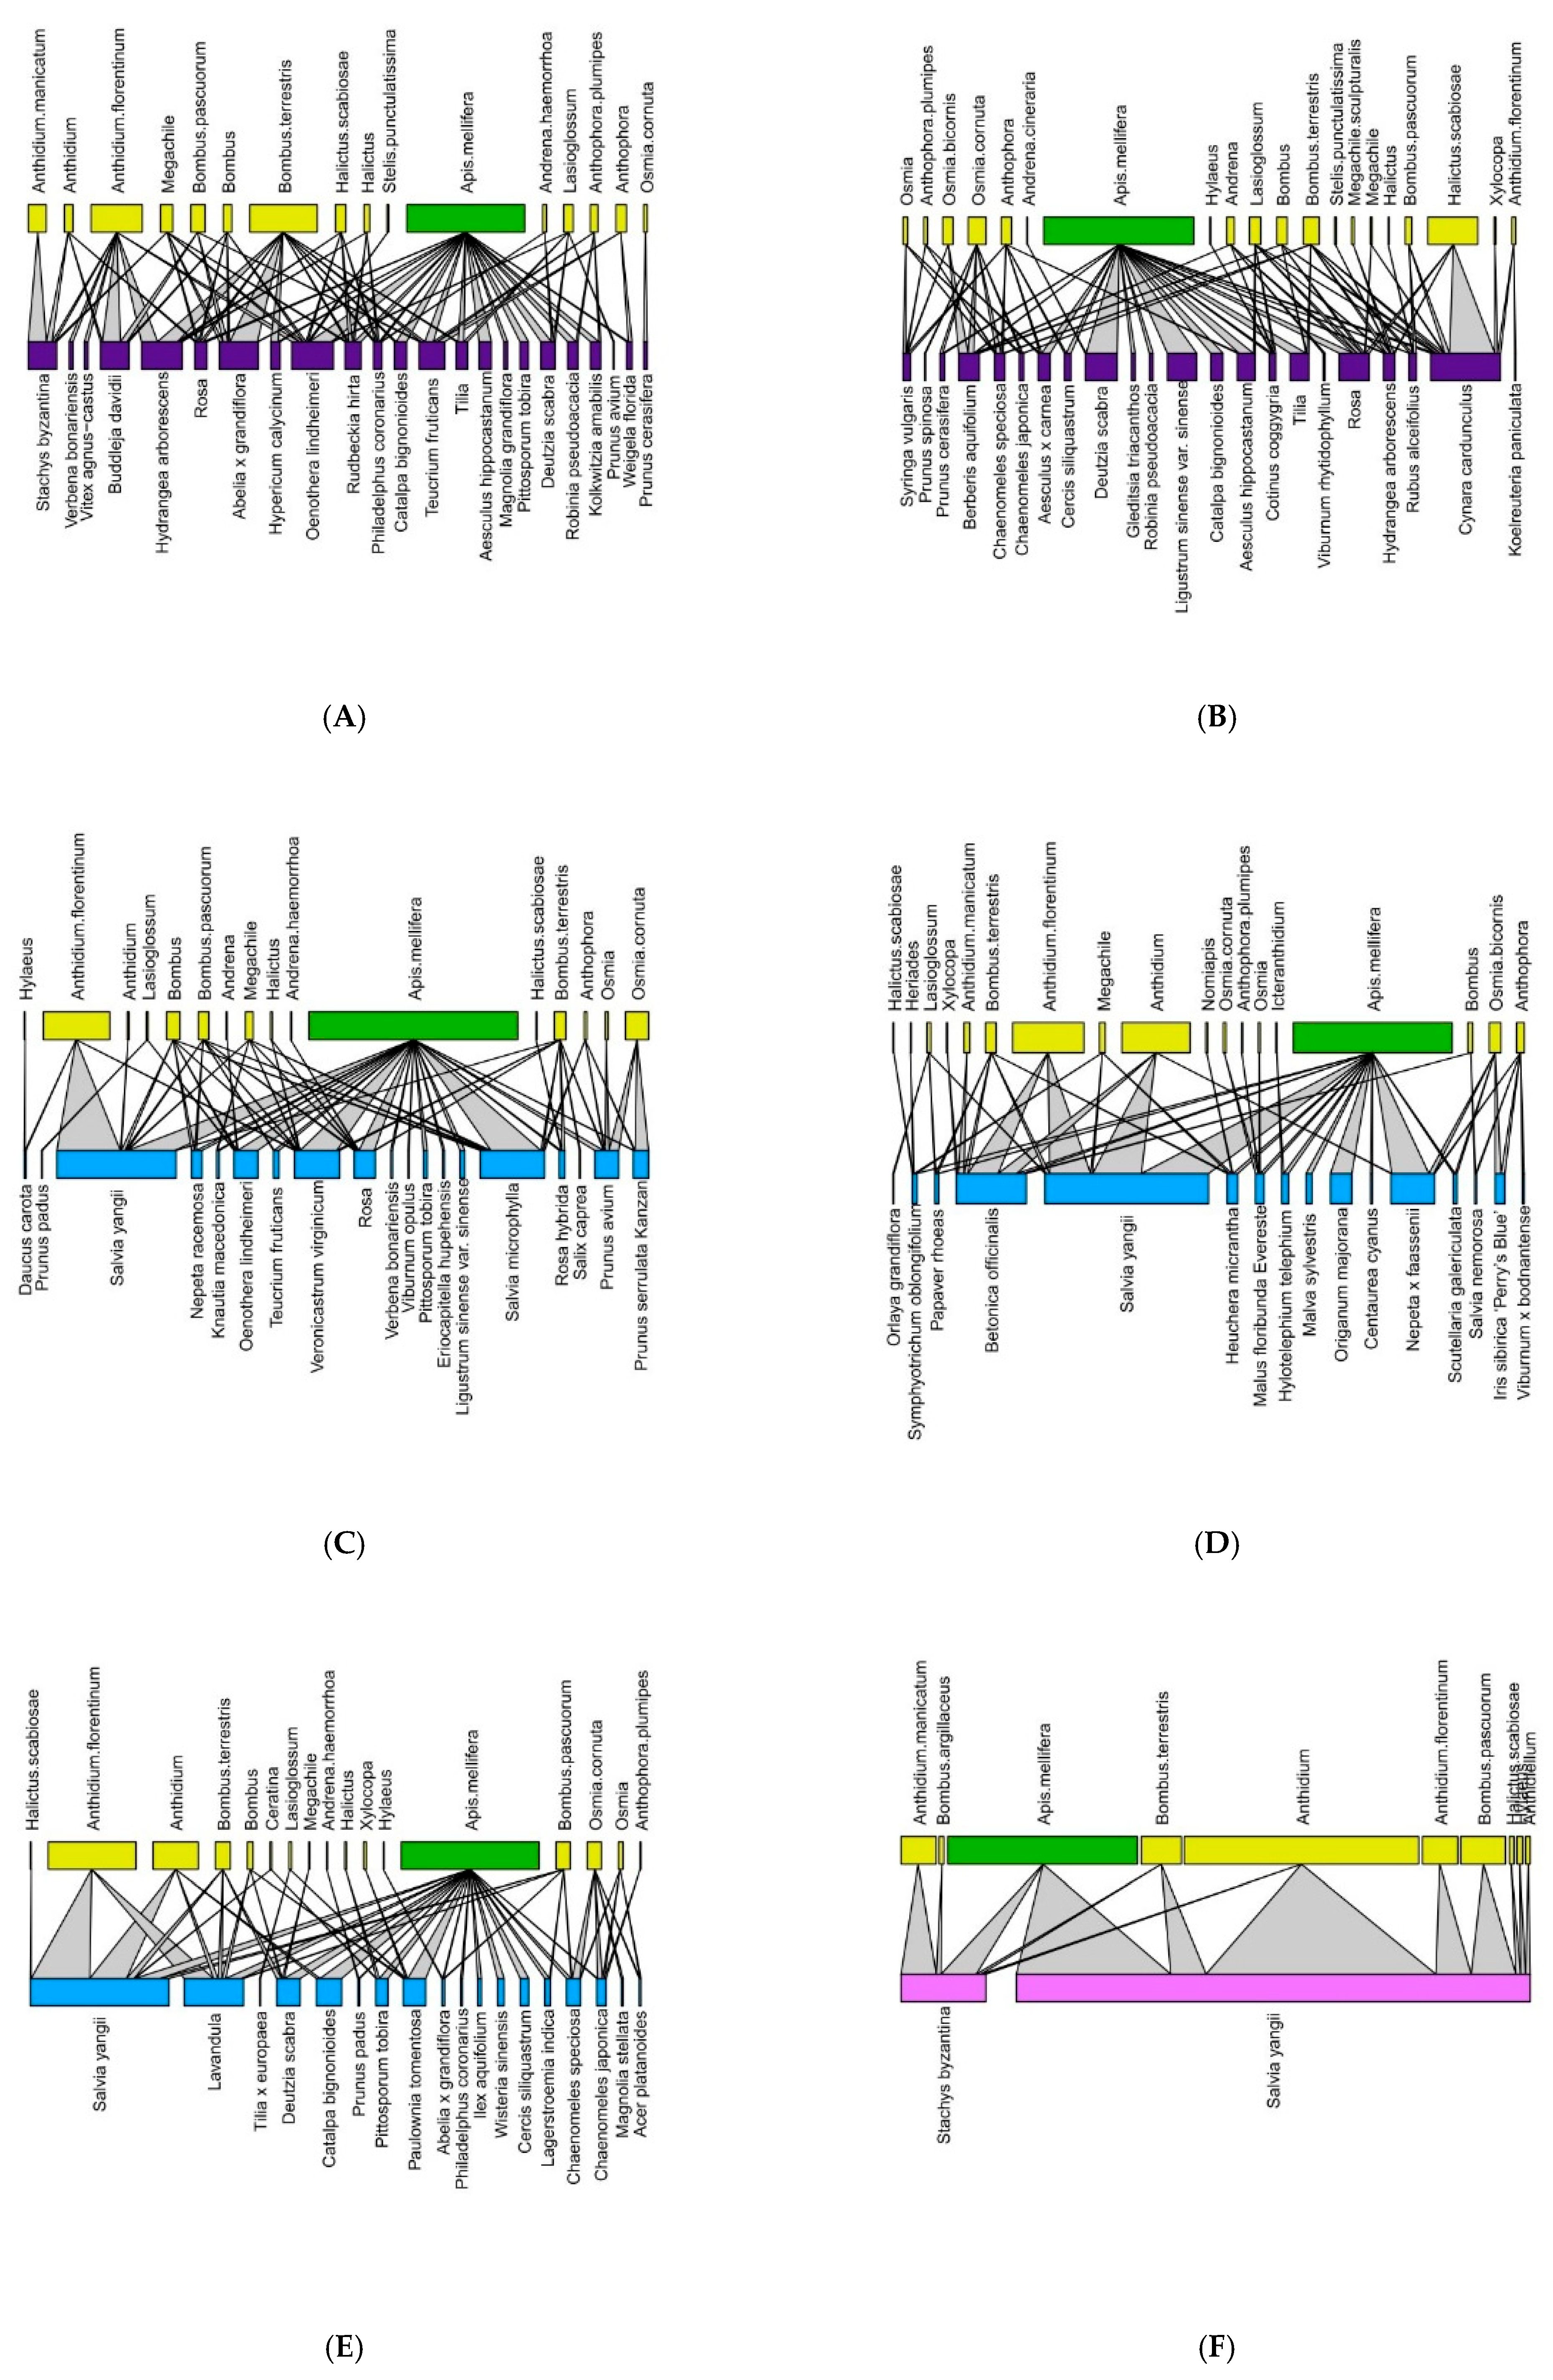
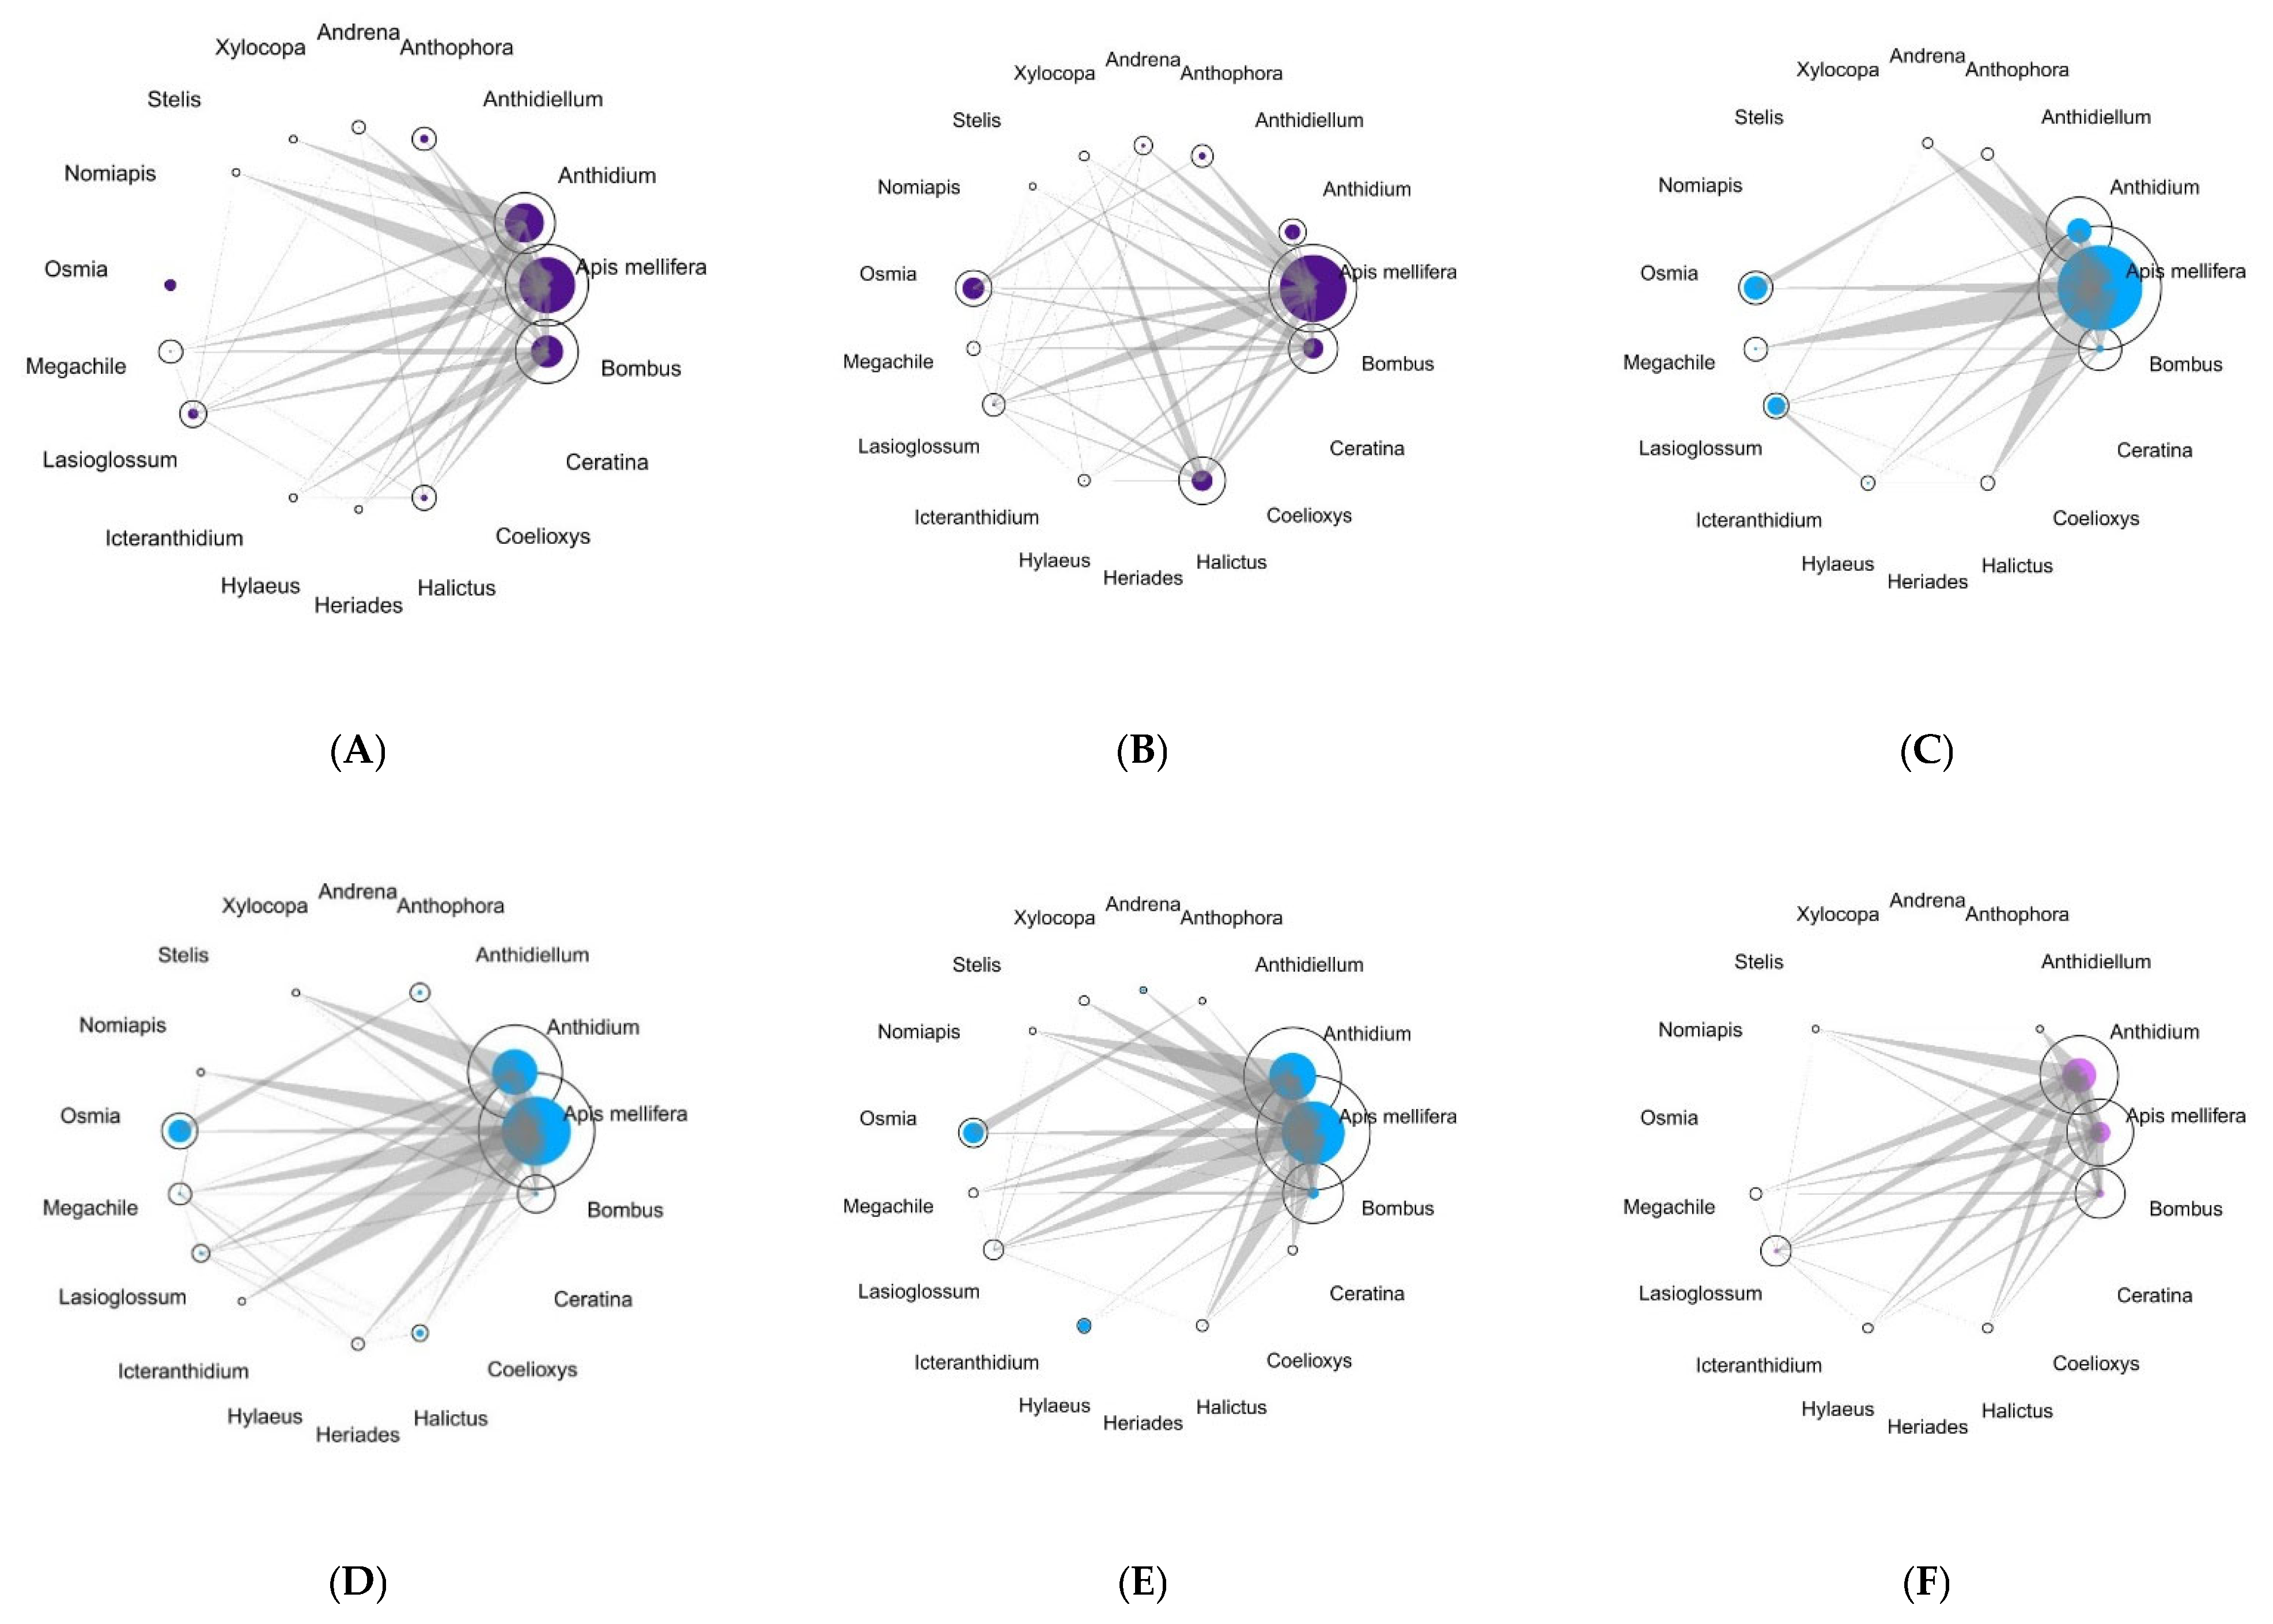
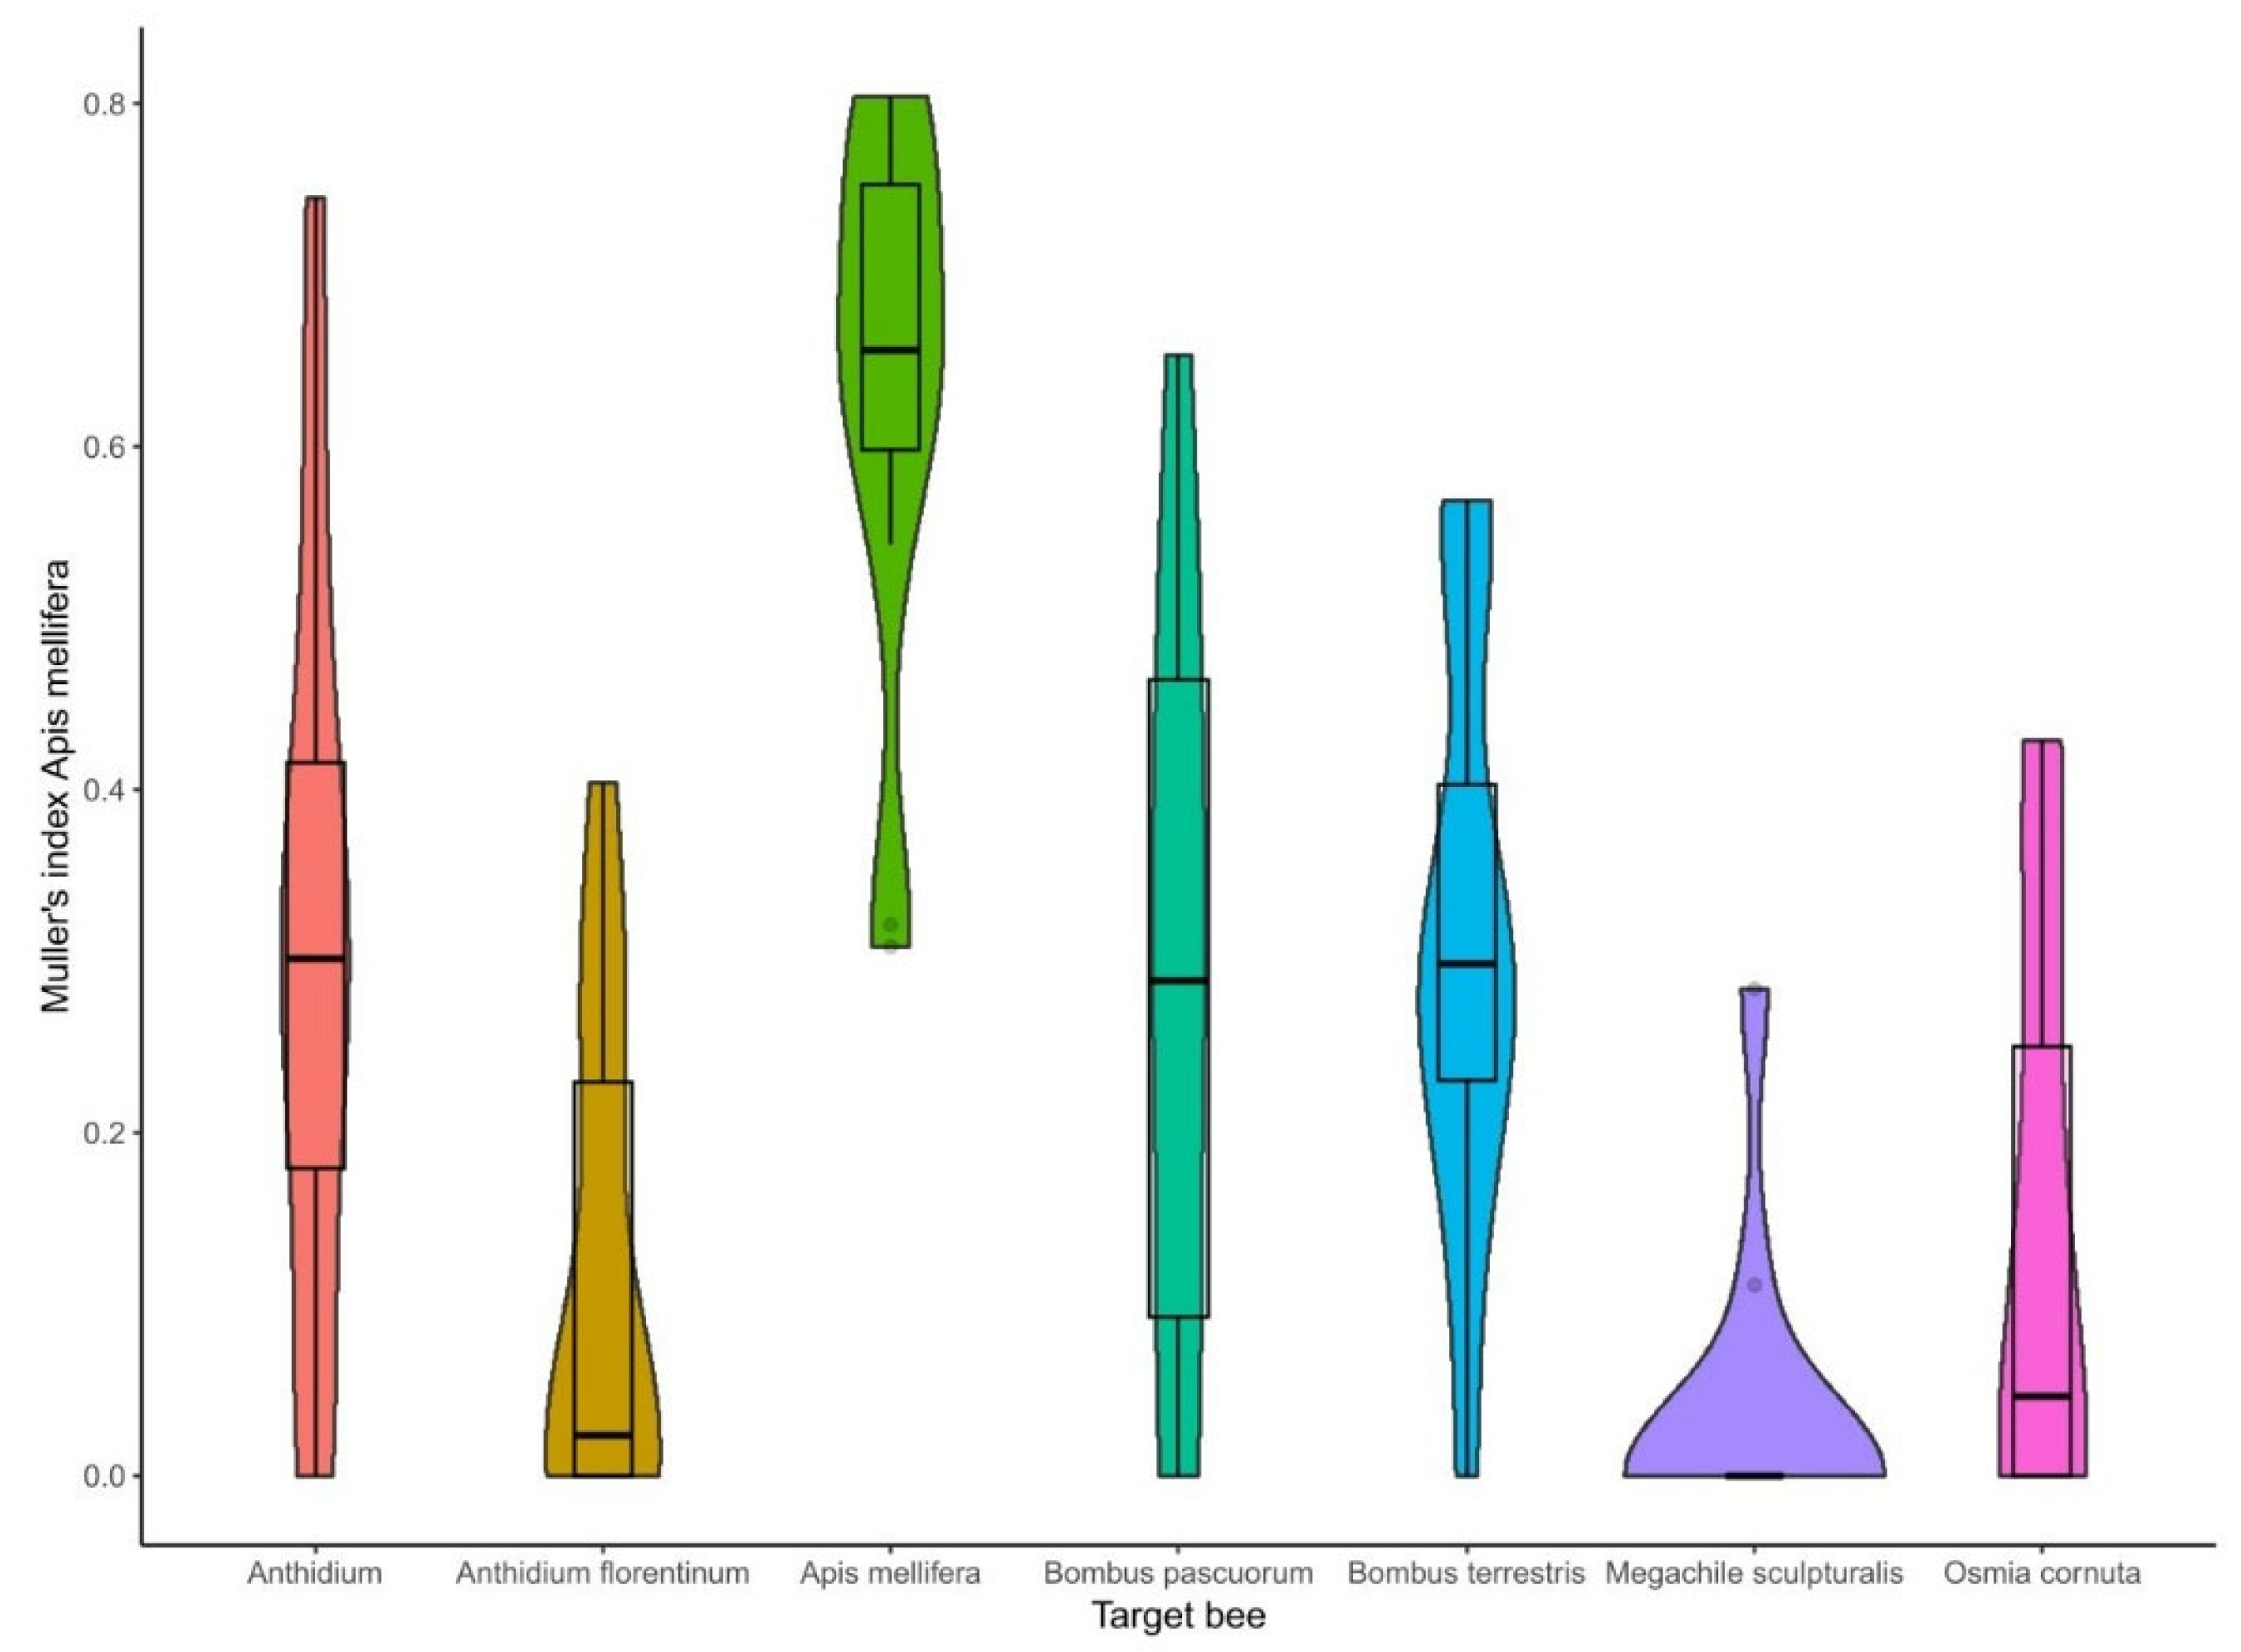
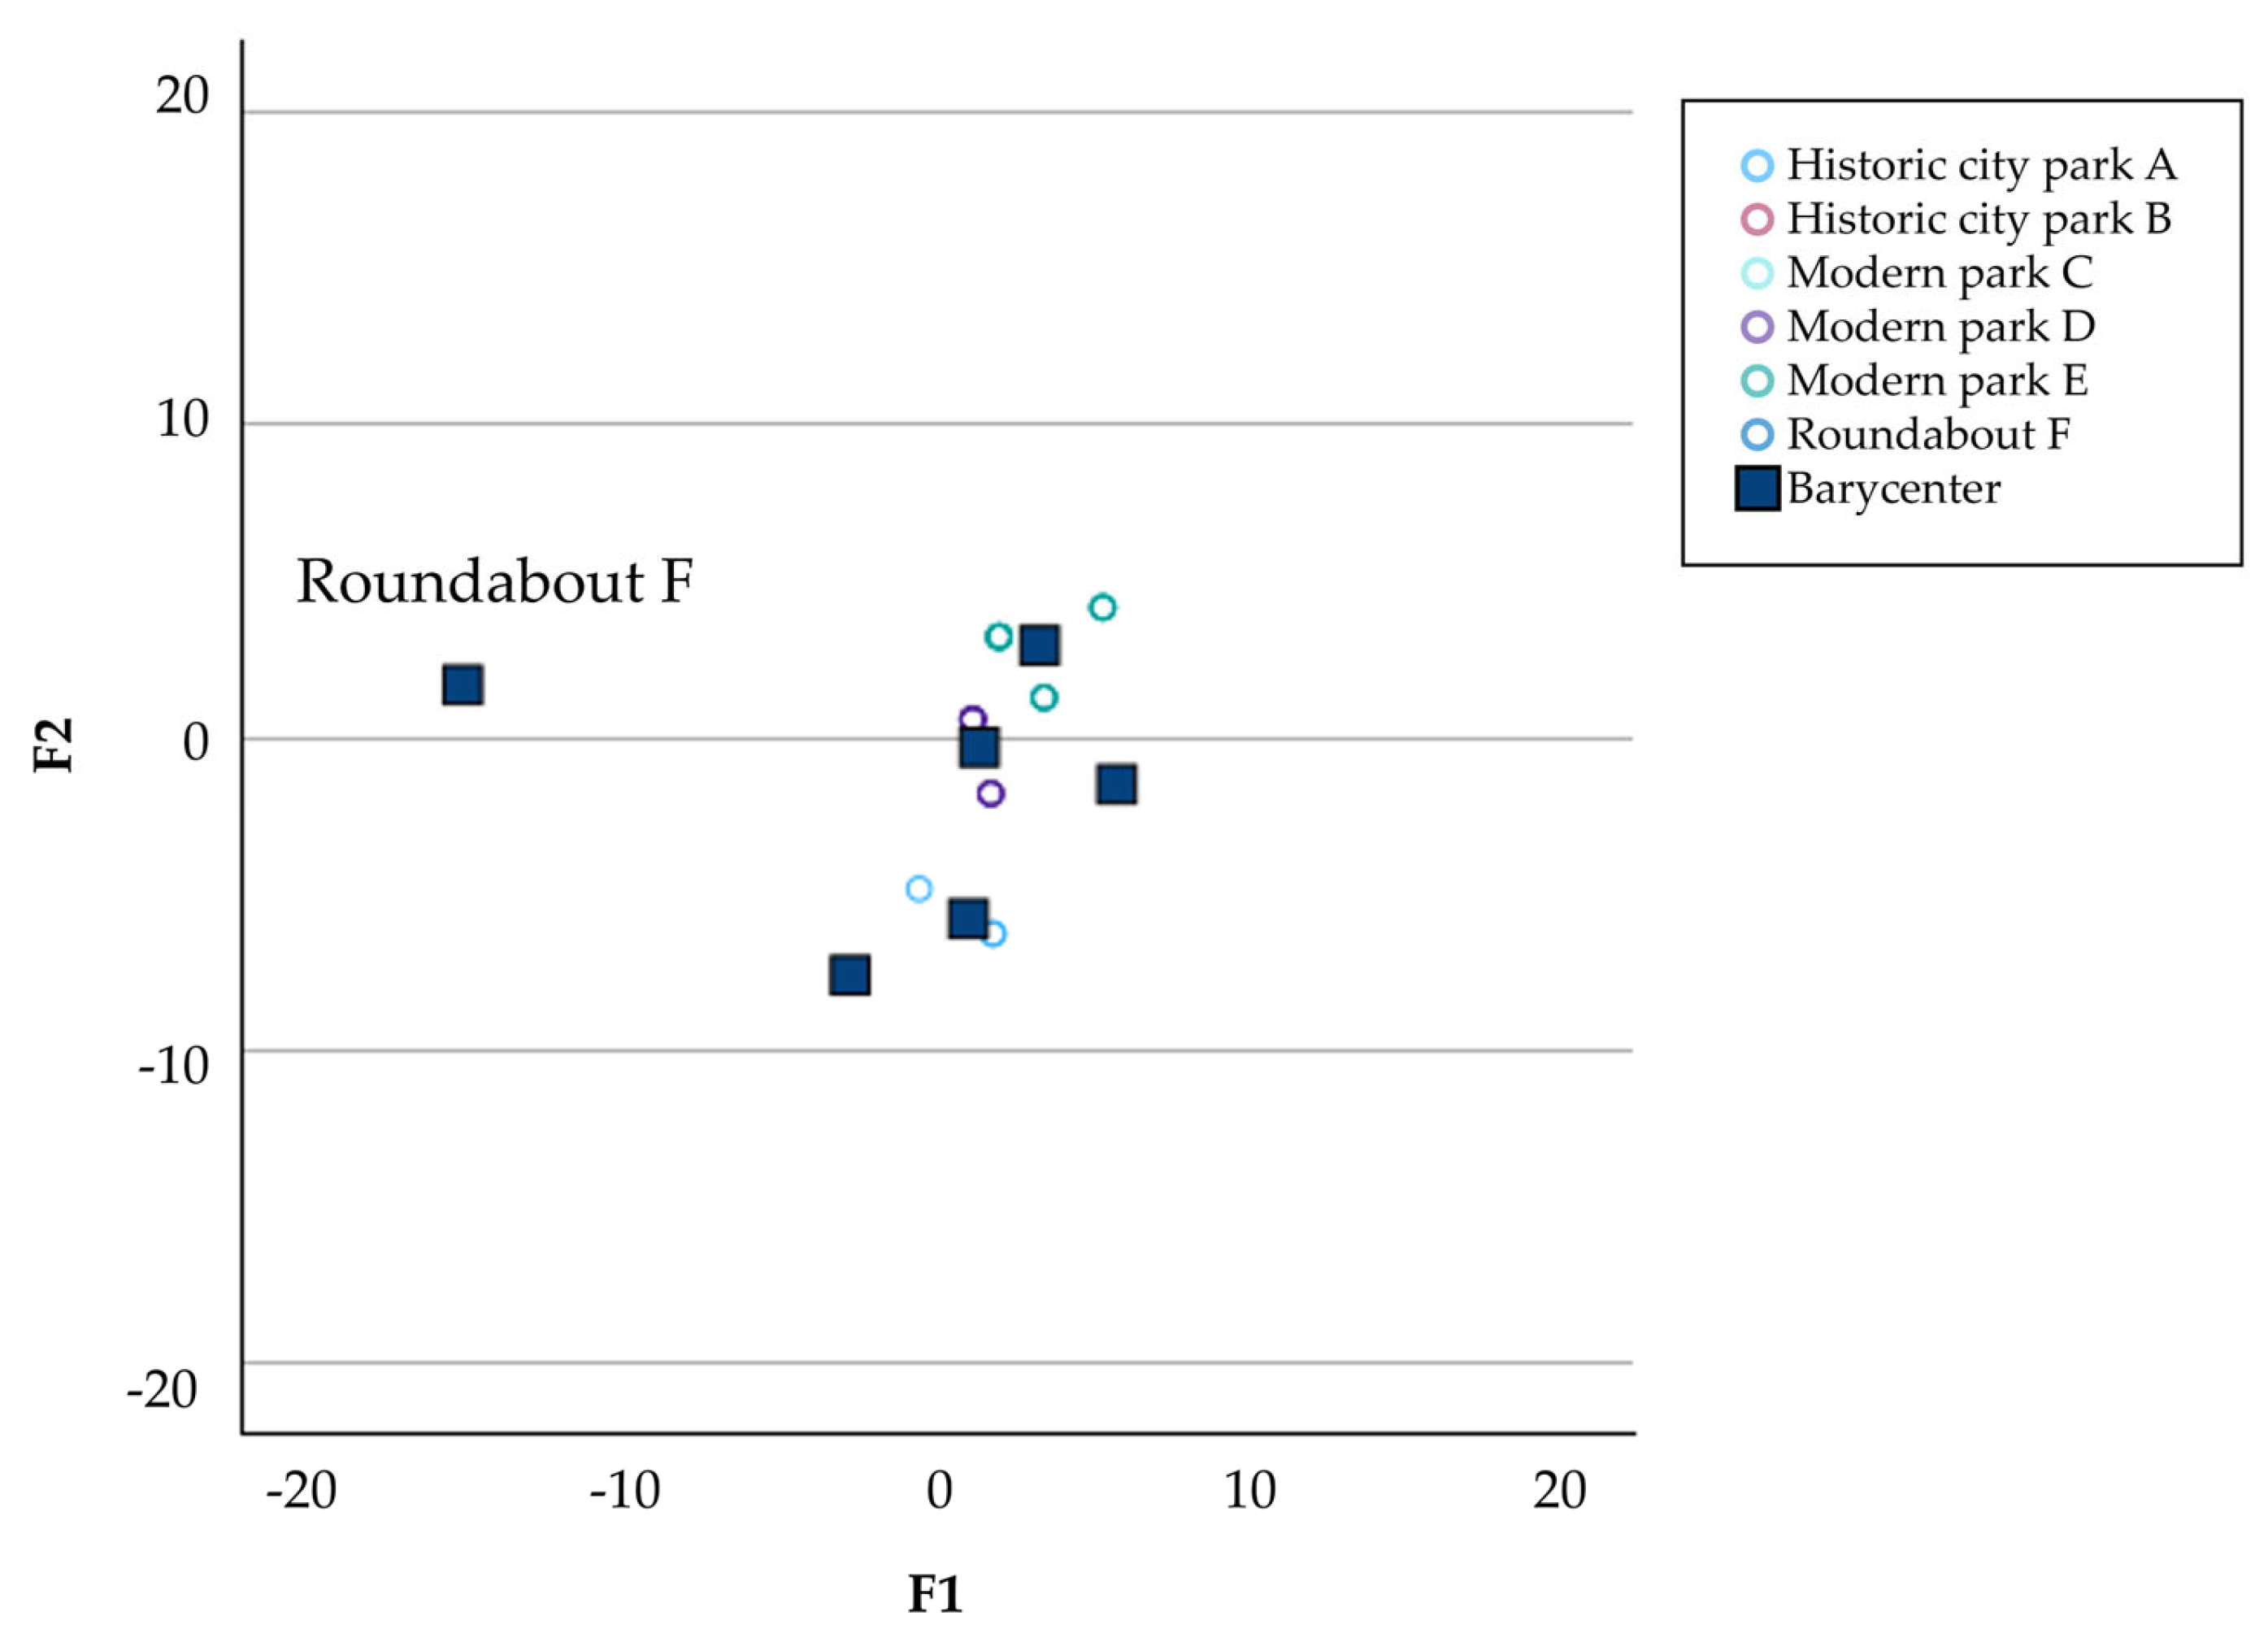
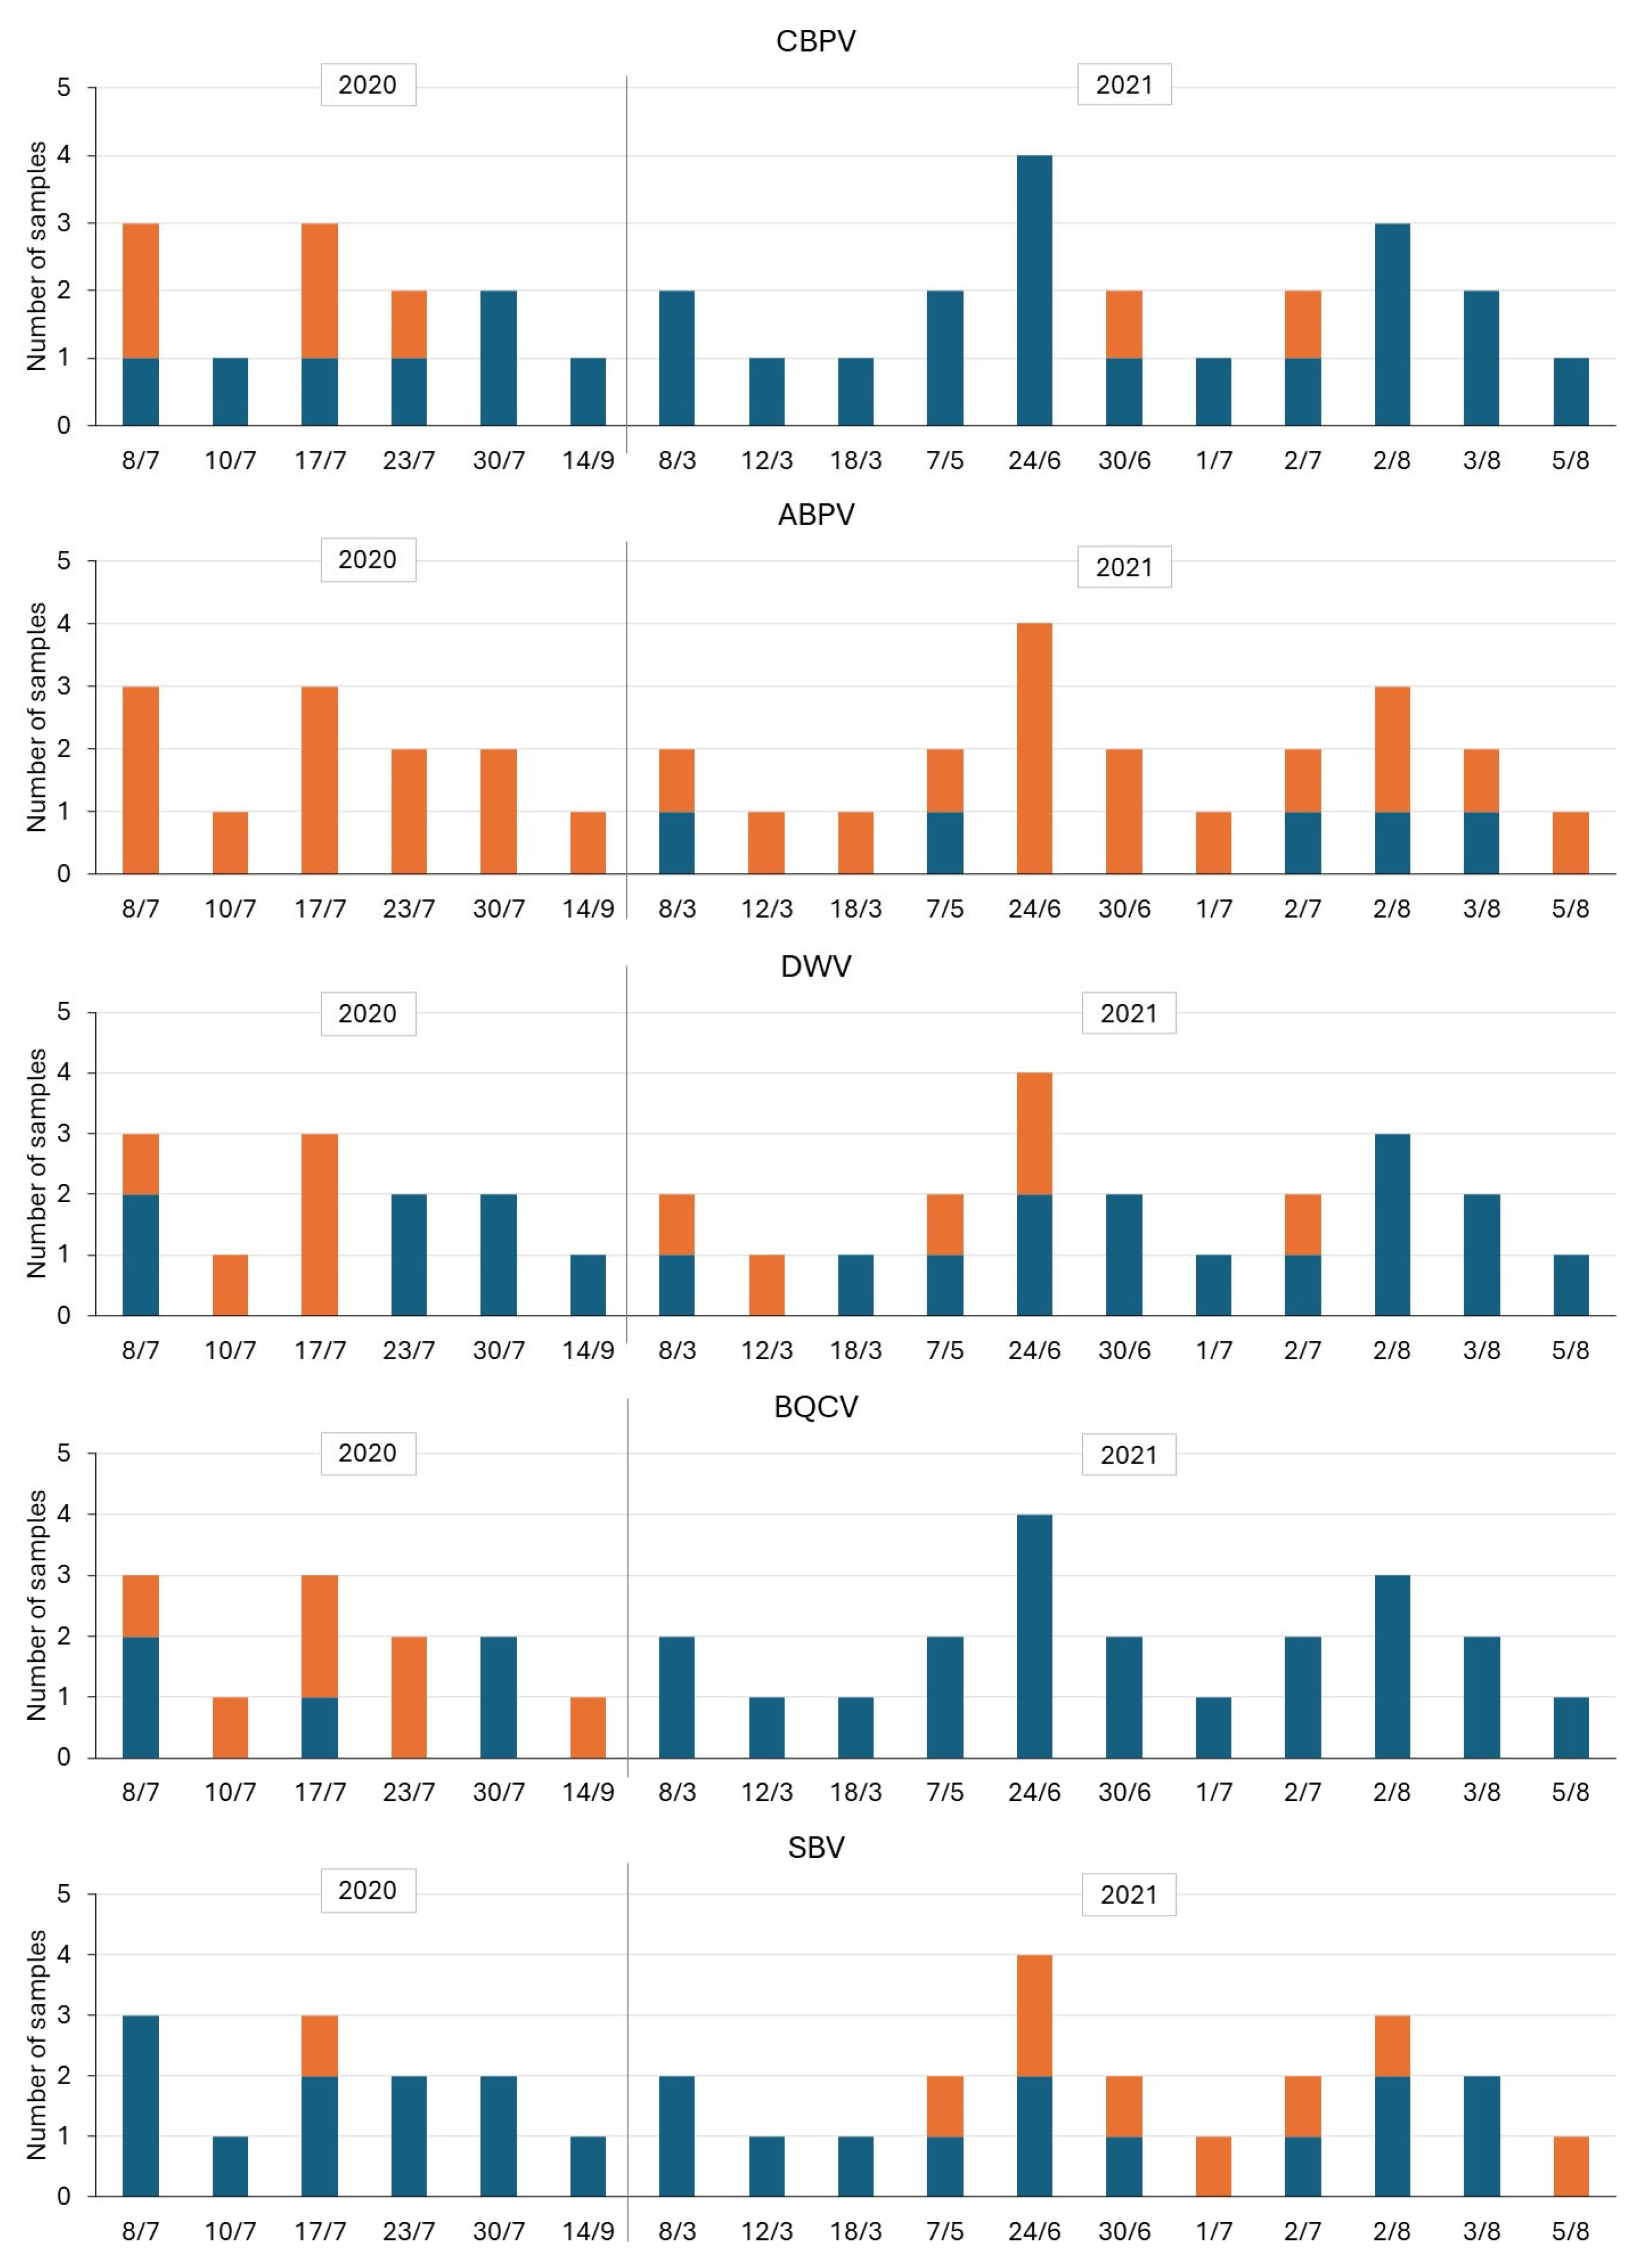

Disclaimer/Publisher’s Note: The statements, opinions and data contained in all publications are solely those of the individual author(s) and contributor(s) and not of MDPI and/or the editor(s). MDPI and/or the editor(s) disclaim responsibility for any injury to people or property resulting from any ideas, methods, instructions or products referred to in the content. |
© 2025 by the authors. Licensee MDPI, Basel, Switzerland. This article is an open access article distributed under the terms and conditions of the Creative Commons Attribution (CC BY) license (https://creativecommons.org/licenses/by/4.0/).