
Failure Modes Analysis Related to User Experience in Interactive System Design Through a Fuzzy Failure Mode and Effect Analysis-Based Hybrid Approach


Abstract
1. Introduction
2. Theoretical Background
2.1. UX in Interactive System Design
2.2. FMEA
2.3. Fuzzy Set Theory
2.4. The Use of Fuzzy Logic in UX
3. Proposed Methodology
3.1. Detecting Failure Modes by Using HTA and SHERPA
3.2. Analysing Failure Modes by Using Fuzzy Linguistic Variables and SAM
3.2.1. Evaluating Risk Parameters of Failure Modes
3.2.2. Aggregating Fuzzy Opinions for Risk Parameters Assessments
3.3. Calculating FRPNs with Fuzzy Logic
3.4. Modifying the Failure Modes with High Priorities
4. Case Study
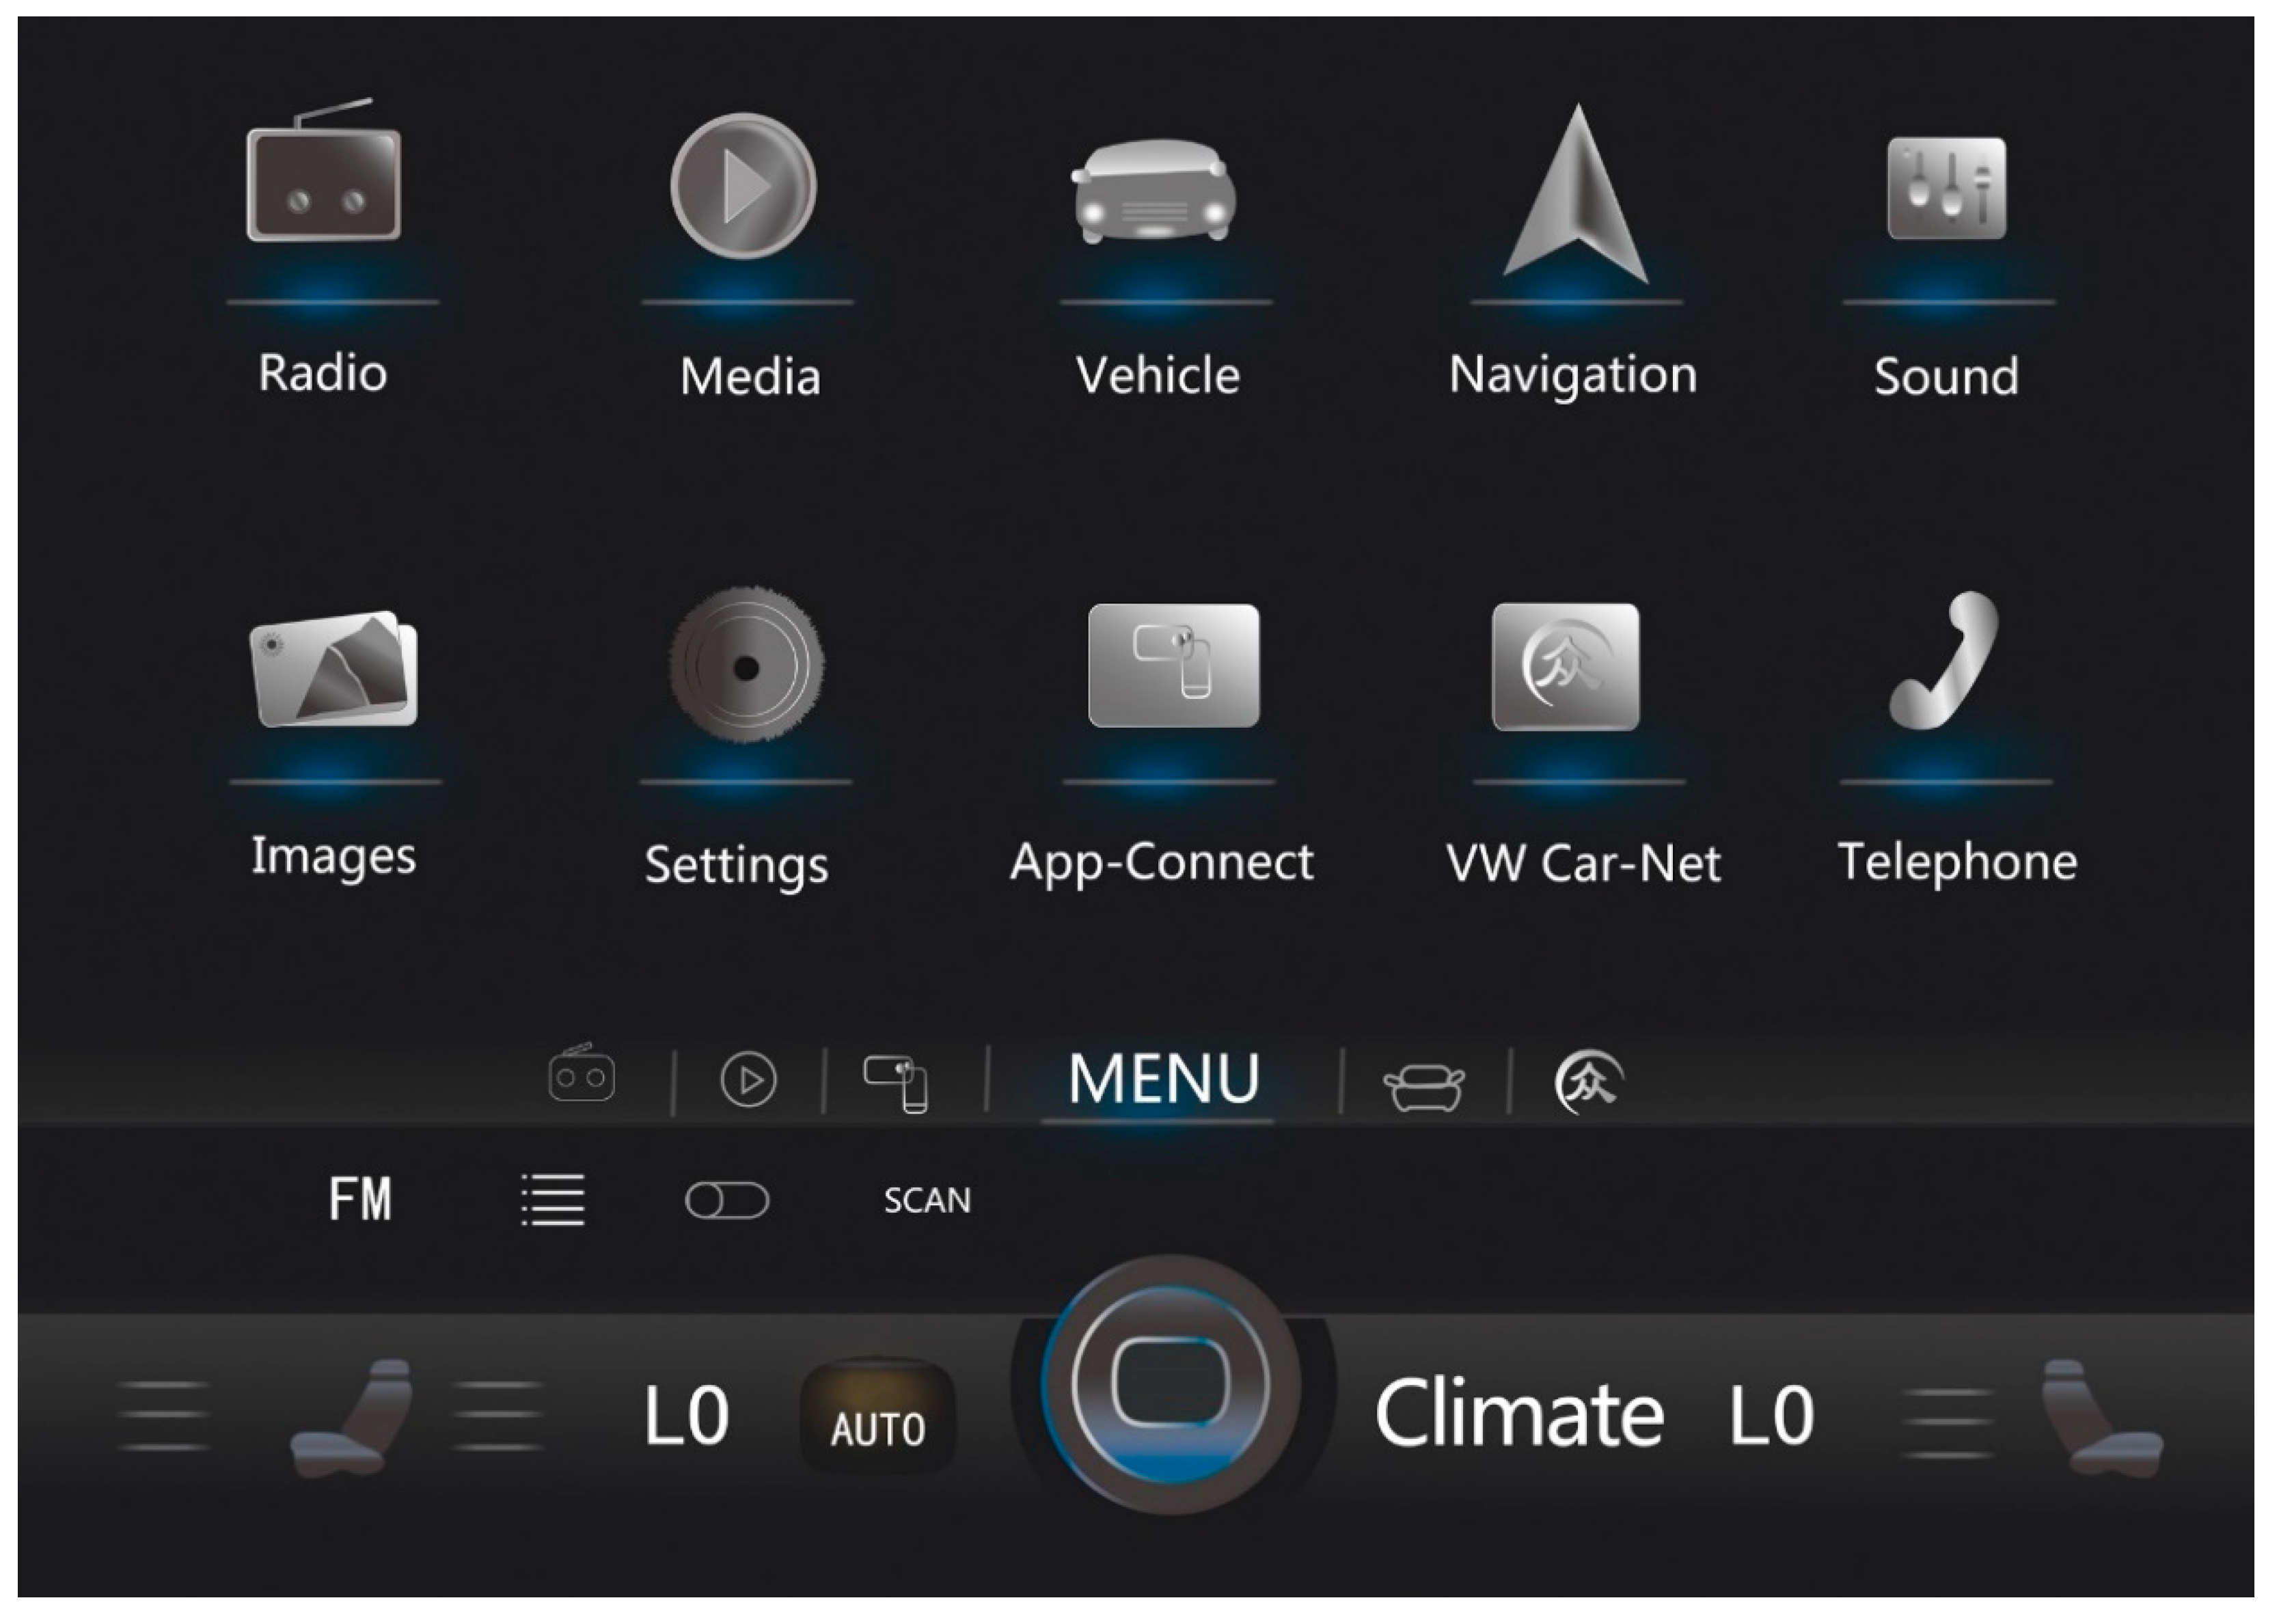
4.1. Detecting Failure Modes for IVIS
4.2. Analysing Failure Modes for IVIS
4.2.1. Evaluating Risk Parameters of Failure Modes for IVIS
4.2.2. Aggregating Fuzzy Opinions for Risk Parameters Assessments for IVIS
4.3. Calculating FRPNs for IVIS
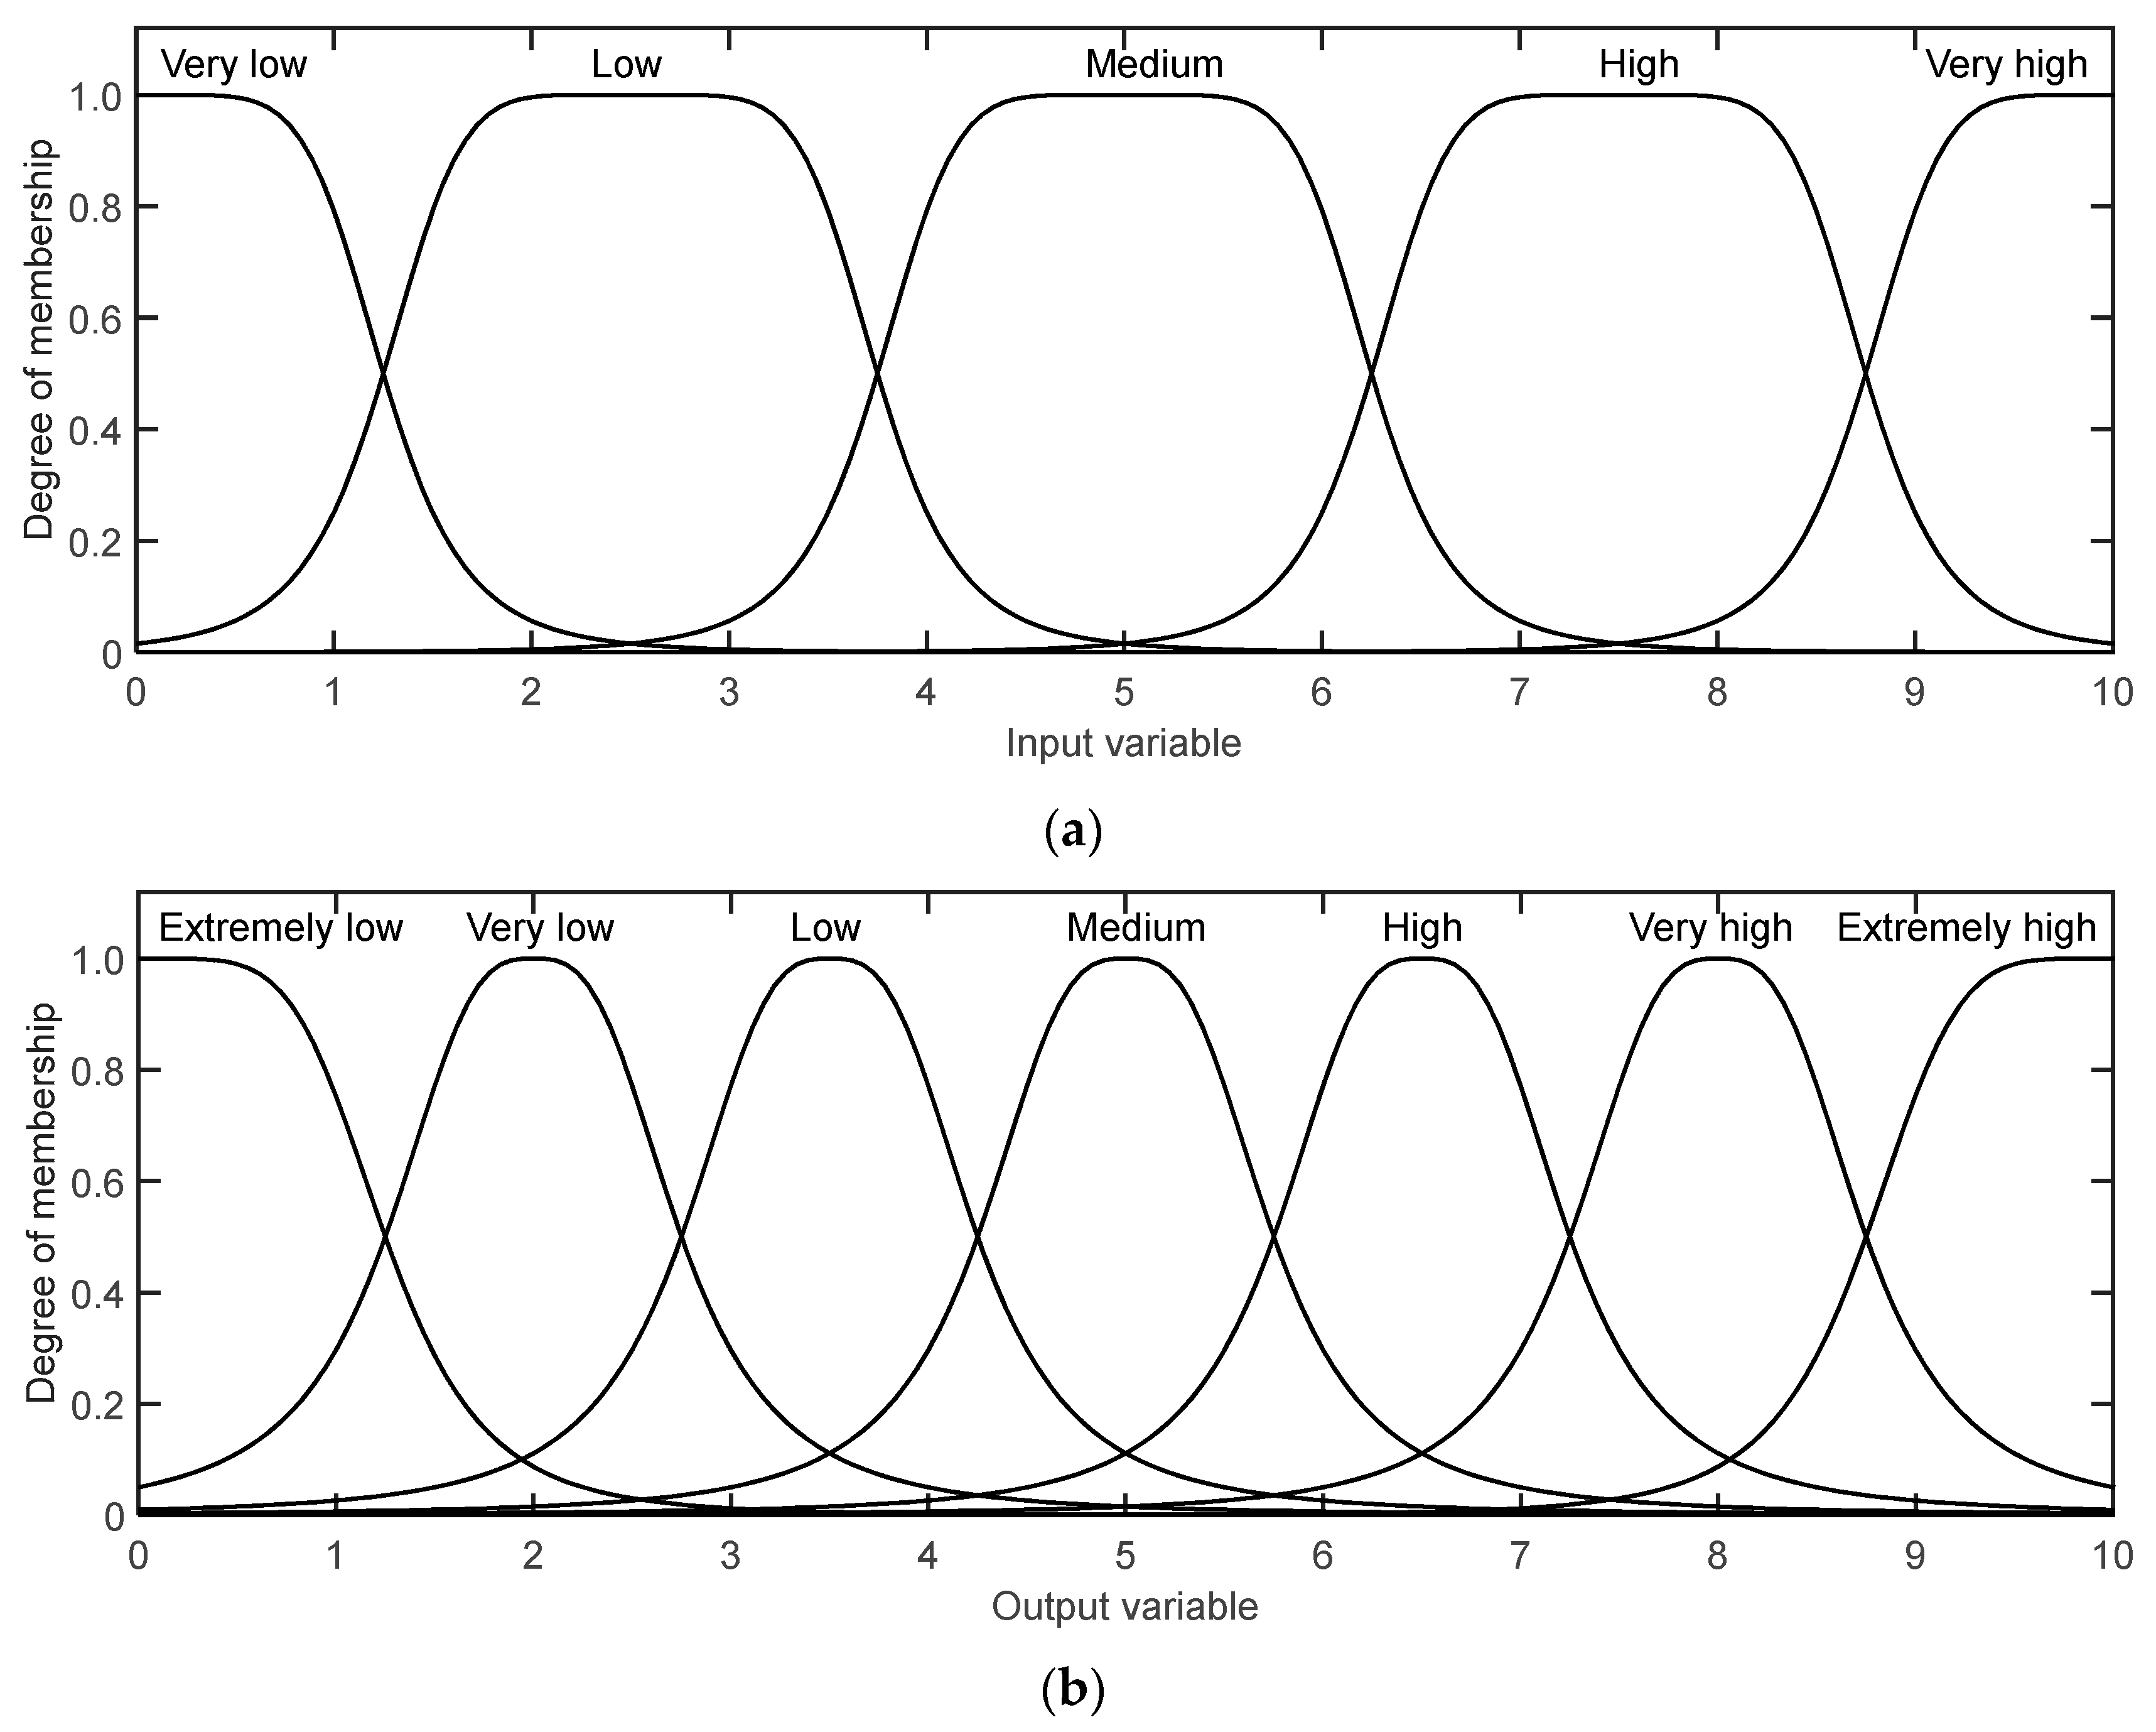
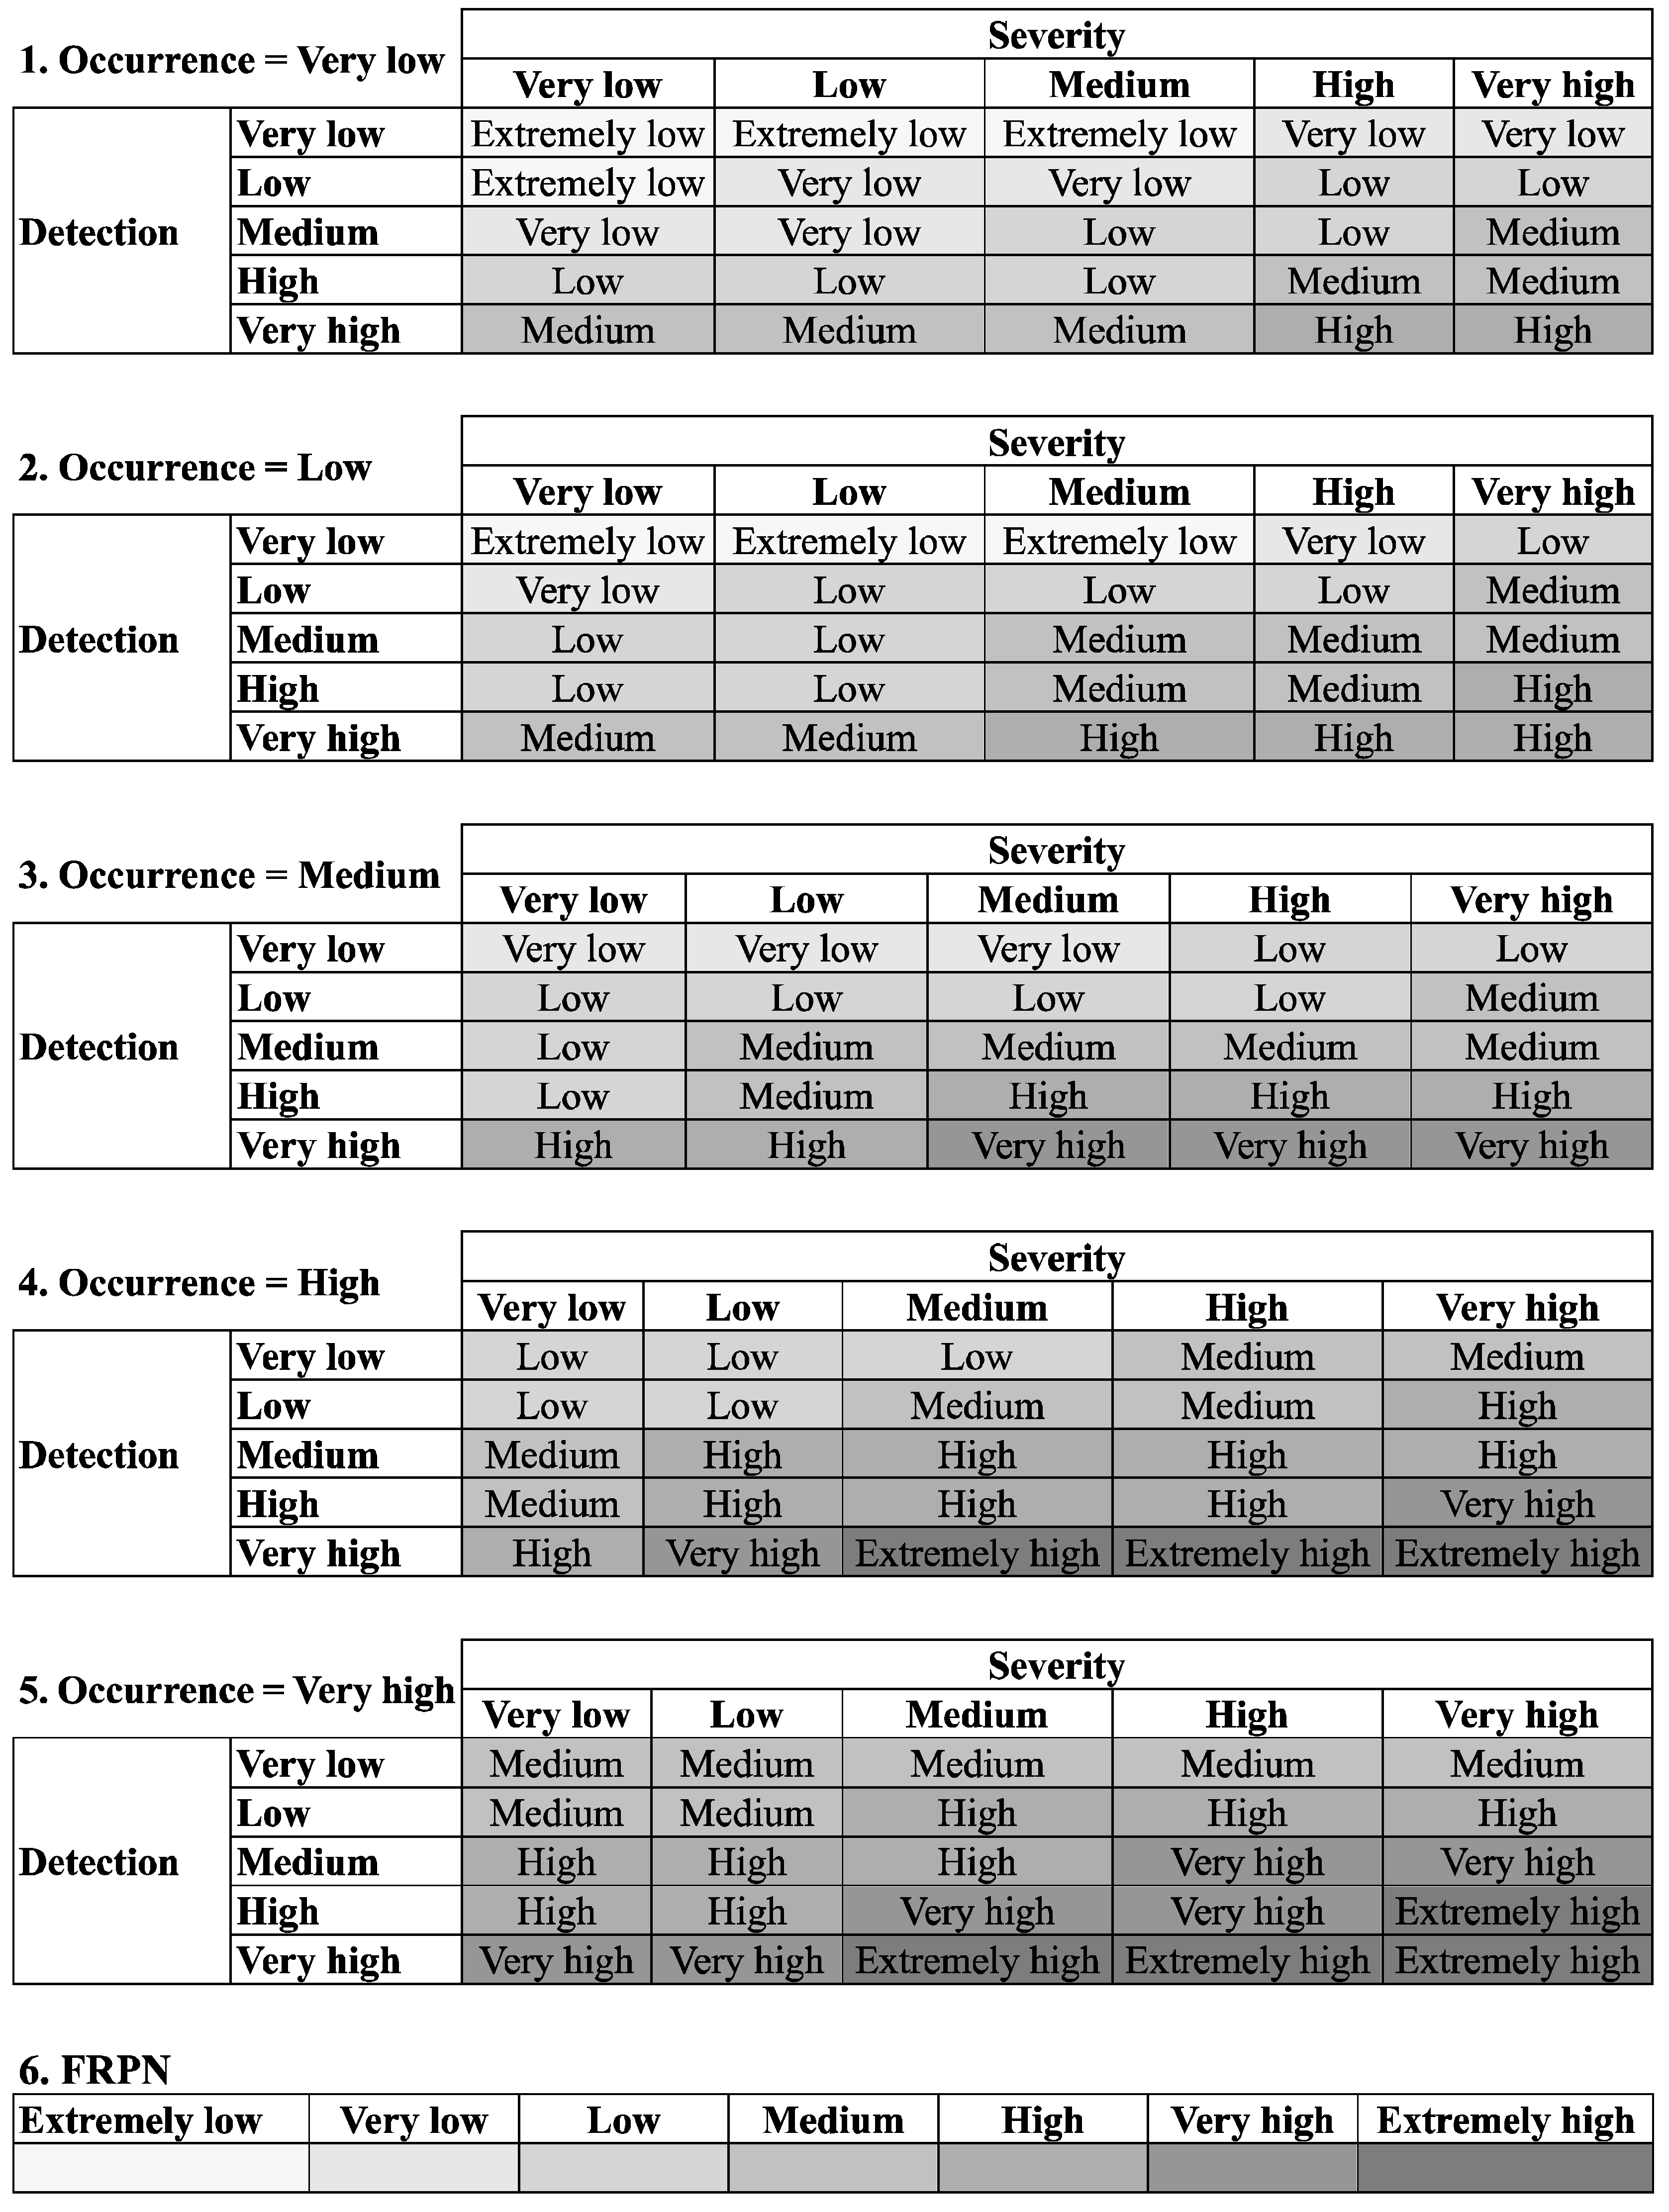
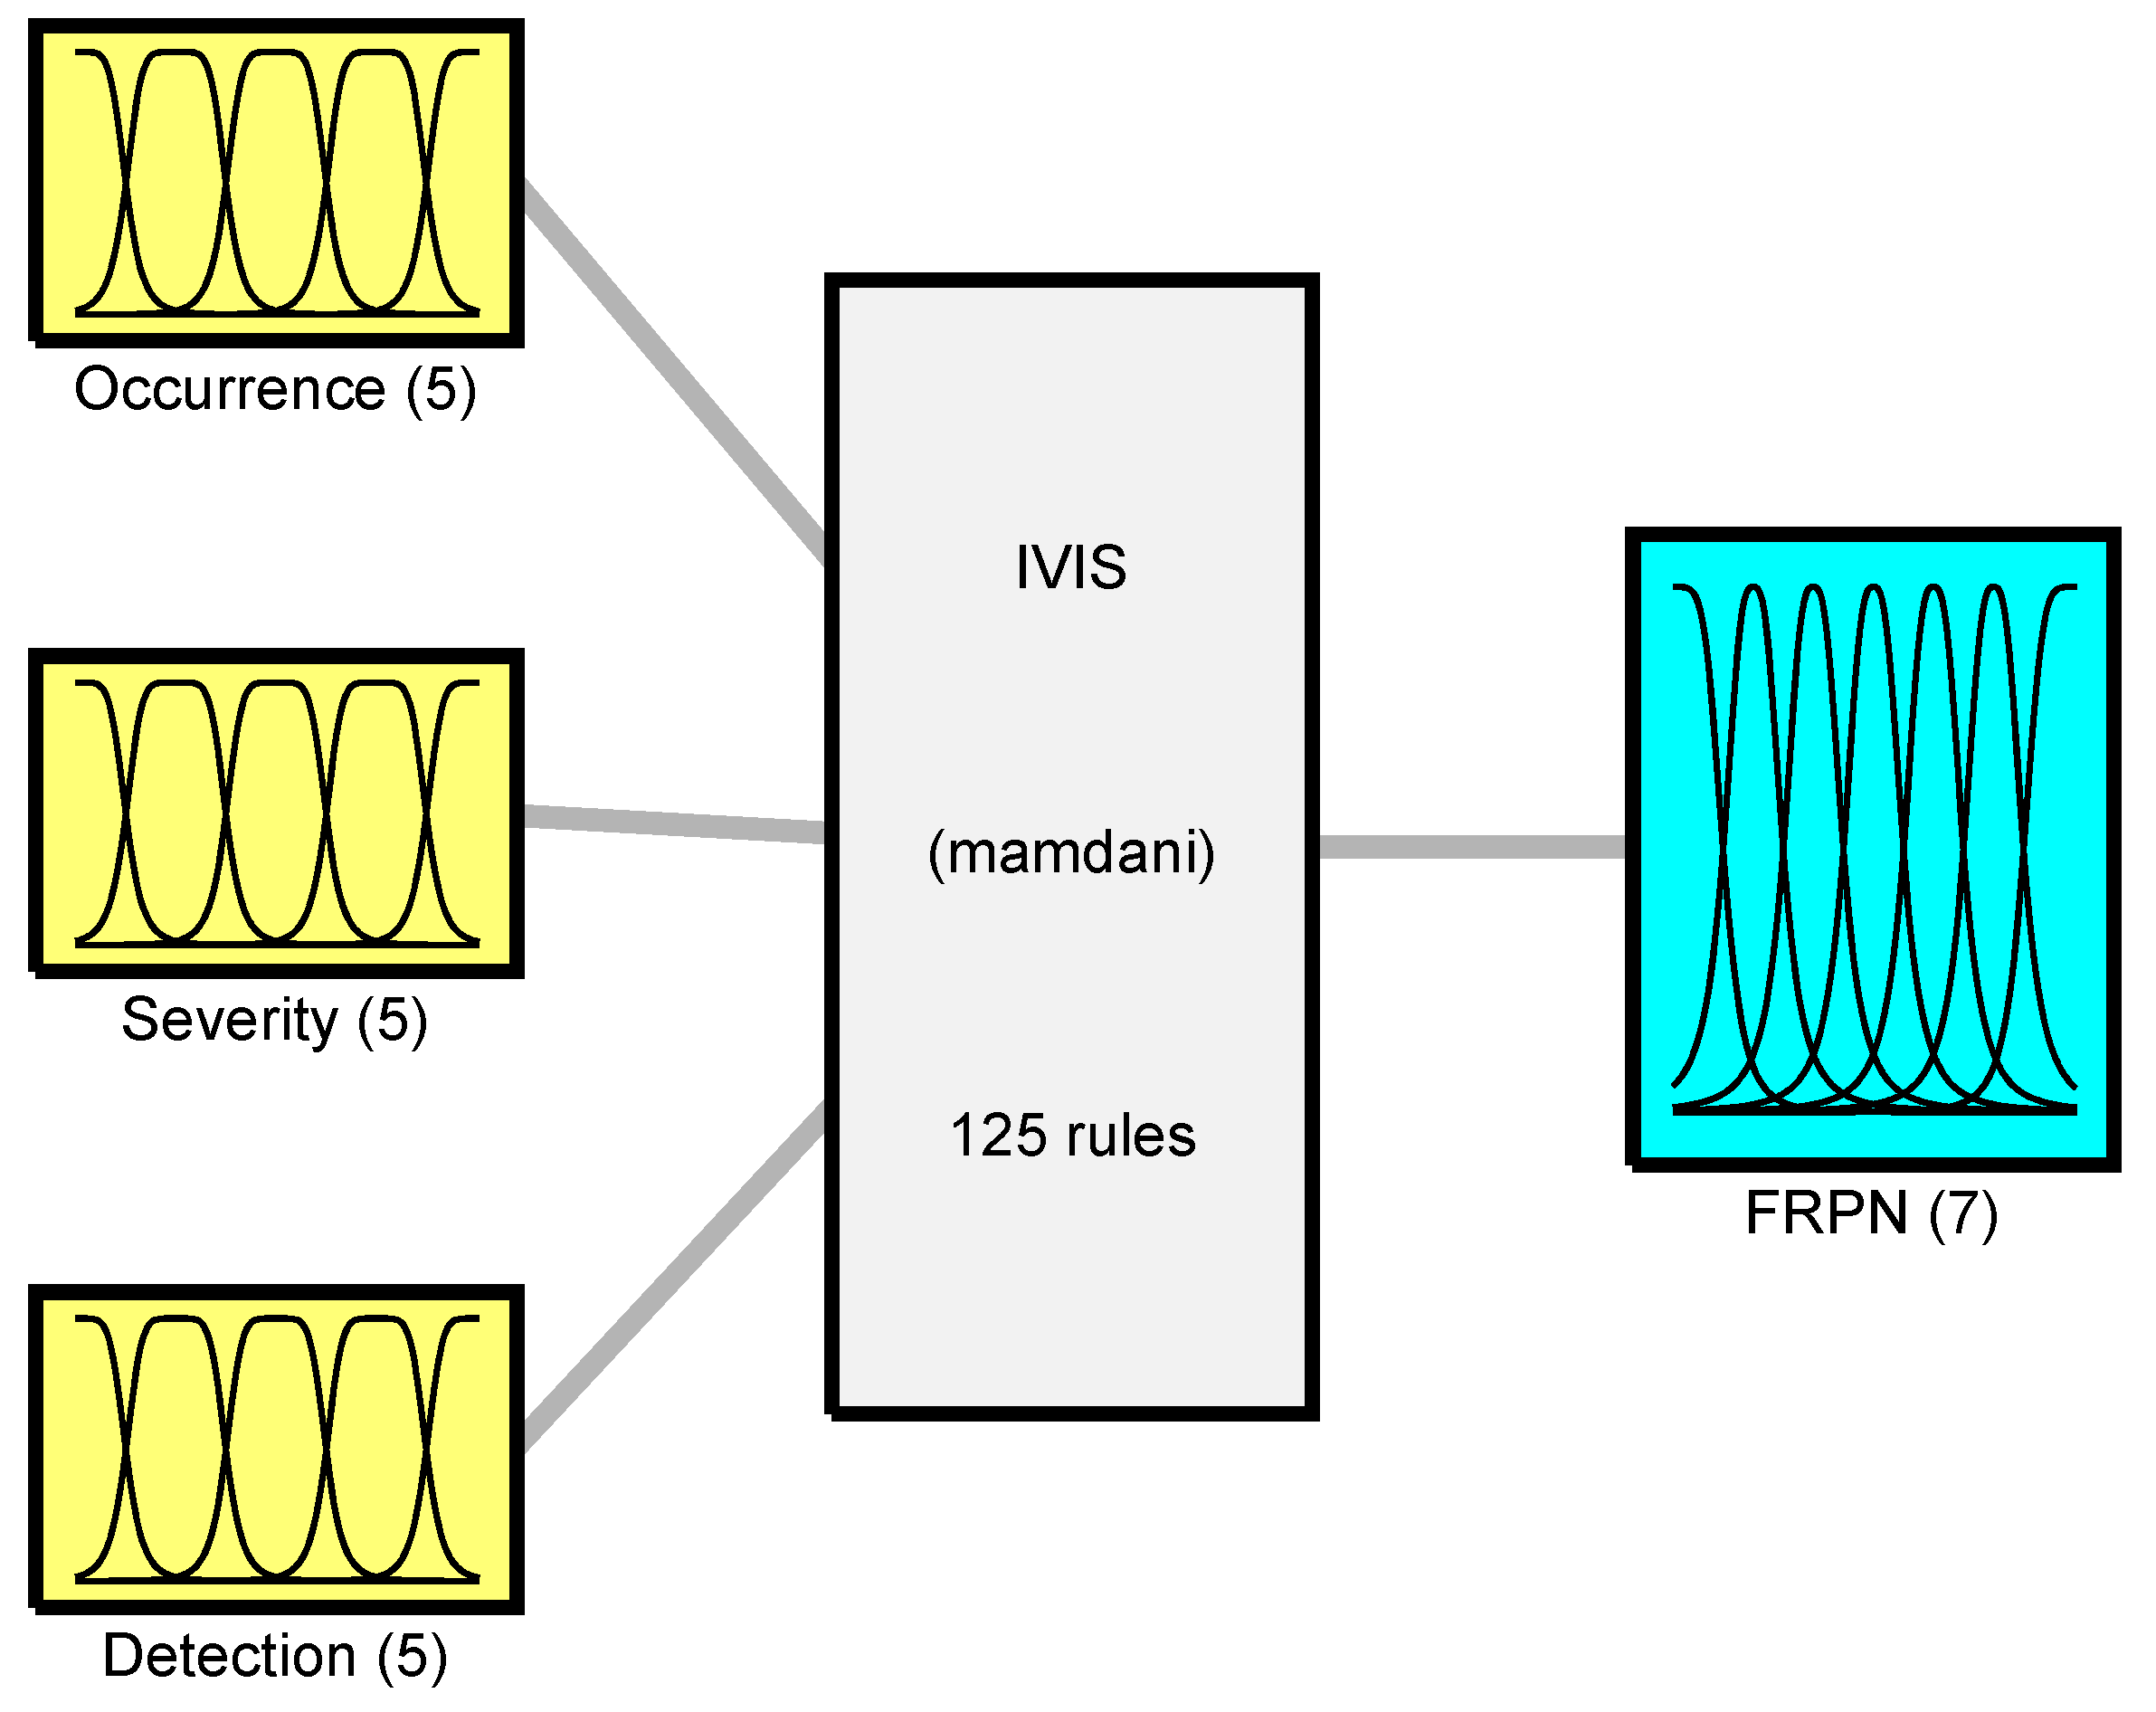
4.3.1. Constructing the Fuzzy Logic System
4.3.2. Calculating the FRPN
4.4. Modifying the Failure Modes with High Priorities for IVIS
5. Discussion
6. Conclusions
Author Contributions
Funding
Institutional Review Board Statement
Informed Consent Statement
Data Availability Statement
Acknowledgments
Conflicts of Interest
Abbreviations
| UX | User experience |
| FMEA | Failure mode and effect analysis |
| HTA | Hierarchical task analysis |
| SHERPA | Systematic human error reduction and prediction approach |
| RPN | Risk priority number |
| FRPN | Fuzzy risk priority number |
| SAM | Similarity aggregation method |
| IVIS | In-vehicle information system |
| AAD | Average agreement degree |
| RAD | Relative agreement degree |
| CDC | Consensus degree coefficient |
References
- Benyon, D. Designing User Experience: A Guide to HCI, UX and Interaction Design, 4th ed.; Pearson: Harlow, UK, 2019. [Google Scholar]
- Nielsen, J. Usability Engineering; Morgan Kaufmann: San Diego, CA, USA, 1993. [Google Scholar]
- Rubin, J.; Chisnell, D. Handbook of Usability Testing: How to Plan, Design and Conduct Effective Tests, 2nd ed.; John Wiley & Sons: New York, NY, USA, 2008. [Google Scholar]
- Travis, D.; Hodgson, P. Think Like a UX Researcher: How to Observe Users, Infuence Design, and Shape Business Strategy; CRC Press: Boca Raton, FL, USA, 2019. [Google Scholar]
- Liu, P.; Wu, Y.; Li, Y.; Wu, X. An improved FMEA method based on the expert trust network for maritime transportation risk management. Expert Syst. Appl. 2024, 238, 121705. [Google Scholar] [CrossRef]
- Anes, V.; Morgado, T.; Abreu, A.; Calado, J.; Reis, L. Updating the FMEA Approach with Mitigation Assessment Capabilities—A Case Study of Aircraft Maintenance Repairs. Appl. Sci. 2022, 12, 11407. [Google Scholar] [CrossRef]
- Liu, H.-C.; Zhang, L.-J.; Ping, Y.-J.; Wang, L. Failure mode and effects analysis for proactive healthcare risk evaluation: A systematic literature review. J. Eval. Clin. Pract. 2020, 26, 1320–1337. [Google Scholar] [CrossRef] [PubMed]
- Cai, M.; Xiao, J.; Luo, Q.; Gao, Y.; Jian, X.; Wang, Y. Evidential FMEA method for human reliability assessment. Qual. Eng. 2024, 36, 21–35. [Google Scholar] [CrossRef]
- Testik, O.M.; Unlu, E.T. Fuzzy FMEA in risk assessment for test and calibration laboratories. Qual. Reliab. Eng. Int. 2023, 39, 575–589. [Google Scholar] [CrossRef]
- Kumru, M.; Kumru, P.Y. Fuzzy FMEA application to improve purchasing process in a public hospital. Appl. Soft Comput. 2013, 13, 721–733. [Google Scholar] [CrossRef]
- Muthukumar, A.; Krishnamurthy, K. Bus body manufacturing system via FEMA and fuzzy logic controller. Soft Comput. 2021, 25, 3889–3901. [Google Scholar] [CrossRef]
- Bohrey, O.P.; Chatpalliwar, A.S. Human error management in aviation maintenance using hybrid FMEA with a novel fuzzy approach. Def. Sci. J. 2024, 74, 11–21. [Google Scholar] [CrossRef]
- Chanamool, N.; Naenna, T. Fuzzy FMEA application to improve decision-making process in an emergency department. Appl. Soft Comput. 2016, 43, 441–453. [Google Scholar] [CrossRef]
- Stamatis, D.H. Failure Mode and Effect Analysis: FMEA from Theory to Execution, 2nd ed.; ASQ Quality Press: Milwaukee, WI, USA, 2003. [Google Scholar]
- Li, Y.; Zhu, L. Risk analysis of human error in interaction design by using a hybrid approach based on FMEA, SHERPA, and fuzzy TOPSIS. Qual. Reliab. Eng. Int. 2020, 36, 1657–1677. [Google Scholar] [CrossRef]
- Yin, H.; Liu, C.; Wu, W.; Song, K.; Liu, D.; Dan, Y. Safety assessment of natural gas storage tank using similarity aggregation method based fuzzy fault tree analysis (SAM-FFTA) approach. J. Loss Prev. Process Ind. 2020, 66, 104159. [Google Scholar] [CrossRef]
- Tuncel, A.L.; Besikci, E.B.; Akyuz, E.; Arslan, O. Safety analysis of fire and explosion (F&E) accidents risk in bulk carrier ships under fuzzy fault tree approach. Saf. Sci. 2023, 158, 105972. [Google Scholar] [CrossRef]
- Kumar, M.; Singh, K. Fuzzy fault tree analysis of chlorine gas release hazard in Chlor-Alkali industry using alpha-cut interval-based similarity aggregation method. Appl. Soft Comput. 2022, 125, 109199. [Google Scholar] [CrossRef]
- Stanton, N.A. Hierarchical task analysis: Developments, applications, and extensions. Appl. Ergon. 2006, 37, 55–79. [Google Scholar] [CrossRef]
- Salvendy, G. Handbook of Human Factors and Ergonomics, 4th ed.; John Wiley & Sons, Inc.: Hoboken, NJ, USA, 2012. [Google Scholar]
- Embrey, D.E. SHERPA: A systematic human error reduction and prediction approach. In Proceedings of the International Topical Meeting on Advances in Human Factors in Nuclear Power Systems, Knoxville, Tennessee, 21–24 April 1986; pp. 184–193. [Google Scholar]
- Stanton, N.A.; Salmon, P.M.; Rafferty, L.A.; Walker, G.H.; Baber, C.; Jenkins, D.P. Human Factors Methods: A Practical Guide for Engineering and Design, 2nd ed.; CRC Press: Boca Raton, FL, USA, 2013. [Google Scholar]
- Mandal, S.; Singh, K.; Behera, R.K.; Sahu, S.K.; Raj, N.; Maiti, J. Human error identification and risk prioritization in overhead crane operations using HTA, SHERPA and fuzzy VIKOR method. Expert Syst. Appl. 2015, 42, 7195–7206. [Google Scholar] [CrossRef]
- Schrepp, M. User Experience Questionnaires: How to Use Questionnaires to Measure the User Experience of Your Products? Independently Published: Chicago, IL, USA, 2021. [Google Scholar]
- Rogers, Y.; Sharp, H.; Preece, J. Interaction Design: Beyond Human-Computer Interaction, 6th ed.; John Wiley & Sons, Inc.: Hoboken, NJ, USA, 2023. [Google Scholar]
- Hassenzahl, M.; Diefenbach, S.; Göritz, A. Needs, affect, and interactive products—Facets of user experience. Interact. Comput. 2010, 22, 353–362. [Google Scholar] [CrossRef]
- Hartson, H.R. Human–computer interaction: Interdisciplinary roots and trends. J. Syst. Softw. 1998, 43, 103–118. [Google Scholar] [CrossRef]
- Norman, D.A. The Design of Everyday Things. Revised and Expanded Edition; Basic Books: New York, NY, USA, 2013. [Google Scholar]
- Shneiderman, B.; Plaisant, C.; Cohen, M.; Jacobs, S.; Elmqvist, N.; Diakopoulos, N. Designing the User Interface: Strategies for Effective Human-Computer Interaction, 6h ed.; Pearson: Boston, MA, USA, 2016. [Google Scholar]
- Atalay, K.D.; Eraslan, E. Multi-criteria usability evaluation of electronic devices in a fuzzy environment. Hum. Factors Ergon. Manuf. Serv. Ind. 2014, 24, 336–347. [Google Scholar] [CrossRef]
- Camargo, M.; Wendling, L.; Bonjour, E. A fuzzy integral based methodology to elicit semantic spaces in usability tests. Int. J. Ind. Ergon. 2014, 44, 11–17. [Google Scholar] [CrossRef]
- Chou, J.-R. A psychometric user experience model based on fuzzy measure approaches. Adv. Eng. Inform. 2018, 38, 794–810. [Google Scholar] [CrossRef]
- Albert, B.; Tullis, T. Measuring the User Experience: Collecting, Analyzing, and Presenting UX Metrics, 3rd ed.; Morgan Kaufmann: Cambridge, MA, USA, 2022. [Google Scholar]
- Razouk, H.; Kern, R. Improving the Consistency of the Failure Mode Effect Analysis (FMEA) Documents in Semiconductor Manufacturing. Appl. Sci. 2022, 12, 1840. [Google Scholar] [CrossRef]
- Zhu, M.; Zhou, W.; Duan, C. Integrating FMEA and fuzzy super-efficiency SBM for risk assessment of crowdfunding project investment. Soft Comput. 2024, 28, 2563–2575. [Google Scholar] [CrossRef]
- Akhtar, M.J.; Naseem, A.; Ahsan, F. A novel hybrid approach to explore the interaction among faults in production process with extended FMEA model using DEMATEL and cloud model theory. Eng. Fail. Anal. 2024, 157, 107876. [Google Scholar] [CrossRef]
- Ju, Y.; Zhao, Q.; Luis, M.; Liang, Y.; Dong, J.; Dong, P.; Giannakis, M. A novel framework for FMEA using evidential BWM and SMAA-MARCOS method. Expert Syst. Appl. 2024, 243, 122796. [Google Scholar] [CrossRef]
- Zadeh, L.A. Fuzzy sets. Inf. Control 1965, 8, 338–353. [Google Scholar] [CrossRef]
- Ceylan, B.O. Shipboard compressor system risk analysis by using rule-based fuzzy FMEA for preventing major marine accidents. Ocean Eng. 2023, 272, 113888. [Google Scholar] [CrossRef]
- Can, G.F.; Demirok, S. Universal usability evaluation by using an integrated fuzzy multi criteria decision making approach. Int. J. Intell. Comput. Cybern. 2019, 12, 194–223. [Google Scholar] [CrossRef]
- Rao, C.; Gao, M.; Wen, J.; Goh, M. Multi-attribute group decision making method with dual comprehensive clouds under information environment of dual uncertain Z-numbers. Inf. Sci. 2022, 602, 106–127. [Google Scholar] [CrossRef]
- Li, Y.; Zhu, L. Optimization of user experience in mobile application design by using a fuzzy analytic-network-process-based Taguchi method. Appl. Soft Comput. 2019, 79, 268–282. [Google Scholar] [CrossRef]
- Zimmermann, H.-J. Fuzzy Set Theory—And Its Applications, 4th ed.; Kluwer Academic Publishers: Boston, MA, USA, 2001. [Google Scholar]
- Nourbakhsh Borujerd, S.V.; Soleimani, A.; Esfandyari, M.J.; Masih-Tehrani, M.; Esfahanian, M.; Nehzati, H.; Dolatkhah, M. Fuzzy logic approach for failure analysis of Li-ion battery pack in electric vehicles. Eng. Fail. Anal. 2023, 149, 107233. [Google Scholar] [CrossRef]
- Sulikowski, P.; Zdziebko, T.; Hussain, O.; Wilbik, A. Fuzzy Approach to Purchase Intent Modeling Based on User Tracking For E-commerce Recommenders. In Proceedings of the 2021 IEEE International Conference on Fuzzy Systems (FUZZ-IEEE), Luxembourg, 11–14 July 2021; pp. 1–8. [Google Scholar]
- Li, Y.; Zhu, L. Multi-objective optimisation of user experience in mobile application design via a grey-fuzzy-based Taguchi approach. Concurr. Eng.-Res. Appl. 2020, 28, 175–188. [Google Scholar] [CrossRef]
- Jong, C.H.; Tay, K.M.; Lim, C.P. Application of the fuzzy failure mode and effect analysis methodology to edible bird nest processing. Comput. Electron. Agric. 2013, 96, 90–108. [Google Scholar] [CrossRef]
- Banks, V.; Allison, C.K.; Parnell, K.; Plant, K.; Stanton, N.A. Predicting and mitigating failures on the flight deck: An aircraft engine bird strike scenario. Ergonomics 2022, 65, 1672–1695. [Google Scholar] [CrossRef] [PubMed]
- Tzeng, G.-H.; Huang, J.-J. Multiple Attribute Decision Making: Methods and Applications; CRC Press: Boca Raton, FL, USA, 2011. [Google Scholar]
- Guo, C.; Wu, W. Risk assessment of disconnect operations of MNPP using similarity aggregation method based fuzzy dynamic Bayesian networks model. Ocean Eng. 2023, 285, 115390. [Google Scholar] [CrossRef]
- Hsu, H.-M.; Chen, C.-T. Aggregation of fuzzy opinions under group decision making. Fuzzy Sets Syst. 1996, 79, 279–285. [Google Scholar]
- Psarros, G.A. Fuzzy logic system interference in ship accidents. Hum. Factors Ergon. Manuf. Serv. Ind. 2018, 28, 372–382. [Google Scholar] [CrossRef]
- Hassan, F.u.; Nguyen, T.; Le, T.; Le, C. Automated prioritization of construction project requirements using machine learning and fuzzy failure mode and effects analysis (FMEA). Autom. Constr. 2023, 154, 105013. [Google Scholar] [CrossRef]
- Chaudhary, A.K.; Pandey, A.K.; Dubey, A.K. Computer aided Taguchi-fuzzy multi-optimization of laser cutting process. J. Intell. Fuzzy Syst. 2014, 26, 801–810. [Google Scholar] [CrossRef]
- Ross, T.J. Fuzzy Logic with Engineering Applications, 4th ed.; John Wiley & Sons, Ltd.: Chichester, UK, 2017. [Google Scholar]
- Tzeng, Y.-f.; Chen, F.-c. Multi-objective optimisation of high-speed electrical discharge machining process using a Taguchi fuzzy-based approach. Mater. Des. 2007, 28, 1159–1168. [Google Scholar] [CrossRef]
- Lee, S.C.; Kim, Y.W.; Ji, Y.G. Effects of visual complexity of in-vehicle information display: Age-related differences in visual search task in the driving context. Appl. Ergon. 2019, 81, 102888. [Google Scholar] [CrossRef]
- Feng, F.; Liu, Y.; Chen, Y. A computer-aided usability testing tool for in-vehicle infotainment systems. Comput. Ind. Eng. 2017, 109, 313–324. [Google Scholar] [CrossRef]
- Biondi, F.; Alvarez, I.; Jeong, K.-A. Human–vehicle cooperation in automated driving: A multidisciplinary review and appraisal. Int. J. Hum.–Comput. Interact. 2019, 35, 932–946. [Google Scholar] [CrossRef]
- Ramzali, N.; Lavasani, M.R.M.; Ghodousi, J. Safety barriers analysis of offshore drilling system by employing Fuzzy Event Tree Analysis. Saf. Sci. 2015, 78, 49–59. [Google Scholar] [CrossRef]
- Chang, E.; Dillon, T.S. A usability-evaluation metric based on a soft-computing approach. IEEE Trans. Syst. Man Cybern. Part A Syst. Hum. 2006, 36, 356–372. [Google Scholar] [CrossRef]
- Ruiz, J.; Serral, E.; Snoeck, M. Unifying Functional User Interface Design Principles. Int. J. Hum.–Comput. Interact. 2021, 37, 47–67. [Google Scholar] [CrossRef]
- Yablonski, J. Laws of UX: Using Psychology to Design Better Products & Services; O’Reilly Media, Inc.: Sebastopol, CA, USA, 2020. [Google Scholar]
- Selim, H.; Yunusoglu, M.G.; Balaman, S.Y. A Dynamic Maintenance Planning Framework Based on Fuzzy TOPSIS and FMEA: Application in an International Food Company. Qual. Reliab. Eng. Int. 2016, 32, 795–804. [Google Scholar] [CrossRef]
- Brooke, J. SUS—A quick and dirty usability scale. Usability Eval. Ind. 1996, 189, 4–7. [Google Scholar]
- Gallardo, B.; Sutherland, W.J.; Martin, P.; Aldridge, D.C. Applying fault tree analysis to biological invasions identifies optimal targets for effective biosecurity. J. Appl. Ecol. 2022, 59, 2553–2566. [Google Scholar] [CrossRef]
- Mutlu, N.G.; Altuntas, S. Risk analysis for occupational safety and health in the textile industry: Integration of FMEA, FTA, and BIFPET methods. Int. J. Ind. Ergon. 2019, 72, 222–240. [Google Scholar] [CrossRef]
- Arifin, H.H.; Kawamura, K.; Robert Ong, H.K.; Pepper, B.; Chimplee, N.; Pavalkis, S. Model-based FMEA & FTA with case-based reasoning. INCOSE Int. Symp. 2023, 33, 305–319. [Google Scholar] [CrossRef]
- Harvey, C.; Stanton, N.A.; Pickering, C.A.; McDonald, M.; Zheng, P. A usability evaluation toolkit for in-vehicle information systems (IVISs). Appl. Ergon. 2011, 42, 563–574. [Google Scholar] [CrossRef]


| Failure Mode Category | Failure Mode Code | Failure Mode Description |
|---|---|---|
| Action | A1 | Operation too long/short |
| A2 | Operation mistimed | |
| A3 | Operation in wrong direction | |
| A4 | Operation too much/little | |
| A5 | Misalign | |
| A6 | Right operation on wrong object | |
| A7 | Wrong operation on right object | |
| A8 | Operation omitted | |
| A9 | Operation incomplete | |
| A10 | Wrong operation on wrong object | |
| Checking | C1 | Check omitted |
| C2 | Check incomplete | |
| C3 | Right check on wrong object | |
| C4 | Wrong check on right object | |
| C5 | Check mistimed | |
| C6 | Wrong check on wrong object | |
| Information communication | I1 | Information not communicated |
| I2 | Wrong information communicated | |
| I3 | Information communication incomplete | |
| Information retrieval | R1 | Information not obtained |
| R2 | Wrong information obtained | |
| R3 | Information retrieval incomplete | |
| Selection | S1 | Selection omitted |
| S2 | Wrong selection made |
| Linguistic Variable | Triangular Fuzzy Number | Description |
|---|---|---|
| Very low (VL) | (0, 0, 2.5) | Failure modes are unlikely to occur. |
| Low (L) | (0, 2.5, 5.0) | Relatively few failure modes are likely to occur. |
| Medium (M) | (2.5, 5.0, 7.5) | Failure modes occur occasionally. |
| High (H) | (5.0, 7.5, 10.0) | Failure modes can be repeated. |
| Very high (VH) | (7.5, 10.0, 10.0) | Failure modes are almost inevitable. |
| Linguistic Variable | Triangular Fuzzy Number | Description |
|---|---|---|
| Very low (VL) | (0, 0, 2.5) | The effect of failure mode on usability can be ignored. |
| Low (L) | (0, 2.5, 5.0) | The effect slightly impacts usability. |
| Medium (M) | (2.5, 5.0, 7.5) | The effect slightly but noticeably impacts usability. |
| High (H) | (5.0, 7.5, 10.0) | The effect significantly impacts on usability. |
| Very high (VH) | (7.5, 10.0, 10.0) | The effect seriously impacts usability. |
| Linguistic Variable | Triangular Fuzzy Number | Description |
|---|---|---|
| Very low (VL) | (0, 0, 2.5) | Almost certain to be detected. |
| Low (L) | (0, 2.5, 5.0) | Easy to detect. |
| Medium (M) | (2.5, 5.0, 7.5) | Detected occasionally. |
| High (H) | (5.0, 7.5, 10.0) | Difficult to detect. |
| Very high (VH) | (7.5, 10.0, 10.0) | Almost impossible to detect. |
| Team Member | Professional Position (T1) | Job Experience (T2) | Education (T3) | Age (T4) |
|---|---|---|---|---|
| TM1 | Senior expert | 20 | PhD | 43 |
| TM2 | Intermediate expert | 17 | Master | 39 |
| TM3 | Senior expert | 35 | Bachelor | 59 |
| TM4 | Designer | 30 | Master | 52 |
| TM5 | Designer | 4 | Master | 25 |
| TM6 | Advanced user | 27 | College diploma | 50 |
| TM7 | Ordinary user | 5 | High school | 27 |
| Code | Task | Rule |
|---|---|---|
| 0 | Performing relevant tasks | Plan 0: do any of 1, 2, 3, 4, or 5 in any order |
| 1 | Media | Plan 1: do 1.1, 1.2, 1.3, 1.4, and 1.5 in order |
| 1.1 | Play media | Plan 1.1: do 1.1.1, 1.1.2, and 1.1.3 in order |
| 1.1.1 | Click on MENU | |
| 1.1.2 | Click on Media | |
| 1.1.3 | Click on Play | |
| 1.2 | Adjust volume | Plan 1.2: do 1.2.1, 1.2.2 in order |
| 1.2.1 | Click on blank area | |
| 1.2.2 | Slide volume bar | |
| 1.3 | Switch music | Plan 1.3: do 1.3.1, then do 1.3.2, 1.3.3, 1.3.4, and 1.3.5 in any order |
| 1.3.1 | Click on Selection | Plan 1.3.1: do 1.3.1.1 and 1.3.1.2 in order |
| 1.3.1.1 | Enter playlist | |
| 1.3.1.2 | Click on the songs | |
| 1.3.2 | Click on Previous | |
| 1.3.3 | Click on Next | |
| 1.3.4 | Click on Repeat | |
| 1.3.5 | Click on Shuffle | |
| 1.4 | Adjust process | Plan 1.4: do 1.4.1 and 1.4.2 in any order |
| 1.4.1 | Slide to right | |
| 1.4.2 | Slide to left | |
| 1.5 | Close media | Plan 1.5: do 1.5.1 and 1.5.2 in order |
| 1.5.1 | Click on Stop | |
| 1.5.2 | Click on MENU | |
| 2 | Navigation | Plan 2: do 2.1, 2.2, 2.3, and 2.4 in order |
| 2.1 | Open navigation | Plan 2.1: do 2.1.1 and 2.1.2 in order |
| 2.1.1 | Click on MENU | |
| 2.1.2 | Click on Navigation | |
| 2.2 | Choose place | Plan 2.2: do 2.2.1 and 2.2.2 in order |
| 2.2.1 | Set route | |
| 2.2.2 | Set destination | Plan 2.2.2: do 2.2.2.1, 2.2.2.2, and 2.2.2.3 in any order |
| 2.2.2.1 | Save current position | |
| 2.2.2.2 | Historical records | |
| 2.2.2.3 | Home address | |
| 2.3 | Start navigating | Plan 2.3: do 2.2, then do 2.3.1, 2.3.2, and 2.3.3 in order |
| 2.3.1 | Click on Selection | |
| 2.3.2 | Select route | |
| 2.3.3 | Click on Start | |
| 2.4 | Close navigation | |
| 3 | Telephone | Plan 3: do 3.1, 3.2, 3.3, and 3.4 in order |
| 3.1 | Open phone options | Plan 3.1: do 3.1.1 and 3.1.2 in order |
| 3.1.1 | Click on MENU | |
| 3.1.2 | Click on Call | |
| 3.2 | Select contacts | Plan 3.2: do 3.2.1, 3.2.2, or 3.2.3 |
| 3.2.1 | Dial number | |
| 3.2.2 | Contacts | |
| 3.2.3 | Recent | |
| 3.3 | Make calls | Plan 3.3: do 3.3.1 and 3.3.2 in order |
| 3.3.1 | Click on dial button | |
| 3.3.2 | Click on hang-up button | |
| 3.4 | Return Home | |
| 4 | Radio | Plan 4: do 4.1, 4.2, 4.3, and 4.4 in order |
| 4.1 | Turn on the radio | Plan 4.1: do 4.1.1 and 4.1.2 in order |
| 4.1.1 | Click on MEUN | |
| 4.1.2 | Click on radio options | |
| 4.2 | Switch radio | Plan 4.2: do 4.2.1, 4.2.2, and 4.2.3 in any order |
| 4.2.1 | Click on bands | Plan 4.2.1: do 4.2.1.1 and 4.2.1.2 in any order |
| 4.2.1.1 | Select AM | |
| 4.2.1.2 | Select FM | |
| 4.2.2 | Click on the radio list | |
| 4.2.3 | Click on manual | |
| 4.3 | Add station | Plan 4.3: do 4.2.2, then do 4.3.1 and 4.3.2 in order |
| 4.3.1 | Long press station | |
| 4.3.2 | Click on blank to add box | |
| 4.4 | Return home | |
| 5 | Climate | Plan 5: do 5.1, 5.2, and 5.3 in order |
| 5.1 | Turn on the air conditioner | Plan 5.1: do 5.1.1, 5.1.2, 5.1.3, and 5.1.4 in order |
| 5.1.1 | Click on MENU | |
| 5.1.2 | Click on vehicle button | |
| 5.1.3 | Click on blank | |
| 5.1.4 | Click on air conditioner button | |
| 5.2 | Set air conditioner | Plan 5.2: do 5.2.1, 5.2.2, and 5.2.3 in any order |
| 5.2.1 | Regulate air volume | Plan 5.2.1: do 5.2.1.1 and 5.2.1.2 in any order |
| 5.2.1.1 | Increase air volume | |
| 5.2.1.2 | Decrease air volume | |
| 5.2.2 | Regulate temperature | Plan 5.2.2: do 5.2.2.1 and 5.2.2.2 in any order |
| 5.2.2.1 | Turn down the temperature | |
| 5.2.2.2 | Turn up the temperature | |
| 5.2.3 | Regulate blowing mode | |
| 5.3 | Return home |
| Failure Mode No. | Code in HTA | Failure Mode Category | Failure Mode Description | Failure Mode Effect | Failure Mode Cause |
|---|---|---|---|---|---|
| 1 | 1.1.1 | A9 | Users confuse the meaning of icons. | Impact on the following operations. | The meaning of icon is unclear. |
| 2 | 1.1.2 | A9 | Users are unable to determine the correct method of operation. | Unable to advance to the next step. | The information architecture is complicated. |
| 3 | 1.2.1 | I3 | Users are not aware of how to operate. | It is difficult to complete the task. | The operation is complex. |
| 4 | 1.2.2 | A2 | Additional time is required to complete the operation. | Impact on usability. | The operation is complex. |
| 5 | 1.3.2 | I1 | Users lack confidence in their operations. | Impact on usability. | Shortage of operational clues. |
| 6 | 1.5.1 | A8 | Users omit certain steps in the operational process. | Unable to complete the task. | Insufficient relevant clues. |
| 7 | 2.2.1.1 | A9 | Users are not aware of how to operate. | It is difficult to complete the task. | Be an unreasonable design. |
| 8 | 2.3.1 | A4 | Users are not aware of how to operate. | It is difficult to complete the task. | The operation process is unreasonable. |
| 9 | 2.2.2.4 | A9 | Users are unable to locate their saved records. | Impact on usability. | Be an unreasonable design. |
| 10 | 2.4 | I3 | Users are unsure if the navigation has been initiated. | Impact on usability. | Insufficient relevant clues. |
| 11 | 3.1.2 | I2 | Users are unable to determine the correct method of operation. | Results in incorrect operation. | The information architecture is complicated. |
| 12 | 3.2.2 | R1 | Users are unable to locate the contact information. | Unable to complete the task. | Shortage of operational clues. |
| 13 | 3.2.3 | C3 | Users select the wrong objects. | Unable to complete the task. | The meaning of icon is unclear. |
| 14 | 3.4 | A8 | Users navigate back to the main interface without disconnecting the phone. | Impact on the following operations. | Shortage of operational clues. |
| 15 | 3.2.1 | A9 | Users do not know how to navigate back. | Impact on the following operations. | Insufficient relevant clues. |
| 16 | 3.2.1 | A2 | Users are not aware of how to operate. | Results in incorrect operation. | The layout of interface is unsuitable. |
| 17 | 4.2.1 | A9 | Users have difficulty understanding the meaning of words. | Unable to advance to the next step. | Overlooking users’ characteristics. |
| 18 | 4.2.2 | I3 | Users are unclear about their subsequent actions. | Results in incorrect operation. | Shortage of operational clues. |
| 19 | 4.3.1 | A9 | Users are unclear about their subsequent actions. | Results in incorrect operation. | The operation is complex. |
| 20 | 4.3.2 | A9 | Users have difficulty understanding the meaning of words. | Results in incorrect operation. | The meaning of words is unclear. |
| 21 | 5.1.3 | I1 | Users are uncertain about their next step. | Unable to advance to the next step. | There are too many operational steps. |
| 22 | 5.1.4 | A4 | Users are unable to figure out how to use it. | Results in incorrect operation. | The operation process is unreasonable. |
| 23 | 5.2.1 | A9 | Users confuse the meaning of icons. | Unable to advance to the next step. | The meaning of icon is unclear. |
| 24 | 5.2.3 | S2 | Users confuse the meaning of icons. | Results in incorrect operation. | The meaning of icon is unclear. |
| 25 | 5.2.2.1 | A9 | Users are unclear about how to adjust the temperature. | Unable to advance to the next step. | Shortage of operational clues. |
| Failure Mode No. | Fuzzy Evaluations of Team Members | Aggregation of Fuzzy Opinions | Defuzzification Value | ||||||
|---|---|---|---|---|---|---|---|---|---|
| TM1 | TM2 | TM3 | TM4 | TM5 | TM6 | TM7 | |||
| 1 | H | VH | M | VH | M | H | H | (5.072, 7.572, 9.382) | 7.342 |
| 2 | M | M | H | M | M | H | H | (3.428, 5.928, 8.428) | 5.928 |
| 3 | VH | VH | H | VH | VH | VH | VH | (7.215, 9.715, 10.000) | 8.977 |
| 4 | M | M | L | M | M | M | M | (2.227, 4.727, 7.227) | 4.727 |
| 5 | M | M | M | M | H | M | M | (2.660, 5.160, 7.660) | 5.160 |
| 6 | M | M | L | M | M | M | M | (2.227, 4.727, 7.227) | 4.727 |
| 7 | M | H | M | M | H | M | M | (2.981, 5.481, 7.981) | 5.481 |
| 8 | VH | VH | H | VH | VH | VH | H | (6.999, 9.499, 10.000) | 8.832 |
| 9 | M | M | M | H | M | H | M | (3.066, 5.566, 8.066) | 5.566 |
| 10 | M | M | H | M | M | M | M | (2.773, 5.273, 7.773) | 5.273 |
| 11 | H | H | H | H | H | M | H | (4.798, 7.298, 9.798) | 7.298 |
| 12 | H | M | M | H | H | H | H | (4.406, 6.906, 9.406) | 6.906 |
| 13 | M | M | L | M | L | M | M | (1.962, 4.462, 6.962) | 4.462 |
| 14 | M | H | M | M | M | M | M | (2.716, 5.216, 7.716) | 5.216 |
| 15 | M | M | H | M | H | M | M | (3.038, 5.538, 8.038) | 5.538 |
| 16 | H | H | M | H | H | H | H | (4.727, 7.227, 9.727) | 7.227 |
| 17 | M | M | M | M | M | M | M | (2.500, 5.000, 7.500) | 5.000 |
| 18 | H | H | H | VH | H | H | H | (5.271, 7.771, 10.000) | 7.681 |
| 19 | H | H | H | H | H | H | H | (5.000, 7.500, 10.000) | 7.500 |
| 20 | H | H | H | VH | H | H | H | (5.271, 7.771, 10.000) | 7.681 |
| 21 | M | M | M | M | M | M | M | (2.500, 5.000, 7.500) | 5.000 |
| 22 | VH | VH | VH | H | H | VH | H | (6.618, 9.118, 10.000) | 8.579 |
| 23 | H | H | H | H | H | M | M | (4.589, 7.089, 9.589) | 7.089 |
| 24 | H | H | H | H | H | M | M | (4.589, 7.089, 9.589) | 7.089 |
| 25 | M | M | L | M | L | M | M | (1.962, 4.462, 6.962) | 4.462 |
| Failure Mode No. | Fuzzy Evaluations of Team Members | Aggregation of Fuzzy Opinions | Defuzzification Value | ||||||
|---|---|---|---|---|---|---|---|---|---|
| TM1 | TM2 | TM3 | TM4 | TM5 | TM6 | TM7 | |||
| 1 | H | H | VH | H | H | M | H | (5.085, 7.585, 9.793) | 7.488 |
| 2 | H | H | H | H | H | H | M | (4.896, 7.396, 9.896) | 7.396 |
| 3 | VH | VH | VH | VH | VH | H | VH | (7.285, 9.785, 10.000) | 9.023 |
| 4 | H | M | H | H | M | H | H | (4.519, 7.019, 9.519) | 7.019 |
| 5 | H | M | M | H | H | H | H | (4.406, 6.906, 9.406) | 6.906 |
| 6 | L | L | L | L | L | L | M | (0.104, 2.604, 5.104) | 2.604 |
| 7 | H | H | H | M | H | H | H | (4.741, 7.241, 9.741) | 7.241 |
| 8 | H | H | H | H | VH | H | VH | (5.389, 7.889, 10.000) | 7.759 |
| 9 | M | M | M | H | M | M | H | (2.967, 5.467, 7.967) | 5.467 |
| 10 | M | M | M | M | H | H | M | (2.967, 5.467, 7.967) | 5.467 |
| 11 | H | H | M | M | H | H | H | (4.364, 6.864, 9.364) | 6.864 |
| 12 | H | H | H | H | M | M | H | (4.533, 7.033, 9.533) | 7.033 |
| 13 | M | M | M | M | M | L | M | (2.298, 4.798, 7.298) | 4.798 |
| 14 | M | M | M | M | H | M | M | (2.660, 5.160, 7.660) | 5.160 |
| 15 | H | H | H | M | H | H | H | (4.741, 7.241, 9.741) | 7.241 |
| 16 | H | H | H | H | H | H | VH | (5.117, 7.617, 10.000) | 7.578 |
| 17 | M | M | M | M | M | M | H | (2.604, 5.104, 7.604) | 5.104 |
| 18 | H | VH | H | H | H | VH | H | (5.543, 8.043, 10.000) | 7.862 |
| 19 | H | H | H | H | VH | VH | H | (5.487, 7.987, 10.000) | 7.825 |
| 20 | VH | H | H | VH | VH | VH | H | (6.548, 9.048, 10.000) | 8.532 |
| 21 | H | M | M | M | H | H | H | (3.904, 6.404, 8.904) | 6.404 |
| 22 | VH | VH | VH | VH | VH | H | VH | (7.285, 9.785, 10.000) | 9.023 |
| 23 | H | H | H | M | H | H | H | (4.741, 7.241, 9.741) | 7.241 |
| 24 | H | H | H | VH | H | H | H | (5.271, 7.771, 10.000) | 7.681 |
| 25 | H | VH | H | H | H | M | H | (5.029, 7.529, 9.793) | 7.451 |
| Failure Mode No. | Fuzzy Evaluations of Team Members | Aggregation of Fuzzy Opinions | Defuzzification Value | ||||||
|---|---|---|---|---|---|---|---|---|---|
| TM1 | TM2 | TM3 | TM4 | TM5 | TM6 | TM7 | |||
| 1 | M | L | M | L | L | L | M | (0.998, 3.498, 5.998) | 3.498 |
| 2 | L | L | L | L | M | L | L | (0.160, 2.660, 5.160) | 2.660 |
| 3 | M | M | M | M | M | M | L | (2.396, 4.896, 7.396) | 4.896 |
| 4 | M | M | M | M | M | M | M | (2.500, 5.000, 7.500) | 5.000 |
| 5 | M | M | L | M | M | M | M | (2.227, 4.727, 7.227) | 4.727 |
| 6 | L | L | L | L | L | L | L | (0.000, 2.500, 5.000) | 2.500 |
| 7 | M | M | M | M | L | L | M | (2.033, 4.533, 7.033) | 4.533 |
| 8 | L | L | L | L | L | L | L | (0.000, 2.500, 5.000) | 2.500 |
| 9 | M | L | M | M | M | M | M | (2.284, 4.784, 7.284) | 4.784 |
| 10 | M | L | L | M | M | M | M | (1.906, 4.406, 6.906) | 4.406 |
| 11 | M | M | M | L | L | L | L | (1.110, 3.610, 6.110) | 3.610 |
| 12 | M | M | L | L | L | L | L | (0.594, 3.094, 5.594) | 3.094 |
| 13 | L | L | M | L | L | L | L | (0.273, 2.773, 5.273) | 2.773 |
| 14 | M | M | M | M | L | M | L | (2.131, 4.631, 7.131) | 4.631 |
| 15 | M | M | L | M | M | L | L | (1.572, 4.072, 6.572) | 4.072 |
| 16 | M | L | M | M | M | L | L | (1.629, 4.129, 6.629) | 4.129 |
| 17 | M | M | M | M | L | M | L | (2.131, 4.631, 7.131) | 4.631 |
| 18 | L | L | M | L | L | L | L | (0.273, 2.773, 5.273) | 2.773 |
| 19 | L | L | L | L | L | L | L | (0.000, 2.500, 5.000) | 2.500 |
| 20 | L | L | L | L | L | L | L | (0.000, 2.500, 5.000) | 2.500 |
| 21 | M | M | M | M | L | L | L | (1.685, 4.185, 6.685) | 4.185 |
| 22 | H | H | H | VH | H | H | H | (5.271, 7.771, 10.000) | 7.681 |
| 23 | M | L | L | M | M | L | M | (1.460, 3.960, 6.460) | 3.960 |
| 24 | H | H | M | H | H | M | M | (4.072, 6.572, 9.072) | 6.572 |
| 25 | M | M | M | M | M | L | M | (2.298, 4.798, 7.298) | 4.798 |
| Traits | Classify | Score |
|---|---|---|
| Professional position (T1) | Senior expert | 5 |
| Intermediate expert | 4 | |
| Designer | 3 | |
| Advanced user | 2 | |
| Ordinary user | 1 | |
| Job experience (T2) | ≥30 years | 5 |
| 20–29 | 4 | |
| 10–19 | 3 | |
| 6–9 | 2 | |
| ≤5 | 1 | |
| Education (T3) | PhD | 5 |
| Master | 4 | |
| Bachelor | 3 | |
| College diploma | 2 | |
| High school | 1 | |
| Age (T4) | ≥50 | 4 |
| 40–49 | 3 | |
| 30–39 | 2 | |
| ≤29 | 1 |
| Team Member | Weighting Traits | Total Score | Weight | |||
|---|---|---|---|---|---|---|
| T1 | T2 | T3 | T4 | |||
| TM1 | 5 | 4 | 5 | 3 | 17 | 0.191 |
| TM2 | 4 | 3 | 4 | 2 | 13 | 0.146 |
| TM3 | 5 | 5 | 3 | 4 | 17 | 0.191 |
| TM4 | 3 | 5 | 4 | 4 | 16 | 0.180 |
| TM5 | 3 | 1 | 4 | 1 | 9 | 0.101 |
| TM6 | 2 | 4 | 2 | 4 | 12 | 0.135 |
| TM7 | 1 | 2 | 1 | 1 | 5 | 0.056 |
| Team Member | Average Agreement Degree (AAD) | Relative Agreement Degree (RAD) | Consensus Degree Coefficient (CDC) |
|---|---|---|---|
| TM1 | 0.448 | 0.190 | 0.191 |
| TM2 | 0.267 | 0.113 | 0.130 |
| TM3 | 0.238 | 0.101 | 0.146 |
| TM4 | 0.267 | 0.113 | 0.147 |
| TM5 | 0.238 | 0.101 | 0.101 |
| TM6 | 0.448 | 0.190 | 0.163 |
| TM7 | 0.448 | 0.190 | 0.123 |
| Failure Mode No. | FRPN | Prioritization |
|---|---|---|
| 1 | 6.395 | 8 |
| 2 | 5.347 | 19 |
| 3 | 8.078 | 1 |
| 4 | 6.286 | 14 |
| 5 | 6.267 | 15 |
| 6 | 3.602 | 25 |
| 7 | 6.330 | 12 |
| 8 | 6.432 | 6 |
| 9 | 5.153 | 20 |
| 10 | 5.113 | 21 |
| 11 | 6.374 | 10 |
| 12 | 6.289 | 13 |
| 13 | 4.869 | 24 |
| 14 | 5.046 | 22 |
| 15 | 6.093 | 17 |
| 16 | 6.384 | 9 |
| 17 | 5.013 | 23 |
| 18 | 6.467 | 4 |
| 19 | 6.411 | 7 |
| 20 | 6.823 | 3 |
| 21 | 5.889 | 18 |
| 22 | 8.028 | 2 |
| 23 | 6.332 | 11 |
| 24 | 6.450 | 5 |
| 25 | 6.233 | 16 |
| Failure Mode No. | RPN Derived from the Traditional FMEA Method | FRPN Derived from the Proposed Approach | |||
|---|---|---|---|---|---|
| Occurrence | Severity | Detection | RPN | ||
| 1 | 8 | 7 | 4 | 224 | 6.395 |
| 16 | 7 | 8 | 4 | 224 | 6.384 |
| 8 | 9 | 8 | 3 | 216 | 6.432 |
| 20 | 8 | 9 | 3 | 216 | 6.823 |
| 11 | 7 | 6 | 5 | 210 | 6.374 |
| 12 | 7 | 5 | 6 | 210 | 6.289 |
| 23 | 6 | 7 | 5 | 210 | 6.332 |
| 7 | 6 | 8 | 4 | 192 | 6.330 |
| 18 | 8 | 8 | 3 | 192 | 6.467 |
| 19 | 8 | 6 | 4 | 192 | 6.411 |
| 15 | 6 | 6 | 4 | 144 | 6.093 |
| 21 | 4 | 6 | 6 | 144 | 5.889 |
| 9 | 6 | 5 | 4 | 120 | 5.153 |
| 10 | 5 | 6 | 4 | 120 | 5.113 |
| 14 | 4 | 6 | 5 | 120 | 5.046 |
| 17 | 6 | 4 | 5 | 120 | 5.013 |
| Failure Mode No. | Prioritization Based on the Proposed Approach | Prioritization Based on the Combination of FMEA with Fuzzy TOPSIS | Prioritization Based on the Combination of FMEA with Fuzzy Logic |
|---|---|---|---|
| 1 | 8 | 9 | 9 |
| 2 | 19 | 16 | 19 |
| 3 | 1 | 2 | 1 |
| 4 | 14 | 18 | 11 |
| 5 | 15 | 15 | 11 |
| 6 | 25 | 25 | 25 |
| 7 | 12 | 12 | 11 |
| 8 | 6 | 4 | 5 |
| 9 | 20 | 19 | 20 |
| 10 | 21 | 21 | 20 |
| 11 | 10 | 11 | 10 |
| 12 | 13 | 13 | 11 |
| 13 | 24 | 24 | 24 |
| 14 | 22 | 22 | 22 |
| 15 | 17 | 14 | 16 |
| 16 | 9 | 7 | 8 |
| 17 | 23 | 23 | 22 |
| 18 | 4 | 6 | 4 |
| 19 | 7 | 8 | 7 |
| 20 | 3 | 5 | 3 |
| 21 | 18 | 20 | 16 |
| 22 | 2 | 1 | 2 |
| 23 | 11 | 10 | 15 |
| 24 | 5 | 3 | 6 |
| 25 | 16 | 17 | 18 |
Disclaimer/Publisher’s Note: The statements, opinions and data contained in all publications are solely those of the individual author(s) and contributor(s) and not of MDPI and/or the editor(s). MDPI and/or the editor(s) disclaim responsibility for any injury to people or property resulting from any ideas, methods, instructions or products referred to in the content. |
© 2025 by the authors. Licensee MDPI, Basel, Switzerland. This article is an open access article distributed under the terms and conditions of the Creative Commons Attribution (CC BY) license (https://creativecommons.org/licenses/by/4.0/).
Share and Cite
Li, Y.; Zhu, L. Failure Modes Analysis Related to User Experience in Interactive System Design Through a Fuzzy Failure Mode and Effect Analysis-Based Hybrid Approach. Appl. Sci. 2025, 15, 2954. https://doi.org/10.3390/app15062954
Li Y, Zhu L. Failure Modes Analysis Related to User Experience in Interactive System Design Through a Fuzzy Failure Mode and Effect Analysis-Based Hybrid Approach. Applied Sciences. 2025; 15(6):2954. https://doi.org/10.3390/app15062954
Chicago/Turabian StyleLi, Yongfeng, and Liping Zhu. 2025. "Failure Modes Analysis Related to User Experience in Interactive System Design Through a Fuzzy Failure Mode and Effect Analysis-Based Hybrid Approach" Applied Sciences 15, no. 6: 2954. https://doi.org/10.3390/app15062954
APA StyleLi, Y., & Zhu, L. (2025). Failure Modes Analysis Related to User Experience in Interactive System Design Through a Fuzzy Failure Mode and Effect Analysis-Based Hybrid Approach. Applied Sciences, 15(6), 2954. https://doi.org/10.3390/app15062954