
Comparison of Battery Electrical Vehicles and Internal Combustion Engine Vehicles–Greenhouse Gas Emission Life Cycle Assessment


 , ,
, ,  , and
, and
Abstract
1. Introduction
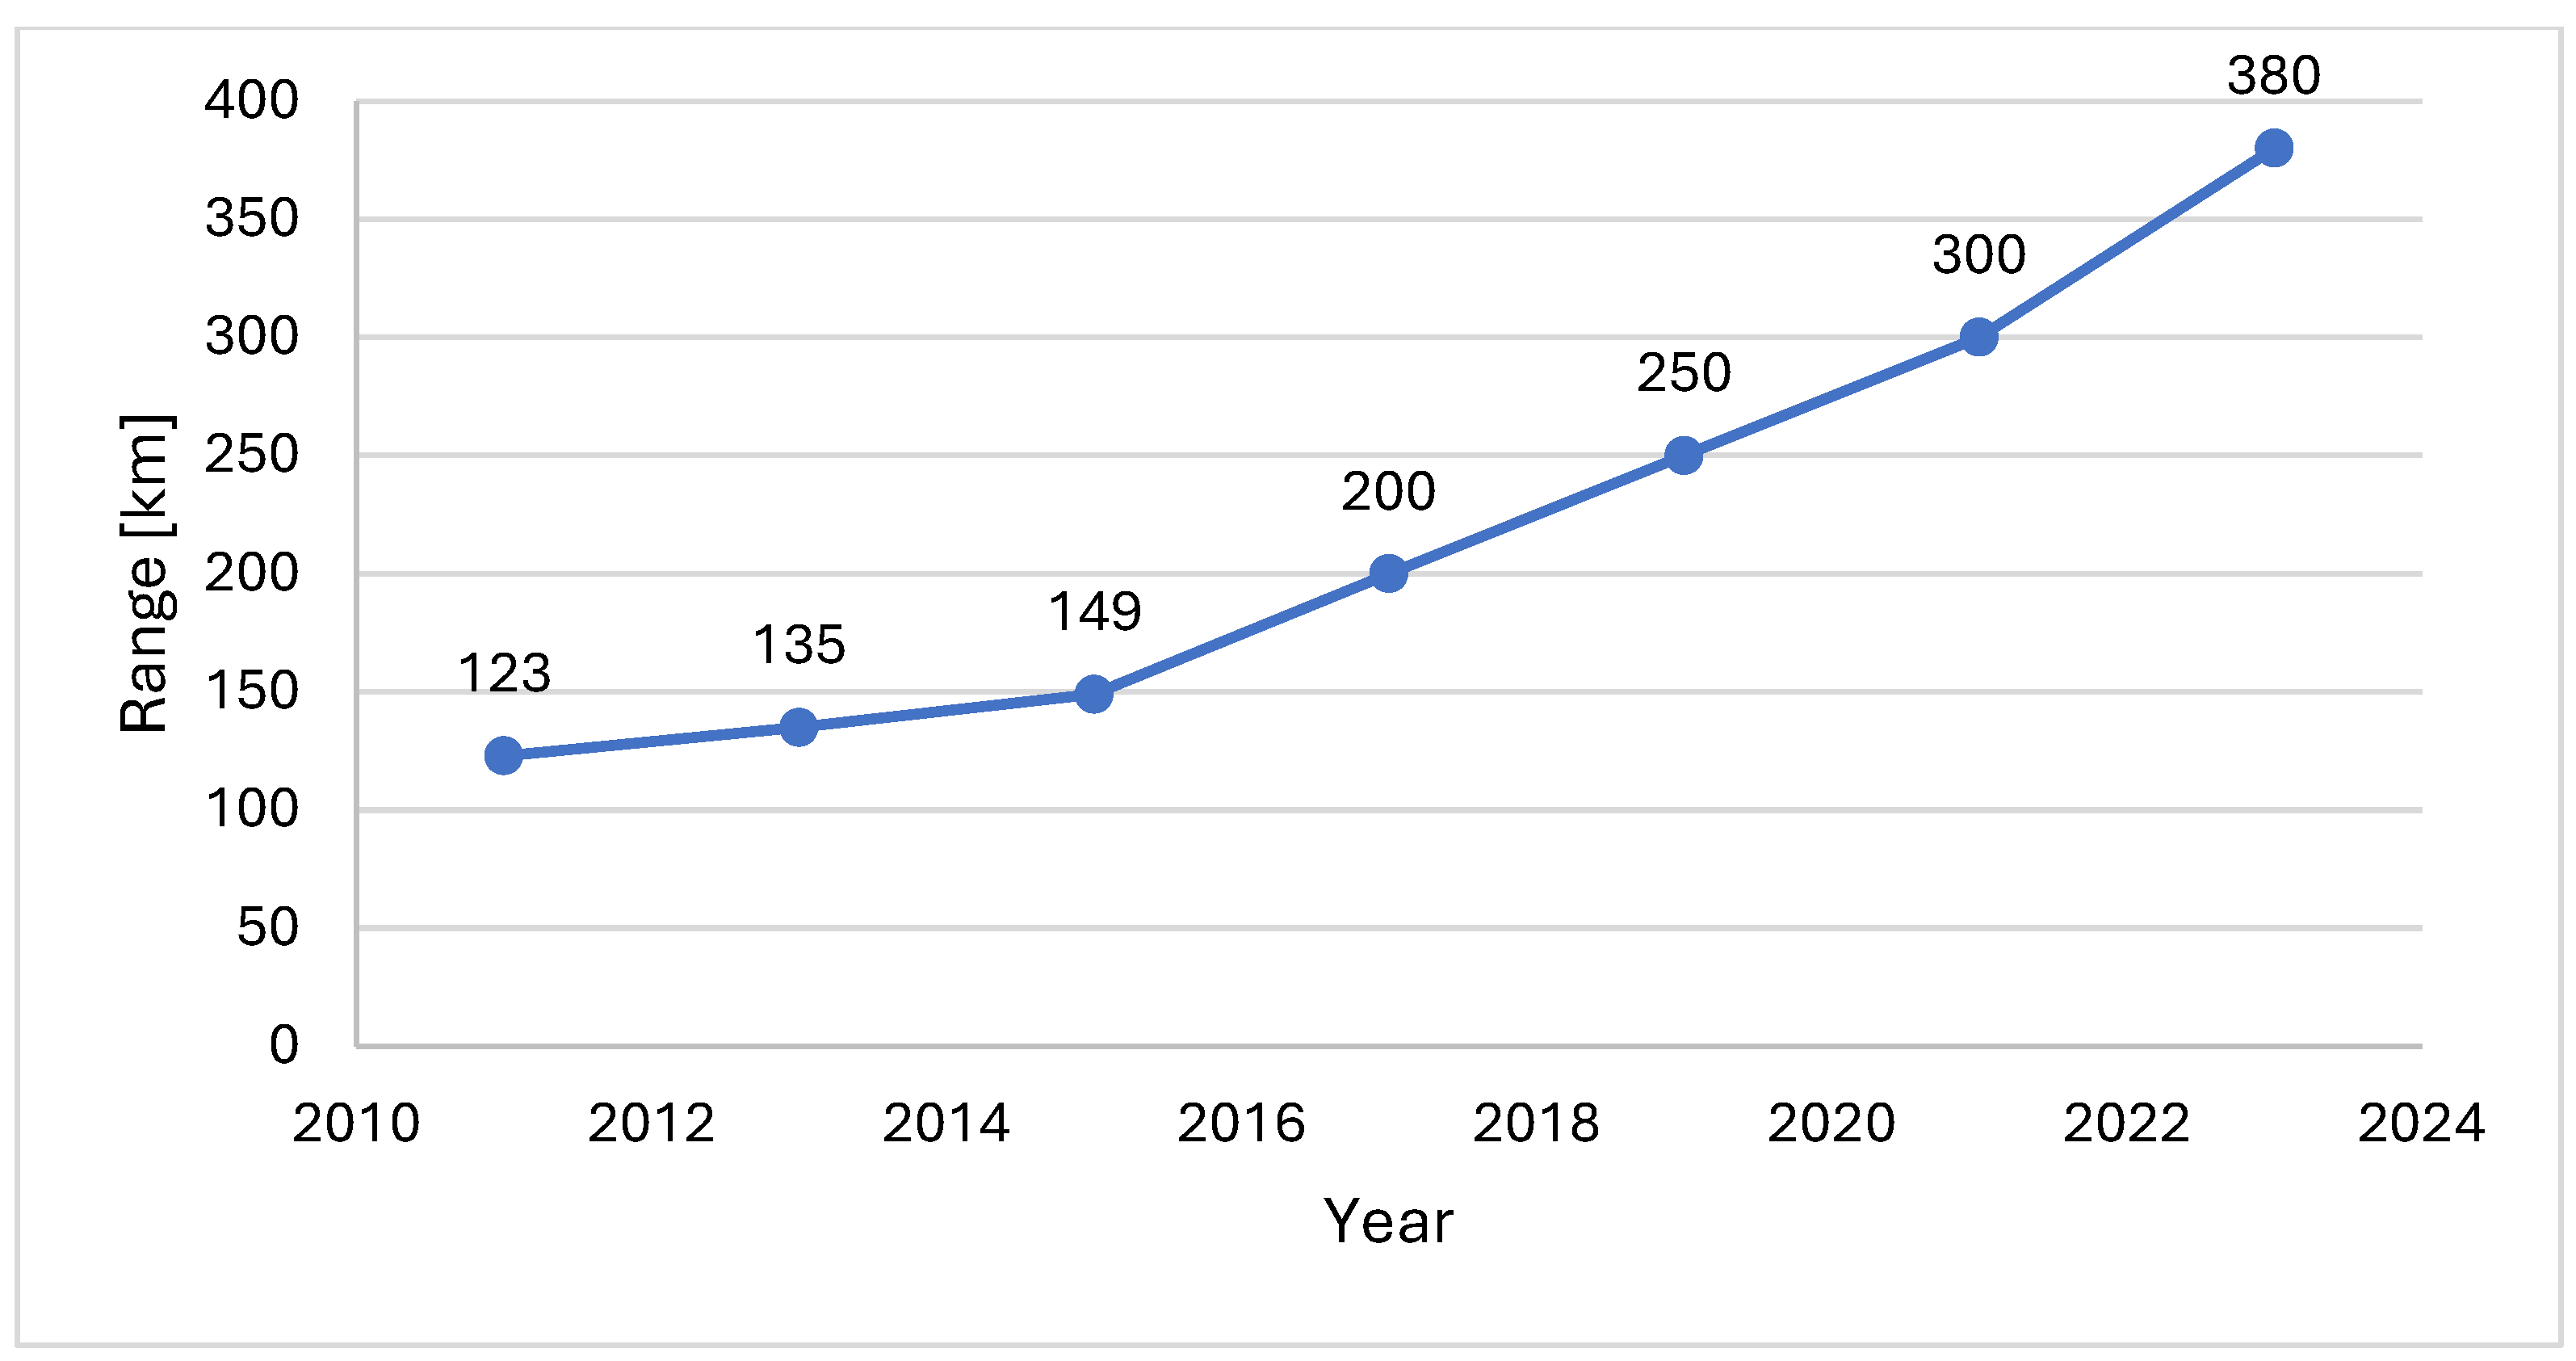
1.1. Autonomy
1.2. Batteries
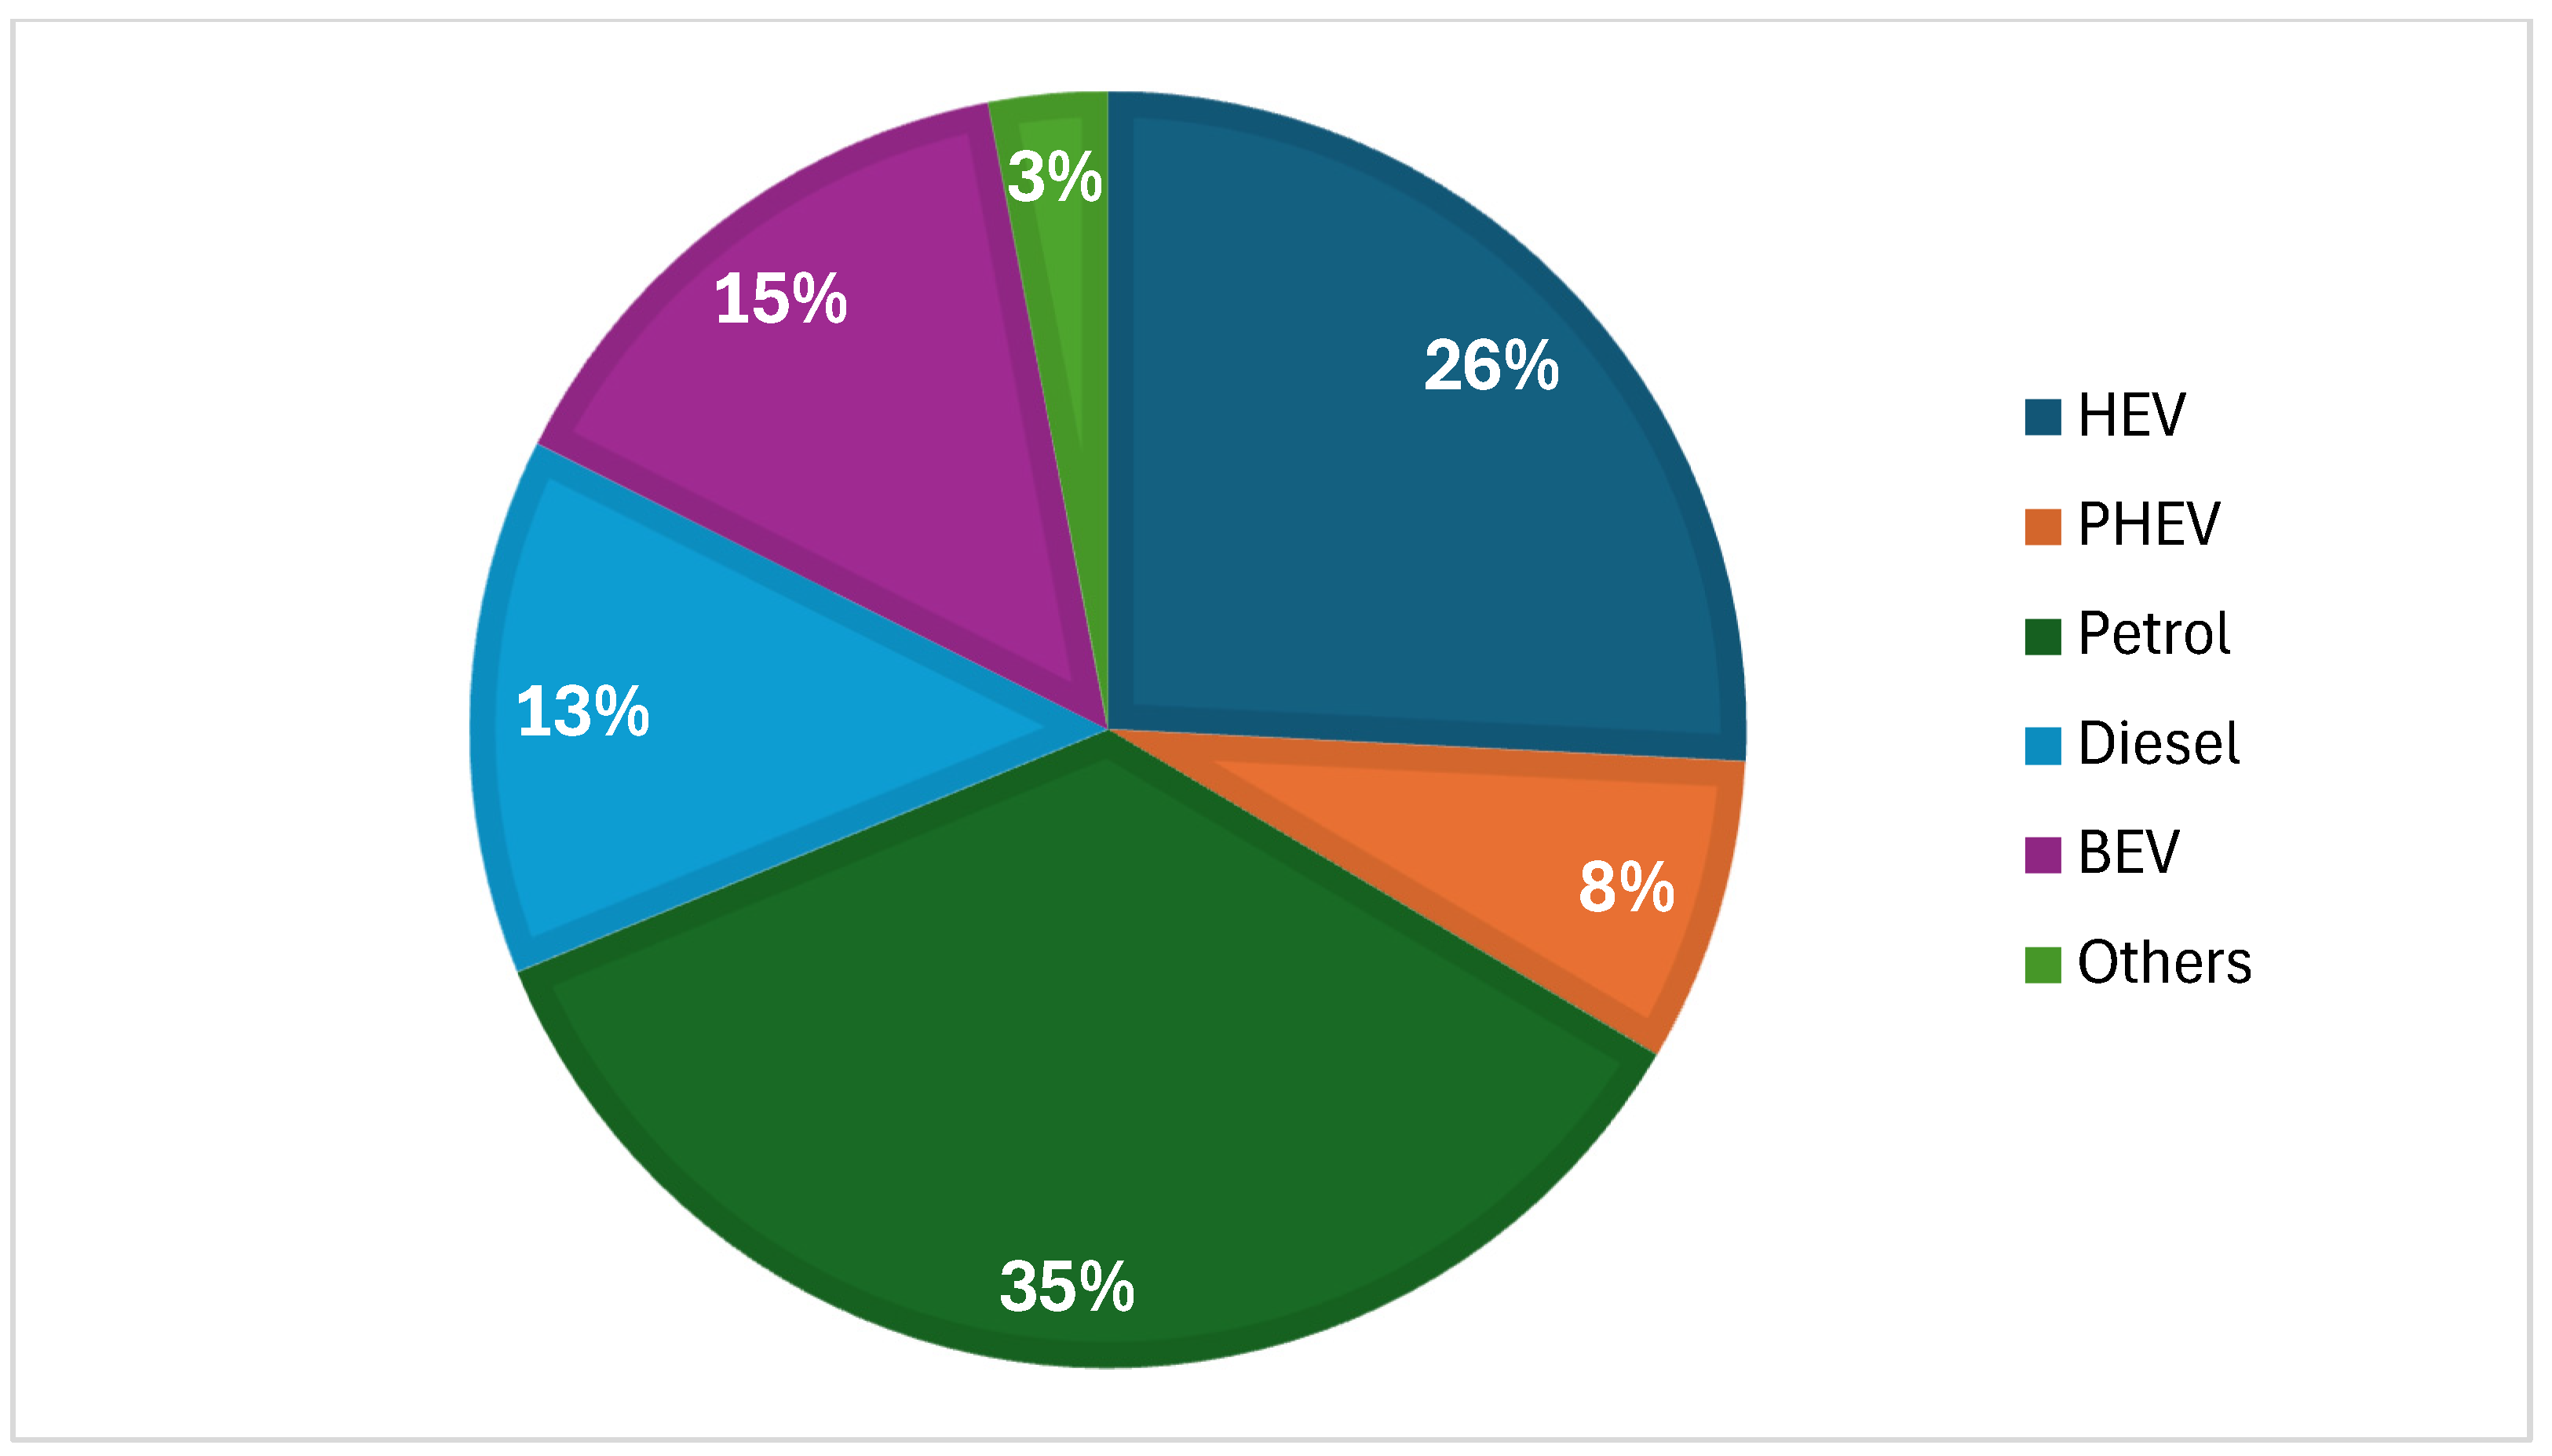
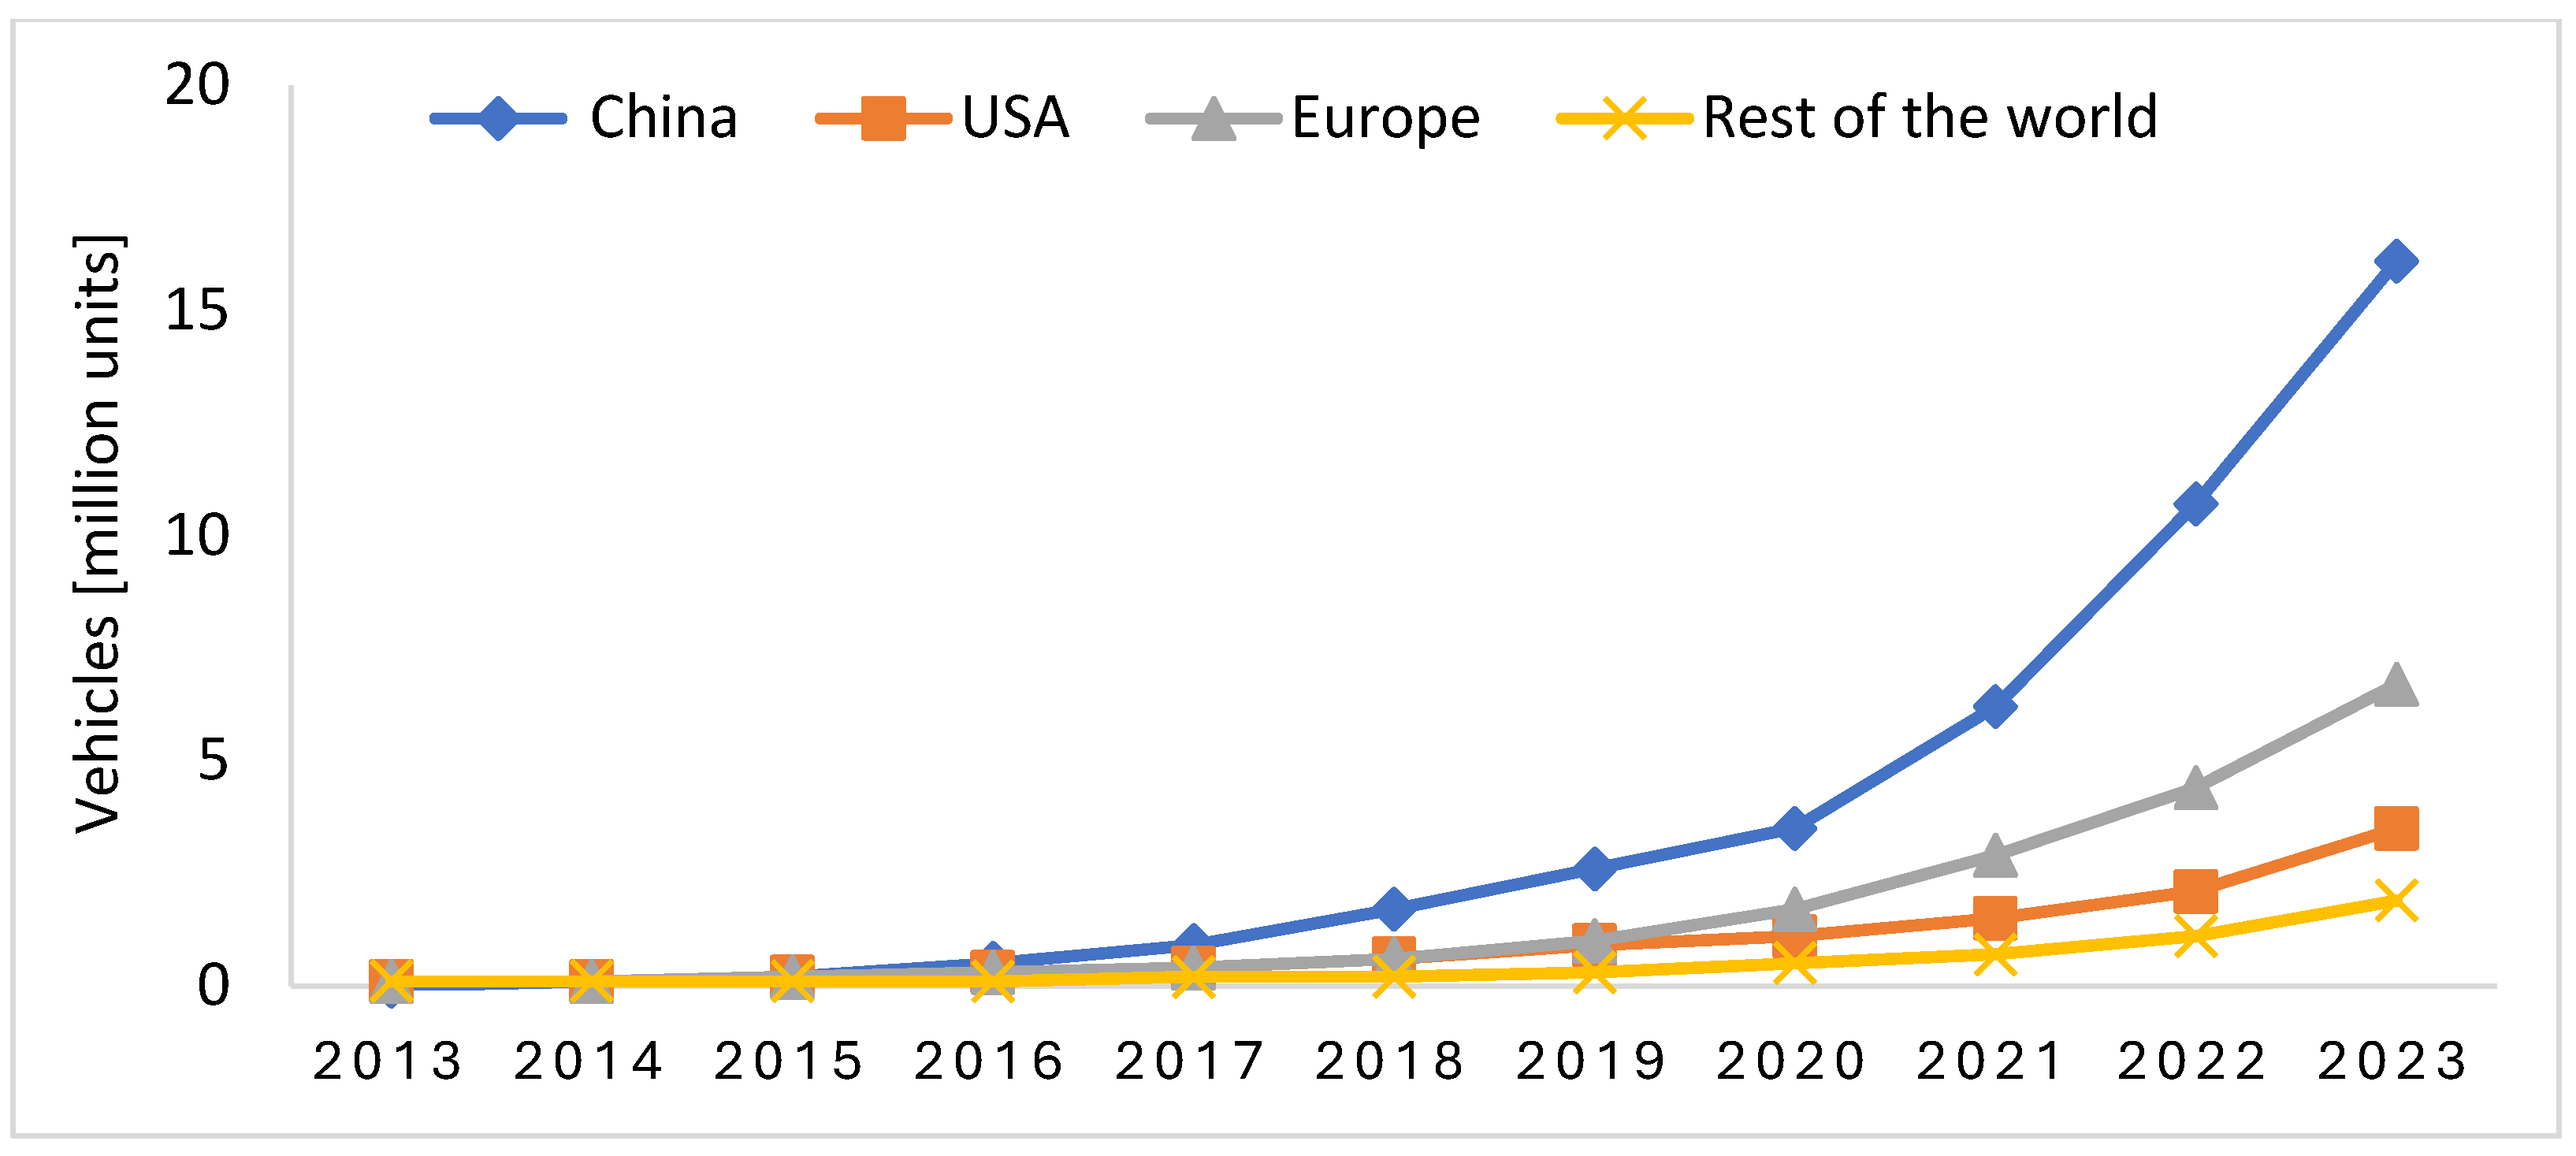
1.3. Electric Car Ownership
1.4. EU Climate Goals
2. Method for Comparing ICEVs and BEVs—Life Cycle Assessments (LCAs)
- −
- Comparing the total life cycle emissions for BEVs and ICE vehicles;
- −
- Evaluating the impact of energy sources and battery production on GHG emissions;
- −
- Assessing the role of recycling and maintenance in emission reductions.
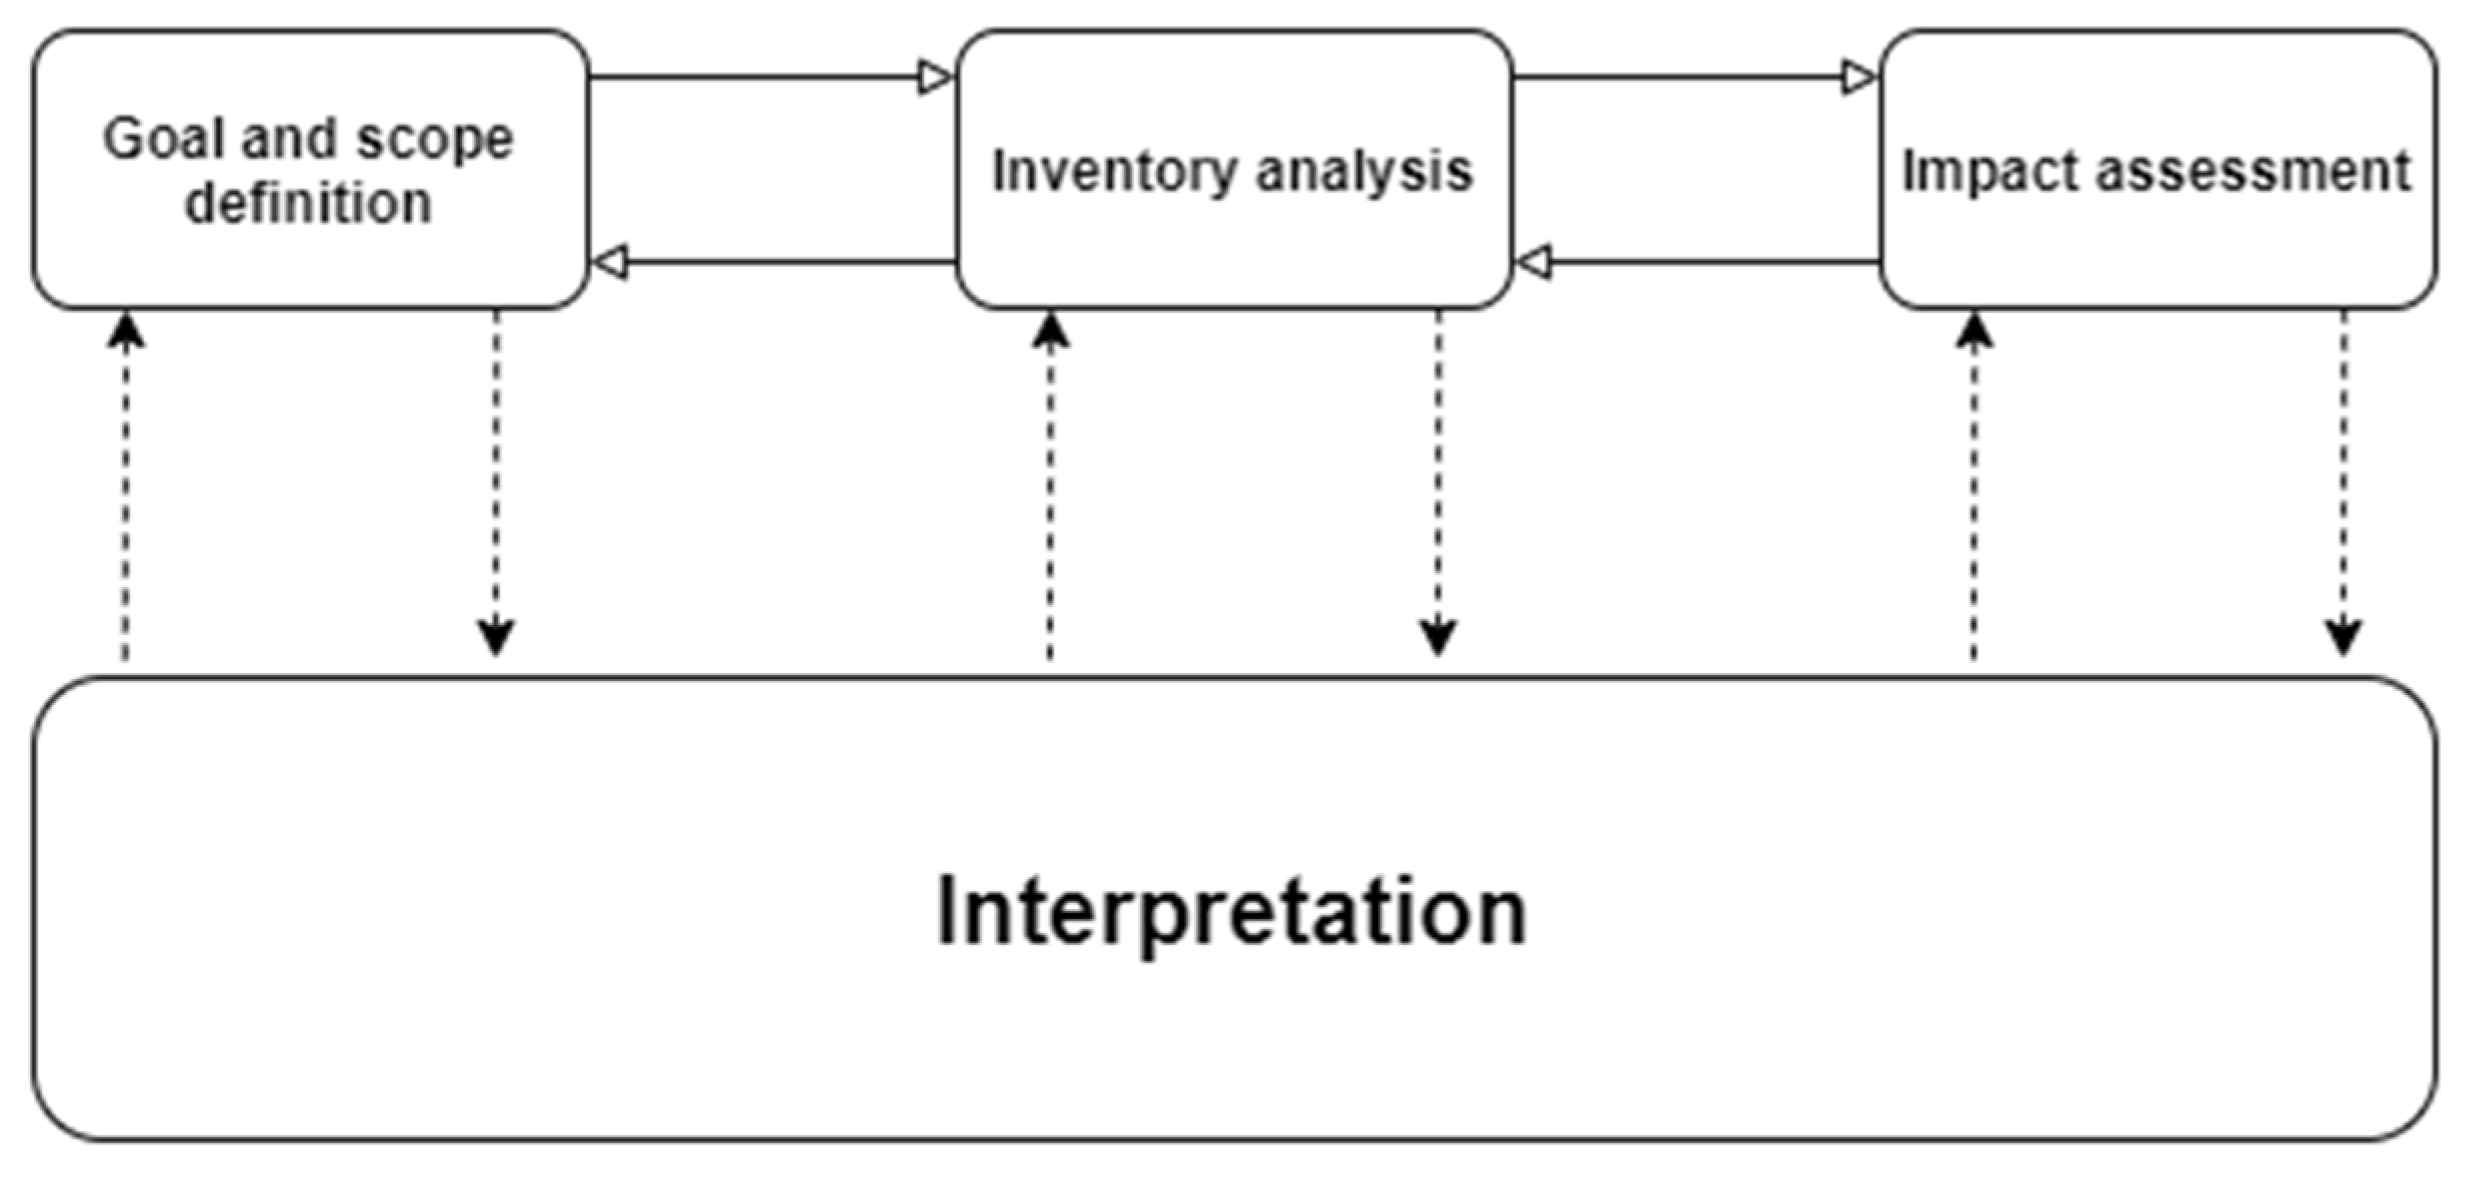
- Establish clear objectives for comparing BEVs and ICE vehicles.
- Define boundaries to include vehicle production, energy production, use phase, maintenance, and end-of-life processes.
- Document assumptions, such as energy grid compositions and vehicle lifespans, ensuring that they are transparent and aligned with the study’s objectives.
- Production Phase: includes emissions from vehicle manufacturing (excluding and including battery production) and battery production (varying by country and battery chemistry).
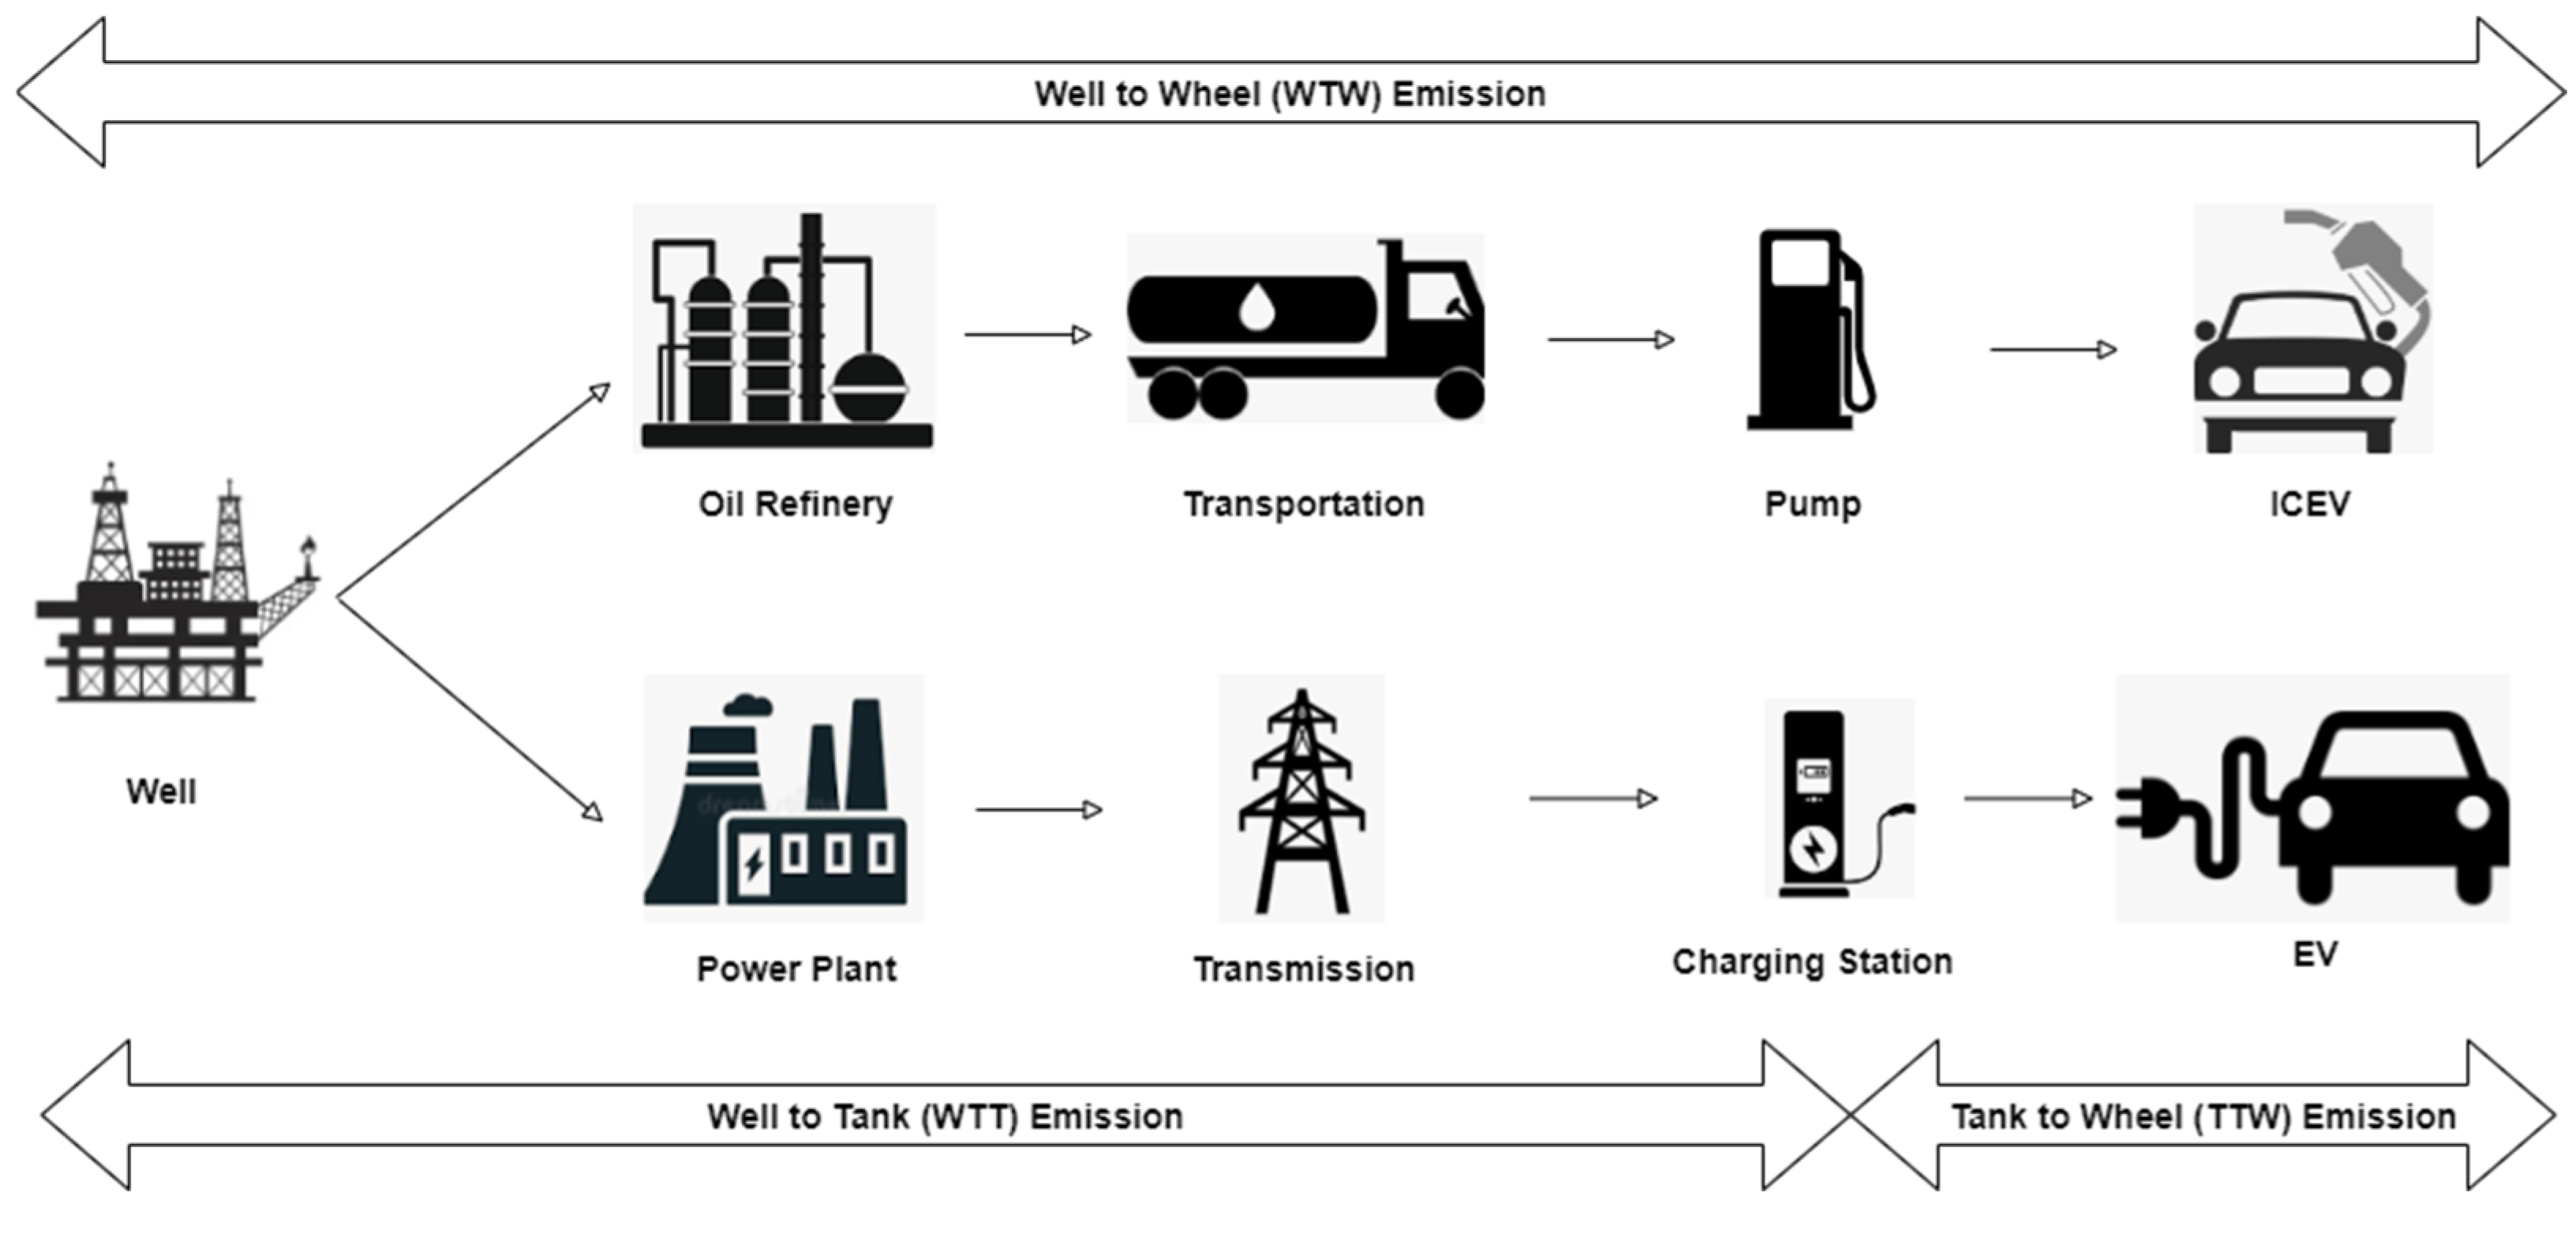
- Use Phase: combines Well-to-Wheel (WTW) emissions including WTT (Well-to-Tank; emissions from fuel extraction, refining, and transportation) and TTW (Tank-to-Wheel; combustion or electricity use during operation).
- End-of-Life Phase: covers emissions from recycling, disposal, and remanufacturing.
- Production, differentiating BEVs and ICE vehicles by material intensity.
- Operation, analyzing energy losses in electricity generation, distribution, and use.
- End of life, evaluating emissions savings from advanced recycling technologies.
- Region-specific energy mix emission data were applied to refine the calculations.
- Analyze results to identify the critical phases and factors influencing emissions.
- Evaluate scenarios under varying assumptions, such as grid decarbonization or advances in battery production and recycling.

| BEVs | ICEVs-Petrol | ICEVs-Diesel | |||||||
|---|---|---|---|---|---|---|---|---|---|
| Small | Medium | Large | Small | Medium | Large | Small | Medium | Large | |
| tCO2e/vehicle | 5.0 | 6.0 | 7.0 | 5.5 | 6.7 | 7.8 | 5.8 | 7.0 | 8.2 |
| Size of Vehicle | ICEVs-Petrol (L/100 km) | ICEVs-Diesel (L/100 km) | BEVs (kWh/100 km) | Battery Capacity of BEVs (kWh) |
|---|---|---|---|---|
| Small | 6.5 | 5.4 | 16.0 | 45.0 |
| Medium | 7.5 | 6.2 | 17.5 | 60.0 |
| Large | 8.8 | 6.7 | 19.0 | 75.0 |
| Fuel | WTT (gCO2e/L) | TTW (gCO2e/L) | WTW (gCO2e/L) |
|---|---|---|---|
| Petrol | 680 | 2240 | 2920 |
| Diesel | 980 | 2440 | 3420 |
| Emissions [gCO2e/kWh] | Portugal | USA | China | Norway | Poland | Sweden | EU 27 | France |
| 166 | 369 | 582 | 30 | 662 | 41 | 229 | 56 |
| Type of Vehicle | BEVs | ICEVs-Petrol | ICEVs-Diesel | ||||||
|---|---|---|---|---|---|---|---|---|---|
| Small | Medium | Large | Small | Medium | Large | Small | Medium | Large | |
| tCO2e/vehicle | 1.6 | 2.0 | 2.4 | 1.1 | 1.3 | 1.6 | 1.1 | 1.3 | 1.6 |
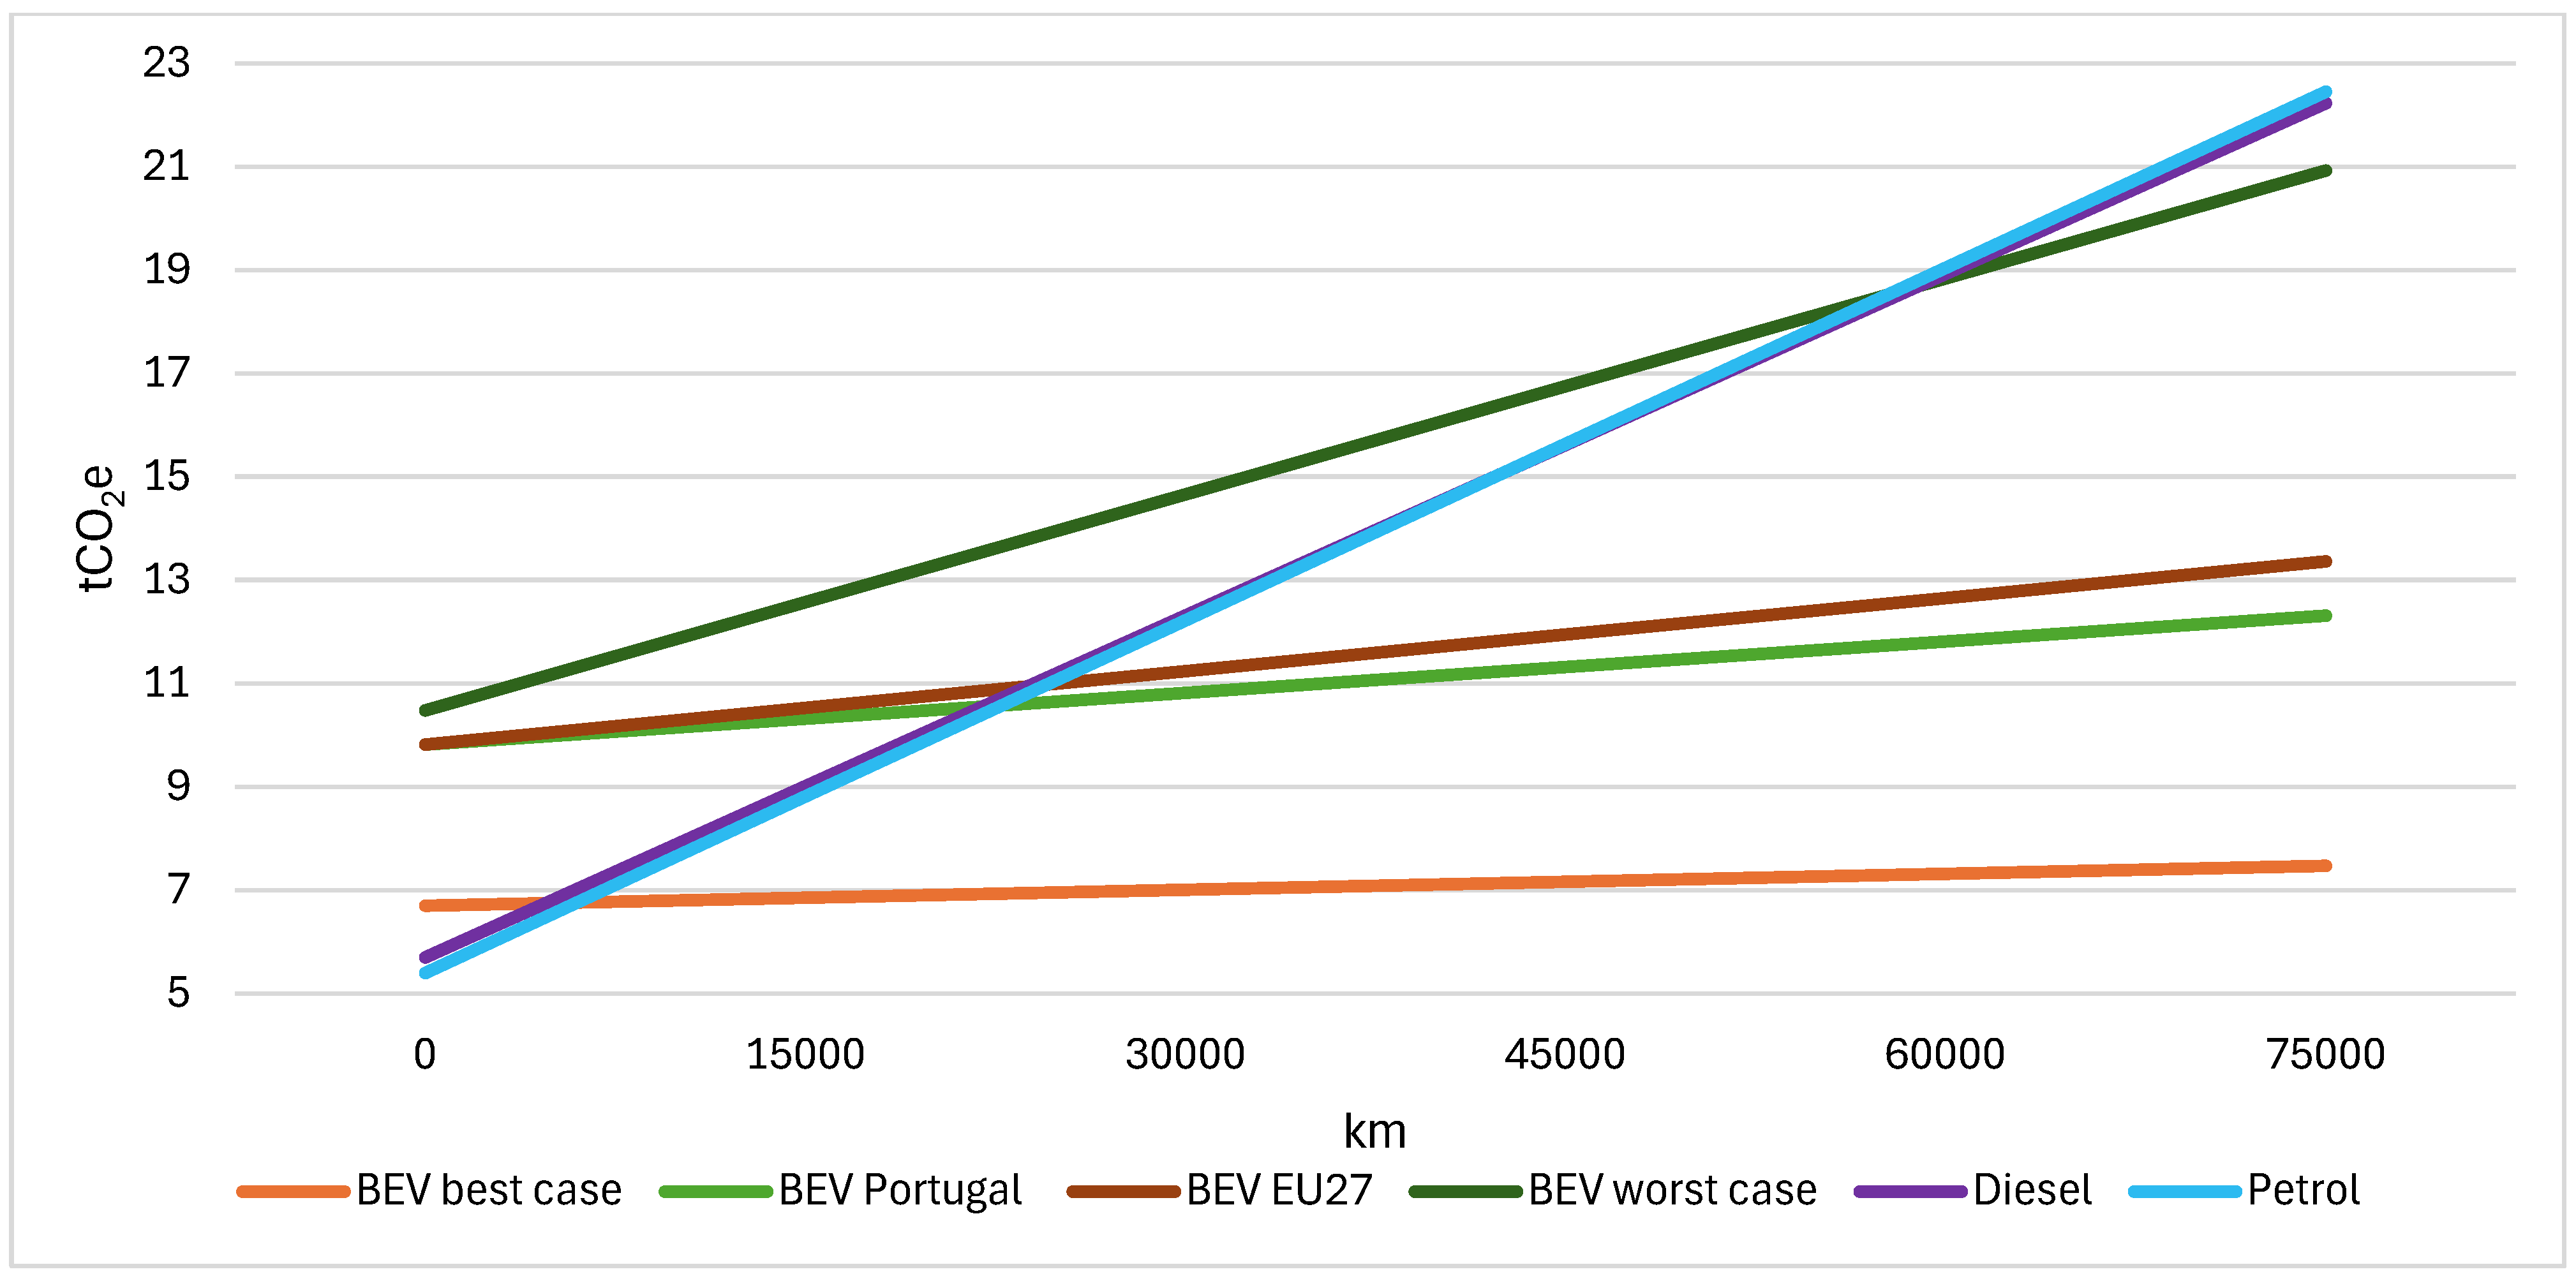
3. Results
4. Conclusions
Author Contributions
Funding
Institutional Review Board Statement
Informed Consent Statement
Data Availability Statement
Conflicts of Interest
Nomenclature
| BEV | Battery Electric Vehicle |
| EU | European Union |
| EV | Electric Vehicle |
| GHG | Greenhouse Gases |
| HEV | Hybrid Electrical Vehicle |
| ICE | Internal Combustion Engine |
| ICEV | Internal Combustion Engine Vehicle |
| PHEV | Plug-In Hybrid Electrical Vehicle |
| SoC | State of Charge |
| SoH | State of Health |
| TTW | Tank-to-Wheel |
| WTT | Weel-to-Tank |
| WTW | Weel-to-Wheel |
Appendix A
| # Manufacturing emissions in tCO2e per vehicle manufacturing_ICEV = { "gasoline": { "small": 5.5, "medium": 6.7, "large": 7.8, } , "diesel": { "small": 5.8, "medium": 7.0, "large": 8.2, } } manufacturing_BEV = {"small": 5.0, "medium": 6.0, "large": 7.0} # Battery capacity in kWh per vehicle battery_capacity = {"small": 45, "medium": 60, "large": 75} # Emissions from battery production in kgCO2e per kWh of battery battery_production_emissions = { "Sweden": 45, "South Korea": 72, "USA": 74, "China": 108, "Battery Average": 97 } # End-of-life emissions in tCO2e per vehicle end_of_life_emissions = { "small_BEV": -1.6, "medium_BEV": -2, "large_BEV": -2.4, "small_ICEV": -1.1, "medium_ICEV": -1.3, "large_ICEV": -1.6 } # TTW emissions tailpipe_emissions_per_liter_ICEV = { "gasoline": 2240/1000/1000, # tCO2e/L "diesel": 2440/1000/1000 # tCO2e/L } # WTT emissions # WTT Maintenance emissions in tCO2e/km maintenance_emissions_per_km_ICEV = 8.34/1000/1000 maintenance_emissions_per_km_BEV = 4.17/1000/1000 # WTT emissions, extraction refining and transportation wtt_per_liter_ICEV = { "gasoline": 680/1000/1000, # tCO2e/L "diesel": 980/1000/1000 # tCO2e/L } # WTT electricity mix electricity_generation_emissions_per_kWh = { "Portugal": 166/1000/1000, # tCO2e/kWh "USA": 369/1000/1000, # tCO2e/kWh "China": 582/1000/1000, # tCO2e/kWh "Germany": 381/1000/1000, # tCO2e/kWh "Poland": 662/1000/1000, # tCO2e/kWh "Sweden": 41/1000/1000, # tCO2e/kWh "EU27 Average": 229/1000/1000, # tCO2e/kWh "Norway": 30/1000/1000, # tCO2e/kWh "France": 56/1000/1000 # tCO2e/kWh } # Vehicle fuel and electricity consumption consumption_per_100km = { "gasoline": { "small": 6.5/100, # l/km "medium": 7.5/100, # l/km "large": 8.8/100, # l/km } , "diesel": { "small": 5.4/100, # l/km "medium": 6.2/100, # l/km "large": 6.7/100, # l/km }, "BEV": { "small": 16/100, # kWh/km "medium": 17.5/100, # kWh/km "large": 19/100 # kWh/km } } # Function to calculate total emissions for a given distance def calculate_emissions(vehicle_type, size, distance, fuel_type=None, battery_prod_loc=None, elec_mix=None): if vehicle_type == "ICEV": manufacturing = manufacturing_ICEV[fuel_type][size] maintenance = maintenance_emissions_per_km_ICEV * distance wtt = wtt_per_liter_ICEV[fuel_type] * distance * consumption_per_100km[fuel_type][size] tailpipe = tailpipe_emissions_per_liter_ICEV[fuel_type] * distance * consumption_per_100km[fuel_type][size] end_of_life = end_of_life_emissions[f"{size}_ICEV"] return manufacturing + wtt + maintenance + tailpipe + end_of_life elif vehicle_type == "BEV": manufacturing = manufacturing_BEV[size] battery_production = battery_capacity[size] * battery_production_emissions[battery_prod_loc]/1000 # tCO2e maintenance = maintenance_emissions_per_km_BEV * distance # Adjust electricity use for charging losses electricity_use = consumption_per_100km["BEV"][size] * distance * electricity_generation_emissions_per_kWh[elec_mix]*(1/0.857) end_of_life = end_of_life_emissions[f"{size}_BEV"] return manufacturing + battery_production + maintenance + electricity_use + end_of_life # Finding the exact distance where BEV becomes more eco-friendly than ICEV max_distance = 240000 countries = ["Portugal", "USA", "China", "Germany", "Poland", "Sweden", "EU27 Average", "Norway", "France"] battery_locations = ["Sweden", "South Korea", "USA", "China", "Battery Average"] results = [] for size in ["small", "medium", "large"]: for fuel_type in ["gasoline", "diesel"]: for country in countries: for battery_loc in battery_locations: for distance in range(0, max_distance + 1): emissions_ICEV = calculate_emissions("ICEV", size, distance, fuel_type=fuel_type) emissions_BEV = calculate_emissions("BEV", size, distance, battery_prod_loc=battery_loc, elec_mix=country) if emissions_BEV <= emissions_ICEV: results.append((size, fuel_type, country, battery_loc, distance, emissions_BEV, emissions_ICEV)) break print("Results for each scenario where BEV becomes more eco-friendly than ICEV:") for record in results: size, fuel_type, country, battery_loc, distance, emissions_BEV, emissions_ICEV = record print(f"Vehicle Size: {size.capitalize()}, Fuel Type: {fuel_type.capitalize()}, Country: {country}, Battery Location: {battery_loc}, Distance: {distance} km, BEV Emissions: {emissions_BEV:.2f} tCO2e, ICEV Emissions: {emissions_ICEV:.2f} tCO2e") # Calculate emissions at 240000 km for each scenario distance = 240000 results = [] for size in ["small", "medium", "large"]: for fuel_type in ["gasoline", "diesel"]: for country in countries: for battery_loc in battery_locations: emissions_ICEV = calculate_emissions("ICEV", size, distance, fuel_type=fuel_type) emissions_BEV = calculate_emissions("BEV", size, distance, battery_prod_loc=battery_loc, elec_mix=country) results.append((size, fuel_type, country, battery_loc, emissions_BEV, emissions_ICEV)) print("Total CO2e emissions after 240,000 km for each scenario:") for record in results: size, fuel_type, country, battery_loc, emissions_BEV, emissions_ICEV = record print(f"Vehicle Size: {size.capitalize()}, Fuel Type: {fuel_type.capitalize()}, Country: {country}, Battery Location: {battery_loc}, BEV Emissions: {emissions_BEV:.2f} tCO2e, ICEV Emissions: {emissions_ICEV:.2f} tCO2e") |
References
- Heywood, J.B. Internal Combustion Engine Fundamentals; McGraw-Hill Education: New York, NY, USA, 1988. [Google Scholar]
- Society of Motor Manufacturers and Traders (SMMT). Britain’s New Car Market Boosted by Battery Electric Vehicle Choice. 2023. Available online: https://www.smmt.co.uk/2023/05/britains-new-car-market-boosted-by-battery-electric-vehicle-choice/ (accessed on 14 January 2025).
- Nitta, N.; Wu, F.; Lee, J.T.; Yushin, G. Li-ion battery materials: Present and future. Mater. Today 2015, 18, 252–264. [Google Scholar] [CrossRef]
- Babu, A.K. Electric & Hybrid Vehicles; Khana Publishing House: New Delhi, India, 2018. [Google Scholar]
- European Environment Agency. Electric Vehicles from Life Cycle and Circular Economy Perspectives; Transport and Environment Reporting Mechanism (TERM): Copenhagen, Denmark, 2018. [Google Scholar]
- Goodenough, J.B.; Park, K.S. The Li-ion rechargeable battery: A perspective. J. Am. Chem. Soc. 2013, 135, 1167–1176. [Google Scholar] [CrossRef] [PubMed]
- Linden, D. Linden’s Handbook of Batteries; McGraw-Hill: New York, NY, USA, 2010. [Google Scholar]
- Eddy, J.; Mulligan, C.; van de Staaij, J.; Klip, D.; Campagnol, N.; Hagenbruch, T. Metal Mining Constraints on the Electric Mobility Horizon; McKinsey Basic Minerals Institute and MineSpans by McKinsey: New York, NY, USA, 2018. [Google Scholar]
- Amrouche, S.O.; Rekioua, D.; Rekioua, T.; Bacha, S. Overview of energy storage in renewable energy systems. Int. J. Hydrogen Energy 2016, 41, 20914–20927. [Google Scholar] [CrossRef]
- Dunn, J.B.; Gaines, L.; Kelly, J.C.; Jamesb, C.; Gallagher, K.G. The significance of Li-ion batteries in electric vehicle lifecycle energy and emissions and recycling’s role in its reduction. Energy Environ. Sci. 2015, 8, 158. [Google Scholar] [CrossRef]
- Zanoletti, A.; Carena, E.; Ferrara, C.; Bontempi, E. A Review of Lithium-Ion Battery Recycling: Technologies, Sustainability, and Open Issues. Batteries 2024, 10, 38. [Google Scholar] [CrossRef]
- The Faraday Institution. High-Energy Battery Technologies. 2020. Available online: https://www.faraday.ac.uk/policy/high-energy-battery-technologies/ (accessed on 14 January 2025).
- Power, S. Sion Power Demonstrates More Than 2500 Cycles in Licerion® Rechargeable Battery Technology. 2022. Available online: https://sionpower.com/2022/sion-power-demonstrates-more-than-2500-cycles-in-licerion-rechargeable-battery-technology/ (accessed on 14 January 2025).
- Linder, M. The Race to Decarbonize Electric-Vehicle Batteries; McKinsey: New York, NY, USA, 2023. [Google Scholar]
- European Automobile Manufacturers’ Association (ACEA). New Car Registrations: +13.9% in 2023; Battery Electric 14.6% Market Share. 2024. Available online: https://www.acea.auto/pc-registrations/new-car-registrations-13-9-in-2023-battery-electric-14-6-market-share/ (accessed on 15 January 2025).
- The Norwegian EV Association. Norwegian EV Market. Available online: https://elbil.no/english/norwegian-ev-market/ (accessed on 15 January 2025).
- International Energy Agency (IEA). 2024. Available online: https://www.iea.org/data-and-statistics/charts/global-electric-car-stock-2013-2023 (accessed on 15 January 2025).
- United Nations Framework Convention on Climate Change (UNFCCC). Kyoto Protocol; European Commission: Press and Communication Service: Brussels, Belgium, 2004. [Google Scholar]
- United Nations Framework Convention on Climate Change (UNFCCC). Paris Agreement; United Nations: New York, NY, USA, 2015. [Google Scholar]
- Council of the European Union. European Parliament. Regulation (EU) 2021/1119 of the European Parliament and of the Council of 30 June 2021 establishing the framework for achieving climate neutrality and amending Regulations (EC) No 401/2009 and (EU) 2018/1999 (‘European Climate Law’). Off. J. Eur. Union 2021, 64, L243. [Google Scholar]
- European Energy Agency. Trends and Projections in Europe 2023; Publications Office of the European Union: Luxembourg, 2023. [Google Scholar]
- Northvolt. Northvolt—the Future of Energy. 2022. Available online: https://northvolt.com/ (accessed on 14 January 2025).
- Ritchie, H.; Rosado, P. Electricity Mix. 2020. Available online: https://ourworldindata.org/electricity-mix (accessed on 15 January 2025).
- Polestar and Rivian Pathway Report; Kearney: Chicago, IL, USA, 2023.
- Transport and Envoronment (T&E). How Clean are Electric Cars?—T&E’s Analysis of Electric Car Lifecycle CO2 Emissions. 2020. Available online: https://www.transportenvironment.org/articles/how-clean-are-electric-cars? (accessed on 15 January 2025).
- Prussi, M.; Yugo, M.; de Prada, L.; Padella, M.; Edwards, R. JEC Well-to-Wheels Report v5; JRC Publications Repository: Brussels, Belgium, 2020. [Google Scholar]
- ISO 14040:2006; Environmental Management—Life Cycle Assessment—Principles and Framework. International Organization for Standardization (ISO): Geneva, Switzerland, 2006.
- Bieker, G. A global comparison of the lifecycle greenhouse gas emissions of combustion engine and electric passenger cars. Communications 2021, 49, 847129-102. [Google Scholar]
- Green NCAP. Estimated Greenhouse Gas Emissions and Primary Energy Demand of Passenger Vehicles, 3rd ed.; Life Cycle Assessment Methodology and Data; Green NCAP: Leuven, Belgium, 2024; Available online: https://www.greenncap.com/wp-content/uploads/Green-NCAP-Life-Cycle-Assessment-Methodology-and-Data_2nd-edition_2402.pdf (accessed on 15 January 2025).
- Cornet, A.; Heuss, R.; Tschiesner, A.; Hensley, R.; Hertzke, P.; Möller, T.; Schaufuss, P.; Conzade, J.; Schenk, S.; von Laufenberg, K. Why the Automotive Future is Electric: Mainstream EVs Will Transform the Automotive Industry and Help Decarbonize the Planet; IAA: Westchester, IL, USA, 2021. [Google Scholar]
- Li, M.; Noering, F.K.-D.; Öngün, Y.; Appelt, M.; Henze, R. An Investigation of Representative Customer Load Collectives in the Development of Electric Vehicle Drivetrain Durability. World Electr. Veh. J. 2024, 15, 112. [Google Scholar] [CrossRef]


| Parameter | Pb-PbO2 | Ni-Cd | Ni-MH | ZnBr2 | Na-NiCl2 | Na-S | Li-Ion |
|---|---|---|---|---|---|---|---|
| Temperature of operation [°C] | −20–50 | 0–50 | 0–50 | 10–40 | 300–350 | 300–350 | −20–60 |
| Energy density [Wh/kg] | 30–40 | 40–60 | 60–120 | 60–80 | 120–150 | 150–240 | 150–260 |
| Voltage of each cell [V] | 2.0 | 1.2 | 1.2 | 1.79 | 2.58 | 2.08 | 3.6 |
| Max. No. of charging cycles | 200–300 | 500–1000 | 500–1000 | >2000 | 1500–2000 | 2500–4500 | 400–3000 |
| Emissions [gCO2e/kWh] | 200–300 | 250–350 | 300–400 | 400–500 | 500–600 | 600–700 | 150–200 |
| Cost [EUR/Wh] | 5 | 5 | 4 | 2 | 1.3–1.7 | 0.7–0.8 | 2 |
| Stage in Production of Batteries | 2023 [kgCO2e/kWh] | Forecast for 2030 [kgCO2e/kWh] |
|---|---|---|
| Extraction and refining | 26 | 10 |
| Production of active materials | 32 | 10 |
| Logistics | 14 | 4 |
| Manufacturing of cells | 25 | 0 |
| Total | 97 | 24 |
| Country of Production | Intensity of Emissions in [kgCO2e/kWh] 1 |
|---|---|
| Sweden | 45 |
| South Corea | 72 |
| USA | 74 |
| China 2 | 79 |
| China | 108 |
| Year | The Target for GHG Emissions in the EU | Results and Forecasts (Reference Year: 1990) |
|---|---|---|
| 1990 | Reference year for most EU climate objectives. | ------------------------ |
| 2000 | No formal, binding EU-level target for this year. | ------------------------ |
| 2012 | Kyoto Protocol of 1997 to reduce GHG emissions by 8% (compared to 1990 levels) between 2008 and 2012. | Reduction of 12.2% |
| 2020 | A 20% reduction compared to 1990 levels in 2007 under the EU 2020 “Climate and Energy” package. | Reduction of 24% |
| 2030 | A 55% reduction compared to 1990 levels, in line with the “Fit for 55” objective achieved in 2021. | Reduction of 51% |
| 2050 | Net-zero emissions target. | Reduction of 65% |
| Scenario | ICEVs-Diesel (km) | ICEVs-Petrol (km) |
|---|---|---|
| Best scenario (small BEVs) | 5535 | 5334 |
| Worst scenario (small BEVs) | 20,841 | 20,086 |
| Best scenario (medium BEVs) | 7131 | 6864 |
| Worst scenario (medium BEVs) | 27,865 | 26,840 |
| Best scenario (large BEVs) | 9894 | 9525 |
| Worst scenario (large BEVs) | 36,231 | 34,878 |
Disclaimer/Publisher’s Note: The statements, opinions and data contained in all publications are solely those of the individual author(s) and contributor(s) and not of MDPI and/or the editor(s). MDPI and/or the editor(s) disclaim responsibility for any injury to people or property resulting from any ideas, methods, instructions or products referred to in the content. |
© 2025 by the authors. Licensee MDPI, Basel, Switzerland. This article is an open access article distributed under the terms and conditions of the Creative Commons Attribution (CC BY) license (https://creativecommons.org/licenses/by/4.0/).
Share and Cite
Vieira, V.; Baptista, A.; Cavadas, A.; Pinto, G.F.; Monteiro, J.; Ribeiro, L. Comparison of Battery Electrical Vehicles and Internal Combustion Engine Vehicles–Greenhouse Gas Emission Life Cycle Assessment. Appl. Sci. 2025, 15, 3122. https://doi.org/10.3390/app15063122
Vieira V, Baptista A, Cavadas A, Pinto GF, Monteiro J, Ribeiro L. Comparison of Battery Electrical Vehicles and Internal Combustion Engine Vehicles–Greenhouse Gas Emission Life Cycle Assessment. Applied Sciences. 2025; 15(6):3122. https://doi.org/10.3390/app15063122
Chicago/Turabian StyleVieira, Vasco, Andresa Baptista, Adélio Cavadas, Gustavo F. Pinto, Joaquim Monteiro, and Leonardo Ribeiro. 2025. "Comparison of Battery Electrical Vehicles and Internal Combustion Engine Vehicles–Greenhouse Gas Emission Life Cycle Assessment" Applied Sciences 15, no. 6: 3122. https://doi.org/10.3390/app15063122
APA StyleVieira, V., Baptista, A., Cavadas, A., Pinto, G. F., Monteiro, J., & Ribeiro, L. (2025). Comparison of Battery Electrical Vehicles and Internal Combustion Engine Vehicles–Greenhouse Gas Emission Life Cycle Assessment. Applied Sciences, 15(6), 3122. https://doi.org/10.3390/app15063122