
Performance Evaluation of YOLOv8, YOLOv9, YOLOv10, and YOLOv11 for Stamp Detection in Scanned Documents


Abstract
1. Introduction
- Based on the combination and annotation of the StaVer and DDI-100 datasets, an adapted dataset was created.
- Comparative evaluation of the performance of YOLOv8s, YOLOv9s, YOLOv10s, and YOLOv11s models for stamp detection in scanned documents. Considering that the YOLOv9 to YOLOv11 models are used for the first time in this task.
- Specification of the deep learning-based YOLO model with the best performance and/or lowest computational cost and robustness for stamp detection, enabling implementation in document authentication tools.
2. Literature Review
3. Materials and Methods
3.1. Dataset
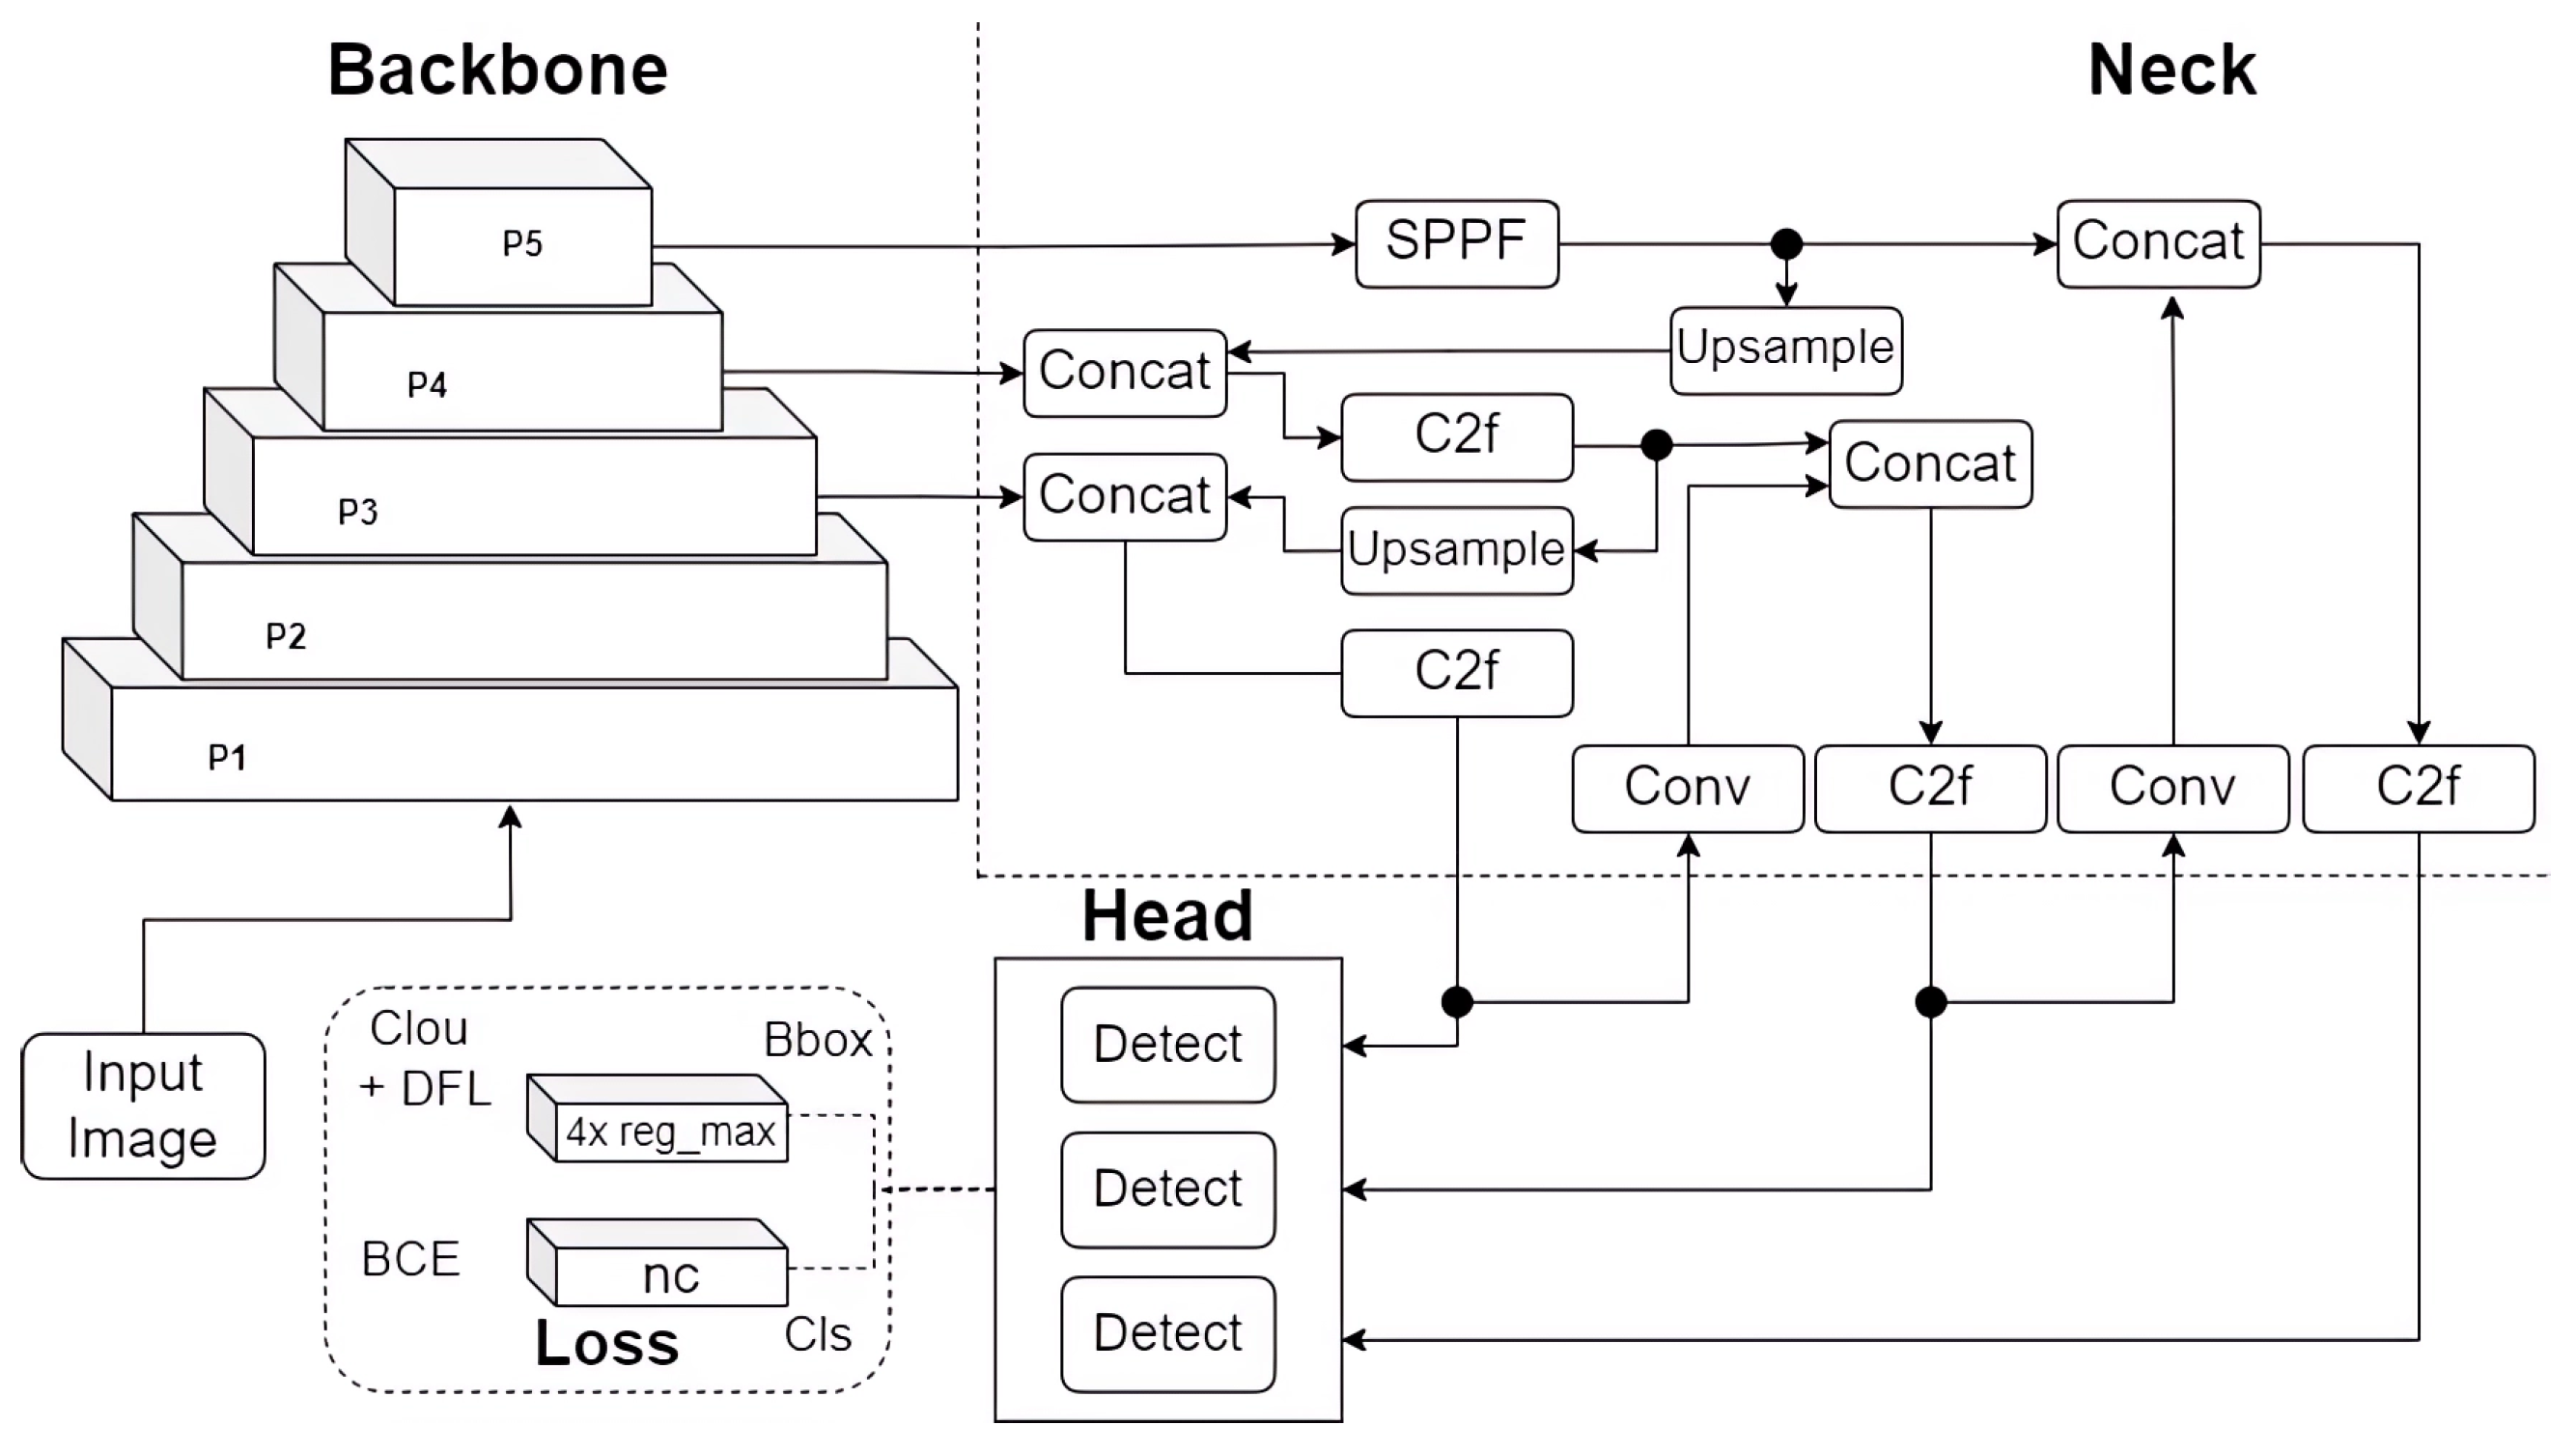
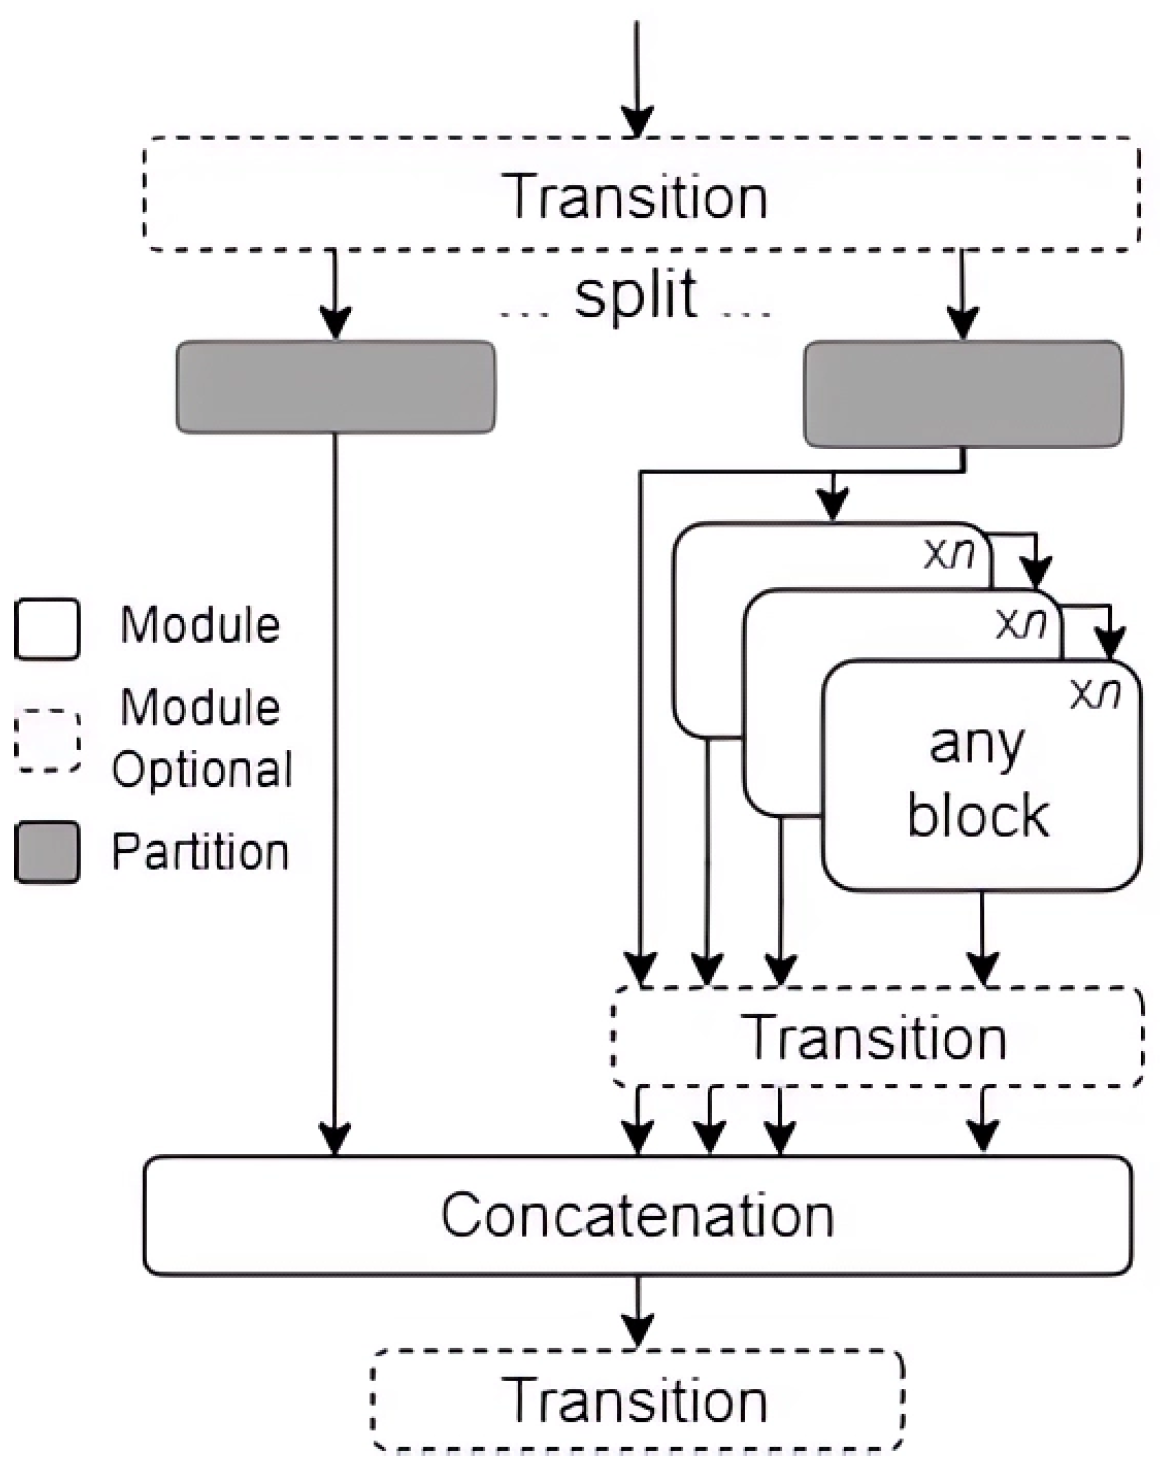
3.2. YOLOv8
3.3. YOLOv9
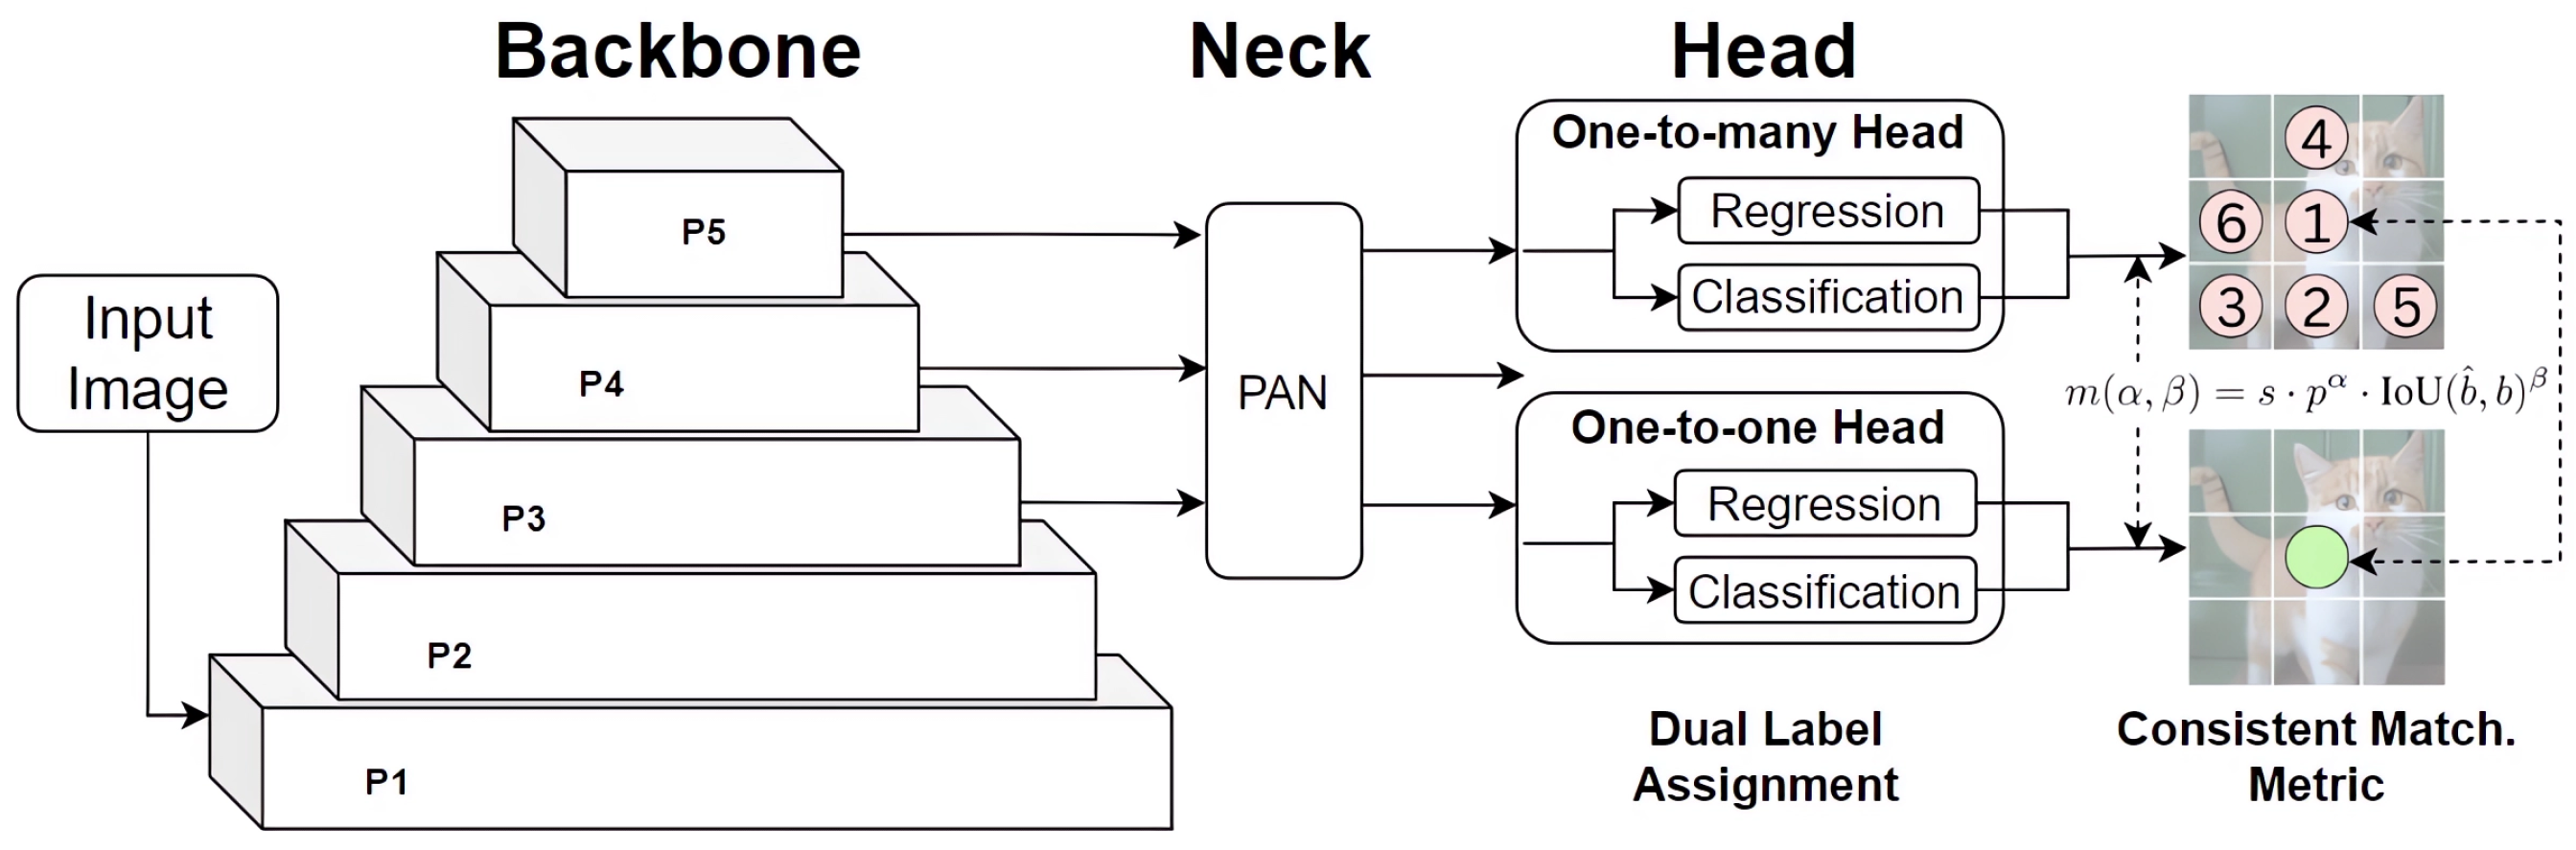
3.4. YOLOv10
3.5. YOLOv11
3.6. Metrics and Validation
3.6.1. Intersection over Union (IoU)
3.6.2. Precision and Recall
3.6.3. Average Precision and Mean Average Precision
3.6.4. Confidence Score
4. Experimental Results
4.1. Hardware and Software
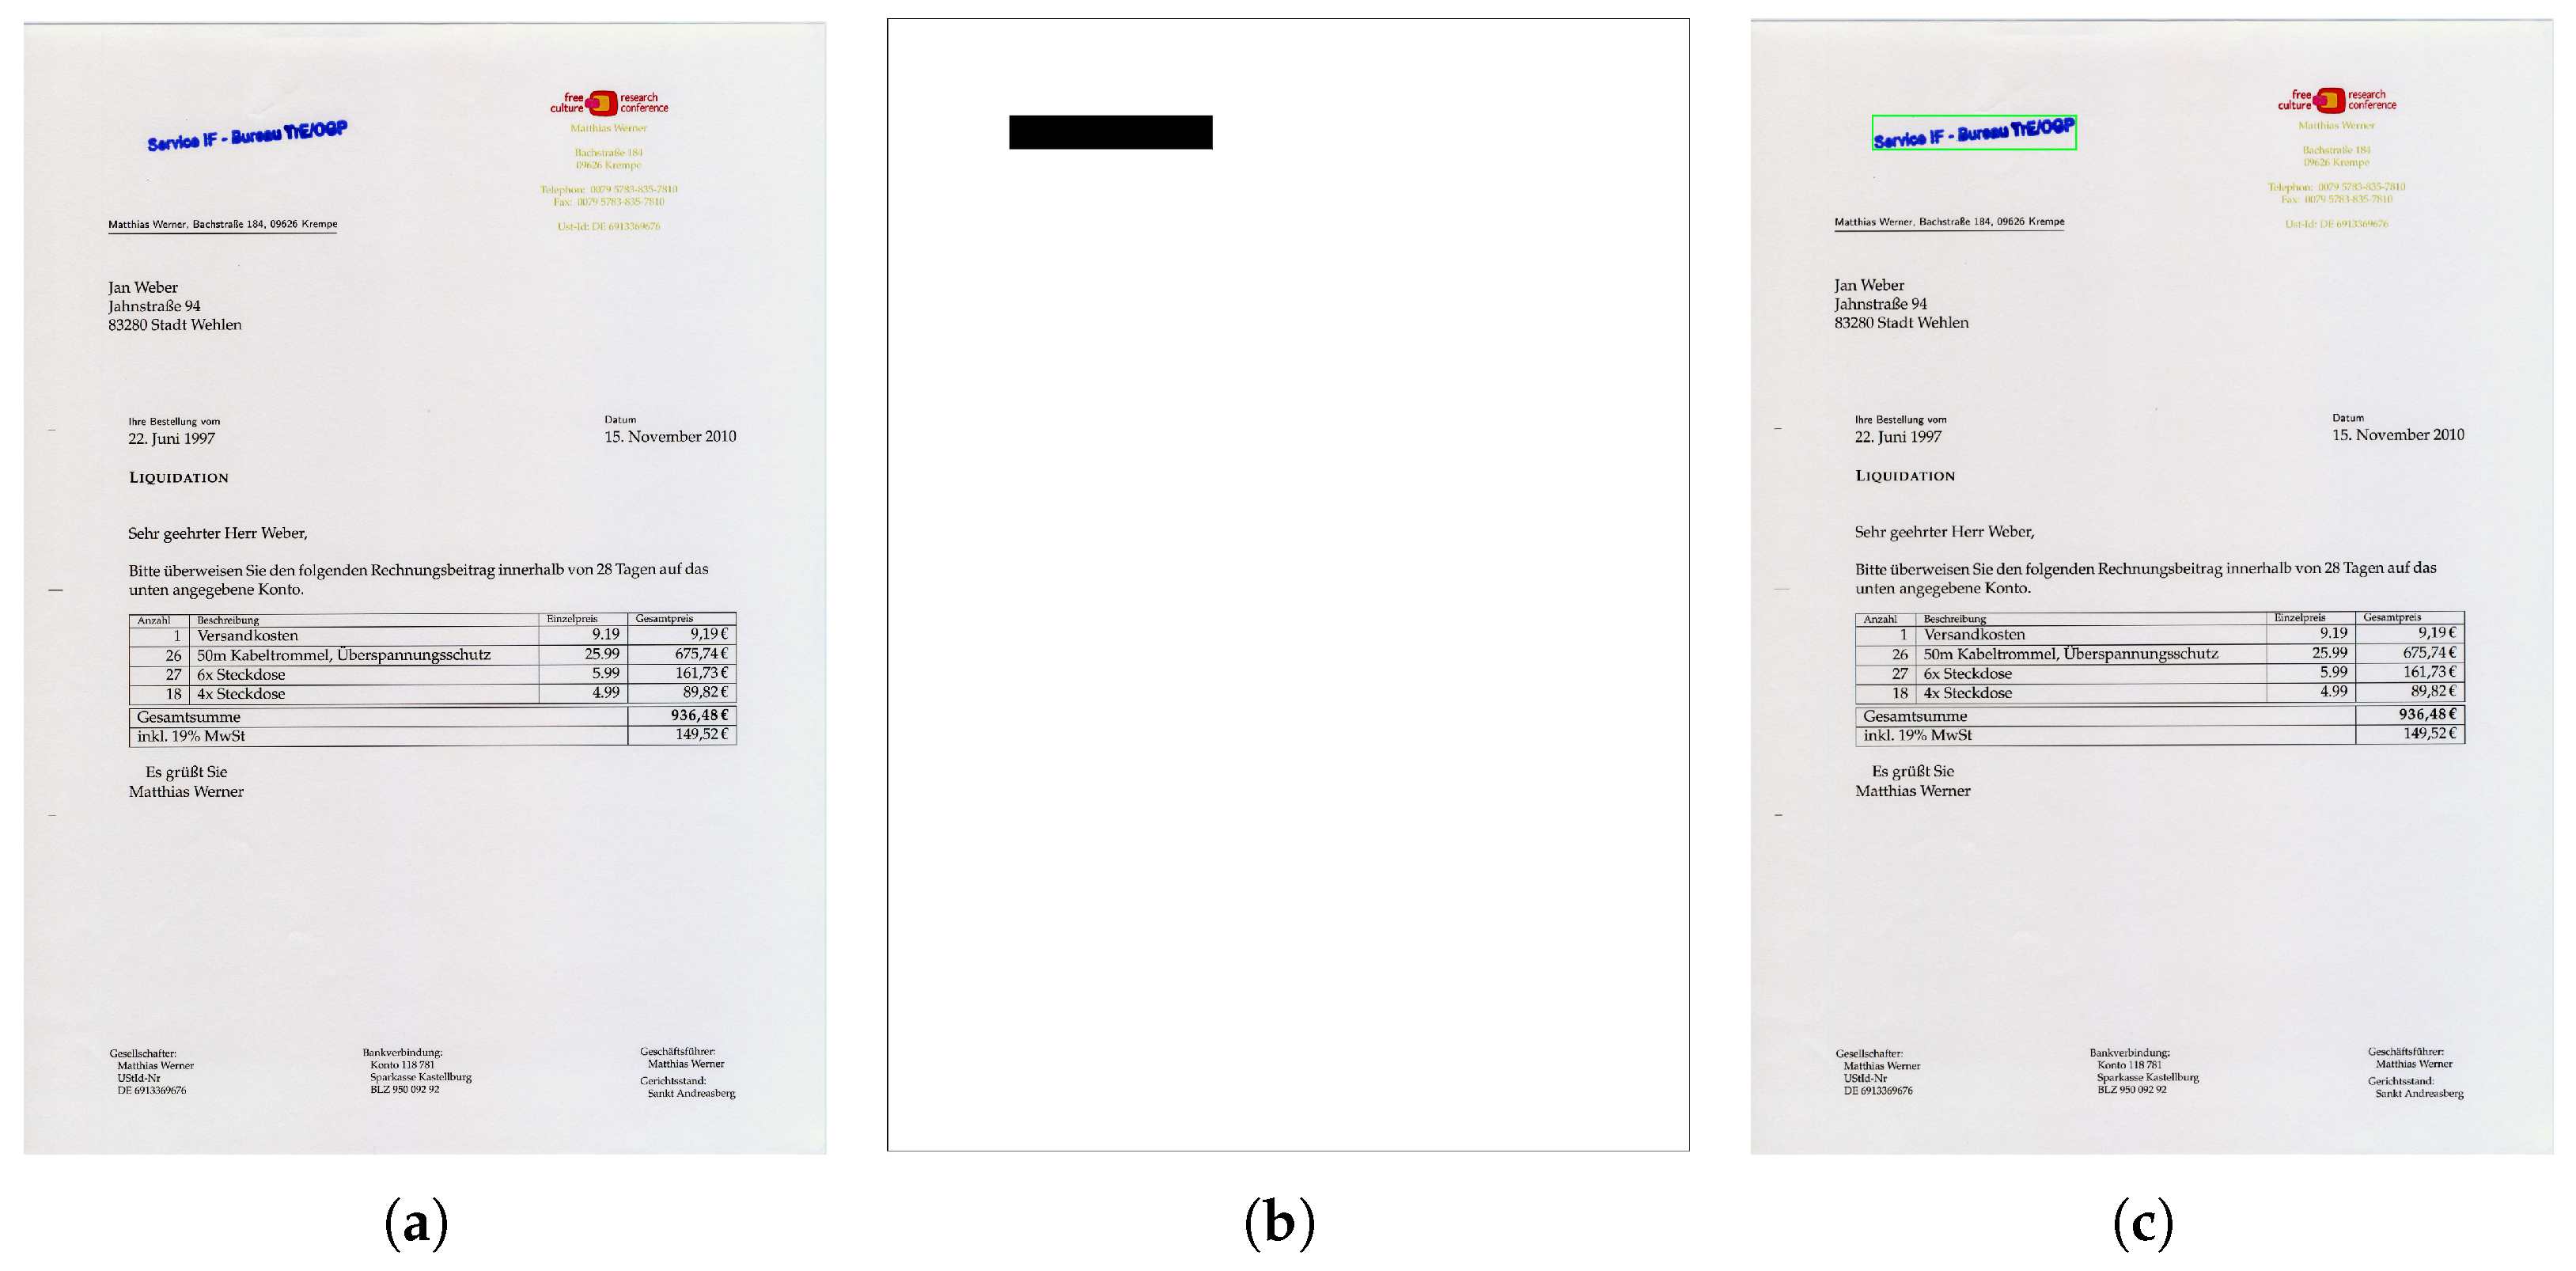
4.2. Preprocessing
4.3. Comparison of YOLO Models
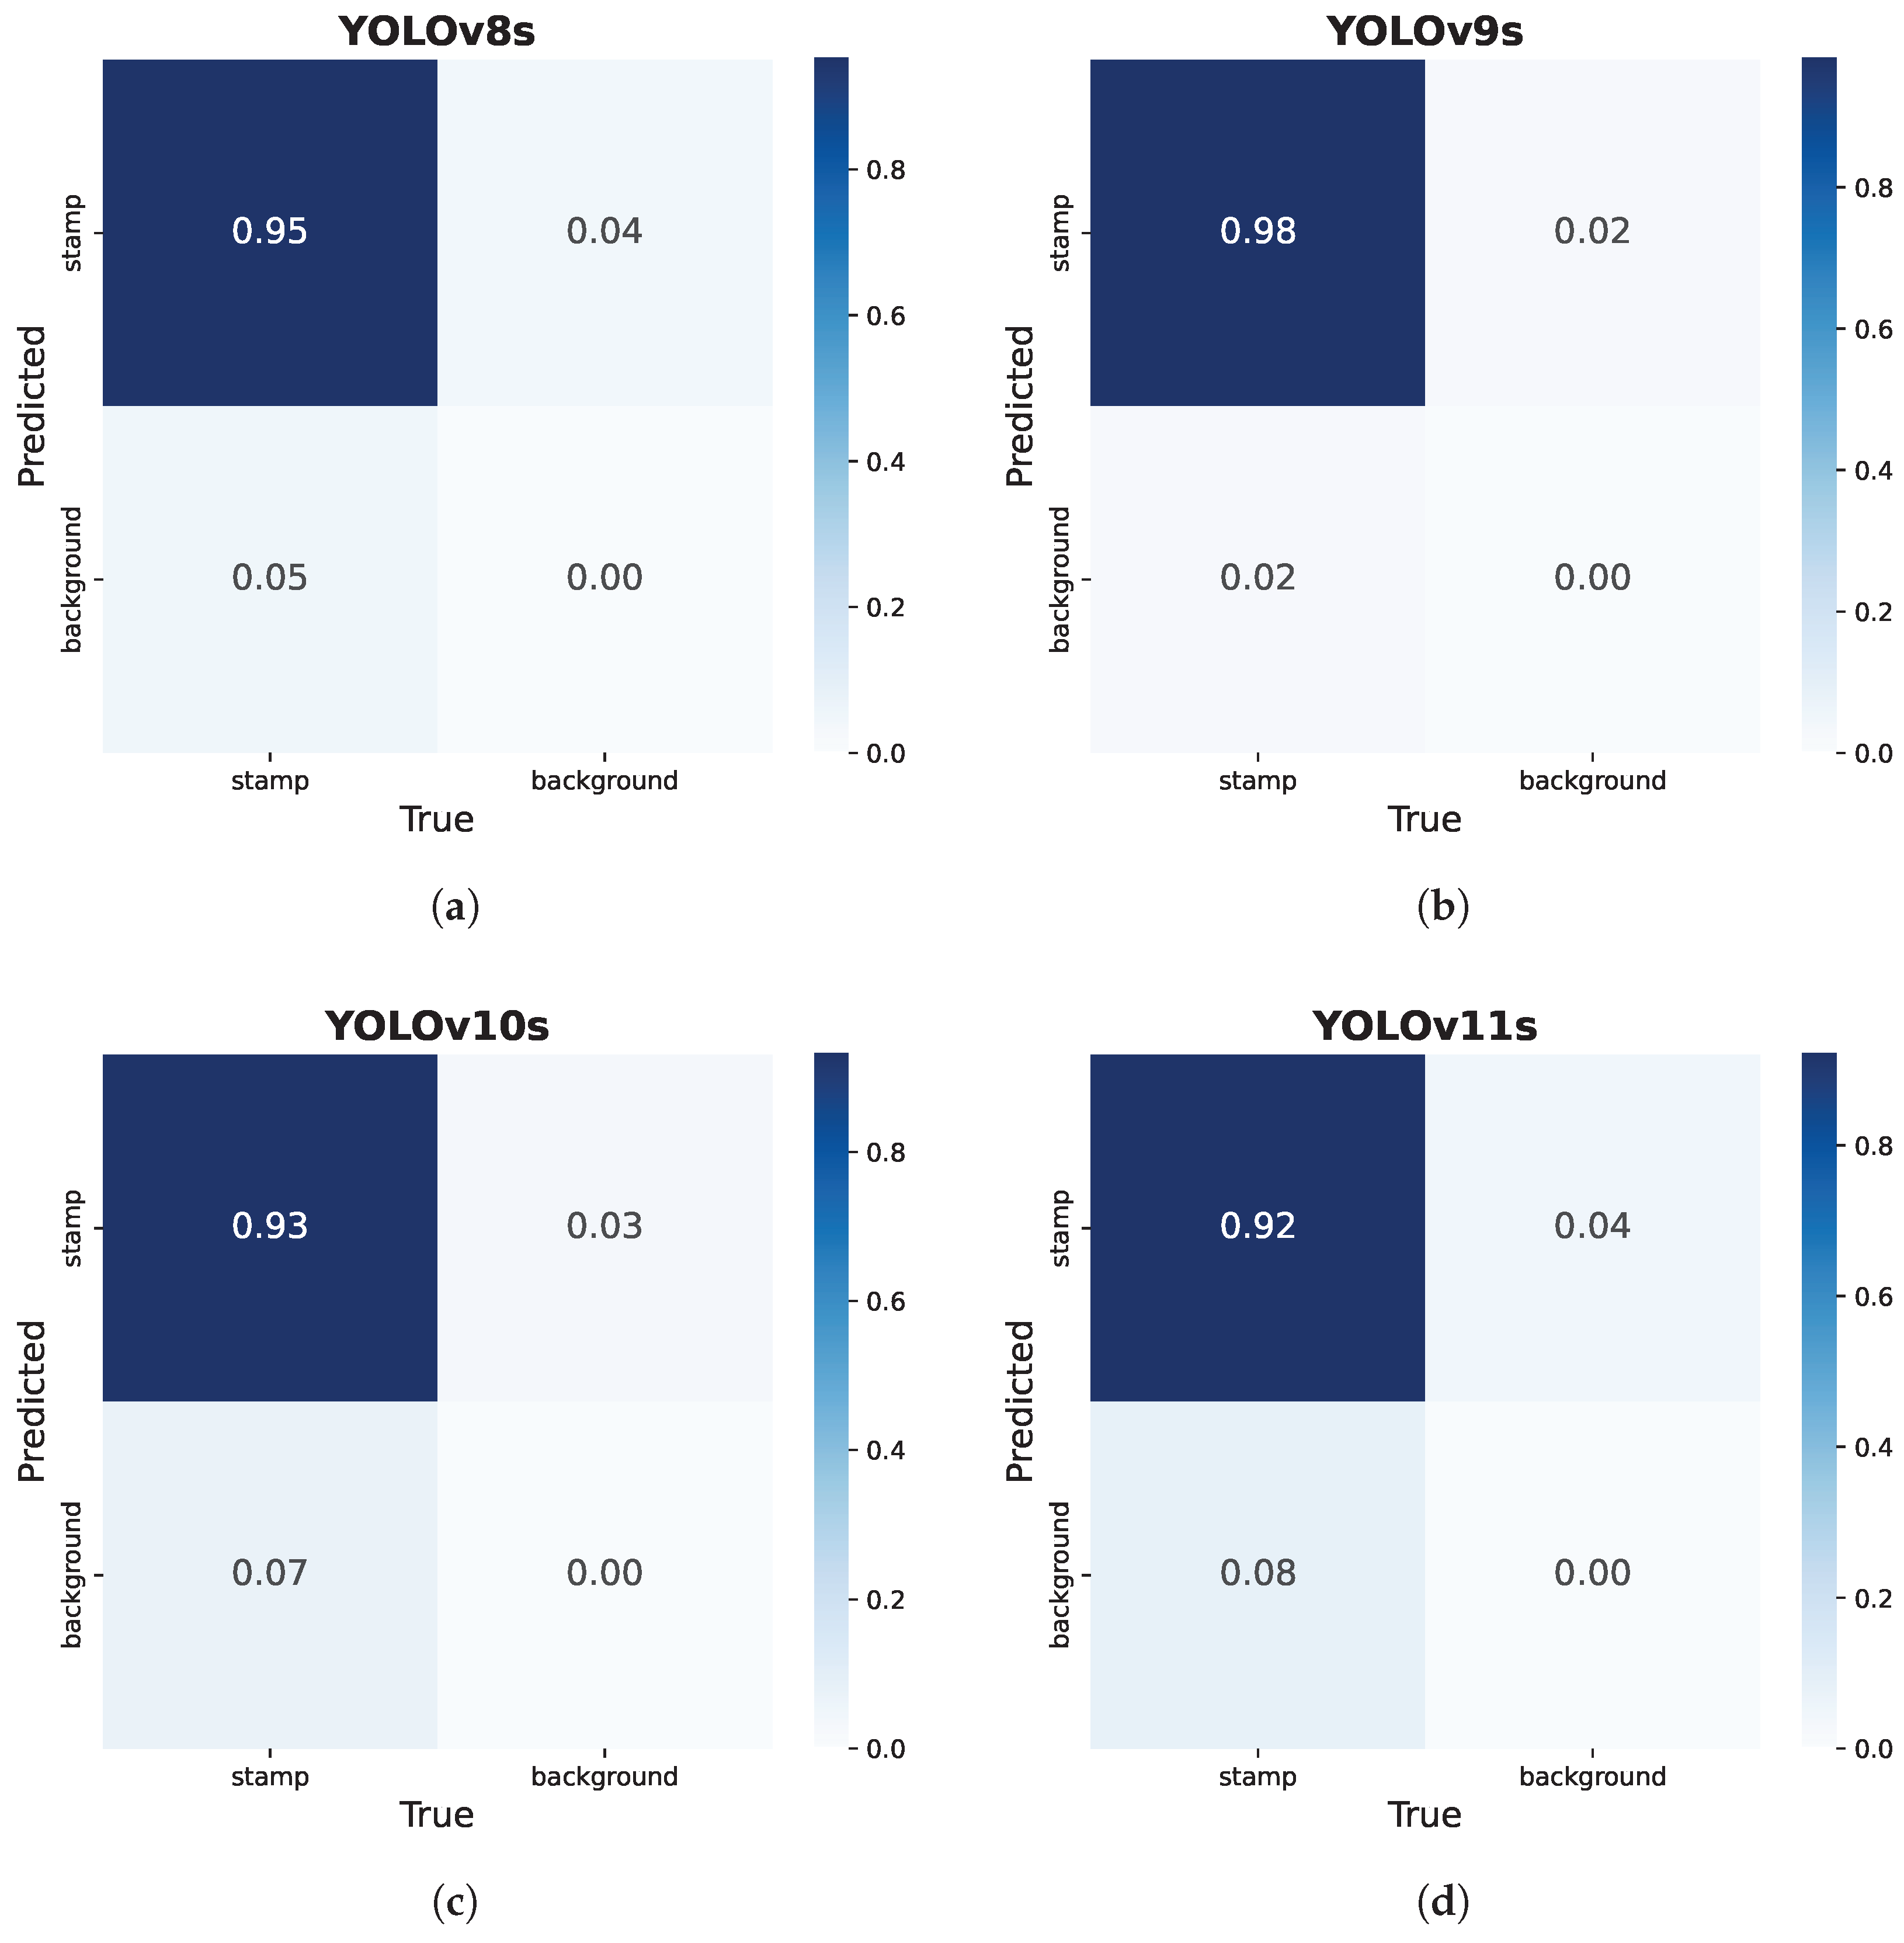
4.3.1. Quantitative Comparisons
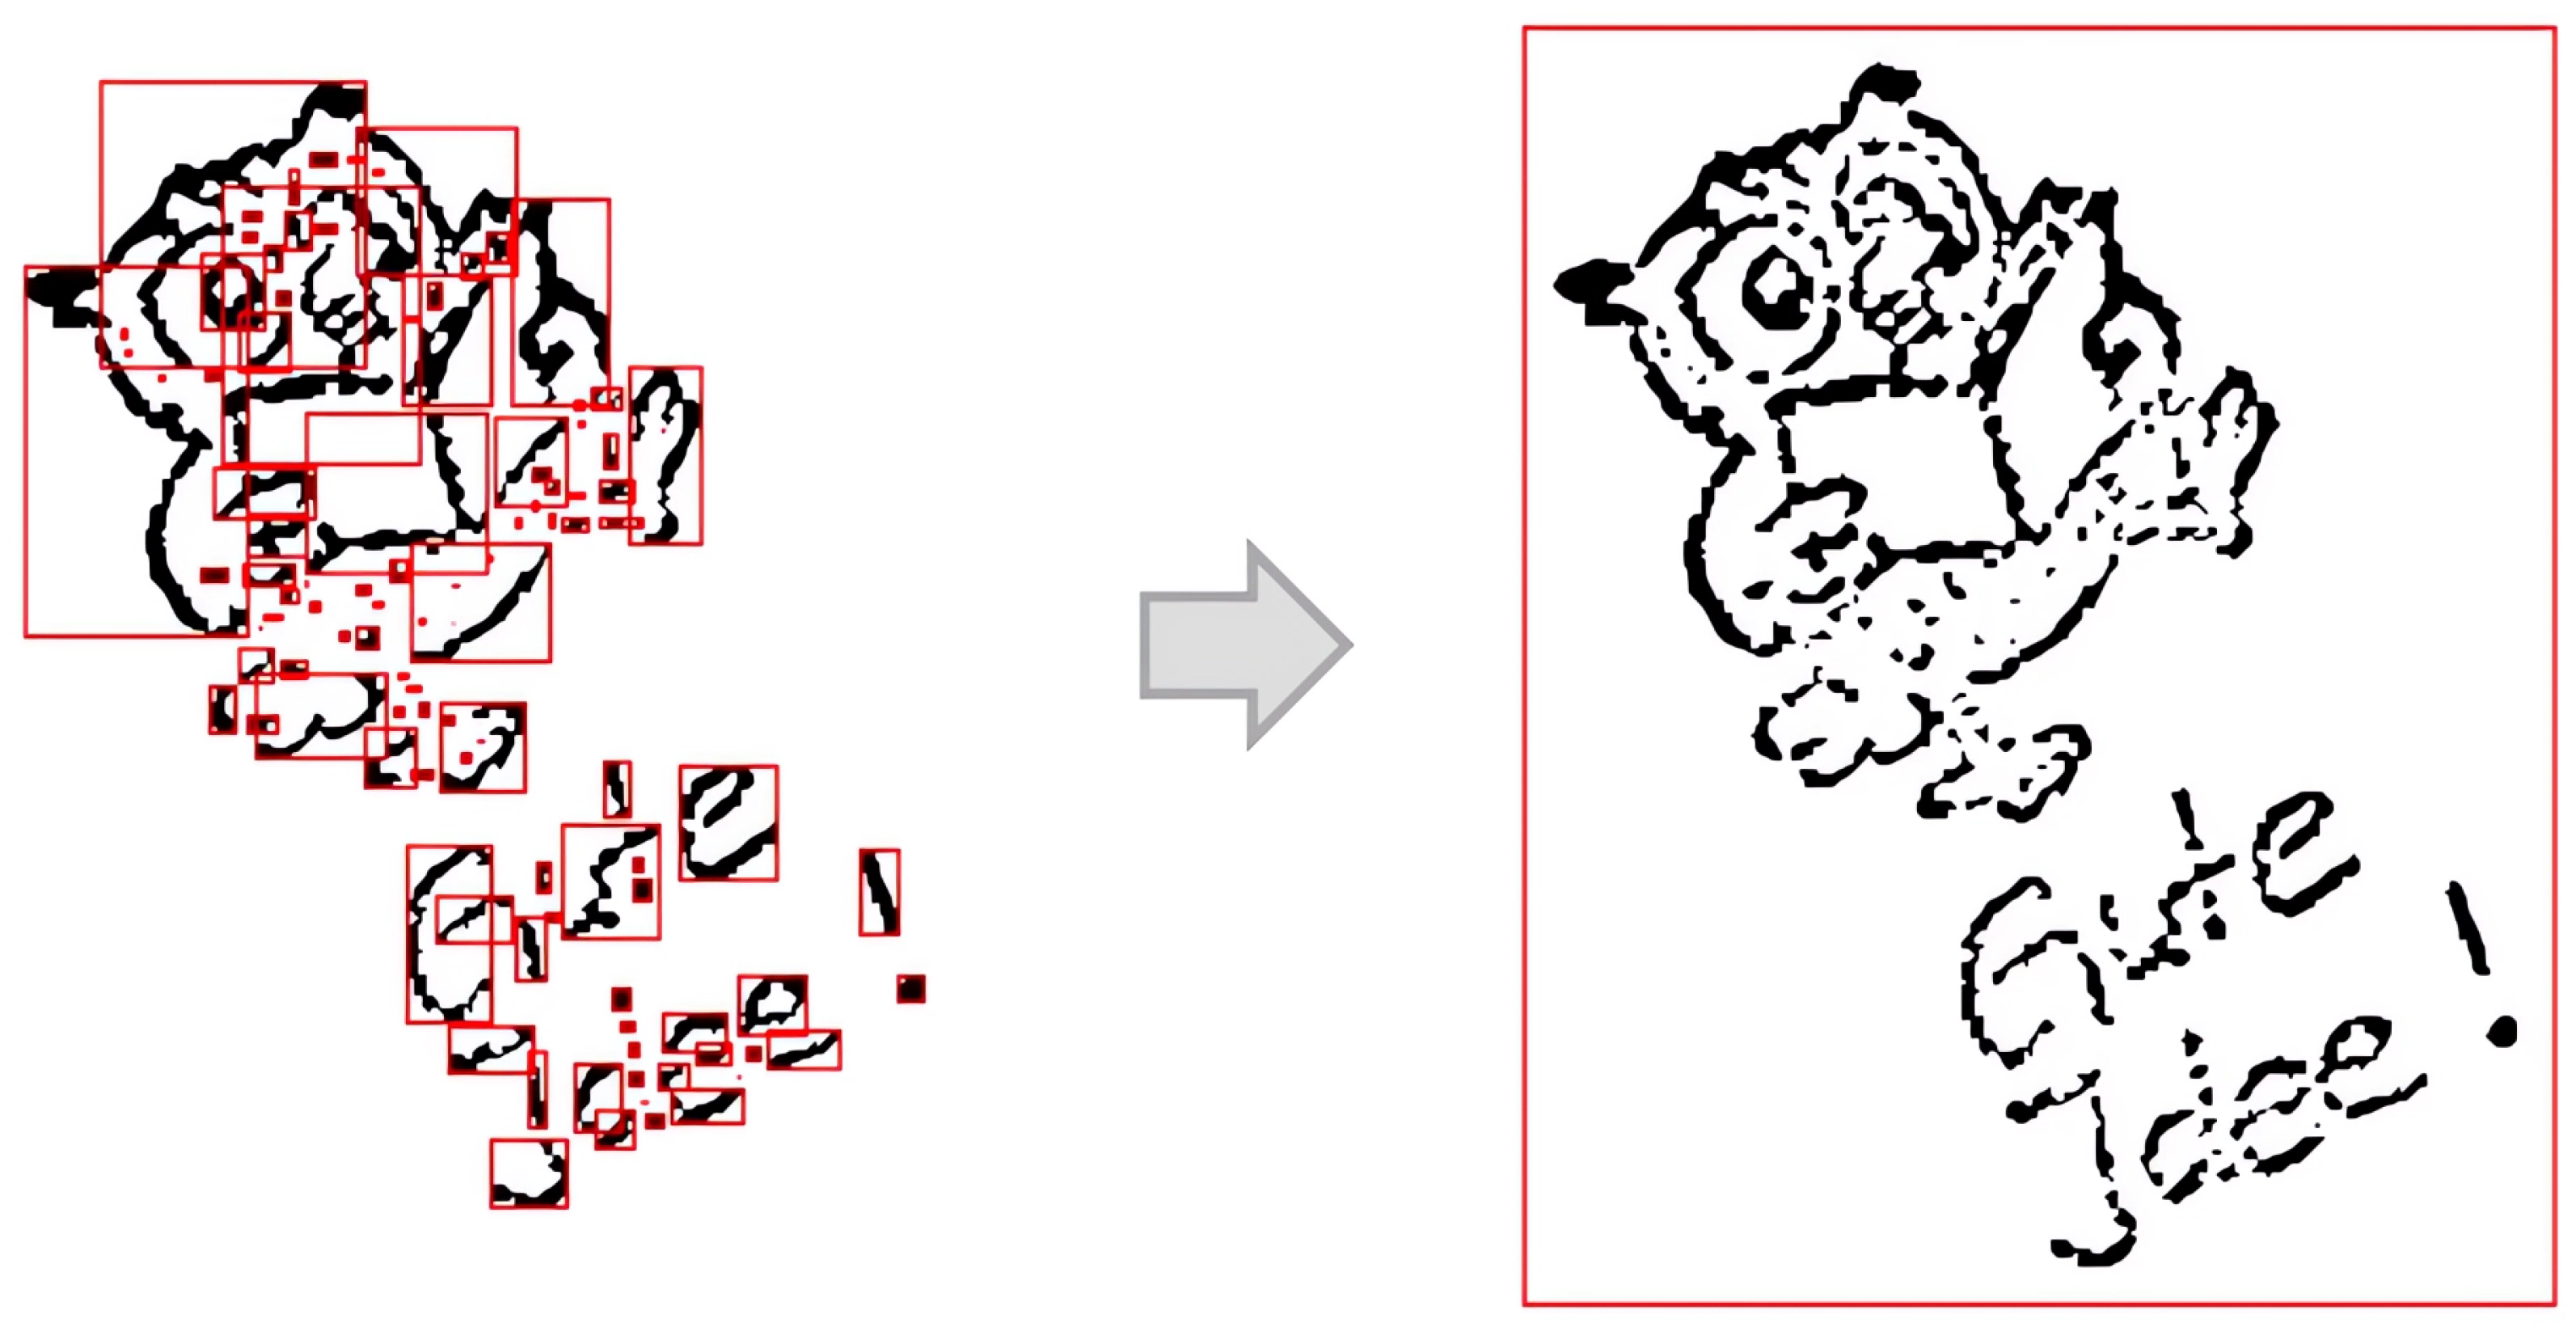
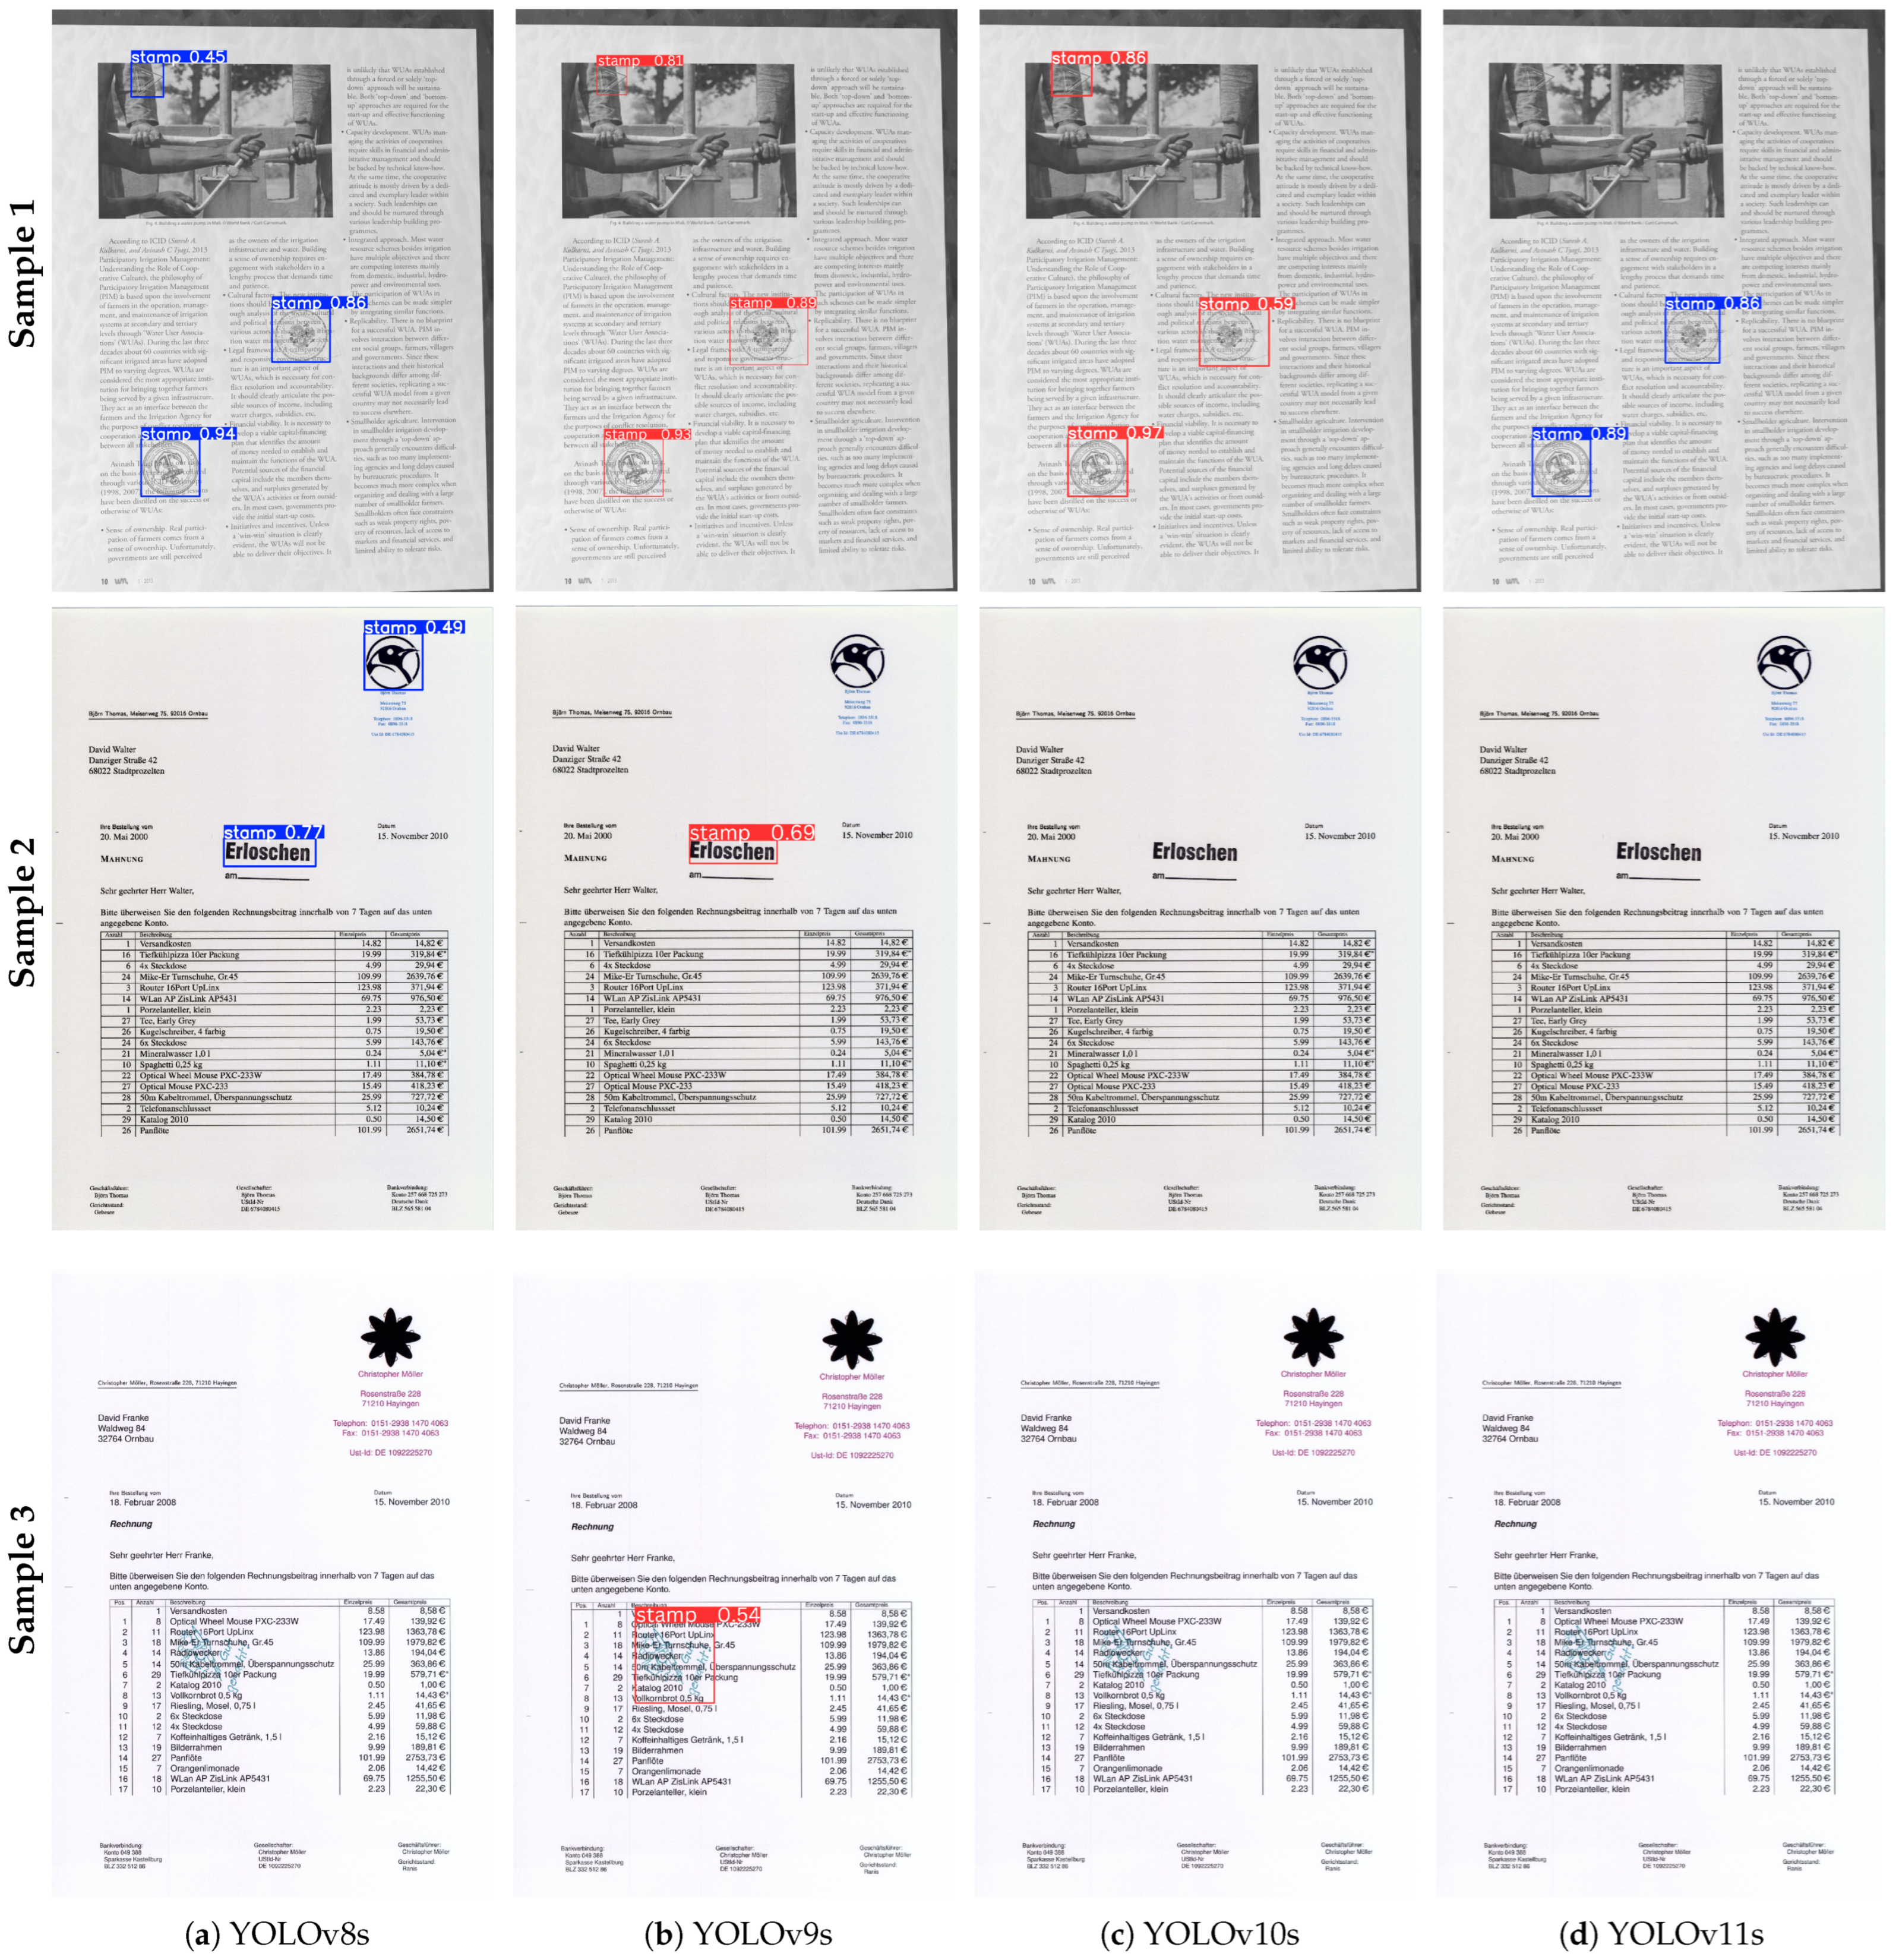
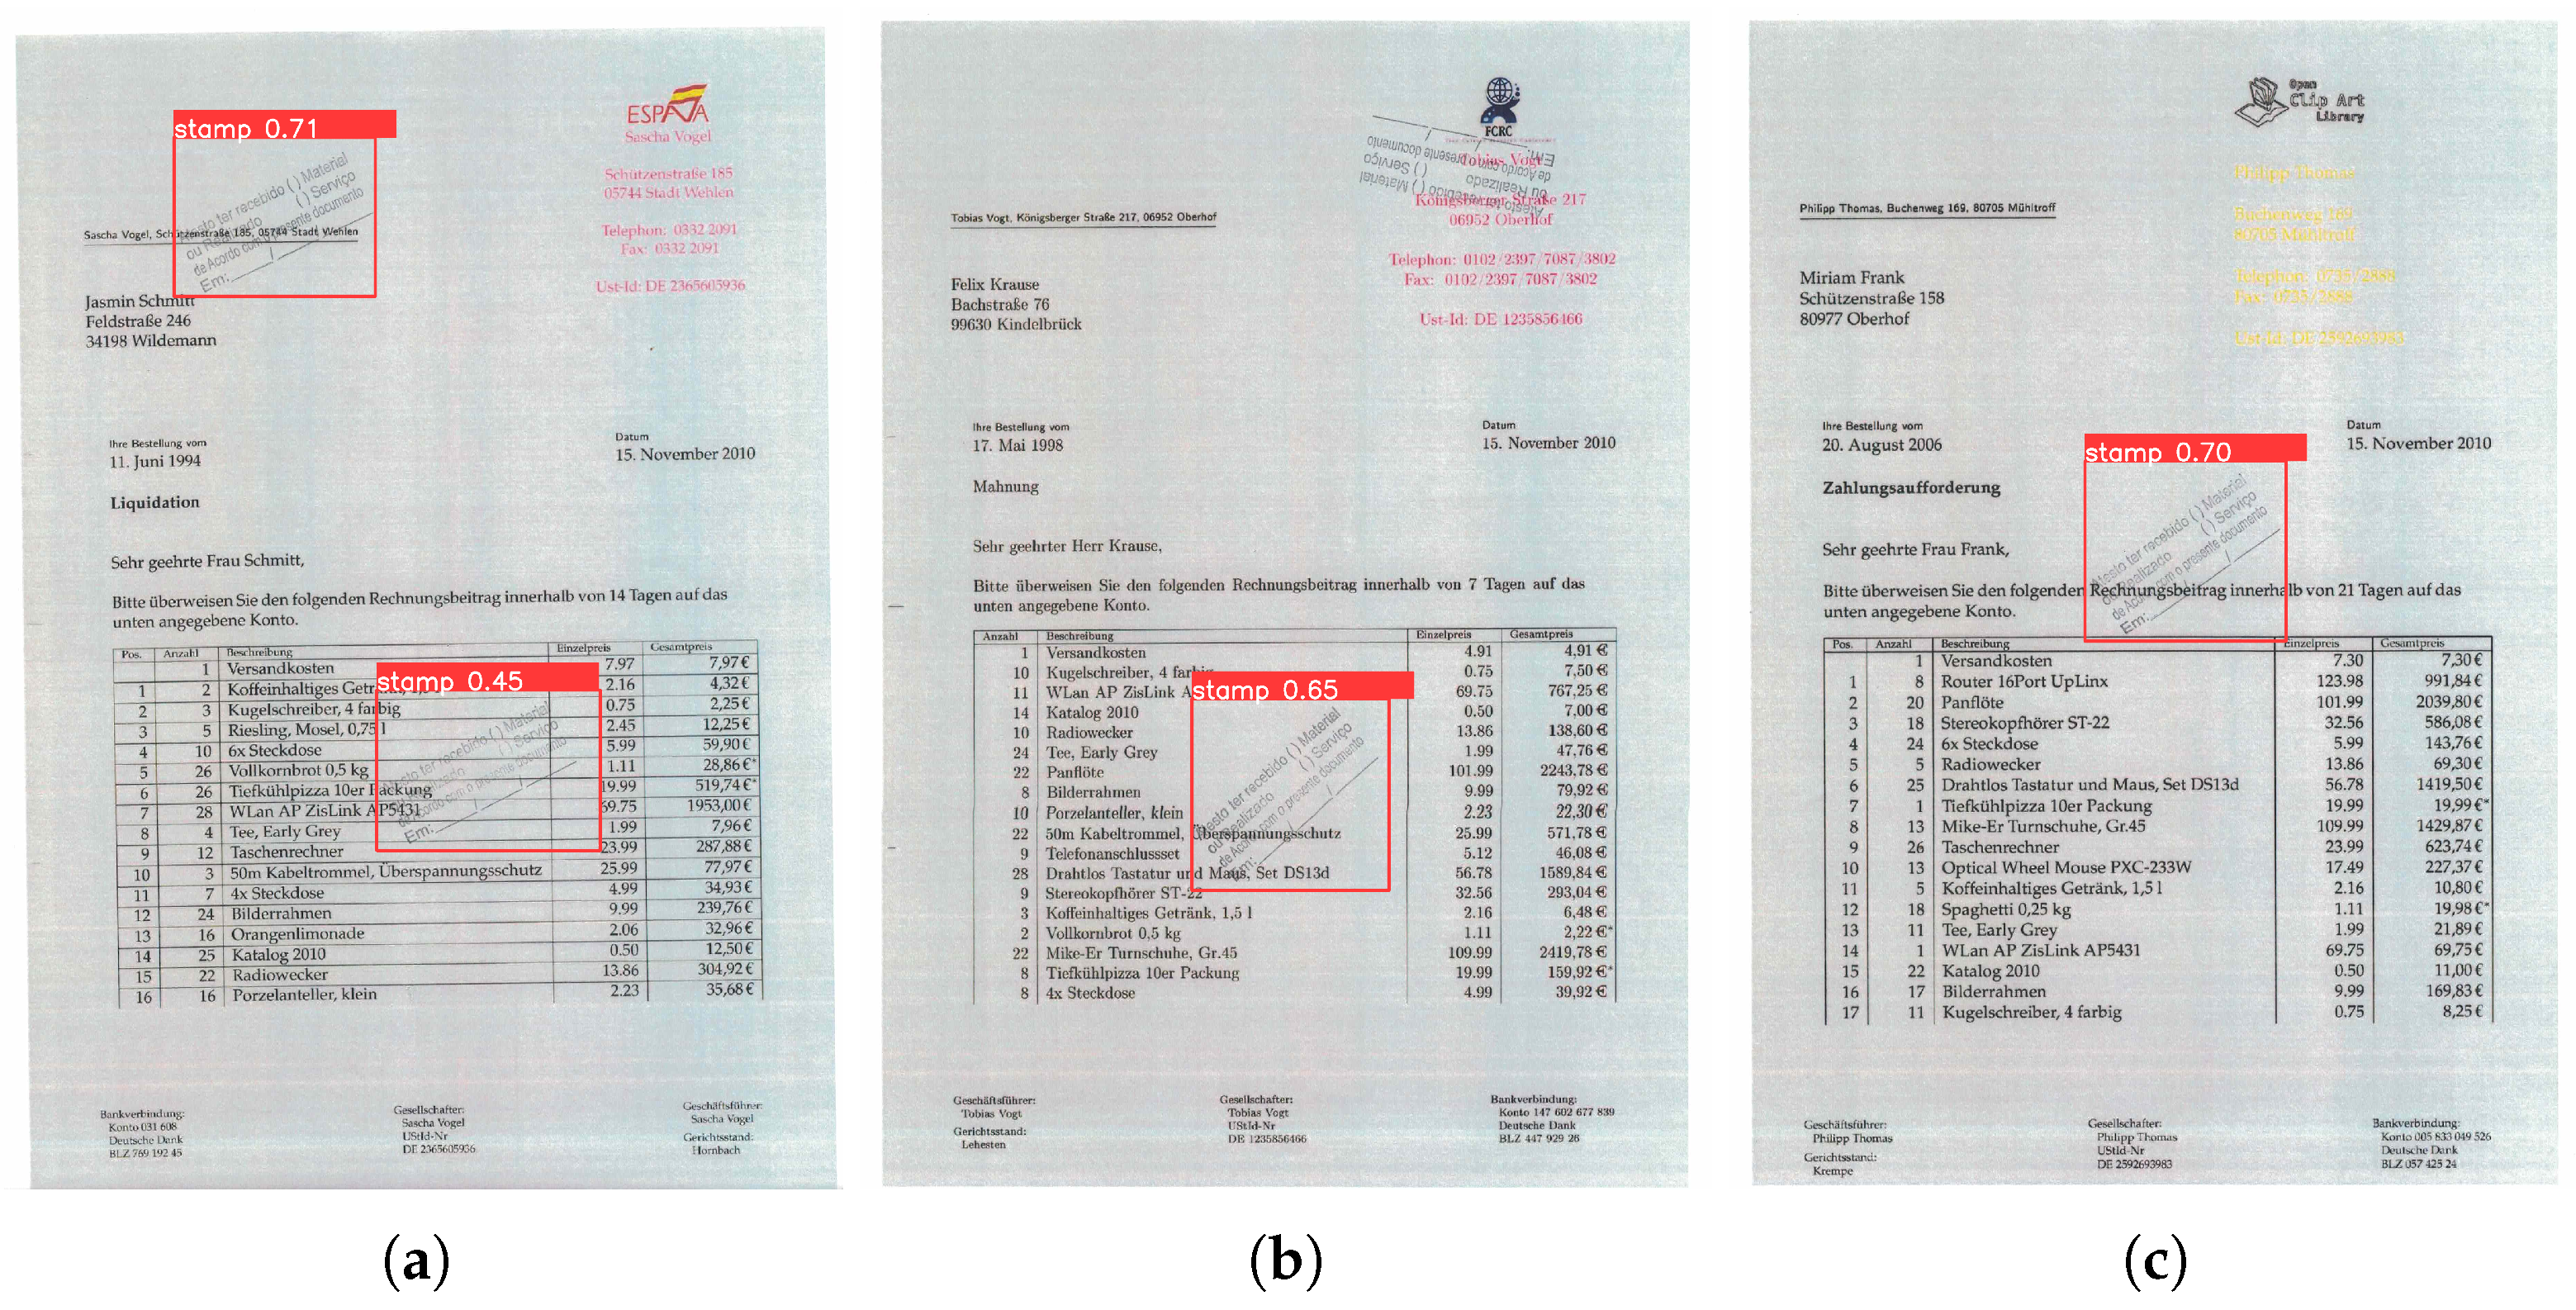
4.3.2. Qualitative Comparisons
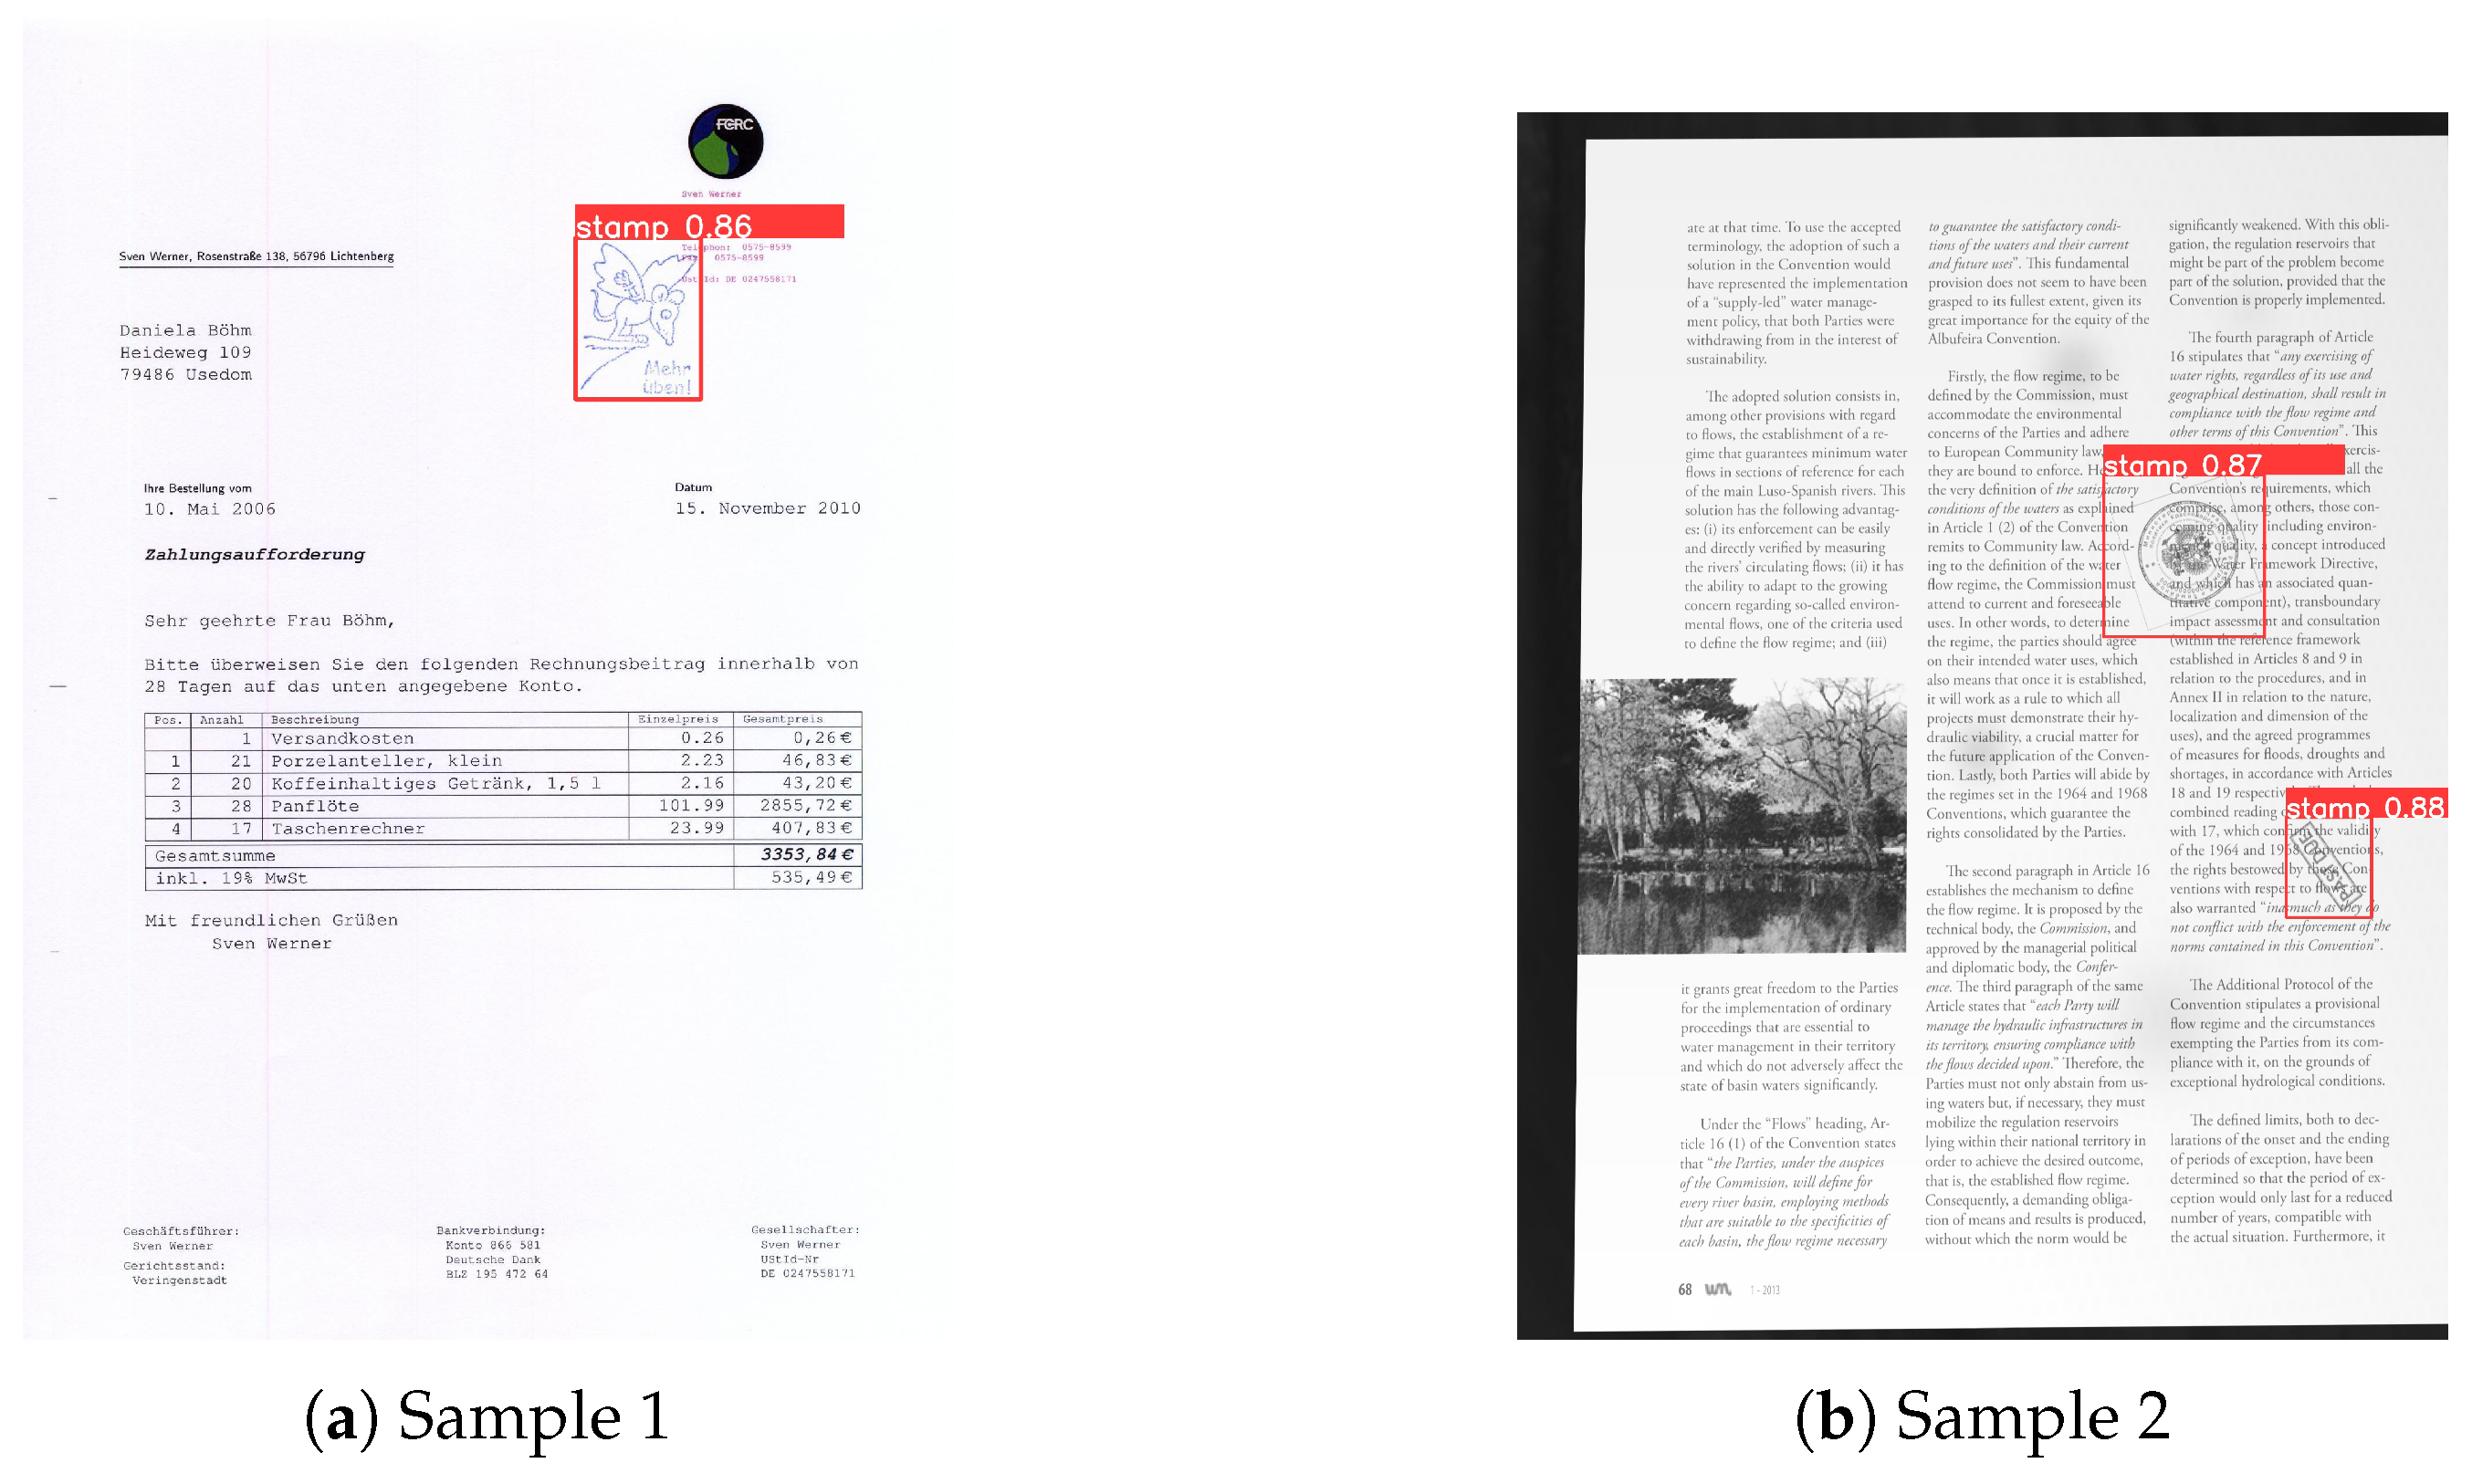
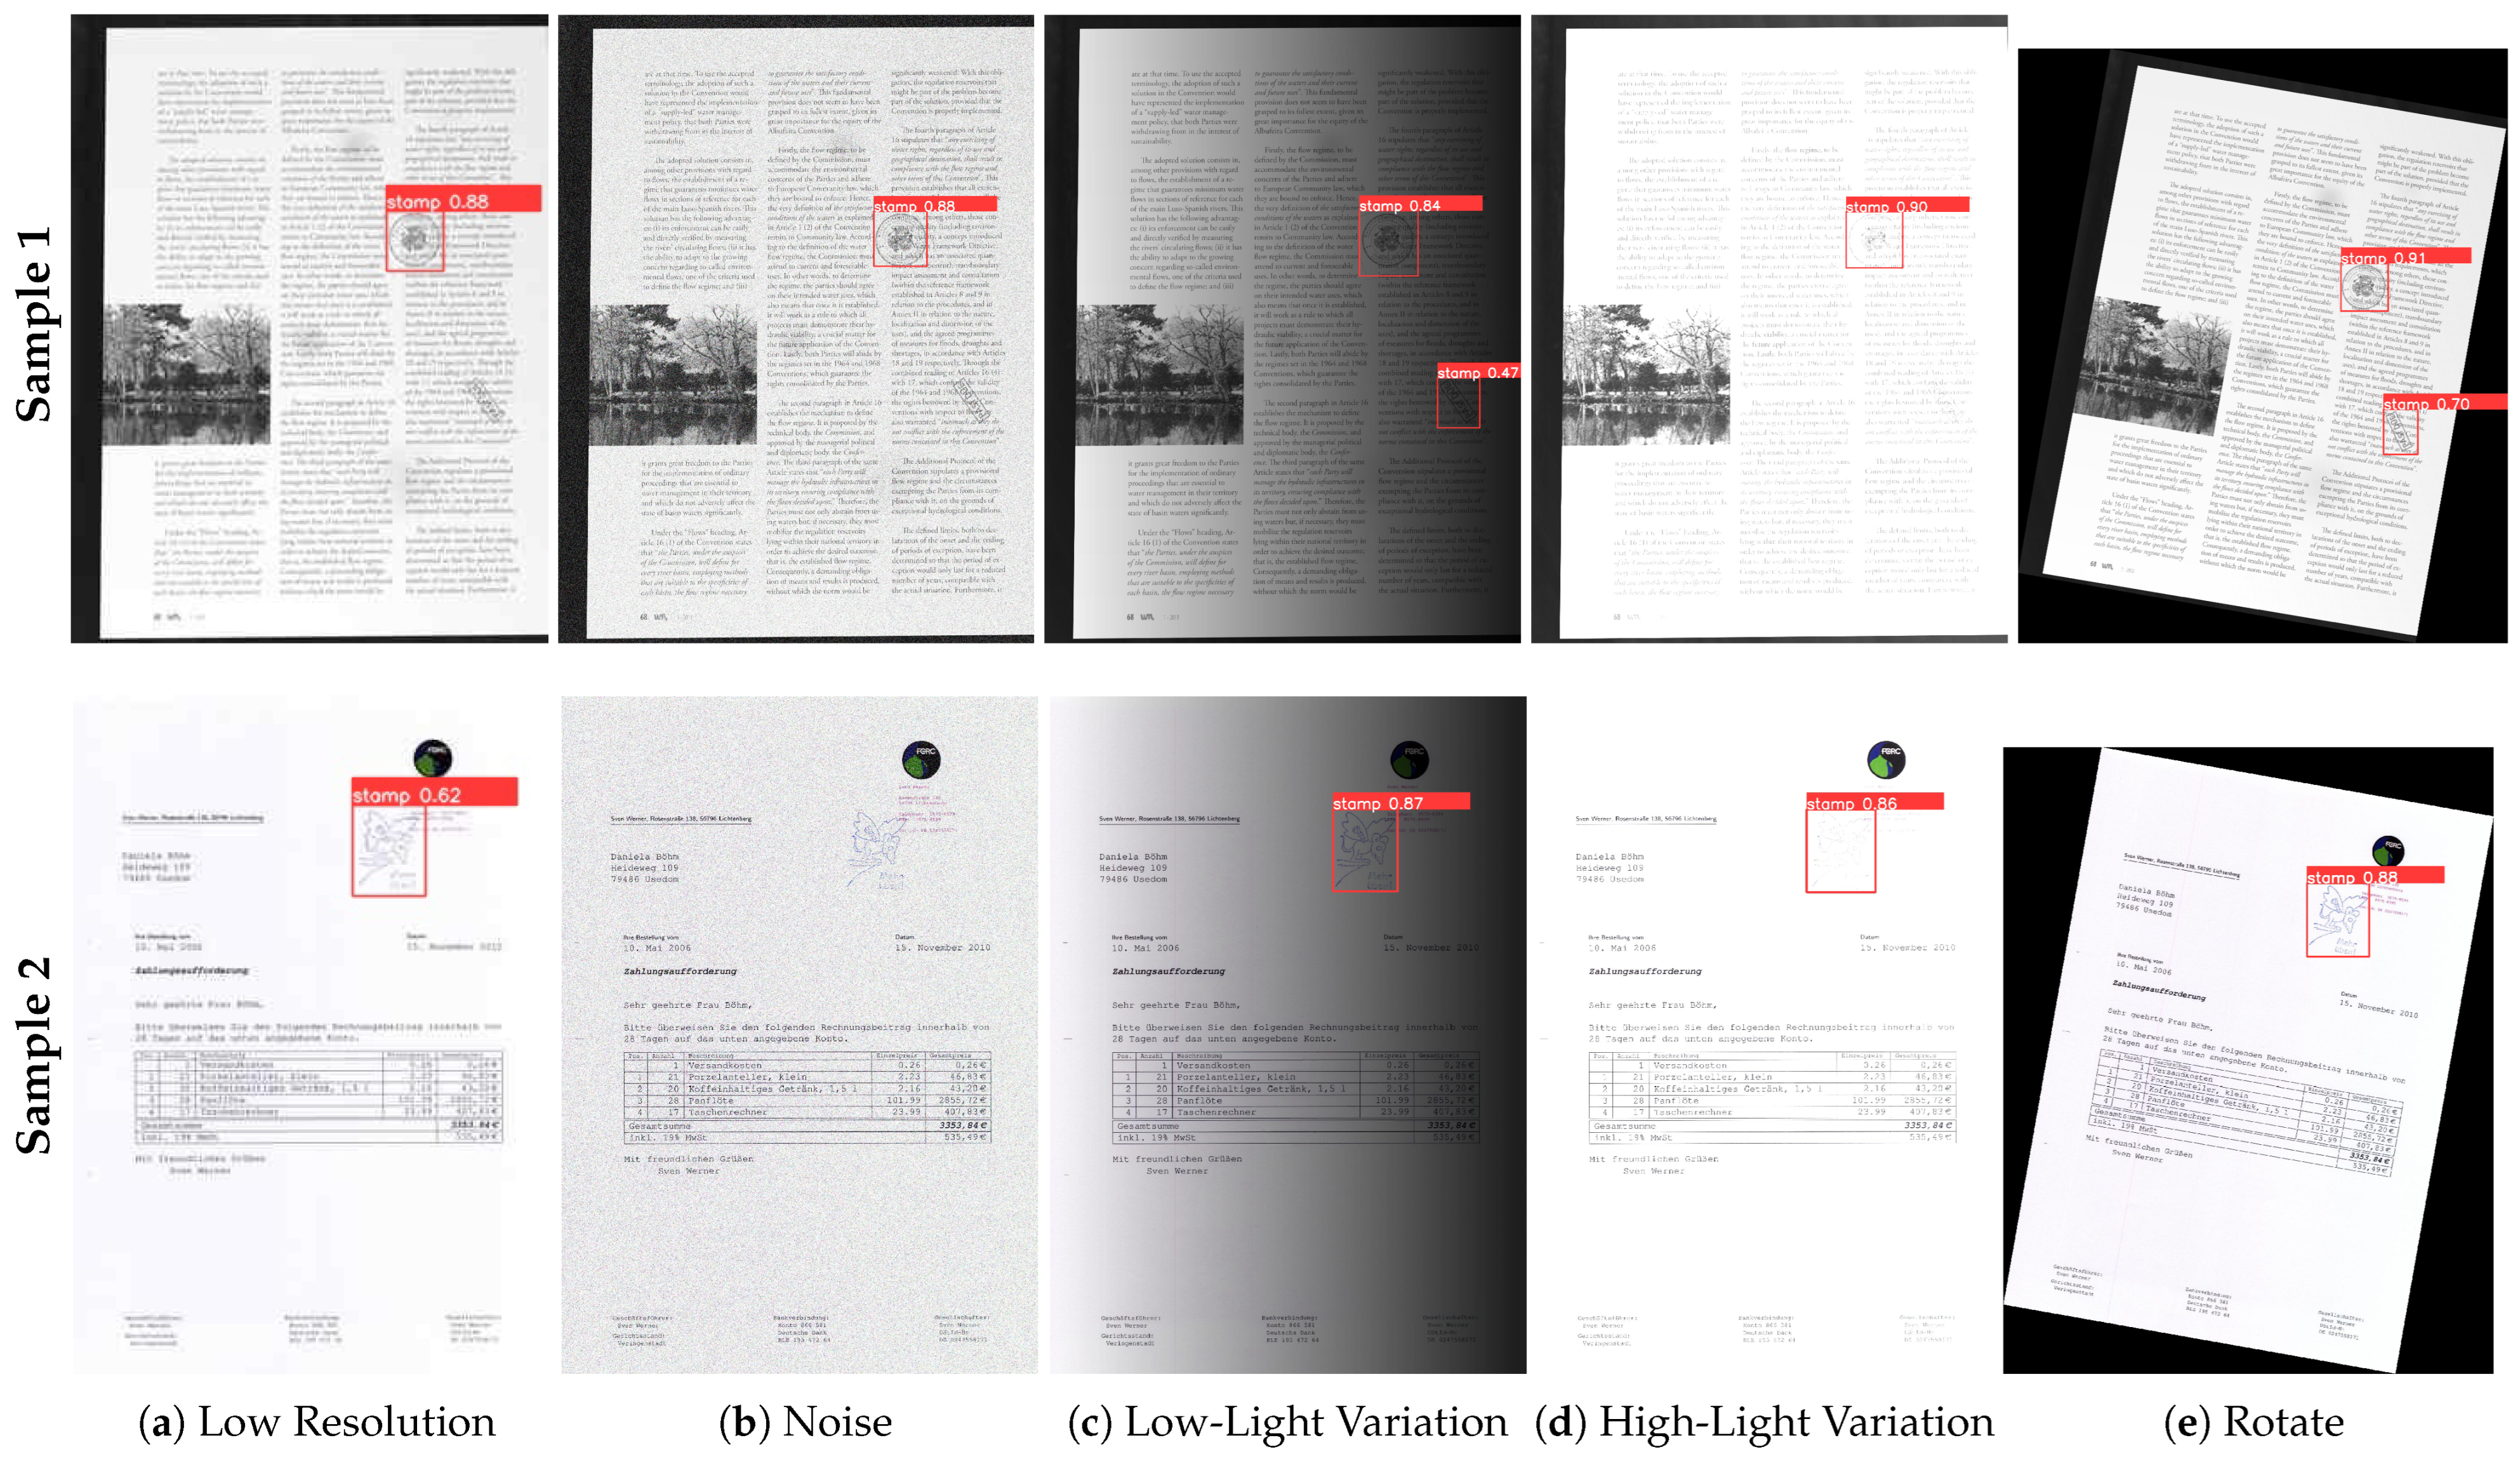
4.4. Robustness Analysis
5. Conclusions
Author Contributions
Funding
Institutional Review Board Statement
Informed Consent Statement
Data Availability Statement
Acknowledgments
Conflicts of Interest
References
- Tan, Y.; Sim, H.; Lim, C.; Yang, C. A Preliminary Study on Stamp Impressions with the Same Placement and Orientation on Reproduced Documents—How Easily can it be Achieved by Deliberately Stamping at the Same Relative Position and Orientation? J. Am. Soc. Quest. Doc. Exam. 2020, 23, 33–40. [Google Scholar] [CrossRef]
- de Araújo, J.M.G. Carimbo, sim: O carimbo como um aliado da segurança em coleções especiais. PontodeAcesso 2022, 16, 566–581. [Google Scholar] [CrossRef]
- da Silva, E.B.; Costantin de Sá, D.C.; Martins Barbosa, S.A. Document forgery in brazil general panorama and prospects of combat. Rev. Ciênc. Juríd. Sociais-IURJ 2024, 5, 107–125. [Google Scholar] [CrossRef]
- Duy, H.L.; Nghia, H.M.; Vinh, B.T.; Hung, P.D. An Efficient Approach to Stamp Verification. In Proceedings of the Smart Trends in Computing and Communications, Singapore, 24–25 January 2023; pp. 781–789. [Google Scholar] [CrossRef]
- Zhao, Z.Q.; Zheng, P.; Xu, S.T.; Wu, X. Object Detection with Deep Learning: A Review. IEEE Trans. Neural Netw. Learn. Syst. 2019, 30, 3212–3232. [Google Scholar] [CrossRef]
- Zou, Z.; Chen, K.; Shi, Z.; Guo, Y.; Ye, J. Object Detection in 20 Years: A Survey. Proc. IEEE 2023, 111, 257–276. [Google Scholar] [CrossRef]
- Ren, S.; He, K.; Girshick, R.; Sun, J. Faster R-CNN: Towards Real-Time Object Detection with Region Proposal Networks. IEEE Trans. Pattern Anal. Mach. Intell. 2017, 39, 1137–1149. [Google Scholar] [CrossRef]
- Redmon, J.; Divvala, S.; Girshick, R.; Farhadi, A. You Only Look Once: Unified, Real-Time Object Detection. In Proceedings of the 2016 IEEE Conference on Computer Vision and Pattern Recognition (CVPR), Las Vegas, NV, USA, 27–30 June 2016; pp. 779–788. [Google Scholar] [CrossRef]
- Liu, W.; Anguelov, D.; Erhan, D.; Szegedy, C.; Reed, S.; Fu, C.Y.; Berg, A.C. SSD: Single Shot MultiBox Detector. In Proceedings of the Computer Vision—ECCV 2016, Amsterdam, The Netherlands, 11–14 October 2016; Leibe, B., Matas, J., Sebe, N., Welling, M., Eds.; Springer: Cham, Switzerland, 2016; pp. 21–37. [Google Scholar] [CrossRef]
- Tan, M.; Pang, R.; Le, Q.V. EfficientDet: Scalable and Efficient Object Detection. In Proceedings of the IEEE/CVF Conference on Computer Vision and Pattern Recognition (CVPR), Seattle, WA, USA, 13–19 June 2020. [Google Scholar] [CrossRef]
- Vilcapoma, P.; Parra Meléndez, D.; Fernández, A.; Vásconez, I.N.; Hillmann, N.C.; Gatica, G.; Vásconez, J.P. Comparison of Faster R-CNN, YOLO, and SSD for Third Molar Angle Detection in Dental Panoramic X-rays. Sensors 2024, 24, 6053. [Google Scholar] [CrossRef] [PubMed]
- Kim, J.a.; Sung, J.Y.; Park, S.h. Comparison of Faster-RCNN, YOLO, and SSD for Real-Time Vehicle Type Recognition. In Proceedings of the 2020 IEEE International Conference on Consumer Electronics—Asia (ICCE-Asia), Seoul, Republic of Korea, 1–3 November 2020; pp. 1–4. [Google Scholar] [CrossRef]
- Li, M.; Zhang, Z.; Lei, L.; Wang, X.; Guo, X. Agricultural Greenhouses Detection in High-Resolution Satellite Images Based on Convolutional Neural Networks: Comparison of Faster R-CNN, YOLO v3 and SSD. Sensors 2020, 20, 4938. [Google Scholar] [CrossRef] [PubMed]
- Khin, P.P.; Htaik, N.M. Gun Detection: A Comparative Study of RetinaNet, EfficientDet and YOLOv8 on Custom Dataset. In Proceedings of the 2024 IEEE Conference on Computer Applications (ICCA), Yangon, Myanmar, 16 March 2024; pp. 1–7. [Google Scholar] [CrossRef]
- Munteanu, D.; Moina, D.; Zamfir, C.G.; Petrea, Ș.M.; Cristea, D.S.; Munteanu, N. Sea Mine Detection Framework Using YOLO, SSD and EfficientDet Deep Learning Models. Sensors 2022, 22, 9536. [Google Scholar] [CrossRef] [PubMed]
- Hussain, M. YOLOv5, YOLOv8 and YOLOv10: The Go-To Detectors for Real-time Vision. arXiv 2024, arXiv:2407.02988. [Google Scholar] [CrossRef]
- Wang, C.Y.; Yeh, I.H.; Liao, H.Y.M. YOLOv9: Learning What You Want to Learn Using Programmable Gradient Information. arXiv 2024, arXiv:2402.13616. [Google Scholar] [CrossRef]
- Wang, A.; Chen, H.; Liu, L.; Chen, K.; Lin, Z.; Han, J.; Ding, G. YOLOv10: Real-Time End-to-End Object Detection. arXiv 2024, arXiv:2405.14458. [Google Scholar] [CrossRef]
- Alif, M.A.R. YOLOv11 for Vehicle Detection: Advancements, Performance, and Applications in Intelligent Transportation Systems. arXiv 2024, arXiv:2410.22898. [Google Scholar] [CrossRef]
- Micenkov, B.; Beusekom, J.V. Stamp Detection in Color Document Images. In Proceedings of the 2011 International Conference on Document Analysis and Recognition, Beijing, China, 18–21 September 2011; pp. 1125–1129. [Google Scholar] [CrossRef]
- Zharikov, I.; Nikitin, P.; Vasiliev, I.; Dokholyan, V. DDI-100: Dataset for Text Detection and Recognition. In Proceedings of the 2020 4th International Symposium on Computer Science and Intelligent Control, ACM, Newcastle upon Tyne, UK, 17–19 November 2020. [Google Scholar] [CrossRef]
- Prokudina, K.; Skriplyonok, M.; Vostrikov, A. Development of a Detector for Stamps on Images. In Proceedings of the 2024 International Conference on Industrial Engineering, Applications and Manufacturing (ICIEAM), Sochi, Russia, 12–16 May 2024; pp. 865–869. [Google Scholar]
- Nandedkar, A.V.; Mukherjee, J.; Sural, S. A spectral filtering based deep learning for detection of logo and stamp. In Proceedings of the 2015 Fifth National Conference on Computer Vision, Pattern Recognition, Image Processing and Graphics (NCVPRIPG), Patna, Bihar, 16–19 December 2015; pp. 1–4. [Google Scholar] [CrossRef]
- Younas, J.; Afzal, M.Z.; Malik, M.I.; Shafait, F.; Lukowicz, P.; Ahmed, S. D-StaR: A Generic Method for Stamp Segmentation from Document Images. In Proceedings of the 2017 14th IAPR International Conference on Document Analysis and Recognition (ICDAR), Kyoto, Japan, 9–15 November 2017; pp. 248–253. [Google Scholar] [CrossRef]
- Gayer, A.; Ershova, D.; Arlazarov, V. Fast and Accurate Deep Learning Model for Stamps Detection for Embedded Devices. Pattern Recognit. Image Anal. 2022, 32, 772–779. [Google Scholar] [CrossRef]
- Jin, X.; Mu, Q.; Chen, X.; Liu, Q.; Xiao, C. Digital Archive Stamp Detection and Extraction. In International Symposium on Artificial Intelligence and Robotics; Springer: Singapore, 2024; pp. 165–174. [Google Scholar] [CrossRef]
- Forczmański, P.; Smolinski, A.; Nowosielski, A.; Małecki, K. Segmentation of Scanned Documents Using Deep-Learning Approach. In Progress in Computer Recognition Systems 11; Springer: Cham, Switzerland, 2020; pp. 141–152. [Google Scholar] [CrossRef]
- Terven, J.; Córdova-Esparza, D.M.; Romero-González, J.A. A Comprehensive Review of YOLO Architectures in Computer Vision: From YOLOv1 to YOLOv8 and YOLO-NAS. Mach. Learn. Knowl. Extr. 2023, 5, 1680–1716. [Google Scholar] [CrossRef]
- Wang, C.Y.; Mark Liao, H.Y.; Wu, Y.H.; Chen, P.Y.; Hsieh, J.W.; Yeh, I.H. CSPNet: A New Backbone that can Enhance Learning Capability of CNN. In Proceedings of the 2020 IEEE/CVF Conference on Computer Vision and Pattern Recognition Workshops (CVPRW), Seattle, WA, USA, 14–19 June 2020; pp. 1571–1580. [Google Scholar] [CrossRef]
- Wang, C.Y.; Liao, H.Y.; Yeh, I.H. Designing Network Design Strategies Through Gradient Path Analysis. arXiv 2022, arXiv:2211.04800. [Google Scholar] [CrossRef]
- Liu, S.; Qi, L.; Qin, H.; Shi, J.; Jia, J. Path Aggregation Network for Instance Segmentation. In Proceedings of the 2018 IEEE/CVF Conference on Computer Vision and Pattern Recognition, Salt Lake City, UT, USA, 18–22 June 2018; pp. 8759–8768. [Google Scholar] [CrossRef]
- Khanam, R.; Hussain, M. YOLOv11: An Overview of the Key Architectural Enhancements. arXiv 2024, arXiv:2410.17725. [Google Scholar] [CrossRef]
- Padilla, R.; Netto, S.L.; da Silva, E.A.B. A Survey on Performance Metrics for Object-Detection Algorithms. In Proceedings of the 2020 International Conference on Systems, Signals and Image Processing (IWSSIP), Niterói, Brazil, 1–3 July 2020; pp. 237–242. [Google Scholar] [CrossRef]
- Arya, S.; Kashyap, A. A novel method for real-time object-based copy-move tampering localization in videos using fine-tuned YOLO V8. Forensic Sci. Int. 2024, 48, 301663. [Google Scholar] [CrossRef]


| Total | Circular | Triangular | Textual | Cartoon | Rectangular |
|---|---|---|---|---|---|
| 1311 | 610 | 196 | 196 | 187 | 122 |
| 100% | 46.5% | 15.0% | 15.0% | 14.3% | 9.3% |
| Total Images | Train | Validation | Test |
|---|---|---|---|
| 732 | 512 | 110 | 110 |
| 100% | 70% | 15% | 15% |
| Models | #Param. (M) | Layers | FLOPS (G) | Size (MB) |
|---|---|---|---|---|
| YOLOv8s | 11.14 | 225 | 28.6 | 22.0 |
| YOLOv9s | 9.76 | 1269 | 40.4 | 19.9 |
| YOLOv10s | 8.07 | 402 | 24.8 | 16.2 |
| YOLOv11s | 9.43 | 319 | 21.5 | 18.7 |
| Models | Complete Epochs | Train Time (min) | Time per Epoch (min) |
|---|---|---|---|
| YOLOv8s | 227 | 32.4 | 0.14 |
| YOLOv9s | 330 | 361.2 | 1.09 |
| YOLOv10s | 327 | 64.8 | 0.20 |
| YOLOv11s | 179 | 27.6 | 0.15 |
| Models | Precision (%) | Recall (%) | mAP (%) | Inference Time (ms) |
|---|---|---|---|---|
| YOLOv8s | 95.8 | 95.6 | 97.3 | 13.9 |
| YOLOv9s | 97.6 | 97.6 | 98.7 | 33.1 |
| YOLOv10s | 97.0 | 93.5 | 97.5 | 14.5 |
| YOLOv11s | 95.8 | 91.7 | 96.5 | 13.8 |
Disclaimer/Publisher’s Note: The statements, opinions and data contained in all publications are solely those of the individual author(s) and contributor(s) and not of MDPI and/or the editor(s). MDPI and/or the editor(s) disclaim responsibility for any injury to people or property resulting from any ideas, methods, instructions or products referred to in the content. |
© 2025 by the authors. Licensee MDPI, Basel, Switzerland. This article is an open access article distributed under the terms and conditions of the Creative Commons Attribution (CC BY) license (https://creativecommons.org/licenses/by/4.0/).
Share and Cite
Bento, J.; Paixão, T.; Alvarez, A.B. Performance Evaluation of YOLOv8, YOLOv9, YOLOv10, and YOLOv11 for Stamp Detection in Scanned Documents. Appl. Sci. 2025, 15, 3154. https://doi.org/10.3390/app15063154
Bento J, Paixão T, Alvarez AB. Performance Evaluation of YOLOv8, YOLOv9, YOLOv10, and YOLOv11 for Stamp Detection in Scanned Documents. Applied Sciences. 2025; 15(6):3154. https://doi.org/10.3390/app15063154
Chicago/Turabian StyleBento, João, Thuanne Paixão, and Ana Beatriz Alvarez. 2025. "Performance Evaluation of YOLOv8, YOLOv9, YOLOv10, and YOLOv11 for Stamp Detection in Scanned Documents" Applied Sciences 15, no. 6: 3154. https://doi.org/10.3390/app15063154
APA StyleBento, J., Paixão, T., & Alvarez, A. B. (2025). Performance Evaluation of YOLOv8, YOLOv9, YOLOv10, and YOLOv11 for Stamp Detection in Scanned Documents. Applied Sciences, 15(6), 3154. https://doi.org/10.3390/app15063154