Abstract
With the recent advancements in automated driving technology, object detection algorithms that can effectively respond to complex and diverse road traffic scenarios are especially important for driving safety during real driving. In this context, we conduct an in-depth study on object detection algorithms for diverse scenarios in autonomous driving. For diverse and changing backgrounds and multi-scale targets, we propose environmental perception attention (EPA) and the three-scale fusion module (TSFM) to improve the accuracy of object detection algorithms in complex traffic scenes. Environmental perception attention effectively improves the model’s ability to perceive the object by modeling long-range information and inter-channel relationships to direct the model’s attention to important task-related regions and important features in the image. The three-scale fusion module mixes features from different scales while introducing low-level feature map information, enabling the model to take into account the features of objects at different scales. In our experiments, we apply the proposed method to the YOLOv8 model for validation. The results show that compared to the performance of the baseline model on the BDD100K automated driving domain dataset with diverse and complex backgrounds, the mAP@0.5 metric of the improved model is increased by 1.3%. This makes the YOLOv8 more accurate and effective for the detection of different objects in the scenario, and it can better adapt to the different traffic scenarios and environmental changes.
1. Introduction
In recent years, deep learning-based object detection algorithms have been widely used in various fields. Two-stage object detection algorithms such as the RCNN series [1,2,3] divide the object detection task into two consecutive stages: candidate region generation and classification and bounding box regression. Although the two-stage detection method has high computational complexity, by generating candidate regions, the number of regions that need to be processed is significantly reduced, making the second-stage classification and regression more efficient. In contrast, one-stage object detection algorithms, such as the YOLO series [4,5,6,7,8,9], transform the object detection task into a regression problem, and complete the location and classification of the target at the same time through a single forward propagation, making its structure more concise and efficient. Recently, with the successful application of transformers in the field of computer vision, transformer-based object detection algorithms have also become a hot topic of research. DETR (end-to-end object detection with transformers), as the earliest classic algorithm that applies transformers to object detection, transforms the object detection task into a set prediction problem and directly predicts the location and category of objects from images through the self-attention mechanism. However, its training efficiency is low and the computational overhead is large. In order to make up for the shortcomings of DETR [10], RT-DETR [11] has been carefully optimized and designed on the transformer architecture, enabling it to achieve higher accuracy in real-time applications and demonstrate good performance in multiple application scenarios.
In real traffic scenarios, the complexity of the driving environment brings many challenges to the research and application of automatic driving object detection. In automated driving tasks, various objects in road traffic scenes, such as vehicles, pedestrians, traffic signs, traffic signals, etc., are required to be recognized in real time and accurately, which requires efficient algorithms that can handle complex environments and a wide variety of objects. The background of pictures in real traffic scenes is complex, and the same type of objects may be in different background environments due to weather, geographic location, and angle. In this case, it is extremely important for the model to be able to capture long-distance spatial information to provide rich context for the model.
Normal convolutional neural networks fuse local feature response points through convolution operators, resulting in the limited ability of models that rely only on convolution to capture the dependencies between these spatial locations. Although the receptive field can be enlarged to obtain long-range dependency information of feature maps by using large convolution kernels [12] or stacking multiple layers [13], it may bring more serious side effects, such as explosion of model parameters and computational complexity, difficulty in optimization and convergence, and network degradation [14]. ViTs [15,16] applies the standard transformer [17] in the field of natural language processing to visual images, so that each layer has a global receptive field. However, the transformer lacks some of the inductive biases inherent in CNNs and needs to learn this prior knowledge through large-scale datasets. NLNet and other works [18,19] introduced long-distance dependency information by combining non-local attention with convolutional neural networks. The non-local attention method calculates the response of a certain position as the weighted sum of the features of all positions in the input feature map, so that the receptive field of the current position can exceed the local convolution kernel to cover the entire regional feature map. However, the calculation process requires calculating the dot product similarity between the two feature response points, which will bring quadratic complexity relative to the size of the feature map. Therefore, the scope of application of non-local attention is limited. For example, it is difficult to extend its application to high-resolution images in downstream tasks such as object detection and semantic segmentation, and it is not friendly to lightweight convolutional neural network models deployed on resource-constrained devices.
Based on the characteristics of real traffic scene images, we designed the environmental perception attention (EPA) method, which captures long-range background environment feature information through row and column one-dimensional convolution. It can help the model automatically focus on important areas and features and ignore irrelevant background information, and it is efficient and lightweight.
In addition, objects in traffic scenes may have different sizes and shapes, and multi-scale fusion can effectively capture the features of these different scales. Feature pyramid networks such as FPN [20] and PAN [21] usually simply aggregate adjacent feature maps through bottom-up and top-down paths and cannot effectively utilize the correlation between feature maps at multiple levels. In addition, low-level feature maps also contain a lot of useful details and positioning information, which existing models fail to simply and effectively utilize. Based on the above shortcomings, we designed a three-scale fusion module (TSFM) to effectively fuse multi-scale features and simply and effectively utilize low-level feature maps. It can help the model better understand the contextual information of complex scenes, improve the model’s adaptability to complex scenes, and improve the model’s ability to recognize objects of various sizes in complex traffic scenes.
2. Related Work
2.1. Attention Mechanism
The attention mechanism originates from the study of human vision. When humans observe the surrounding environment, they will selectively pay attention to the salient part of the information, while ignoring other information that is not obvious. The introduction of the attention mechanism into the convolutional neural network enables the model to learn where and what to pay attention to, so that it can automatically select information that is more valuable to the current task from a large amount of information. The residual attention network [22] performs down-sampling and up-sampling through a soft mask branch, generates a spatial attention map, and weights it to the trunk branch. SENet [23] first compresses the global spatial information into channel descriptors through the Sequeeze operation, and then captures the channel dependency through the Excitation operation of two fully connected layers, similar to the bottleneck structure [14], to generate channel attention weights. CBAM [24] generates attention maps by concatenating channel and spatial dimensions, and then multiplies the channel and spatial attention maps by the input feature map, respectively, for adaptive feature refinement. In contrast, BAM [25] computes the attention maps along the channel and spatial dimensions in parallel, and then aggregates the channel and spatial attention maps into the final attention recalibration weights. SKNet [26] applies convolution kernels of different sizes to the feature map to obtain receptive fields of different scales, and finally calculates the gate vector to control the aggregation of feature maps of all branches to obtain the output feature map.
Google first proposed applying self-attention to explore global dependencies in the transformer architecture for machine translation [17]. In the field of computer vision, for global context information, NLNet [18], ANN [19], GCNet [27], and DANet [28] introduced non-local attention mechanisms to construct dense spatial feature maps to capture long-range dependencies in non-local operations, and use non-local mechanisms to capture different types of spatial information. However, since non-local modules need to calculate a large relationship matrix for each spatial position, it brings expensive computational costs and storage space occupancy, and is usually used in large models. SPNet [29] replaces global spatial pooling with horizontal and vertical strip pooling layers to more efficiently capture long-range dependencies and large-scale contexts. Since channel attention represented by SE ignores position information, CA [30] merges and captures feature maps in two directions and then decomposes them into two 1D feature encoding processes to aggregate features along two spatial directions, effectively embedding position information. ELA [31] processes feature vectors independently for each direction, avoiding dimensionality reduction in the intermediate process and achieving better results.
2.2. Traffic Scene Object Detection
Based on popular object detection algorithms, some works have studied object detection algorithms in traffic scenarios in the field of autonomous driving. Wang et al. [32] added detection scales and introduced a spatial pyramid pooling module based on YOLOv3-tiny, which improved the accuracy and speed of vehicle detection in complex road environments. Wu et al. [33] adjusted the network layer structure of YOLOv5s to make it more suitable for embedded devices and applied it to vehicle and distance detection. Carrasco et al. [34] significantly improved the model detection performance based on YOLOv5 by using a multi-scale mechanism to learn different levels of feature representations and dynamically determining the scale that is most suitable for detecting the objects in the scenario. In order to solve the problems of low accuracy and missed detection of the SSD vehicle detection algorithm, Guo et al. [35] improved the SSD algorithm by replacing the backbone network, designing a feature fusion model, and adding an attention module, which improved the accuracy but reduced the detection speed. Mao et al. [36] achieved good results in multi-scale vehicle target detection by using inverted residual technology, introducing a spatial pyramid pooling module to obtain multi-scale information, and using a soft non-maximum suppression method to improve YOLOv3. Alsanaban et al. [37] added a residual module with an auxiliary block structure to improve the YOLOv4-tiny detection algorithm, reducing memory usage and improving detection speed. Aduen et al. [38] proposed a series of YOLO-Z models of different scales by replacing the backbone network and neck network of the YOLOv5 model and manually changing the connection methods of some layers, thereby improving the small target detection effect in the field of autonomous driving. Bie et al. [39] introduced depth-separable convolution and C3Ghost modules on the YOLOv5n algorithm, added SE attention, and optimized feature fusion at different scales, which not only significantly reduced the model size but also improved the accuracy. Ghosh [40] introduced the variable-size region proposal mechanism into Faster R-CNN through a multi-RPN fusion strategy, achieving better accuracy detection in complex weather and vehicle size diversity scenarios. Zhao et al. [41] proposed an SSD-based target detection algorithm, which significantly improved the accuracy and speed of vehicle detection in traffic environments through the proposed feature pyramid enhancement and cascade detection mechanism. Zhao et al. [42] significantly improved the target detection performance based on DETR through multi-scale feature extraction, and grouped axial attention mechanism and dynamic hyperparameter adjustment, which is suitable for complex scene detection tasks in autonomous driving.
3. Method
3.1. Environmental Perception Attention (EPA)
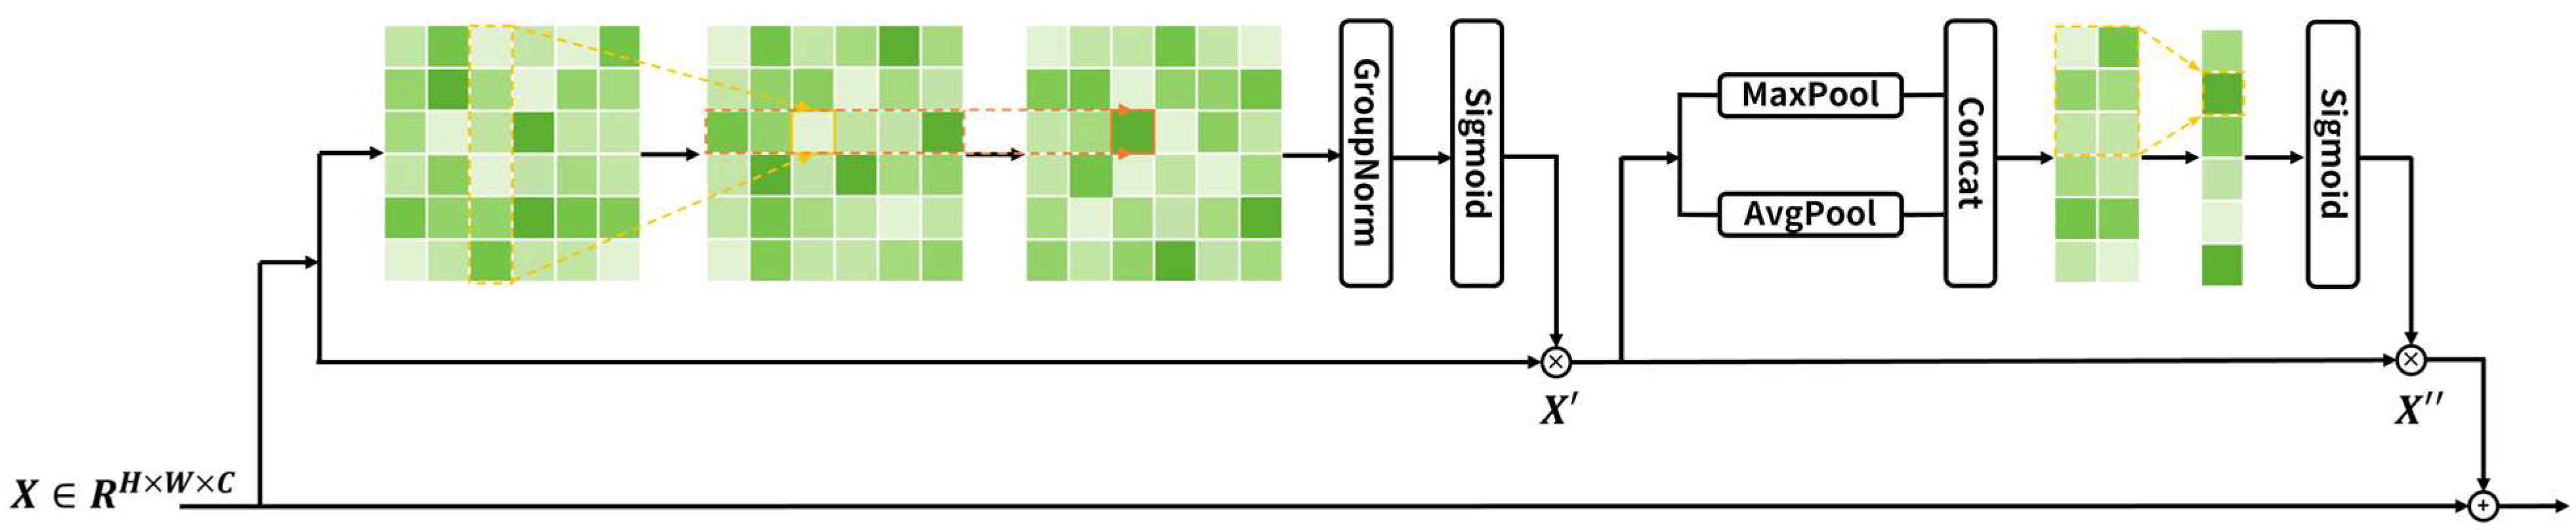
In real driving, the model needs to have the ability to “see” a wide range of environmental information to help accurately and effectively locate and identify various targets. When faced with complex scenes, the model can more effectively identify key information, reduce interference and noise, and automatically select the features most relevant to the current decision. In addition, the model must also adapt to different weather conditions (such as rain, snow, fog, etc.) and lighting environments (such as direct sunlight or night driving) to enhance its robustness and reduce the misjudgment rate. Especially when identifying distant obstacles, pedestrians, and other vehicles, it is particularly important for the model to focus on a wide area around the vehicle. We designed a lightweight environmental perception attention (EPA) to help the model capture long-range contextual relationships, supplement a wide range of environmental information into the network model, and improve the robustness of the model in various scenarios. The environmental perception attention structure is shown in Figure 1.
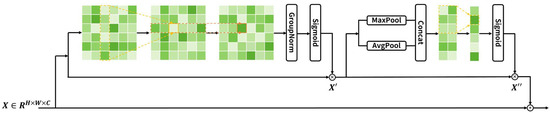
Figure 1.
Environmental perception attention (EPA).
Specifically, given an input feature map , where is the number of feature map channels, and are the height and width of the feature map space dimensions, respectively. The calculation method of the convolution operator aggregates local range context information onto the new feature map, which can be expressed as
where is the convolution kernel size, f is the output feature map, is the convolution kernel weight parameter, and is the input feature map.
If is increased to or , although the global receptive field is obtained, it will introduce quadratic computational complexity, that is, , which is particularly obvious in high-resolution scenarios [43]. Considering the lightweight and efficient nature of the attention mechanism, it is required to preserve long-range dependency information and obtain the attention weight results in a simple and effective manner. We decompose it by rows and columns, obtain the relationship between the long-distance row and column spatial positions, and effectively enhance the interactive ability of positioning information embedding through the interaction of feature information extracted by rows and columns. From the spatial dimension, the decomposition operation aggregates wide or high feature information in a fully connected manner. After the row is fully connected, each position of the output feature map is aggregated by the corresponding row information of the input, and then the corresponding column information is aggregated through the column fully connected, thereby indirectly capturing long-distance position information, and the computational overhead is reduced to . From the perspective of convolution operations, the above steps are to decompose the two-dimensional convolution into rows and columns and perform one-dimensional convolution operations, respectively, which is also a popular strategy to reduce the complexity of large convolution kernels [44,45]. Therefore, two one-dimensional convolutions can be cascaded to implement the above steps, and deep convolution can be applied to reduce the amount of calculation and parameters.
Compared with the fully connected layer, the one-dimensional convolution can take advantage of the parameter sharing and local connection of the convolution layer, further reducing the computational overhead, that is . In addition to adjusting the convolution kernel size as needed, the one-dimensional convolution can also implement other extended convolution operations in the operator, such as introducing the dilated convolution technology [46], which maintains the amount of computation and the number of parameters while increasing the receptive field. Since batch normalization is heavily dependent on the mini-batch size and may have a negative impact on smaller network architectures, we use group normalization to be more stable when training small batch samples or with different batch sizes [47]. Group normalization and the Sigmoid activation function are then used to process the enhanced position information to obtain the representation of position attention in the horizontal and vertical directions. The above process can be expressed as
where represents one-dimensional convolution, represents group normalization, is a nonlinear activation function, and is the element-wise multiplication.
In the above process, we only use deep convolution to calculate and fuse features channel by channel, resulting in a lack of cross-channel interaction information. Next, we capture the dependencies and correlations between channels from the information of each channel in the feature map. First, we use global average pooling and global maximum pooling to aggregate and extract representative feature information contained in different channels. Global maximum pooling tends to retain high-frequency information and can capture more salient features such as edges and textures. Global average pooling tends to retain low-frequency information, can capture the overall feature distribution, and pays more attention to low-frequency information. Although second-order pooling such as covariance pooling [48] and bilinear pooling [49] can theoretically capture richer global statistical information, it will bring greater complexity and is not in line with our design concept. Considering that a single method is somewhat rough for representing the global context information of feature maps and may lose a lot of useful information, we combine them to comprehensively describe channel-level statistics.
Next, we generate weights for each feature channel from channel-level statistics. Most popular methods adaptively recalibrate channel-wise feature responses by explicitly modeling the interdependencies between channels. SENet [23] fits the complex correlations between channels by connecting two fully connected layers in series, and finally obtains normalized weights through a nonlinear activation function. The two fully connected layers first reduce the dimension and then restore it, which effectively controls the model complexity, but leads to an indirect relationship between the channels and their corresponding weights. In order to reduce the amount of computation, performing dimensionality reduction during the calculation process will damage the direct correspondence between channels and their weights, which will have an adverse effect on the generation of attention weights. Moreover, it is not necessary to capture the dependencies between all channels to achieve better results [31,50]. Therefore, we introduce a method to avoid dimensionality reduction and local cross-channel interaction in environmental perception attention, which is effective and lightweight. After obtaining the channel information, the channel attention is predicted by aggregating the information between each channel and its k adjacent channels. This operation is achieved by using a one-dimensional convolution of size k. The size of the convolution kernel k determines the coverage of local cross-channel interactions, that is, how many features of adjacent channels will participate in the calculation of the attention weight of a certain channel. The k value affects whether the model tends to have long-range or short-range interactions between channels, and manual adjustment is cumbersome and inefficient in different modules and architectures. Intuitively, the number of input feature map channels is proportional to k, but linear mapping is too simple, so an exponential function can be used to describe the corresponding relationship. In actual models, the number of channels © is often an integer power of 2, so the mapping relationship between it and k can be defined as
That is,
where represents the odd number closest to . Obviously, the larger the number of input feature map channels, the larger the value is, and the proportional relationship is still preserved. Based on the above process, the input processing steps can be expressed as
Among them, is a two-dimensional convolution with a convolution kernel of , and is global average pooling, i.e.,
is global maximum pooling, i.e.,
Finally, the attention weight is fused into the original input feature map, that is,
The environmental perception attention we designed uses one-dimensional convolutions along the horizontal and vertical dimensions to capture long-range interactions in space, and retains precise location information along the horizontal and vertical dimensions to strengthen attention to the spatial regions of interest. Channel-level information is embedded through global average pooling and global maximum pooling, and then the adjacent interaction range is dynamically adjusted to supplement cross-channel interaction information.
3.2. Three-Scale Fusion Module (TSFM)
Most of the target detection algorithms based on deep learning use the backbone network to extract features, in which higher-level semantic information is gradually acquired through multiple down-sampling processes to obtain feature maps of different levels, and finally the last three levels of feature maps are used for fusion and prediction. For prediction on feature maps of different scales, the main idea is to predict small targets on low-level high-resolution feature maps and predict large targets on high-level feature maps with high semantic information. The traditional feature pyramid network simply fuses the information of feature maps of adjacent scales and fails to capture the correlation between feature maps of multiple levels. In addition, the neck network only uses the feature map information of higher layers and ignores the rich detailed information in the larger-scale feature maps of lower layers. The feature maps of lower layers are usually higher in resolution and can provide richer contextual information, which is especially useful for boundary clarity and small object detection. Therefore, completely ignoring this feature information in the subsequent fusion process will affect the detection accuracy.
Based on the above analysis, we considered making effective use of the position information in the low-level feature map to preserve the detailed information of small objects and improve the expression of features. If we simply fed the low-level feature map into the neck network for fusion and added a large-scale feature map detection head, it would bring a huge number of parameters and calculations, and significantly reduce the inference speed. We designed a three-scale fusion module (TSFM) to aggregate features of multiple scales from the backbone network, namely the high-level semantic information of the deep feature maps and the detailed information of the shallow feature maps, and then fused the results into the neck network, as shown in Figure 2 below.
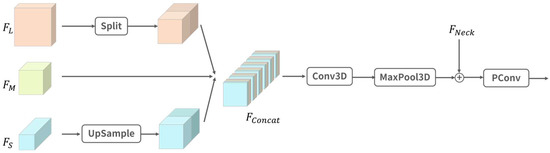
Figure 2.
Three-scale fusion module, where Split is the process shown in Figure 3.
Specifically, we first unified the resolution of the large () and small () feature maps from the backbone network to the medium-scale feature map size (), while keeping the number of channels unchanged. For small-scale feature maps, we used the nearest neighbor interpolation method for up-sampling. The nearest neighbor interpolation algorithm is not only simple and efficient, but also only considers the nearest pixel value and does not smooth the original pixel value, so it can retain the original features and edge information of the image. For the large-scale feature map , we did not use the traditional pooling or strided convolution down-sampling method, but split it to down-sample the feature map without losing learnable information [51]. The Split operation is shown in Figure 3 below.

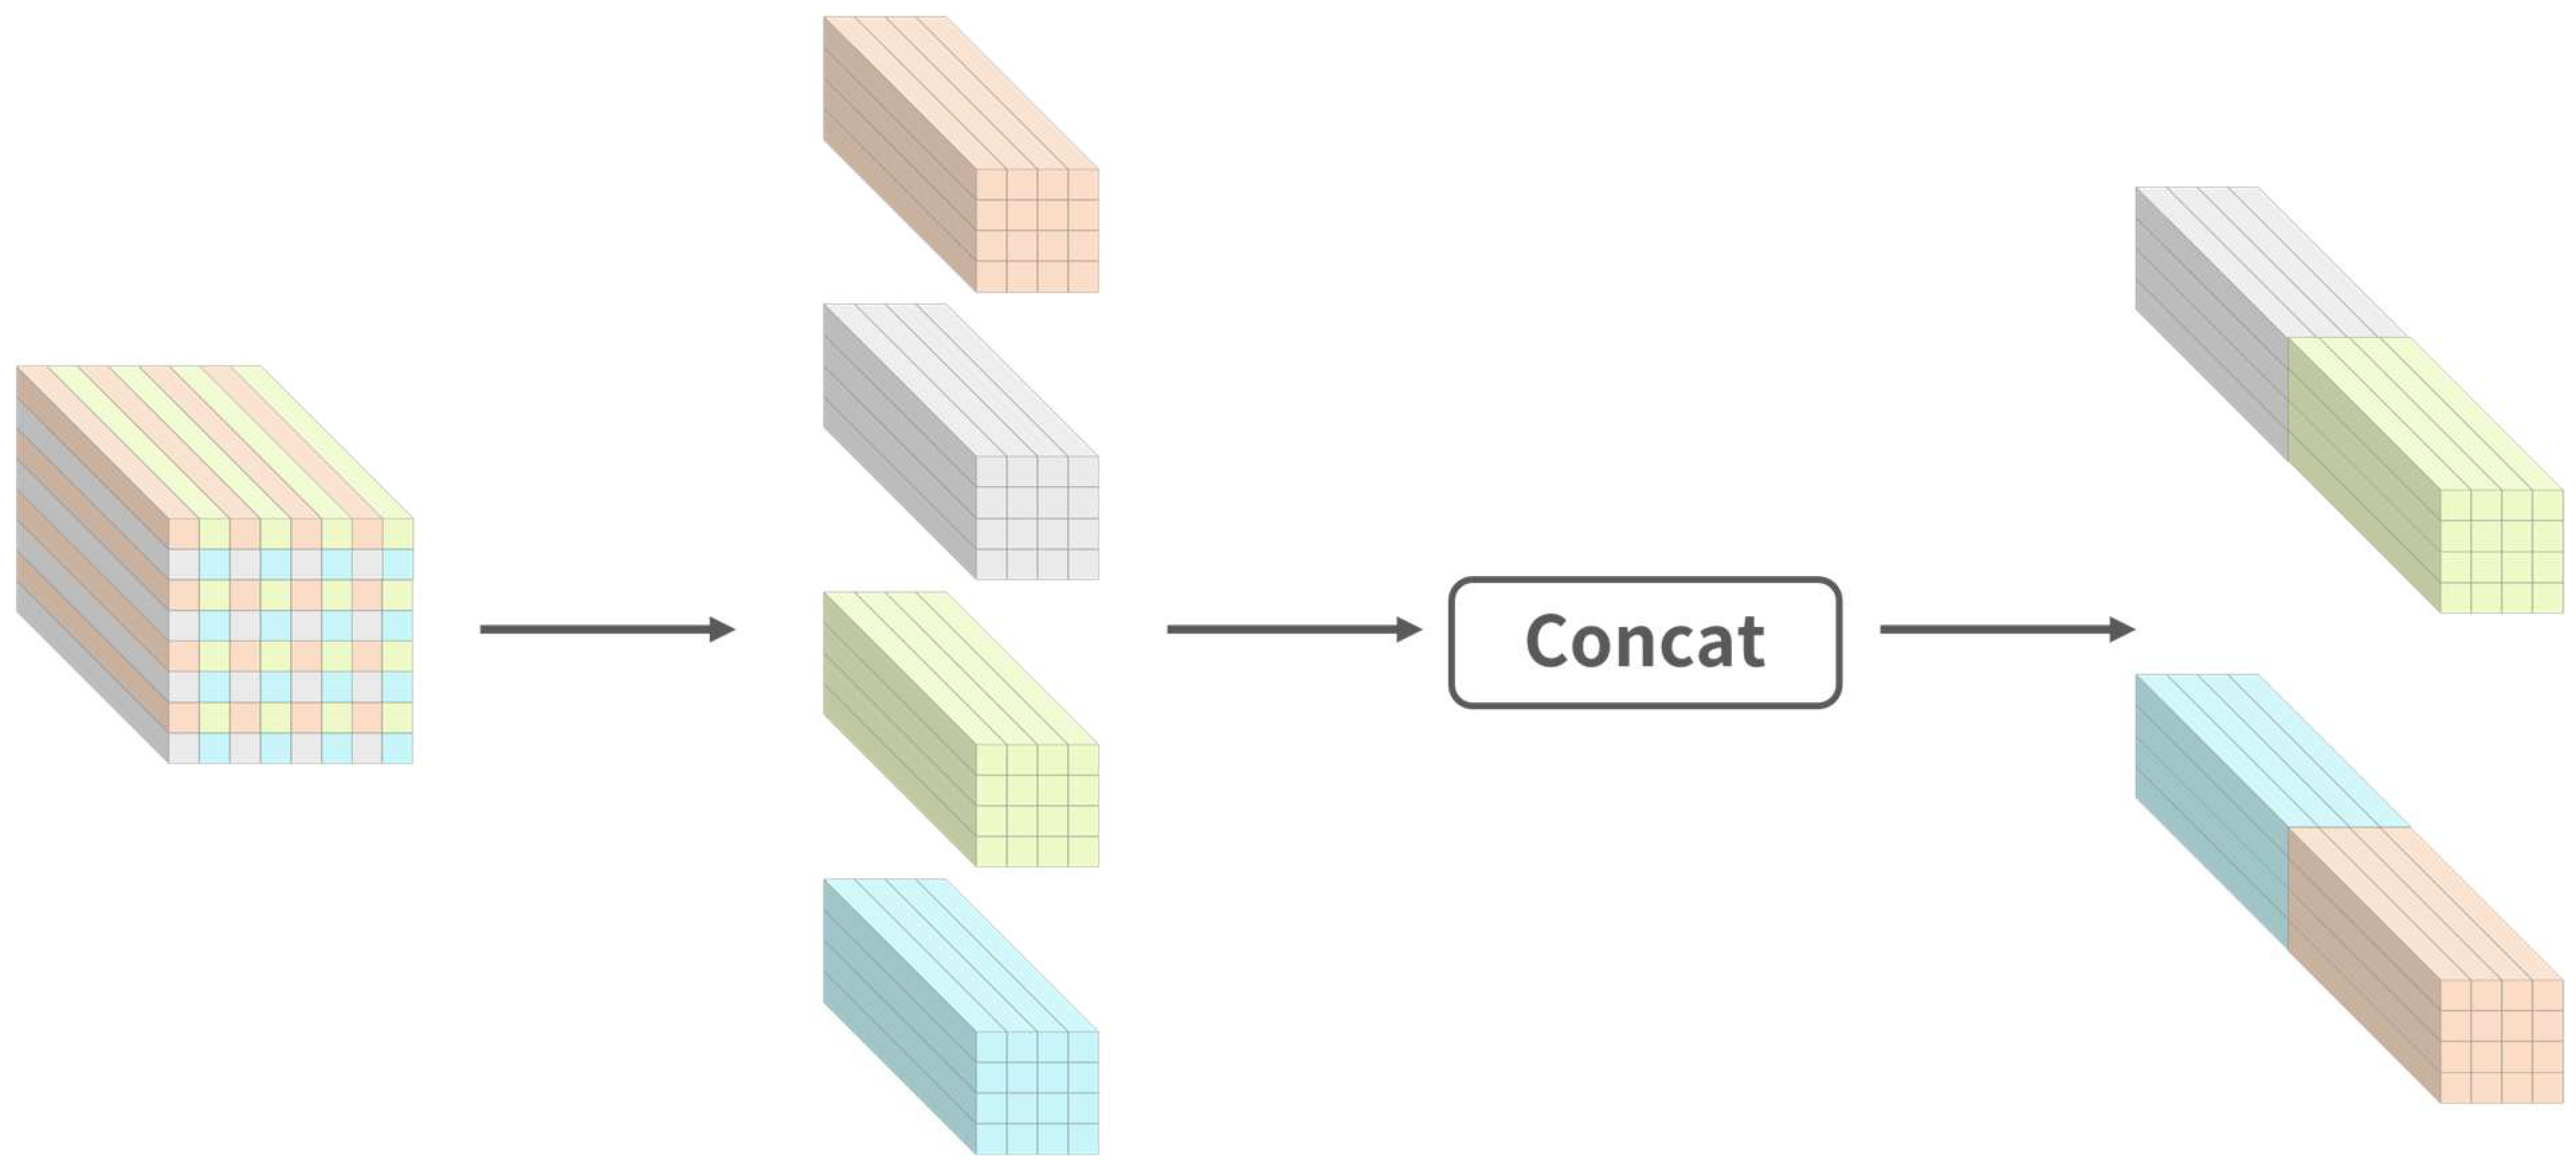
Figure 3.
Split operation steps.
The Split operation divides the large feature map into blocks with a scale of 2, concatenates the feature values at the same relative position in each block together with their channel dimensions, and finally forms a new sub-feature map. Relative to the original input feature map , the shape of each sub-map is , which can be regarded as the result of pooling calculations using specific position values to retain the original image, which retains all information in the channel dimension and avoids information loss.
Next, as shown in Figure 2, we concatenated all feature maps with the same scale to obtain the feature map and stacked them in the new dimension. Then, we extracted the combination of features at different levels and scales through 3D convolution (Conv3D) to obtain a richer multi-level feature representation [52]. However, features of different scales may contain different degrees of noise, especially in low-resolution features, where noise may be more obvious. When these features are fused, the noise may be amplified, affecting the performance of the model. When dealing with complex backgrounds or low-quality images, the impact of noise may cause the model to learn incorrect features. In addition, multi-scale features may contain similar information, and this redundant information may mask important features and affect the performance of the model. Therefore, we used 3D maximum pooling (MaxPool3D) to reduce redundant information, suppress the impact of noise, and emphasize important features to enhance the robustness of the model when processing noisy data. Finally, the output features were added to the neck network (), and point convolution (PConv) was used to fuse information between different channels to enhance the expressiveness of the model.
4. Experimental Results
4.1. Dataset and Experimental Environment
BDD100K (Berkeley DeepDrive 100K) [53] is a large-scale, diverse autonomous driving video dataset released by the Berkeley Deep Driving Lab, University of California, Berkeley, USA, in 2018. The data were collected at different times of the day and night and in various weather conditions, covering multiple cities and various scene types, and including common targets such as vehicles, traffic signs, and pedestrians during driving. Compared with other autonomous driving datasets, BDD100K can better simulate real-world driving scenarios and provide richer background information for the training and evaluation of autonomous driving systems. To alleviate the problem of imbalanced number of labeled instances of different categories in the dataset, we adopted a stratified sampling strategy to construct the training subset: first, we completely retained the images of categories with fewer labeled instances (such as motor) to ensure their representativeness; then, we randomly sampled from the remaining data and finally constructed a balanced subset containing 40,000 images. The new dataset was randomly allocated in an 8:1:1 ratio, and after division, 32,000 training sets, 4000 validation sets, and 4000 test sets were obtained, covering nine common types of targets in driving scenarios, including pedestrians, cars, traffic lights, traffic signs, etc.
The experimental environment was as follows: the operating system was Ubuntu 22.04.2 with a 64-bit operating system, the CPU was Intel(R) Xeon(R) Gold 6248R, the GPU was NVIDIA A100, the deep learning framework pytorch1.12.0, and python 3.8.19. We trained from scratch without using pre-trained weights. The training configuration was as follows: the input image size was 640 × 640, the batch size was 80, the optimizer was SGD, the initial learning rate was 0.01, the weight decay coefficient was 0.0005, the momentum was 0.937, the training round was 200, and the random seed was 0.
4.2. Comparative Experiment
In order to verify the effect and performance of the proposed method, we applied the proposed method to the YOLOv8s model and conducted experiments on the BDD100K dataset. The experimental results are shown in Table 1. This experiment compared the performance of various detection models and evaluated them from multiple aspects, such as accuracy (mAP@0.5 and mAP@0.5:0.95), number of parameters, and computational complexity. The results show that ours model achieves the optimal balance between accuracy and efficiency. Compared with other models, ours shows excellent detection performance while maintaining a low parameter count (11.193 M) and computational complexity (30.1 G), especially in complex autonomous driving scenarios, where it exhibits strong generalization capabilities. Compared with the lightweight YOLO series, although ours has slightly higher computational complexity, its accuracy has been significantly improved. Compared with classic Faster-RCNN and SSD, ours not only significantly improves accuracy, but also avoids deployment problems caused by high parameter volume and computational complexity on resource-constrained devices.

Table 1.
Performance of our method and other models on the BDD100K dataset.
In general, compared with other classic detection algorithms, our method takes into account both detection accuracy and speed and achieves a good balance. At the same time, it also maintains a high level of detection performance under the strict standards of different IoU thresholds, showing good generalization performance and deployment potential, and is more suitable for application in the field of autonomous driving.
4.3. Ablation Study
4.3.1. Environmental Perception Attention (EPA)
In environmental perception attention, the convolution kernel size (denoted by k) of a one-dimensional convolution represents, to some extent, the scope of contextual information captured in the spatial dimension—that is, how large the information in the receptive field can be obtained. However, intuitively, due to the saturation effect of the receptive field, blindly increasing the convolution kernel cannot continuously increase the receptive field of the model. In addition, all pixels in the receptive field contribute differently to the response of the model output, and the effective receptive field only accounts for a small part of the theoretical receptive field [54]. We explored the impact of EPA with different convolution kernel sizes on the performance of the detection algorithm, and the results are shown in Table 2.
Table 2.
Effect of varying k in environmental perception attention on model performance.
From the overall perspective of Table 2, after increasing k, mAP is effectively improved within a certain range, which shows that appropriately increasing the convolution kernel size can help the model detect the target better. However, when k continues to increase (such as from 17 to 23), the performance does not continue to improve, and even drops in some scenarios. We believe that this is because a larger k expands the receptive field, but at the same time may introduce more irrelevant background information, causing the model to confuse the target and the background, increasing false detections.
To analyze the above phenomenon, we calculated and quantified the high contribution area ratio r of the minimum rectangle under different contribution score thresholds t by the method in RepLKNet [12] to show the effective receptive field (ERF) size of the model. The results are shown in Table 3. Specifically, the percentage t of the pixel contribution score in the model output feature map is provided by the rectangular area located in the center, and the ratio of this area to the overall area is r, which shows the ratio of the contribution of pixels in the central area of different sizes to the overall area. Under the same score threshold t, the larger the area ratio r, the more uniform the distribution of high contribution pixels and the larger the effective receptive field. The smaller r indicates that the high contribution pixels are concentrated around the central area, while the contribution of the external points is very low, indicating that the ERF is limited.
Table 3.
This table shows the impact of different k values in environmental perception attention on the effective receptive field of the backbone network of the baseline model through the high contribution area ratio r.
In Table 3, under different experimental hyperparameter settings of k, the high contribution area (ERF) covering a specific threshold t does not continue to increase, especially when k is larger; in fact, the growth of the receptive field slows down or stagnates. This shows that continuously increasing the size of the convolution kernel does not linearly increase the network’s focus area on the target. Too large a convolution kernel may even increase the area ratio of the low contribution area, thereby reducing the detection accuracy. Therefore, choosing an appropriate one-dimensional convolution kernel size is important for environmental perception attention. A reasonable convolution kernel size can help the model better capture the contextual information around the target, thereby improving the robustness of the object detection model.
Experiments show that our environmental perception attention can effectively improve the receptive field of the baseline model. At the same time, by properly adjusting the size of the one-dimensional convolution kernel, it can help the model further obtain long-range information and obtain a larger effective receptive field. Previous work has improved the receptive field by deepening the network and using large-scale convolution kernels to extract features, but this will bring problems such as network optimization and an excessive number of parameters and calculations. Environmental perception attention provides another simple and lightweight way to improve the effective receptive field and avoid these side effects.
4.3.2. Three-Scale Fusion Module (TSFM)
In the object detection algorithm based on deep learning, the backbone network usually uses down-sampling five times to gradually extract the high-level features of the image (multi-scale feature maps P1~P5), and selects the feature maps of different scales (P3~P5) in the last three layers to be sent to the neck network for fusion. In order to explore the impact of the combination of three-scale feature maps on the model, we selected a combination of feature maps of different scales. The experimental results are shown in Table 4.
Table 4.
Ablation experiments of different layer fusion configurations of the three-scale fusion module.
We first fused the feature maps of the last three layers (P3~P5) through TSFM and sent them into the neck network. Compared with the baseline model, the improvement was very limited. We analyzed that the baseline model itself used the features of the last three layers of maps and sent them into the neck network for fusion, which would cause information redundancy and duplication. However, the baseline model simply fuses feature maps of adjacent scales multiple times in the neck network, while TSFM can fuse three-scale feature maps at the same time, providing a richer multi-scale feature representation. Then, the P2~P4 layer is fused into the network through TSFM, which effectively improves the model performance. This method introduces the fusion of the lower-level P2 feature map, which can utilize the position information and spatial detailed information in it to help the model better understand the local structure in the image.
We applied the above two strategies to the baseline model at the same time. Compared with the TSFM (P2~P4) method, although this method obtains a higher mAP@0.5, it does not increase the mAP@0.5:0.95 indicator, which has stricter requirements on positioning accuracy. This further shows that the information in the low-level feature map helps to improve the positioning accuracy and predict the boundary of the target more accurately.
4.3.3. Ablation Experiment
Next, we conducted ablation experiments to study the impact of our proposed method on the performance of the algorithm model. We applied different methods to the baseline model (“√” indicates addition), as shown in Table 5.
Table 5.
Ablation experiment results.
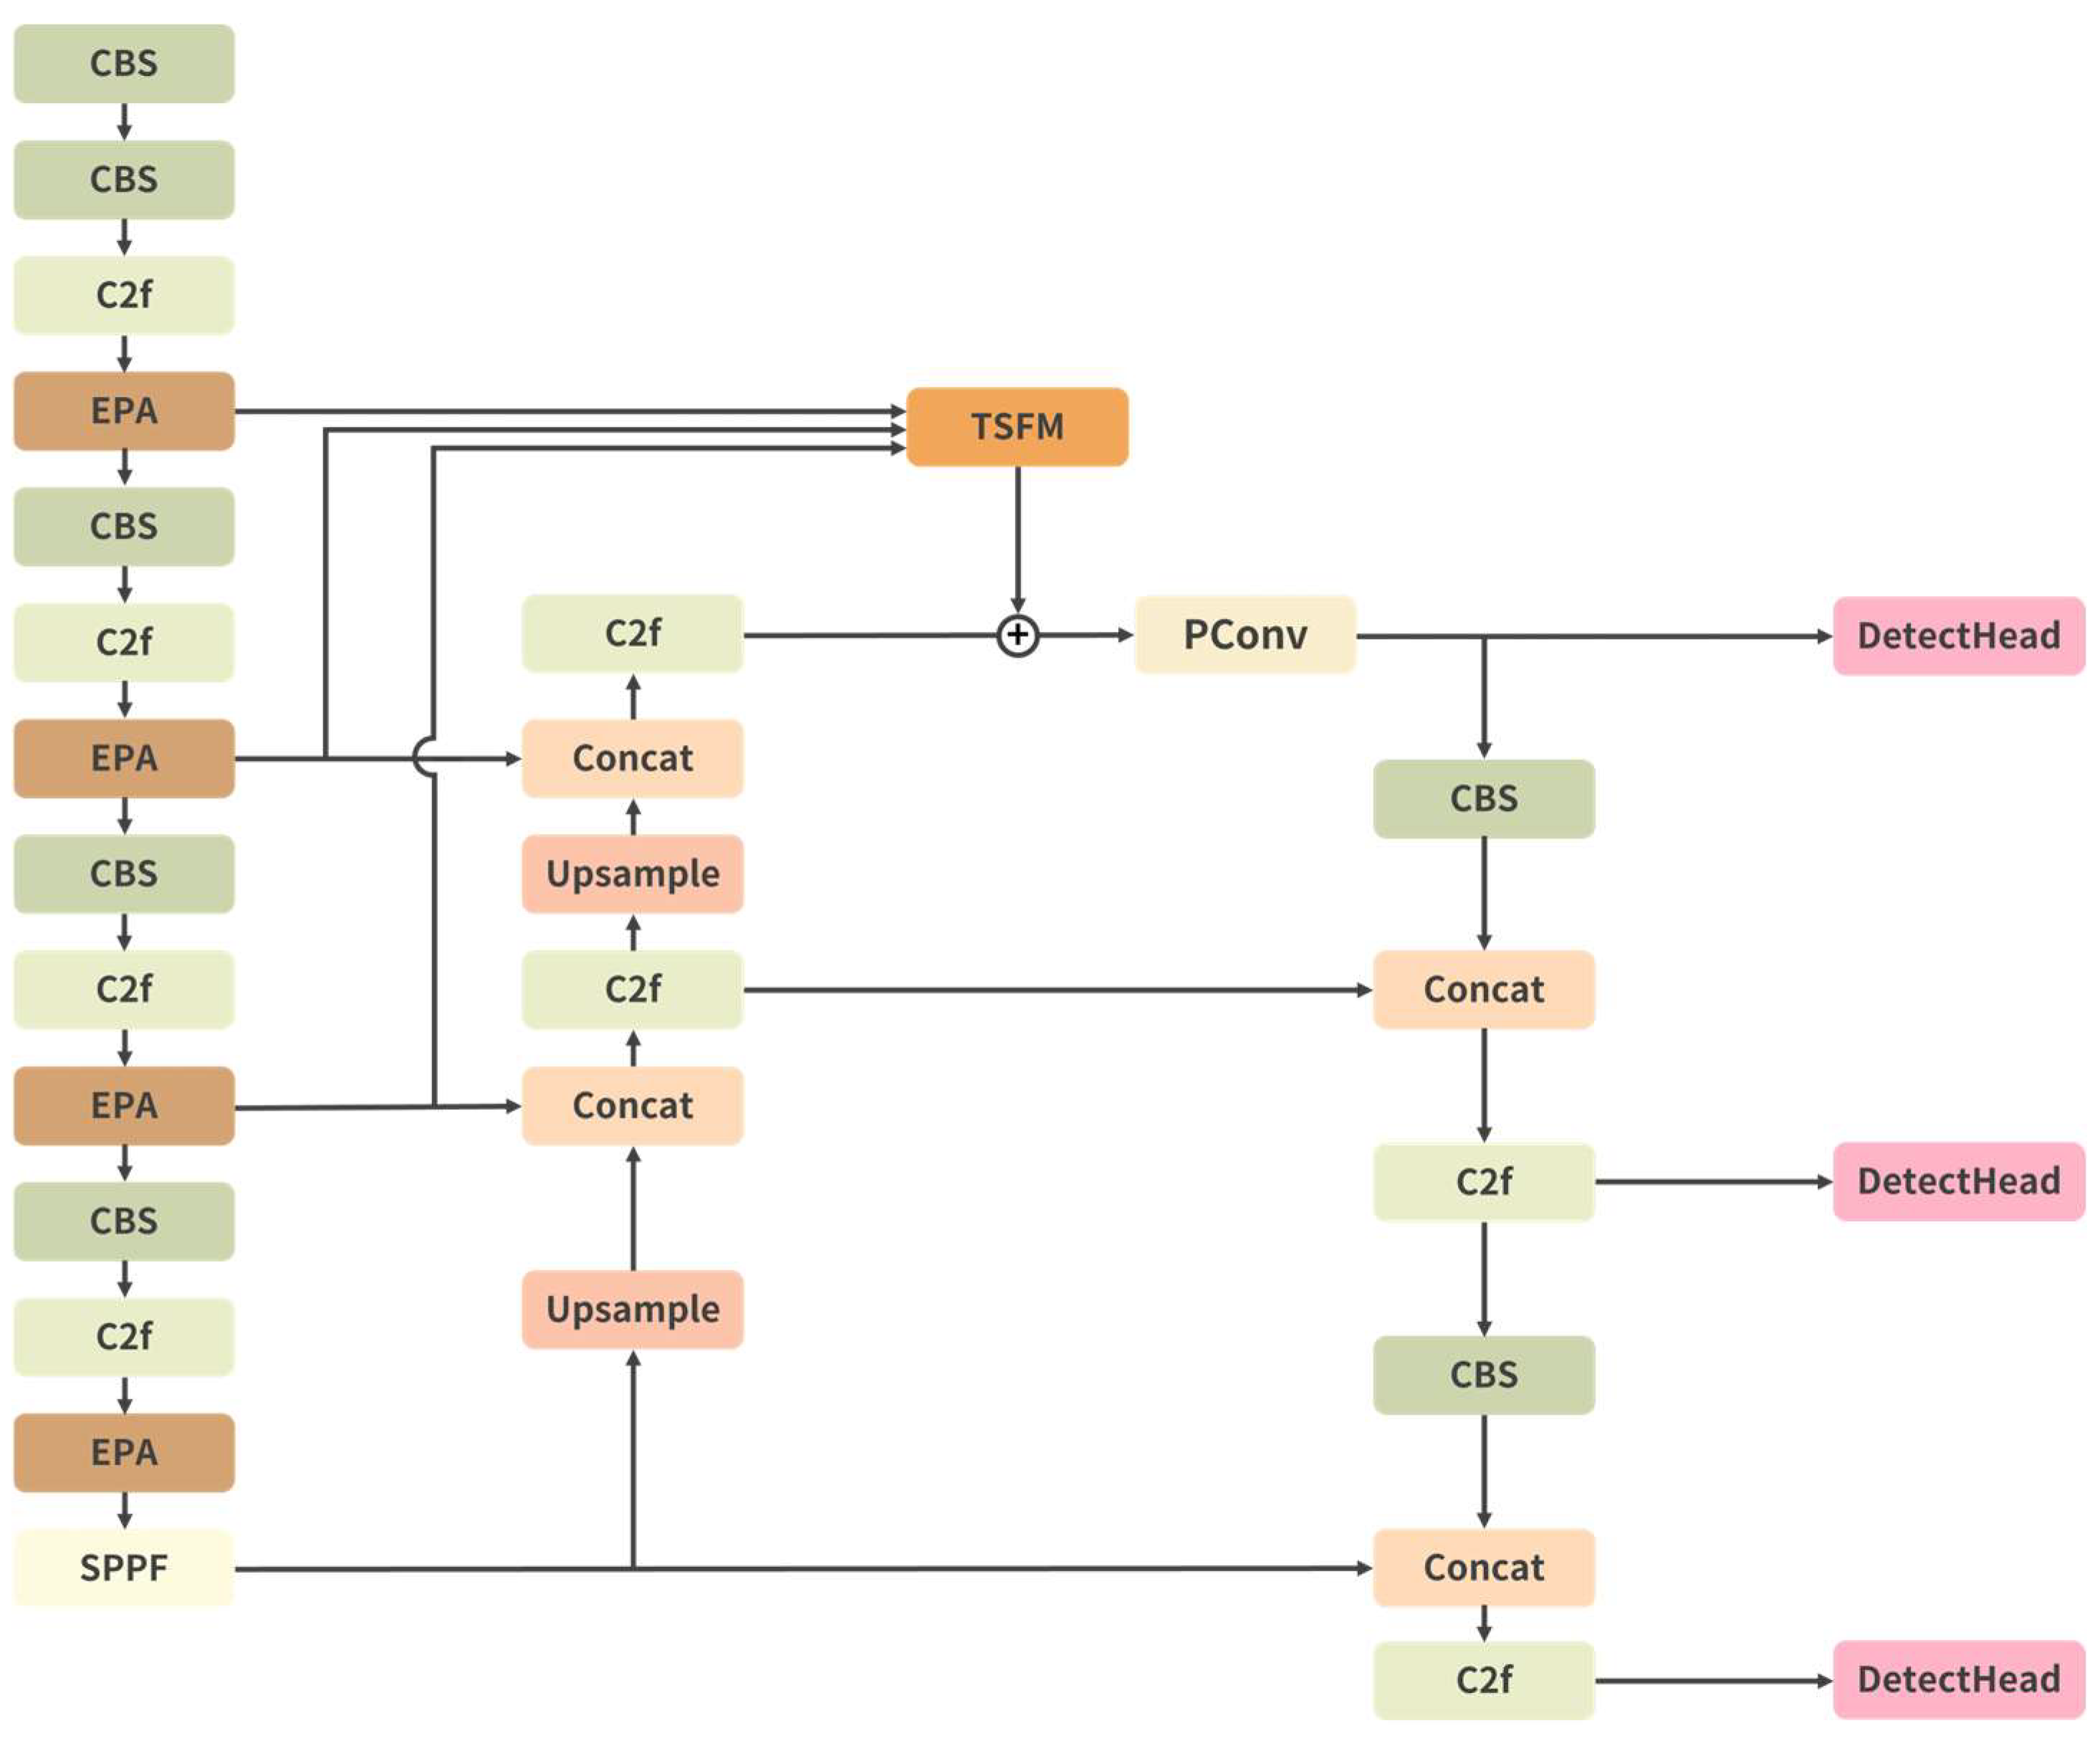
We applied our method to the YOLOv8 model, as shown in Figure 4.

Figure 4.
Applying our method to the YOLOv8.
We inserted environmental perception attention (EPA) after each C2f module in the backbone network. Compared with the baseline model, the introduction of long-range spatial information through EPA can effectively enhance the detection ability of the model. After five down-sampling operations in the backbone network, feature maps P1 to P5 were generated. We integrated P2, P3, and P4 feature maps into the neck network after TDSF fusion. The experimental results demonstrate an improvement in performance compared to the baseline model, indicating that incorporating low-level feature maps (P2) and aggregating multi-scale feature information effectively enhances the model’s performance. Finally, EPA and TSFM were simultaneously applied to the benchmark model, enabling the model to better adapt to diverse traffic scenarios and environmental changes, further boosting its performance. This suggested that the two methods exhibited strong coupling and a certain degree of synergy.
Although our method can effectively improve model performance, the amount of computation and number of parameters also increases, and the detection speed decreases (Nvidia A800 test FPS). Specifically, the number of parameters and the amount of computation (FLOPs) increased by 0.48% and 4.88%, respectively, and the FPS decreased by 16.25%. In some practical application scenarios (such as mobile or embedded devices), the increased computational complexity may bring performance bottlenecks on some resource-constrained devices. To solve this problem, future research can try to reduce the amount of computation through methods such as model pruning [55] quantization, and distillation [56], while maintaining high accuracy and speed. The amount of computation of the model can also be further reduced through lightweight methods [39], or the model architecture can be adjusted according to the resource conditions of different hardware platforms, and the inference speed can be improved through hardware acceleration (such as GPU, TPU), so as to find the best balance between performance and resource requirements.
In addition, we conducted experiments on the KITTI dataset [57] in the field of autonomous driving to further explore the advantages of the proposed method. The experimental results are shown in Table 6. Compared with the baseline, our method is still effective on other datasets and effectively improves the detection performance.
Table 6.
Results of our method and baseline on KITTI dataset.
4.4. Visualization Experiment
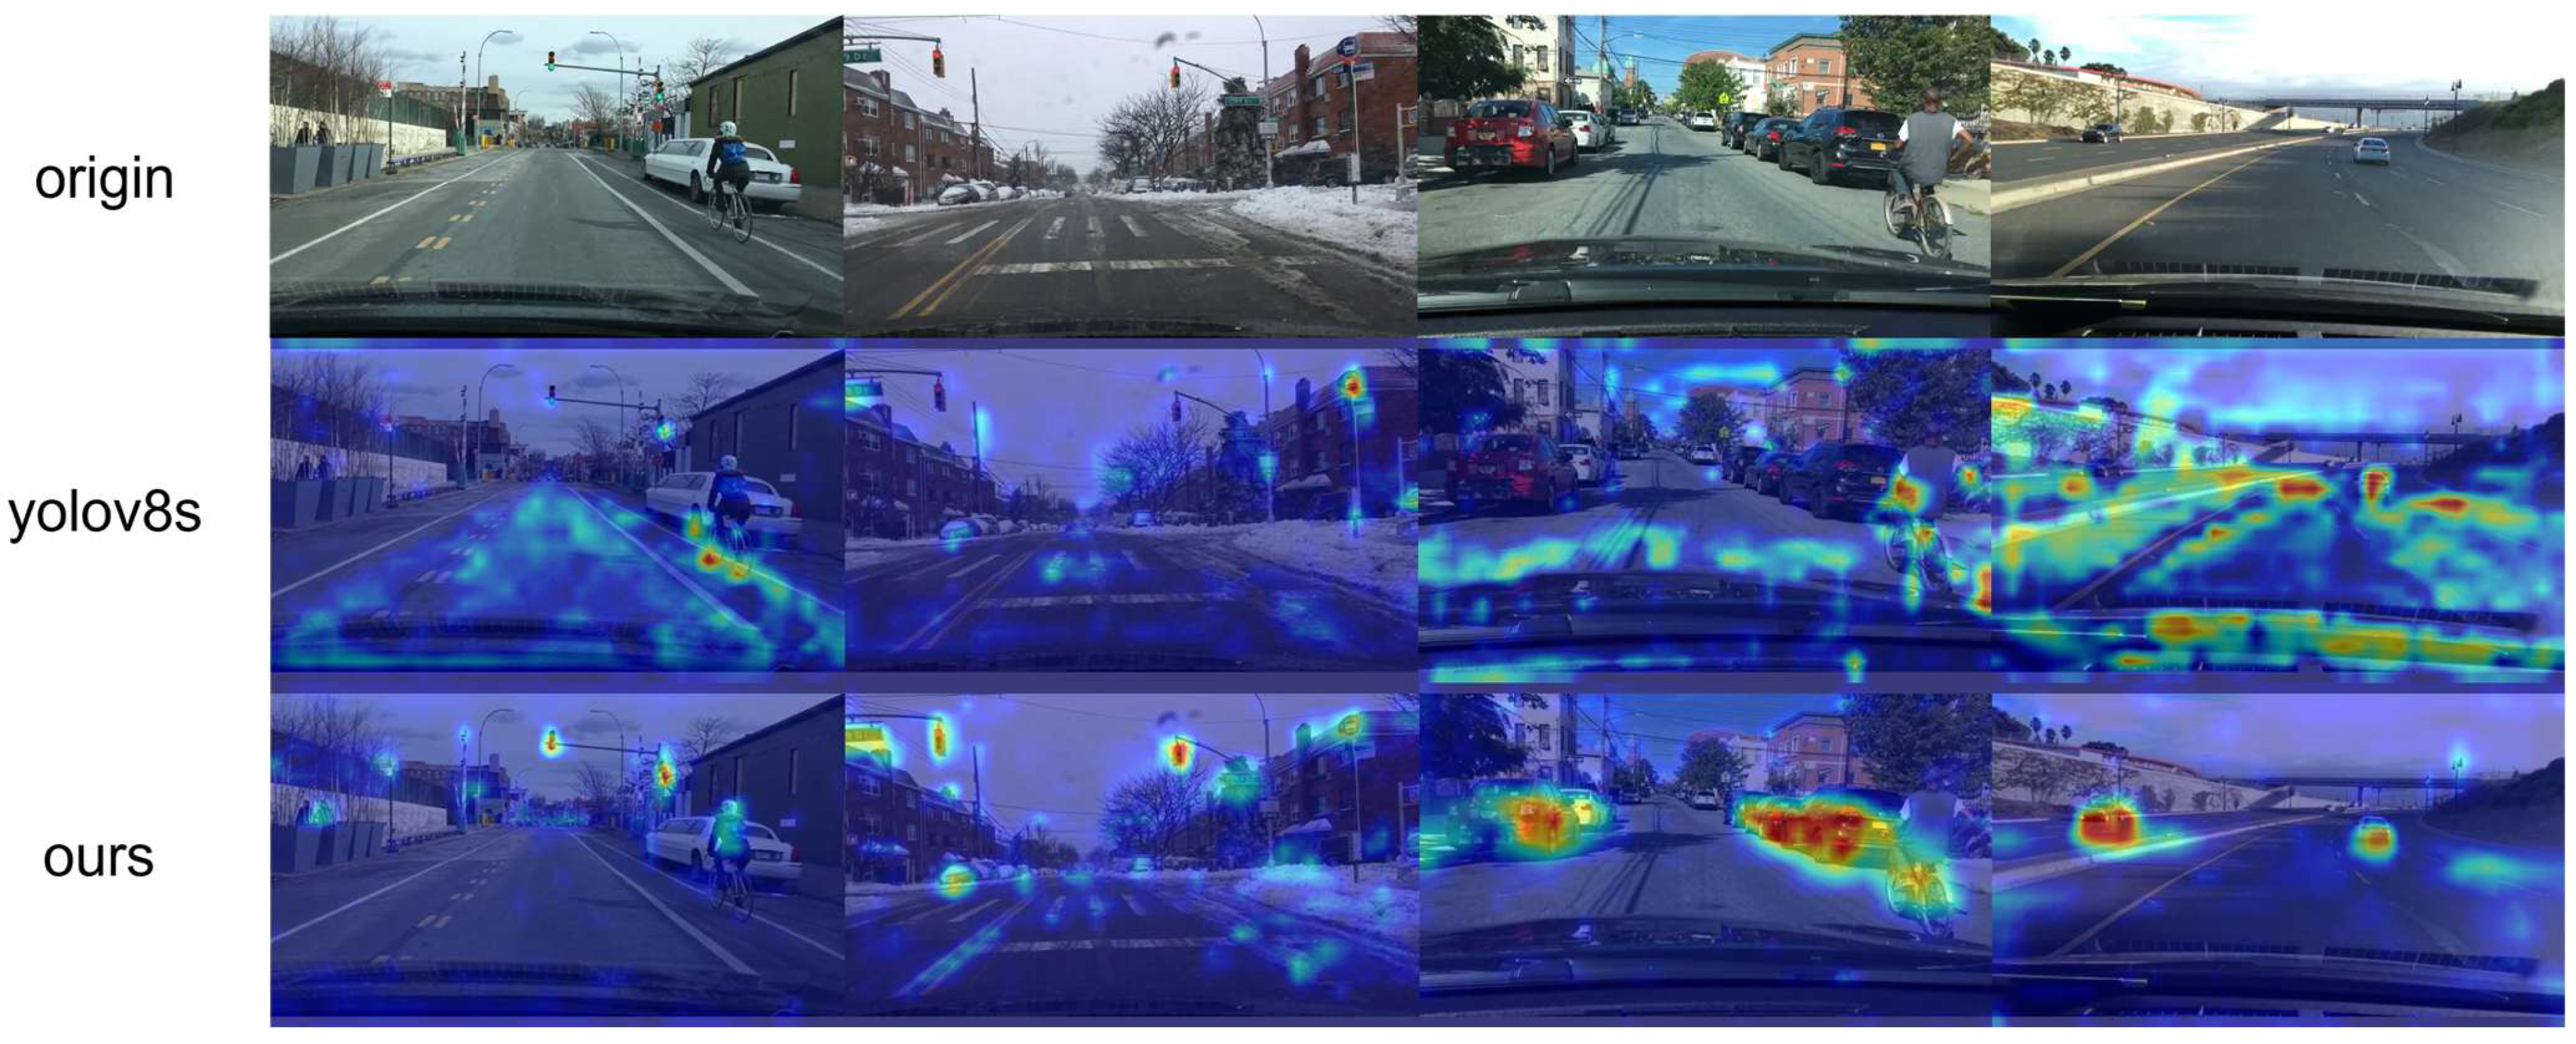
In this section, we aimed to visually demonstrate the impact of environmental perception attention (EPA) on the model’s attention mechanism. To achieve this, we utilized GradCAM [58] to generate a visual heat map for the output feature map of the backbone network to show the model’s attention area before and after the application of EPA, as shown in Figure 5. In the heat map, warm and cold tones are used to distinguish the contribution of position pixels to the prediction results. The warmer the color, the greater the contribution of the position to the final prediction result of the model, indicating more important position information and greater attention paid by the model. The colder the color, the opposite is true. As seen in Figure 5, the attention distribution of the baseline model was relatively scattered, and it also produced large responses to many unimportant areas. Compared with the baseline model that does not use EPA, EPA could effectively organize the model’s attention area, avoid distracting attention to useless locations, and significantly reduce the feature response to irrelevant areas. This shows that the EPA module we proposed could effectively guide the entire network model to focus more accurately on the area where the target to be detected is located.
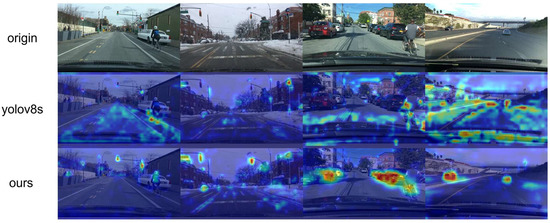
Figure 5.
Heatmap visualization results before and after adding environmental perception attention.
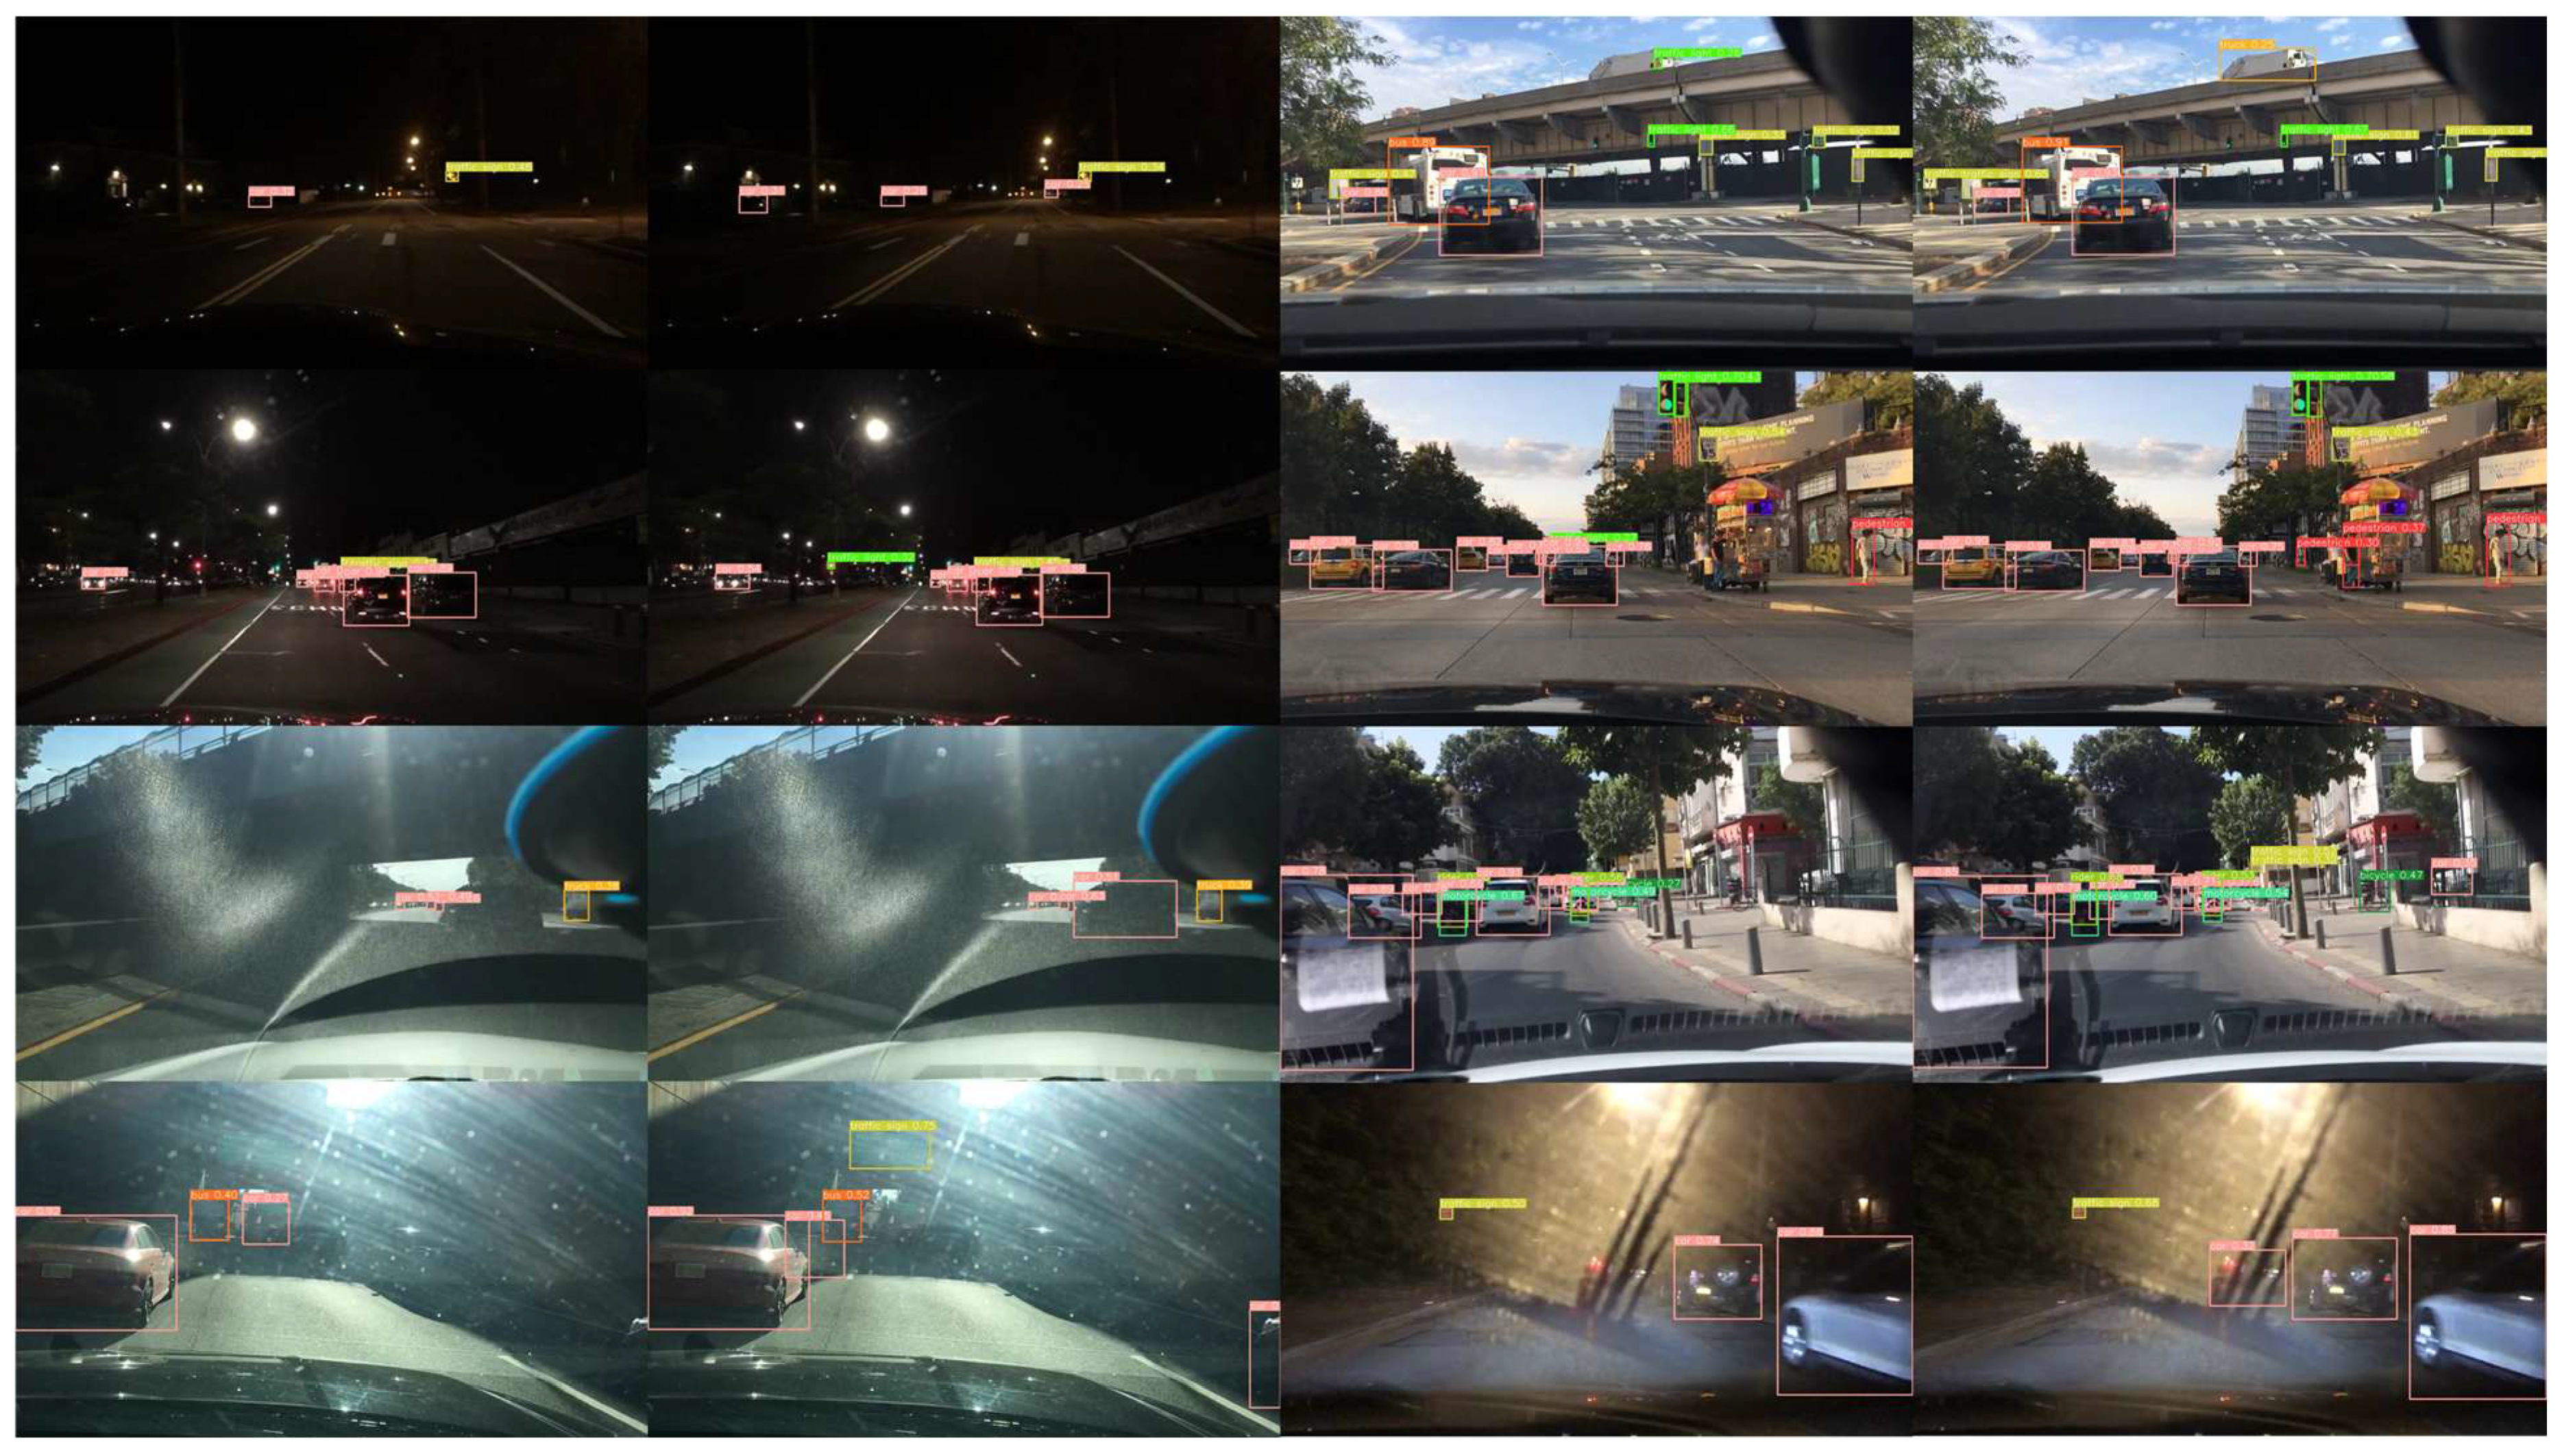
Next, we visualized the detection results of the baseline model (left) and the detection results after applying the proposed method (right). As shown in Figure 6, it can be seen that in different scenes affected by factors such as time and lighting, the baseline model had certain false detections and misdetections, while our method effectively improved the detection effect and effectively improved the adaptability and robustness of the model to diverse and complex backgrounds.
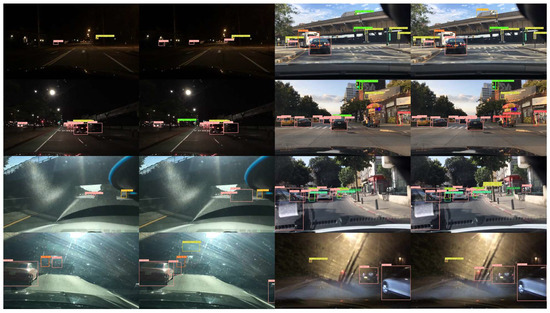
Figure 6.
Comparison of model detection results before and after using the proposed method.
5. Conclusions
In this paper, we propose environmental perception attention and multi-scale fusion modules for the task of object detection in complex traffic scenarios, and demonstrate the effectiveness of our approach in the experimental part. Environmental perception attention first captures long-range contextual relationships from the input feature map, and then learns weights from channel dependencies to selectively emphasize informative features and suppress less useful features. In the three-scale fusion module, we introduce low-level feature maps to help the model obtain detailed information such as edges and textures, and fully integrate them with other scale features to enhance the detection ability of objects of different scales. Experimental results show that our method can effectively improve the performance of the model on the autonomous driving road traffic dataset. In addition, the ablation experiment results also show that our method has a certain synergistic effect. Although our proposed method has a significant effect in improving model detection accuracy, its computational complexity and resource requirements have also increased, which may pose certain challenges in resource-constrained embedded devices or real-time processing scenarios. Therefore, future research should focus on optimizing the model structure, further reducing computational overhead, or using model compression, pruning, quantization, and other technologies to ensure that the inference speed is maintained efficiently while improving performance. In general, this study provides methods and ideas for improving the object detection accuracy of autonomous driving systems in complex traffic scenarios, and promotes the further application of object detection algorithms in the field of autonomous driving.
Author Contributions
Conceptualization, C.Y. and J.L.; methodology, J.L.; software, J.L. and H.W.; validation, C.Y., J.L. and H.W.; formal analysis, C.Y.; investigation, C.Y. and H.W.; resources, Q.Y.; data curation, J.L.; writing—original draft preparation, J.L.; writing—review and editing, C.Y.; visualization, H.W.; supervision, Q.Y.; project administration, Q.Y.; funding acquisition, Q.Y. All authors have read and agreed to the published version of the manuscript.
Funding
This research was funded by Tianjin Enterprise Science and Technology Commissioner Project, Technology Innovation Guidance Special Fund (Fund) grant number (24YDTPJC00410).
Institutional Review Board Statement
Not applicable.
Informed Consent Statement
Not applicable.
Data Availability Statement
The raw data supporting the conclusions of this article will be made available by the authors on request.
Conflicts of Interest
The authors declare no conflict of interest.
References
- Girshick, R.; Donahue, J.; Darrell, T.; Malik, J. Rich feature hierarchies for accurate object detection and semantic segmentation. In Proceedings of the IEEE Conference on Computer Vision and Pattern Recognition, Columbus, OH, USA, 24–28 June 2014; pp. 580–587. [Google Scholar]
- Girshick, R. Fast r-cnn. In Proceedings of the IEEE International Conference on Computer Vision, Santiago, Chile, 7–13 December 2015; pp. 1440–1448. [Google Scholar]
- Ren, S.; He, K.; Girshick, R.; Sun, J. Faster r-cnn: Towards real-time object detection with region proposal networks. Adv. Neural Inf. Process. Syst. 2015, 28, 91. [Google Scholar] [CrossRef] [PubMed]
- Redmon, J.; Divvala, S.; Girshick, R.; Farhadi, A. You only look once: Unified, real-time object detection. In Proceedings of the IEEE Conference on Computer Vision and Pattern Recognition, Las Vegas, NV, USA, 27–30 June 2016; pp. 779–788. [Google Scholar]
- Redmon, J.; Farhadi, A. YOLO9000: Better, faster, stronger. In Proceedings of the IEEE Conference on Computer Vision and Pattern Recognition, Honolulu, HI, USA, 21–26 July 2017; pp. 7263–7271. [Google Scholar]
- Redmon, J.; Farhadi, A. Yolov3: An incremental improvement. arXiv 2018, arXiv:1804.02767. [Google Scholar]
- Bochkovskiy, A.; Wang, C.Y.; Liao, H.Y.M. Yolov4: Optimal speed and accuracy of object detection. arXiv 2020, arXiv:2004.10934. [Google Scholar]
- Wang, C.Y.; Bochkovskiy, A.; Liao, H.Y.M. YOLOv7: Trainable bag-of-freebies sets new state-of-the-art for real-time object detectors. In Proceedings of the IEEE/CVF Conference on Computer Vision and Pattern Recognition, Vancouver, BC, Canada, 17–24 June 2023; pp. 7464–7475. [Google Scholar]
- Jocher, G.; Chaurasia, A.; Qiu, J. Ultralytics YOLO; Version 8.0.0; Ultralytics: UK, 2023; Available online: https://github.com/ultralytics/ultralytics (accessed on 1 March 2024).
- Carion, N.; Massa, F.; Synnaeve, G.; Usunier, N.; Kirillov, A.; Zagoruyko, S. End-to-end object detection with transformers. In Proceedings of the European Conference on Computer Vision, Glasgow, UK, 23–28 August 2020; Springer International Publishing: Cham, Switzerland, 2020; pp. 213–229. [Google Scholar]
- Zhao, Y.; Lv, W.; Xu, S.; Wei, J.; Wang, G.; Dang, Q.; Liu, Y.; Chen, J. DETRs Beat YOLOs on Real-time Object Detection. In Proceedings of the 2024 IEEE/CVF Conference on Computer Vision and Pattern Recognition (CVPR), Seattle, WA, USA, 16–22 June 2024; pp. 16965–16974. [Google Scholar]
- Ding, X.; Zhang, X.; Han, J.; Ding, G. Scaling up your kernels to 31 × 31: Revisiting large kernel design in cnns. In Proceedings of the IEEE/CVF Conference on Computer Vision and Pattern Recognition, New Orleans, LA, USA, 18–24 June 2022; pp. 11963–11975. [Google Scholar]
- Simonyan, K.; Zisserman, A. Very Deep Convolutional Networks for Large-Scale Image Recognition. arXiv 2014, arXiv:1409.1556. [Google Scholar] [CrossRef]
- He, K.; Zhang, X.; Ren, S.; Sun, J. Deep residual learning for image recognition. In Proceedings of the IEEE conference on computer vision and pattern recognition, Las Vegas, NV, USA, 27–30 June 2016; pp. 770–778. [Google Scholar]
- Dosovitskiy, A.; Beyer, L.; Kolesnikov, A.; Weissenborn, D.; Zhai, X.; Unterthiner, T.; Dehghani, M.; Minderer, M.; Heigold, G.; Gelly, S.; et al. An Image is Worth 16 × 16 Words: Transformers for Image Recognition at Scale. arXiv 2020, arXiv:2010.11929. [Google Scholar]
- Liu, Z.; Lin, Y.; Cao, Y.; Hu, H.; Wei, Y.; Zhang, Z.; Lin, S.; Guo, B. Swin transformer: Hierarchical vision transformer using shifted windows. In Proceedings of the IEEE/CVF International Conference on Computer Vision, Montreal, BC, Canada, 11–17 October 2021; pp. 10012–10022. [Google Scholar]
- Vaswani, A. Attention is all you need. Adv. Neural Inf. Process. Syst. 2017, 30. [Google Scholar] [CrossRef]
- Wang, X.; Girshick, R.; Gupta, A.; He, K. Non-local neural networks. In Proceedings of the IEEE Conference on Computer Vision and Pattern Recognition, Salt Lake City, UT, USA, 18–22 June 2018; pp. 7794–7803. [Google Scholar]
- Zhu, Z.; Xu, M.; Bai, S.; Huang, T.; Bai, X. Asymmetric non-local neural networks for semantic segmentation. In Proceedings of the IEEE/CVF International Conference on Computer Vision, Seoul, Republic of Korea, 27 October–2 November 2019; pp. 593–602. [Google Scholar]
- Lin, T.Y.; Dollár, P.; Girshick, R.; He, K.; Hariharan, B.; Belongie, S. Feature pyramid networks for object detection. In Proceedings of the IEEE Conference on Computer Vision and Pattern Recognition, Honolulu, HI, USA, 21–26 July 2017; pp. 2117–2125. [Google Scholar]
- Liu, S.; Qi, L.; Qin, H.; Shi, J.; Jia, J. Path aggregation network for instance segmentation. In Proceedings of the IEEE Conference on Computer Vision and Pattern Recognition, Salt Lake City, UT, USA, 18–22 June 2018; pp. 8759–8768. [Google Scholar]
- Wang, F.; Jiang, M.; Qian, C.; Yang, S.; Li, C.; Zhang, H.; Wang, X.; Tang, X. Residual attention network for image classification. In Proceedings of the IEEE Conference on Computer Vision and Pattern Recognition, Honolulu, HI, USA, 21–26 July 2017; pp. 3156–3164. [Google Scholar]
- Hu, J.; Shen, L.; Sun, G. Squeeze-and-excitation networks. In Proceedings of the IEEE Conference on Computer Vision and Pattern Recognition, Salt Lake City, UT, USA, 18–22 June 2018; pp. 7132–7141. [Google Scholar]
- Woo, S.; Park, J.; Lee, J.Y.; Kweon, I.S. Cbam: Convolutional block attention module. In Proceedings of the European Conference on Computer Vision (ECCV), Munich, Germany, 8–14 September 2018; pp. 3–19. [Google Scholar]
- Park, J. Bam: Bottleneck attention module. arXiv 2018, arXiv:1807.06514. [Google Scholar]
- Li, X.; Wang, W.; Hu, X.; Yang, J. Selective kernel networks. In Proceedings of the IEEE/CVF Conference On computer Vision and Pattern Recognition, Long Beach, CA, USA, 15–20 June 2019; pp. 510–519. [Google Scholar]
- Cao, Y.; Xu, J.; Lin, S.; Wei, F.; Hu, H. Gcnet: Non-local networks meet squeeze-excitation networks and beyond. In Proceedings of the IEEE/CVF International Conference on Computer Vision Workshops, Seoul, Republic of Korea, 27–28 October 2019. [Google Scholar]
- Fu, J.; Liu, J.; Tian, H.; Li, Y.; Bao, Y.; Fang, Z.; Lu, H. Dual attention network for scene segmentation. In Proceedings of the IEEE/CVF Conference On computer Vision and Pattern Recognition, Long Beach, CA, USA, 15–20 June 2019; pp. 3146–3154. [Google Scholar]
- Hou, Q.; Zhang, L.; Cheng, M.M.; Feng, J. Strip pooling: Rethinking spatial pooling for scene parsing. In Proceedings of the IEEE/CVF Conference on Computer Vision and Pattern Recognition, Seattle, WA, USA, 14–19 June 2020; pp. 4003–4012. [Google Scholar]
- Hou, Q.; Zhou, D.; Feng, J. Coordinate attention for efficient mobile network design. In Proceedings of the IEEE/CVF Conference on Computer Vision and Pattern Recognition, Nashville, TN, USA, 19–25 June 2021; pp. 13713–13722. [Google Scholar]
- Xu, W.; Wan, Y. ELA: Efficient Local Attention for Deep Convolutional Neural Networks. arXiv 2024, arXiv:2403.01123. [Google Scholar]
- Wang, X.; Wang, S.; Cao, J.; Wang, Y. Data-driven based tiny-YOLOv3 method for front vehicle detection inducing SPP-net. IEEE Access 2020, 8, 110227–110236. [Google Scholar] [CrossRef]
- Wu, T.H.; Wang, T.W.; Liu, Y.Q. Real-time vehicle and distance detection based on improved YOLOv5 network. In Proceedings of the 2021 3rd World Symposium on Artificial Intelligence (WSAI), Online, 18–20 June 2021; pp. 24–28. [Google Scholar]
- Carrasco, D.P.; Rashwan, H.A.; García, M.Á.; Puig, D. T-YOLO: Tiny vehicle detection based on YOLO and multi-scale convolutional neural networks. IEEE Access 2021, 11, 22430–22440. [Google Scholar] [CrossRef]
- Guo, X.; Liu, Q.; Qin, Z.; Xu, Y. Target Detection of Forward Vehicle Based on Improved SSD. In Proceedings of the 2021 IEEE 6th International Conference on Cloud Computing and Big Data Analytics (ICCCBDA), Chengdu, China, 24–26 April 2021. [Google Scholar]
- Mao, Q.C.; Sun, H.M.; Zuo, L.Q.; Jia, R.S. Finding every car: A traffic surveillance multi-scale vehicle object detection method. Appl. Intell. 2020, 50, 3125–3136. [Google Scholar] [CrossRef]
- Alsanabani, A.A.; Saeed, S.A.; Al-Mkhlafi, M.; Albishari, M. A low cost and real time vehicle detection using enhanced YOLOv4-tiny. In Proceedings of the 2021 IEEE International Conference on Artificial Intelligence and Computer Applications (ICAICA), Dalian, China, 28–30 June 2021; pp. 372–377. [Google Scholar]
- Benjumea, A.; Teeti, I.; Cuzzolin, F.; Bradley, A. YOLO-Z: Improving small object detection in YOLOv5 for autonomous vehicles. arXiv 2021, arXiv:2112.11798. [Google Scholar]
- Bie, M.; Liu, Y.; Li, G.; Hong, J.; Li, J. Real-time vehicle detection algorithm based on a lightweight You-Only-Look-Once (YOLOv5n-L) approach. Expert Syst. Appl. 2023, 213, 119108. [Google Scholar] [CrossRef]
- Ghosh, R. On-road vehicle detection in varying weather conditions using faster R-CNN with several region proposal networks. Multimed. Tools Appl. 2021, 80, 25985–25999. [Google Scholar] [CrossRef]
- Zhao, M.; Zhong, Y.; Sun, D.; Chen, Y. Accurate and efficient vehicle detection framework based on SSD algorithm. IET Image Process. 2021, 15, 3094–3104. [Google Scholar] [CrossRef]
- Zhao, H.; Zhang, S.; Peng, X.; Lu, Z.; Li, G. Improved object detection method for autonomous driving based on DETR. Front. Neurorobot. 2025, 18, 1484276. [Google Scholar] [CrossRef]
- Tang, Y.; Han, K.; Guo, J.; Xu, C.; Xu, C.; Wang, Y. GhostNetv2: Enhance cheap operation with long-range attention. Adv. Neural Inf. Process. Syst. 2022, 35, 9969–9982. [Google Scholar]
- Guo, M.H.; Lu, C.Z.; Liu, Z.N.; Cheng, M.M.; Hu, S.M. Visual attention network. Comput. Vis. Media 2023, 9, 733–752. [Google Scholar] [CrossRef]
- Lau, K.W.; Po, L.M.; Rehman, Y.A.U. Large separable kernel attention: Rethinking the large kernel attention design in cnn. Expert Syst. Appl. 2024, 236, 121352. [Google Scholar] [CrossRef]
- Yu, F. Multi-scale context aggregation by dilated convolutions. arXiv 2015, arXiv:1511.07122. [Google Scholar]
- Wu, Y.; He, K. Group normalization. In Proceedings of the European Conference on Computer Vision (ECCV), Munich, Germany, 8–14 September 2018; pp. 3–19. [Google Scholar]
- Gao, Z.; Xie, J.; Wang, Q.; Li, P. Global Second-Order Pooling Convolutional Networks. In Proceedings of the 2019 IEEE/CVF Conference on Computer Vision and Pattern Recognition (CVPR), Long Beach, CA, USA, 16–20 June 2019. [Google Scholar]
- Lin, T.Y.; RoyChowdhury, A.; Maji, S. Bilinear CNN models for fine-grained visual recognition. In Proceedings of the IEEE International Conference on Computer Vision, Santiago, Chile, 7–13 December 2015; pp. 1449–1457. [Google Scholar]
- Wang, Q.; Wu, B.; Zhu, P.; Li, P.; Zuo, W.; Hu, Q. ECA-Net: Efficient channel attention for deep convolutional neural networks. In Proceedings of the IEEE/CVF Conference on Computer Vision and Pattern Recognition, Seattle, WA, USA, 14–19 June 2020; pp. 11534–11542. [Google Scholar]
- Sunkara, R.; Luo, T. No more strided convolutions or pooling: A new CNN building block for low-resolution images and small objects. In Proceedings of the Joint European Conference on Machine Learning and Knowledge Discovery in Databases, Grenoble, France, 19–23 September 2022; Springer Nature: Cham, Switzerland, 2022; pp. 443–459. [Google Scholar]
- Kang, M.; Ting, C.M.; Ting, F.F.; Phan, R.C.W. ASF-YOLO: A novel YOLO model with attentional scale sequence fusion for cell instance segmentation. Image Vis. Comput. 2024, 147, 105057. [Google Scholar] [CrossRef]
- Yu, F.; Chen, H.; Wang, X.; Xian, W.; Chen, Y.; Liu, F.; Madhavan, V.; Darrell, T. Bdd100k: A diverse driving dataset for heterogeneous multitask learning. In Proceedings of the IEEE/CVF Conference on Computer Vision and Pattern Recognition, Seattle, WA, USA, 14–19 June 2020; pp. 2636–2645. [Google Scholar]
- Luo, W.; Li, Y.; Urtasun, R.; Zemel, R. Understanding the effective receptive field in deep convolutional neural networks. Adv. Neural Inf. Process. Syst. 2016, 29, 4898–4906. [Google Scholar]
- Im Choi, J.; Tian, Q. Visual-saliency-guided channel pruning for deep visual detectors in autonomous driving. In Proceedings of the 2023 IEEE Intelligent Vehicles Symposium (IV), Anchorage, AK, USA, 4–7 June 2023; pp. 1–6. [Google Scholar]
- Lan, Q.; Tian, Q. Gradient-guided knowledge distillation for object detectors. In Proceedings of the IEEE/CVF Winter Conference on Applications of Computer Vision, Waikoloa, HI, USA, 1–6 January 2024; pp. 424–433. [Google Scholar]
- Geiger, A.; Lenz, P.; Stiller, C.; Urtasun, R. Vision meets robotics: The kitti dataset. Int. J. Robot. Res. 2013, 32, 1231–1237. [Google Scholar] [CrossRef]
- Selvaraju, R.R.; Cogswell, M.; Das, A.; Vedantam, R.; Parikh, D.; Batra, D. Grad-cam: Visual explanations from deep networks via gradient-based localization. In Proceedings of the IEEE International Conference on Computer Vision, Venice, Italy, 22–29 October 2017; pp. 618–626. [Google Scholar]

Disclaimer/Publisher’s Note: The statements, opinions and data contained in all publications are solely those of the individual author(s) and contributor(s) and not of MDPI and/or the editor(s). MDPI and/or the editor(s) disclaim responsibility for any injury to people or property resulting from any ideas, methods, instructions or products referred to in the content. |
© 2025 by the authors. Licensee MDPI, Basel, Switzerland. This article is an open access article distributed under the terms and conditions of the Creative Commons Attribution (CC BY) license (https://creativecommons.org/licenses/by/4.0/).