Article

Advanced Brain Tumor Segmentation Using SAM2-UNet

by
Rohit Viswakarma Pidishetti
,
Maaz Amjad
and
Victor S. Sheng
*
Department of Computer Science, Texas Tech University, Lubbock, TX 79409, USA
*
Author to whom correspondence should be addressed.
Appl. Sci. 2025, 15(6), 3267; https://doi.org/10.3390/app15063267
Submission received: 13 February 2025 / Revised: 5 March 2025 / Accepted: 10 March 2025 / Published: 17 March 2025
(This article belongs to the Special Issue Artificial Intelligence Techniques for Medical Data Analytics)

Abstract

:
Image segmentation is one of the key factors in diagnosing glioma patients with brain tumors. It helps doctors identify the types of tumor that a patient is carrying and will lead to a prognosis that will help save the lives of patients. The analysis of medical images is a specialized domain in computer vision and image processing. This process extracts meaningful information from medical images that helps in treatment planning and monitoring the condition of patients. Deep learning models like CNN have shown promising results in image segmentation by identifying complex patterns in the image data. These methods have also shown great results in tumor segmentation and the identification of anomalies, which assist health care professionals in treatment planning. Despite advancements made in the domain of deep learning for medical image segmentation, the precise segmentation of tumors remains challenging because of the complex structures of tumors across patients. Existing models, such as traditional U-Net- and SAM-based architectures, either lack efficiency in handling class-specific segmentation or require extensive computational resources. This study aims to bridge this gap by proposing Segment Anything Model 2-UNetwork, a hybrid model that leverages the strengths of both architectures to improve segmentation accuracy and consumes less computational resources by maintaining efficiency. The proposed model possesses the ability to perform explicitly well on scarce data, and we trained this model on the Brain Tumor Segmentation Challenge 2020 (BraTS) dataset. This architecture is inspired by U-Networks that are based on the encoder and decoder architecture. The Hiera pre-trained model is set as a backbone to this architecture to capture multi-scale features. Adapters are embedded into the encoder to achieve parameter-efficient fine-tuning. The dataset contains four channels of MRI scans of 369 glioma patients as T1, T1ce, T2, and T2-flair and a segmentation mask for each patient consisting of non-tumor (NT), necrotic and non-enhancing tumor (NCR/NET), and peritumoral edema or GD-enhancing tumor (ET) as the ground-truth value. These experiments yielded good segmentation performance and achieved balanced performance based on the metrics discussed next in this paragraph for each tumor region. Our experiments yielded the following results with minimal hardware resources, i.e., 16 GB RAM with 30 epochs: a mean Dice score (mDice) of 0.771, a mean Intersection over Union (mIoU) of 0.569, an S α score of 0.692, a weighted F-beta score ( F β w ) of 0.267, a F-beta score ( F β ) of 0.261, an E ϕ score of 0.857, and a Mean Absolute Error (MAE) of 0.04 on the BraTS 2020 dataset.

1. Introduction

Image segmentation is very crucial in the medical science industry, as the accurate and detailed interpretation of data is very important for diagnosis, treatment planning, and monitoring patients’ condition, as discussed in [1]. Through segmentation, health care professionals can understand the structure of organs, tissues, or any anomalies if present; this prior analysis would help them to plan the medication needed for the patient and to diagnose them [2]. This segmentation ability is very crucial in fields like neurology, where the precise identification of tumor boundaries is needed to assess the growth of the tumor and the adverse effects of the tumor. The most common type of tumor that can be noted in adults are gliomas; these exhibit aggression and difficult prognosis [3,4]. Gliomas are brain tumors that cause a variety of adverse effects, including headaches, seizures, vision problems, and personality changes that can cause complete memory loss. In some severe cases, gliomas can cause death by putting pressure on the brain, which can damage brain tissue and impair brain function. Gliomas can also cause life-threatening complications like brain hemorrhage, brain herniation, and hydrocephalus; thus, detection at early stages can increase the chances of the patient’s recovery after treatment. Over the last decade, we have witnessed substantial development in medical imaging technologies, and they are now becoming an integral part of diagnosis and treatment processes.
Magnetic resonance imaging (MRI) is required to asses the heterogeneity of the tumor; these MRI scans include T1 (T1-weighted; this shows the structure and composition of the brain tissue), T1ce (T1 enhanced with gadolinium agent; this improves the visibility of abnormalities or anomalies in the brain tissue [5]), T2 (T2-weighted; this highlights the fluid content in the brain tissue [6]), T2-FLAIR (fluid-attenuated inversion recovery; this suppresses the fluid signals in order to make it very easy to identify lesions that are very hard to spot in all the other channels [6]), as shown in Figure 1. These MRI scans help in the identification of four different regions of tumors in the brain, the first of which is a necrotic tumor (NCR), which specifies regions of dead or dying cells within the tumor mass because of insufficient blood supply; these tumors progress very rapidly, making them hard to identify and treat [6]. A non-enhancing tumor (NET) is a type of lesion that is less aggressive in nature when compared to enhancing tumors; these are basically slow-growing tumors. The treatment for these type of tumors is challenging because of their potential to progress within the tissue. Peritumoral edema (ED) refers to the swelling of the tumor due to excess fluid content within the brain tissue. This occurs because of the disrupted blood–brain barrier integrity, which leads to excess pressure within the skull [6]. This edema appears as an area of hyper-intensity, which differentiates it from the tumor core. A GD-enhancing tumor (ET) signifies an aggressive high-grade tumor along with active growth and increased vascularity. These regions help in assessing the tumor boundaries and monitoring treatment. The most challenging part of this problem is the identification of the type of tumor because of their complex structures and the variability of their appearances across different patients [7]. To address all these problems, it is essential to develop a system that can accurately segment and detect tumors in the brain. In recent years, foundation models for vision tasks have proven to be robust and effective in various domains of image segmentation, which has led to researchers exploring their usage in medical science [8]. Thus, in this paper, we propose a deep learning model, SAM2-Unet, which is a fusion of two different models, SAM2 and U-Net, that yields better accuracy and efficiency when analyzing a medical image [9].
In summary, the key contributions of this study are the following:
  • We propose SAM2-UNet, a novel hybrid deep learning model that integrates Segment Anything Model 2 (SAM2) and U-Net to improve the precise segmentation of tumors.
  • The model effectively leverages the zero-shot segmentation capabilities of SAM2 along with U-Net’s fine-grained spatial localization to enhance segmentation performance.
  • We implement a parameter-efficient fine-tuning approach using Hiera pre-trained models, which helps in capturing multi-scale features with minimal computations.
  • The proposed model is evaluated on the BraTS 2020 dataset, demonstrating superior segmentation performance across multiple evaluation metrics, achieving an mDice of 0.771 and an mIoU of 0.569 with minimal hardware resources.
These contributions provide a significant advancement in medical image segmentation, offering a more efficient and accurate approach for brain tumor detection. The remainder of this paper is organized as follows:
The paper’s outline is as follows: Section 2 discusses the background. Section 3 presents the dataset used in this study and the methodologies that were applied to achieve data pre-processing. Section 4 introduces the proposed SAM2-UNet architecture. Section 5 reports the results that were achieved when performing the experiments on the proposed model. Section 6 and Section 7 provide a detailed discussion, studies, and conclusion.

2. Related Work

Deep learning technologies have been extensively applied to medical image segmentation problems, along with the U-Network architecture, which is specifically designed for biomedical image segmentation, introduced in 2015 by Olaf et al. [10]. U-Networks exhibit robust performance in precise pixel-level classification. The U-Network is a U-shaped architecture designed for tasks such as image segmentation. They consist of four main layers organized into distinct stages: downsampling, bottleneck, upsampling, and skip connections. The downsampling stage progressively reduces the spatial dimensions of the input feature maps while increasing the number of feature channels, enabling the extraction of high-level features. At the core of the architecture, the bottleneck acts as a transition point between the encoder (downsampling) and decoder (upsampling), serving as a bridge to preserve critical feature information. The upsampling stage then restores the spatial dimensions of the feature maps, recovering the resolution of the input data. To enhance the reconstruction process, skip connections link corresponding layers in the encoder and decoder, appending feature embeddings from the encoder to the outputs of the decoder. This structure ensures the retention of both high-level and fine-grained spatial details, making the U-Network highly effective for applications requiring precise feature localization and reconstruction [10]. U-Net has achieved notable success in the BraTS 2018 segmentation challenge. This network was originally developed for handling and segmenting 2-dimensional images. Later, it was adapted into 3D to be used for training on the BraTS 2018 dataset. Many researches have leveraged the U-Net model for segmentation in BraTS 2018 [11,12,13,14]. By looking at the development of the U-Net architecture, we can infer that the potential for developing this architecture is substantial. Its performance has also improved with other developments [15]. U-Net has also been deployed for image segmentation to predict the segmentation mask for every input image. This approach was very successful for all the segmentation tasks. The state of the art is nnU-Network, where the architecture and the hyperparameters are automatically chosen by each dataset [16]. In the realm of medical image segmentation, several advanced models have been developed to address the challenges posed by the complex anatomical structures of the brain. Among these, U-Net++, DeepLabV3, and Mask R-CNN have gained significant attention due to their advanced architectures, capabilities, and efficiency.

2.1. U-Net++

UNet++ is an advanced version of the classical UNet architecture, which is designed to reduce the semantic gap between the encoder and decoder feature maps through nested, dense skip pathways. This architecture enhances the ability of the model to capture fine-grained details and is effective for CT scans and polyp segmentation in colonoscopy videos. Yet, this model relies on annotated training data, which can be a limitation in scenarios with limited labeled datasets.

2.2. DeepLabV3

DeepLabV3 is a powerful CNN that is designed for semantic image segmentation. It employs atrous convolution and Atrous Spatial Pyramid Pooling (ASPP) to capture multi-scale contextual information, which is crucial in the segmentation of complex structures in medical images. The model’s performance can be affected by the loss of spatial information during downsampling, which may impact accuracy when segmenting small anatomical structures.

2.3. Mask R-CNN

Mask R-CNN is an advanced version of the Faster R-CNN framework, with the addition of a branch for predicting segmentation masks on each Region of Interest (RoI), enabling instance segmentations. This model heavily relies on region proposals, and the complexity of its architecture can lead to increased computational requirements and longer training times.

2.4. SAM2-UNet

The SAM2-UNet model integrates Segment Anything Model 2 (SAM2) as an encoder with a UNet decoder, combining the strengths of both architectures. SAM2’s zero-shot segmentation capability allows it to handle complex structures with minimal manual training, reducing the dependency on annotated training data and resulting in accurate and efficient segmentations.

3. Materials and Methods

This section details the dataset used to train the SAM2+Unet model, as well as the data pre-processing techniques applied to prepare the dataset for efficiently segmenting the brain tumor.

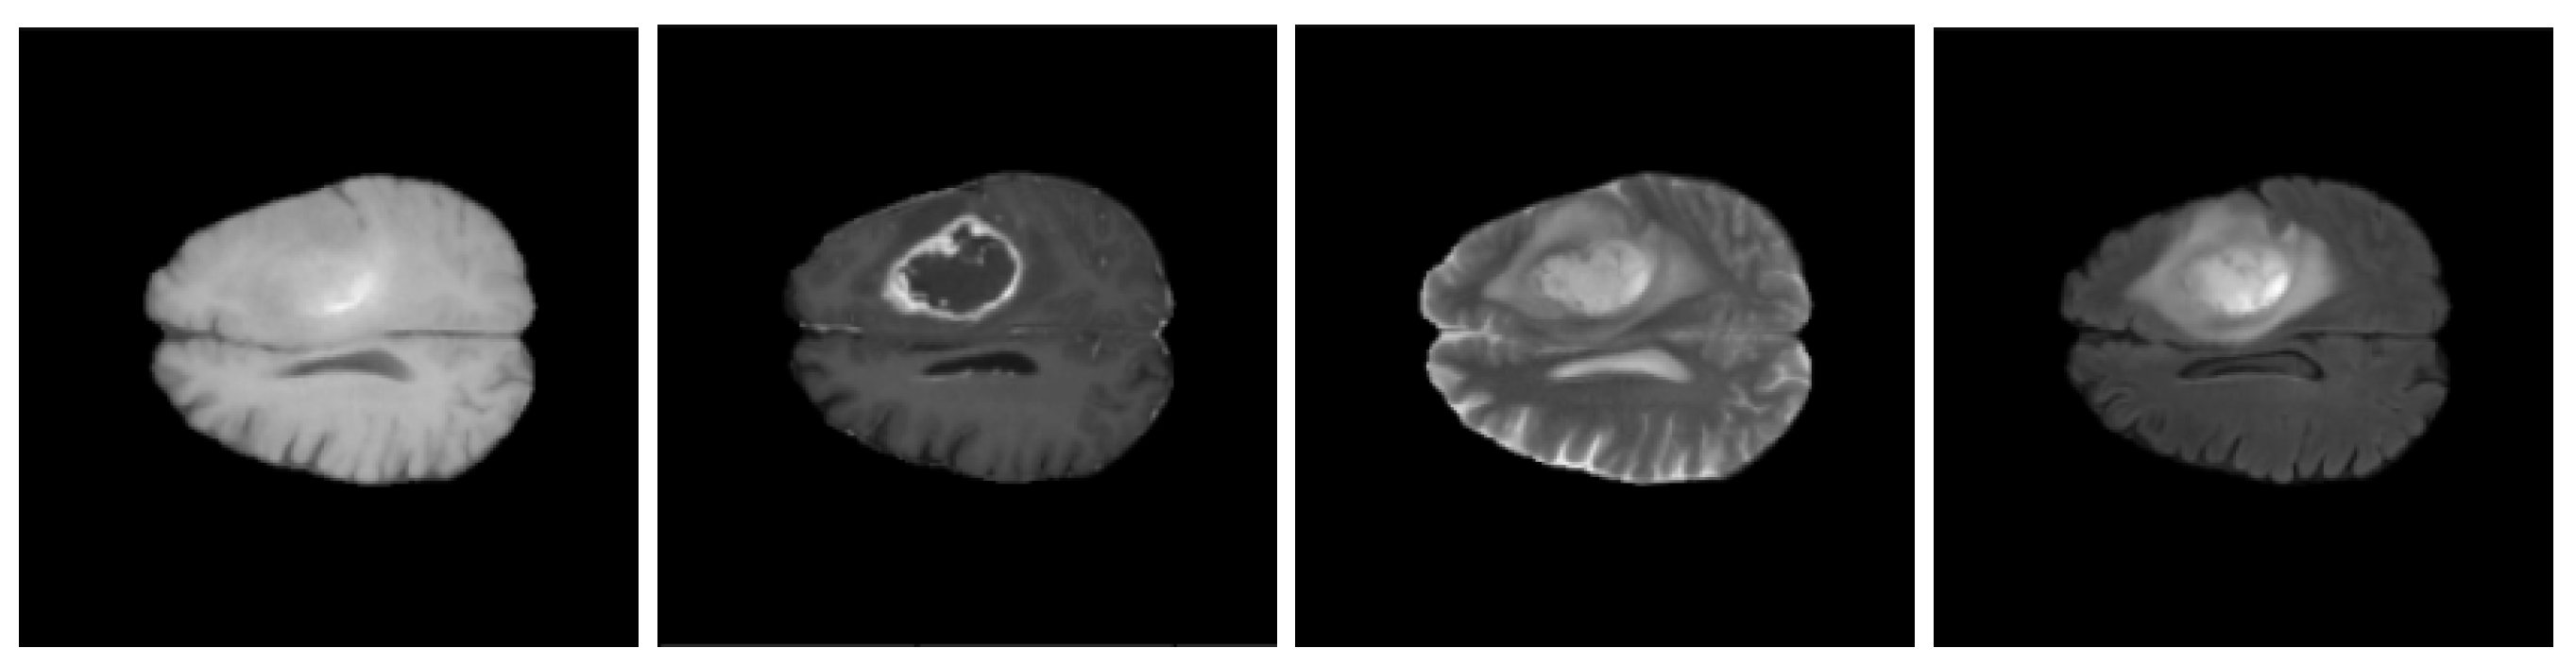
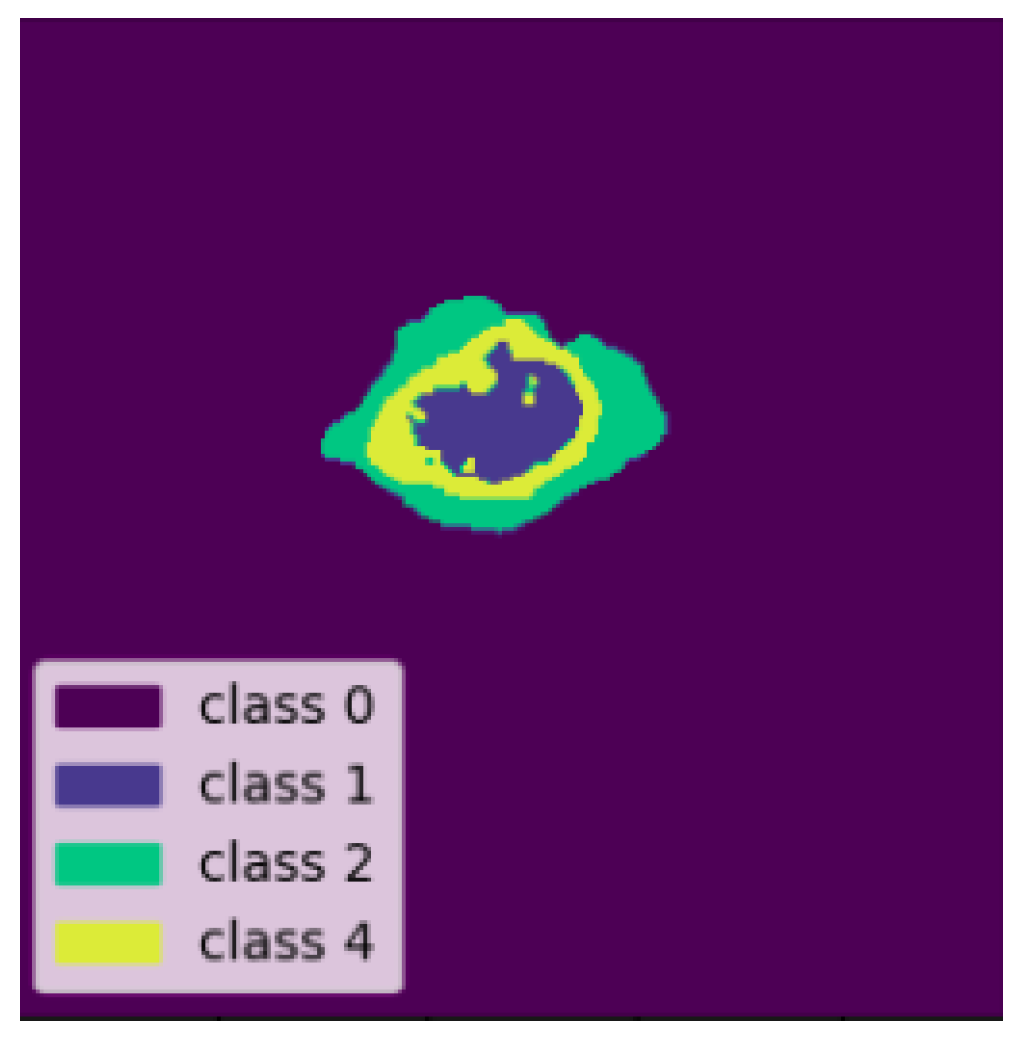
3.1. BraTS 2020 Dataset

The BraTS 2020 (Brain Tumor Segmentation 2020) [6] dataset is a benchmarking dataset in the biomedical domain, especially for brain tumor segmentation. The BraTS 2020 dataset contains multi-modal images of magnetic resonance imaging scans of 369 patients suffering from gliomas (tumor). The multi-modal data are a collection of four channels of modalities, the first of which is T1-weighted; this shows the structure and composition of the brain tissue and also helps to identify tumors, cysts, and abnormalities.
The other channels of modalities are T1ce (T1 enhanced with gadolinium agent; this improves the visibility of the abnormalities or anomalies in the brain tissue [5]), as shown in the Figure 2, T2 (T2-weighted; this highlights the fluid content in the brain tissue), and T2-FLAIR (fluid-attenuated inversion recovery; this suppresses the fluid signals in order to make it very easy to identify lesions that are very hard to spot in all the other channels), along with the segmentation mask, which shows the ground truth of the patient’s tumor as NT, specifying the segment as not a tumor, NCR/NET, which specifies a necrotic and non-enhancing tumor, ED, which specifies a peritumoral edema, or ET, which specifies a GD-enhancing tumor. BraTS 2020 is widely used to evaluate the performance of segmenting algorithms and in advanced research on automated tumor detection [12], and it is publicly available on kaggle and dedicated to advanced research on the automated segmentation of tumors.
The BraTS 2020 dataset is split into training and testing subsets according to the traditional ratio; that is, 80% of the dataset is used for training and 20% of the dataset is used for testing as shown in Figure 3, i.e., out of 369 magnetic resonance imaging scans, 295 scans are chosen for training and 74 scans are chosen for testing, as shown in the Table 1.
Each channel consists of 155 matrices or slices, as shown in Figure 4, denoting the depth of the dataset, as this is a 3-dimensional dataset and every 2-dimensional matrix is about 240 × 240, i.e., height × width. Thus, the dataset contains 240 × 240 × 155 images for every modality, where there are 4 modalities in this case. In order to depict the data from the MRI scans, all the figures portrayed are of patient number 355, and as BraTS 2020 is a 3D dataset, we sliced the 95th 2D matrix of the 155 matrices and generated plots. As each image is a 3D image that can be displayed from several viewpoints, axial wedges display slices from top to bottom, coronal slices display slices from front to back, and sagittal slices display slices from left to right, or vice versa. Modality T1 shows the presence of a tumor, and T1ce displays a more contrasting boundary, whereas T2 and T2-FLAIR display the tumor area more clearly and precisely, as shown in Figure 2. Along with these, the ground-truth label data are also provided for training purposes in this dataset. The label for each voxel consists of 4 labels, where label 3 is omitted in the dataset. Label 0 is used for non-tumor (NT) areas, and label 1 is used for marking NCR/NET areas (necrotic and non-enhancing tumors). Label 2 is used to mark the peritumoral area of an edema. Label 4 is used to mark the GD-enhancing area. These four are visualized in Figure 5 and Figure 6.

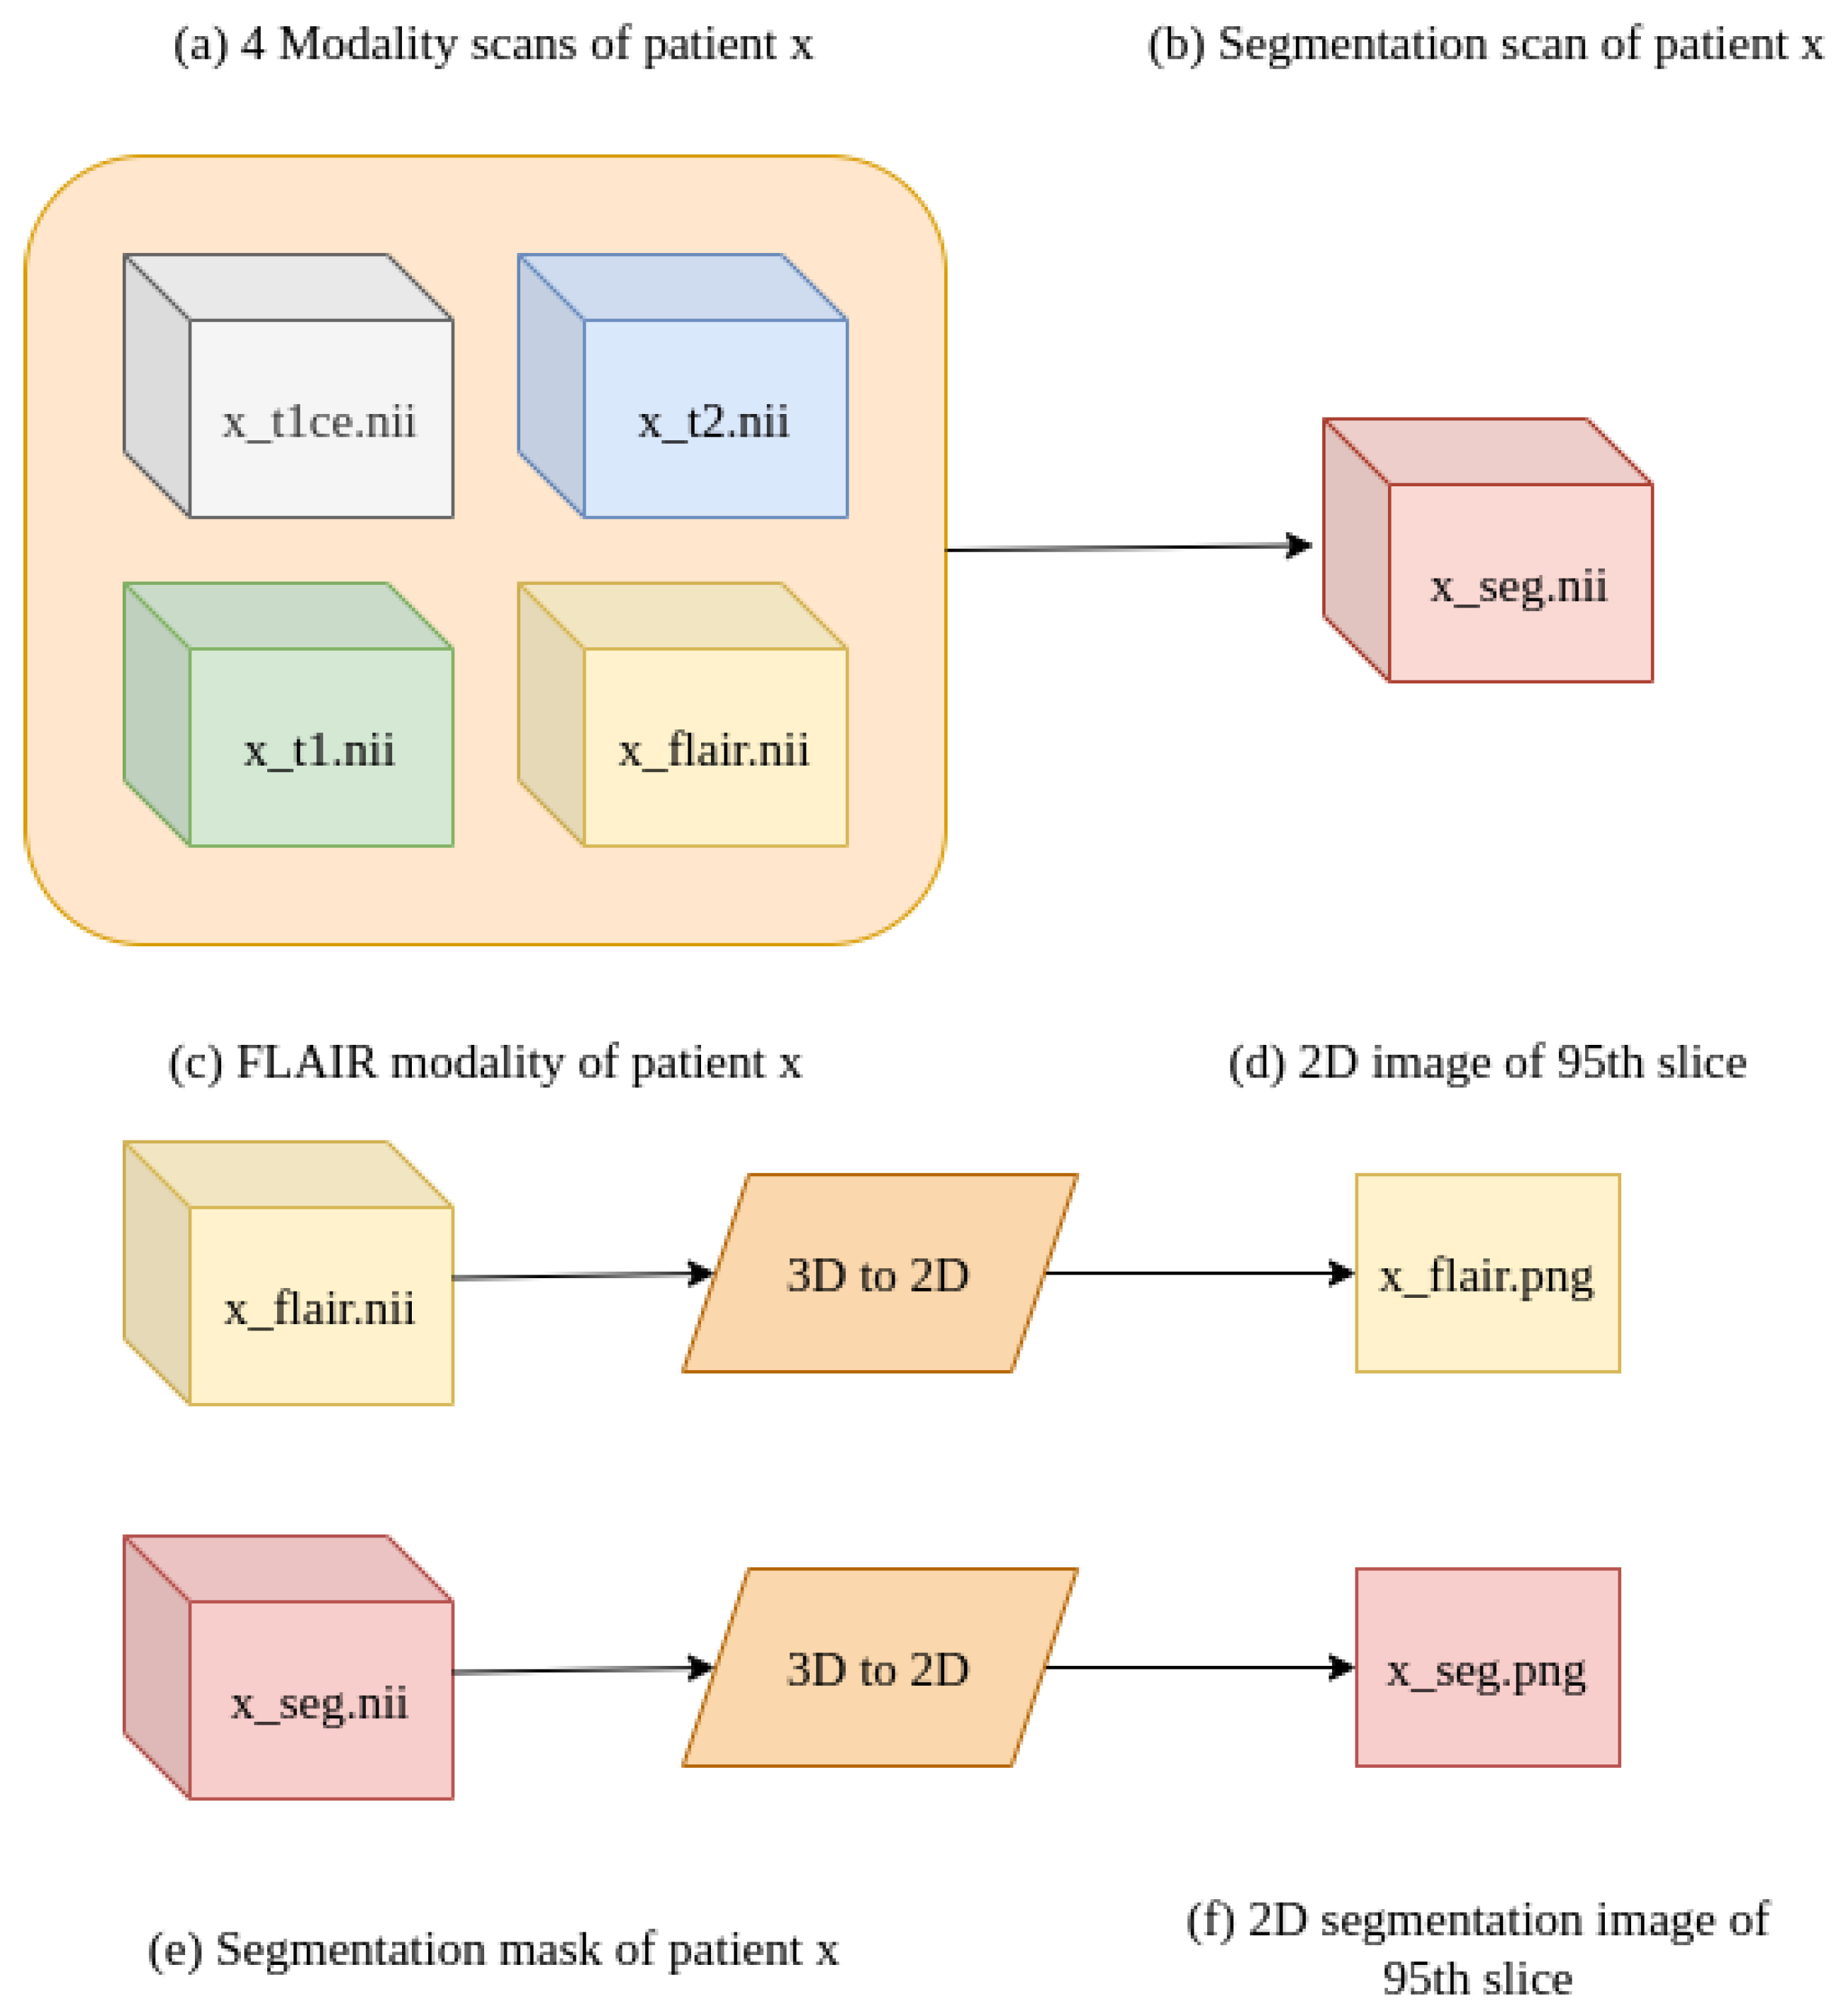
3.2. Data Pre-Processing

As SAM2-Unet is a 2-dimensional model [17] and BraTS 2020 is a 3-dimensional dataset, this study provides a method to transform a 3-dimensional dataset into 2-dimensional images. The FLAIR modality was chosen to be converted into a 2D image out of the rest of the modalities, i.e., T1, T1ce, and T2, as FLAIR suppresses the fluid signals in the scans, which makes it easy to identify lesions. Lesions refer to any abnormal changes or damage in tissue, typically caused by injury, disease, or other conditions. It is a challenging task to identify these lesions as their appearance, location, and characteristics can vary depending on the underlying cause. Additionally, all types of lesions may look similar, making diagnosis dependent on a combination of clinical evaluation, imaging studies, laboratory tests, and sometimes biopsies. As the FLAIR modality contains 155 images, 2-dimensional matrices, or slices, we chose the 95th slice as the ideal slice for all the scans of different patients, as this slice highlights lesions very clearly along with the whole MRI image of the brain from the top angle. This 95th slice was then converted into a 2-dimensional black and white image of dimensions 352 × 352 × 3. We repeated the same procedure for the 3-dimensional segmentation mask, i.e., we converted the 95th slice into a 2-dimensional image, as shown in the Figure 7 and Figure 8.

3.3. Brain Tumor Segmentation Model

Deep learning has demonstrated remarkable success in image segmentation tasks due to its ability to automatically learn hierarchical feature representations from data. Architectures like U-Net, SegNet, and Mask R-CNN have consistently achieved state-of-the-art performance across various domains, including medical imaging, autonomous driving, and satellite imagery analysis. For example, the U-Net architecture has become a standard choice for biomedical image segmentation due to its effective use of skip connections and its ability to localize fine-grained details [10]. In this study, SAM2-UNet demonstrates robust performance by achieving a mean Dice score (mDice) of 0.771, a mean Intersection over Union (mIoU) of 0.569, an S α score of 0.692, a weighted F-beta score ( F β w ) of 0.267, an F-beta score ( F β ) of 0.261, an E ϕ score of 0.857, and a mean absolute error (MAE) of 0.046 when training for 30 epochs, with 250 iterations for each epoch.

4. Proposed Approach

SAM2 (Segment Anything Model 2) is a robust computer vision model that has been developed for segmenting images efficiently [17]. SAM2 was proposed by Meta’s (Menlo Park, CA, USA)’s AI research team and aims to segment anything with high accuracy and adaptability. SAM2 was specifically designed to handle complex image segmentations by embedding enhanced methodologies that make the model very robust and to yield promising results for applications like automated automobiles, biomedical imaging, and navigation systems without requiring extensive manual training. Gliomas are tumors that present a significant challenge in medical imaging because of their irregular shapes and boundaries. SAM2’s ability to perform zero-shot segmentation allows the model to accurately delineate these complex structures using minimal input. As SAM2 enables user prompts, it has become very easy to segment complex structures within images without the need for extensive manual training, which is essential in the biomedical domain for medical image segmentation to detect anomalies [9].

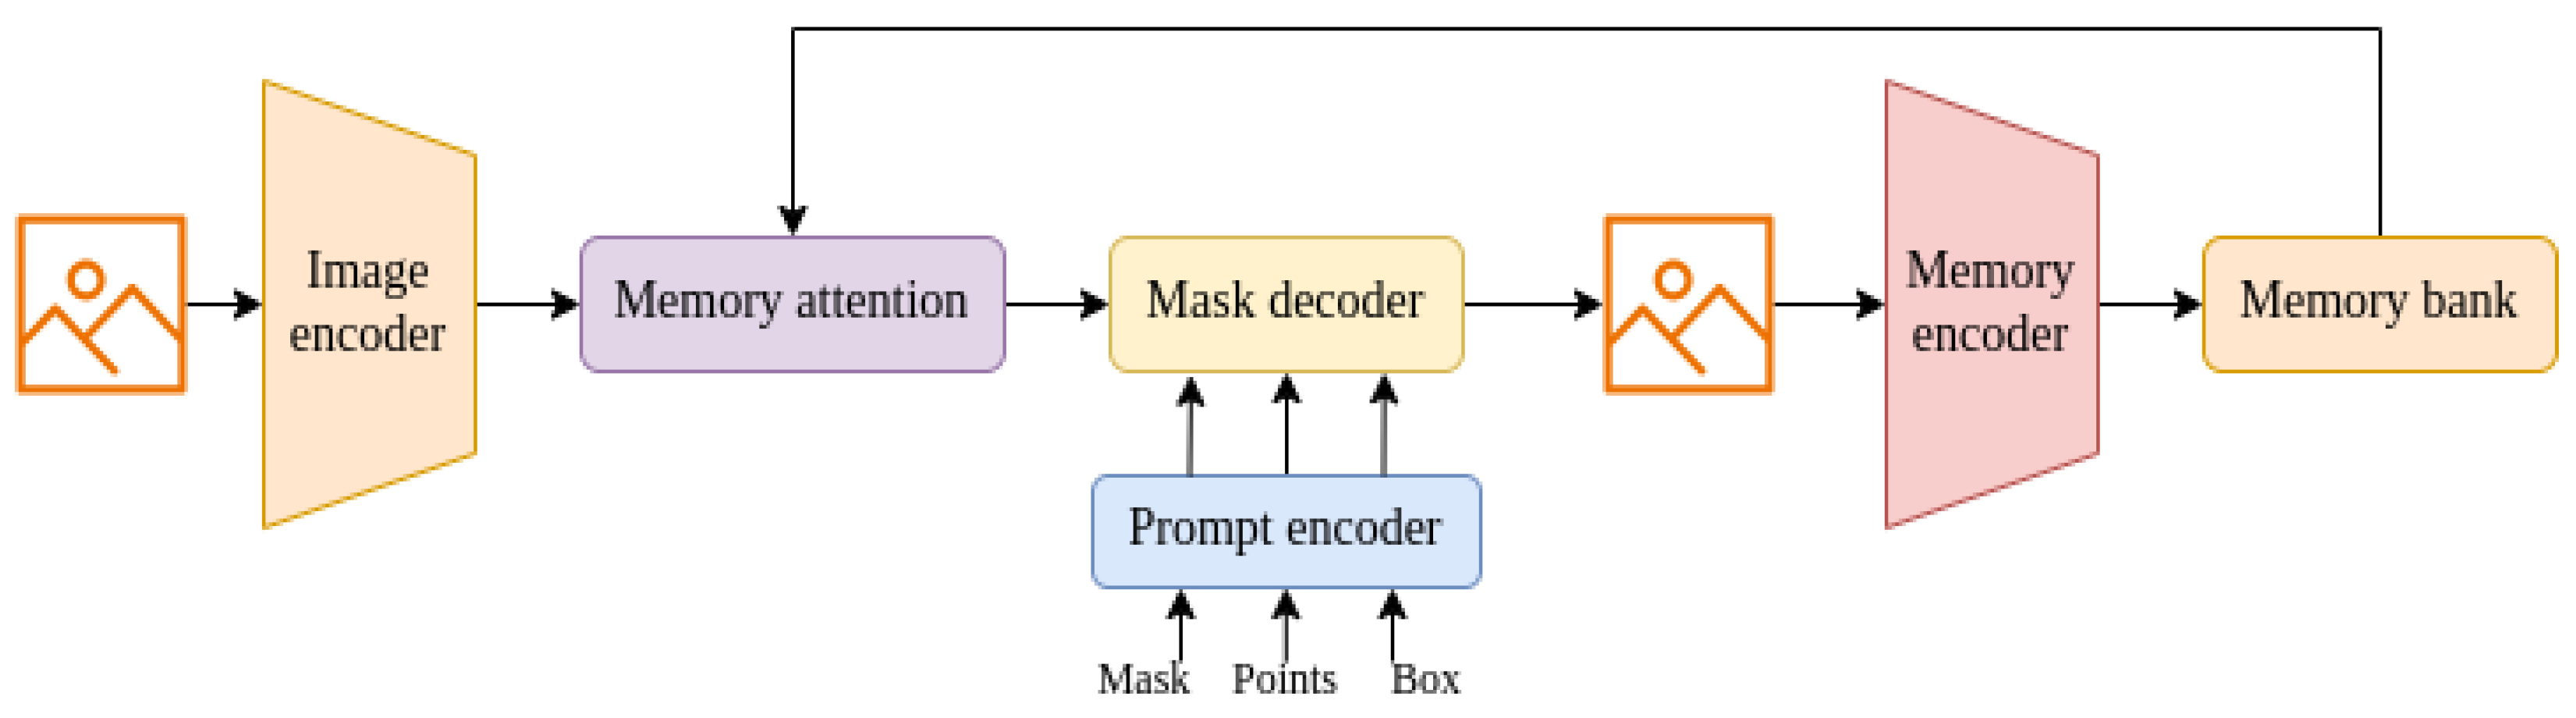
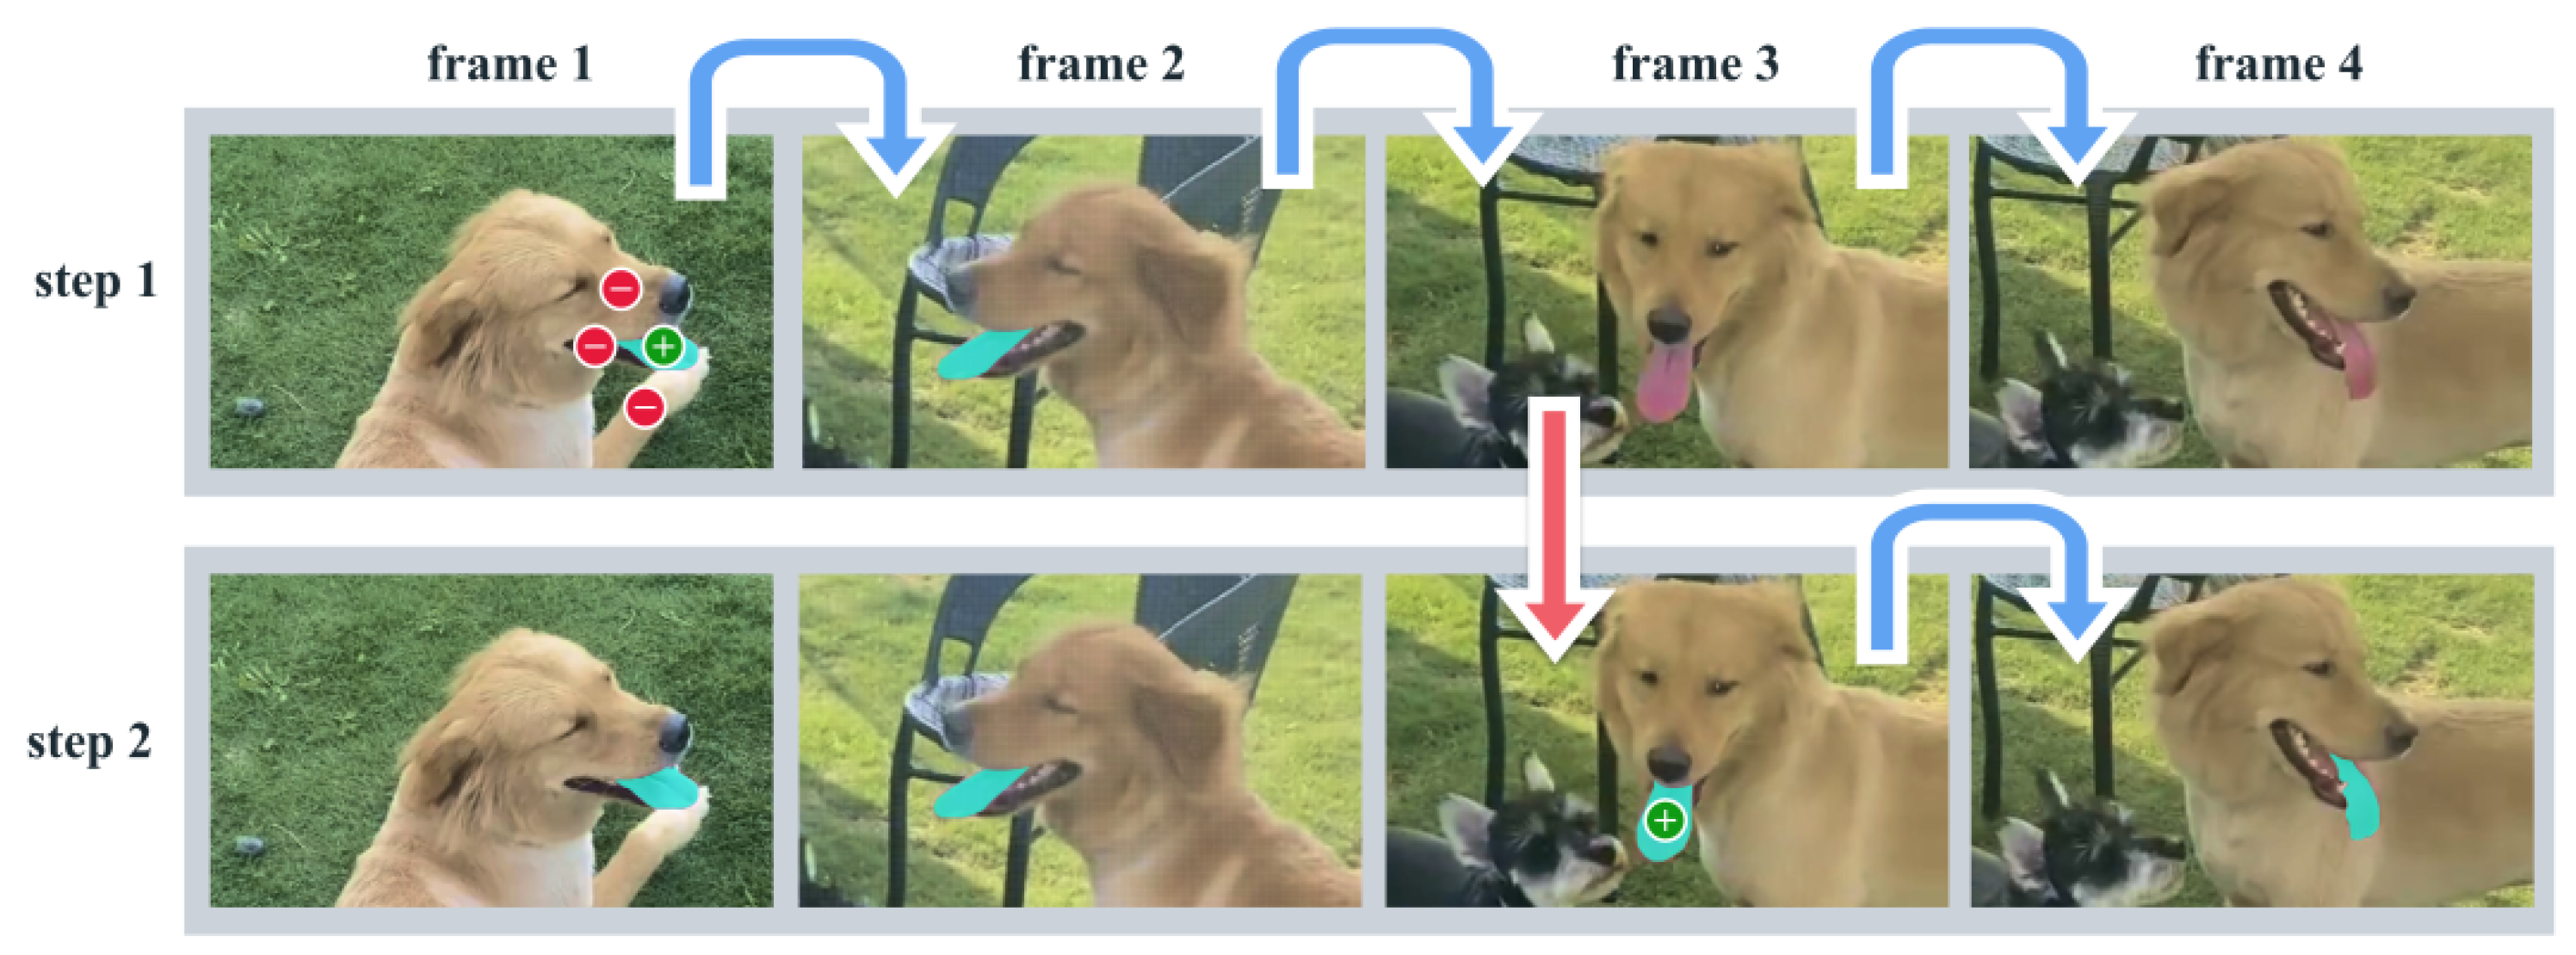
4.1. Segment Anything Model (SAM)-2

SAM2 Figure 9 accepts multi-modal images as input to the image encoder for detecting objects. The image encoder then converts these multi-modal images into feature embeddings using a masked auto-encoder. These feature embeddings are then passed into the memory attention module to integrate the context from the previous frames that are stored in the memory bank with the received feature embeddings; this also stores the information from the previous frames and the prompted frames. The memory attention module uses the self-attention mechanism to capture the dependencies of the features within the frames and the cross-attention mechanism in order to condition the features based on stored memory; the output of this memory attention mechanism will then be passed into the mask decoder.
This model even consists of a prompt encoder that enables the users to prompt vital segmentation on selected frames for accurate and efficient segmentation as shown in the Figure 10. This will be further passed into the memory encoder to integrate the mask decoder’s output with the feature embeddings of the image encoder. The memory encoder will integrate the current predictions with the original frame’s detailed features and then downsample these integrations using convolutional neural networks to make the model more focused on the important feature and ignore the rest. The output of the memory encoder will be passed into the memory bank to store the spatial feature maps of each frame.

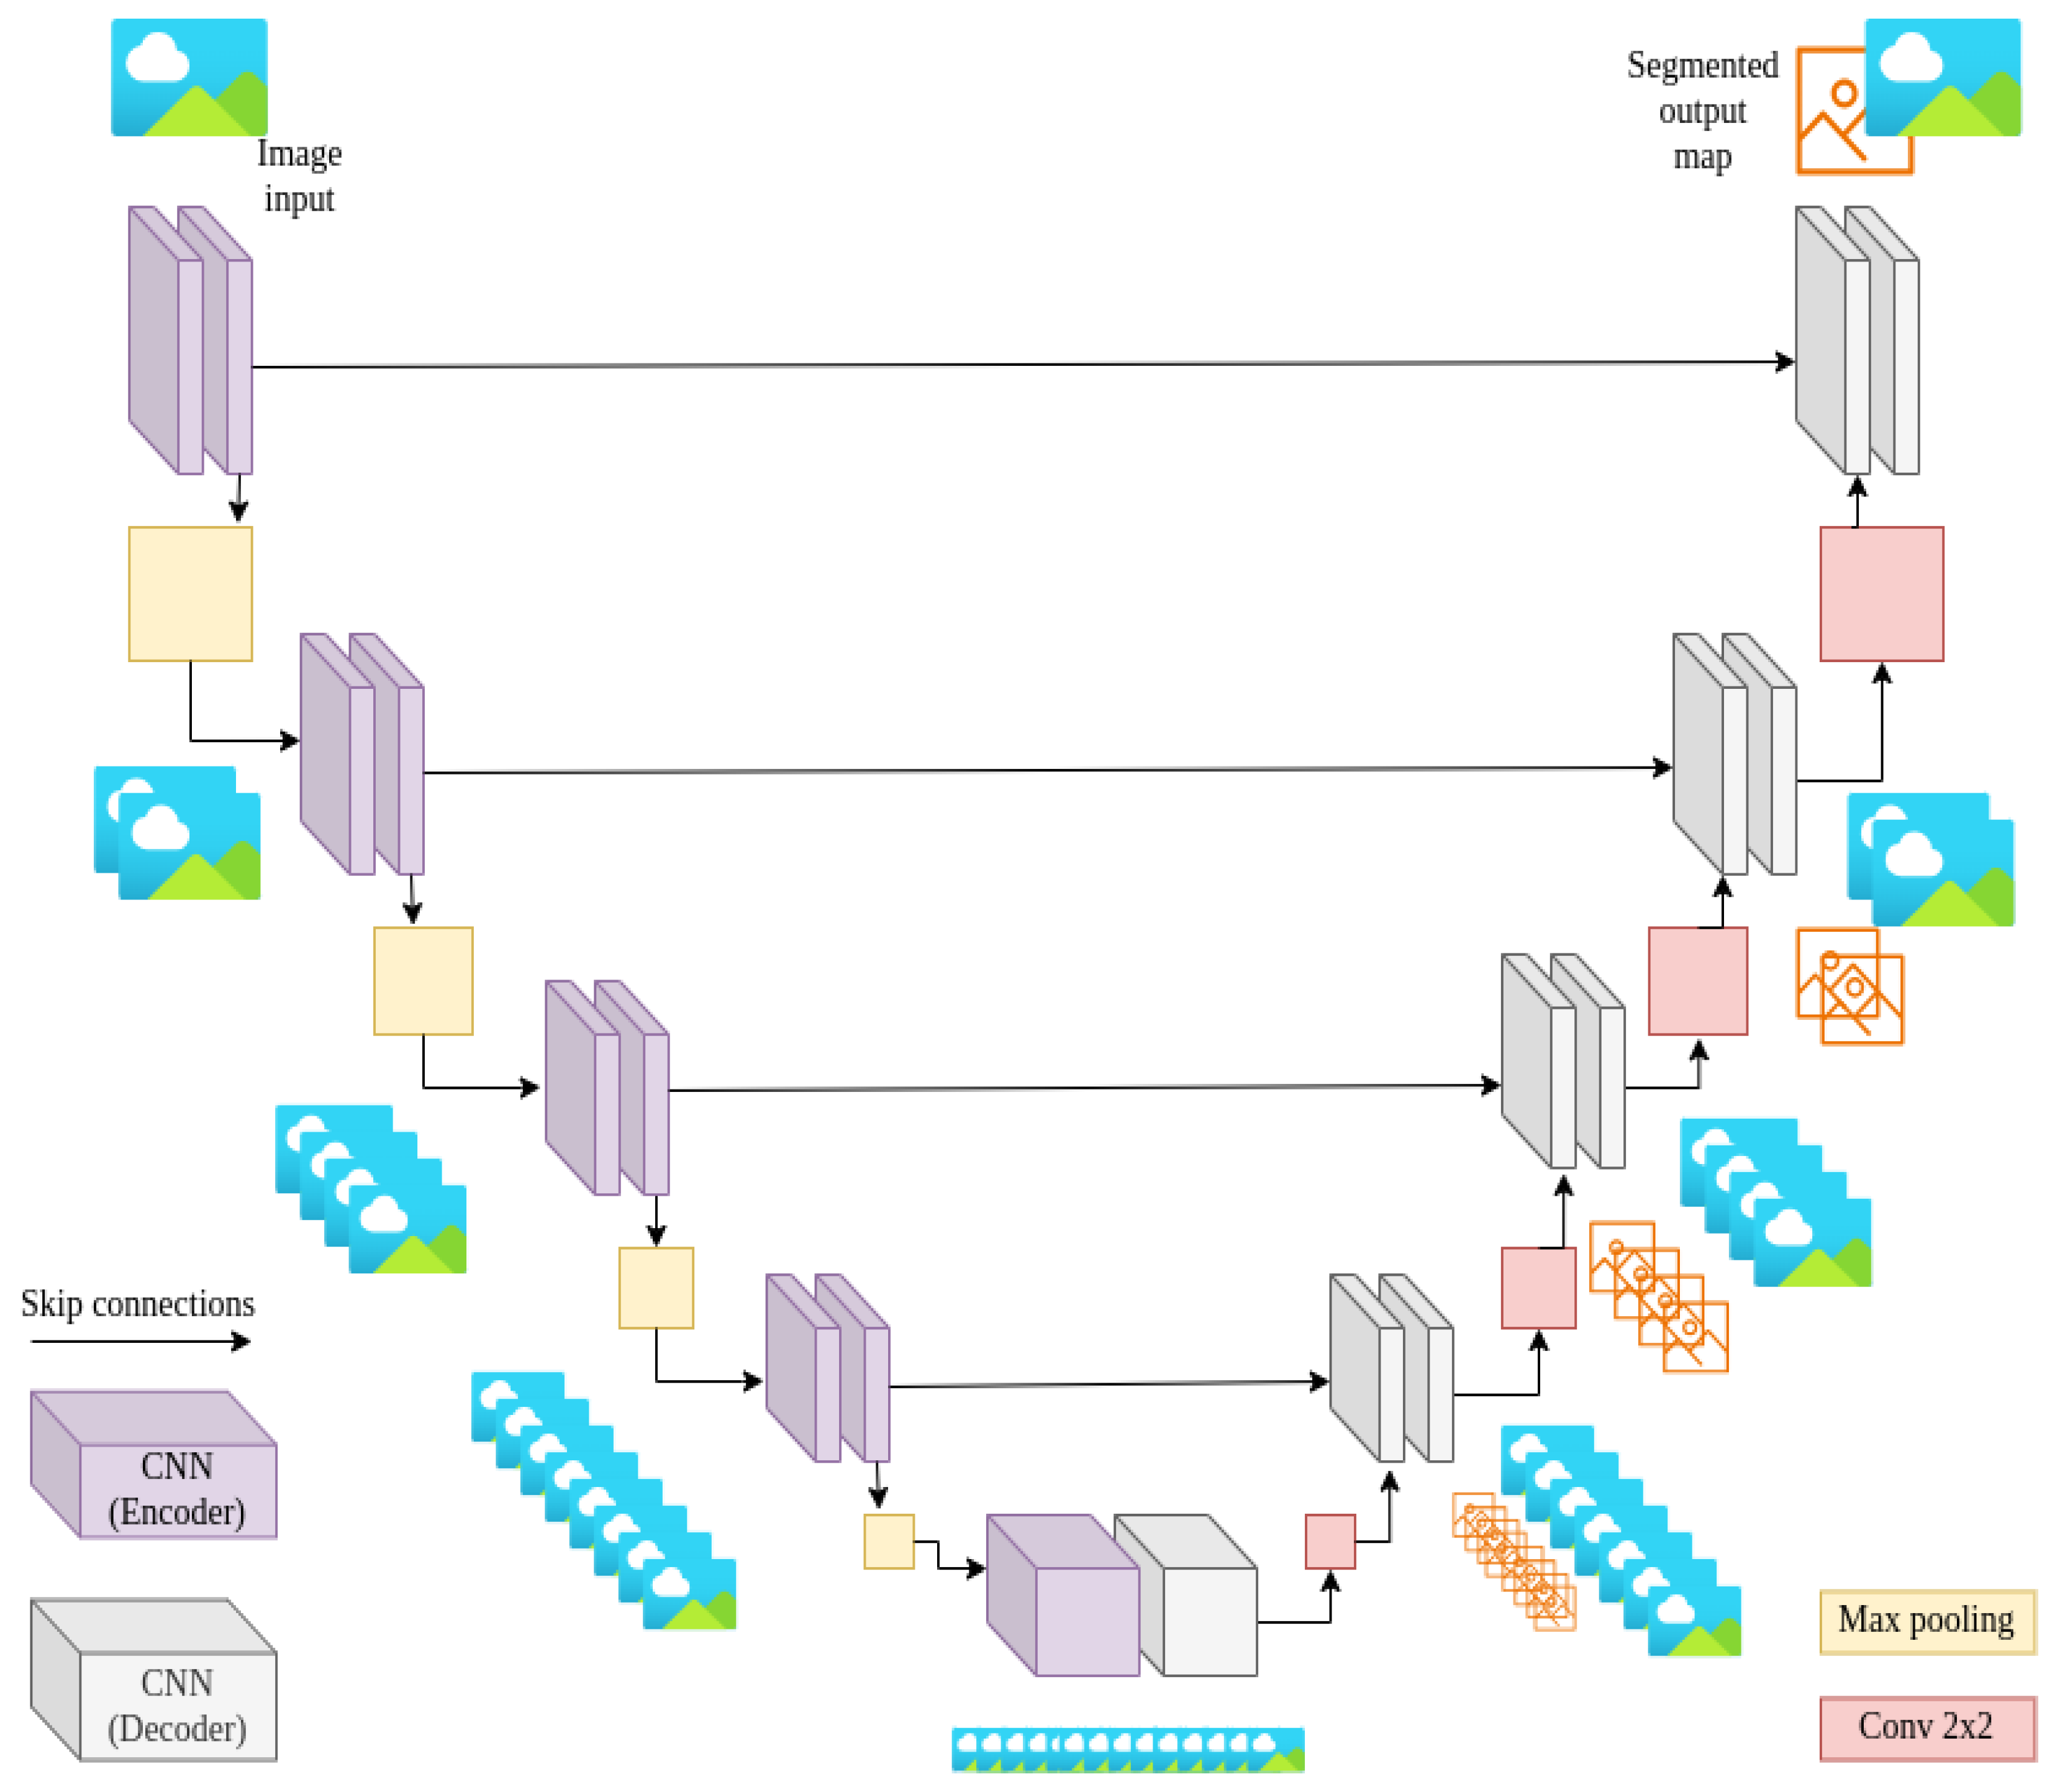
4.2. U-Net Architecture

The U-Shaped network is simply a set of convolutional blocks arranged in a hierarchy with max-pooling layers and convolutional layers. This model was developed in 2015 by Olaf et al., specifically for biomedical image segmentation [10]. This U-Net architecture is inspired by the encoder–decoder architecture. The encoder uses a set of convolutional layers along with max-pooling with a kernel of size 2 × 2, a stride of 2 to extract the pixels without overlapping, and ReLU as an activation function; this process is termed downsampling, where the spatial dimensions are reduced and the number of channels is doubled at each layer of the encoder. At the deepest point of the architecture lies a bottleneck, which serves as the transition between the encoder and decoder. In the decoder blocks, upsampling is performed using 2 × 2 convolution operations instead of max-pooling to retain the spatial resolutions lost during downsampling. This process is known as upsampling, and it uses the ReLU activation function. Additionally, the number of channels is halved at each layer during this phase, ensuring a gradual reduction in feature complexity while reconstructing the original spatial dimensions. The output of these decoder blocks will be appended to the feature embeddings from the encoder blocks at each level to achieve perfect pixel segmentation. This combination can be understood as follows: if the decoder’s features highlight a specific area containing an object, the encoder’s features provide precise pixel-level localization of that object, as illustrated in Figure 11. The key feature of this model is that it works effectively and efficiently with a limited number of training images, making it suitable for biomedical applications.

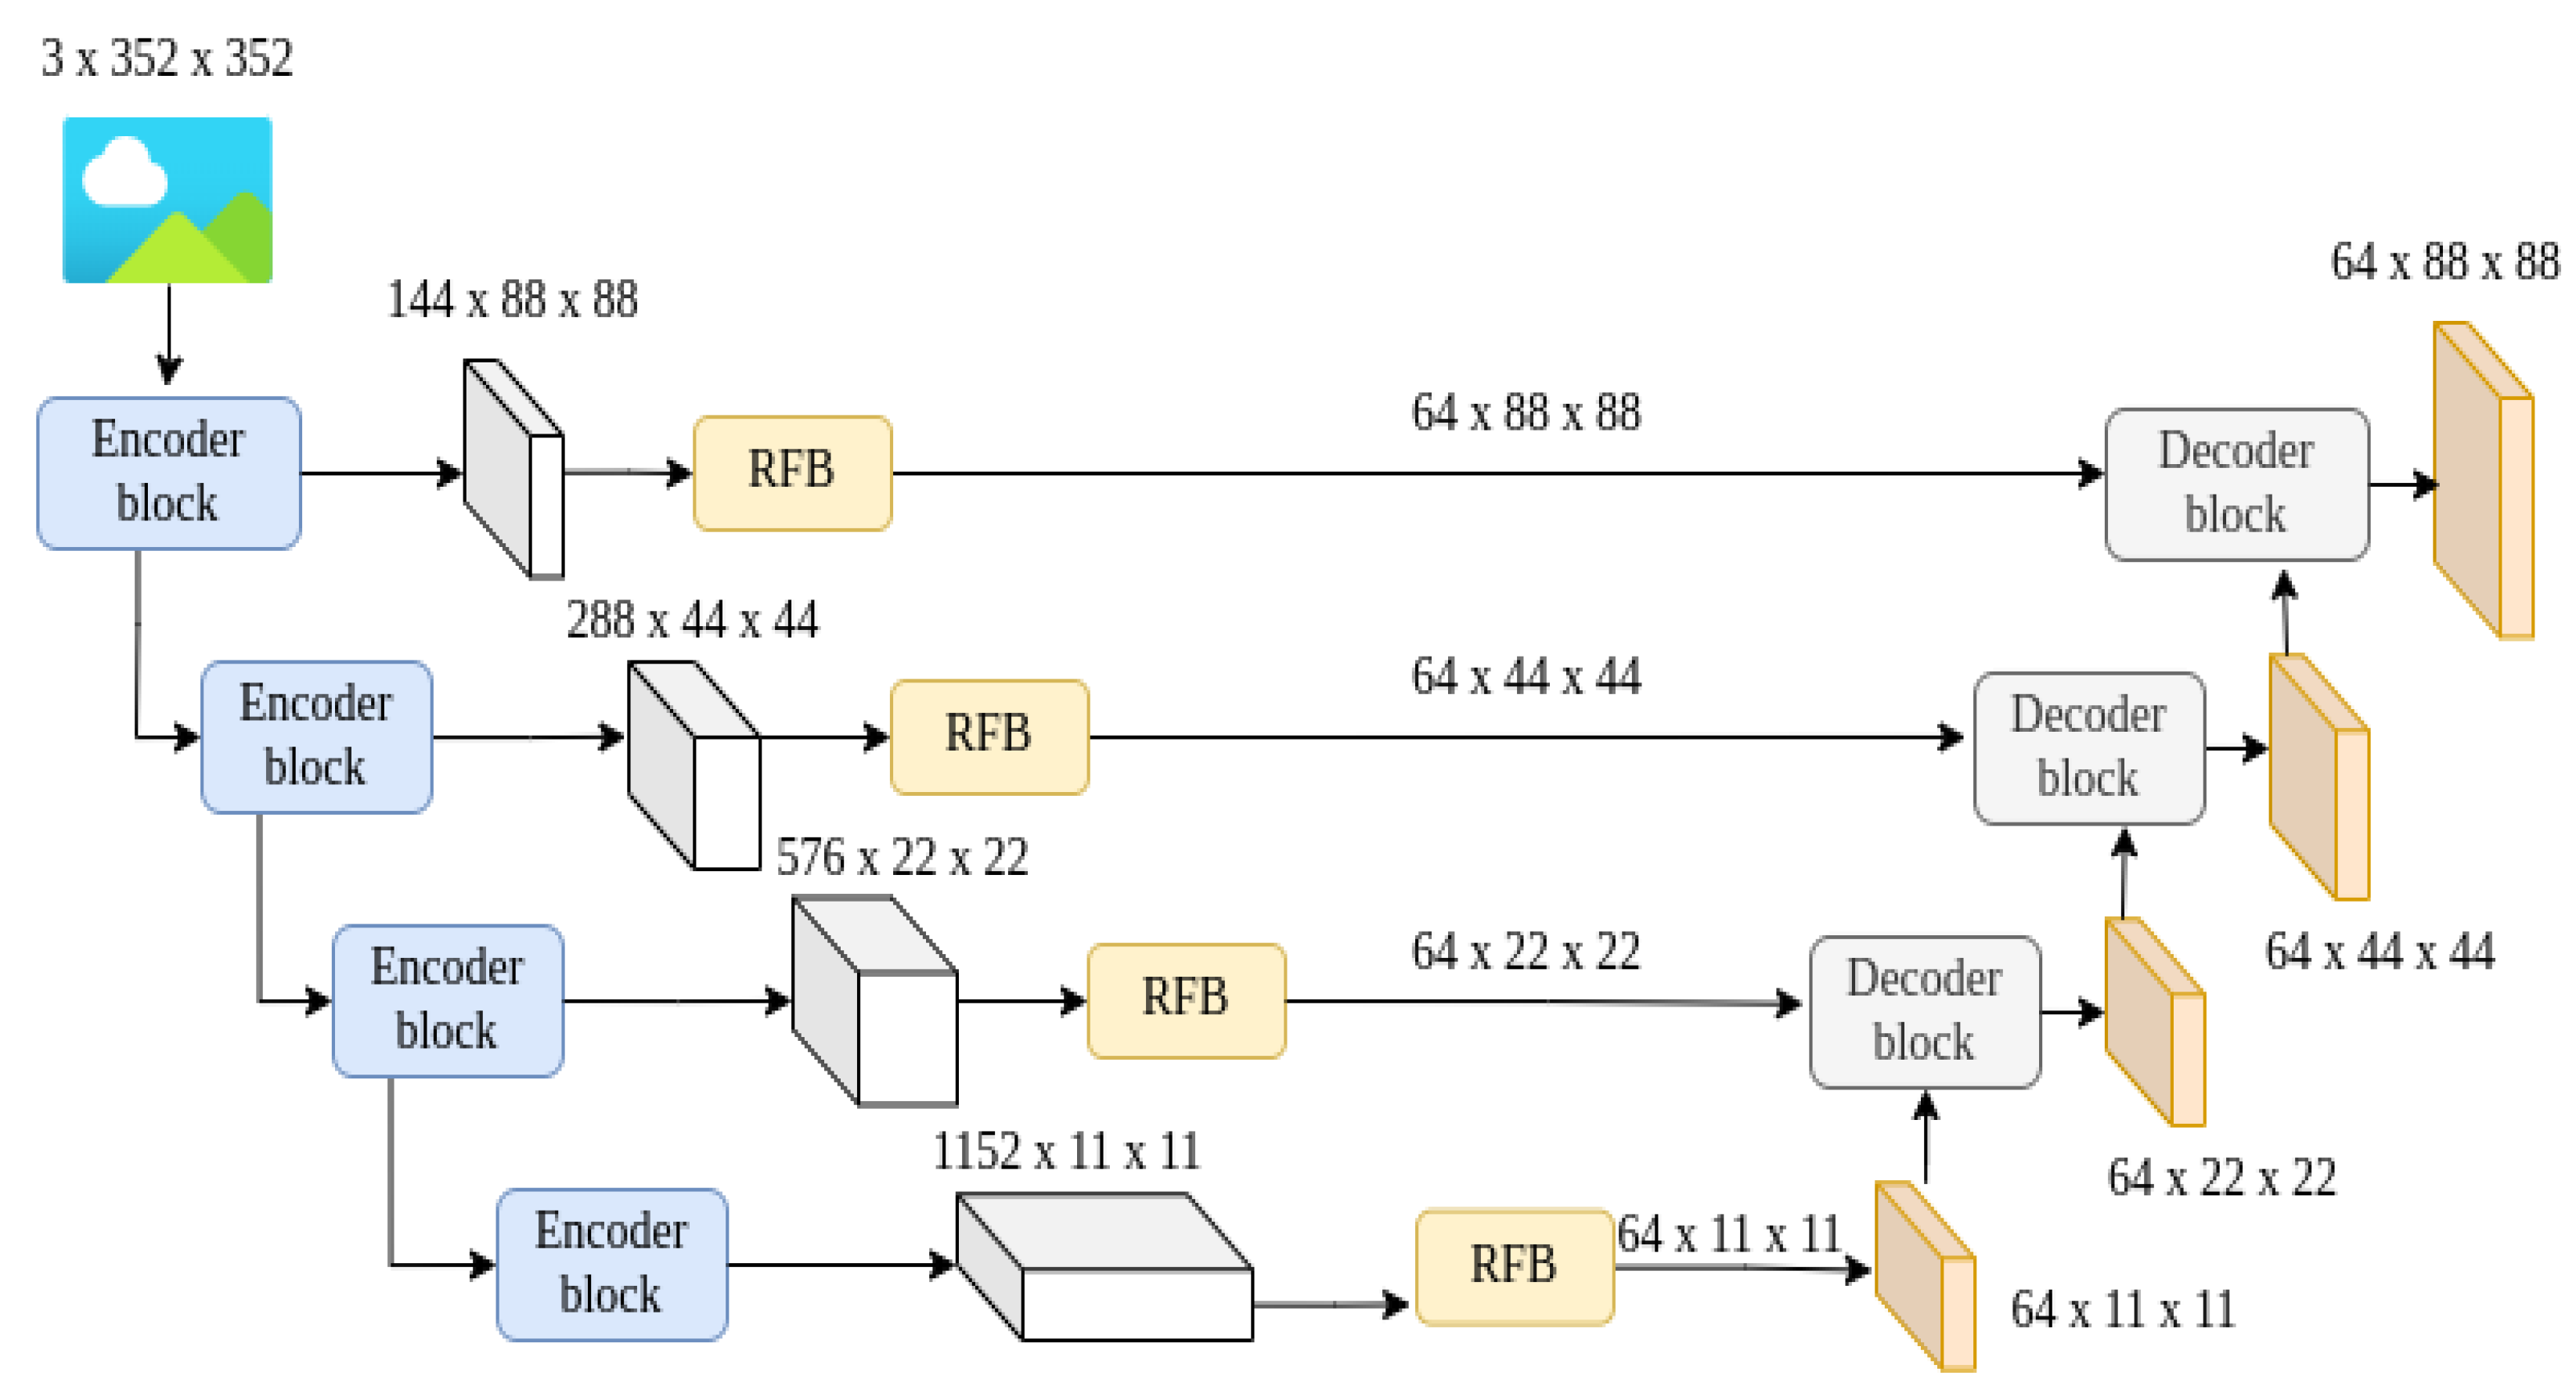
4.3. Integrated SAM2-UNet Model

Even though the Segment Anything Model (SAM-2) was based on the SAM-1 model, including advanced and robust improvements, SAM2 produces class-agnostic results, i.e., identification and object separation is based on images without label requirement when no prompt is given to the model [9]. To tackle this problem, this study has proposed the integration of SAM2 and UNet model as shown in the Figure 12.
In this proposed solution, the SAM2 model acts as an encoder, and the UNet architecture functions as the decoder. This combination leverages SAM2’s advanced zero-shot segmentation capabilities, which help in handling complex structures with minimal manual training. The SAM2 encoder provides robust feature extraction, while the UNet decoder refines the features to produce precise segmentation outputs. This study also incorporates Hiera, a pre-trained model that captures multi-scaled features and is well suited for U-shaped networks. Given an input image, I R 3 × H × W , where H denotes height and W denotes width, Hiera outputs four hierarchical features, X i R C i × 2 H / ( i + 1 ) × 2 W / ( i + 1 ) ( i { 1 , 2 , 3 , 4 } ) . In order to build this hybrid architecture, we have omitted a few modules from the SAM2 model, namely memory attention, prompt encoder, memory encoder, and memory bank, as they are not necessary to build a U-Network architecture [10]. In summary, while the traditional UNet remains as a powerful tool for medical image segmentation, the hybrid SAM2–UNet model offers significant advantages in handling complex structures with minimal manual training. This combination of SAM2’s robust feature extraction and UNet’s refined decoding process results in precise and efficient segmentation. The proposed architecture consists of four encoders that accept an image with dimensions of 3 × 352 × 352 and converts them into feature embeddings of distinct channels. These extracted features will then be passed into the corresponding four receptive field blocks, which help in reducing the number of channels to 64 channels in order to enhance the lightweight features [18]. These features will then be passed into the respective decoder blocks, which are inspired by customizable U-shaped structures, which have been proven to be effective in many biomedical applications [19]. These decoders consist of two combinations of a 3 × 3 convolutional layer, Batch normalization, and a ReLU activation function. The outputs from these decoders will be passed into a 1 × 1 convolutional layer that produces a segmentation result, which is then upsampled and supervised by the ground-truth segmentation mask ‘G’. We use the mean weighted Intersection over Union (mIoU) loss and binary cross-entropy loss as our training objectives [20]:
L = L IoU + L BCE .
Additionally, we apply deep supervision to all segmentation outputs, S i . The total loss for SAM2-UNet is formulated as follows:
L total = i = 1 3 L ( G , S i ) .
Each adapter in the proposed framework consists of a linear layer for downsampling, a GeLU activation function, which is followed by another linear layer for upsampling, and a final GeLU activation function, similarly to in [21].
Table 2 depicts the training hyperparameters used for training our SAM2-UNet model on the brain tumor segmentation 2020 dataset.

5. Experiments and Results

5.1. Discerning the Inner Workings of the Proposed SAM2-UNet Architecture

Our SAM2-UNet model was efficiently trained for only 30 epochs using the hyperparameters outlined in Table 2, demonstrating its capability to achieve significant performance even with limited hardware resources and without the need for specialized hardware. As shown in Figure 13, our SAM2-Unet model performed exceptionally well on the testing dataset by segmenting the tumors, i.e., lesions, precisely from the 2-dimensional image; the training loss is shown in Figure 14. The model’s output was evaluated using the following metrics: (a) mIoU, (b) Dice coefficient, (c) F1-measure, and (d) mean absolute error. The results are shown in Table 3.

5.1.1. Mean Intersection over Union (mIoU)

The mIoU metric is great for segmentation tasks because it provides a balanced assessment of model accuracy by measuring the overlap between predicted and actual regions. It accounts for both false positives and false negatives, making it reliable even when the classes are imbalanced. The metric ‘mIoU’ (mean Intersection over Union) is widely recognized in benchmark evaluations and serves as a standard for comparing the performance of various models. It is also well suited for multi-class segmentation, capturing performance across all categories. Thus, the mIoU is simple, interpretable, and effective for evaluating image segmentation quality [10].
mIoU = 1 N i = 1 N | A i B i | | A i B i |

5.1.2. Dice Coefficient (DICE)

The Dice coefficient is a simple and intuitive metric that measures the overlap between predicted and actual regions and makes interpretion very easy. It is useful for imbalanced datasets, as it gives equal importance to both false positives and false negatives. This metric is widely used in fields like biomedical imaging due to its sensitivity in detecting small structures. It is effective for both binary and multi-class segmentation tasks [22].
Dice = 1 N i = 1 N 2 | A B | | A | + | B |

5.1.3. F1-Measure

The F1-measure is great in the biomedical field because it balances both false positives and false negatives, which is crucial for accurate medical diagnoses. It works well with imbalanced data, where certain conditions are rare [23]. F1 is sensitive to misclassifications and helps to avoid missing critical details like rare diseases. It is especially useful in tasks where errors can have serious consequences, like cancer, tumor, and cyst detection.
F 1 = 1 N i = 1 N 2 × ( T P T P + F P ) × ( T P T P + F N ) ( T P T P + F P ) + ( T P T P + F N )

5.1.4. Mean Absolute Error

The mean absolute error (MAE) is easy to understand and calculate, as it measures the average difference between predicted and actual values. It is interpretable because it is in the same units as the data, making it practical for real-world applications. The MAE is less sensitive to outliers than other metrics like MSE, which helps in scenarios with extreme values. Thus, the MAE offers a straightforward way to assess model accuracy without the complications of squared error penalties [24].
MAE = 1 N i = 1 N | y i y i ^ |

6. Discussion

6.1. Strengths and Contributions

This paper demonstrates several key strengths, including the integration of novel techniques for precise segmentation with improved accuracy and precision. The proposed model handles limited data effectively, resulting in a generalized performance across distinct brain tumor datasets, which makes it robust in real-world applications. This can lead to more accurate diagnoses and potentially aid in personalized treatment planning for patients.

6.2. Limitations and Challenges

Despite its strengths, our proposed approach faces some limitations such as data constraints, as the availability of diverse datasets remains limited, especially for rare tumor types. Hardware limitations also pose a challenge, as high computational resources are required for training deep learning models on large datasets. Additionally, there is room for improvement in terms of generalization to unseen data, which could be addressed through techniques such as domain adaptation or transfer learning. Future research should focus on overcoming these limitations by expanding the dataset diversity and optimizing model performance with reduced hardware demands.

7. Error Analysis

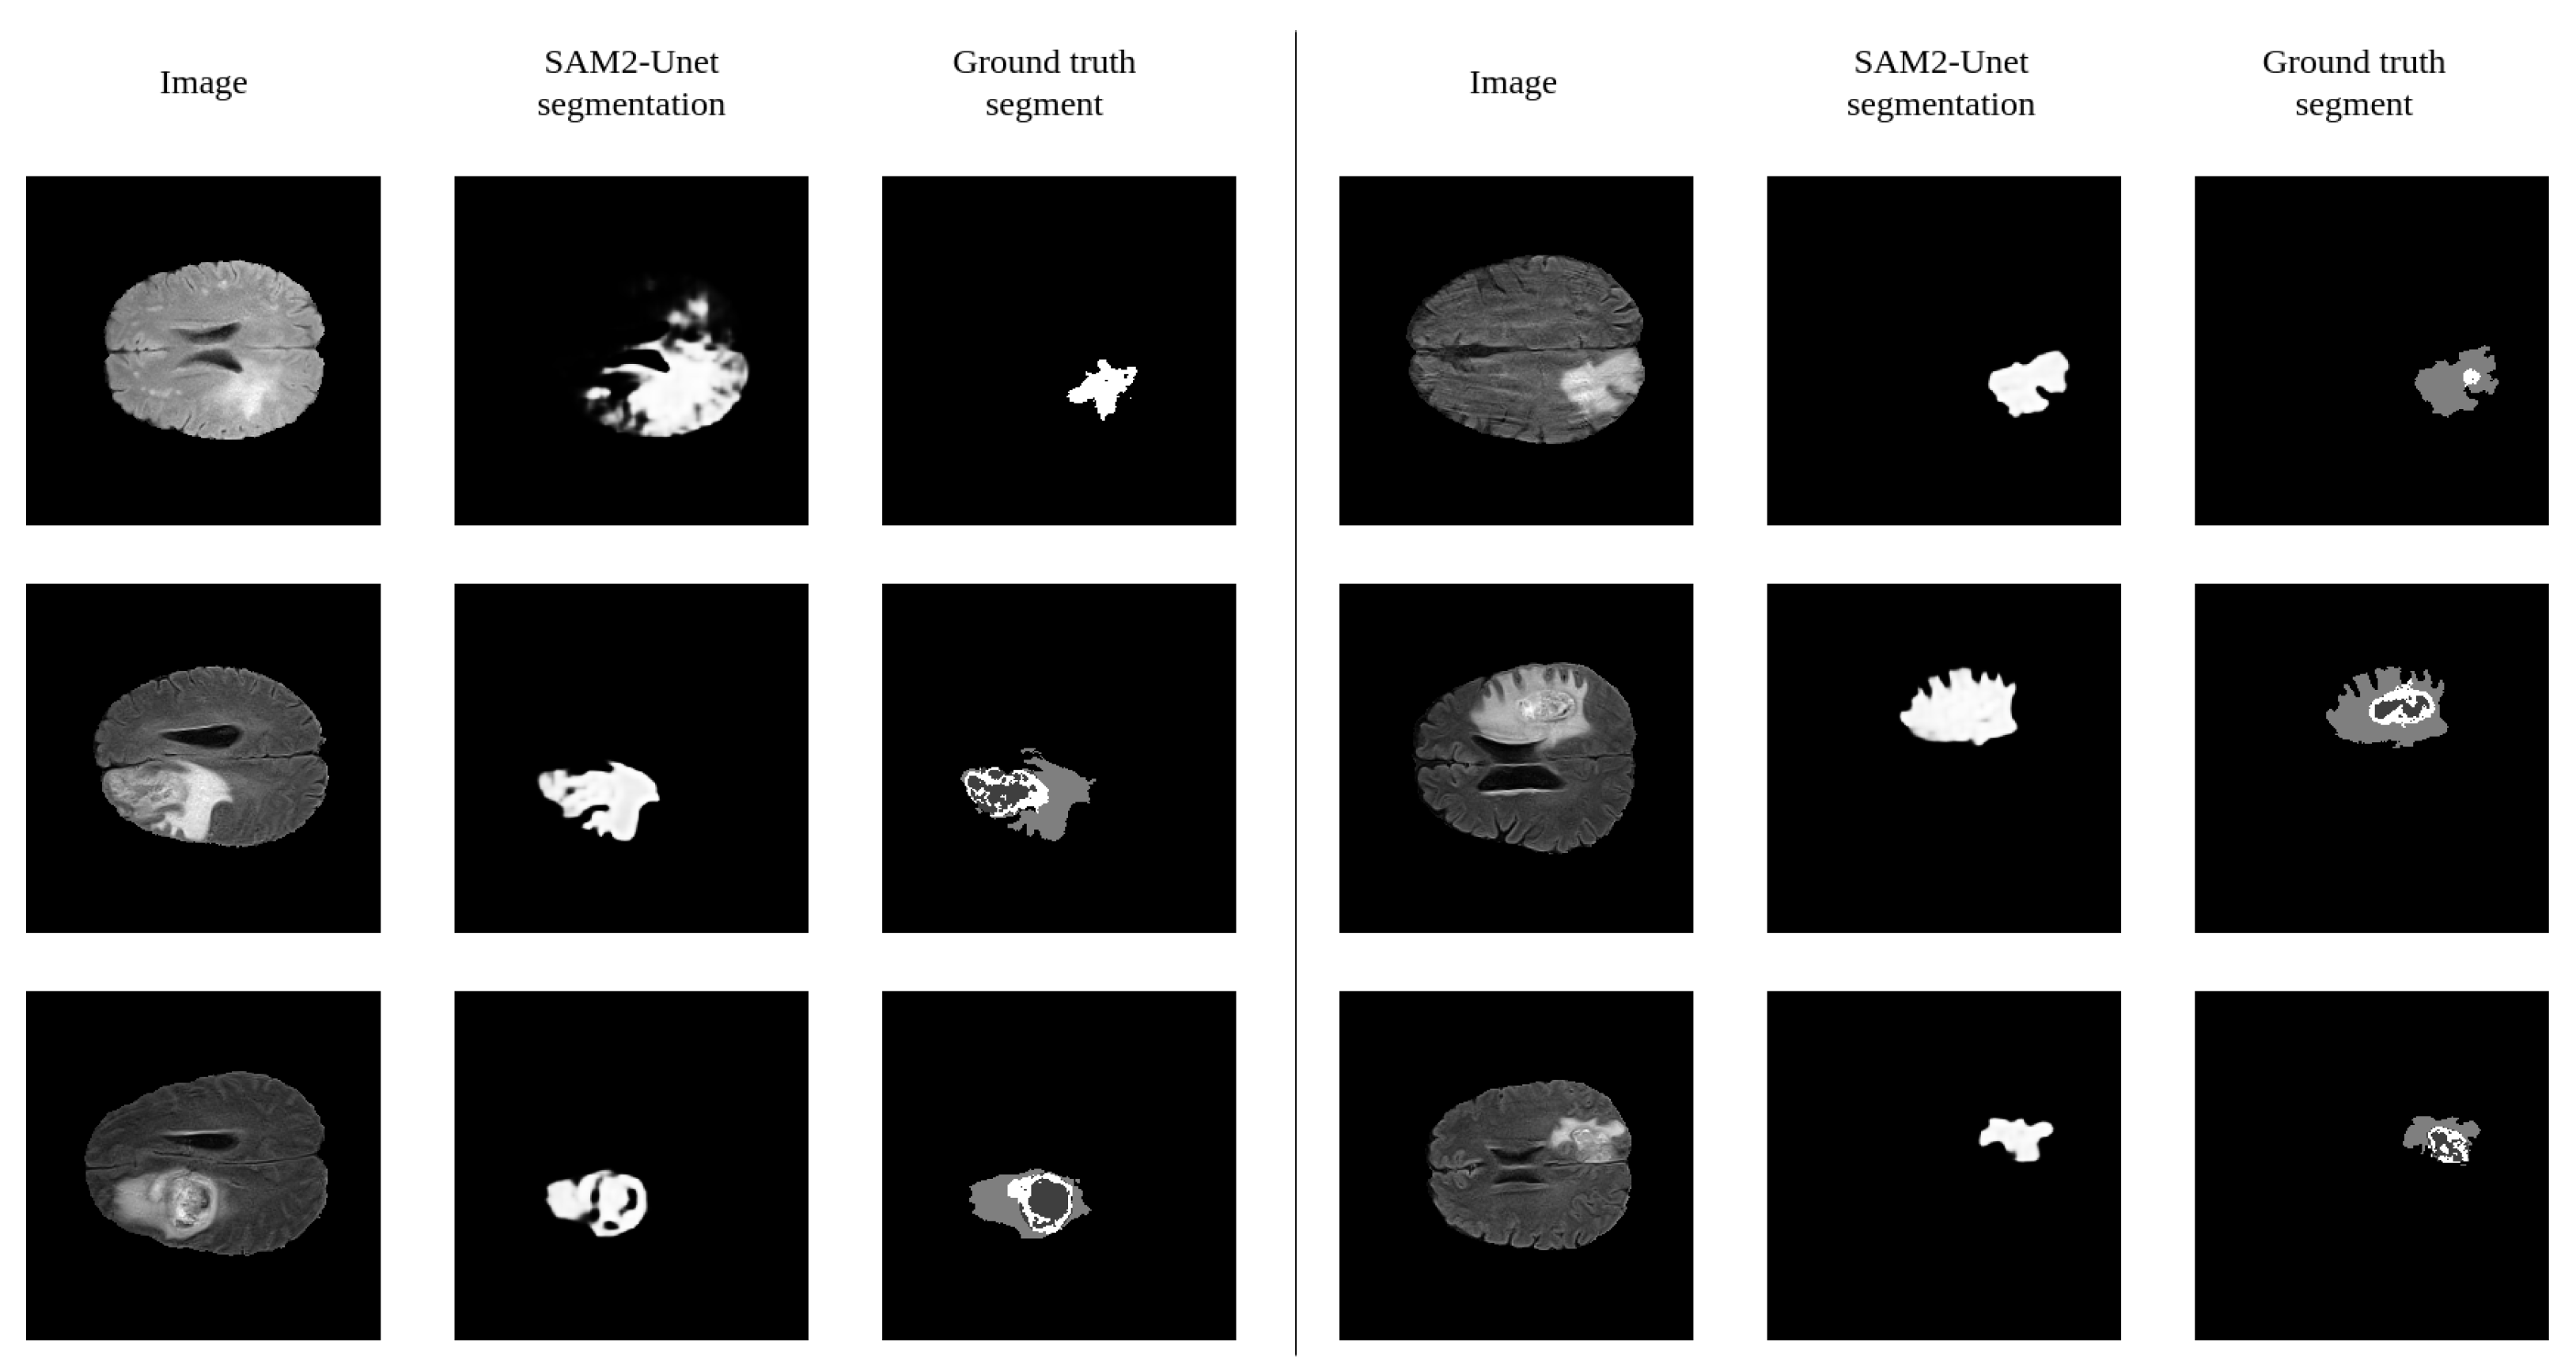
7.1. Visual Error Analysis

This highlights areas where the proposed model struggles, such as regions with low contrast, complex shapes, or overlapping tissues. By visualizing these discrepancies, we can better understand the model’s limitations and identify specific areas that require improvement.

7.2. Error Causes

Potential causes of errors in brain tumor segmentation include factors like image quality, which may introduce noise or artifacts, and limitations in the model architecture, such as insufficient representation of complex tumor shapes or boundaries. Additionally, pre-processing techniques like data augmentation and improved feature extraction can mitigate these issues by enhancing the robustness of the model. Through careful analysis and refinement of these factors, future work can address underlying challenges and improve segmentation accuracy.

8. Conclusions and Future Work

This study proposes SAM2-UNet, a very simple and straightforward but effective and efficient U-shaped architecture for accurate segmentation in the domain of biomedical applications. SAM2-UNet is designed for ease of interpretation and usage, featuring a SAM2 pre-trained model ’Hiera’ encoder coupled with a classic U-Net decoder. SAM2-UNet serves as a new baseline model for developing variants of SAM2 models in future.

Future Enhancements

Future enhancements include experimenting with learning rates, batch sizes, and optimizer choices and implementing techniques like rotation, flipping, and scaling for the BraTS 2020 dataset.

Author Contributions

Conceptualization, R.V.P.; methodology, R.V.P.; software, R.V.P.; validation, R.V.P.; formal analysis, R.V.P.; investigation, R.V.P.; resources, R.V.P. and V.S.S.; data curation, R.V.P. and V.S.S.; writing—original draft preparation, R.V.P.; writing—review and editing, R.V.P., V.S.S. and M.A.; visualization, R.V.P.; supervision, R.V.P.; project administration, R.V.P. and V.S.S.; funding acquisition, V.S.S. All authors have read and agreed to the published version of the manuscript.

Funding

This research received no external funding.

Institutional Review Board Statement

Not applicable.

Informed Consent Statement

Not applicable.

Data Availability Statement

The data presented in this study are openly available in the BraTS 2020 repository at https://www.kaggle.com/datasets/awsaf49/brats20-dataset-training-validation, accessed on 9 March 2025.

Acknowledgments

The authors would like to thank their families and colleagues for their support during the completion of this work.

Conflicts of Interest

The authors declare no conflicts of interest.

References

  1. Cao, R.; Ning, L.; Zhou, C.; Wei, P.; Ding, Y.; Tan, D.; Zheng, C. CFANet: Context Feature Fusion and Attention Mechanism Based Network for Small Target Segmentation in Medical Images. Sensors 2023, 23, 8739. [Google Scholar] [CrossRef] [PubMed]
  2. Guo, S.; Yang, X.; Wang, M. Recent deep learning-based brain tumor segmentation models using multi-modality magnetic resonance imaging: A prospective survey. Front. Neurosci. 2020, 14, 1206. [Google Scholar]
  3. Holland, E.C. Glioma: Biology and diagnosis. Nat. Rev. Cancer 2009, 9, 341–353. [Google Scholar]
  4. Brown, T.E.; Peterson, D. Glioblastoma: The paradigm of the malignant glioma. J. Clin. Oncol. 2004, 22, 2171–2181. [Google Scholar]
  5. Ceballos-Ceballos, J.; Loza-Gallardo, D.A.; Barajas-Romero, M.A.; Cantú-Brito, C.; Valdés-Ferrer, S.I. Recognition of Brain Meta’s (Menlo Park, CA, USA)stases Using Gadolinium-Enhanced SWI MRI: Proof-of-Concept Study. Front. Neurol. 2020, 11, 5. [Google Scholar] [CrossRef] [PubMed]
  6. Bakas, S.; Reyes, M.; Jakab, A.; Smith, J.; Johnson, R.; Lee, C.; Chen, L.; Zhao, X.; Wang, Y.; Li, Z.; et al. BraTS 2020: Prediction of Survival and Pseudoprogression. In Proceedings of the MICCAI 2020, Lima, Peru, 4–8 October 2020. [Google Scholar] [CrossRef]
  7. Chougule, A.G.; Srinivasan, S.; Mathivanan, P.; Mathivanan, S.K.; Shah, M.A. Robust brain tumor classification by fusion of deep learning and channel-wise attention mode approach. BMC Med. Imaging 2023, 24, 147. [Google Scholar]
  8. Shi, P.; Qiu, J.; Abaxi, S.M.D.; Wei, H.; Lo, F.P.W.; Yuan, W. Generalist Vision Foundation Models for Medical Imaging: A Case Study of Segment Anything Model on Zero-Shot Medical Segmentation. arXiv 2023, arXiv:2304.12637. [Google Scholar] [CrossRef] [PubMed]
  9. Xiong, X.; Wu, Z.; Tan, S.; Li, W.; Tang, F.; Chen, Y.; Li, S.; Ma, J.; Li, G. SAM2-UNet: Segment Anything 2 Makes Strong Encoder for Natural and Medical Image Segmentation. arXiv 2024, arXiv:2408.08870. [Google Scholar]
  10. Ronneberger, O.; Fischer, P.; Brox, T. U-Net: Convolutional Networks for Biomedical Image Segmentation; Springer International Publishing: Berlin/Heidelberg, Germany, 2015; pp. 234–241. [Google Scholar] [CrossRef]
  11. Ellis, D.; Aizenberg, M. Trialing U-Net Training Modifications for Segmenting Gliomas Using Open Source Deep Learning Framework. In Brainlesion: Glioma, Multiple Sclerosis, Stroke and Traumatic Brain Injuries; Springer: Berlin/Heidelberg, Germany, 2021; pp. 31–39. [Google Scholar] [CrossRef]
  12. Banerjee, S.; Mitra, S.; Shankar, B.U. Multi-planar Spatial-ConvNet for Segmentation and Survival Prediction in Brain Cancer. In Brainlesion: Glioma, Multiple Sclerosis, Stroke and Traumatic Brain Injuries; Crimi, A., Smith, J., Johnson, R., Lee, C., Zhao, X., Wang, Y., Li, Z., Brown, T., Green, P., White, D., Eds.; Springer: Berlin/Heidelberg, Germany, 2019; pp. 94–104. [Google Scholar]
  13. Feng, X.; Tustison, N.J.; Patel, S.H.; Meyer, C.H. Brain Tumor Segmentation Using an Ensemble of 3D U-Nets and Overall Survival Prediction Using Radiomic Features. In Brainlesion: Glioma, Multiple Sclerosis, Stroke and Traumatic Brain Injuries; Crimi, A., Smith, J., Johnson, R., Lee, C., Zhao, X., Wang, Y., Li, Z., Brown, T., Green, P., White, D., Eds.; Springer: Berlin/Heidelberg, Germany, 2019; pp. 279–288. [Google Scholar]
  14. Weninger, L.; Rippel, O.; Koppers, S.; Merhof, D. Segmentation of Brain Tumors and Patient Survival Prediction: Methods for the BraTS 2018 Challenge. In Lecture Notes in Computer Science; Springer: Berlin/Heidelberg, Germany, 2019; pp. 3–12. [Google Scholar]
  15. Jahangard, S.; Zangooei, M.H.; Shahedi, M. U-Net Based Architecture for an Improved Multiresolution Segmentation in Medical Images. arXiv 2020, arXiv:2007.08238. [Google Scholar]
  16. Isensee, F.; Jaeger, P.F.; Kohl, S.A.; Petersen, J.; Maier-Hein, K.H. nnU-Net: A self-configuring method for deep learning-based biomedical image segmentation. Nat. Methods 2021, 18, 203–211. [Google Scholar] [CrossRef] [PubMed]
  17. Ravi, N.; Gabeur, V.; Hu, Y.T.; Hu, R.; Ryali, C.; Ma, T.; Khedr, H.; Rädle, R.; Rolland, C.; Gustafson, L.; et al. SAM 2: Segment Anything in Images and Videos. arXiv 2024, arXiv:2408.00714. [Google Scholar]
  18. Liu, S.; Huang, D.; Wang, Y. Receptive Field Block Net for Accurate and Fast Object Detection. In Proceedings of the European Conference on Computer Vision (ECCV), Munich, Germany, 8–14 September 2018; pp. 385–400. [Google Scholar]
  19. Zhou, Z.; Siddiquee, M.; Tajbakhsh, N.; Liang, J. UNet++: Redesigning Skip Connections to Exploit Multiscale Features in Image Segmentation. IEEE Trans. Med. Imaging 2019, 39, 1856–1867. [Google Scholar] [CrossRef] [PubMed]
  20. Fan, D.P.; Ji, G.P.; Zhou, T.; Chen, G.; Fu, H.; Shen, J.; Shao, L. PraNet: Parallel Reverse Attention Network for Polyp Segmentation. In Proceedings of the MICCAI, Lima, Peru, 4–8 October 2020; Springer: Berlin/Heidelberg, Germany, 2020; pp. 263–273. [Google Scholar] [CrossRef]
  21. Qiu, Z.; Hu, Y.; Li, H.; Liu, J. Learnable ophthalmology SAM. arXiv 2023, arXiv:2304.13425. [Google Scholar]
  22. Dice, L.R. Measures of the Amount of Ecologic Association Between Species. Ecology 1945, 26, 297–302. [Google Scholar] [CrossRef]
  23. Milliman. Evaluating supervised machine learning classification models in healthcare. Milliman Res. Rep. 2022, 12, 45–58. [Google Scholar]
  24. Willmott, C.J.; Matsuura, K. Some Comments on the Evaluation of Model Performance. J. Climatol. 2005, 25, 637–655. [Google Scholar] [CrossRef]
Figure 1. Magnetic resonance imaging scans showing T1, T1ce, T2, and T2-FLAIR modalities.
Applsci 15 03267 g001
Figure 2. Axial slices at index 95/155 for patient 355. Images are shown for T1, T1ce, T2, and T2-FLAIR modalities, respectively.
Applsci 15 03267 g002
Figure 3. Visual representation of data distribution showing an 8:2 ratio for training and test sets.
Applsci 15 03267 g003
Figure 4. Representation of 155 different slices of the T1 modality.
Applsci 15 03267 g004
Figure 5. Ground-truth labels of slice number 95 for each region of NT (non-tumor), NET (non-enhancing tumor), ED (edema), and GD (gadolinium-enhancing tumor).
Applsci 15 03267 g005
Figure 6. Ground-truth label for slice number 95.
Applsci 15 03267 g006
Figure 7. (a) The collection of all the modalities of data for a patient, containing the following modalities: T1, T1ce, T2, and FLAIR. (b) The ground-truth segmentation mask related to the patient. (c) The FLAIR modality of the patient being passed into the algorithm that converts from 3D to 2D, where it converts the 3D data into a 2D image of type ’png’ (d). The same conversion with (e) to produce (f).
Applsci 15 03267 g007
Figure 8. Image showing the 2-dimensional representation of the 95th slice of the FLAIR modality for patient x, as well as the 2-dimensional representation of the 95th slice of the ground-truth segmentation mask.
Applsci 15 03267 g008
Figure 9. Segment Anything Model 2 architecture image depicting all the components of Segment Anything Model (SAM) 2, where the image is passed into the encoder for object detection; the feature embeddings generated by the encoder are then passed into the memory attention module and then to the memory encoder; and these feature maps, along with the mask decoder’s output, are stored in the memory bank.
Applsci 15 03267 g009
Figure 10. Illustration showing how lost segments can be re-segmented or masked using user prompts [17].
Applsci 15 03267 g010
Figure 11. UNet architecture. The image is depicting the architecture of the U-shaped network. This network is a collection of convolutional neural networks, max-pooling layers, and skip connections, along with the bottle neck as the base of the U network.
Applsci 15 03267 g011
Figure 12. SAM2-UNet architecture.
Applsci 15 03267 g012
Figure 13. SAM2-UNet model evaluation.
Applsci 15 03267 g013
Figure 14. Training loss graph depicts how the training loss was minimized over 30 epochs, wherein the model was iterated 250 times for each epoch. The training loss was minimized to 0.4% on the final epoch.
Applsci 15 03267 g014
Table 1. BraTS 2020 training, validation and test sets.
DatasetSizePercentage
Training29580%
Validation2910% [Train]
Testing7420%
Table 2. Hyperparameter settings.
ParameterValue
Pre-trained modelHiera
Epochs30
Learning rate 1 × 10 4
Weight decay 1 × 10 4
OptimizerAdamW
Batch size1
Table 3. Performance of the SAM2-UNet model across various metrics compared to other image segmentation models.
ModelmDicemIoUMAE
SAM2-Unet0.7710.5690.046
U-Net0.5630.3920.178
U-Net++0.6100.4390.167
Mask R-CNN0.7460.5710.094
DeepLabV30.7090.5490.062
ResUNet0.5910.4190.183
Disclaimer/Publisher’s Note: The statements, opinions and data contained in all publications are solely those of the individual author(s) and contributor(s) and not of MDPI and/or the editor(s). MDPI and/or the editor(s) disclaim responsibility for any injury to people or property resulting from any ideas, methods, instructions or products referred to in the content.

