
Multispectral Earth Polarization Observation Based on the Lagrange L1 Point of the Earth–Moon System


Abstract
1. Introduction
2. Polarization State and Observation Analysis
2.1. Polarization State
2.2. Overall Observation
2.3. Wavelength Selection
3. Design
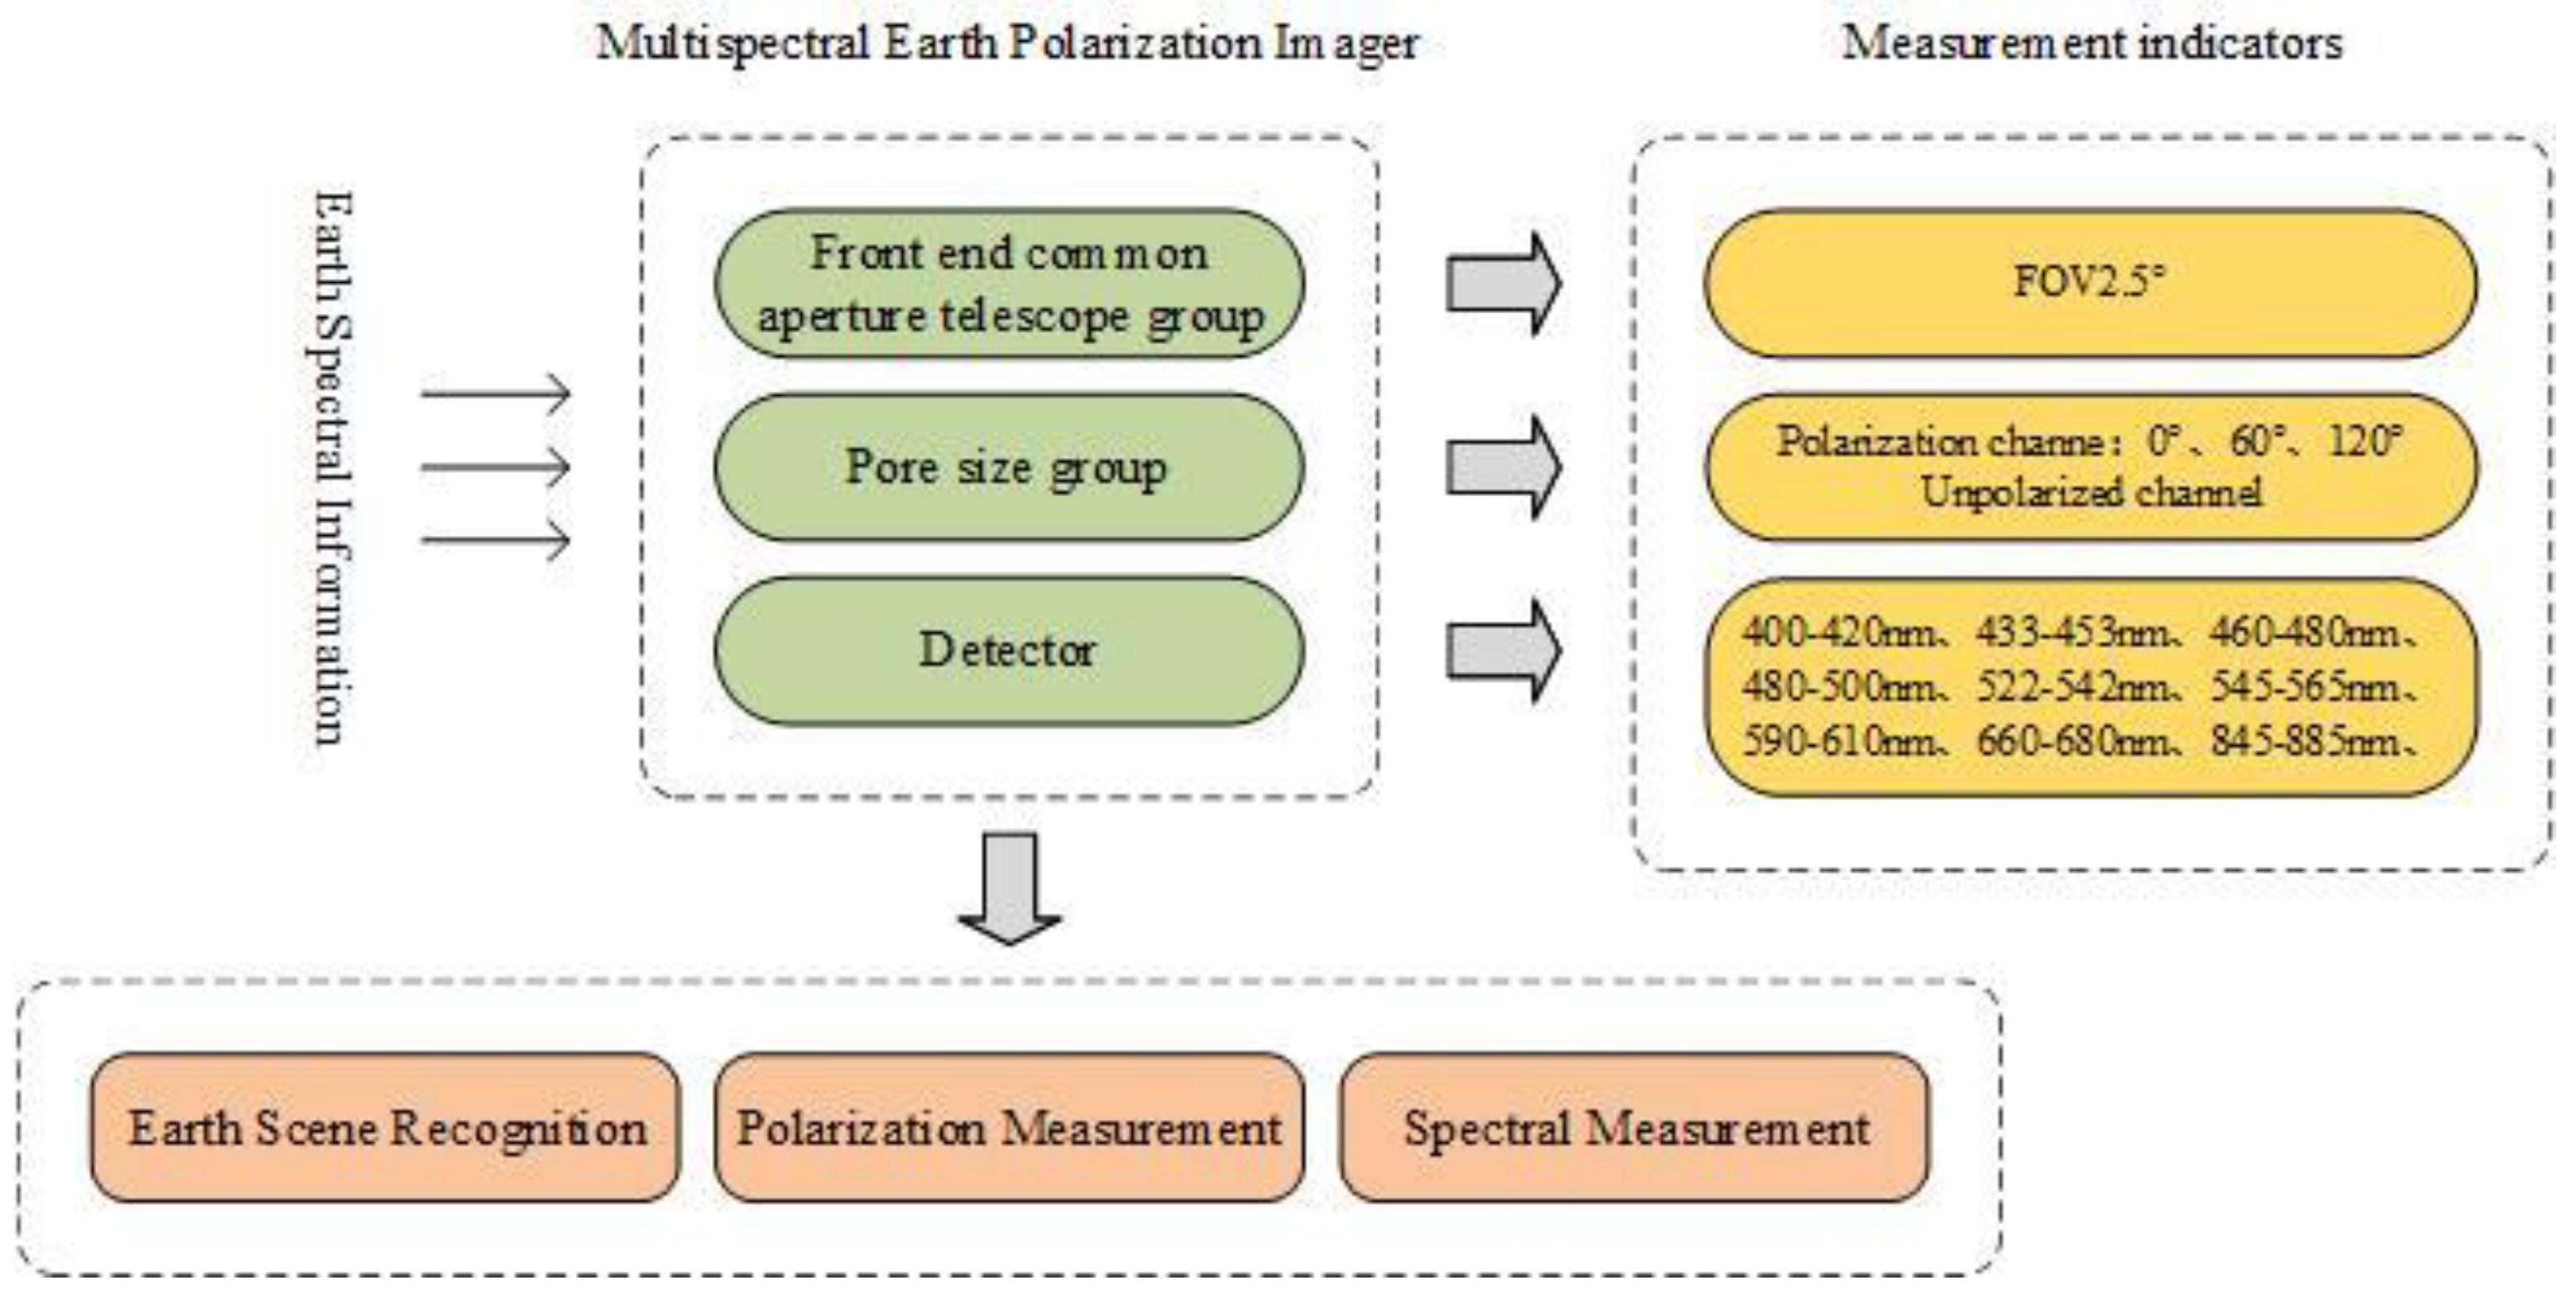
3.1. System Technical Requirements
3.1.1. Mosaic Coating
3.1.2. Scientific Requirements
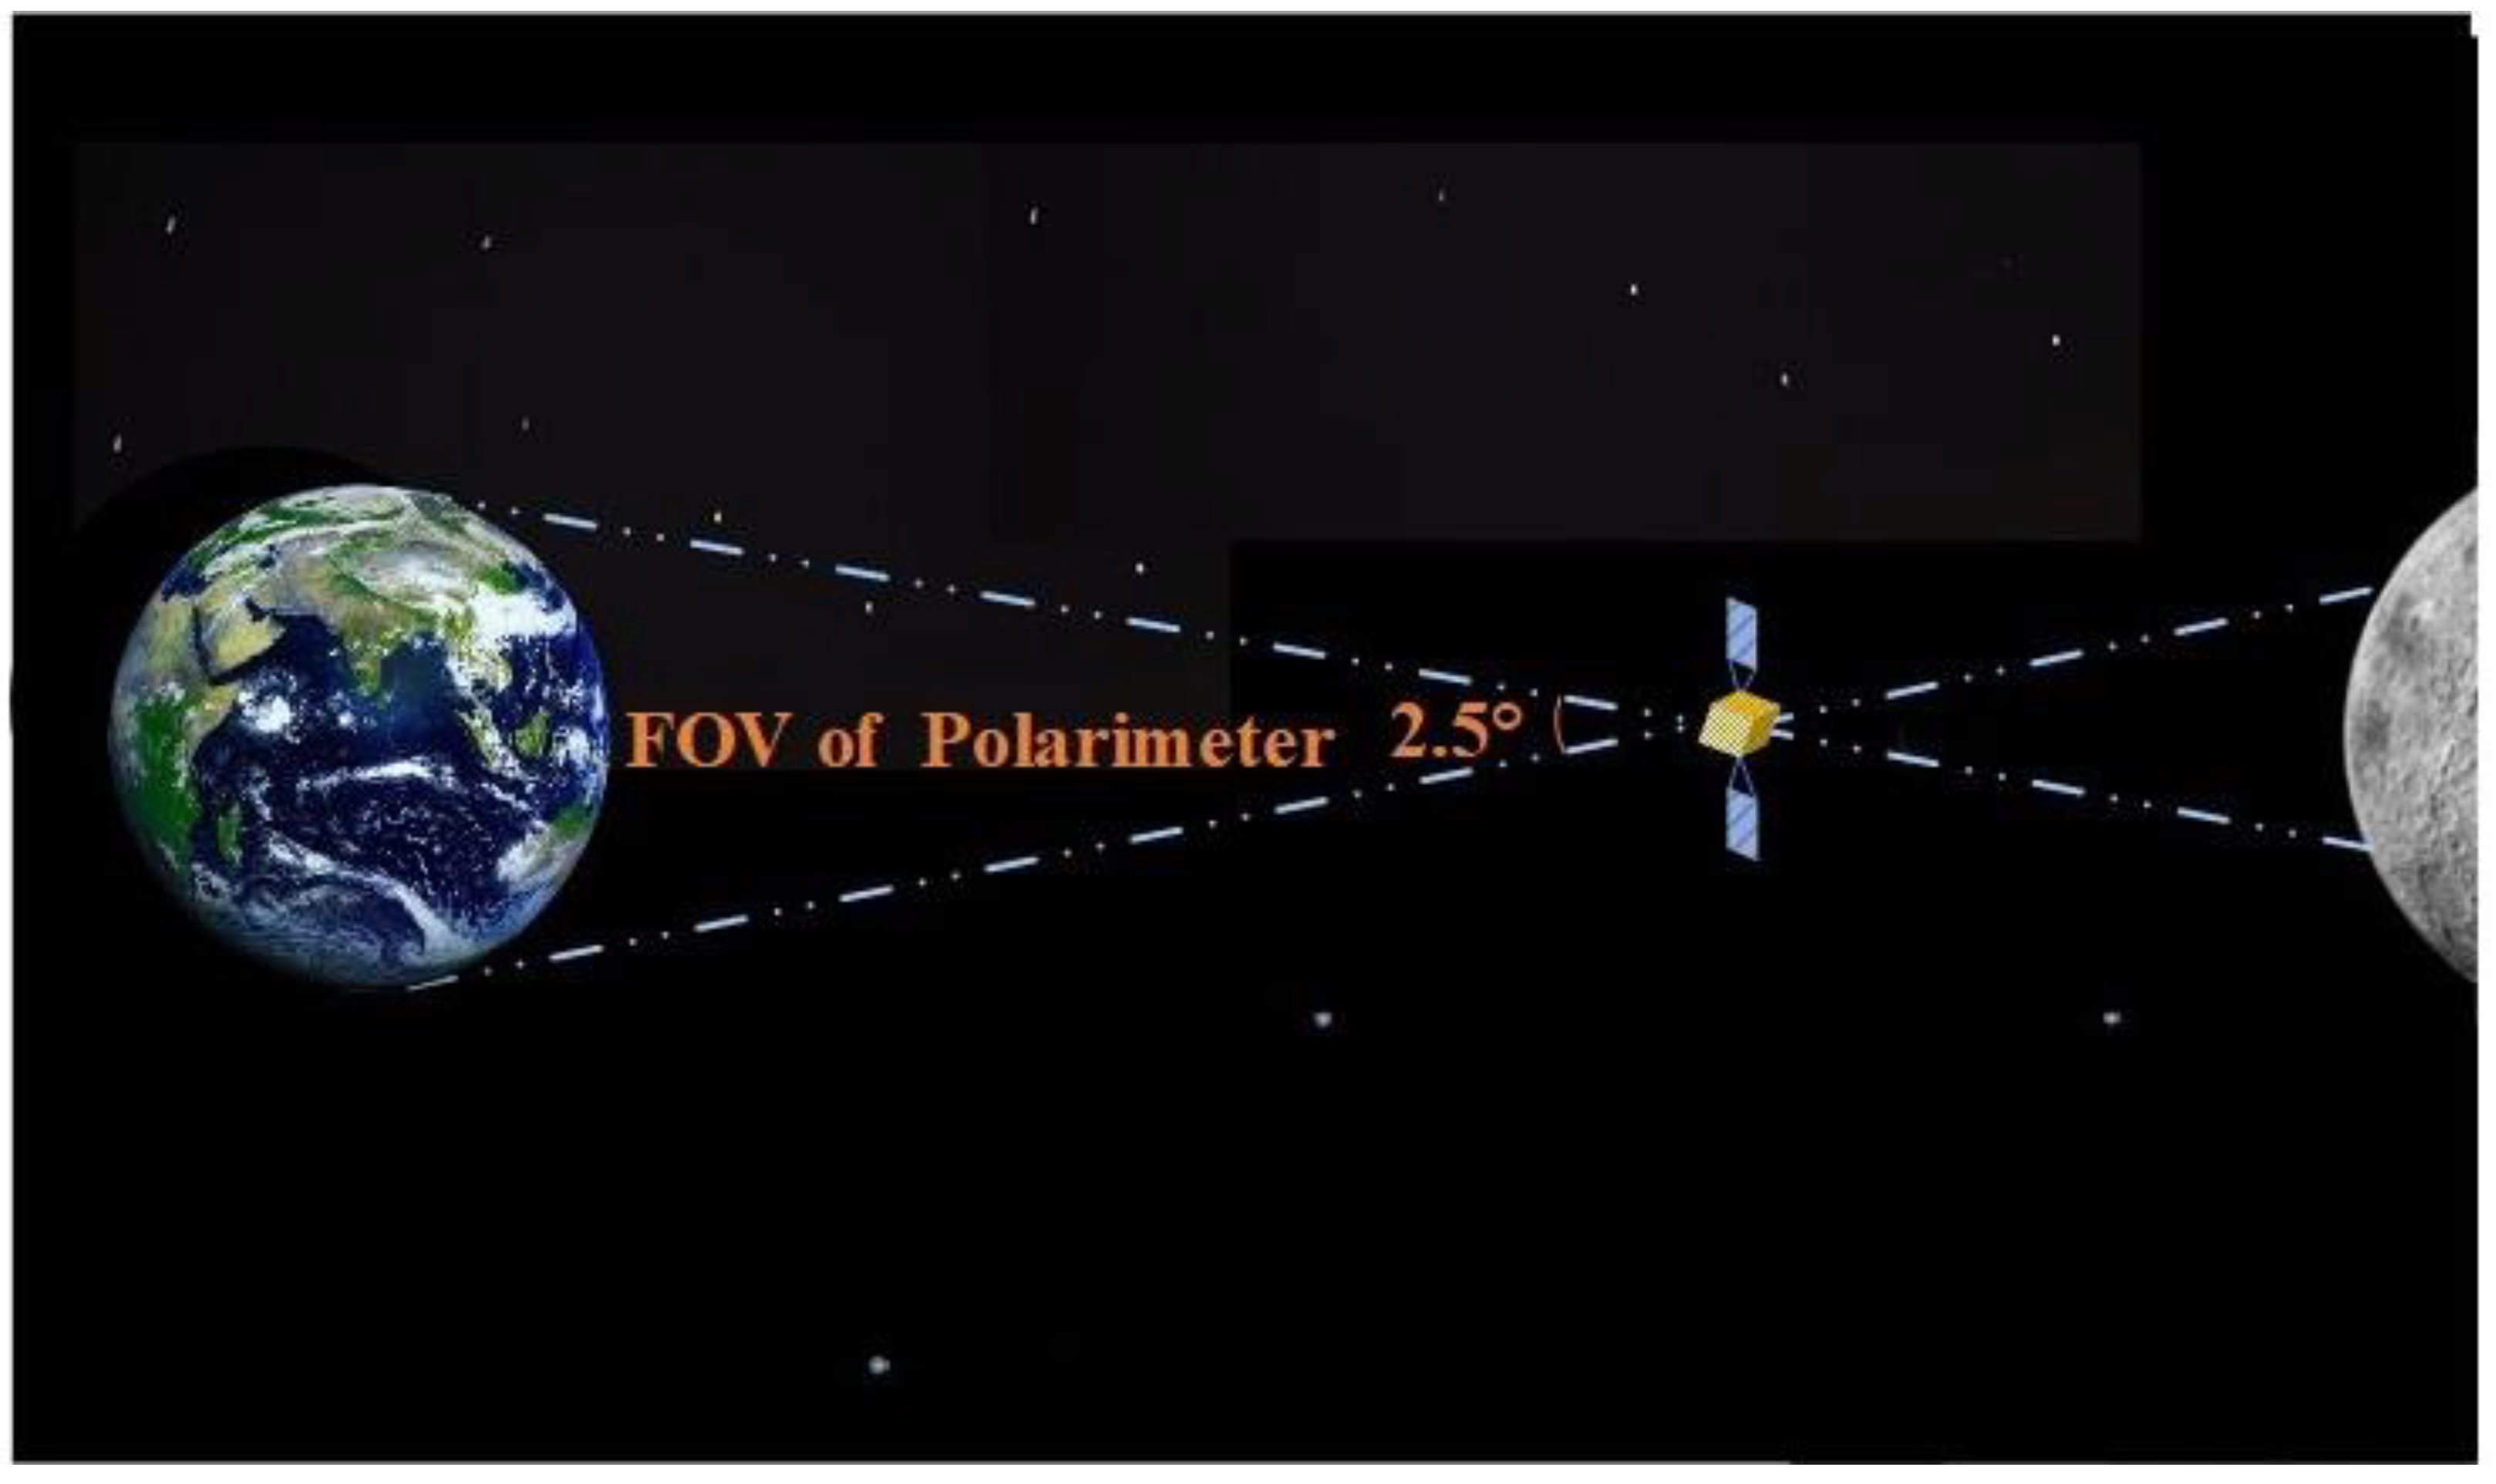
- The field of view (FOV) of the instrument should cover the entire Earth at the Earth–Moon system’s Lagrange point L1;
- The instrument measures the polarization of the whole Earth. Instantaneous imaging is applied to avoid losing climate change information during operation [14];
- The resolution is 10 km, which can distinguish between cloudy and clear sky scenes. It can be clearly imaged in nine spectral bands;
- The continental map is derived from the integrated signal of the disc, and the salient features such as vegetation, aerosol, and surface can be identified.
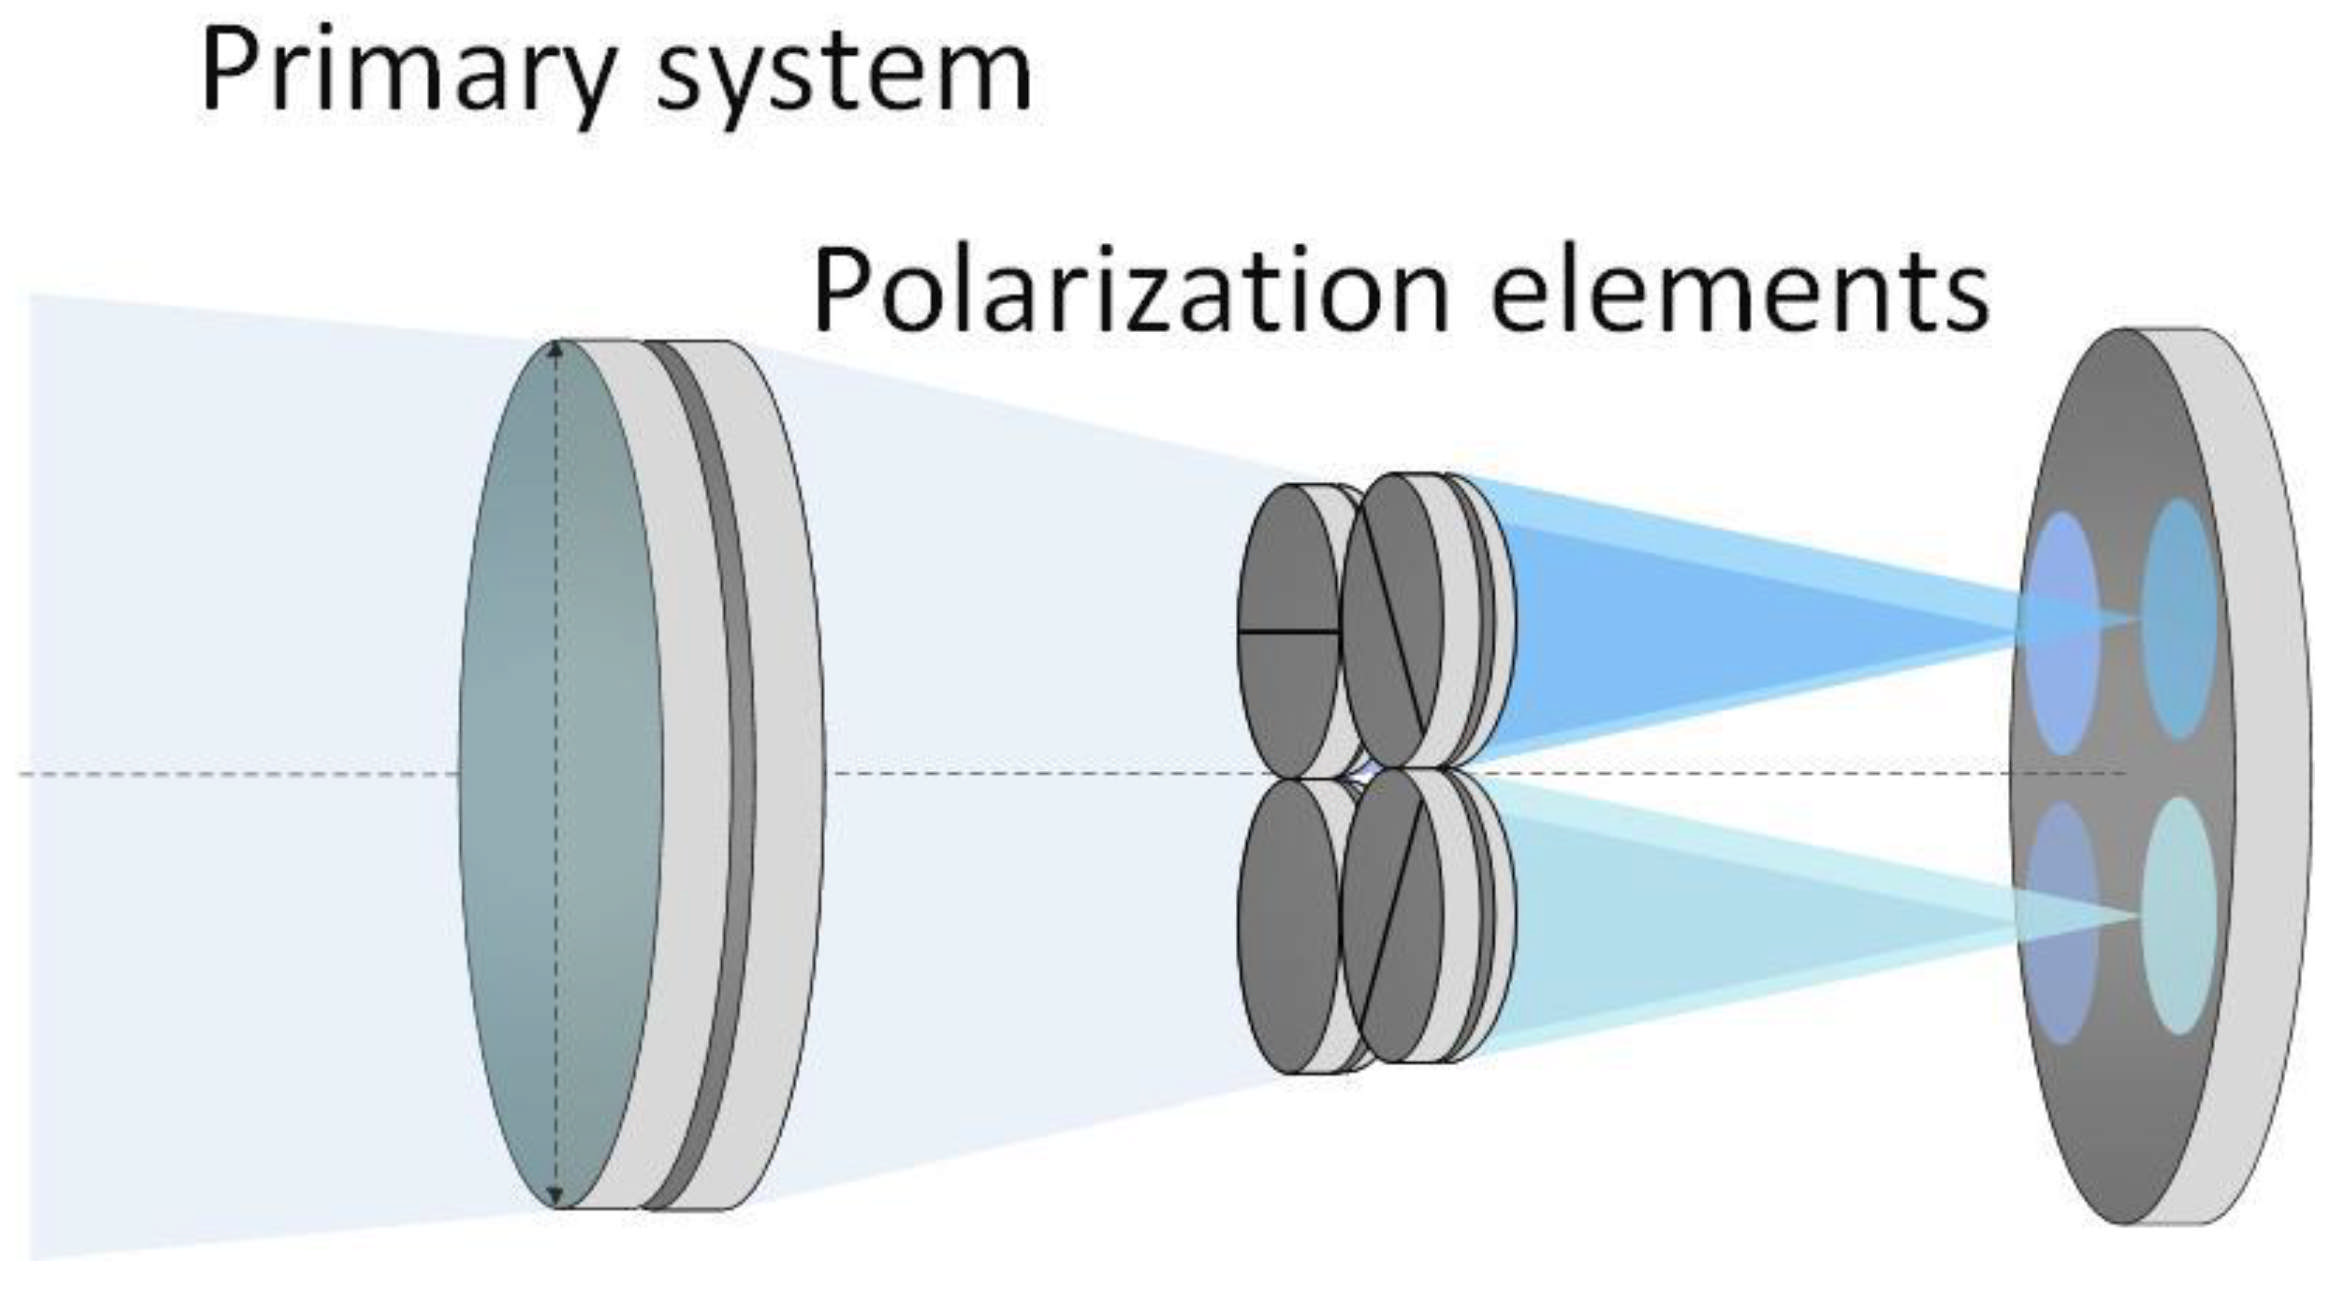
3.2. Optical Design of MEPI
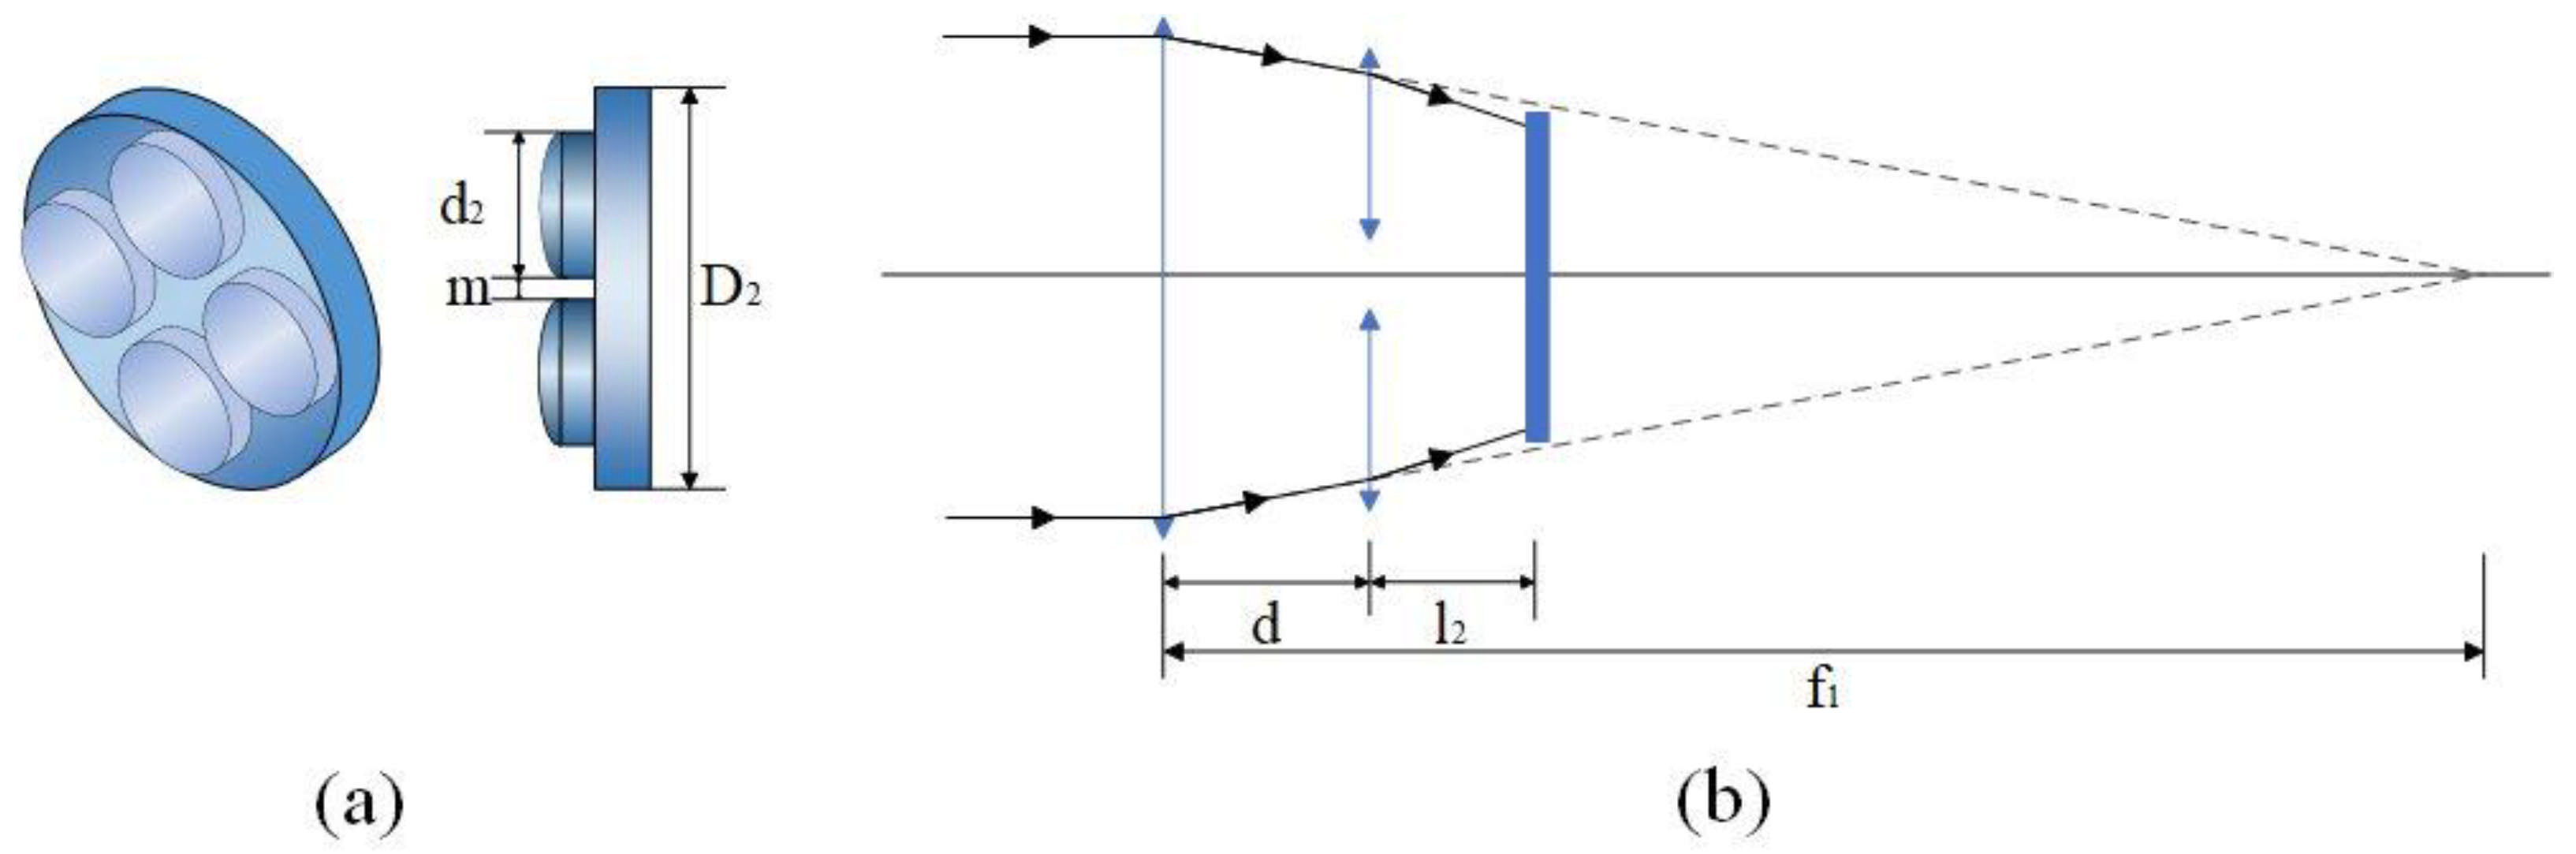
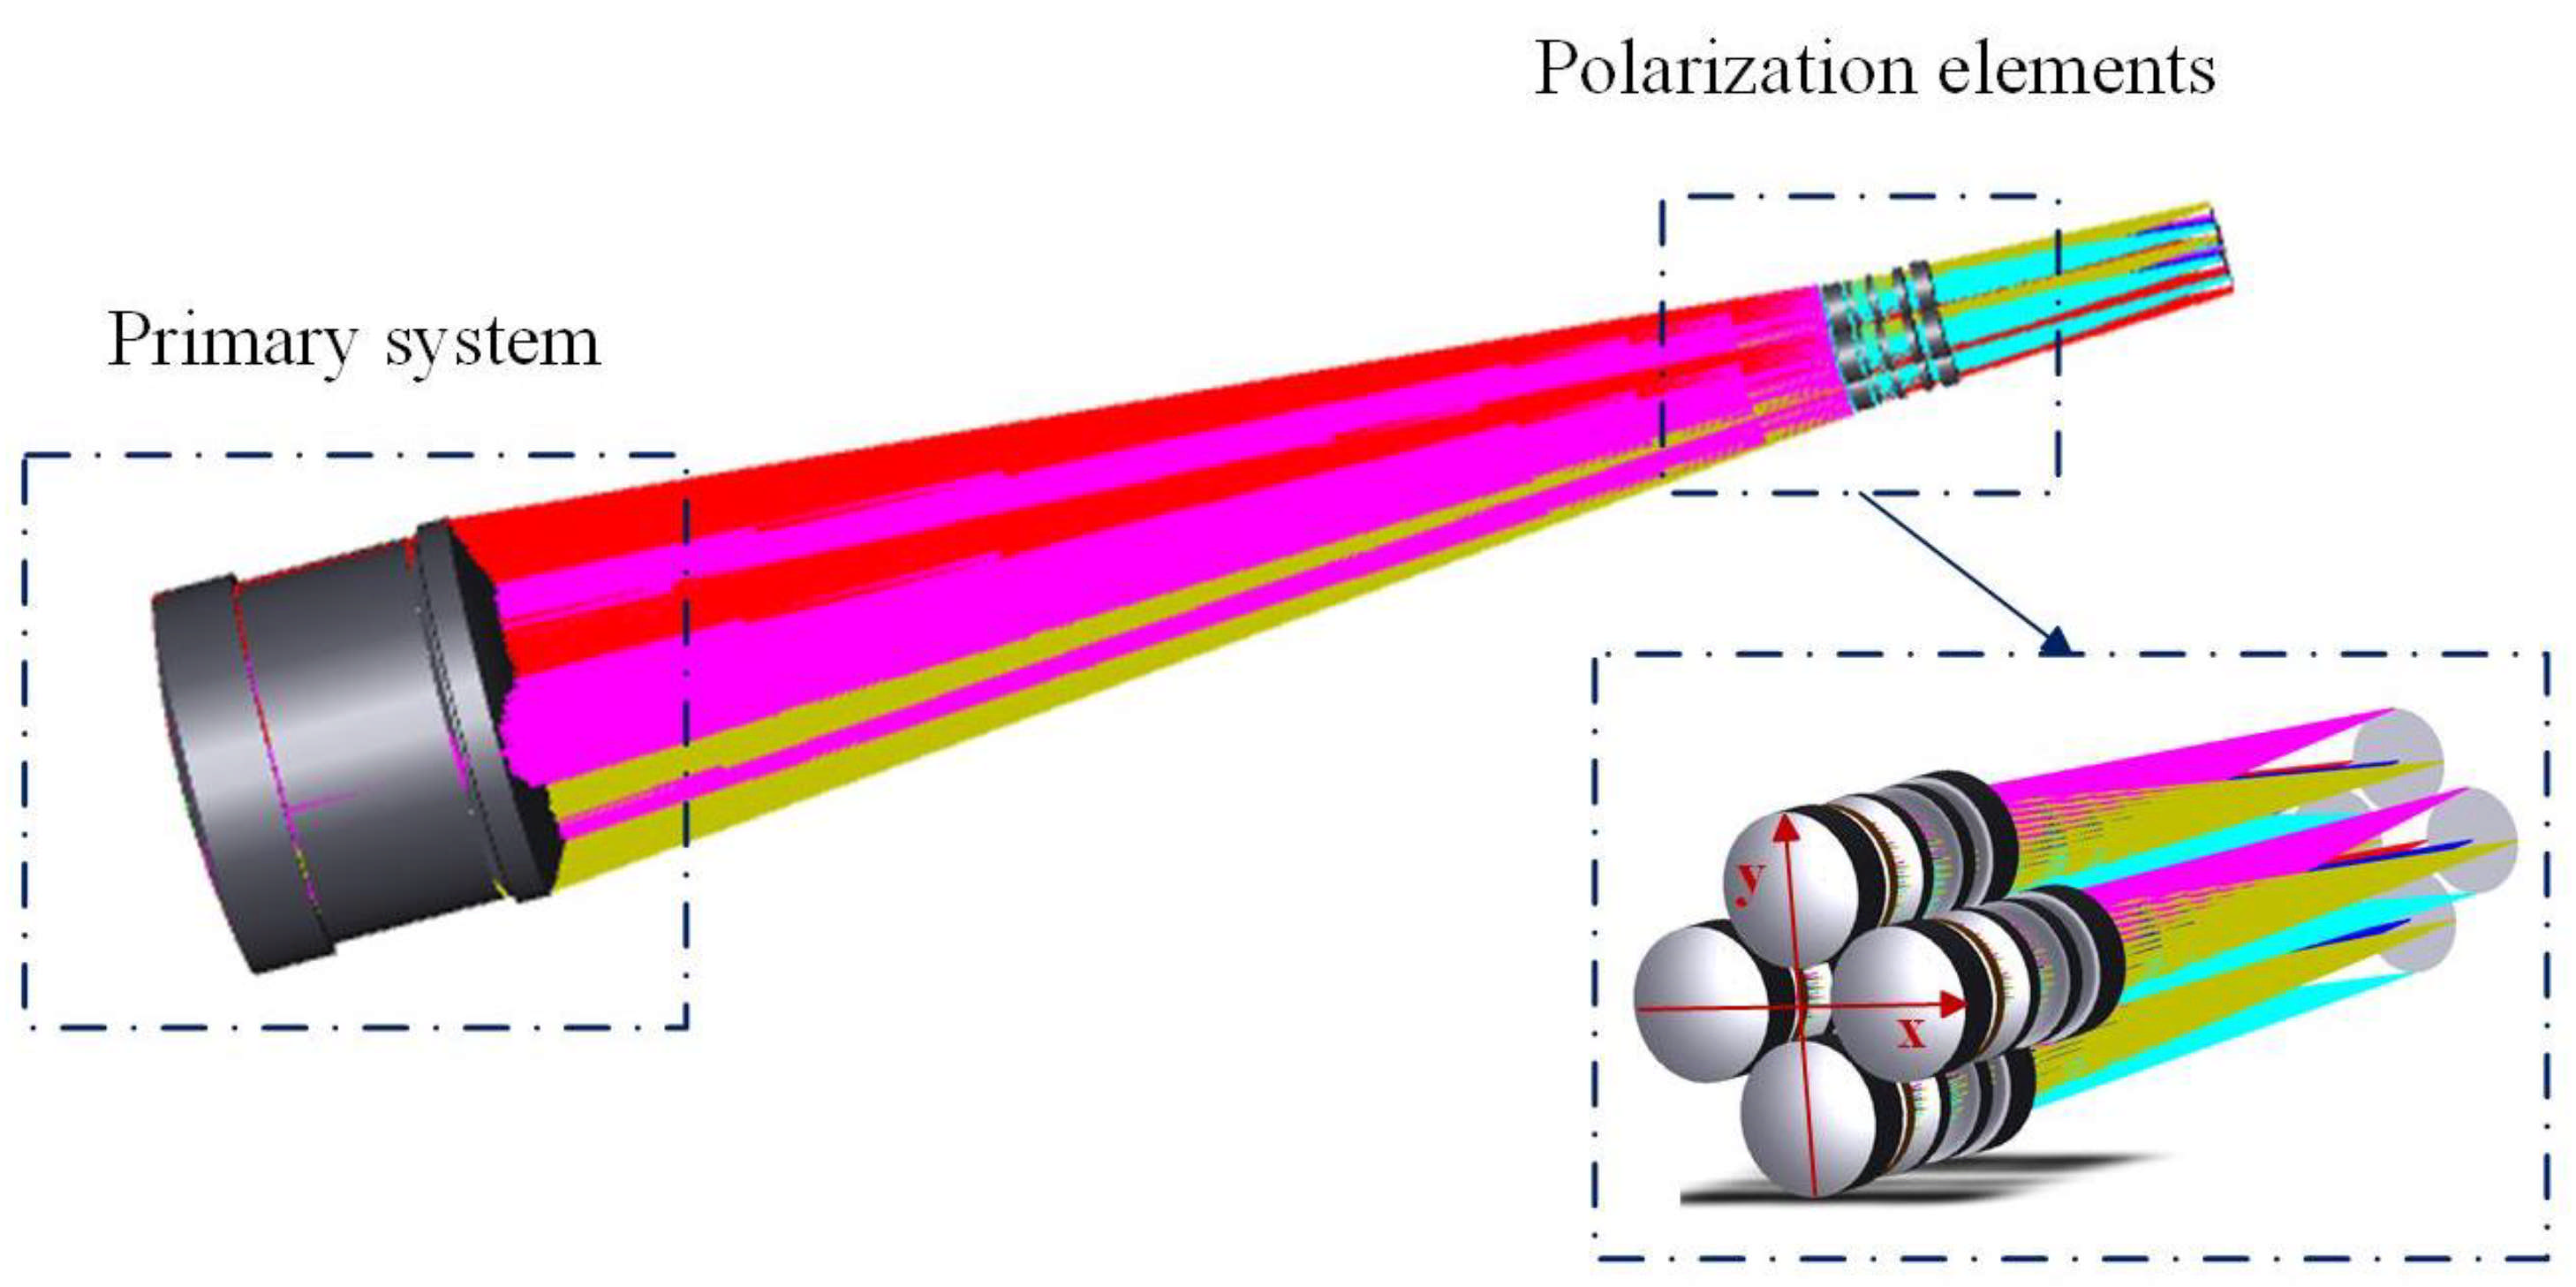
3.2.1. Design Approach
3.2.2. Result of Design
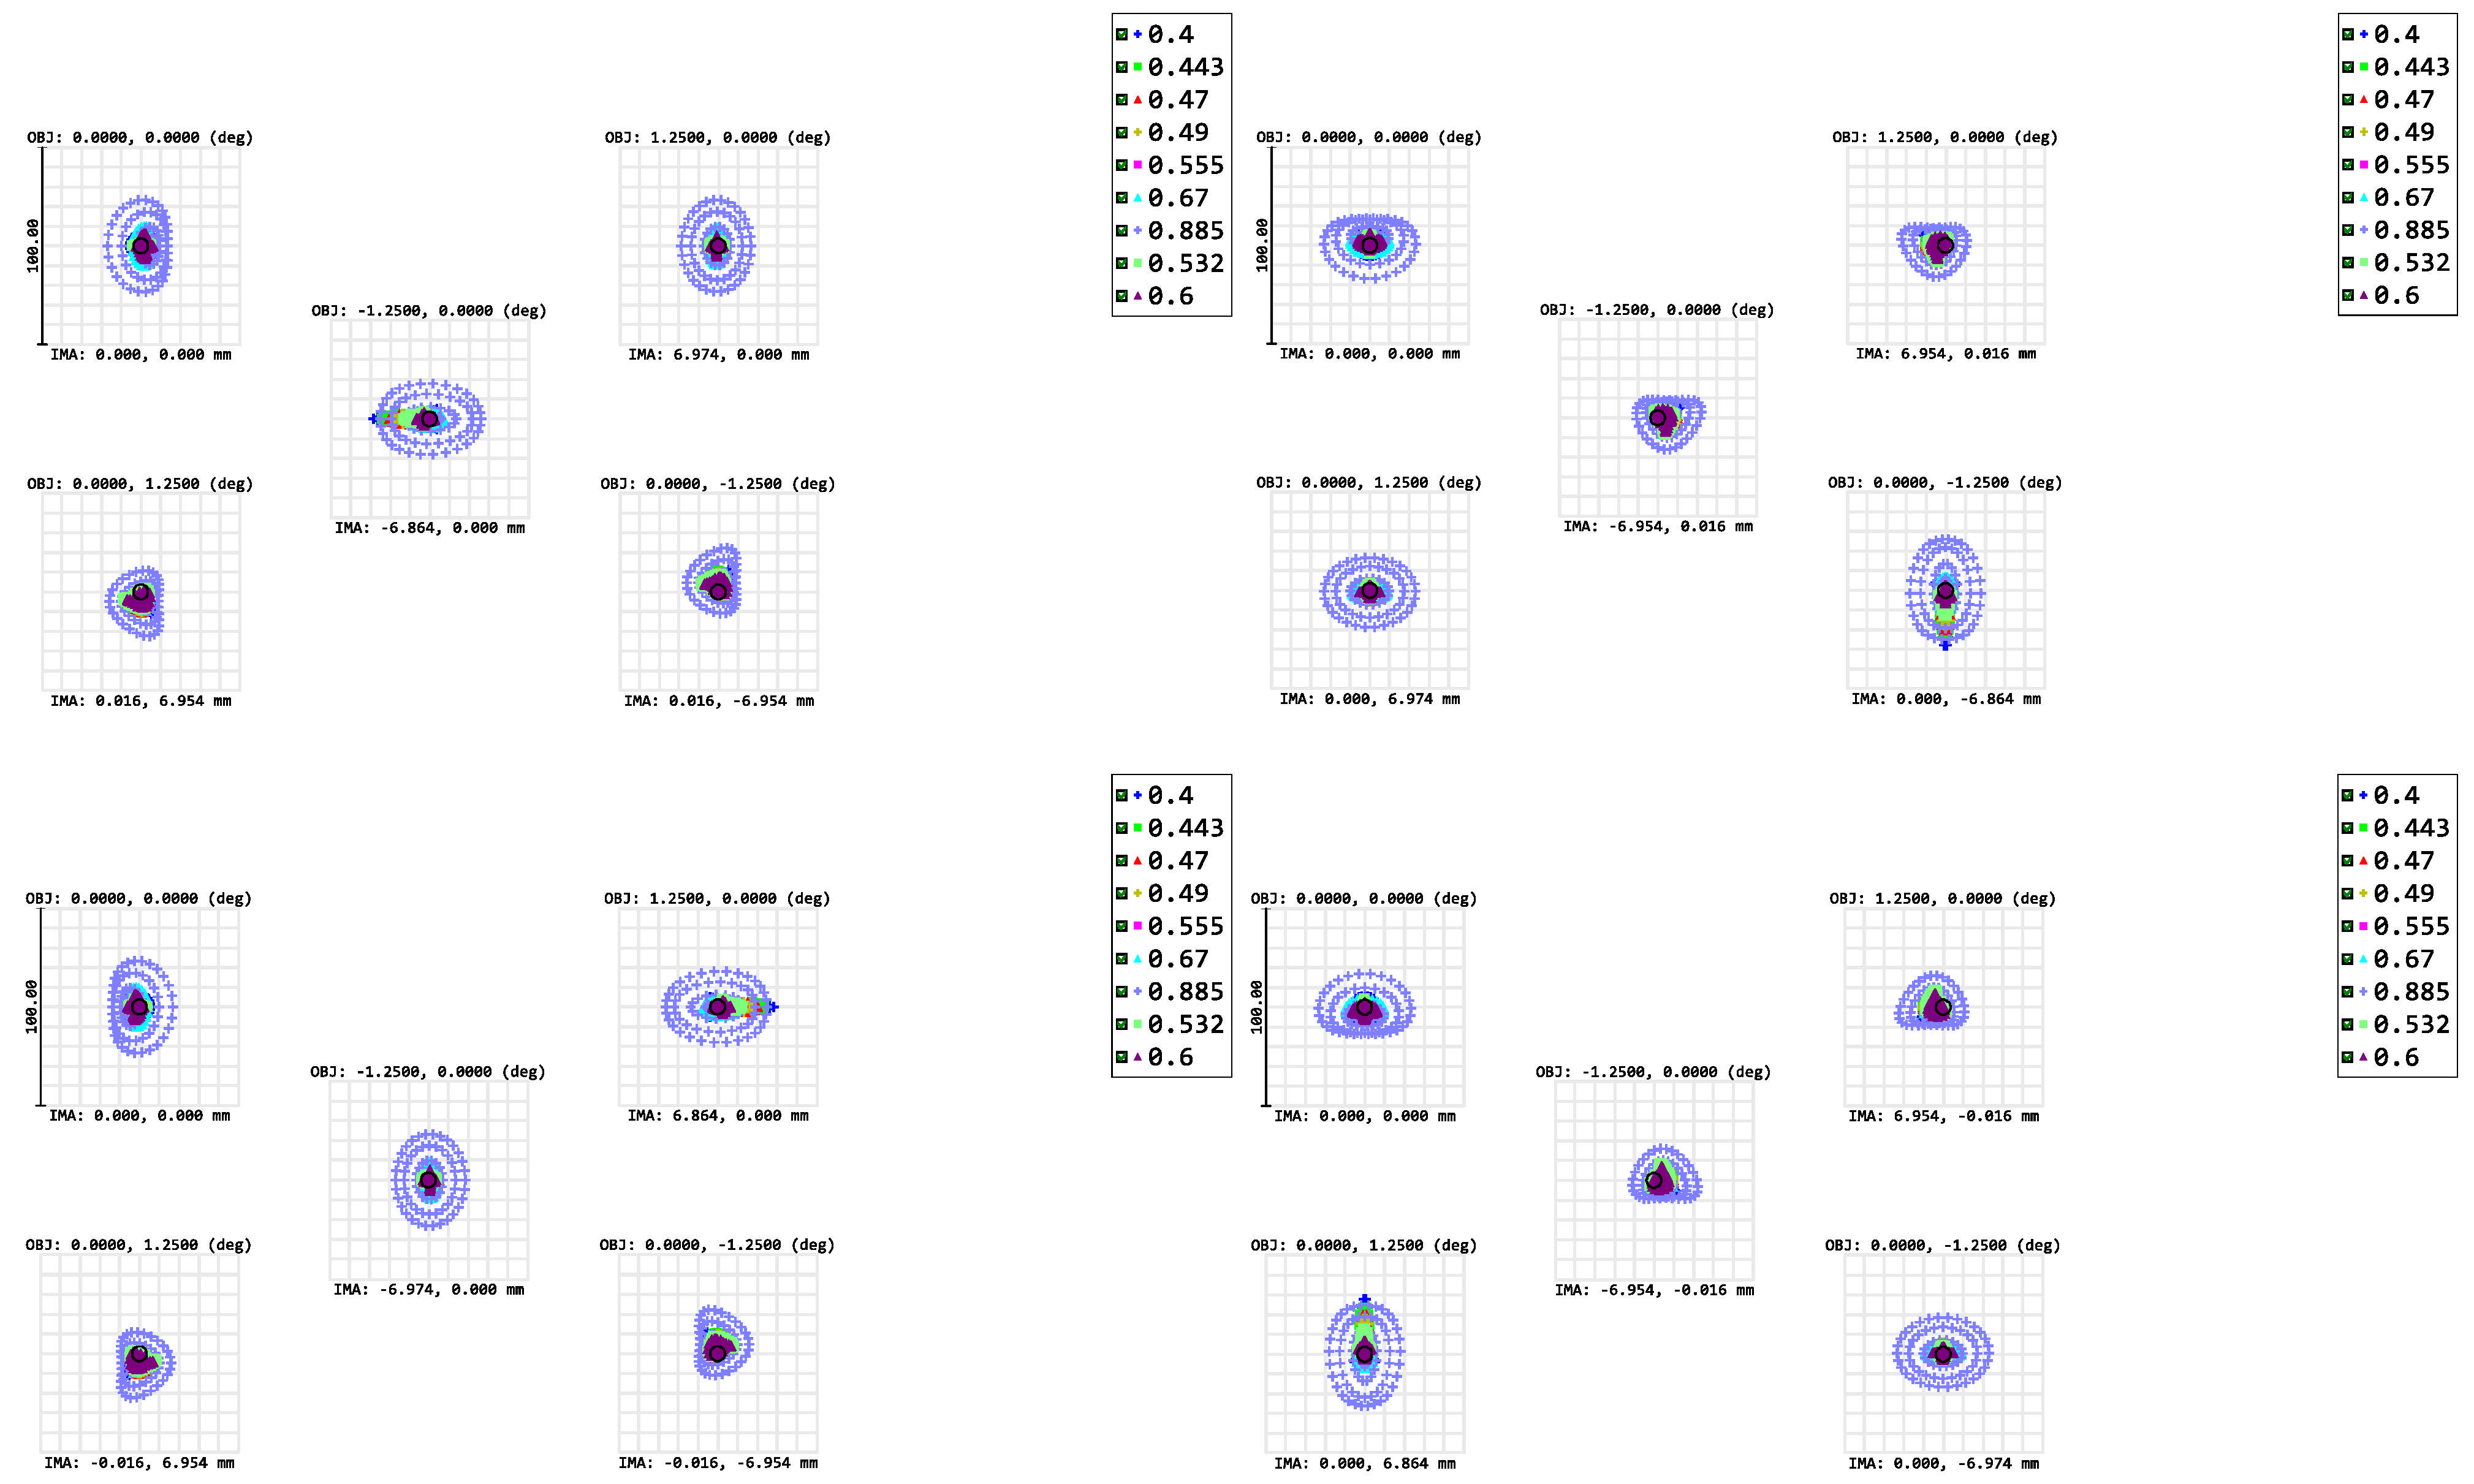
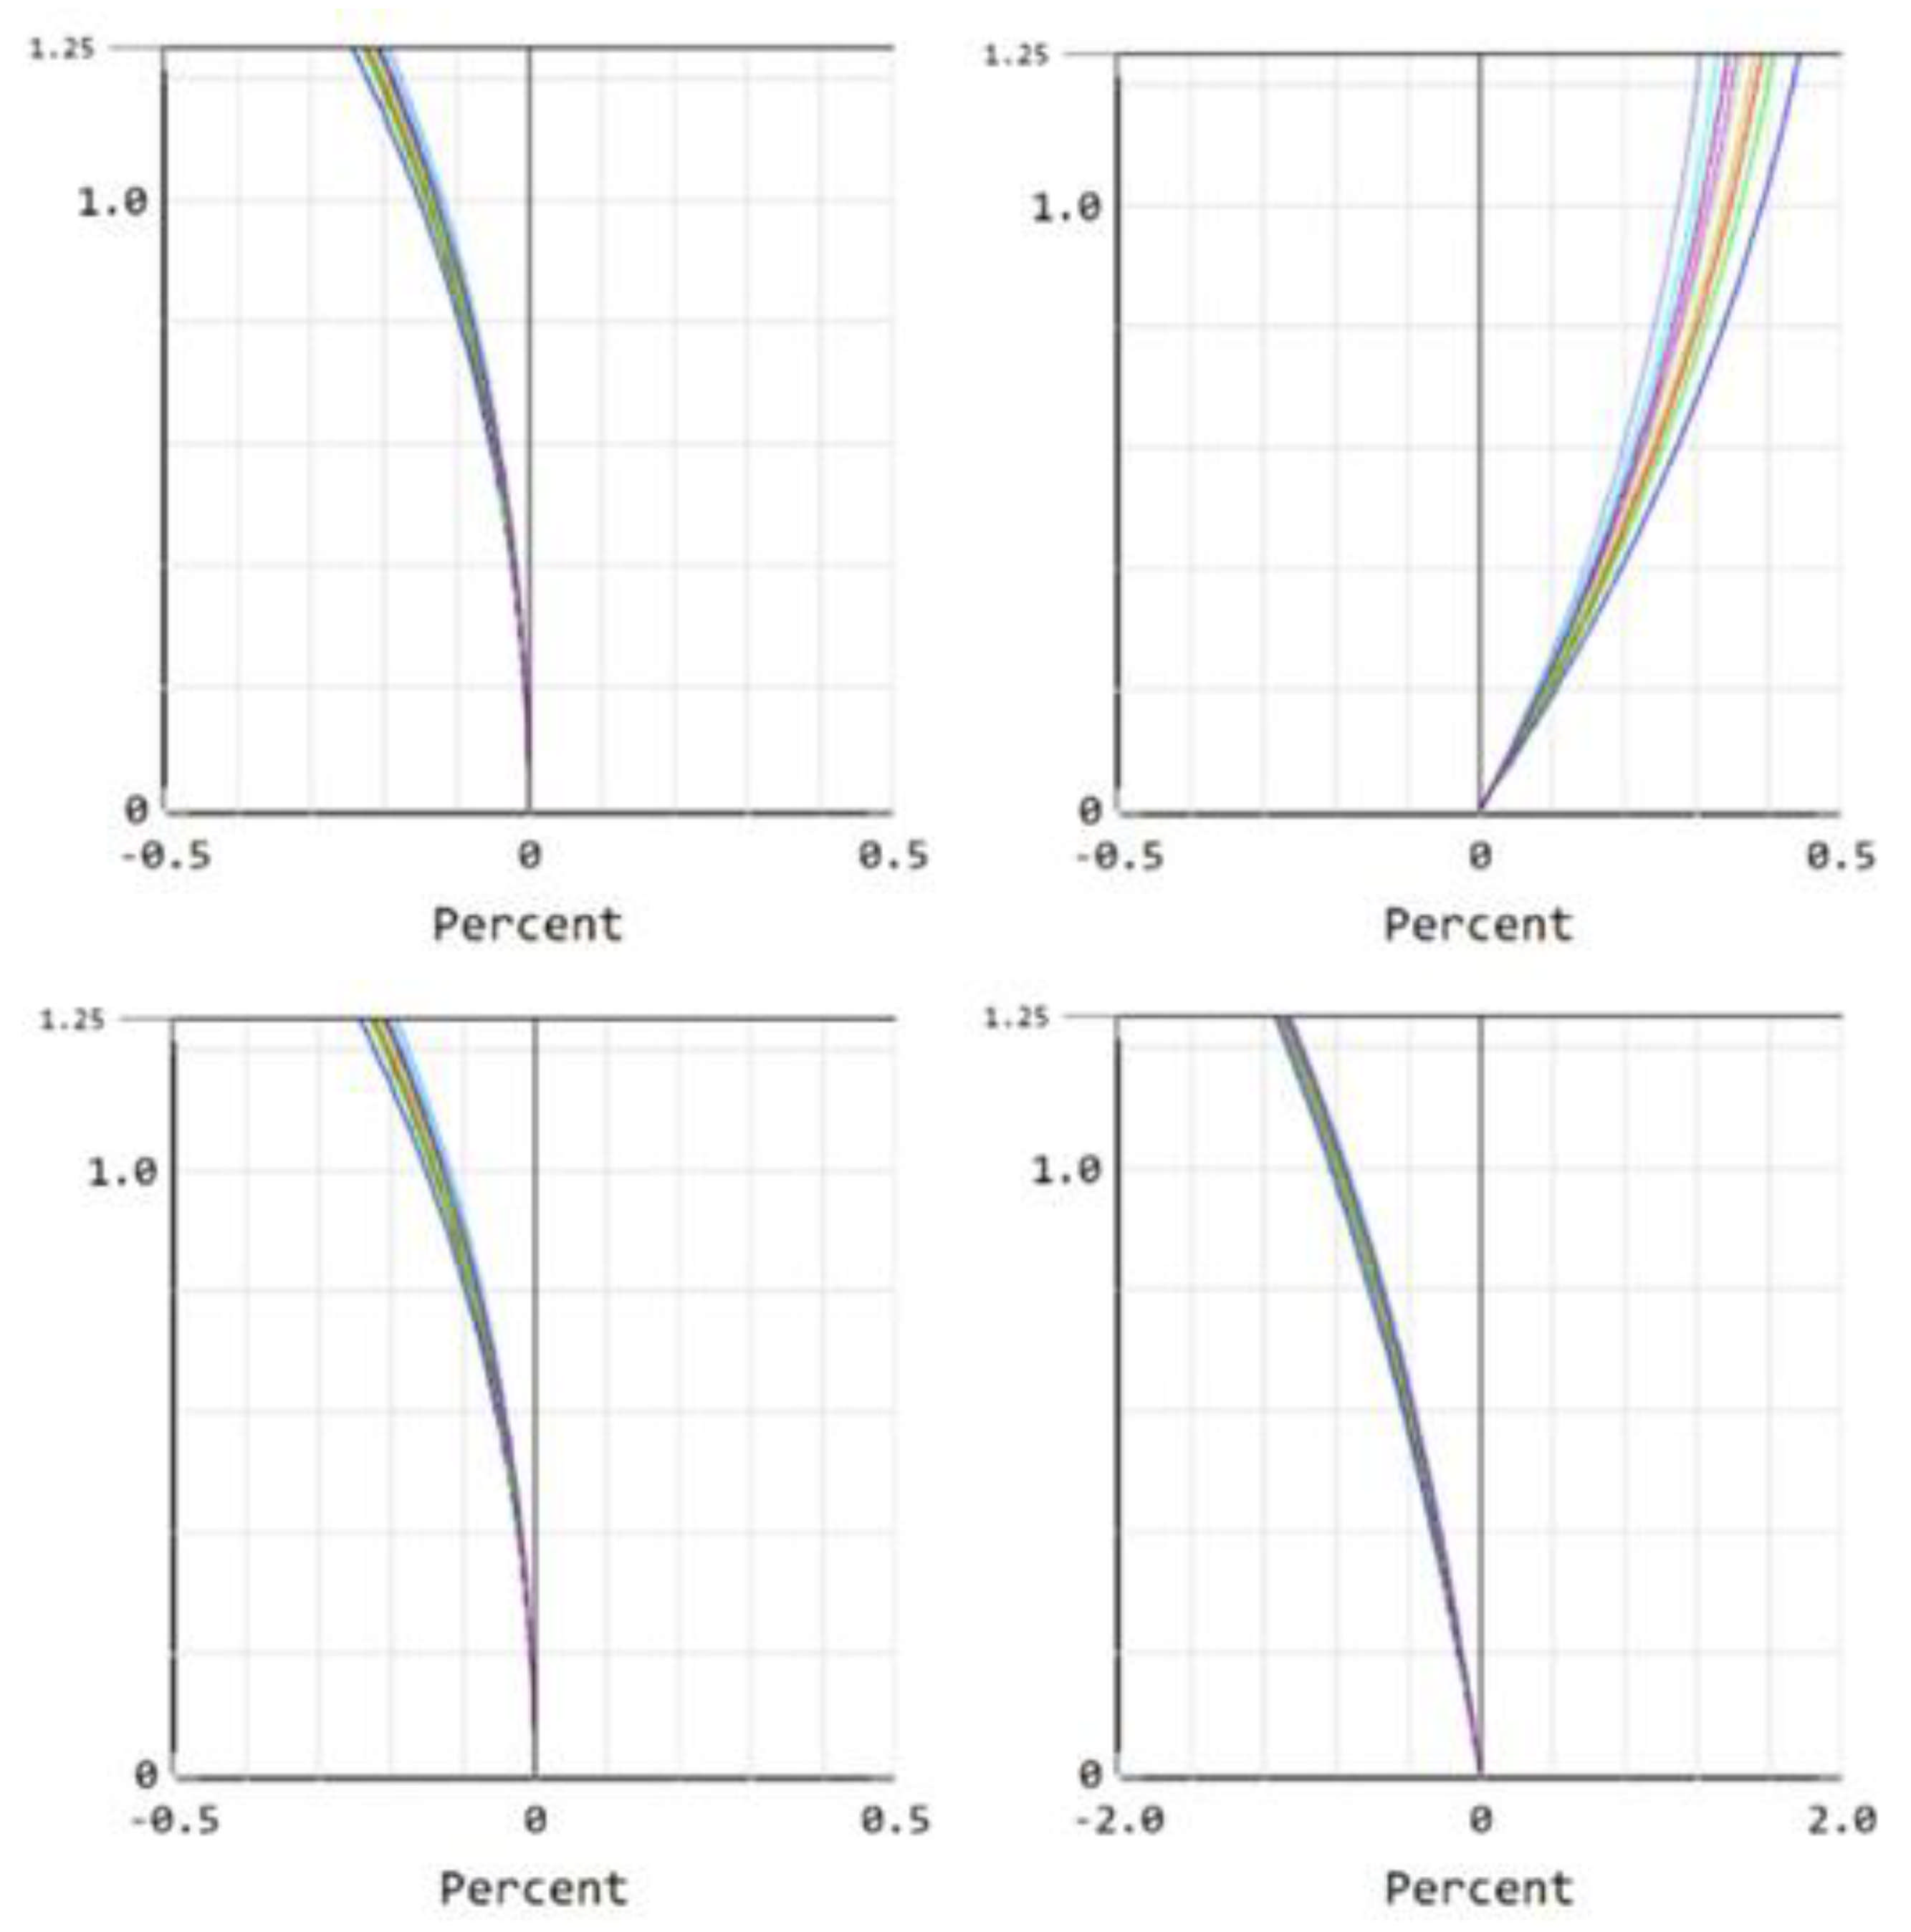
4. Optical Performance Display
5. Discussion
6. Conclusions
Author Contributions
Funding
Institutional Review Board Statement
Informed Consent Statement
Data Availability Statement
Conflicts of Interest
References
- Boyd, P.T.; Wilson, E.L.; Smale, A.P.; Supsinskas, P.; Livengood, T.A.; Hewagama, T.; Villanueva, G.L.; Marshak, A.; Krotkov, N.A.; Pokorny, P. Earthshine: Observing our world as an exoplanet from the surface of the moon. J. Astron. Telesc. Instrum. Syst. 2022, 8, 014003. [Google Scholar] [CrossRef]
- Zhang, J.; Shao, J.; Yan, C. Cloud and aerosol polarimetric imager. In Proceedings of the Selected Papers from Conferences of the Photoelectronic Technology Committee of the Chinese Society of Astronautics: Optical Imaging, Remote Sensing, and Laser-Matter Interaction, Suzhou, China, 21 February 2014. [Google Scholar]
- Stam, D. Spectropolarimetric signatures of earth-like extrasolar planets. Astron. Astrophys. 2008, 482, 989–1007. [Google Scholar] [CrossRef]
- Zhao, C.; Wang, K.; Li, S.; Ye, X.; Yi, X.; Jiang, Y.; Fang, W. Research on the Earth Reflected Solar Spectral Radiation Observation System Based on the Lagrange L1 Point of the Earth–Moon System. Remote Sens. 2025, 17, 28. [Google Scholar] [CrossRef]
- Wang, W.; Ping, J.; Zhang, W.; Wang, M.; Ye, H.; Han, X.; Kou, S. A New Method for Ground-Based Optical Polarization Observation of the Moon. Sensors 2024, 24, 2580. [Google Scholar] [CrossRef] [PubMed]
- Maharana, S.; Kiehlmann, S.; Blinov, D.; Pelgrims, V.; Pavlidou, V.; Tassis, K.; Kypriotakis, J.; Ramaprakash, A.; Anche, R.; Basyrov, A. Bright-Moon sky as a wide-field linear Polarimetric flat source for calibration. Astron. Astrophys. 2023, 679, A68. [Google Scholar] [CrossRef]
- Shkuratov, Y.; Opanasenko, N.; Zubko, E.; Grynko, Y.; Korokhin, V.; Pieters, C.; Videen, G.; Mall, U.; Opanasenko, A. Multispectral polarimetry as a tool to investigate texture and chemistry of lunar regolith particles. Icarus 2007, 187, 406–416. [Google Scholar] [CrossRef]
- Li, Z.; Hou, W.; Hong, J.; Zheng, F.; Luo, D.; Wang, J.; Gu, X.; Qiao, Y. Directional Polarimetric Camera (DPC): Monitoring aerosol spectral optical properties over land from satellite observation. J. Quant. Spectrosc. Radiat. Transf. 2018, 218, 21–37. [Google Scholar] [CrossRef]
- Snik, F.; Kochukhov, O.; Piskunov, N.; Rodenhuis, M.; Jeffers, S.; Keller, C.; Dolgopolov, A.; Stempels, E.; Makaganiuk, V.; Valenti, J. The HARPS polarimeter. arXiv 2010, arXiv:1010.0397. [Google Scholar]
- Deschamps, P.-Y.; Bréon, F.-M.; Leroy, M.; Podaire, A.; Bricaud, A.; Buriez, J.-C.; Seze, G. The POLDER mission: Instrument characteristics and scientific objectives. IEEE Trans. Geosci. Remote Sens. 1994, 32, 598–615. [Google Scholar] [CrossRef]
- Hubold, M.; Montag, E.; Berlich, R.; Brunner, R.; Brüning, R. Multi-aperture system approach for snapshot multispectral imaging applications. Opt. Express 2021, 29, 7361–7378. [Google Scholar] [CrossRef] [PubMed]
- Hansen, J.E.; Travis, L.D. Light scattering in planetary atmospheres. Space Sci. Rev. 1974, 16, 527–610. [Google Scholar] [CrossRef]
- Hovenier, J.W.; Van der Mee, C.V.; Domke, H. Transfer of Polarized Light in Planetary Atmospheres: Basic Concepts and Practical Methods; Springer Science & Business Media: Berlin/Heidelberg, Germany, 2014; Volume 318. [Google Scholar]
- Zhang, H.; Ye, X.; Wang, Y.; Wu, D.; Yang, D.; Fang, W. Aperture division multispectral camera for the Earth’s reflected solar radiation observation based on the Lagrange L1 point of the Earth-Moon system. Opt. Express 2023, 31, 38077–38096. [Google Scholar] [CrossRef] [PubMed]
- Zhang, H.; Ye, X.; Zhu, P.; Fang, W.; Wang, Y. Observation system design and analysis for a new staring Earth radiation budget radiometer based on the Lagrange L1 point of the Earth–Moon system. Remote Sens. 2022, 14, 1596. [Google Scholar] [CrossRef]
- Dubovik, O.; Li, Z.; Mishchenko, M.I.; Tanré, D.; Karol, Y.; Bojkov, B.; Cairns, B.; Diner, D.J.; Espinosa, W.R.; Goloub, P. Polarimetric remote sensing of atmospheric aerosols: Instruments, methodologies, results, and perspectives. J. Quant. Spectrosc. Radiat. Transf. 2019, 224, 474–511. [Google Scholar] [CrossRef]
- Si, Y.; Lu, Q.; Zhang, X.; Hu, X.; Wang, F.; Li, L.; Gu, S. A review of advances in the retrieval of aerosol properties by remote sensing multi-angle technology. Atmos. Environ. 2021, 244, 117928. [Google Scholar] [CrossRef]
- Geelen, B.; Tack, N.; Lambrechts, A. A compact snapshot multispectral imager with a monolithically integrated per-pixel filter mosaic. In Proceedings of the Advanced Fabrication Technologies for Micro/Nano Optics and Photonics VII, San Francisco, CA, USA, 7 March 2014; pp. 80–87. [Google Scholar]
- Lapray, P.-J.; Wang, X.; Thomas, J.-B.; Gouton, P. Multispectral Filter Arrays: Recent Advances and Practical Implementation. Sensors 2014, 14, 21626–21659. [Google Scholar] [CrossRef] [PubMed]
- Zeng, D.; Du, X. Influence of detector’s pixel size on performance of optical detection system. Chin. Space Sci. Technol. 2011, 31, 51–55. [Google Scholar]
- Stone, T.C.; Kieffer, H.; Lukashin, C.; Turpie, K. The Moon as a climate-quality radiometric calibration reference. Remote Sens. 2020, 12, 1837. [Google Scholar] [CrossRef]
- Venkatesulu, E.; Dabby, S.; Shaw, J.A. Disk-Averaged and Disk-Resolved Polarization of Moonlight Across Lunar Phases. In Proceedings of the Conference on Characterization and Radiometric Calibration for Remote Sensing (CALCON), Logan, UT, USA, 12 June 2023; Utah State University: Logan, UT, USA, 2023. [Google Scholar]
- Wilmer, A.P.; Bettinger, R.A.; Little, B.D. Cislunar Periodic Orbits for Earth–Moon L 1 and L 2 Lagrange Point Surveillance. J. Spacecr. Rocket. 2022, 59, 1809–1820. [Google Scholar] [CrossRef]
- Dahlke, J.A.; Wilmer, A.P.; Bettinger, R.A. Preliminary Comparative Assessment of L2 and L3 Surveillance Using Select Cislunar Periodic Orbits. In Proceedings of the AAS/AIAA Astrodynamics Specialist Conference, Charlotte, NC, USA, 7–10 August 2022; pp. 1–19. [Google Scholar]
- Atwell, W. Mitigation of space radiation effects. In Proceedings of APS March Meeting Abstracts; American Physical Society: College Park, MD, USA, 2012; p. Y10.001. [Google Scholar]
- Okafor, C.E.; Okonkwo, U.C.; Okokpujie, I.P. Trends in reinforced composite design for ionizing radiation shielding applications: A review. J. Mater. Sci. 2021, 56, 11631–11655. [Google Scholar] [CrossRef]


| Satellite/Sensor | Country | Band Center (nm) |
|---|---|---|
| DPC | China | 490; 670; 865 |
| APS | U.S.A. | 412; 443; 555; 672; 865; 910; 1370; 1610; 2200 |
| POSP | China | 380; 410; 443; 490; 670; 865 |
| 3MI | Eumetsat | 410; 443; 490; 555; 670; 865; 1370; 1650; 2130 |
| MAI | China | 560; 670; 865 |
| CAPI | Japan | 670; 1640 |
| HARP2 | NASA | 440; 550; 670; 870 |
| POLDER-1,2 | Japan | 443; 670; 865 |
| POLDER-3 | France | 490; 670; 865 |
| Band Center (nm) | Bandwidth (nm) | Main Purposes |
|---|---|---|
| 410 | 20 | Absorbent aerosol and ash cloud monitoring |
| 443 | 20 | Aerosol absorption and height, fine mode aerosol size, aerosol refractive index; cloud masking |
| 470 | 20 | Application of joint inversion of liquid water clouds and aerosol characteristics on clouds |
| 490 | 20 | Aerosols, clouds, sea color, surface albedo |
| 532 | 20 | Clouds and aerosols, vegetation |
| 555 | 20 | Surface albedo |
| 600 | 20 | Aerosol fine mode size distribution, cloud screening and characterization, vegetation |
| 670 | 20 | Clouds, aerosols, vegetation |
| 865 | 40 | Clouds, aerosols, vegetation, and surface characteristics |
| Parameter | Specification |
|---|---|
| Number of channels | 4 |
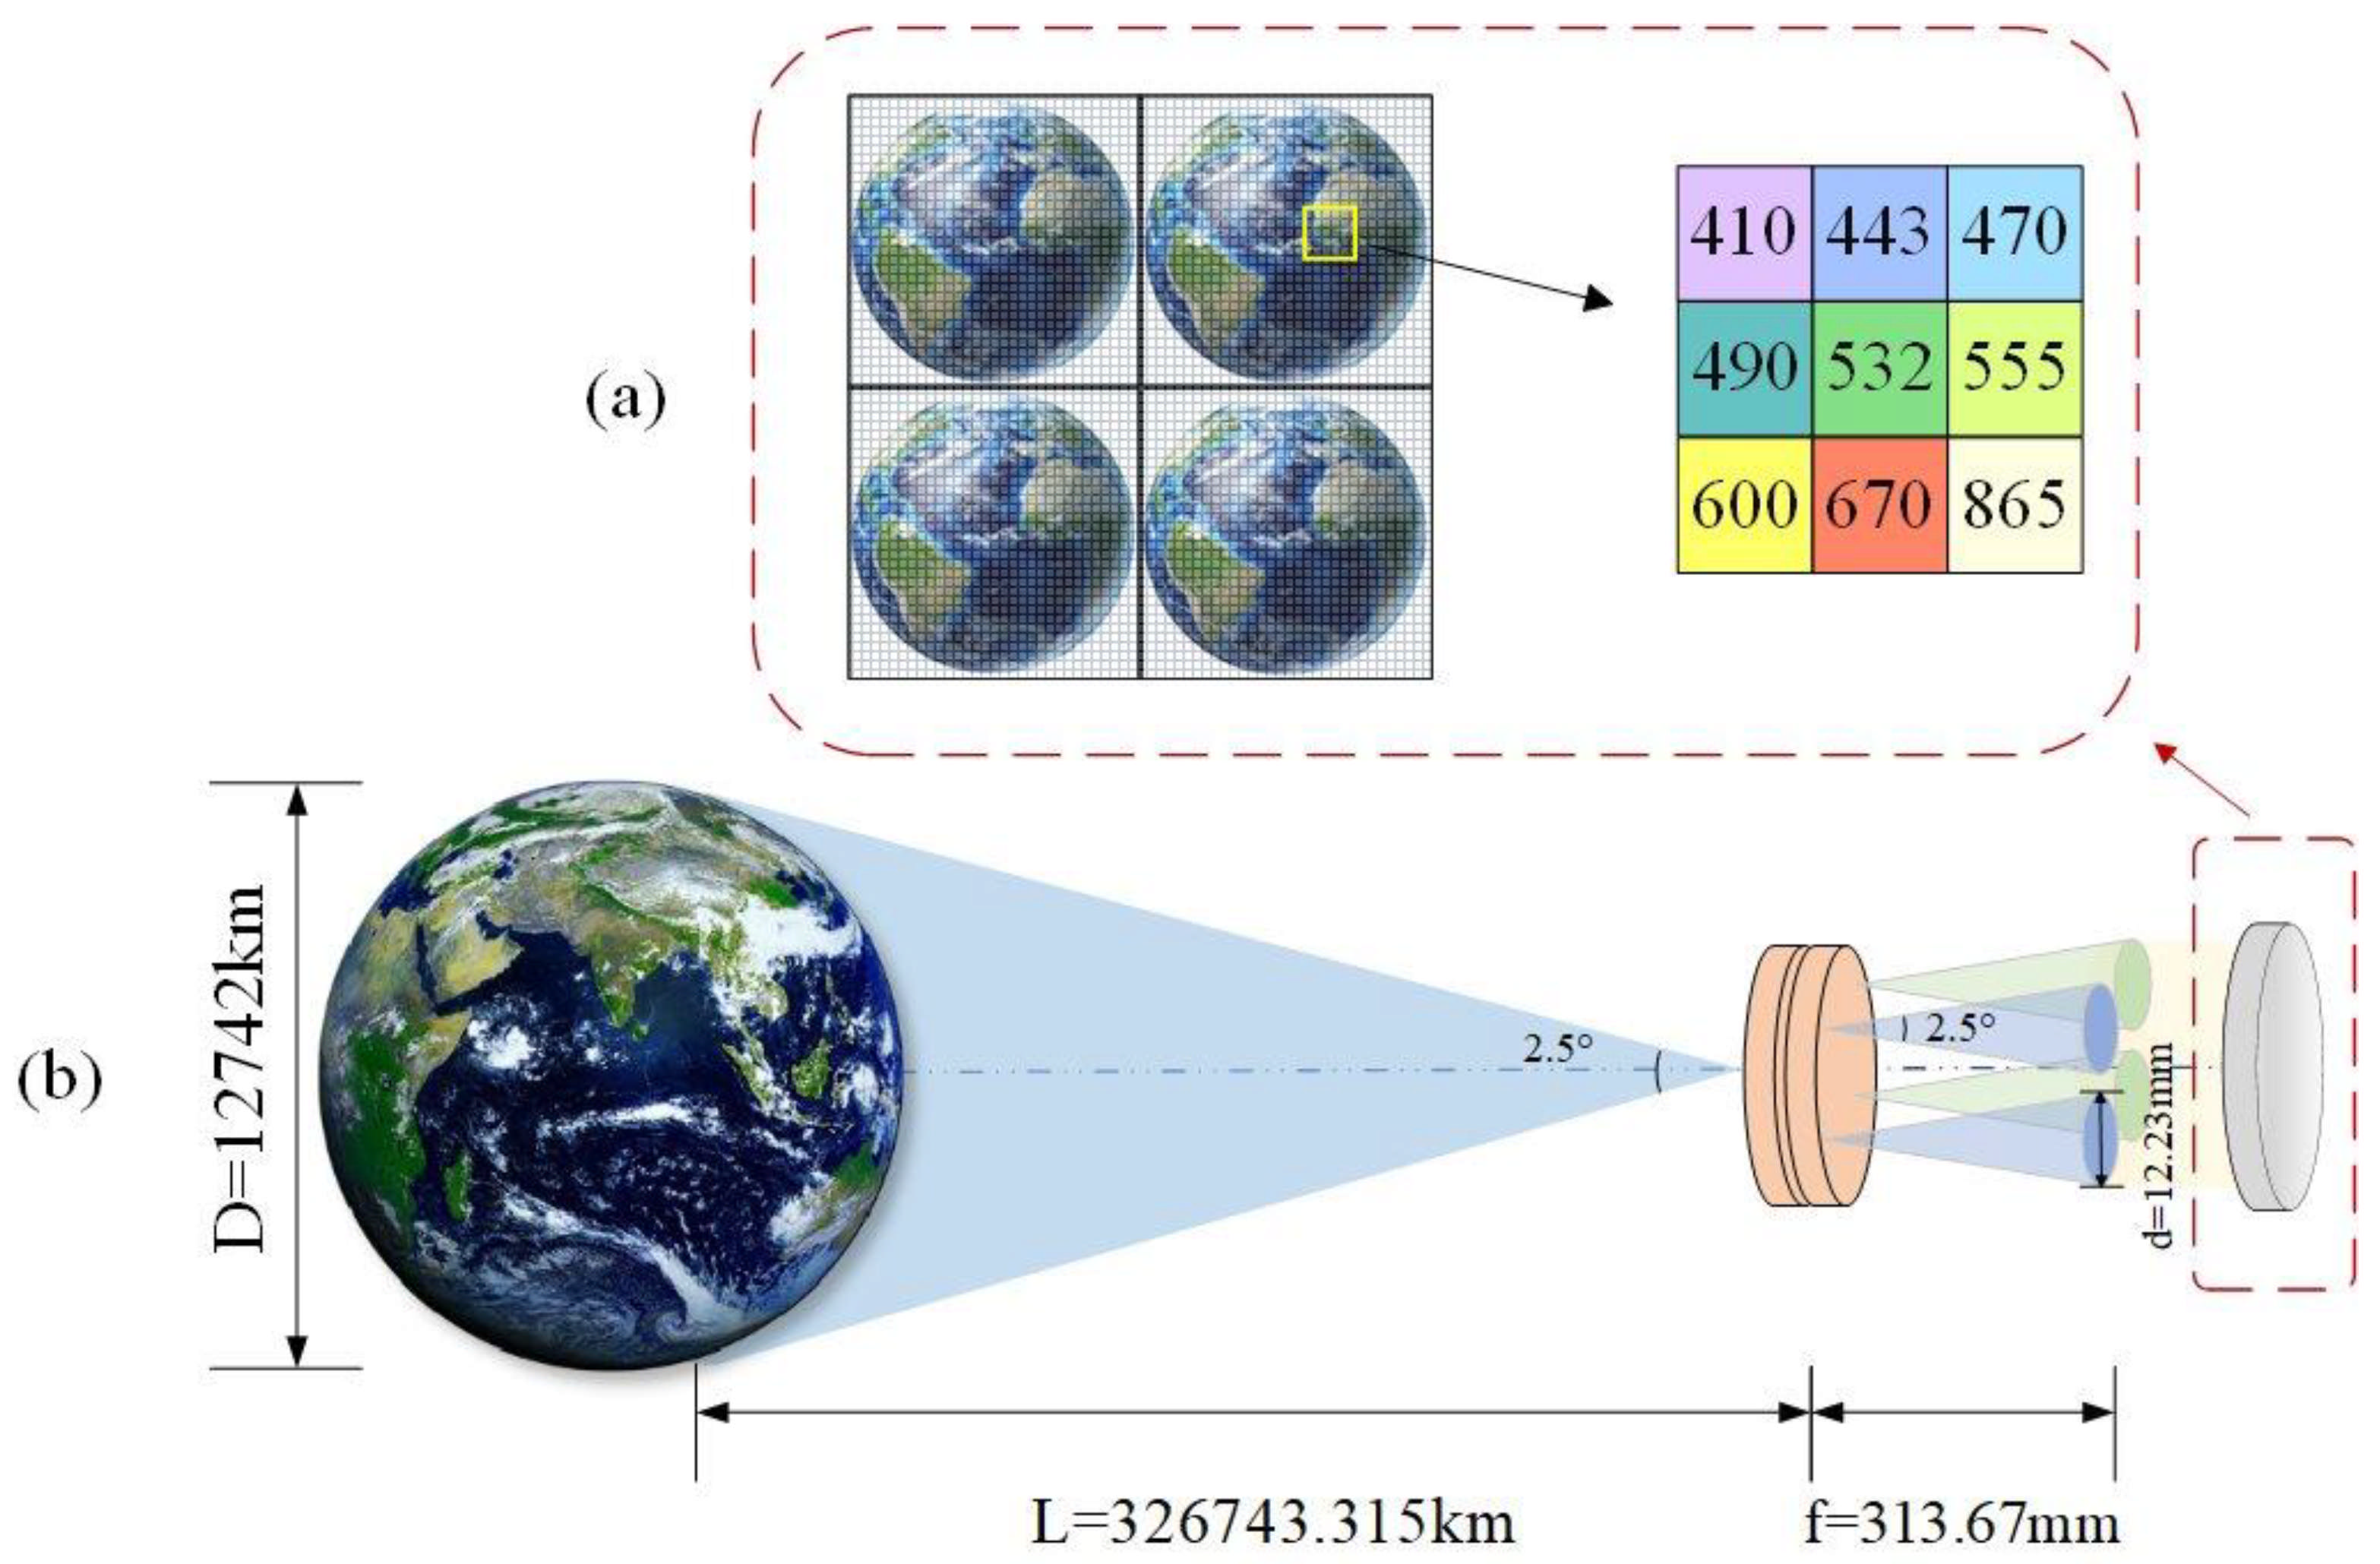
| FOV | 2.5° |
| Effective Focal Length (EFL) | 313.67 mm |
| Entrance Pupil Diameter (EPD) | 30 mm |
| Polarizations | 0°; 60°; 120° |
| Detected wavelength band (nm) | 400–420; 433–453; 460–480 |
| 480–500; 522–542; 545–565 | |
| 590–610; 660–680; 845–885 | |
| Swath (to the Moon) | 1127.275 km |
| Ground Sampling Distance (GSD) | 10 km (Earth) |
| 34.5 km (Moon) |
| Channel | X-Axis Eccentric Distance | Y-Axis Eccentric Distance |
|---|---|---|
| 1st subsystem | 15 | 0 |
| 2nd subsystem | 0 | −15 |
| 3rd subsystem | −15 | 0 |
| 4th subsystem | 0 | 15 |
| Front Surface Curvature | Back Surface Curvature | Thickness | Material | |
|---|---|---|---|---|
| 1st lens | 353.201 | 567.661 | 35.135 | H-ZLAF4LB |
| 2nd lens | −525.432 | 160.852 | 45.742 | H-ZBAF1 |
| 3rd lens | 153.085 | −265.159 | 29.173 | H-FK61 |
| 4th lens | −115.491 | −123.943 | 12.487 | D-ZF10 |
| Front Surface Curvature | Back Surface Curvature | Thickness | Material | |
|---|---|---|---|---|
| 1st lens | 39.171 | 501.552 | 8.248 | H-FK61B |
| 2nd lens | 56.774 | 31.182 | 1.458 | H-ZLAF92 |
| 3rd lens | 31.056 | 49.063 | 3.381 | H-ZF7LAGT |
| 4th lens | −34.272 | −24.365 | 3.937 | H-LAK1 |
| 5th lens | −22.324 | −38.321 | 5.812 | H-ZLAF55D |
Disclaimer/Publisher’s Note: The statements, opinions and data contained in all publications are solely those of the individual author(s) and contributor(s) and not of MDPI and/or the editor(s). MDPI and/or the editor(s) disclaim responsibility for any injury to people or property resulting from any ideas, methods, instructions or products referred to in the content. |
© 2025 by the authors. Licensee MDPI, Basel, Switzerland. This article is an open access article distributed under the terms and conditions of the Creative Commons Attribution (CC BY) license (https://creativecommons.org/licenses/by/4.0/).
Share and Cite
Zhang, W.; Lin, Y.; Zhao, C.; Zhou, Q.; Fang, W.; Ye, X. Multispectral Earth Polarization Observation Based on the Lagrange L1 Point of the Earth–Moon System. Appl. Sci. 2025, 15, 3268. https://doi.org/10.3390/app15063268
Zhang W, Lin Y, Zhao C, Zhou Q, Fang W, Ye X. Multispectral Earth Polarization Observation Based on the Lagrange L1 Point of the Earth–Moon System. Applied Sciences. 2025; 15(6):3268. https://doi.org/10.3390/app15063268
Chicago/Turabian StyleZhang, Wenxiu, Yuchen Lin, Cong Zhao, Qun Zhou, Wei Fang, and Xin Ye. 2025. "Multispectral Earth Polarization Observation Based on the Lagrange L1 Point of the Earth–Moon System" Applied Sciences 15, no. 6: 3268. https://doi.org/10.3390/app15063268
APA StyleZhang, W., Lin, Y., Zhao, C., Zhou, Q., Fang, W., & Ye, X. (2025). Multispectral Earth Polarization Observation Based on the Lagrange L1 Point of the Earth–Moon System. Applied Sciences, 15(6), 3268. https://doi.org/10.3390/app15063268