Article

Numerical Simulation of the Elastic–Plastic Ejection from Grooved Aluminum Surfaces Under Double Supported Shocks Using the SPH Method

State Key Laboratory of Explosion Science and Safety Protection, Beijing Institute of Technology, Beijing 100081, China
*
Author to whom correspondence should be addressed.
Appl. Sci. 2025, 15(7), 3498; https://doi.org/10.3390/app15073498
Submission received: 1 March 2025 / Revised: 20 March 2025 / Accepted: 20 March 2025 / Published: 22 March 2025
(This article belongs to the Section Mechanical Engineering)

Abstract

:
The ejection of disturbed surfaces under multiple shocks is a critical phenomenon in pyrotechnic and inertial confinement fusion. In this study, the elastic–plastic ejection from grooved aluminum surfaces under double supported shocks was investigated using the SPH method. A spallation region developed at the bottom of the bubble during the first ejection, and the subsequent second ejection comprised three distinct components: low-density; high- and medium-velocity ejecta; and high-density, low-velocity ejecta. Recompression of the spallation material generated high- and medium-velocity ejecta, resulting in a limited second ejecta mass. The significant increase in the defect area of the bubble and the convergence of the first ejecta generated low-velocity ejecta, resulting in a substantial increase in the second ejecta mass. The shock pressure threshold required for the second ejection was significantly reduced compared with the first ejection. The second ejecta mass increased with shock pressure, but the increase rate gradually decreased, primarily affecting the low-velocity ejecta. The time interval between shocks primarily influenced the second ejection, driven by the evolution of the spallation region at the bottom of the bubble and the convergence of the first ejecta. The second ejecta mass increased and asymptotically approached a constant value with increasing time intervals.

1. Introduction

Ejection refers to the emission of high-velocity spray particles from a substrate when a shock wave is reflected from a metal surface or a metal–gas interface. This complex dynamic phenomenon encompasses various fundamental scientific aspects, including shock-induced phase transformation, dynamic damage, multiphase flow, and particle aerodynamic deformation and fragmentation. The underlying mechanisms of ejection have been extensively studied globally due to their significance in shock compression science and engineering applications, such as pyrotechnics and inertial confinement fusion [1,2].
Over the past decades, experimental [3,4,5,6,7], numerical [8,9,10,11,12], and theoretical [13,14,15,16,17] approaches have been employed to investigate ejection. Zellner et al. [3] studied ejection under high explosive loading and with a Ti64b impactor, respectively, and characterized the ejecta using piezoelectric pins and Asay foils. The results show that the total mass of the ejecta is linearly related to the shock pressure under supported shocks, whereas it increases sharply before and after unloading melting and then exhibits a relatively constant amount under unsupported shocks. Rességuier et al. [5] developed a ps-pulsed laser-generated X-ray source for the radiography of ejecta under laser shock loading. High-quality radiographs with good spatial and temporal resolution were obtained. In addition, the radiographs showed that low-density regions extend from the sides of the groove into the interior of the sample, forming subsurface damage due to localized tensions induced by rarefaction wave interactions. The advancement of computational technologies has further facilitated studies on ejection using molecular dynamics (MD) and hydrodynamic simulations, and the physical mechanisms of ejection have been further understood. Durand et al. [11] conducted MD simulations to study the ejection process from shock-loaded tin surfaces in regimes where the metal first undergoes solid–solid phase transitions and then melts on release. The oblique interaction of the incident shock wave with the planar interface of the defect led to a sharp increase in temperature at the defect’s bottom, causing spatially heterogeneous solid–liquid phase transitions and non-uniform fragmentation, which was different from the relatively uniform fragmentation process observed when the metal directly melts upon receiving the shock. Mackay et al. [12] used hydrodynamic simulations to investigate microjet formation from tin grooves under varying shock pressures. The results showed that relatively large variations in spall model parameters had minimal effect on quantities of interest (jet velocity and free-surface velocity). Three regimes were identified: a weakly driven regime where material strength limits material ejection, a moderately driven regime where solid–liquid phase change influences ejecta formation, and a strongly driven regime where behavior agrees with the steady-jet theory. Efforts have been made to model spike and bubble velocities and quantify ejecta mass based on experimental and numerical simulation results. Treating ejection as a limiting case of the Richtmyer–Meshkov (RM) instability at the metal–vacuum interface, Buttler et al. [13] proposed a model that replicated experimental spike and bubble velocities. Similarly, Cherne et al. [16] developed an analytical expression for the total mass of the ejecta, extending it to various initial perturbation shapes and achieving consistency with MD and hydrodynamic simulation data. In practical applications, the reflection of shock waves results in multiple shocks acting on disturbed surfaces. Buttler et al. [18] examined second ejections using an explosively driven two-shockwave apparatus, identifying additional mass ejection caused by the recompression of localized spallation. Liu et al. [19] conducted combined numerical and experimental studies on second ejections from grooved tin surfaces subjected to laser-driven shock loading. Their numerical findings demonstrated that successive RM instabilities, generated by the second incident shock at the two-density interfaces formed after the first ejection, dominated the second ejection. These simulation results are closely aligned with the experimental observations. Additionally, Karkhanis et al. [20] extended the existing models for the velocity and total mass of the ejecta to scenarios involving multiple shocks in the case where the material undergoes melting, with hydrodynamic simulations validating their results. However, the experimental findings have indicated that the spallation material at the bottom of the bubble during the first ejection contributes to additional mass ejection, but this phenomenon has not been systematically analyzed. Furthermore, most studies have primarily considered second ejection under conditions where material melting occurs, and the behavior at low shock pressures, where material strength has a significant effect on surface ejection, has not been studied.
In this study, the elastic–plastic ejection from grooved aluminum surfaces under double supported shocks was investigated using the smoothed particle hydrodynamics (SPH) method. The remainder of this paper is structured as follows: Section 2 outlines the materials and methods employed, Section 3 presents the numerical validations and numerical results of the elastic–plastic ejections from grooved aluminum surfaces under double supported shocks, Section 4 discusses the numerical results of the study, and Section 5 concludes the study.

2. Materials and Methods

The ejection involves free-surface (interface) large deformation, tensile, and fracture. The Lagrangian method has the advantage of clearly describing material interfaces, but in regions of large deformation, elements tend to twist, entangle, or even flip, leading to the termination of the calculation. The Eulerian method has the advantage of being able to handle large material deformations, but it is difficult to track the interface history. The SPH method, originally introduced to address astrophysical problems in three-dimensional open space [21,22], has been widely adopted for solving various scientific and engineering problems. Its Lagrangian and mesh-free characteristics make it suitable for applications such as fluid mechanics [23,24,25,26,27], solid mechanics [28,29,30,31,32], fluid–structure interactions [33,34,35,36,37], and explosion and shock dynamics [38,39,40,41,42]. In this paper, we study the elastic–plastic ejection from grooved aluminum surfaces under double supported shocks using a self-developed SPH program that has been validated in previous research [9,19,43,44,45].
The governing equations of continuum mechanics in the Lagrangian framework [46] are expressed as follows:
d ρ d t = ρ v β x β d v α d t = 1 ρ σ α β x β d e d t = σ α β ρ v α x β ,
where ρ denotes the density, e represents the specific internal energy, v α denotes the velocity component, x β corresponds to the spatial coordinate component, σ α β represents the stress tensor component, and α and β are the dimension indices.
The stress tensor component σ α β can be expressed as the sum of hydrostatic and deviatoric components:
σ α β = p δ α β + S α β ,
where p denotes the pressure, δ α β represents the second-order identity tensor, and S α β corresponds to the deviatoric stress tensor component. The pressure p and deviatoric stress tensor component S α β are solved by the equation of state and the constitutive model, respectively.
The SPH equations can be obtained by applying the kernel and particle approximations to discretize Equation (1) as follows:
d ρ i d t = ρ i j = 1 N m j ρ j v i β v j β W i j C x i β d v i α d t = j = 1 N m j σ i α β ρ i 2 + σ j α β ρ j 2 Π i j δ α β + f n R i j α β W i j C x i β d e i d t = 1 2 j = 1 N m j σ i α β ρ i 2 + σ j α β ρ j 2 Π i j δ α β v j α v i α W i j C x i β ,
where N denotes the number of neighboring particles, m j represents the mass of the neighboring particle, Π i j denotes the artificial viscosity, f n R i j α β denotes the artificial stress, and W i j C denotes the kernel function obtained using the kernel gradient correction technique. In this study, the Wendland kernel function is used.
The artificial viscosity Π i j [47] is used as follows:
Π i j = α Π c ¯ i j ϕ i j + β Π ϕ i j 2 ρ ¯ i j , v i j x i j < 0 0 , v i j x i j 0 ,
where
ϕ i j = h ¯ i j v i j x i j x i j 2 + 0.01 h ¯ i j 2 ,
c ¯ i j = 1 2 c i + c j ,
ρ ¯ i j = 1 2 ρ i + ρ j ,
h ¯ i j = 1 2 h i + h j ,
v i j = v i v j ,
x i j = x i x j ,
where h denotes the smoothing length, and c represents the speed of sound. Both the parameters α Π and β Π of the artificial viscosity are set to 1.0.
Ejection involves significant material deformation, resulting in disordered particle distributions. The kernel gradient correction technique [48] is applied to enhance accuracy as follows:
i W i j C = L i i W i j ,
where
L i = j = 1 N m j ρ j x j x i i W i j 1 .
Ejection involves shock wave loading and unloading as well as tensile fracture, and significant tensile stress develops within the material. Therefore, the artificial stress [49] is applied to remove the tensile instability as follows:
f n R i j α β = W x j x i , h W Δ x , h n R i α β + R j α β ,
where Δx denotes the initial particle distance, n is set to 4, and R i α β is expressed as follows:
R i x x = cos 2 θ i R ¯ i x x + sin 2 θ i R ¯ i y y R i y y = sin 2 θ i R ¯ i x x + cos 2 θ i R ¯ i y y R i x y = sin θ i cos θ i R ¯ i x x R ¯ i y y ,
where R ¯ i x x and R ¯ i y y are calculated as follows:
R ¯ i x x = ϵ σ ¯ i x x ρ 2 , σ ¯ i x x > 0 0 , σ ¯ i x x 0 ,
R ¯ i y y = ϵ σ ¯ i y y ρ 2 , σ ¯ i y y > 0 0 , σ ¯ i y y 0 ,
where ϵ is set to 0.3, σ ¯ i x x and σ ¯ i y y are expressed as follows:
σ ¯ i x x = cos 2 θ i σ i x x + 2 sin θ i cos θ i σ i x y + sin 2 θ i σ i y y σ ¯ i y y = sin 2 θ i σ i x x 2 sin θ i cos θ i σ i x y + cos 2 θ i σ i y y ,
where the rotation angle θ i is defined as follows:
tan 2 θ i = 2 σ i x y σ i x x σ i y y .
Ejection induces considerable compression and tension in the material, and maintaining a constant smoothing length would cause notable fluctuations in the number of neighboring particles, ultimately decreasing the precision of the computational outcomes. Hence, the variable smoothing length [50] is used as follows:
d h i d t = 1 2 h i ρ i d ρ i d t ,
In this study, the initial smoothing length h 0 is equal to 1.5 Δ x , and then, the smoothing length is updated according to Equation (19).
The kick–drift–kick method [47] is employed to solve Equation (3). First, the velocity at the half time step n + 1/2 is as follows:
v i n + 1 2 = v i n + 1 2 Δ t d v i d t n ,
where n denotes the present time step. Subsequently, the density, specific internal energy, and position are solved using the updated velocity by Equation (20). The updated formulas for the density, specific internal energy, and position at the new time step n + 1 are as follows:
ρ i n + 1 = ρ i n + Δ t d ρ i d t n + 1 2 ,
e i n + 1 = e i n + Δ t d e i d t n + 1 2 ,
x i n + 1 = x i n + Δ t d x i d t n + 1 2 .
Finally, the velocity at the new time step is updated.
v i n + 1 = v i n + 1 2 + 1 2 Δ t d v i d t n + 1 .
The pressure of the material in the ejection is up to tens of GPa or even hundreds of GPa, so the Mie–Grüneisen equation of state [46] is employed as follows:
p = 1 1 2 γ p η p H ρ + γ p ρ e ,
p H ρ = a 0 η + b 0 η 2 + c 0 η 3 , η 0   a 0 , η < 0 ,
where η is the compression ratio, γ p is the Grüneisen constant about pressure, and the parameters a 0 , b 0 , and c 0 are given by
a 0 = ρ 0 c 2   b 0 = a 0 1 + 2 s 1 c 0 = a 0 2 s 1 + 3 s 1 2   ,
where s is the material parameter.
The deviatoric stress tensor component is determined by applying the Jaumann stress rate, as expressed below:
S ˙ α β = 2 G ε ˙ α β 1 3 δ α β ε ˙ γ γ + S α γ R ˙ β γ + S β γ R ˙ α γ ,
where G denotes the shear modulus.
The strain rate tensor component ε ˙ α β and the rotation rate tensor component R ˙ α β are expressed as
ε ˙ α β = 1 2 v α x β + v β x α ,
R ˙ α β = 1 2 v α x β v β x α .
The effective stress S e f f is calculated based on the following equation:
S e f f = 3 2 S α β S α β .
The plastic flow is determined using the von Mises yield criterion, as follows:
S α β = ζ S α β ,
ζ = 2 Y 2 3 S α β S α β , S e f f > Y 1 , S e f f Y ,
where Y denotes the yield strength.
The Steinberg-Guinan model [51] is employed as follows:
G = G 0 1 + G p G 0 p η 1 / 3 G T G 0 T 300 ,
Y = Y 0 1 + β ε p n 1 + Y p Y 0 p η 1 / 3 Y T Y 0 T 300 ,
and must satisfy the following condition:
Y 0 1 + β ε p n Y max ,
where T denotes the temperature; ε p corresponds to the equivalent plastic strain; β and n are the work-hardening parameters; and G p / G 0 , G T / G 0 , Y p / Y 0 , Y T / Y 0 , and Y max are material constants. The subscript 0 refers to the reference state (T = 300 K, p = 0). Once the material is determined to have melted, both the G and Y are set to zero.
The Lindemann melting model [52] is used to describe the melting curve as follows:
T m = T m 0 V V m 0 2 / 3 exp 2 γ T V 0 V m 0 V ,
where T m denotes the melting temperature; γ T is the Grüneisen constant about temperature; V 0 = 1 / ρ 0 ; and T m 0 and V m 0 correspond to the melting temperature and the specific volume of the material at atmospheric pressure, respectively.
The material temperature [53] is calculated as
T = e e c c v ,
e c = 3 Q ρ 0 K 1 q exp q 1 ζ 1 / 3 ζ 1 / 3 1 q + 1 ,
where c v denotes the specific heat capacity, ec denotes the cold energy of metal, ρ 0 K corresponds to the density at 0 K, ζ = V 0 K / V represents the compression ratio with respect to the density at 0 K, and Q and q are material constants.
Spallation is modeled using a threshold stress criterion. Aluminum undergoes spallation when the pressure falls below the −3.0 GPa [54]. After melting it becomes a small value, which is taken as −0.01 GPa in this study. The pressure and deviatoric stress tensor components of the particle are set to zero following spallation, and the particle cannot experience negative pressure.

3. Results

3.1. Numerical Validations

3.1.1. Pressure–Temperature Curve

Since the subsequent simulations of elastic–plastic ejection from grooved aluminum surfaces under double supported shocks involve the loading and unloading of shock waves and melting under strong impacts, we conducted tests on the Hugoniot curve, melting curve, and isentropic unloading curves for aluminum with shock pressure ranging from 1 GPa to 150 GPa in the SPH program, and compared them with the experimental results, as shown in Figure 1. The Hugoniot curve and melting curve derived from SPH simulations demonstrated good agreement with the experimental data [55,56]. In addition, the unloading melting pressure of aluminum was 64.0 GPa, which is consistent with the experimental results of 62–65 GPa [57]. The shock loading and unloading process was categorized into the following three distinct regions based on the variation in shock pressures: Region I (0.0–64.0 GPa, loading solid, unloading solid), Region II (64.0–123.0 GPa, loading solid, unloading liquid), and Region III (greater than 123.0 GPa, loading liquid, unloading liquid). Based on this characterization, we chose the first shock pressure of 43.0 GPa to be at the state of loading solid and unloading solid.

3.1.2. D High-Velocity Impact

Figure 2 presents the 2D computational model of an aluminum circular projectile impacting an aluminum plate. The diameter of the circular projectile is 9.53 mm. The length and width of the plate are 30.0 mm and 0.47 mm, respectively. The projectile has an initial horizontal velocity v 0 of 4.71 km/s. Both projectile and plate are used with the Mie–Grüneisen equation of state and the Steinberg-Guinan constitutive model. The material parameters of aluminum are provided in Table 1. The initial particle distance is 0.01 mm, and the total number of particles is 995,297.
Figure 3 shows the SPH simulations and experimental results of the debris cloud at 6 µs and 19 µs. The overall profile shows that the simulation results agree with the experimental results [58], and the SPH simulations accurately capture the characteristic structure of the debris cloud, with a spallation region appearing inside the spherical projectile, forming a shell that was loosely attached to the rear of the spherical projectile. At 6 µs, the ratio of debris cloud (length of debris cloud/width of debris cloud) is 1.08, which is in close agreement with the experimental result of 1.11.

3.2. Elastic–Plastic Ejection Under Double Supported Shocks

Figure 4 illustrates the 2D computational model of the elastic–plastic ejection under double supported shocks. The length and width of the aluminum sample were 500 µm and 300 µm, respectively, and the depth and width of the surface grooves were 20 µm and 150 µm, respectively. This study generated two supported shock waves by successively impacting an aluminum sample with two flyers. A free boundary condition was applied in the impact direction in the simulations, while a periodic boundary condition was imposed in the direction perpendicular to the impact. The initial particle distance is 0.5 µm, and 1,788,000 particles are used in the simulation.
Figure 5 illustrates the dynamic evolution of the density during the first elastic–plastic ejection, with a surface jump velocity (surface velocity variation after the shock wave reaches the free surface) of 4.0 km/s corresponding to a shock pressure of 43.0 GPa. The disturbed surface, after the reflection of the first incident supported shock wave from the grooved surface, underwent phase inversion, forming a characteristic spike-bubble structure. The ejecta was predominantly attributed to the elastic–plastic deformation in the material near the free surface because the shock pressure was below the unloading melting pressure of aluminum (64.0 GPa). The spike was eventually detached, separating from the substrate and continuing its forward motion. The spike velocity decreased continuously after reaching a peak value of 5.285 km/s, with a maximum velocity of only 4.294 km/s at 300 ns. The total mass of the ejecta at the 300 ns was 3.889 mg/cm2. A spallation region was observed at the bottom of the bubble owing to the rarefaction waves reflected from the grooved surface meeting and interacting at the crest of the initial groove.
We analyzed the evolution of the bubble region because the second ejection was closely associated with the bubble region formed during the first ejection, as shown in Figure 6. Rarefaction waves were generated after the first supported shock wave reached the surfaces on both sides of the groove and meted at the crest of the grooved surface, resulting in tensile stress. Spallation occurred as the tensile stress increased and reached the spall strength. Initially, the spallation region extended into the interior of the sample in a fan-shaped configuration and eventually reached saturation. At the same time, the substrate material on both sides of the spallation region moved under the influence of jet convergence, leading to the widening of the opening of the spallation region. The material within the spallation region underwent continuous compression at a later stage, eventually reaching a steady state. The detachment of material from the substrate after forming the spallation region caused a reduction in the velocity of the bubble, making it progressively more difficult to track the bubble over time. The formation of the spallation region at the base of the bubble led to a significant increase in defect areas within the bubble region. The morphology of the bubble gradually stabilized over time, reaching a steady configuration.
Figure 7 depicts the dynamic evolution of the density during the second ejection, where the shock pressure remained consistent with that of the first ejection at 43.0 GPa. At 200 ns, the second incident supported shock wave reached the spallation region at the bottom of the bubble, followed by the recompression of the material in the spallation region. Phase inversion of the disturbed surface occurred again after reflecting the second supported shock wave from the surface, forming a spike-bubble structure. However, the characteristics of the second ejection were more complex than those of the first ejection. The second ejecta consisted of three distinct components: a low-density, high-velocity ejecta at the front; a low-density, medium-velocity ejecta in the middle; and a high-density, low-velocity ejecta at the rear. A brief low-density damage region appeared at the base of the first spike but was rapidly compacted during the interaction between the second supported shock wave and the disturbed surface.
We further analyzed the density and cumulative area density distribution of the second ejecta along the shock direction at 500 ns, as illustrated in Figure 8. Distinct boundaries for high-, medium-, and low-velocity ejecta were evident, with prominent high-density regions at the leading edges of each ejecta section at densities of 0.154, 0.219, and 0.474 g/cm3, respectively. The average densities of medium- and high-velocity ejecta were notably lower than those of low-velocity ejecta. From the cumulative area density distribution, the total mass of the second ejecta was 15.259 mg/cm2, with the high-velocity ejecta being only 1.148 mg/cm2, the medium-velocity ejecta being 1.615 mg/cm2, and the low-velocity ejecta being 12.496 mg/cm2. The total mass of the second ejecta was primarily concentrated in the low-velocity ejecta, with the medium- and high-velocity ejecta making up only 18% of the total mass of the second ejecta. The total mass of the second ejecta increased substantially compared to the total mass of the first ejecta (3.889 mg/cm2), reaching 3.924 times that of the first ejecta.
Finally, the source distribution of the different velocity ejecta was analyzed, as shown in Figure 9. The medium- and high-velocity ejecta primarily originated from the spallation material at the bottom of the bubble formed during the first ejection, with a smaller contribution from the substrate material surrounding the spallation region. Conversely, the low-velocity ejecta primarily derived from the substrate region at the bottom of the bubble formed during the first ejection, with a portion originating from the first ejecta. Combined with the cumulative area density distribution (Figure 8), the formation of spallation material at the bottom of the bubble during the first ejection resulted in an increase in the total mass of the second ejecta and the formation of low-density, medium- and high-velocity ejecta. The significant increase in the total mass of the second ejecta was primarily due to the formation of the spallation region, which caused a substantial increase in the defect area within the bubble, thereby enhancing the total mass of the low-velocity ejecta. Additionally, the convergence of the first ejecta also contributed to the increased total mass of the second ejecta.

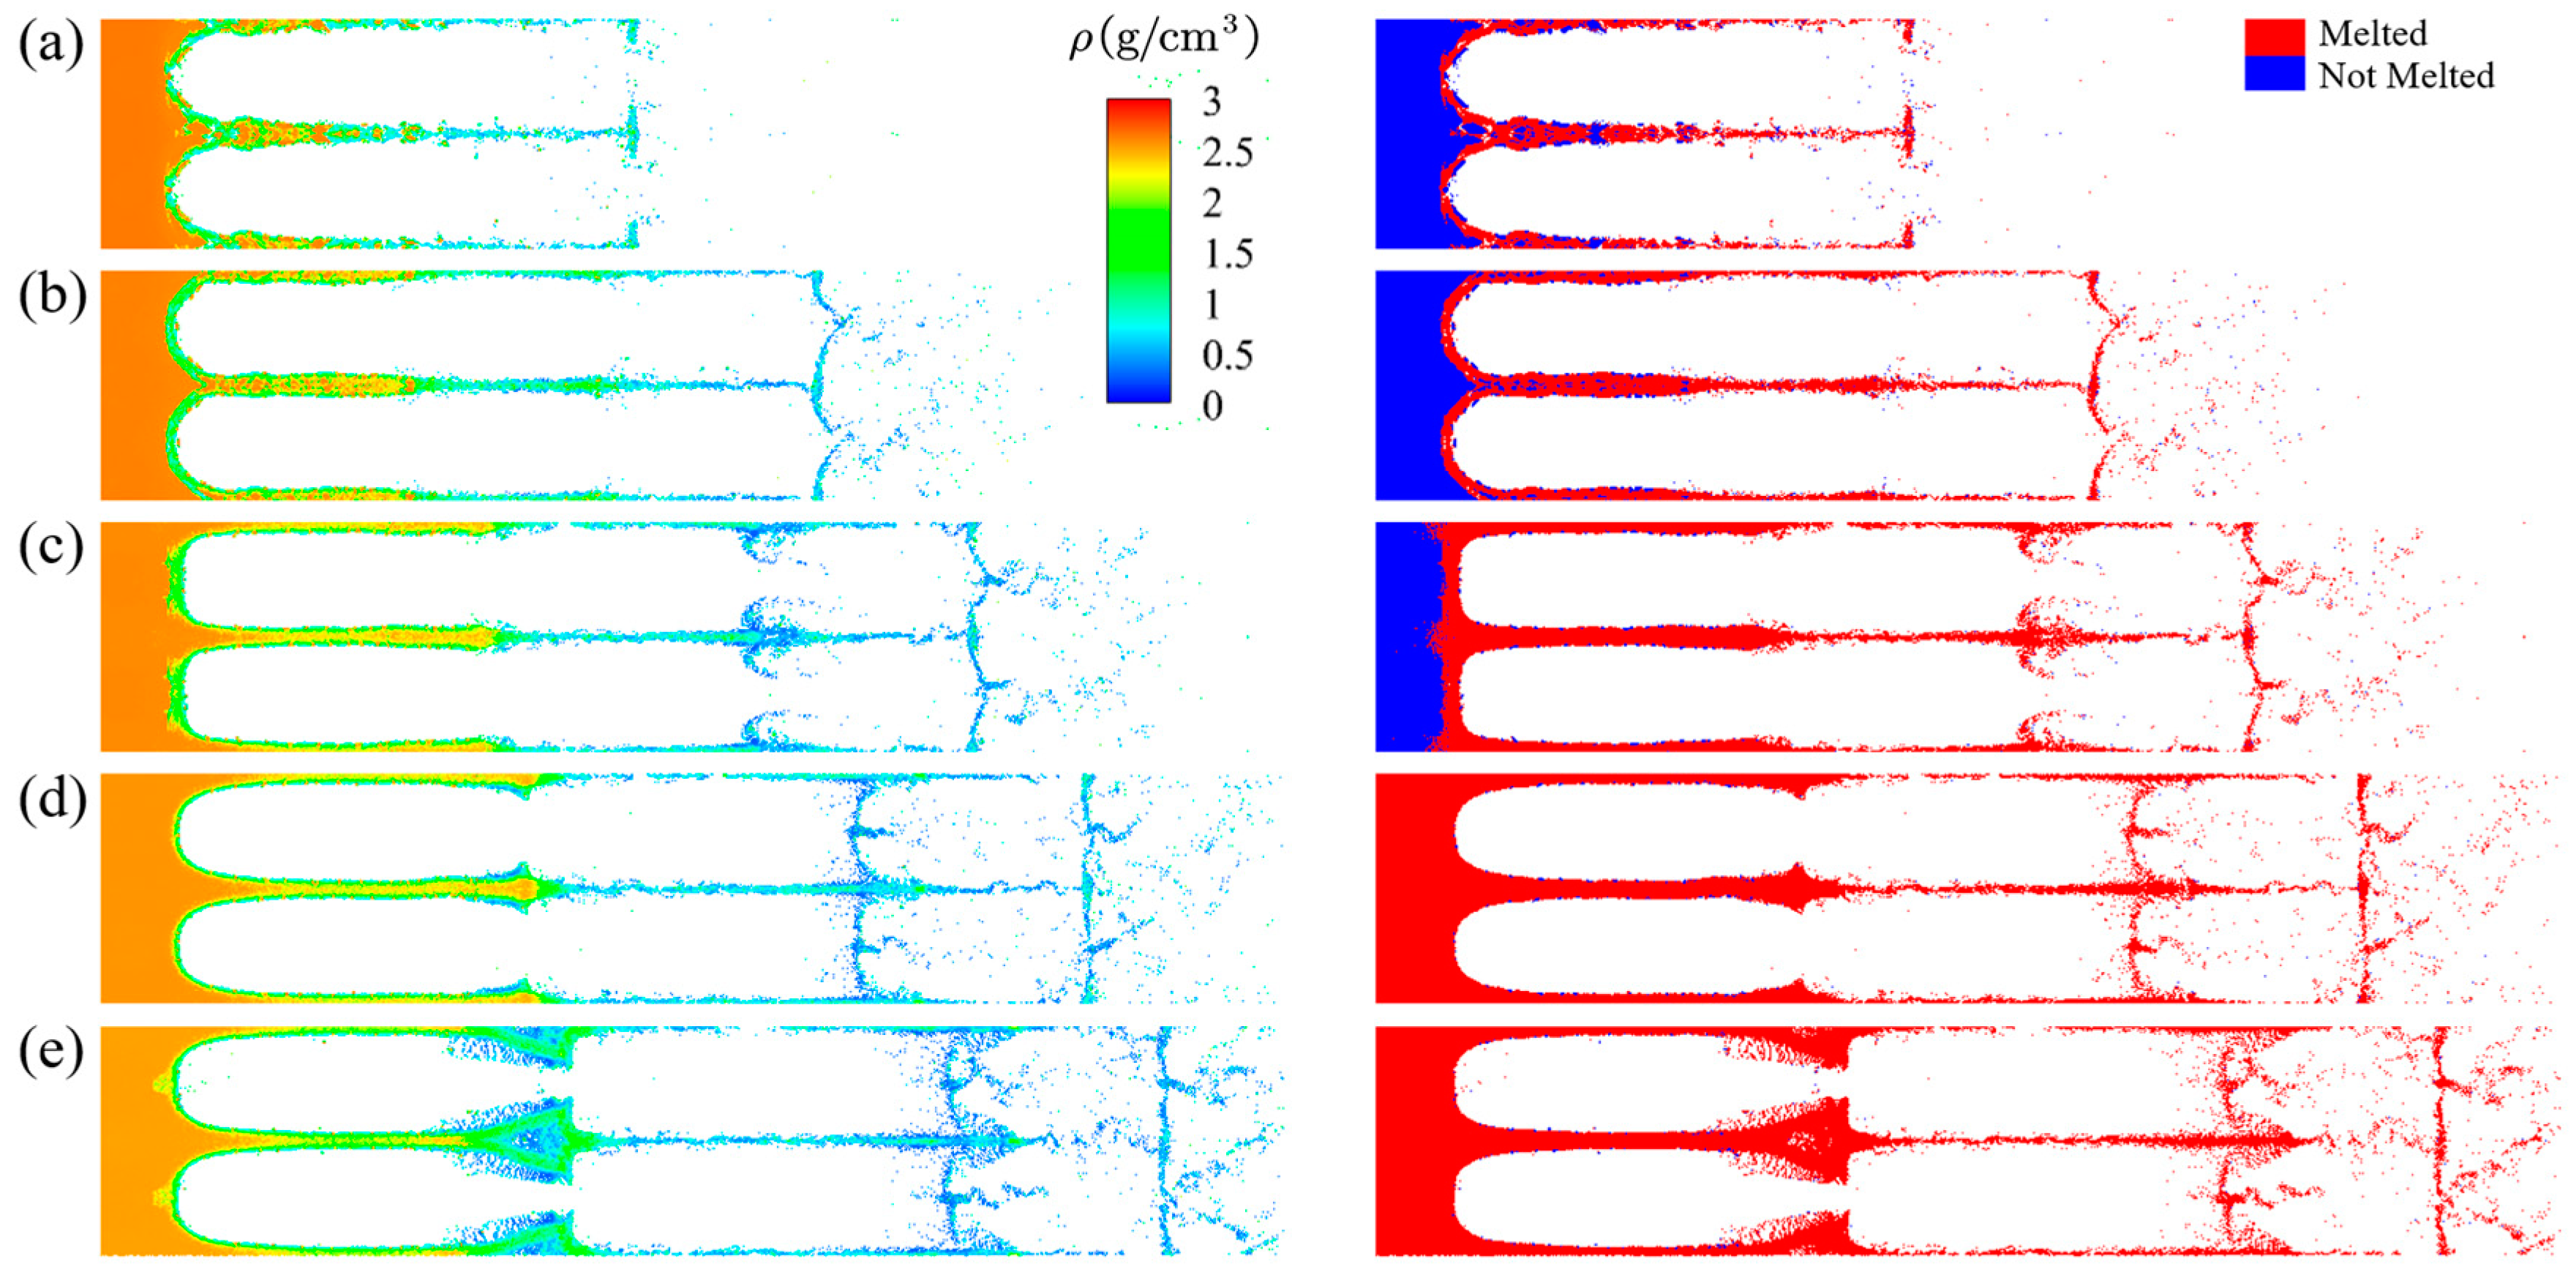
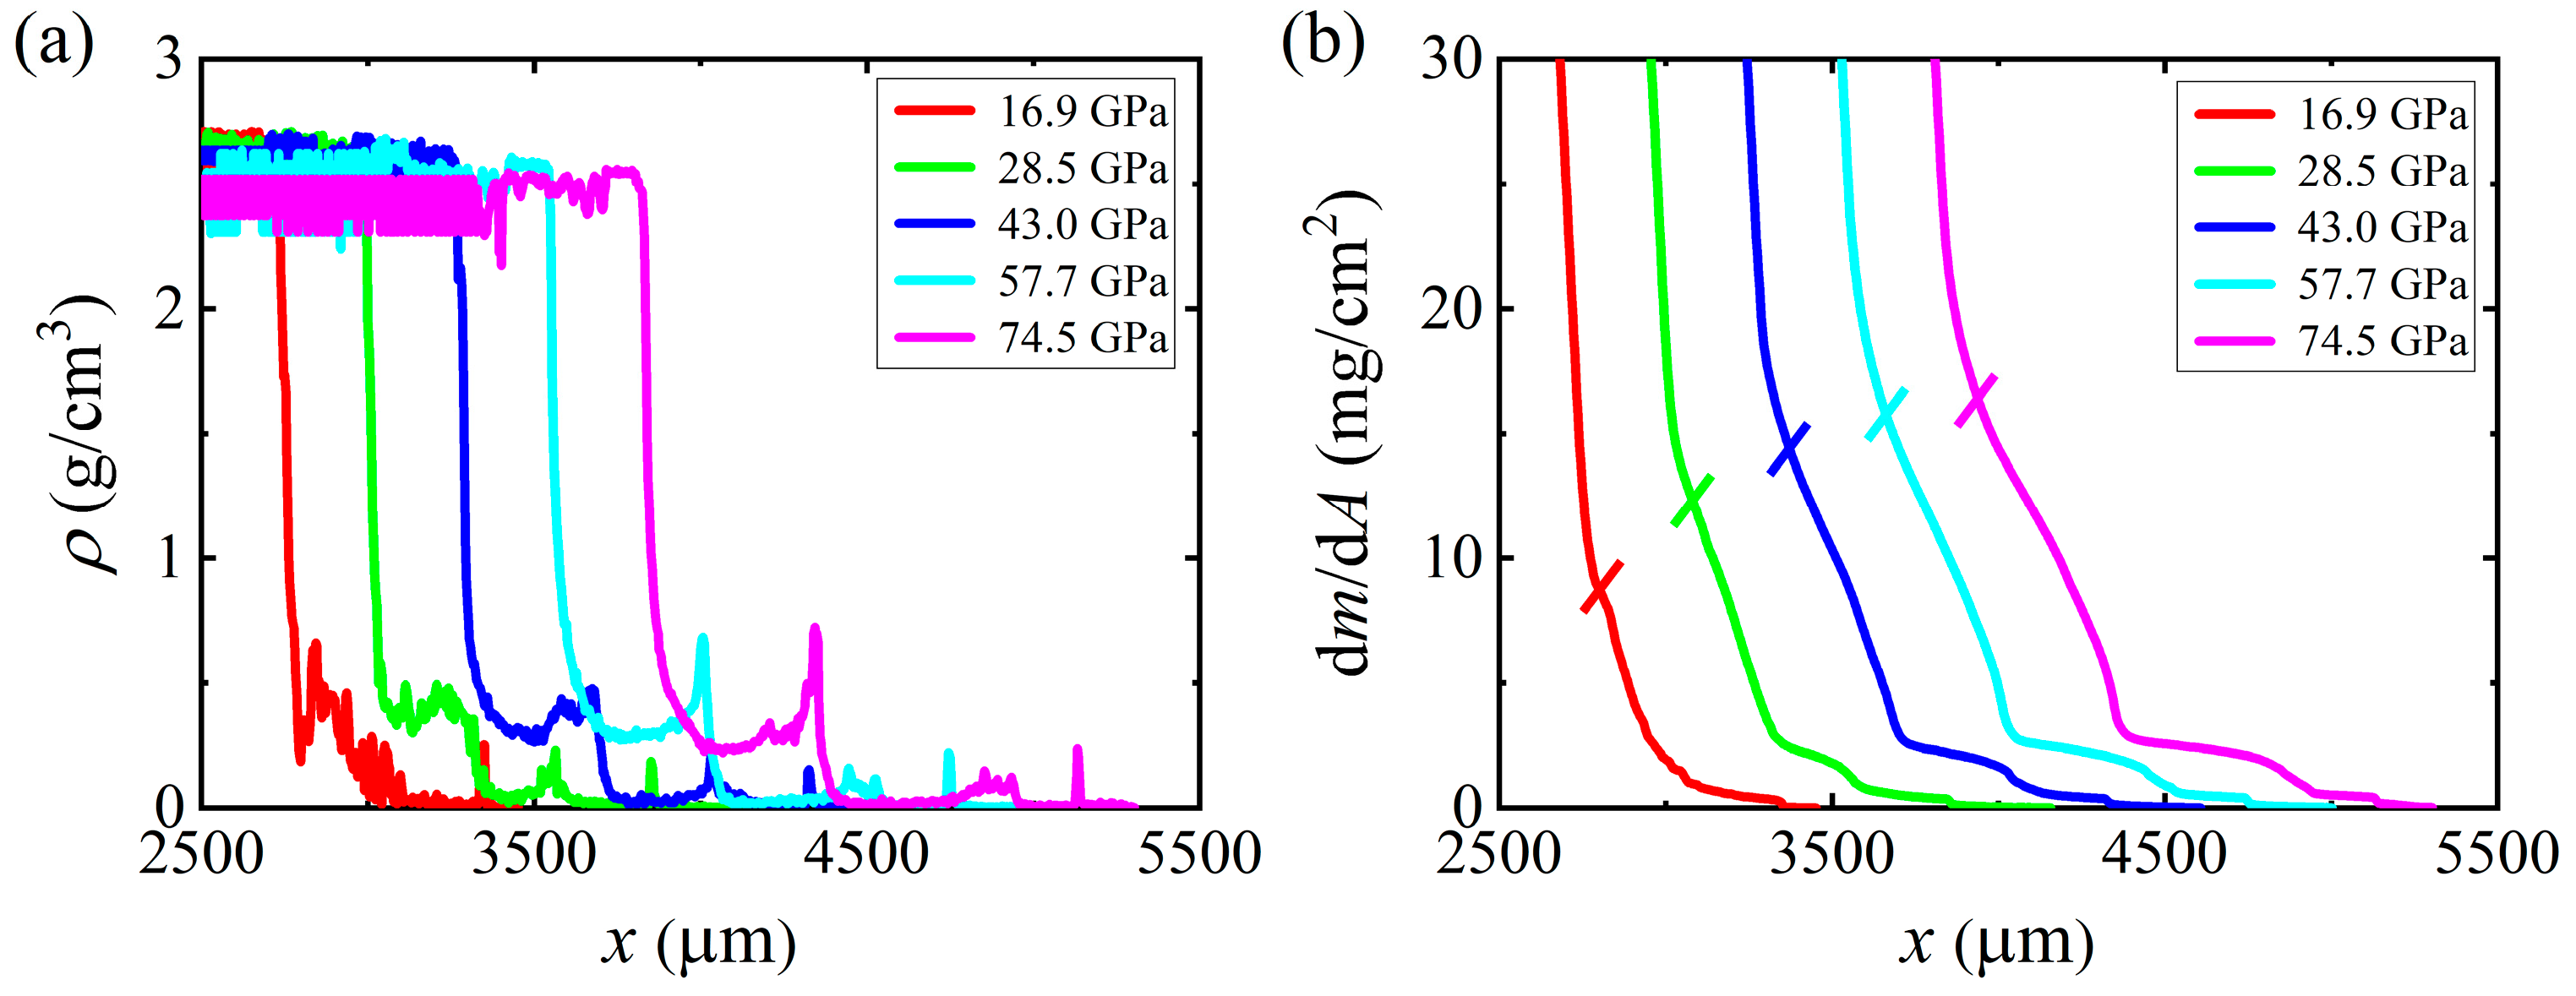
3.3. Effect of the Second Shock Pressure on the Second Ejection

This section examines the effect of the second shock pressure on the second ejection, with a time interval of 145 ns. The second surface jump velocities were 2.0 km/s, 3.0 km/s, 4.0 km/s, 5.0 km/s, and 6.0 km/s, corresponding to second shock pressures of 16.9 GPa, 28.5 GPa, 43.0 GPa, 57.7 GPa, and 74.5 GPa, respectively.
Figure 10 presents the density and phase distributions of the second ejecta at 500 ns for various second shock pressures. An evident second ejecta was formed from the disturbed surface at a shock pressure of 16.9 GPa despite the shock pressure being significantly lower than the unloading melting pressure (64.0 GPa). The shock pressure threshold required for the second ejection was significantly reduced compared with the first ejection. The material at the disturbed surface underwent melting, which came from multiple reasons, such as the initial temperature of the material increased due to the loading and unloading of the first shock wave, collisions between material on either side of the disturbed surface during the second ejection converted kinetic energy into internal energy, and the temperature increase caused by the recompression of the spallation material at the bottom of the bubble. There was no distinct boundary between the high-, medium-, and low-velocity ejecta, and the low-velocity ejecta contained some solid structures due to the low second shock pressure. The solid structures within the low-velocity ejecta gradually decreased with increasing shock pressure. As the second shock pressure continues to increase (57.7 GPa and 74.5 GPa), unloading melting of the material occurs. The structure of the high- and medium-velocity ejecta remains almost unchanged, while the spikes of the low-velocity ejecta gradually dispersed.
We further analyzed the density and cumulative area density distribution of the second ejecta along the shock direction at various second shock pressures, as shown in Figure 11. Distinct oscillations were observed in the density distribution at a shock pressure of 16.9 GPa, originating from the solid structure of the low-velocity ejecta. At this pressure, it becomes difficult to distinguish between the various velocity components of the ejecta. The density distributions for the different velocity ejecta exhibited more defined boundaries with increasing second shock pressure. The medium- and high-velocity ejecta displayed minimal variation, while the density of spikes within the low-density ejecta gradually increased. The density of the spikes in the low-density ejecta reached 0.724 g/cm3 at a second shock pressure of 74.5 GPa. The cumulative area density distribution showed that the total mass of the ejecta was 8.793 mg/cm2 at a second shock pressure of 16.9 GPa, which was significantly higher than the total mass of the first ejection (3.889 mg/cm2). The total mass of the second ejecta continued to increase with increasing second shock pressure; however, the rate of increase diminished progressively.
Figure 12 illustrates the source distribution of the different velocity ejecta at varying second shock pressures. The source distribution for all the ejecta appeared consistent at a shock pressure of 16.9 GPa due to the difficulty distinguishing between different velocity ejecta. The source distributions for medium- and high-velocity ejecta at different second shock pressures remained approximately unchanged. This ejecta primarily originated from the spallation region at the bottom of the bubble, with a minor contribution from the substrate region on either side. The low-velocity ejecta originated from the substrate region at the bottom of the bubble, along with the material from the first ejecta. The source of the low-velocity ejecta extended further into the interior of the substrate region at the bottom of the bubble with increasing second shock pressure. Simultaneously, the source of the low-velocity ejecta in the first ejecta rapidly reached saturation.
Finally, the variations in the spike velocity and total mass for the different velocity ejecta as a function of the second surface jump velocity are depicted in Figure 13. The spike velocity of the second ejecta exhibited an approximately linear relationship with the second surface jump velocity. The total masses of the high- and medium-velocity ejecta remained approximately constant as the second surface jump velocity increased. However, the total mass of the low-velocity ejecta increased significantly, although the rate of increase gradually diminished.

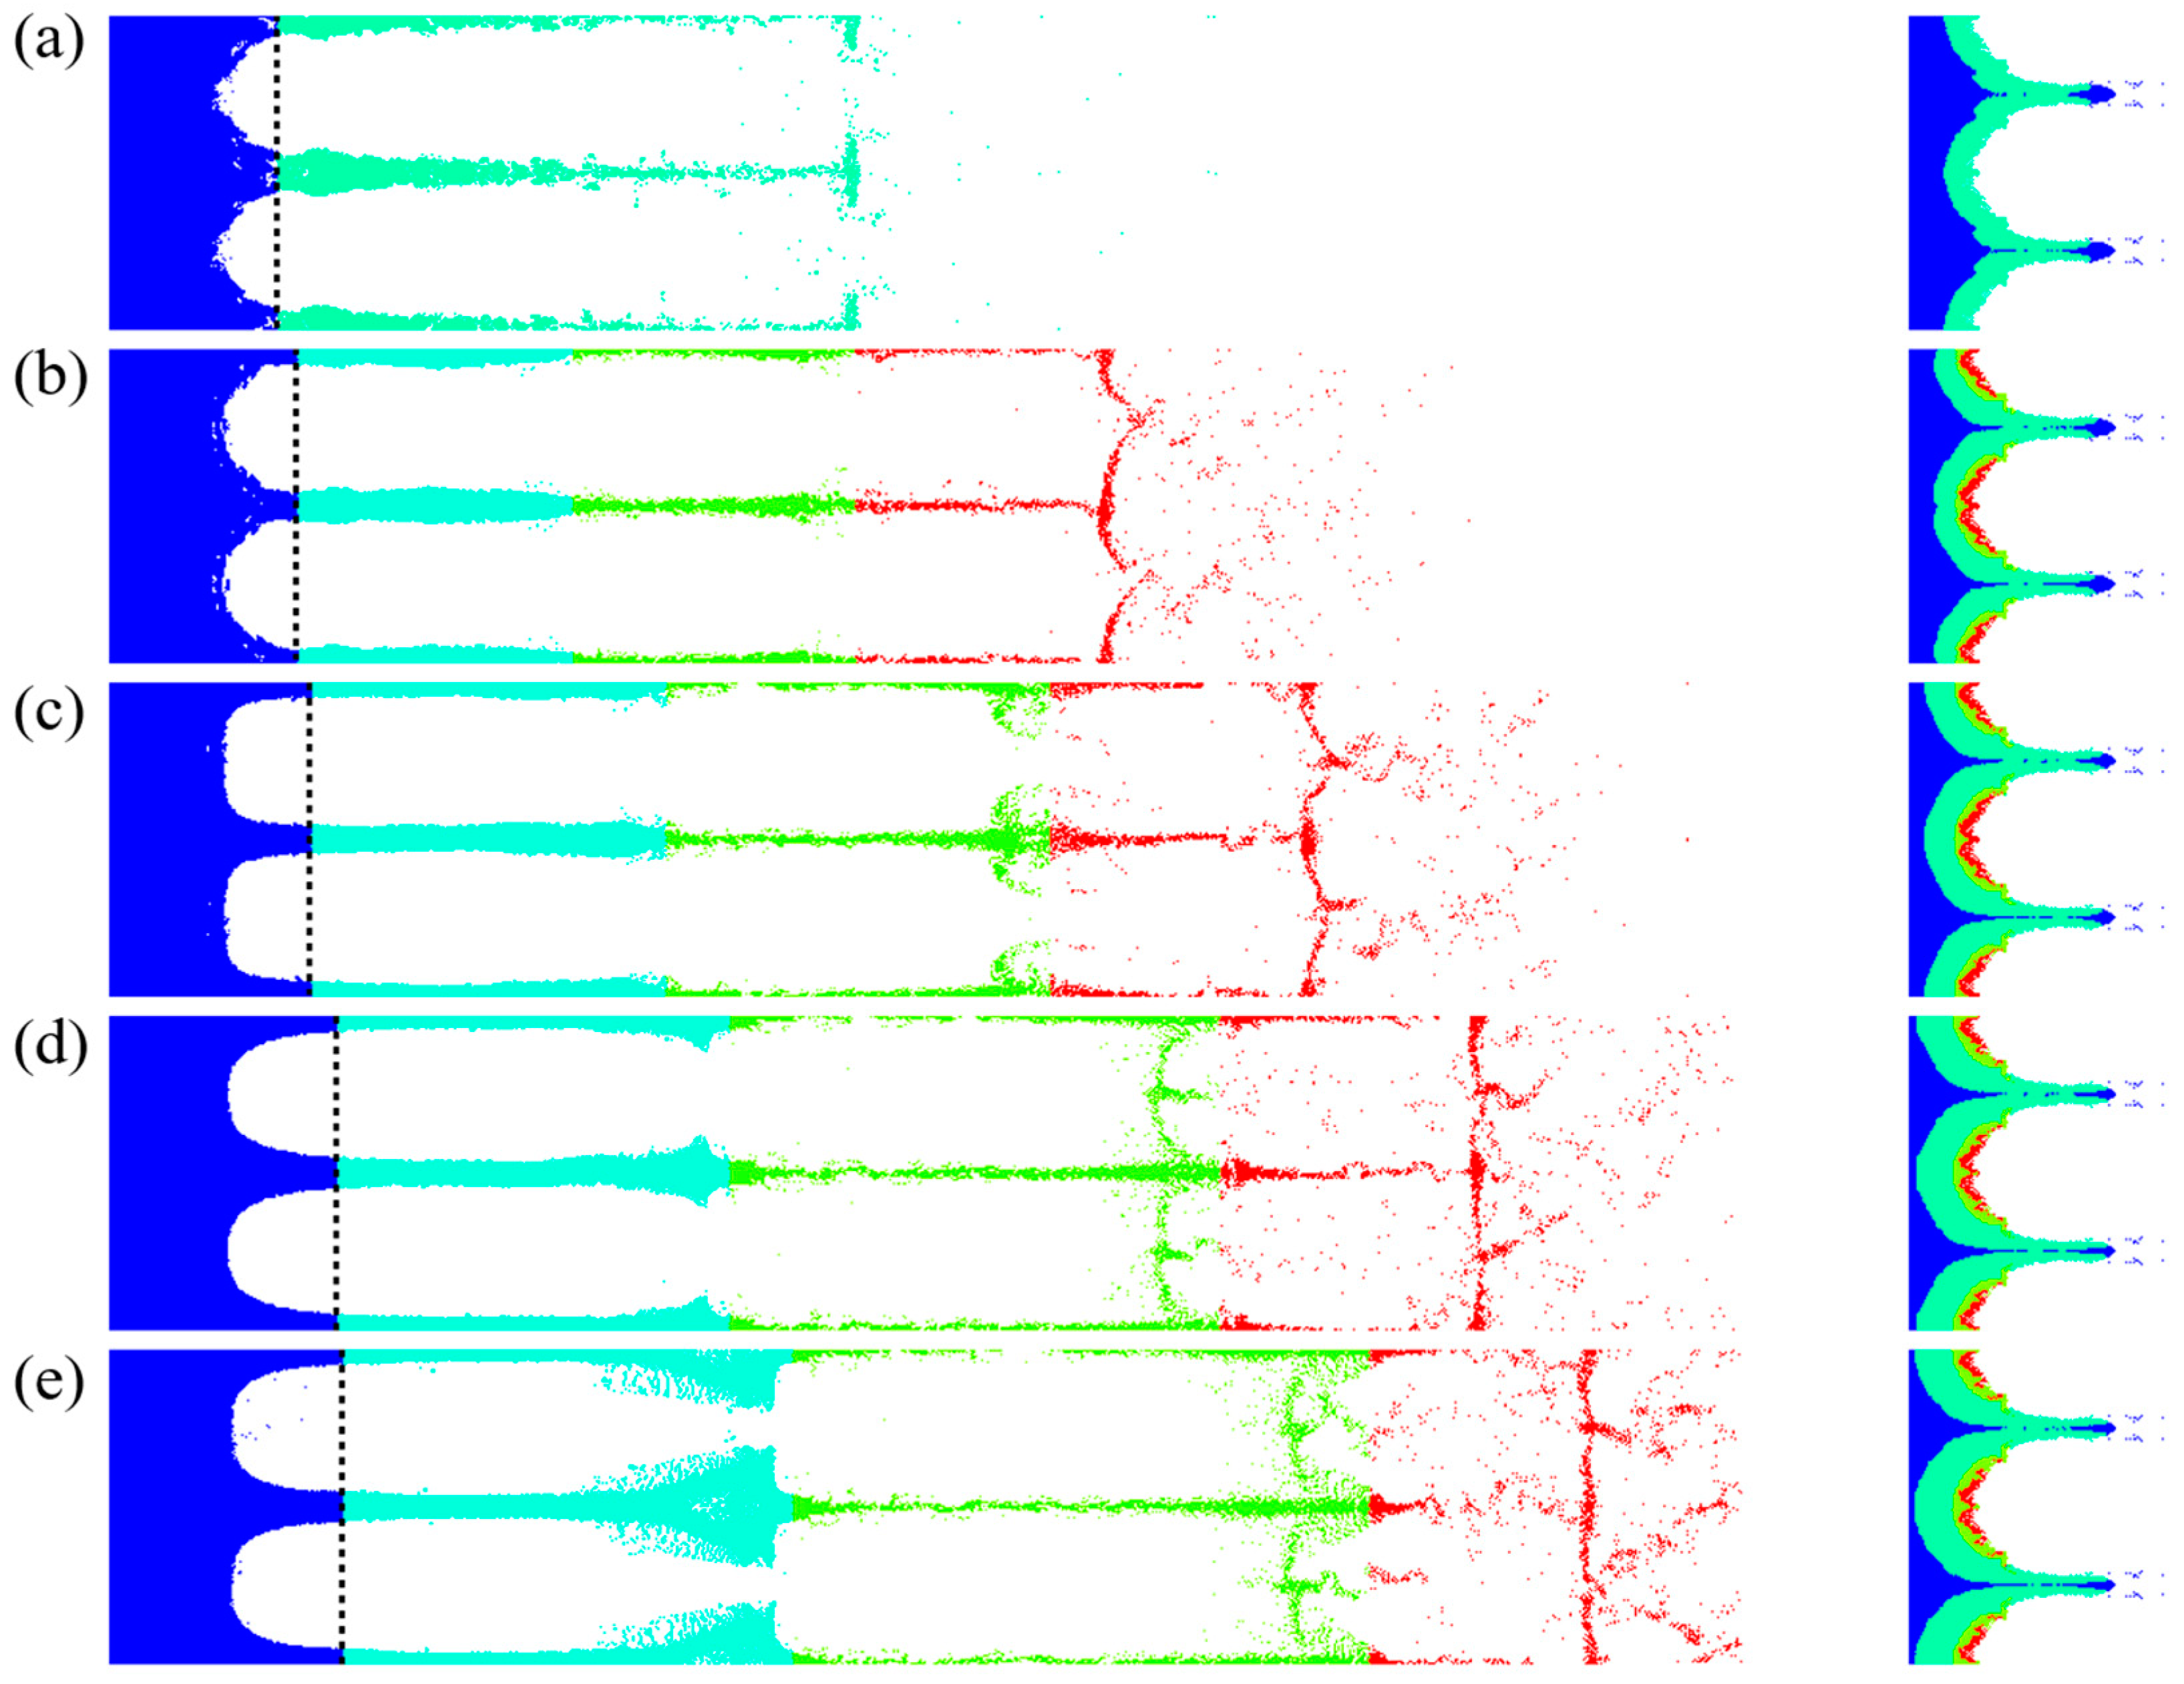
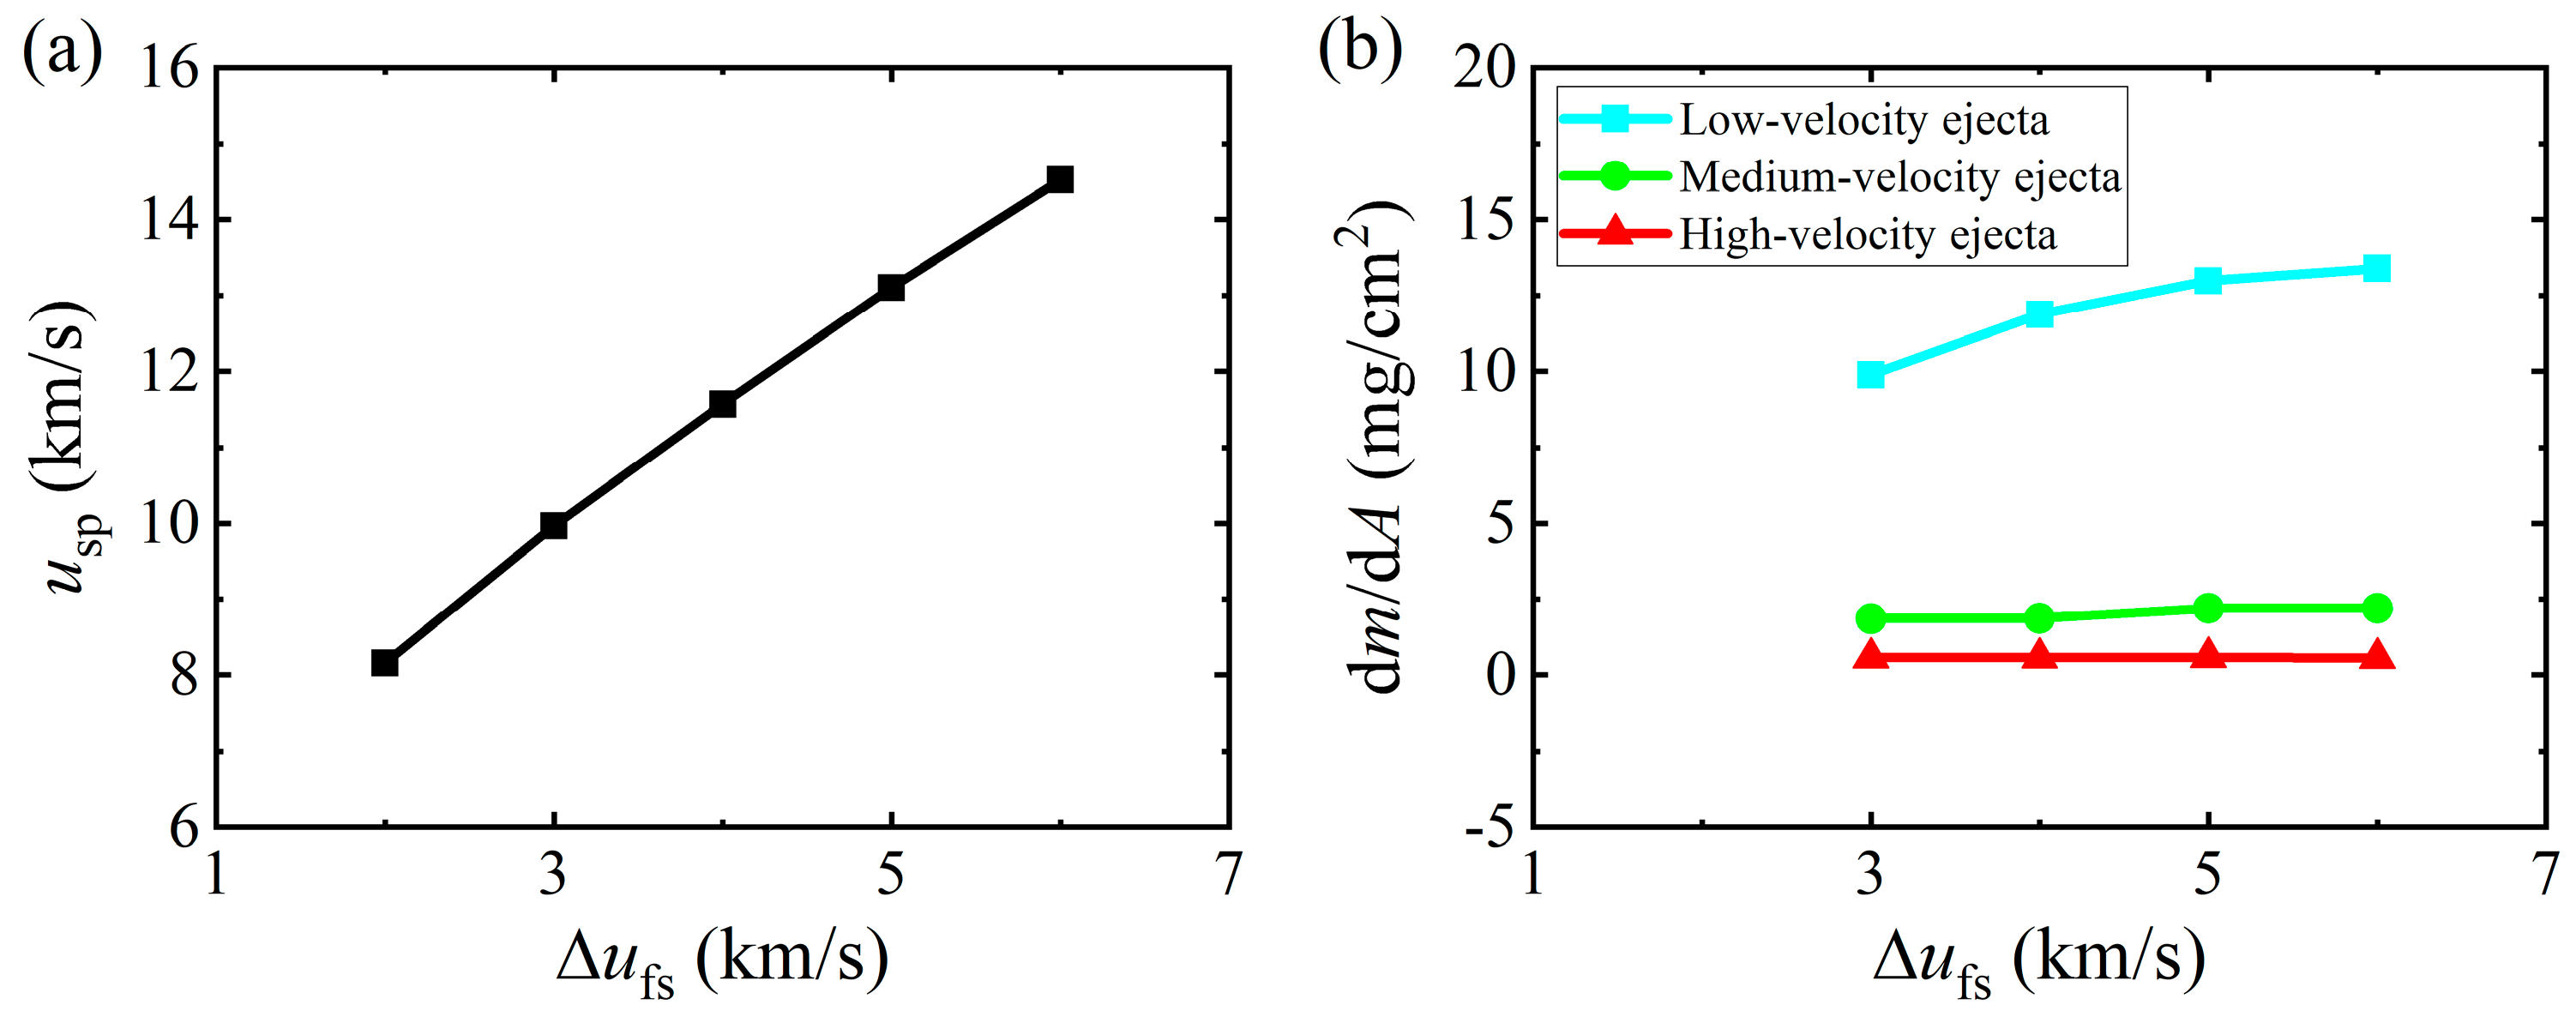
3.4. Effect of the Time Interval on the Second Ejection

This section discusses the effect of the time interval on the second ejection. The second shock pressure was maintained at the same value as the first ejection, 43.0 GPa. Time intervals of 50, 95, 145, 195, and 245 ns were investigated.
Figure 14 presents the density distribution of the second ejection for 300 ns after the second shock wave reaches the bottom of the bubble at different time intervals. The high-, medium-, and low-velocity ejecta demonstrated obvious changes with varying time intervals. The material behind the spike in the high-velocity ejecta exhibited significant fragmentation for a short time interval of 50 ns. The structural integrity of the high-velocity ejecta improved as the time interval increased, resulting in a more stable configuration. Similarly, the medium-velocity ejecta displayed pronounced changes in structure. A prominent spike structure was formed at the head of the medium-velocity ejecta at shorter time intervals. The phenomenon occurred due to the limited opening of the spallation region at the bottom of the bubble when the time interval was short. The strong jet convergence effect contributed to forming a distinct spike structure. The spallation region at the bottom of the bubble gradually widened as the time interval increased, leading to a gradual weakening and eventual stabilization of the spike structure in the medium-velocity ejecta. The low-velocity ejecta was also significantly influenced by the time interval, primarily due to the convergence effect of the first ejecta. The development of the first ejecta was insufficient at shorter time intervals, resulting in the absence of a prominent spike structure in the low-velocity ejecta of the second ejection. The enhanced development of the first ejecta contributed to gradually enlarging the spike structure in the low-velocity ejecta of the second ejection with increasing time intervals.
Figure 15 illustrates the density and cumulative area density distributions along the shock direction at various time intervals. No clear boundary was observed between the high-, medium-, and low-ejecta for shorter time intervals, resulting in a relatively smooth density distribution. Distinct boundaries began to form between the high-, medium-, and low-velocity ejecta with increasing time intervals. Additionally, the spike density of the low-velocity ejecta gradually increased, reaching a maximum of 0.894 g/cm3 at a time interval of 245 ns. The cumulative area density distribution revealed that the total mass of the second ejecta at all the time intervals was significantly higher than that of the first ejecta. The total mass of the second ejecta gradually stabilized with increasing time intervals, which was attributed to the gradual stabilization of the bubble region. The total masses for time intervals of 195 and 245 ns were approximately identical, measuring approximately 15.619 mg/cm2.
Figure 16 depicts the source distributions of different velocity ejecta at various time intervals. The source distributions of medium- and low-velocity ejecta were presented together for the time interval of 50 ns because it was difficult to distinguish between them. As the time interval increased, the source distributions of the high- and medium-velocity ejecta remained approximately constant. However, the low-velocity ejecta gradually extended further into the interior of the sample and saturated as the bubble and spallation regions stabilized. Although the first ejecta detached from the substrate, they were captured by the second ejecta and incorporated into the low-velocity ejecta during the second ejection at the time interval of 245 ns.
Figure 17 shows variation in spike velocity and total mass of the different velocity ejecta for various time intervals. As the time interval increased, the spike velocity of the second ejecta gradually decreased. The spike velocity converged to a constant value when the bubble morphology stabilized. The total masses of the high- and medium-velocity ejecta remained approximately constant with increasing time intervals. However, the total mass of the low-velocity ejecta steadily increased. After stabilizing the bubble morphology, the total mass of low-velocity ejecta converged to a constant value of 12.897 mg/cm2.

4. Discussion

The total mass of the second ejecta is an important aspect of the study of the ejection, but the lack of clarity of the physical mechanism prevented its further study. Buttler et al. [18] examined the second ejection using an explosively driven two-shockwave apparatus. The results showed that there were two mechanisms leading to second ejection: RM instability and the recompression of localized spallation, where the recompression of localized spallation led to a significant increase in the total mass of the second ejecta. Karkhanis et al. [20] developed a theoretical model for the total mass of the second ejecta based on the RM in-stability theory in the case where the material underwent melting, with hydrodynamic simulations validating their results. However, the model was unable to reproduce the phenomenon of a significant increase in total mass. Recently, Wu et al. [59] investigated the ejection production from twice-shocked tin using MD simulations. They found that the second ejecta was also related to the first ejecta. In summary, the present research results attribute the source of the second ejecta to RM instability, the recompression of localized spallation, and the convergence of the first ejecta. However, the physical mechanism of the second ejection is still in the exploratory stage, and the lack of more systematic and detailed studies hinders the theoretical modeling of the total mass of the second ejecta. Revealing the physical mechanism of the second ejection and the generation mechanism of the second ejecta is an urgent requirement for the present research and the basis for theoretical modeling.
In this paper, we studied the elastic–plastic ejection from grooved aluminum surfaces under double supported shocks using the SPH method. In agreement with the experimental results [18], a spallation region was formed at the bottom of the bubble in the first ejection due to the rarefaction wave interactions, and we obtained the evolution law of this spallation region and its influence on the bubble evolution. This phenomenon has not been observed in previous MD simulations since the spallation strength of solid Al is up to 8 GPa at high strain rates [60], whereas it is only 2–3 GPa in the explosion drive experiments. Further, we obtained the spatial structure of the second ejecta, including low-density high- and medium-velocity ejecta formed due to the recompression of the spallation material, and high-density low-velocity ejecta formed due to RM instability and the convergence of the first ejecta. The total mass of the second ejecta (15.259 mg/cm2) was significantly increased compared to the first ejecta (3.889 mg/cm2). The increase in bubble area due to the spallation region led to a significant increase in the mass of the low-velocity ejecta due to RM instability and ultimately led to a significant increase in the total mass of the second ejecta. This finding differed from the results of Buttler et al. [18], which attributed the significant increase in the total mass of the second ejecta to the recompression of localized spallation. Therefore, the simulation results in the present study were expected to provide a new idea and theoretical basis for the subsequent modeling of the total mass of the second ejecta.
We analyzed the effect of the shock pressure on the second ejection. The shock pressure threshold required for the second ejection was significantly reduced compared with the first ejection. This is consistent with the experimental results [18] that a significant amount of second ejecta was formed despite the significant reduction in second shock pressure [18]. Therefore, the pressure threshold for forming the second ejecta should also be an important aspect of the modeling. This is due to the fact that in engineering applications, the peak pressure will inevitably decrease due to the reflection and transmission of shock waves. In addition, we analyzed the effect of the time interval on the second ejection. As the time interval increases, the total mass of the second ejecta gradually tends to a constant value due to the stabilization of the spallation region at the bottom of the bubble. This feature will be useful for modeling the total mass of the second ejecta at long time intervals.
Spallation and recompression are an important issue in the numerical simulations of second ejection. In this study, we adopt a threshold stress criterion to deal with this problem. The particle undergoes spallation when the pressure falls below the spallation strength. Then, the pressure and deviatoric stress tensor components of the particle are set to zero following spallation, and subsequently treat the particle as a fluid, i.e., it cannot experience negative pressure and deviatoric stress. We have conducted numerical validations of this treatment. On the one hand, we simulated 2D high velocity impact, and the spatial structure of the debris cloud is consistent with the experimental results. On the other hand, we simulated the second ejection under laser-driven shock loading, and the main features of the simulation results for the second ejection are in good agreement with the experimental results. Therefore, the treatment of spallation and recompression in the program is applicable. However, spallation and recompression remain a problem to be considered in subsequent numerical simulations, which dominate the evolution of the bubble as well as the formation of the second ejecta. Some MD simulations and modeling have been carried out for this problem [61,62,63], but little work has been applied to hydrodynamic simulations. The macroscopic modeling and application of spallation and recompression should also be an important part of future work on second ejection.

5. Conclusions

In this study, we investigated the elastic–plastic ejection from grooved aluminum surfaces under double supported shocks using the SPH method. First, the present method was validated by the pressure–temperature relationship of the material during the loading and unloading of the shock wave and the 2D high-velocity impact. Then, the mechanism of the second ejection, and the effects of the second shock pressure and time interval on the second ejection were analyzed. The main conclusions are summarized as follows:
(1) The spallation region, formed at the bottom of the bubble during the first ejection due to rarefaction wave interactions, initially expanded fan-shaped into the sample interior, followed by widening and eventual stabilization. The second ejecta can be classified into high-, medium-, and low-velocity categories with clear boundaries. The total mass of the second ejection increased significantly compared to the first ejection. High- and medium-velocity ejecta were primarily generated by the recompression of spallation material, while the majority of the total mass of the second ejecta arose from low-velocity ejecta due to the significant increase in the defect area of the bubble and the convergence of the first ejecta.
(2) The shock pressure threshold required for the second ejection was significantly reduced compared with the first ejection. A distinct second ejection with a total mass of 8.793 mg/cm2 was observed at a second shock pressure of 16.9 GPa, surpassing the total mass of the first ejection (3.889 mg/cm2). The maximum velocity of the second ejecta increased linearly with the surface jump velocity. The total mass of the second ejecta increased with the surface jump velocity. However, the rate of increase gradually decreased, primarily affecting the low-velocity ejecta, whereas the total mass of the high- and medium-velocity ejecta remained approximately constant.
(3) The second ejection was significantly affected by the time interval between shocks, primarily due to the evolution of the spallation region at the bottom of the bubble in the first ejection and the convergence of the first ejecta. The structures of the high- and medium-velocity ejecta stabilized owing to the stabilization of the spallation region, while the low-velocity ejecta continued to evolve due to the interaction with the first ejecta. The maximum velocity of the second ejection decreased and converged to a constant value as the time interval increased. Furthermore, the total mass of the high- and medium-velocity ejecta remained approximately constant, while the total mass of the low-velocity ejecta increased progressively, stabilizing at a constant value over time.

Author Contributions

Conceptualization, W.L.; methodology, W.L.; software, W.L.; validation, W.L. and H.X.; formal analysis, W.L.; investigation, W.L. and H.X.; resources, W.L.; data curation, W.L. and H.X.; writing—original draft preparation, W.L.; writing—review and editing, W.L. and H.X.; visualization, W.L.; supervision, W.L.; project administration, W.L.; funding acquisition, W.L. All authors have read and agreed to the published version of the manuscript.

Funding

This research was funded by China Postdoctoral Science Foundation, grant number 2023M740256.

Institutional Review Board Statement

Not applicable.

Informed Consent Statement

Not applicable.

Data Availability Statement

The original contributions presented in this study are included in the article. Further inquiries can be directed to the corresponding author.

Conflicts of Interest

The authors declare no conflicts of interest.

References

  1. Buttler, W.T.; Williams, R.J.R.; Najjar, F.M. Foreword to the Special Issue on Ejecta. J. Dyn. Behav Mater. 2017, 3, 151–155. [Google Scholar]
  2. Wang, P.; He, A.M.; Shao, J.L.; Sun, H.Q.; Chen, D.W.; Liu, W.B.; Liu, J. Numerical and theoretical investigations of shock-induced material ejection and ejecta-gas mixing. Sci. China Phys. Mech. Astron. 2018, 48, 094608. (In Chinese) [Google Scholar]
  3. Zellner, M.B.; Byers, M.; Dimonte, G.; Hammerberg, J.E.; Germann, T.C.; Rigg, P.A.; Buttler, W.T. Influence of shockwave profile on ejecta. AIP Conf. Proc. 2009, 1195, 1047–1050. [Google Scholar]
  4. Monfared, S.K.; Oŕo, D.M.; Grover, M.; Hammerberg, J.E.; LaLone, B.M.; Pack, C.L.; Schauer, M.M.; Stevens, G.D.; Stone, J.B.; Turley, W.D.; et al. Experimental observations on the links between surface perturbation parameters and shock-induced mass ejection. J. Appl. Phys. 2014, 116, 063504. [Google Scholar]
  5. de Rességuier, T.; Prudhomme, G.; Roland, C.; Brambrink, E.; Loison, D.; Jodar, B.; Lescoute, E.; Sollier, A. Picosecond x-ray radiography of microjets expanding from laser shock-loaded grooves. J. Appl. Phys. 2018, 124, 065106. [Google Scholar]
  6. Xu, M.Y.; Song, W.D.; Wang, C.; Wang, P.; Shao, J.L.; Tang, E.L. Theoretical and experimental study on the hypervelocity impact induced microjet from the grooved metal surface. Int. J. Impact Eng. 2021, 156, 103944. [Google Scholar]
  7. Bober, D.B.; Mackay, K.K.; Akin, M.C.; Najjar, F.M. Understanding the evolution of liquid and solid microjets from grooved Sn and Cu samples using radiography. J. Appl. Phys. 2021, 130, 045901. [Google Scholar]
  8. Shao, J.L.; Wang, P.; He, A.M.; Duan, S.Q.; Qin, C.S. Atomistic simulations of shock-induced microjet from a grooved aluminium surface. J. Appl. Phys. 2013, 113, 153501. [Google Scholar]
  9. Liu, W.B.; Ma, D.J.; He, A.M.; Wang, P. Ejecta from periodic grooved Sn surface under unsupported shocks. Chin. Phys. B 2018, 27, 016202. [Google Scholar]
  10. Wang, F.; Liu, J.; He, A.M.; Wang, P.; Wang, J.G. Ejecta production from metal Sn into inert gases. J. Appl. Phys. 2020, 127, 195901. [Google Scholar]
  11. Durand, O.; Soulard, L.; Colombet, L.; Prat, R. Influence of the phase transitions of shock-loaded tin on microjetting and ejecta production using molecular dynamics simulations. J. Appl. Phys. 2020, 127, 175901. [Google Scholar] [CrossRef]
  12. Mackay, K.K.; Najjar, F.M.; Ali, S.J.; Eggert, J.H.; Rinderknecht, H.G.; Stan, C.V.; Saunders, A.M. Hydrodynamic computations of high-power laser drives generating metal ejecta jets from surface grooves. J. Appl. Phys. 2020, 128, 215904. [Google Scholar] [CrossRef]
  13. Buttler, W.T.; Oŕo, D.M.; Preston, D.L.; MIkaelian, K.O.; Cherne, F.J.; Hixson, R.S.; Mariam, F.G.; Morris, C.; Stone, J.B.; Terrones, G.; et al. Unstable Richtmyer-Meshkov growth of solid and liquid metals in vacuum. J. Fluid Mech. 2012, 703, 60–84. [Google Scholar] [CrossRef]
  14. Dimonte, G.; Terrones, G.; Cherne, F.J.; Ramaprabhu, P. Ejecta source model based on the nonlinear Richtmyer-Meshkov instability. J. Appl. Phys. 2013, 113, 024905. [Google Scholar] [CrossRef]
  15. Karkhanis, V.; Ramaprabhu, P.; Cherne, F.J.; Hammerberg, J.E.; Andrews, M.J. A numerical study of bubble and spike velocities in shock-driven liquid metals. J. Appl. Phys. 2018, 123, 025902. [Google Scholar] [CrossRef]
  16. Cherne, F.J.; Hammerberg, J.E.; Andrews, M.J.; Karkhanis, V.; Ramaprabhu, P. On shock driven jetting of liquid from non-sinusoidal surfaces into a vacuum. J. Appl. Phys. 2015, 118, 185901. [Google Scholar] [CrossRef]
  17. He, A.M.; Liu, J.; Liu, C.; Wang, P. Numerical and theoretical investigation of jet formation in elastic-plastic solids. J. Appl. Phys. 2018, 124, 185902. [Google Scholar] [CrossRef]
  18. Buttler, W.T.; Oŕo, D.M.; Olson, R.T.; Cherne, F.J.; Hammerberg, J.E.; Hixson, R.S.; Monfared, S.K.; Pack, C.L.; Rigg, P.A.; Stone, J.B.; et al. Second shock ejecta measurements with an explosively driven two-shockwave drive. J. Appl. Phys. 2014, 116, 103519. [Google Scholar] [CrossRef]
  19. Liu, W.B.; Xi, T.; He, A.M.; Zhou, T.T.; Xin, J.T.; Liu, N.S.; Wang, P. Numerical and experimental study of the second ejection from a grooved tin surface under laser-driven shock loading. Int. J. Impact Eng. 2022, 161, 104135. [Google Scholar] [CrossRef]
  20. Karkhanis, V.; Ramaprabhu, P.; Buttler, W.T.; Hammerberg, J.E.; Cherne, F.J.; Andrews, M.J. Ejecta production from second shock: Numerical simulations and experiments. J. Dyn. Behav Mater. 2017, 3, 265–279. [Google Scholar] [CrossRef]
  21. Lucy, L.B. Numerical approach to testing of fission hypothesis. Astron. J. 1977, 82, 1013–1024. [Google Scholar]
  22. Gingold, R.A.; Monaghan, J.J. Smoothed particle hydrodynamics: Theory and application to non-spherical stars. Mon. Not. R. Astron. Soc. 1977, 181, 375–389. [Google Scholar]
  23. Lind, S.J.; Rogers, B.D.; Stansby, P.K. Review of smoothed particle hydrodynamics: Towards converged Lagrangian flow modelling. Proc. R. Soc. A. 2020, 476, 20190801. [Google Scholar]
  24. Sun, P.N.; Colagrossi, A.; Marrone, S.; Zhang, A.M. The plus-SPH model: Simple procedures for a further improvement of the SPH scheme. Comput. Methods Appl. Mech. Eng. 2017, 315, 25–49. [Google Scholar]
  25. Ye, T.; Pan, D.Y.; Huang, C.; Liu, M.B. Smoothed particle hydrodynamics (SPH) for complex fluid flows: Recent developments in methodology and applications. Phys. Fluids. 2019, 21, 011301. [Google Scholar] [CrossRef]
  26. Antona, R.; Vacondio, R.; Avesani, D.; Righetti, M.; Renzi, M. Towards a High Order Convergent ALE-SPH Scheme with Efficient WENO Spatial Reconstruction. Water 2021, 13, 2432. [Google Scholar] [CrossRef]
  27. Xu, X.Y.; Cheng, J.; Peng, S.; Yu, P. Numerical simulations of Phan-Thien-Tanner viscoelastic fluid flows based on the SPH method. Eng. Anal. Bound. Elem. 2024, 158, 473–485. [Google Scholar]
  28. Sugiura, K.; Inutsuka, S. An extension of Godunov SPH II: Application to elastic dynamics. J. Comput. Phys. 2017, 333, 78–103. [Google Scholar]
  29. Wang, L.; Xu, F.; Yang, Y. An improved total Lagrangian SPH method for modeling solid deformation and damage. Eng. Anal. Bound. Elem. 2021, 133, 286–302. [Google Scholar]
  30. Rahimi, M.N.; Moutsanidis, G. A smoothed particle hydrodynamics approach for phase field modeling of brittle fracture. Comput. Methods Appl. Mech. Eng. 2022, 398, 115191. [Google Scholar]
  31. Antuono, M.; Pilloton, C.; Colagrossi, A.; Durante, D. Clone particles: A simplified technique to enforce solid boundary conditions in SPH. Comput. Methods Appl. Mech. Eng. 2023, 409, 115973. [Google Scholar]
  32. Liu, W.B.; Duan, Z.P.; Liu, Y.; Huang, F.L. 3D hybrid particle contact method for ignition response of high explosives and high velocity impact. Appl. Math. Model. 2025, 140, 115911. [Google Scholar]
  33. Zhang, A.M.; Sun, P.N.; Ming, F.R.; Colagrossi, A. Smoothed particle hydrodynamics and its applications in fluid-structure interactions. J. Hydrodyn. 2017, 29, 187–216. [Google Scholar]
  34. Gao, T.R.; Qiu, H.H.; Fu, L. A block-based adaptive particle refinement SPH method for fluid-structure interaction problems. Comput. Methods Appl. Mech. Eng. 2022, 399, 115356. [Google Scholar]
  35. Khayyer, A.; Gotoh, H.; Shimizu, Y.; Gotoh, T. An improved Riemann SPH-Hamiltonian SPH coupled solver for hydroelastic fluid-structure interactions. Eng. Anal. Bound. Elem. 2024, 158, 332–355. [Google Scholar]
  36. Feng, R.F.; Fourtakas, G.; Rogers, B.D.; Lombardi, D. A general smoothed particle hydrodynamics (SPH) formulation for coupled liquid flow and solid deformation in porous media. Comput. Methods Appl. Mech. Eng. 2024, 419, 116581. [Google Scholar]
  37. Bao, T.T.; Hu, J.; Wang, S.J.; Huang, C.; Yu, H.; Shakibaeinia, A. An entirely SPH-based FSI solver and numerical investigations on hydrodynamic characteristics of the flexible structure with an ultra-thin characteristic. Comput. Methods Appl. Mech. Eng. 2024, 431, 117255. [Google Scholar]
  38. Fan, H.F.; Bergel, G.L.; Li, S.F. A hybrid peridynamics–SPH simulation of soil fragmentation by blast loads of buried explosive. Int. J. Impact Eng. 2016, 87, 14–27. [Google Scholar]
  39. Zhang, Z.L.; Liu, M.B. Smoothed particle hydrodynamics with kernel gradient correction for modeling high velocity impact in two- and three-dimensional spaces. Eng. Anal. Bound. Elem. 2017, 83, 141–157. [Google Scholar]
  40. Peng, Y.X.; Zhang, A.M.; Ming, F.R. Numerical simulation of structural damage subjected to the near-field underwater explosion based on SPH and RKPM. Ocean. Eng. 2021, 222, 108576. [Google Scholar]
  41. Chen, J.Y.; Feng, D.L.; Liu, J.H.; Yu, S.Y.; Lu, Y. Numerical modeling of the damage mechanism of concrete soil multilayered medium subjected to underground explosion using the GPU-accelerated SPH. Eng. Anal. Bound. Elem. 2023, 151, 265–274. [Google Scholar]
  42. Ceri, S.; Khodaei, Z.S. Numerical investigation of hypervelocity impact simulation with FEM/SPH formulation for space structures. Int. J. Impact Eng. 2024, 187, 104926. [Google Scholar]
  43. Liu, W.B.; He, A.M.; Wang, P. Effect of shock breakout pressure on material ejection from tin surface under unsupported shocks. AIP Adv. 2018, 8, 095023. [Google Scholar]
  44. Xin, J.T.; He, A.M.; Liu, W.B.; Chu, G.B.; Yu, M.H.; Fan, W.; Wu, W.C.; Xi, T.; Shui, M.; Zhao, Y.Q.; et al. X-ray radiography of microjetting from grooved surfaces in tin sample subjected to laser driven shock. J. Micromech. Microeng. 2019, 29, 095011. [Google Scholar]
  45. Liu, W.B.; He, A.M.; Wang, K.; Xin, J.T.; Shao, J.L.; Liu, N.S.; Wang, P. An improved model of damage depth of shock-melted metal in microspall under triangular wave loading. Chin. Phys. B 2021, 30, 096202. [Google Scholar]
  46. Libersky, L.D.; Petschek, A.G.; Carney, T.C.; Hipp, J.R.; Allahdadi, F.A. High strain lagrangian hydrodynamics: A three-dimensional SPH code for dynamic material response. J. Comput. Phys. 1993, 109, 67–75. [Google Scholar]
  47. Monaghan, J.J. Smoothed particle hydrodynamics. Rep. Prog. Phys. 2005, 68, 1703. [Google Scholar]
  48. Shao, J.R.; Li, H.Q.; Liu, G.R.; Liu, M.B. An improved SPH method for modeling liquid sloshing dynamics. Comput. Struct. 2012, 100–101, 18–26. [Google Scholar]
  49. Gray, J.P.; Monaghan, J.J.; Swift, R.P. SPH elastic dynamics. Comput. Methods Appl. Mech. Eng. 2001, 190, 6641–6662. [Google Scholar]
  50. Benz, W. Smooth Particle Hydrodynamics: A Review; Springer: Dordrecht, The Netherlands, 1990; pp. 269–288. [Google Scholar]
  51. Steinberg, D.J.; Cochran, S.G.; Guinan, M.W. A constitutive model for metals applicable at highstrain rate. J. Appl. Phys. 1980, 51, 1498. [Google Scholar]
  52. Xiang, M.Z.; Jiang, S.Q.; Chen, J. Theoretical investigations on melting/crystallization kinetics in overheated/overcooled aluminum at high pressures. J. Appl. Phys. 2019, 126, 125113. [Google Scholar] [CrossRef]
  53. Tang, W.H. Shock Wave Physics; Science Press: Beijing, China, 2011; pp. 162–247. (In Chinese) [Google Scholar]
  54. Kanel, G.I. Unusual behaviour of usual materials in shock waves. J. Phys. Conf. Ser. 2014, 500, 012001. [Google Scholar] [CrossRef]
  55. Ran, X.W.; Tang, W.H.; Tan, H.; Dai, C.D. Calculation of shock temperature by considering electronic contribution. Chin. J. High. Pressure Phys. 2006, 20, 153–156. (In Chinese) [Google Scholar]
  56. Mehta, S. Theoretical melt curves of Al, Cu, Ta and Pb. AIP Conf. Proc. 2006, 845, 258–261. [Google Scholar]
  57. Kanel, G.I.; Baumung, K.; Rush, D.; Singer, J.; Razorenov, S.V.; Utkin, A.V. Melting of shock-compressed metals in release. AIP Conf. Proc. 1998, 429, 155–158. [Google Scholar]
  58. Piekutowski, A.J. Characteristics of debris clouds produced by hypervelocity impact of aluminum spheres with thin aluminum plates. Int. J. Impact Eng. 1993, 14, 573–586. [Google Scholar] [CrossRef]
  59. Wu, B.; He, A.M.; Wang, X.X.; Sun, H.Q.; Wang, P. Numerical investigation of ejecta mass of twice-shocked liquid Sn. J. Appl. Phys. 2023, 133, 165903. [Google Scholar] [CrossRef]
  60. Jiang, D.D.; Shao, J.L.; Wu, B.; Wang, P.; He, A.M. Sudden change of spall strength induced by shock defects based on atomistic simulation of single crystal aluminum. Scr. Mater. 2022, 210, 114474. [Google Scholar] [CrossRef]
  61. Wang, J.N.; Wu, F.C.; Wang, P.; He, A.M.; Wu, H.A. Double-shock-induced spall and recompression processes in copper. J. Appl. Phys. 2020, 127, 135903. [Google Scholar] [CrossRef]
  62. Zhang, Q.; He, A.M.; Zhao, F.Q.; Zhou, T.T.; Wang, P. Understanding the spall behaviors of single crystalline aluminum under double decaying shock loadings: Atomistic simulations and theoretical models. Eur. J. Mech. A/Solids 2024, 105, 105237. [Google Scholar] [CrossRef]
  63. Sui, H.N.; Wang, X.X.; Wu, B.; Bao, Q.; Zhang, F.H.; Sun, H.Q.; He, A.M.; Wang, P. Cooperative competition between melt-phase and void during micro-spallation and recompression. Int. J. Mech. Sci. 2024, 275, 109276. [Google Scholar] [CrossRef]
Figure 1. Hugoniot curve, melting curve, and isentropic unloading curves for aluminum with shock pressure ranging from 1 GPa to 150 GPa. The Hugoniot curve and melting curve derived from SPH simulations were compared with the experimental data [55,56].
Applsci 15 03498 g001
Figure 2. Schematic diagram of the 2D computational model of a circular projectile impacting a target plate.
Applsci 15 03498 g002
Figure 3. Comparison of (a) simulation results with (b) experimental results at 6 µs and 19 µs [58].
Applsci 15 03498 g003
Figure 4. Schematic of the 2D computational model of the elastic–plastic ejection under double supported shocks.
Applsci 15 03498 g004
Figure 5. Dynamic evolution of the density during the first elastic–plastic ejection: (a) 60 ns, (b) 70 ns, (c) 100 ns, and (d) 300 ns.
Applsci 15 03498 g005
Figure 6. Bubble region evolution during the first ejection: (a) 65 ns, (b) 67 ns, (c) 70 ns, (d) 80 ns, (e) 90 ns, (f) 120 ns, (g) 170 ns, and (h) 300 ns.
Applsci 15 03498 g006
Figure 7. Dynamic evolution of the density during the second ejection: (a) 200 ns, (b) 205 ns, (c) 235 ns, (d) 300 ns, and (e) 500 ns.
Applsci 15 03498 g007
Figure 8. (a) Density and (b) cumulative area density distributions of the second ejecta along the shock direction at 500 ns. The black dashed line indicates the free-surface position and the orange dashed line indicates the total mass of the first ejecta. Regions I, II, and III denote the high-, medium-, and low-velocity ejecta, respectively.
Applsci 15 03498 g008
Figure 9. Source distribution of different velocity ejecta. (a) Different velocity ejecta at 500 ns (black dashed line indicates the free surface); (b) source distribution at 195 ns.
Applsci 15 03498 g009
Figure 10. Density (left) and phase (right) distributions of the second ejecta at different second shock pressures: (a) 16.9 GPa, (b) 28.5 GPa, (c) 43.0 GPa, (d) 57.7 GPa, and (e) 74.5 GPa.
Applsci 15 03498 g010
Figure 11. (a) Density and (b) cumulative area density distributions of the second ejecta along the shock direction for different second shock pressures. The slanted segment in (b) indicates the free-surface position.
Applsci 15 03498 g011
Figure 12. Source distributions of different velocity ejecta at different second shock pressures: (a) 16.9 GPa, (b) 28.5 GPa, (c) 43.0 GPa, (d) 57.7 GPa, and (e) 74.5 GPa. The left panel represents the results at 500 ns, and the second ejecta can be classified into high-velocity (red), medium-velocity (greed), and low-velocity (cyan) ejecta based on the spatial structure. The right panel represents the source distributions of different velocity ejecta when the second shock wave reaches the bottom of the bubble. The black dashed line indicates the free surface.
Applsci 15 03498 g012
Figure 13. (a) Spike velocity and (b) the total mass of different velocity ejecta at different second surface jump velocities. The spatial distribution of the high-velocity, medium-velocity, and low-velocity ejecta is shown in Figure 12.
Applsci 15 03498 g013
Figure 14. Density distribution of the second ejection for 300 ns after the second shock wave reaches the bottom of the bubble at different time intervals: (a) 50 ns, (b) 95 ns, (c) 145 ns, (d) 195 ns, and (e) 245 ns.
Applsci 15 03498 g014
Figure 15. (a) Density and (b) cumulative area density distributions along the shock direction for 300 ns after the second shock wave reaches the bottom of the bubble at different time intervals. The slanted segment in (b) indicates the free-surface position.
Applsci 15 03498 g015
Figure 16. Source distributions of different velocity ejecta at different time intervals: (a) 50 ns, (b) 95 ns, (c) 145 ns, (d) 195 ns, and (e) 245 ns. The left panel represents the results for 300 ns after the second shock wave reaches the bottom of the bubble, and the second ejecta can be classified into high-velocity (red), medium-velocity (greed), and low-velocity (cyan) ejecta based on the spatial structure. The right panel represents the source distributions of different velocity ejecta when the second shock wave reaches the bottom of the bubble. The black dashed line indicates the free surface.
Applsci 15 03498 g016
Figure 17. (a) Spike velocity and (b) the total mass of different velocity ejecta at different time intervals. The spatial distribution of high-velocity, medium-velocity, and low-velocity ejecta is shown in Figure 16.
Applsci 15 03498 g017
Table 1. Material parameters of aluminum [51,52,53].
ρ 0 g / cm 3 c 0 km / s s γ p Q GPa q
2.715.351.352.037.898.419
ρ 0 K g / cm 3 T m 0 K V m 0 cm 3 / g γ T c v J / g K G 0 GPa
2.76933.00.39862.350.85027.6
Y 0 GPa Y max GPa G p / G 0 GPa 1 G T / G 0 T 1 Y p / Y 0 GPa 1 Y T / Y 0 T 1
0.290.680.0650.000620.0650.00062
β n
125.00.10
Disclaimer/Publisher’s Note: The statements, opinions and data contained in all publications are solely those of the individual author(s) and contributor(s) and not of MDPI and/or the editor(s). MDPI and/or the editor(s) disclaim responsibility for any injury to people or property resulting from any ideas, methods, instructions or products referred to in the content.

