Abstract
Infrared imaging is based on thermal radiation and does not rely on visible light, allowing for it to operate normally at night and in low-light conditions. This characteristic is beneficial for regulatory authorities to monitor ships. Existing infrared image segmentation methods face challenges such as the absence of color information, blurred edges, weak high-frequency details, and low contrast due to the imaging principles. Consequently, the segmentation accuracy for small-sized ship targets and edges is low, influenced by the indistinct features of infrared images and the weak difference between the background and targets. To address these issues, this paper proposes an infrared image ship segmentation algorithm called the Infrared Image Edge-Enhanced Segmentation Network (IERNet) to extract ship temperature information. By using pseudo-color infrared images, the sensitivity to edges is enhanced, improving the edge features of ships in infrared images. The Sobel operator is used to obtain edge feature maps, and the Convolutional Block Attention Module (CBAM) extracts key feature information. In the Fusion Unit, edge features guide the extraction of infrared ship features in the backbone network, resulting in feature maps rich in edge information. Finally, a specialized loss function with edge weights supervises the fusion features. An eXtreme Gradient Boosting (XGBoost) machine learning model is then established to predict the ship image brightness temperature threshold, using engine brightness threshold, water area brightness threshold, boundary brightness threshold, and temperature gradient as predictive elements. In terms of image segmentation, our algorithm achieves a segmentation performance of 89.17% mIoU. Regarding the XGBoost model’s performance, it achieves high goodness of fit and small error values on both the training and testing sets, demonstrating its good performance in predicting ship temperature. The model achieves over 70% goodness of fit, and the RMSE values for both models are 3.472, indicating minimal errors. Statistical analysis reveals that the proportion of ship temperature differences predicted by the XGBoost model exceeding 2 is less than 0.020%. The proposed temperature detection method offers higher accuracy and versatility, contributing to more efficient detection of abnormal ship temperatures at night.
1. Introduction
The all-weather capability of infrared imaging offers extensive applications in ship management, including nighttime anomaly detection, illegal fishing surveillance, and smuggling monitoring. By capturing thermal radiation, infrared imaging enables the acquisition of clear images without the need for visible light, and can penetrate atmospheric obstacles such as smoke and haze. These advantages make it a superior solution compared to traditional visual monitoring technologies like SAR, ORS, and RGB cameras [1]. However, two major challenges remain unresolved in existing studies: the precise segmentation of ship targets from complex maritime infrared backgrounds with low contrast, as illustrated in Figure 1, and the interference of thermal noise. Additionally, accurately predicting temperature anomalies through the quantitative analysis of segmented thermal signatures remains a critical issue.

Figure 1.
Example of infrared image segmentation.
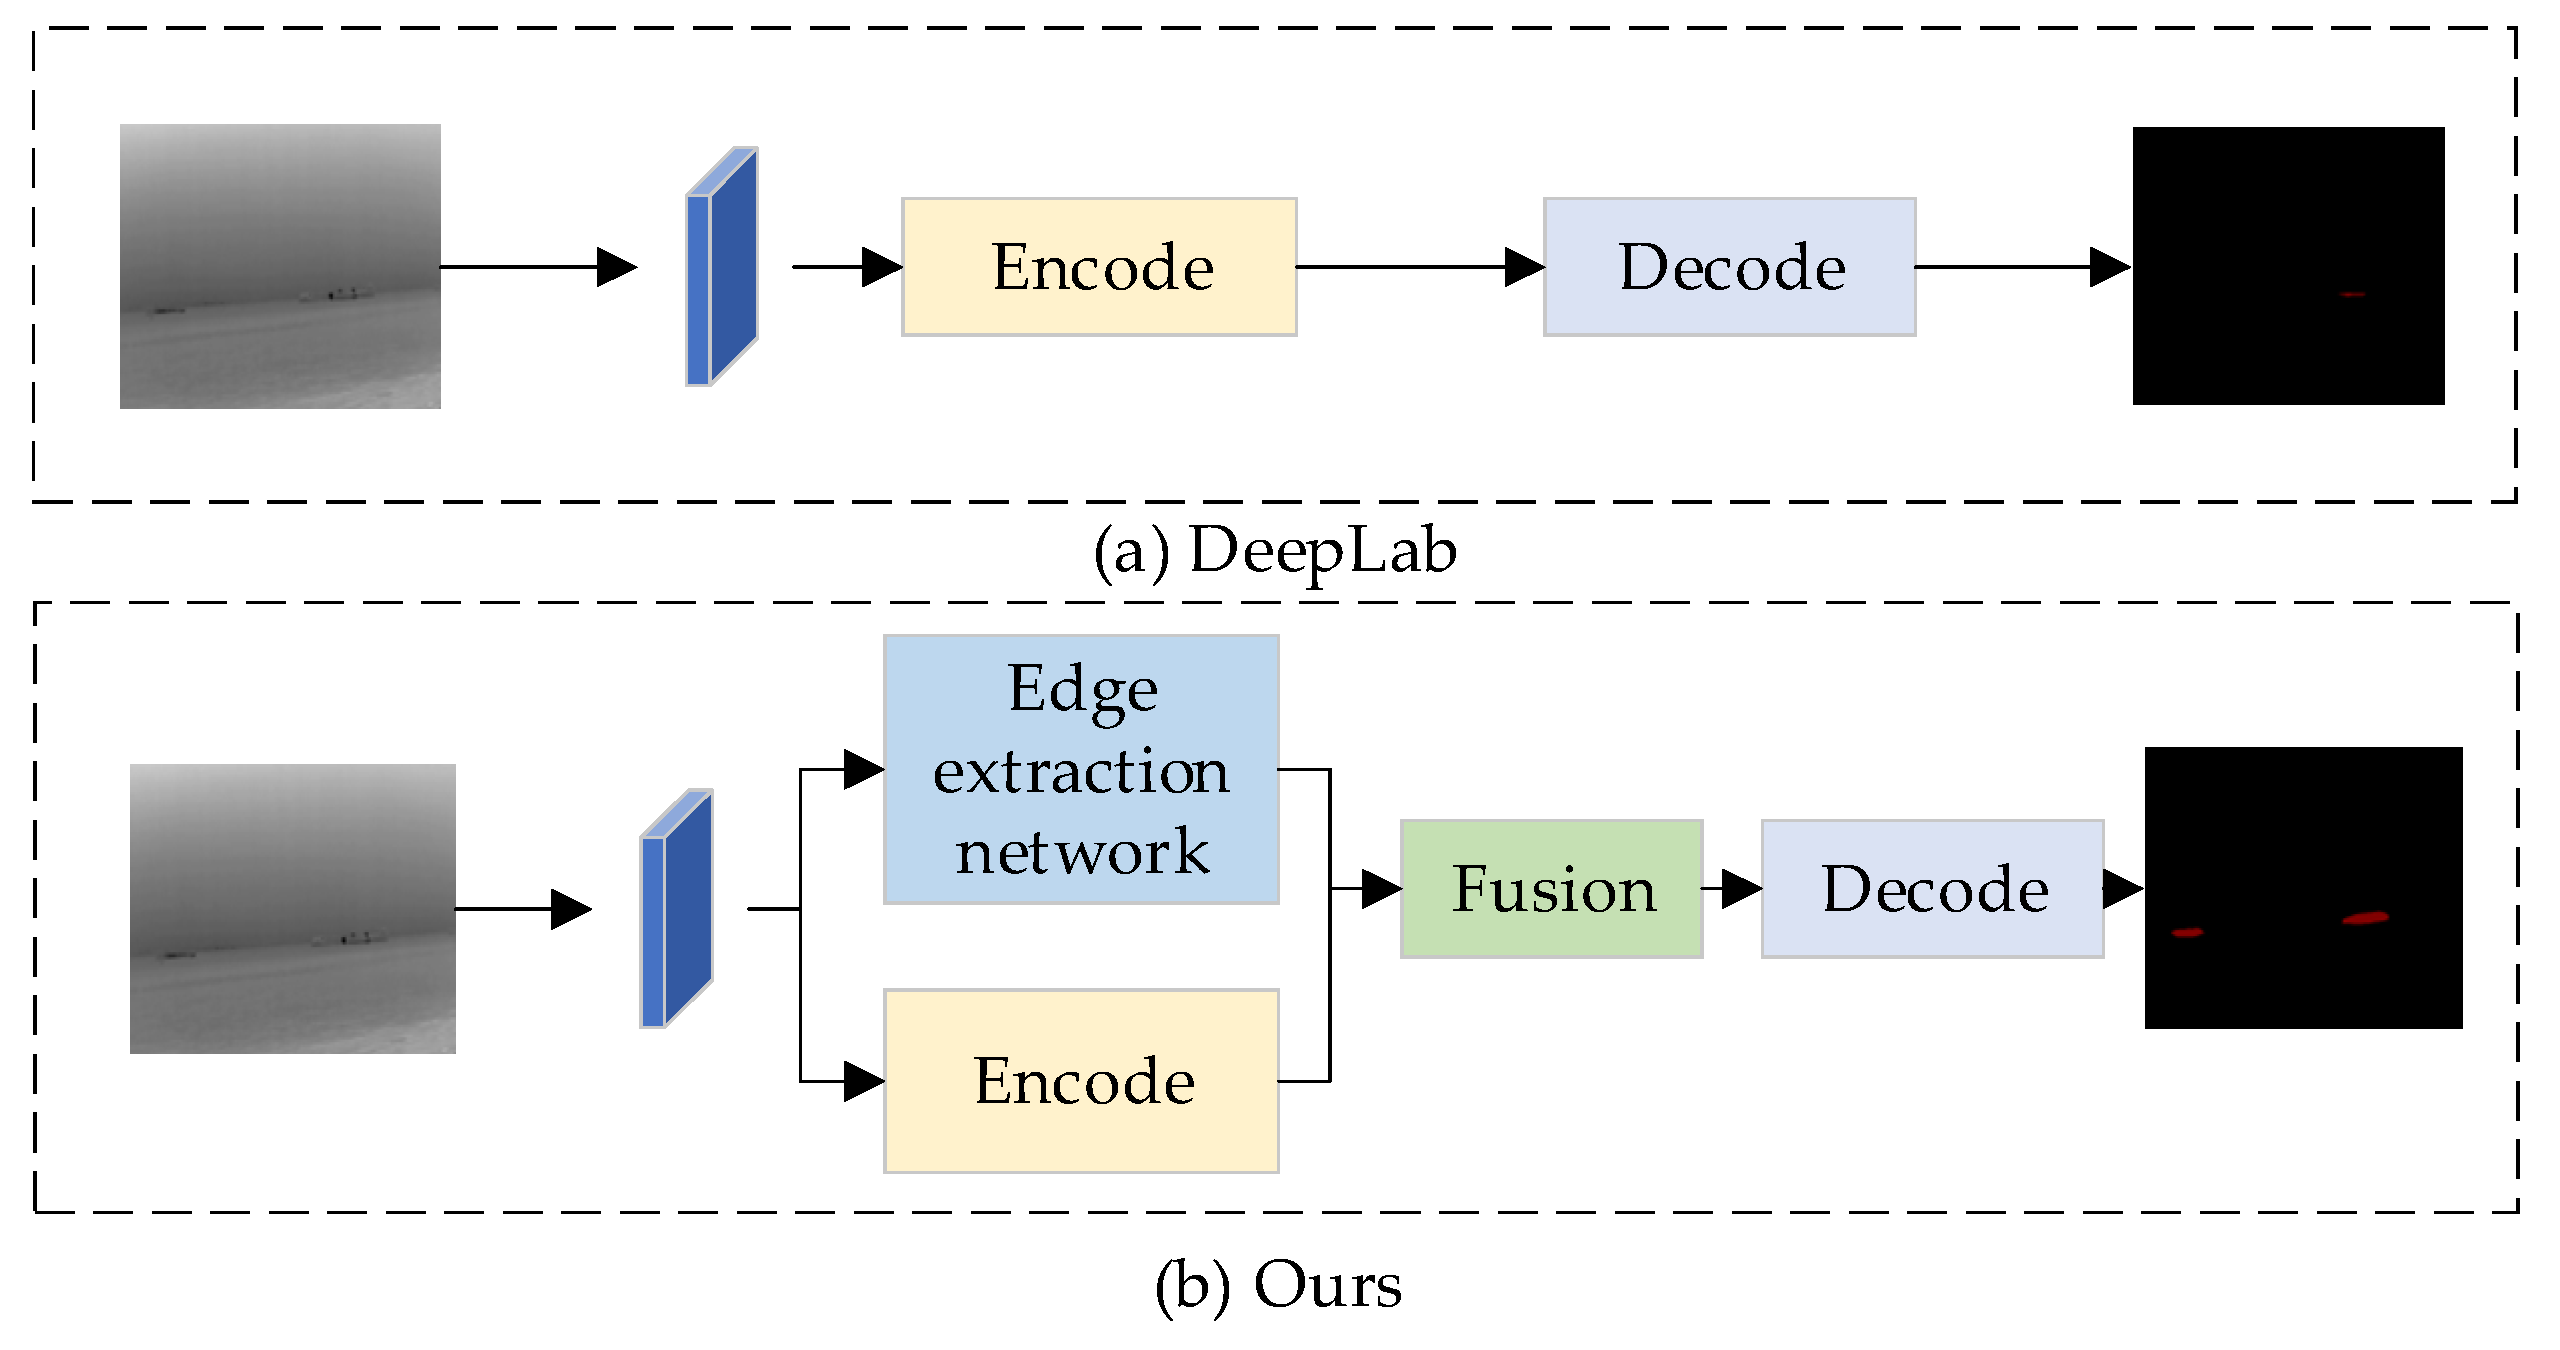
Infrared image segmentation faces significant challenges due to inherent limitations such as low contrast, small target sizes, and blurred boundaries, particularly when distinguishing ships from complex backgrounds in nighttime thermal imagery with elevated noise levels [2,3,4,5,6,7,8,9]. Research in this domain has evolved from traditional methods to deep learning-based approaches. Conventional techniques including threshold-based [10,11,12,13,14], clustering [15,16,17], and active contour segmentation [18,19] exhibit critical shortcomings: threshold methods fail to address spatial information despite enhancements like 2D maximum entropy [13], clustering approaches like mean shift [15] and FCM [16] demonstrate noise sensitivity, while active contours struggle with dynamic backgrounds. Recent advances in convolutional neural networks (CNNs) have improved feature extraction through architectures like PSANet’s adaptive attention masks [20], DeepLab-based multi-scale attention models [21], and IRDCLNet’s fog interference mitigation [22]. Further advancements include Yu et al. [23], who enhanced segmentation accuracy for turbine blades by integrating layered depth-separable convolution blocks into U-Net, and Xiong et al. [24], whose multi-level correction network (MCNet) combines attention and edge enhancement modules to better utilize shallow and edge features. Specialized solutions for ship segmentation include Sun et al. [25], who proposed Global Mask R-CNN with Precise RoI Pooling and Global Mask Head to preserve instance-level global information, and Bai et al. [26], who developed a fuzzy inference system integrating thresholding, region growing, and morphology for complete ship extraction. Li et al. [27] introduced a thermal imaging method combining grayscale morphology reconstruction, multi-feature saliency detection, and novel contour descriptors for small ship detection, while Xu et al. [28] demonstrated significant improvements in nighttime ocean observation through their CGSegNet model. Persistent issues in edge quality and small target segmentation necessitate specialized solutions, particularly given the inherently weak edge features in infrared imagery, where strengthening edge information improves segmentation accuracy [29,30,31]. Edge detection research combines traditional operators (Roberts [32], Prewitt [33], Sobel [34], Kirsch [35]) with deep learning innovations like DeepLabv1 [36], Gated-SCNN [37], and DeepLabv3 [38], which enhance boundary precision through dilated convolutions and shape learning. Building upon these foundations, our enhanced IERNet framework addresses critical limitations through multi-modal temperature adaptation and hierarchical edge enhancement. By synergistically integrating the Sobel operator’s gradient detection with deep feature perception, we establish a dual-strategy architecture optimized for infrared characteristics. As demonstrated in Figure 2, this approach overcomes existing methods’ deficiencies in small target segmentation (Figure 2a) through an edge-assisted detection module that significantly improves boundary delineation (Figure 2b) while maintaining computational efficiency. The framework further incorporates innovations from multi-level attention networks [39] and thermal feature utilization [40], achieving robust performance across diverse observational modes through adaptive multi-scale fusion and edge-aware feature refinement.

Figure 2.
Comparison with current advanced semantic segmentation algorithms.
Secondly, in acquiring brightness temperature data of ship compartments through infrared imaging, effectively detecting abnormal thermal variations emerges as a critical challenge for maritime safety monitoring, necessitating comprehensive evaluation of detection methodologies. Current approaches for abnormal temperature identification primarily encompass single-parameter methods, multi-parameter fusion techniques, and visual detection strategies. Single-parameter solutions such as thresholding [41,42], trend analysis, and slope analysis prioritize computational efficiency but exhibit limited accuracy. While threshold-based detection identifies anomalies through predefined thermal boundaries and trend analysis monitors temporal temperature patterns, these simplistic methods generally underperform compared to advanced alternatives. Recent machine learning advancements have introduced sophisticated prediction models, including Xu et al.’s Multi-LSTM Convolutional Neural Network (M-LCNN) for sea surface temperature forecasting [43], Gong et al.’s XGBoost-based ceramic thermal analysis [44], and Ding et al.’s XGBoost application in wildfire brightness threshold estimation [45]. Building upon these developments, our work employs XGBoost [46] to model ship cabin temperature transfer processes using infrared-derived thermal data, capitalizing on its generalization capacity, computational efficiency, and overfitting resistance for abnormal temperature prediction. Conversely, multi-parameter fusion methods enhance detection accuracy through comprehensive feature integration, as evidenced by Feng et al.’s extreme gradient boosting for sea temperature analysis [47], Qu et al.’s CNN-based ensemble learning for fire detection [48], and Deng et al.’s fuzzy neural network combining temperature, smoke, and CO concentrations [49]. Addressing challenges specific to ship compartment monitoring, particularly signal loss and false alarms arising from parameter complexity, our proposed framework extends these multi-feature fusion principles by developing a temperature-centric detection architecture optimized for maritime thermal anomaly identification in infrared imagery.
To address the above challenges, the contributions of this paper include the following: we propose a novel ship segmentation framework designed specifically for infrared ship scenes that incorporates contour enhancement and multi-level feature fusion. This framework accurately predicts ship masks in infrared images, significantly improving segmentation precision, especially for small target features and ship edges. To address the scarcity of infrared data for ships on the water, we captured over 2000 images of ships in the Pearl River region, annotating 1000 of them with more than 1000 target masks. To tackle the challenges of edge blurring and low background contrast in infrared images, we developed an edge enhancement network that strengthens edge features, thus improving segmentation accuracy. Additionally, for segmenting small maritime targets, we employed a multi-level feature fusion structure that retains shallow feature information, effectively achieving segmentation of small ships. Finally, we constructed a transverse temperature model for ships, extracting temperature information from infrared images to enable the prediction of ship temperatures.
The proposed Infrared Image Edge-Enhanced Segmentation Network (IERNet), detailed in Section 2, integrates an encoder–decoder architecture with an edge enhancement module and multi-level fusion strategies to address ship segmentation and temperature anomaly prediction. The model combines gradient perception and deep feature learning to refine boundaries while predicting both spatial locations and developmental trends of thermal anomalies. Section 3 validates IERNet’s performance through comparative experiments on the Pearl River dataset, benchmarking segmentation accuracy and temperature prediction robustness. Finally, Section 4 concludes with experimental insights and discusses future directions, including temporal thermal modeling and lightweight deployment for real-time maritime monitoring.
2. Method
2.1. IERNet Architecture
We propose an enhanced version of IERNet, a novel data fusion network consisting of two encoders and one decoder. The encoders are responsible for extracting features from input images, while the decoder restores the resolution. The two encoders extract thermal imaging data from two different observation modes. Figure 3 illustrates the overall architecture of our IERNet. We use ResNet as the backbone of the encoders and incorporate an edge feature enhancement branch into the network. This branch emphasizes thermal imaging data by using pseudo-color images to highlight edge information. The pseudo-color effect is achieved by setting a temperature threshold to clearly identify high-temperature areas, which are then highlighted in red to distinguish them from the surrounding environment. Additionally, noise reduction is applied to the original data using bilateral filtering, and non-uniformity correction is performed to compensate for the response differences between pixels in the infrared detector. These operations significantly improve image quality and the accuracy of temperature information. The temperature values of pixels are mapped to grayscale values, and regions with temperatures exceeding the threshold are highlighted in red, ensuring more accurate processing of high-temperature areas. This method extracts richer edge features from pseudo-color data, which contain stronger edge information, and enhances spatial perception through the CBAM. These features are then merged with grayscale image feature maps. Furthermore, in the deep feature layers, edge features are extracted using the Sobel operator and concatenated with low-level feature maps from the encoder, further enhancing feature fusion. The Fusion Unit strategically combines these diverse feature sets using techniques like Depthwise Separable Convolution, improving computational efficiency and reducing model complexity. Finally, the fused feature output undergoes deeper semantic information extraction in the Atrous Spatial Pyramid Pooling (ASPP) module, which is then fused with shallow information. These operations enable the final output features to preserve spatial details while incorporating higher semantic information. The fused features are then passed to the decoder module, enhancing the segmentation performance of the image.
In comparison to the DeepLabv3+ algorithm, our segmentation method excels in both edge data acquisition and multi-scale data integration. By emphasizing edge features through the edge feature enhancement branch and utilizing the Sobel operator, our method captures finer edge details, significantly improving segmentation accuracy along object boundaries. This combination of edge enhancement and multi-level fusion is particularly relevant, as it allows for more precise edge detection while also leveraging multi-scale information for a comprehensive understanding of the scene. The integration of these two strategies provides a more holistic approach to segmentation, where edge details are preserved while maintaining the ability to handle objects at different scales. Additionally, our approach effectively utilizes the ASPP module to collect multi-scale information, enhancing performance in handling objects of various sizes and complex structures. These improvements not only make our method more precise but also highlight its novelty in addressing edge sensitivity and multi-scale data integration more effectively than existing algorithms like DeepLabv3+. The details of the encoder–decoder structure, CBAM, Fusion Unit, Depthwise Separable Convolution, Atrous Spatial Pyramid Pooling, and the loss function will be explained in the following sections. The specific workflow is as follows:
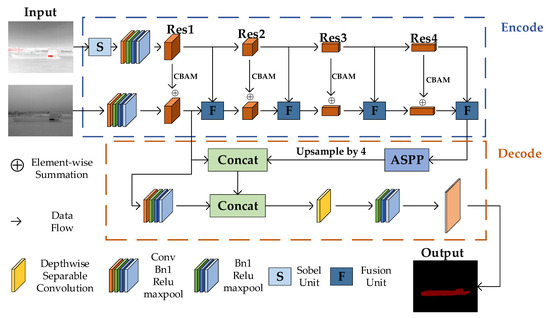
Figure 3.
The IERNet framework for infrared image ship segmentation. Input infrared ship images and pseudo color processed images separately, send the pseudo color images to the edge processing end, extract edge features, and integrate them into the backbone network through feature fusion modules to enhance the edge information of the ship. Multi-layer perception networks fuse deep features with shallow networks after being processed by ASPP.

2.2. Encoder Architecture
In our image processing network, we utilize ResNet-50, leveraging its greater feature extraction capability and lower complexity than VGG-19. ResNet-50’s depth is 5.3 times that of VGG-19, making it the foundation of our feature extraction for image fusion processes. Our design includes a layered approach using ResNet-50’s Res1 to Res4 levels to extract image features from simple to complex gradually, and this hierarchical feature extraction mechanism is vital for deeply understanding and processing images.
Initially, the Res1 layer primarily captures primary features such as edges and texture details, crucial for fundamental image structures. Upon entering the Res2 layer, the network introduces the CBAM, focusing attention both spatially and channel-wise, thus extracting more complex mid-level features. In tandem, the network employs two types of ResNet architectures within the encoder to handle standard thermal imaging and edge-enhanced thermal imaging, respectively.
For applications involving black-hot mode in infrared imaging, we adapt the input by modifying the number of channels in the initial convolutional block of the thermal encoder to accept only one channel. After this adaptation, a max-pooling layer follows the initial block and four residual layers. We thus sequentially reduce the resolution while increasing the channel count, facilitating deep feature extraction.
Moving into Res3 and Res4, the network uses the CBAM to intensify focus on key regions and integrates previous and current layer features through element-wise fusion, enhancing spatial continuity and feature richness. The edge-processing module, applied post-ResNet initial block, employs CBAM in three residual layers to process the extracted features, which are then fused with corresponding layers in the main network to generate feature maps with enhanced edge details.
In the final stage, our Fusion Unit uses max-pooling to extract high-frequency information from edge-enhanced features, while average pooling is used to pull color block information from the main network features. These diverse feature layers are then combined, offering a fused feature map enriched with precise edge details and seamlessly blended features. This advanced feature integration ensures the reconstructed image has sharp edges, smoothed textures, and eliminated shadows—characteristics crucial for high-quality and functional image fusion, notably in sophisticated infrared imaging scenarios.
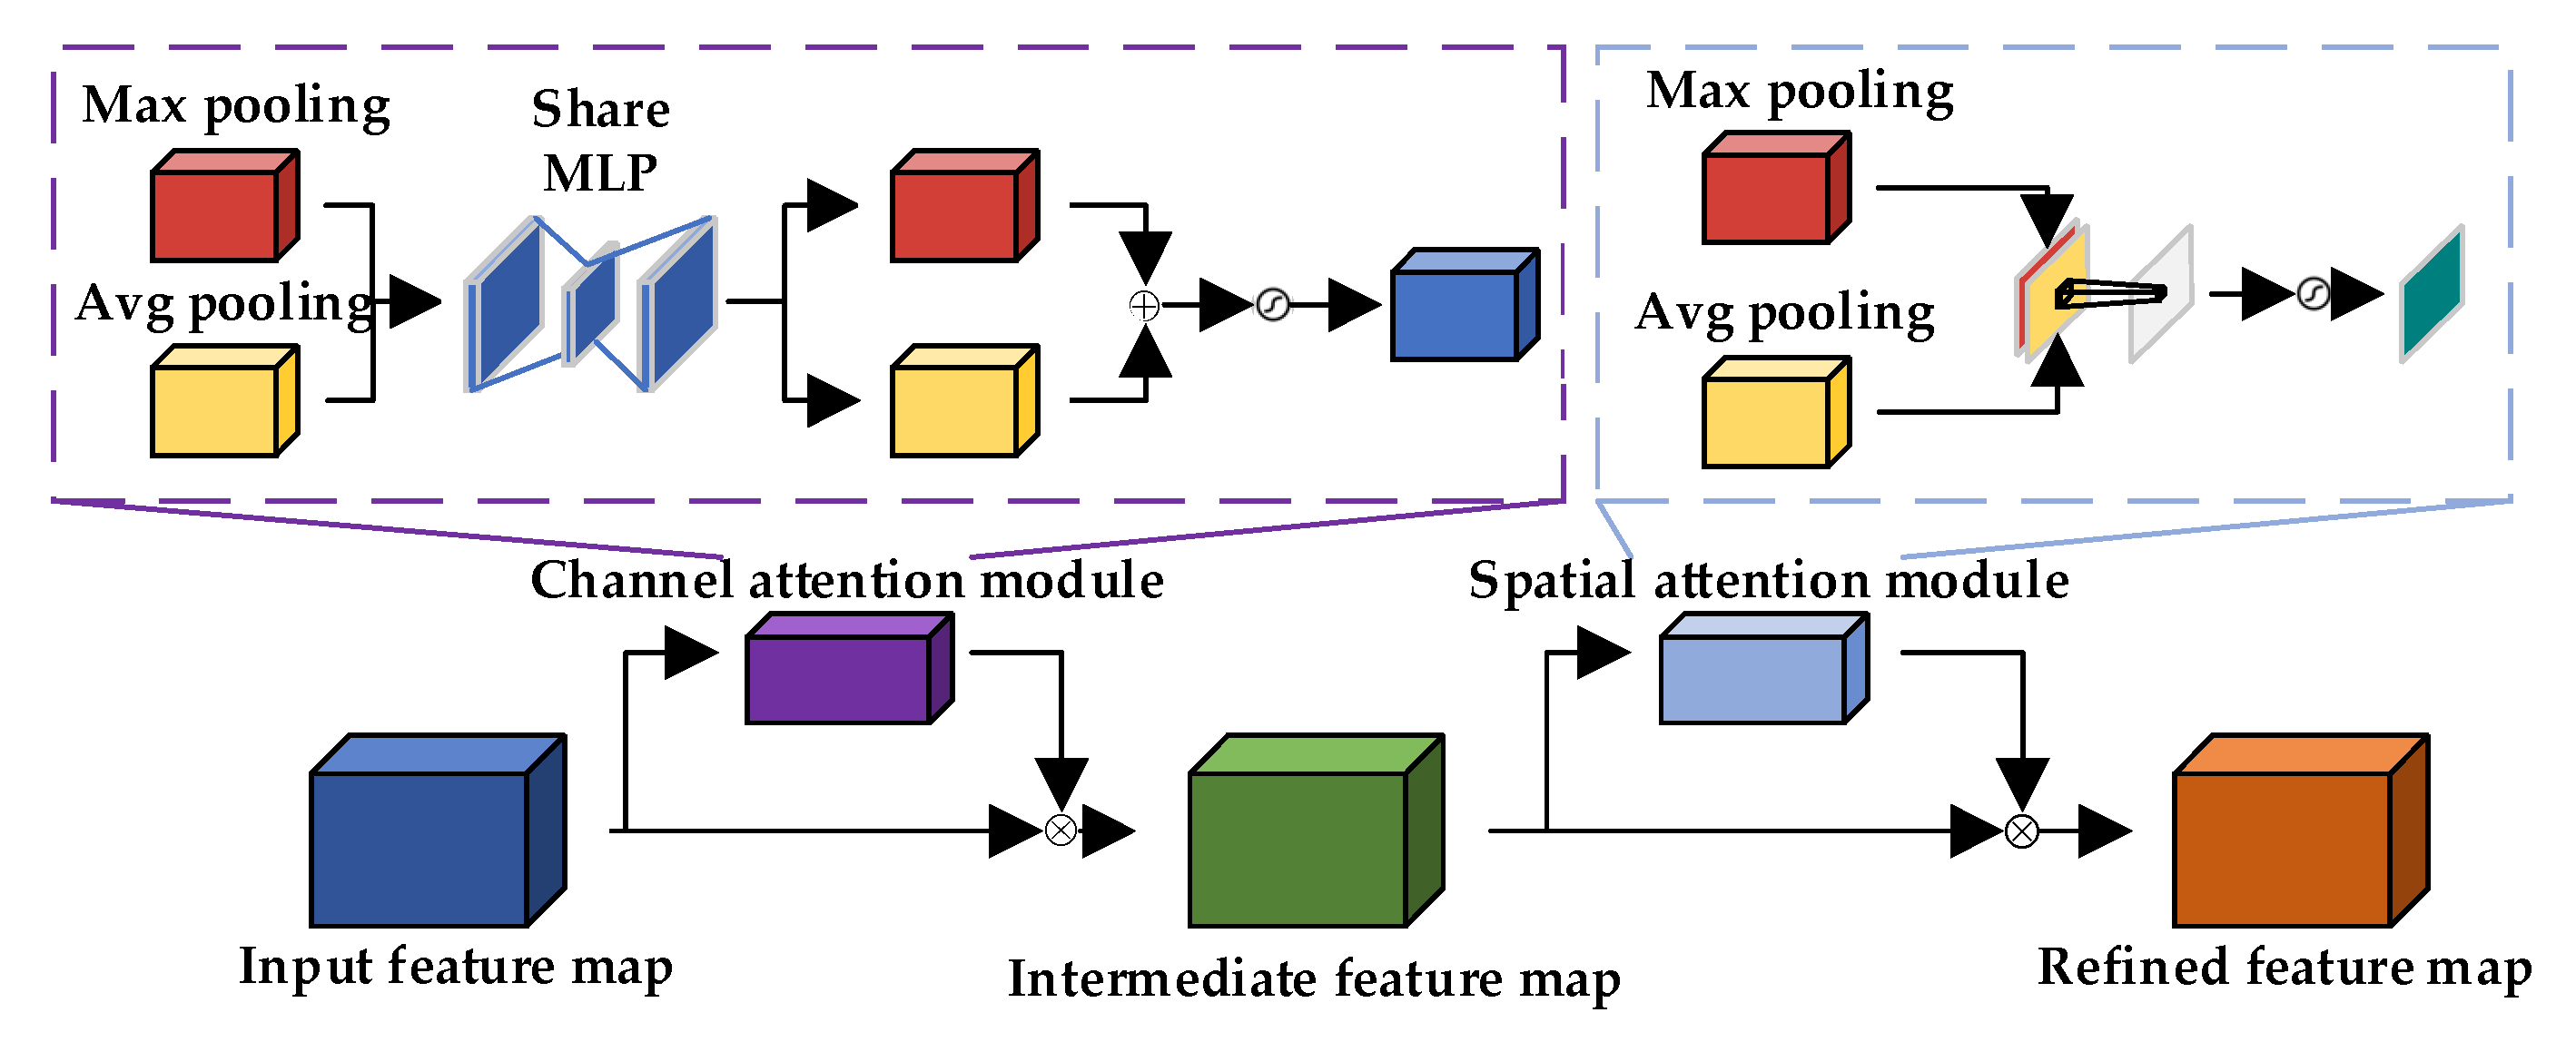
To better extract edge features, the CBAM [50] is utilized, as illustrated in the Figure 4. The CBAM sequentially infers attention maps through channel-wise and spatial-wise dimensions and then multiplies these attention maps with the input feature maps containing edge information for adaptive feature optimization. With a low parameter count, the additional time overhead incurred by adding this module is negligible. The module comprises two parts, channel attention and spatial attention , which can be represented by the following formulas:

Figure 4.
CBAM structure diagram.
represents feature maps, represents channel-based attention, represents spatial-based attention, represents element-wise multiplication, represents feature maps calculated through channel attention, and represents feature maps calculated through spatial attention. The tensor size of its input and output features is equal.
The Sobel operator, as a commonly used edge detection operator, can effectively extract edge information from images. It consists of two 3 × 3 convolution kernels that convolve with the image to extract the edge information. The specific formulas are as follows:
The and kernels calculate the gradient values in the horizontal and vertical directions, respectively, and then combine these gradient values to detect edges in the image. Before the input layer of the ResNet, a Sobel convolution layer is added to introduce the Sobel operator as an additional feature extractor into the network. The benefit of this approach is that it fully utilizes the Sobel operator to extract edge information from the image, thereby enhancing the network’s ability to learn edge features. Additionally, in the edge processing encoder, the average pooling layer is replaced with a max-pooling layer to better extract edge information. This results in higher edge detection accuracy and stronger generalization ability.
To effectively utilize edge feature information, we constructed a Fusion Unit, as illustrated in Figure 5. The input consists of two parts: features from the edge extraction branch and those from the backbone network. The edge features are processed using a 2 × 2 Max-Pool operation, while the backbone features undergo 2 × 2 AvgPool. This choice of a 2 × 2 pooling kernel effectively reduces dimensionality while retaining crucial local features, enhancing computational efficiency and preventing overfitting. The pooled feature tensors are then concatenated to combine both average and maximum information, enriching the feature representation. This fused tensor is further refined through two 3 × 3 convolutional layers and one 1 × 1 convolutional layer, which extract and enhance high-level features. These operations transform the original feature representations into more enriched and discriminative forms, laying a solid foundation for subsequent tasks. Finally, the refined features pass through a sigmoid activation function and are element-wise multiplied with another MaxPooled result from the backbone features, introducing an attention mechanism that amplifies important features while suppressing less relevant ones. This mechanism enhances the model’s representation and generalization capabilities.
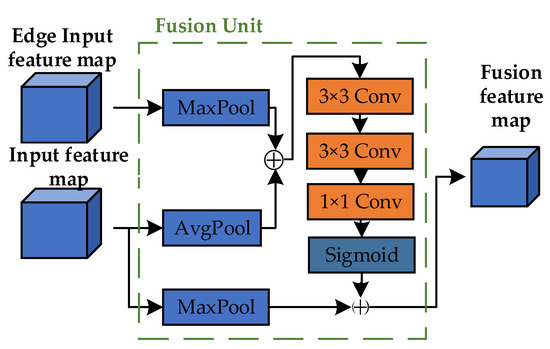
Figure 5.
Fusion Unit structure.
2.3. Decode Architecture
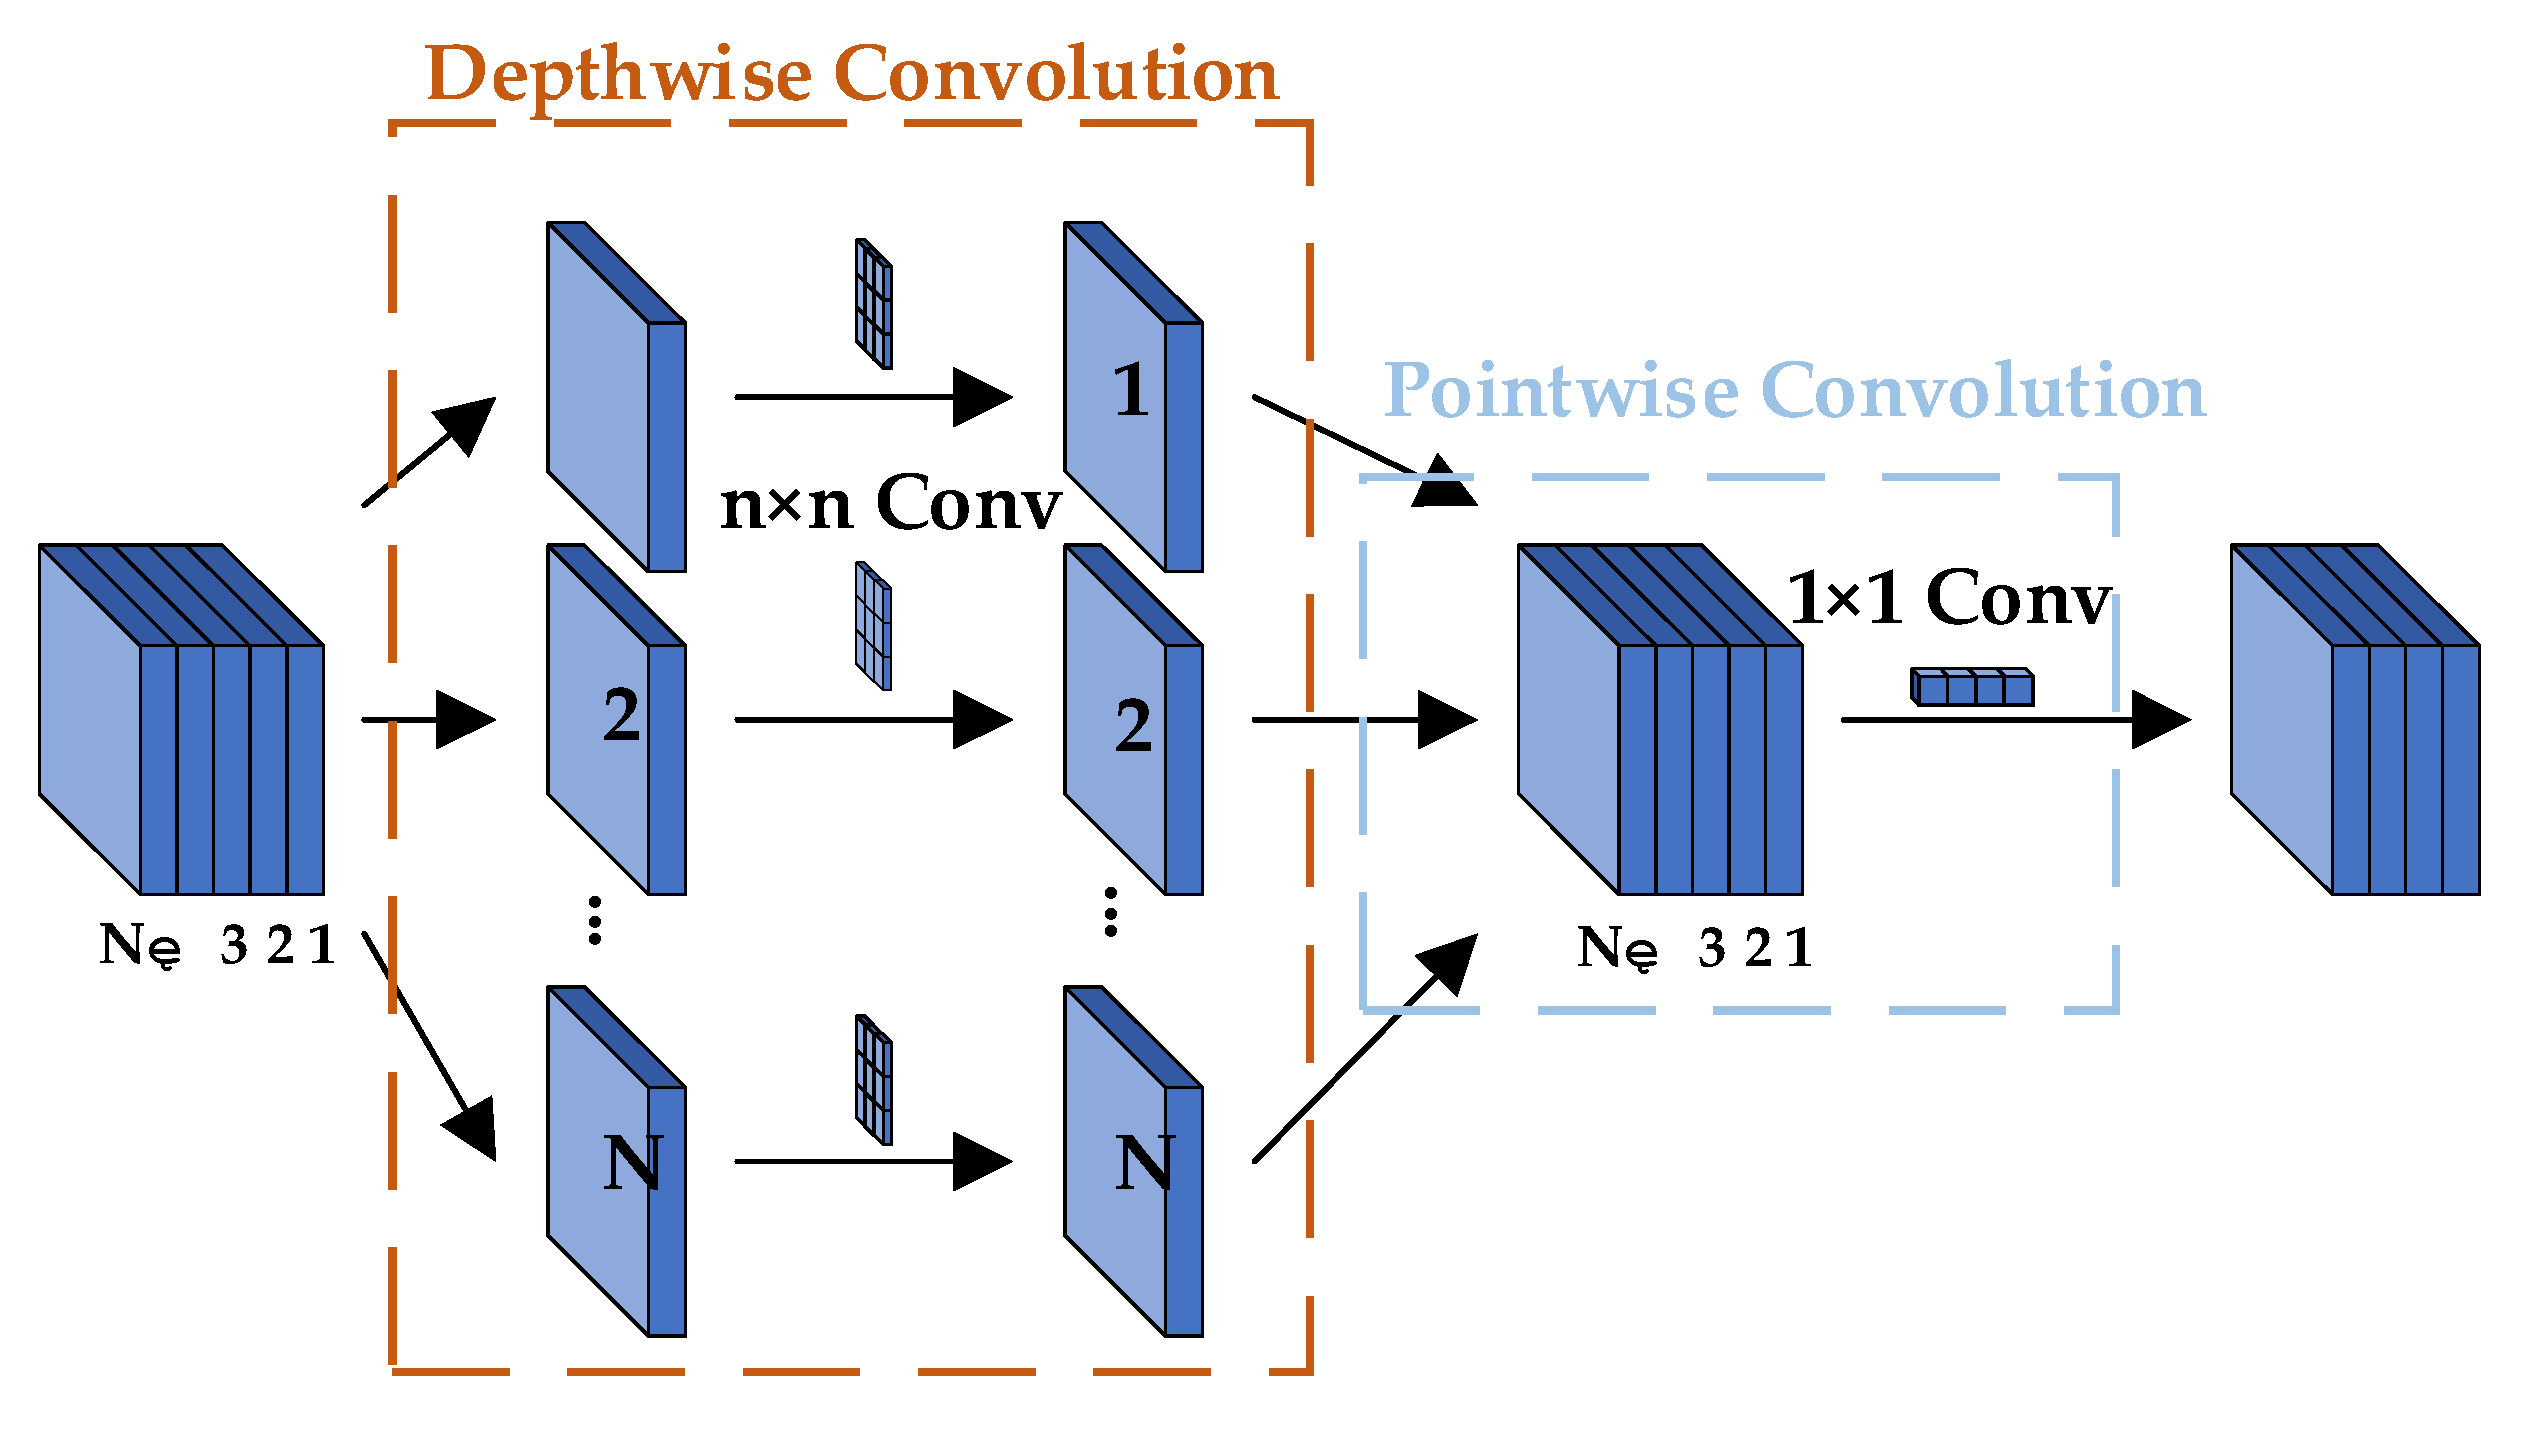
In the decoder, we extract low-level features from the intermediate layers of the backbone network ResNet [51]. These low-level features have higher spatial resolution and richer detail information. Then, through the ASPP module, we capture contextual information at different scales, generating features with different dilation rates. Next, the feature maps generated by the ASPP module are upsampled to align with the input image’s dimensions. Subsequently, the low-level features and the upsampled high-level features are fused to combine fine-grained feature information with global context information. In the improved decoder, before fusing the encoder features with the shallow features from the backbone network, we first stack and fuse them with the fused features from the encoder’s feature fusion branch and then fuse them with the shallow features. The original DeepLab V3+ [52] improves features by passing the final fused feature map with shallow features through a 3 × 3 standard convolution. To reduce the model’s parameter count, we replace the 3 × 3 standard convolution with a 3 × 3 depthwise separable convolution [53], as shown in Figure 6. Finally, the fused features are fed into the final classifier to classify each pixel, producing the final semantic segmentation result.

Figure 6.
Depthwise Separable Convolution.
The ASPP module, as shown in Figure 7, applies one 1 × 1 × 256 convolution and three 3 × 3 × 256 convolutions with dilation rates of 6, 12, and 18 to capture multi-scale information in parallel. By combining multi-scale features, it can classify objects of different sizes. The module performs global average pooling on the final feature map to obtain global image-level features, which helps mitigate the issue of weight vanishing when the dilation rate increases.
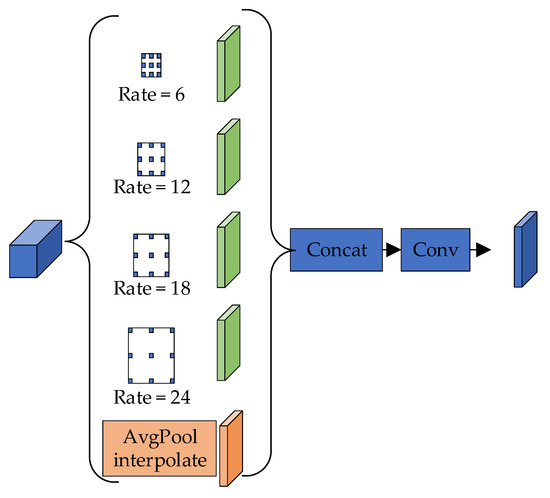
Figure 7.
Atrous Spatial Pyramid Pooling.
In the decoder, two concat operations are performed to effectively fuse features from different scales and levels. The first concat operation merges the high-level semantic features obtained from the ASPP module with the low-level details from earlier network layers. This fusion allows for the model to combine the context of the image with the fine-grained spatial details, improving segmentation accuracy, especially for small objects and object boundaries. The second concat operation combines multi-scale features extracted from the ASPP module at different dilation rates with the fused low-level features. This process enables the model to handle various object sizes and more complex structures, thereby enhancing its ability to segment objects in a diverse range of contexts.
Through the edge extraction branch, we obtained rich edge information and employed the edge feature-weighted Dice Loss [54], a statistical metric used to measure the similarity between two sets. The advantage of Dice Loss lies in its robustness to class imbalance, making it particularly suitable for segmentation tasks where there is a significant difference in the number of positive and negative samples. This ensures that the model places more emphasis on the segmentation of small classes. The Dice coefficient, a similarity measure function used to calculate the similarity between two samples, is defined as follows:
represents the intersection between and ; and represent the number of elements in and , respectively. The coefficient 2 in the numerator accounts for the double counting of and in the denominator. In semantic segmentation tasks, represents the ground truth segmentation image, and Y represents the predicted segmentation image.
The Dice coefficient calculation approximates as the dot product between the predicted and ground truth segmentation images and then sums the element-wise results of the dot product. The calculation method is as follows:
- (1)
- The dot product between Pred predicted segmentation map and GT segmentation map:
- (2)
- The result of element-wise multiplication is the sum of the sum of elements:
For a binary classification problem, where the ground truth segmentation map (GT) contains only values of 0 and 1, all pixels in the predicted segmentation map (Pred) that are not activated in the ground truth segmentation map can effectively be set to zero. For activated pixels, the focus is primarily on penalizing low-confidence predictions, with higher values receiving better Dice coefficients. Due to the blurred nature of edge features in infrared images, an edge weighting function is added on top of this to enhance the importance of edge weights.
Due to the blurred nature of edge features in infrared images, an edge weighting function is introduced to enhance the importance of edge pixels. The edge datum E, obtained by combining the edge features processed through the Sobel operator and filtering out high-frequency data interference from water bodies and background regions in the ground truth (GT) target area, represents the intensity of edge pixels. These edge features capture the most critical information regarding the boundaries of objects, which are vital for accurate segmentation. By focusing on the transitions between different regions, edges provide key structural cues that help the model distinguish between the object and background. The edge datum E is then normalized to the range [0, 1], ensuring that it fits within a standard scale for further processing.
The incorporation of edge information enhances segmentation by emphasizing finer details, especially at the boundaries of the target objects. This is particularly useful in scenarios where the contrast between the object and the background is low, or the edges are blurred. Edge detection helps the model focus on the critical boundaries that define the object, leading to more precise segmentation, particularly for small or intricate structures.
To improve the accuracy of edge segmentation, the weighted Dice coefficient is used, which is calculated using the following formula:
Among them, represents the value of edge data in the -th row and -th column, with a range of . and represent the corresponding values in the GT and prediction segmentation matrices, respectively. is a smoothing term to avoid having a zero denominator.
2.4. Construction of a Ship Cabin Abnormal Temperature Prediction Model Based on GBDT
In this study, we utilize XGBoost as the regression model. The model’s objective function incorporates regularization terms that help control overfitting by penalizing overly complex models. Additionally, XGBoost employs a second-order Taylor expansion of the loss function to better approximate the objective during training. From a computational perspective, the algorithm is highly efficient, utilizing a multi-threaded, parallel processing strategy to compute feature values. This speeds up the training process and reduces computational costs. By integrating key temperature measurements from various points on the ship’s body with environmental factors into composite variables, we aim to predict abnormal temperature variations within the ship’s cabin. This approach enables the construction of a predictive model specifically designed to estimate the transverse cabin temperatures. The objective function is as follows:
where n represents the number of training samples, represents the observed values of the model, represents the simulated values of the model, represents the number of decision trees, and represents the t-th tree model.
After Taylor expansion derivation, defining tree complexity, and determining leaf node grouping, the final objective function can be written as
After each iteration, the XGBoost algorithm assigns a learning rate to the leaf nodes to reduce the weight of each tree, diminishing the influence of each tree and providing better learning space for subsequent iterations.
3. Experiment
The software environment for this experiment includes the Win10 operating system and PyTorch program (https://pytorch.org/), while the hardware environment consists of an AMD R7-5900X CPU and an NVIDIA GeForce RTX 3090Ti GPU. To verify the effectiveness of our method, we conducted extensive comparative experiments on the Infrared-ship thermal dataset and performed visual analysis of the experimental results. Additionally, to validate the effectiveness of the proposed modules, we presented relevant ablation experiments and provided detailed analysis for each of them. When evaluating the performance of semantic segmentation-related algorithms, we used the most common metrics, mean Intersection over Union (mIoU) and mean Pixel Accuracy (mPA), as evaluation metrics.
mIoU is calculated using a confusion matrix, as shown in Table 1, where TP represents the intersection of predicted and ground truth values, FN is the ground truth without overlap, FP is the predicted values without overlap, and TN is the region with no overlap in either.

Table 1.
Confusion matrix.
calculates the accuracy of segmented images by measuring the overlap between predicted values and ground truth values. Its calculation method is as follows:
represents the percentage of correctly classified pixels in the image. Its calculation method is as follows:
In evaluating regression algorithms, we use Mean Squared Error () as the evaluation metric. Its calculation method is as follows:
Among them, is the number of longitudinal sampling temperatures of the ship, is the -th segment cabin temperature in the sampling temperature, and is the predicted temperature of the -th segment cabin.
3.1. The Thermal Ship Dataset
The thermal images in our dataset were collected from the Pearl River waterway scene. By capturing nighttime river scenes, we created a dataset of thermal imaging data for ships navigating in river channels at long distances, specifically within the range of 800 to 1500 m. This allowed for us to focus on ships at a considerable distance, ensuring that the dataset reflects real-world maritime navigation scenarios. We annotated our thermal images, selecting a total of 1000 images from 2000 thermal images for fine annotation. We chose the popular public image annotation tool LabelMe for semantic segmentation annotation of our original data. The image resolution is 640 × 512, and the dataset contains 800 images for training and 200 images for testing. These data include two classes, background and ships, as shown in Figure 8.
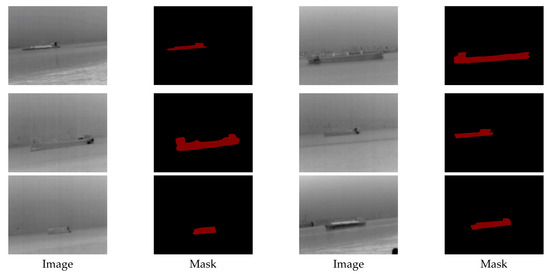
Figure 8.
Infrared-ship dataset.
There may be resolution differences in the dataset due to the distance between ships, resulting in ships with very low resolution. To ensure the balanced distribution of images at different distances, we enhanced the data through techniques such as cropping, rotation, and scaling to simulate different perspectives and distances. This method helps the model to generalize better, making it more robust to changes in ship size and environmental conditions. In addition, we conducted careful quality control during the annotation process to avoid inconsistencies and ensure accurate segmentation boundaries of ships in the image.
3.2. The XGBoost Dataset
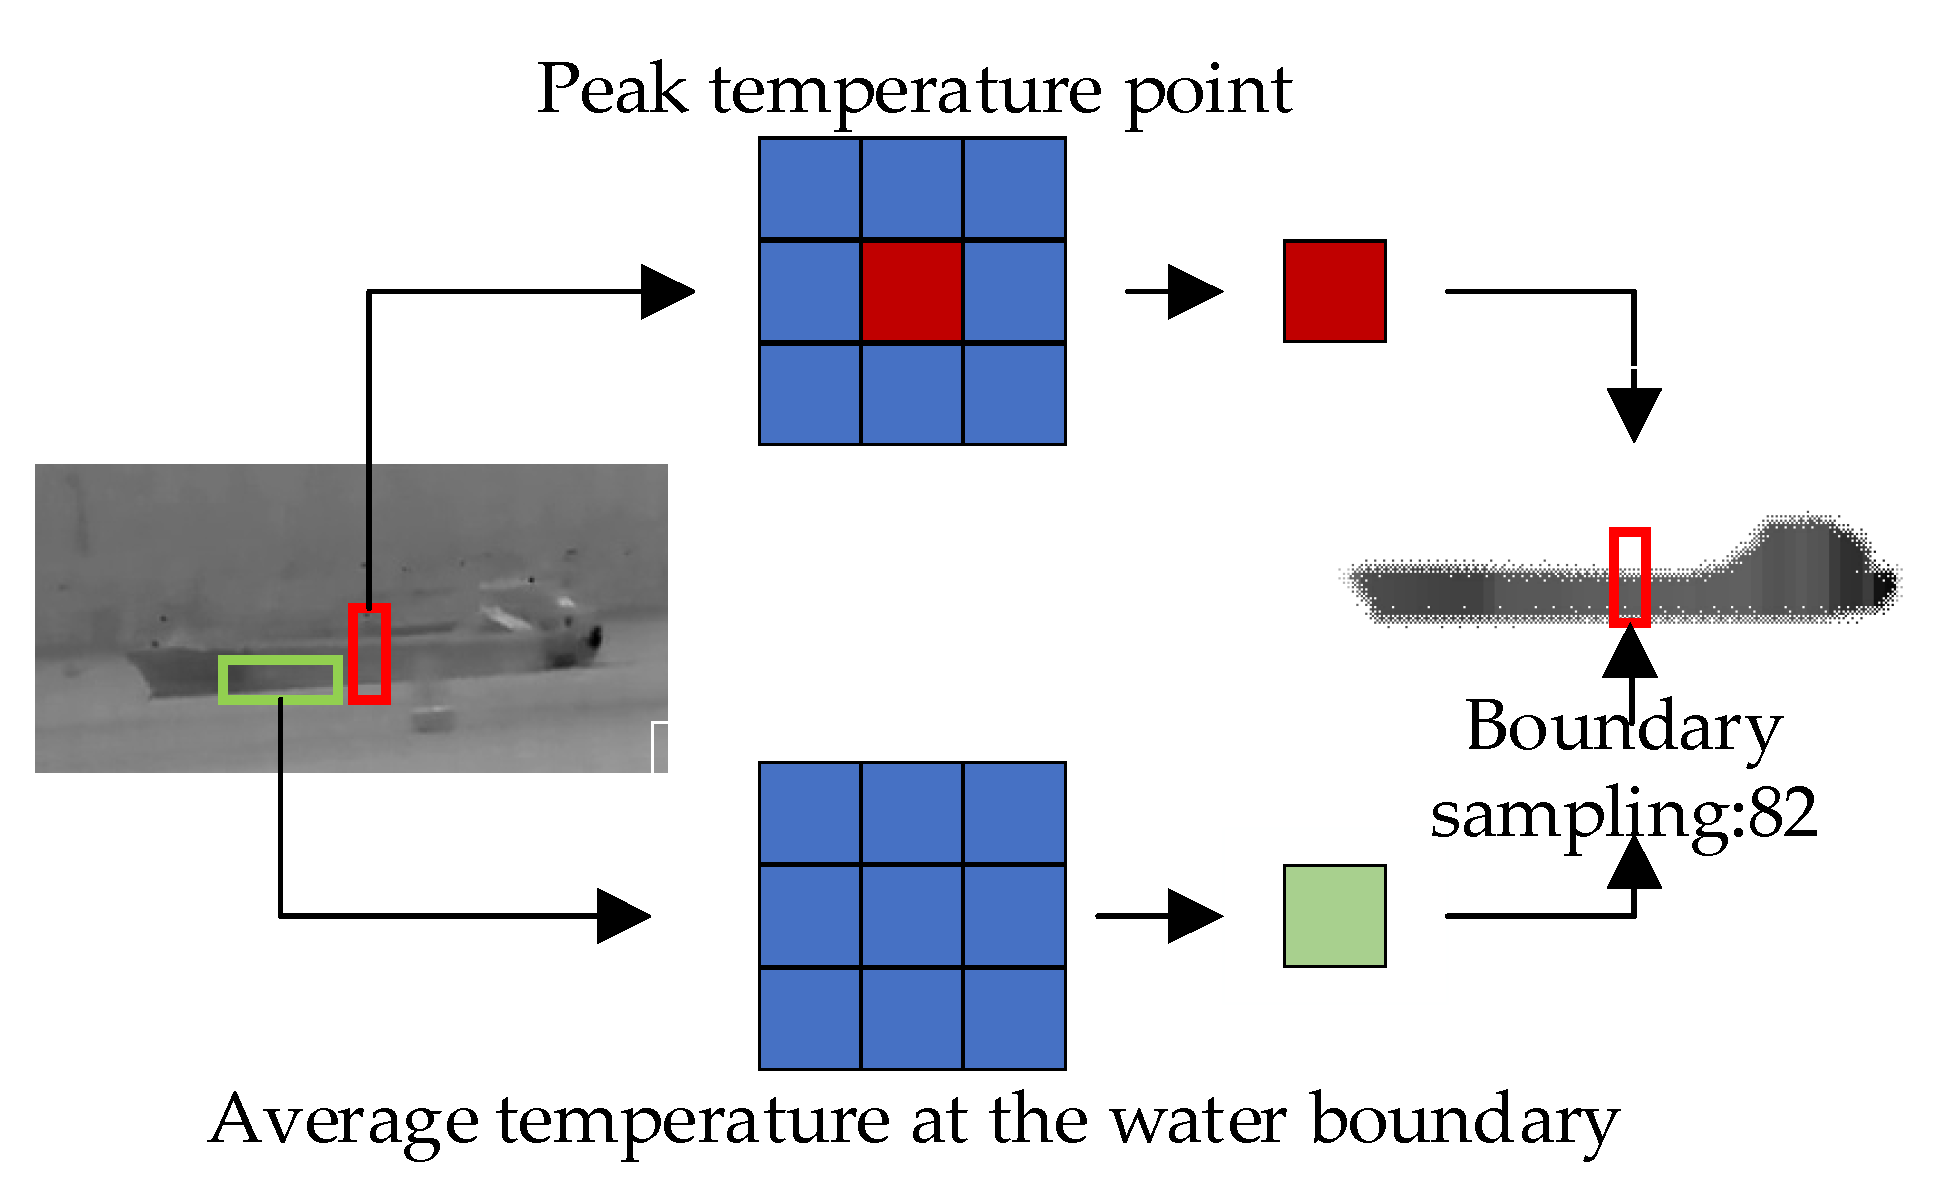
The normal ship data were obtained by processing thermal infrared images of ships captured in river channels, while the abnormal temperature data were obtained by simulating abnormal temperature occurrences using experimental small boats in a water pool, as shown in the figure. Based on the influence of ship morphology on temperature distribution, we processed the thermal imaging temperature data of ships through lateral sampling because the shape of the ship determines the main trend of temperature change laterally. Considering the influence of water temperature on ships, we filtered out abnormal temperature values and used the average temperature as the sampled temperature of each compartment to reflect the heat exchange between the ship and the water. The temperature sampling method is shown in the Figure 9. We take the temperatures at the bow and stern of the ship as the boundary temperatures and the lowest temperature of the compartment as the boundary temperature of the water body. Given that normal cargo ships usually have only the engine as a heat source, we assume that the engine is the only heat source and take the compartment with the highest sampled temperature as the engine position and the temperature of the heat source. In addition, we label the distances from each compartment to the engine compartment and to the ship’s hull to further analyze the relationship between heat distribution and ship structure.

Figure 9.
Temperature sampling method.
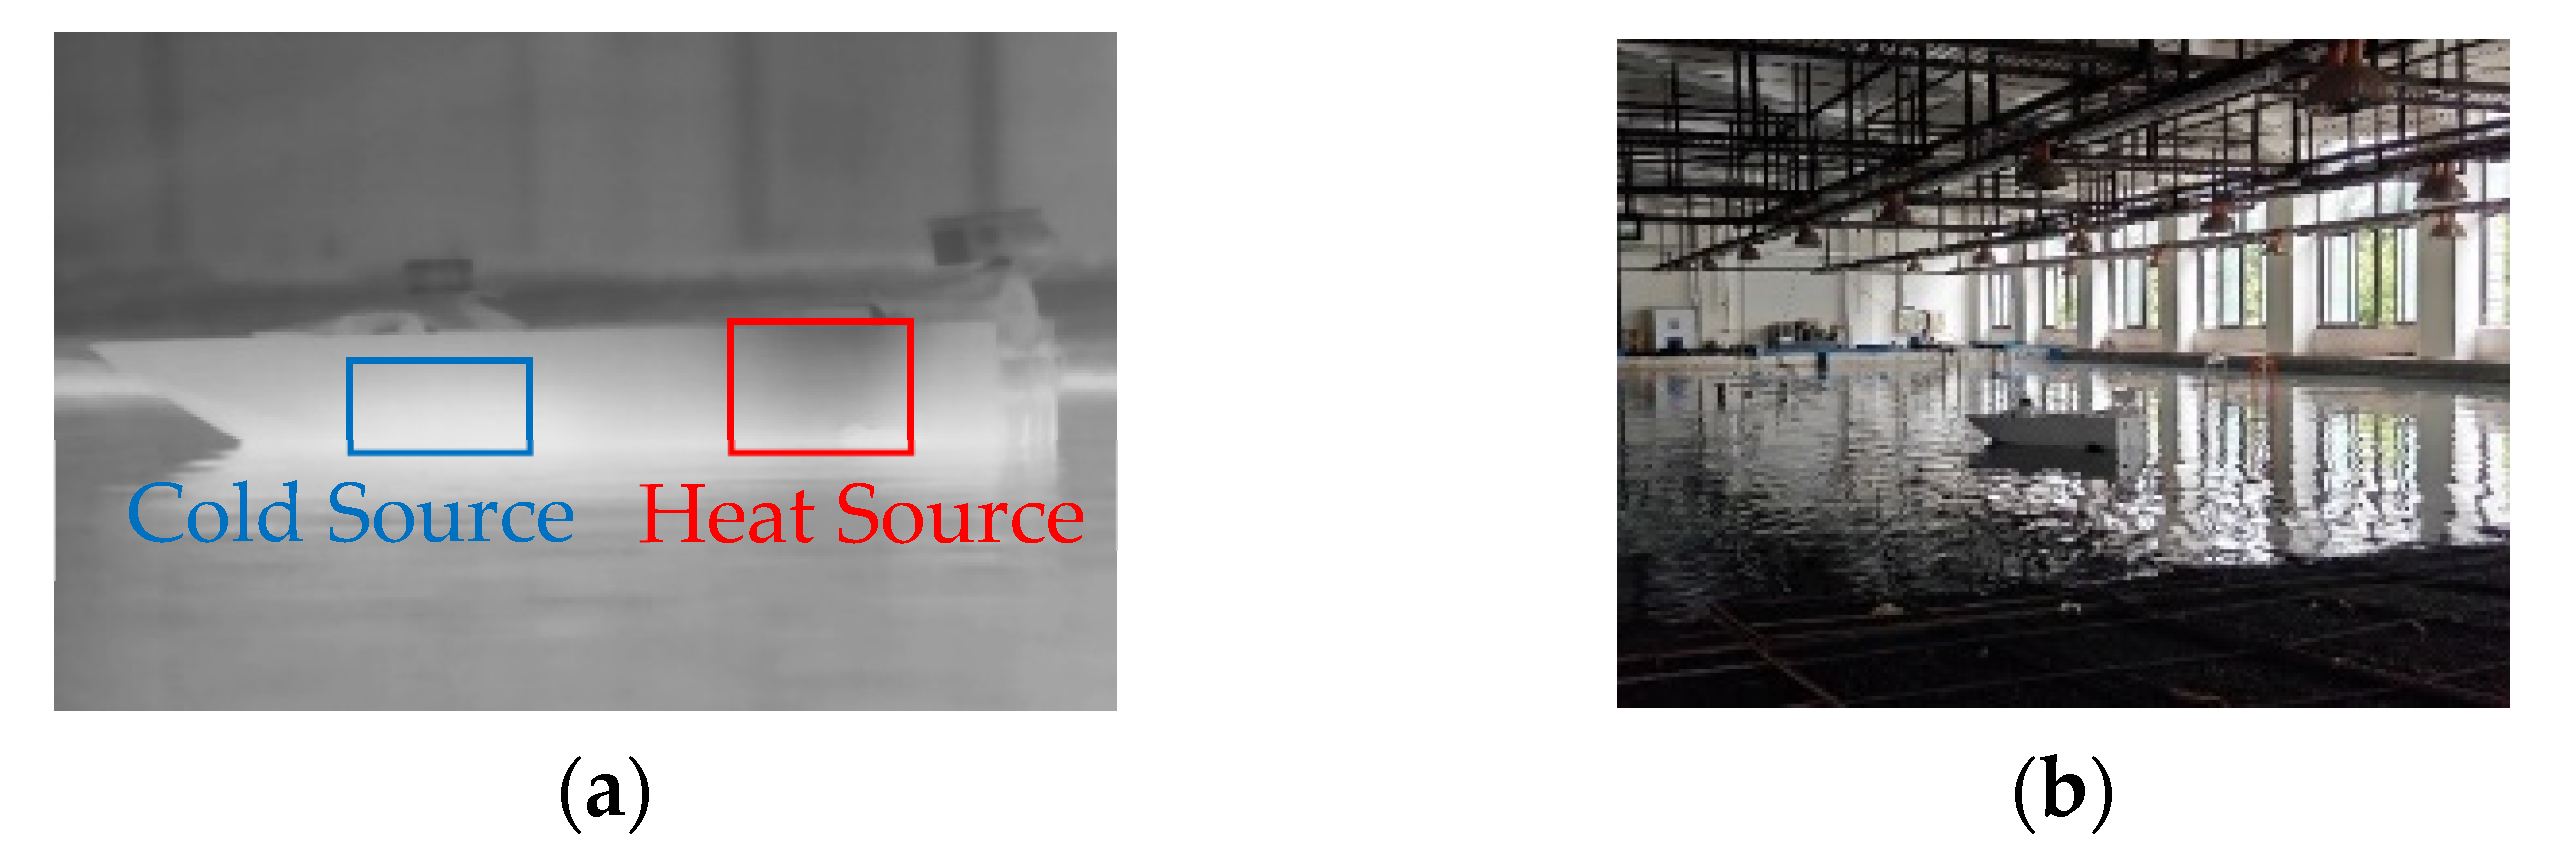
The samples of abnormal ship cabin temperatures were created using experimental small boats. We added a high-temperature heat source to the rear part of the small boat to simulate the temperature of the engine compartment. Additionally, we placed a heat source and a cold source at the bow of the boat to mimic an abnormal ship cabin, as shown in Figure 10. The abnormal samples after sampling are depicted in Figure 11.

Figure 10.
Experimental operation diagram. (a) Collecting images. (b) Realistic view.

Figure 11.
Heatmap of the relationship between relevant factors.
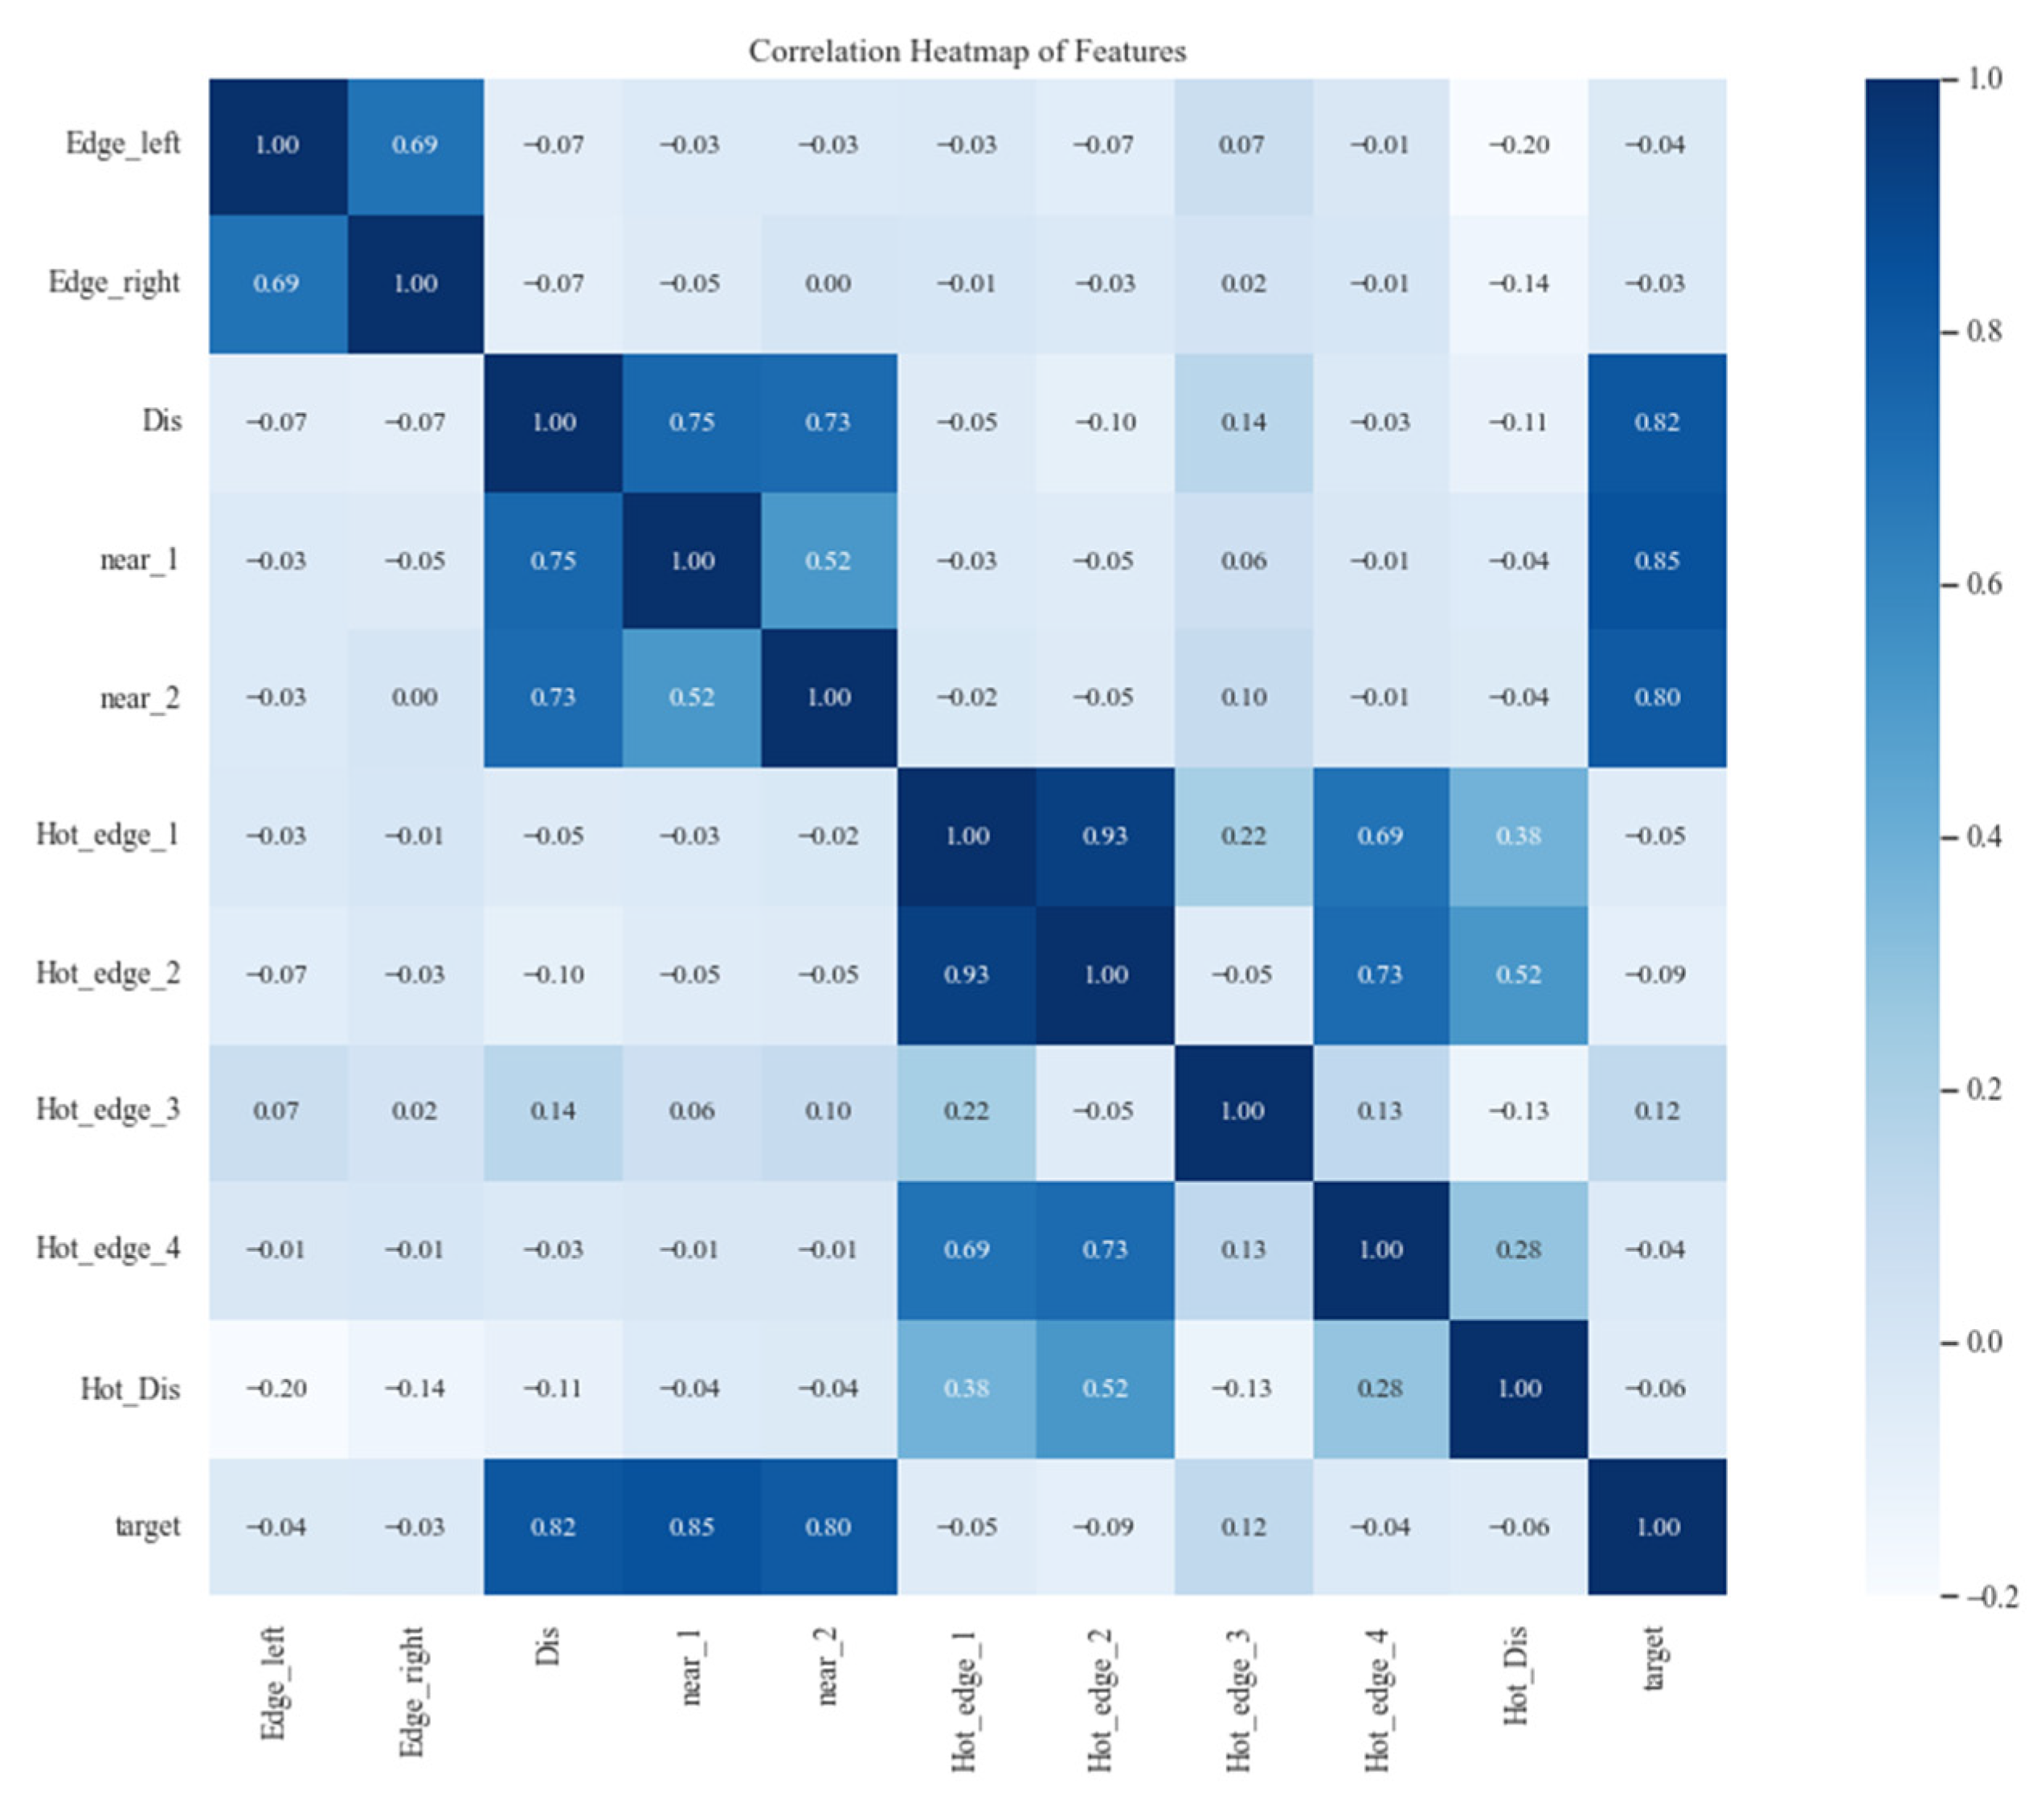
The relationship between ship body temperature and engine temperature, water temperature, and ambient temperature is closely related. Therefore, we chose the heat transfer distance, left edge temperature, right edge temperature, left edge temperature of the heat zone, right edge temperature of the heat zone, water edge temperature, ambient temperature, heat zone temperature, and the ratio of heat zone temperature to distance as the input variables for the model. Initially, the processed data contained a large number of feature variables, among which there might be some features with low correlation. This means that training the model may not achieve the expected predictive performance. Therefore, we first selected feature variables with good correlation with temperature change by calculating the correlation coefficient, as shown in the heatmap in Figure 12. From the heatmap, it can be observed that adjacent temperatures, heat transfer distance, distance from heat zone edge point 3, distance from heat zone edge point 2, and boundary temperature have a relatively large correlation. Therefore, these elements were chosen as training samples.
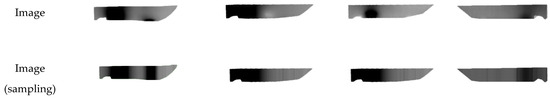
Figure 12.
Lateral temperature distribution of abnormal ship hull samples.
3.3. Semantic Segmentation Experiment
We compared the segmentation performance of our algorithm with several state-of-the-art methods, including FCN-32s, FCN-16s, DFN, PSPNet, PSANet, DeepLabv3, and DeepLabv3+, to demonstrate the improvement of our algorithm. Experimental results on the Infrared-ship dataset showed that our algorithm performs slightly better and is more suitable for segmentation of infrared ship images.
In the table, our algorithm achieves a segmentation performance of 89.17% mIoU. Compared to state-of-the-art algorithms such as DeepLabv3+, PSPNet, and Danet, our algorithm’s segmentation performance improves by 6.38%, 13.21%, and 9.16%, respectively. In Table 2, our overall segmentation accuracy is also higher than that of DeepLabv3 and Denseaspp.
Table 2.
Result of different models on the Infrared-ship dataset.
3.4. Visualization Analysis
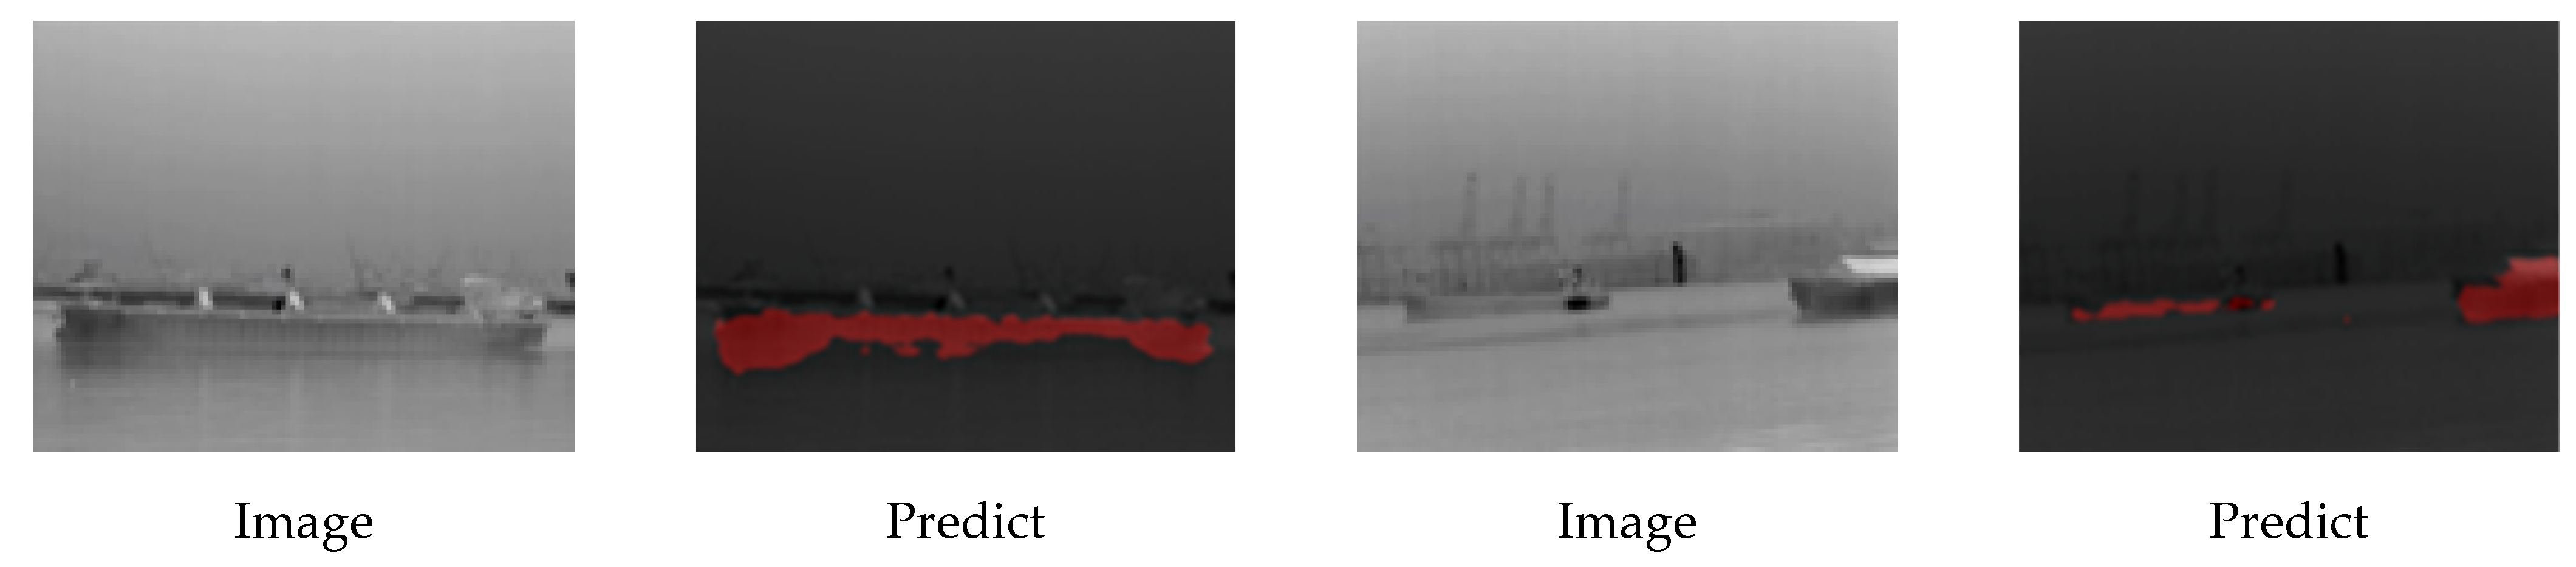
To further validate the effectiveness of our algorithm, we tested the segmentation performance of the trained model on the Ship dataset and visualized some of the segmentation results, as shown in Figure 13. The image segmentation results of our method are superior to DeepLabv3+, Pyramid Scene Parsing Network (PSPNet), and FCN. Firstly, compared to DeepLabv3+, our method performs better in detail information such as small objects and edges, and also segments edges and small objects more clearly. For example, in the first row of images in the figure, the segmentation performance of the ship’s edge and the segmentation line of the water surface has been improved. Compared to the visualization results of FCN segmentation, FCN’s segmentation results are too rough. For instance, large objects like ships are coarsely segmented at close range, and the labels of pixels inside the object contours are also confused, resulting in a loss of detailed information for most objects and easily leading to internal discontinuities.
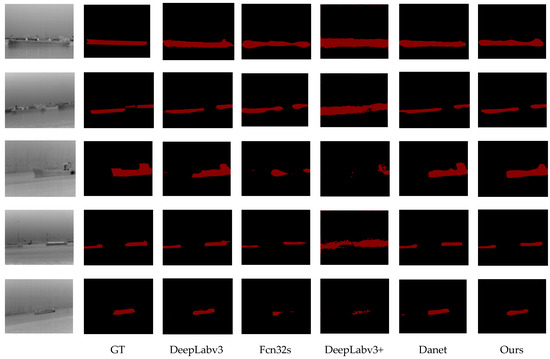
Figure 13.
Visualization results of DeepLabv3, Fcn32s, DeepLabv3+, Danet, and ours on the Infrared-ship dataset. The first and second columns display the original image and its GT from the Infrared-ship data set. The last five columns show the results generated by DeepLabv3, Fcn32s, DeepLabv3+, and our method, respectively.
For the images in the second and third rows, compared to DeepLabv3+, the segmentation of each category is more refined, and our proposed method also performs better in details such as edges and small objects. For the images in the fourth and fifth rows, FCN and PSPNet still only roughly segment objects of each category, and FCN’s segmentation results are still relatively rough. The segmentation results of the DeepLabv3+ algorithm show that some pixel categories are confused for objects such as ships near the dock. Our method not only enhances the localization of boundary pixels for these targets but also alleviates the discontinuity and label confusion problems of large targets.
3.5. Visualization Results on the Features of Each Component of Our Algorithm
We also visualized the features of each module of the algorithm, including Sobel and Fusion Unit. As shown in Figure 14, the Sobel edge detection module extracts edge information through both the X-axis and Y-axis directions, which are then fused together. The lateral information of the ship is the most abundant, and the extracted information improves the problem of missing edges in the infrared images.
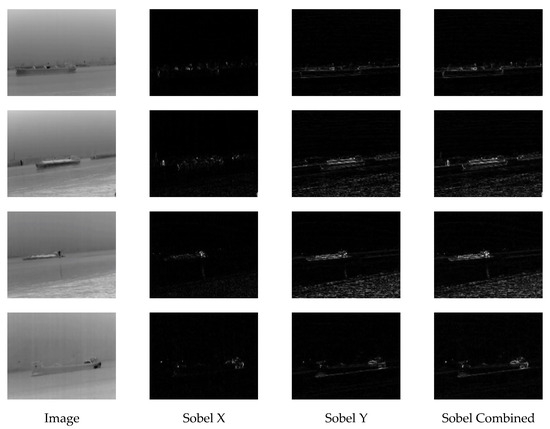
Figure 14.
The edge image processed by Sobel operator, the first column is the original image, and the following three columns are the edges in the X direction, the edges in the Y direction, and the fused edges of both.
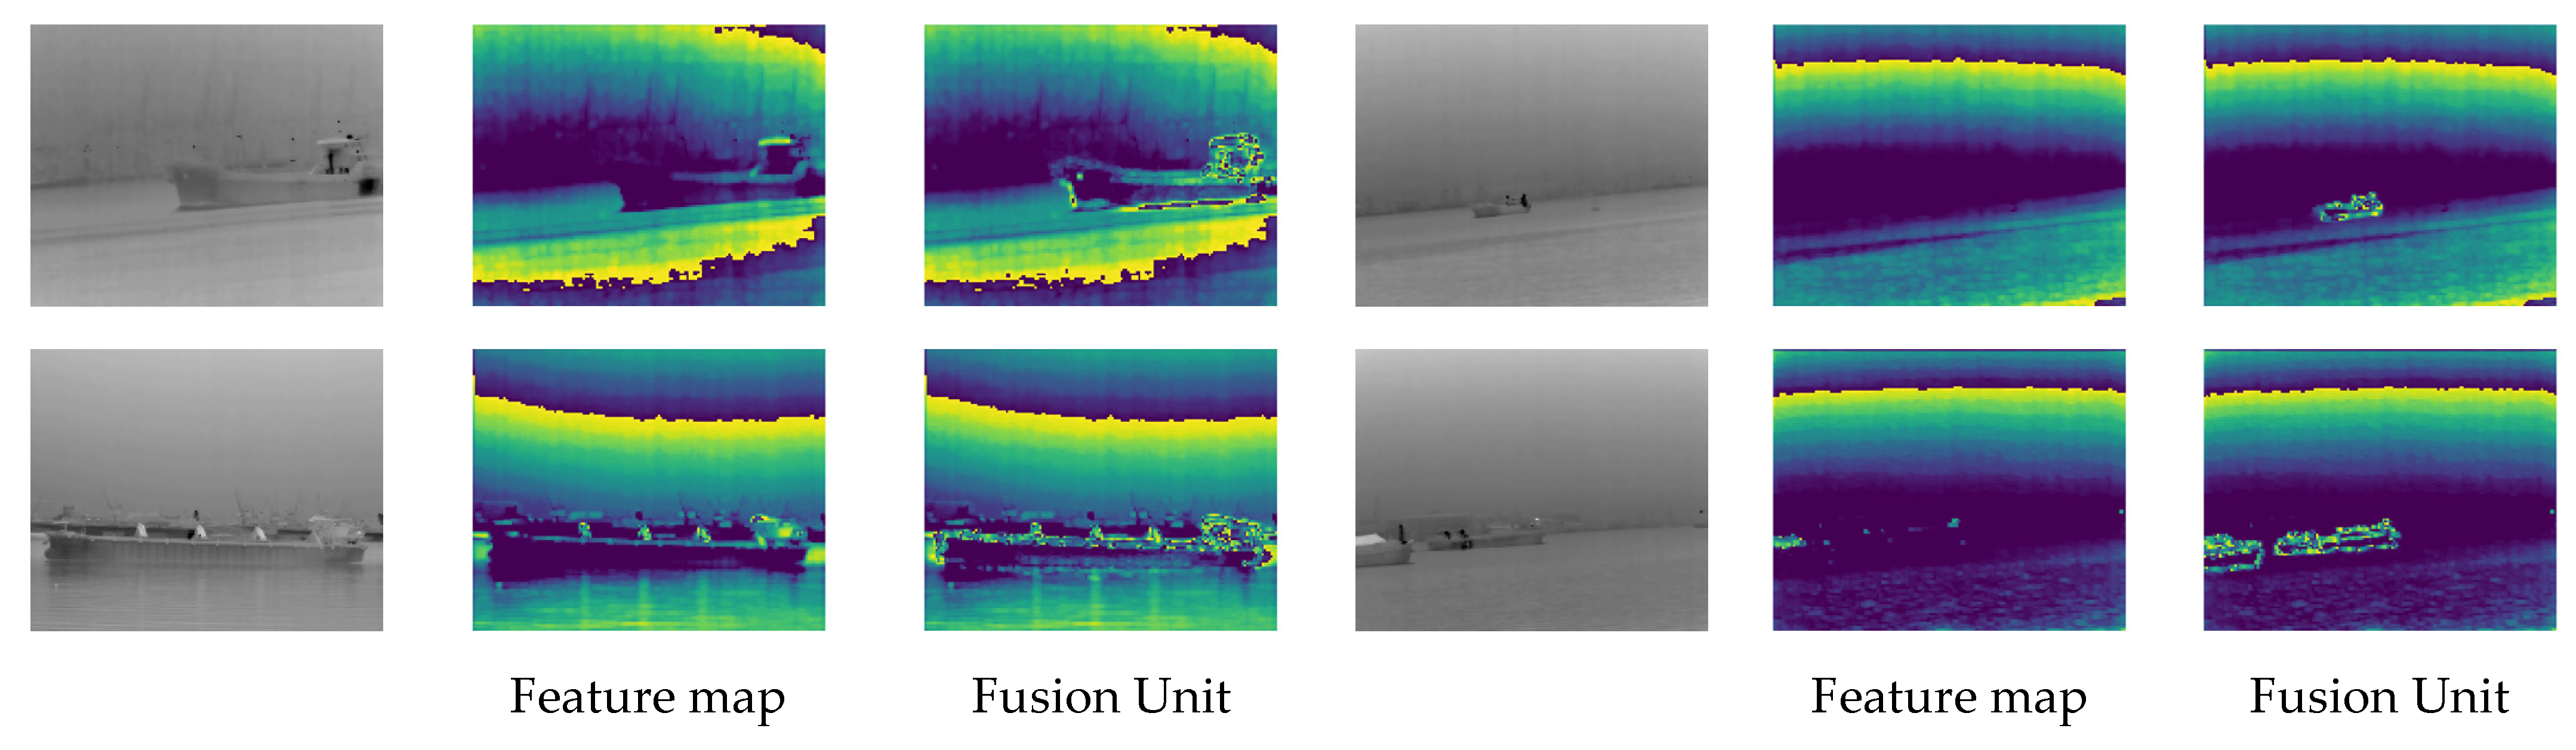
The Fusion Unit integrates edge information, enriching the high-frequency details contained in the feature maps. As shown in Figure 15, taking the ship in the first row as an example, after passing through the feature fusion module, the edge features between the ship and the water body become clearer, with enhanced edge features. Additionally, edge features within the ship and some edge information from heat sources are better extracted. Moreover, for small target ships, we can also extract their features. For example, in the fourth row of the image, by fusing shallow-level feature information with edge information, we can obtain their contour features as well as some high-frequency features on the ship.
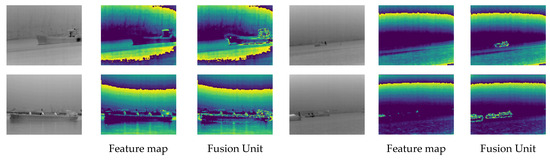
Figure 15.
Visualization results of Fusion Unit. The first column shows original images from Infrared-ship dataset. The second column is the intermediate feature map without adding an edge detection branch. The third column is the feature map output after Fusion Unit processing.
3.6. Abnormal Cabin Monitoring Experiment
3.6.1. Enhancement on the Backbone Network
In the ablation experiments, we chose the FCN as the baseline and used ResNet50 and ResNet101 as backbone networks to demonstrate the effectiveness of the proposed improvements. As shown in the Table 3, when using ResNet50 as the backbone network, the segmentation performance of the original FCN was 56.42% mIoU. By adding the ASPP module to FCN, the segmentation performance improved to 76.59% mIoU. When incorporating the Fusion Unit and CBAM to fuse edge data, the accuracy increased to 83.15% mIoU. Furthermore, adding ASPP on top of this further improved the accuracy to 86.48% mIoU. With ResNet101 as the backbone network, the final segmentation accuracy increased by 0.81% mIoU compared to ResNet50, indicating that the improvement in accuracy does not solely come from increased network depth. This demonstrates that the edge detection branch can obtain more discriminative features to improve semantic segmentation accuracy.
Table 3.
FCN-based ablation experiments.
3.6.2. Ablation Experiments on the Effect of Different Loss Functions
The baseline selection includes FCN and DeepLabv3+, and the loss functions include Cross-Entropy Loss, Focal Loss, and Dice Loss with edge weights. The experimental results are shown in Table 4. The performance of and on FCN and DeepLabv3+ is slightly better compared to , as the edges of infrared ship targets are weak, the targets are small, and the noise is high. Strengthening the supervision of edge pixels by the loss function can enhance segmentation performance.
Table 4.
Ablation experiments on the effect of different loss functions.
3.7. Ship Temperature Regression Experiment
The predictive performance of machine learning models mainly depends on data quality and model parameter tuning. Therefore, for further improvement of the model prediction effectiveness, this study requires fine-tuning of the sea surface temperature diurnal cycle amplitude prediction model based on the XGBoost algorithm. To train the XGBoost model, we first prepare the dataset by splitting it into training and testing sets. Then, we initialize the XGBoost model and fit it to the training data. This involves feeding the features into the model and allowing for it to learn the underlying patterns. We apply the model iteratively, adjusting the parameters based on performance metrics to improve prediction accuracy.
Five key parameters significantly impact the predictive performance of the XGBoost model. Among them, n_estimators determines the number of weak learners in the ensemble algorithm. A higher value increases the model’s learning capacity but also raises the risk of overfitting. max_depth controls the maximum depth of the trees in the model. A higher value leads to a more complex model and increases the risk of overfitting. The subsample parameter controls the proportion of randomly selected data for training, while the learning_rate parameter regulates the iteration rate; both help prevent overfitting. The gamma parameter controls the minimum loss function required for node splitting, reducing model complexity and accelerating algorithm convergence. We adjusted the key parameters of the XGBoost algorithm through multiple rounds of testing, using cross-validation results as the criteria for parameter selection. Cross-validation helps us evaluate the model’s performance by training it on different subsets of the data and ensuring that the model generalizes well to unseen data. Random search or grid search techniques are applied to optimize these hyperparameters, systematically testing different combinations to find the most effective configuration. The final optimal values for the five key parameters are shown in Table 5.
Table 5.
Optimal values of key model parameters.
First, the ship’s lateral temperature dataset is randomly split into training and testing sets in an 80%:20% ratio. Then, based on the XGBoost algorithm, the model is trained on the training set to construct a regression prediction model for ship temperature. Finally, the model’s predictive ability is validated using the testing set. This study utilizes the Python programming language environment (Python v3.9) to build the XGBoost model, primarily based on the scikit-learn library. Following the prediction algorithm workflow, the preprocessed dataset is imported into the XGB model. After finding the optimal parameters, the model is trained to obtain the prediction results.
Table 6 shows that the model achieves high goodness of fit and small error values on both the training and testing sets, demonstrating its good performance in predicting ship temperature. Regarding goodness of fit, the XGBoost model achieves over 70%. In terms of error, the RMSE values for both models are 3.472, indicating minor errors. Statistical analysis reveals that the proportion of ship temperature differences predicted by the XGBoost model exceeding 2 is less than 0.020%. Additionally, the R2 and MAE values further demonstrate the model’s robustness and accuracy in both training and testing phases.
Table 6.
Evaluation result of ship brightness temperature prediction.
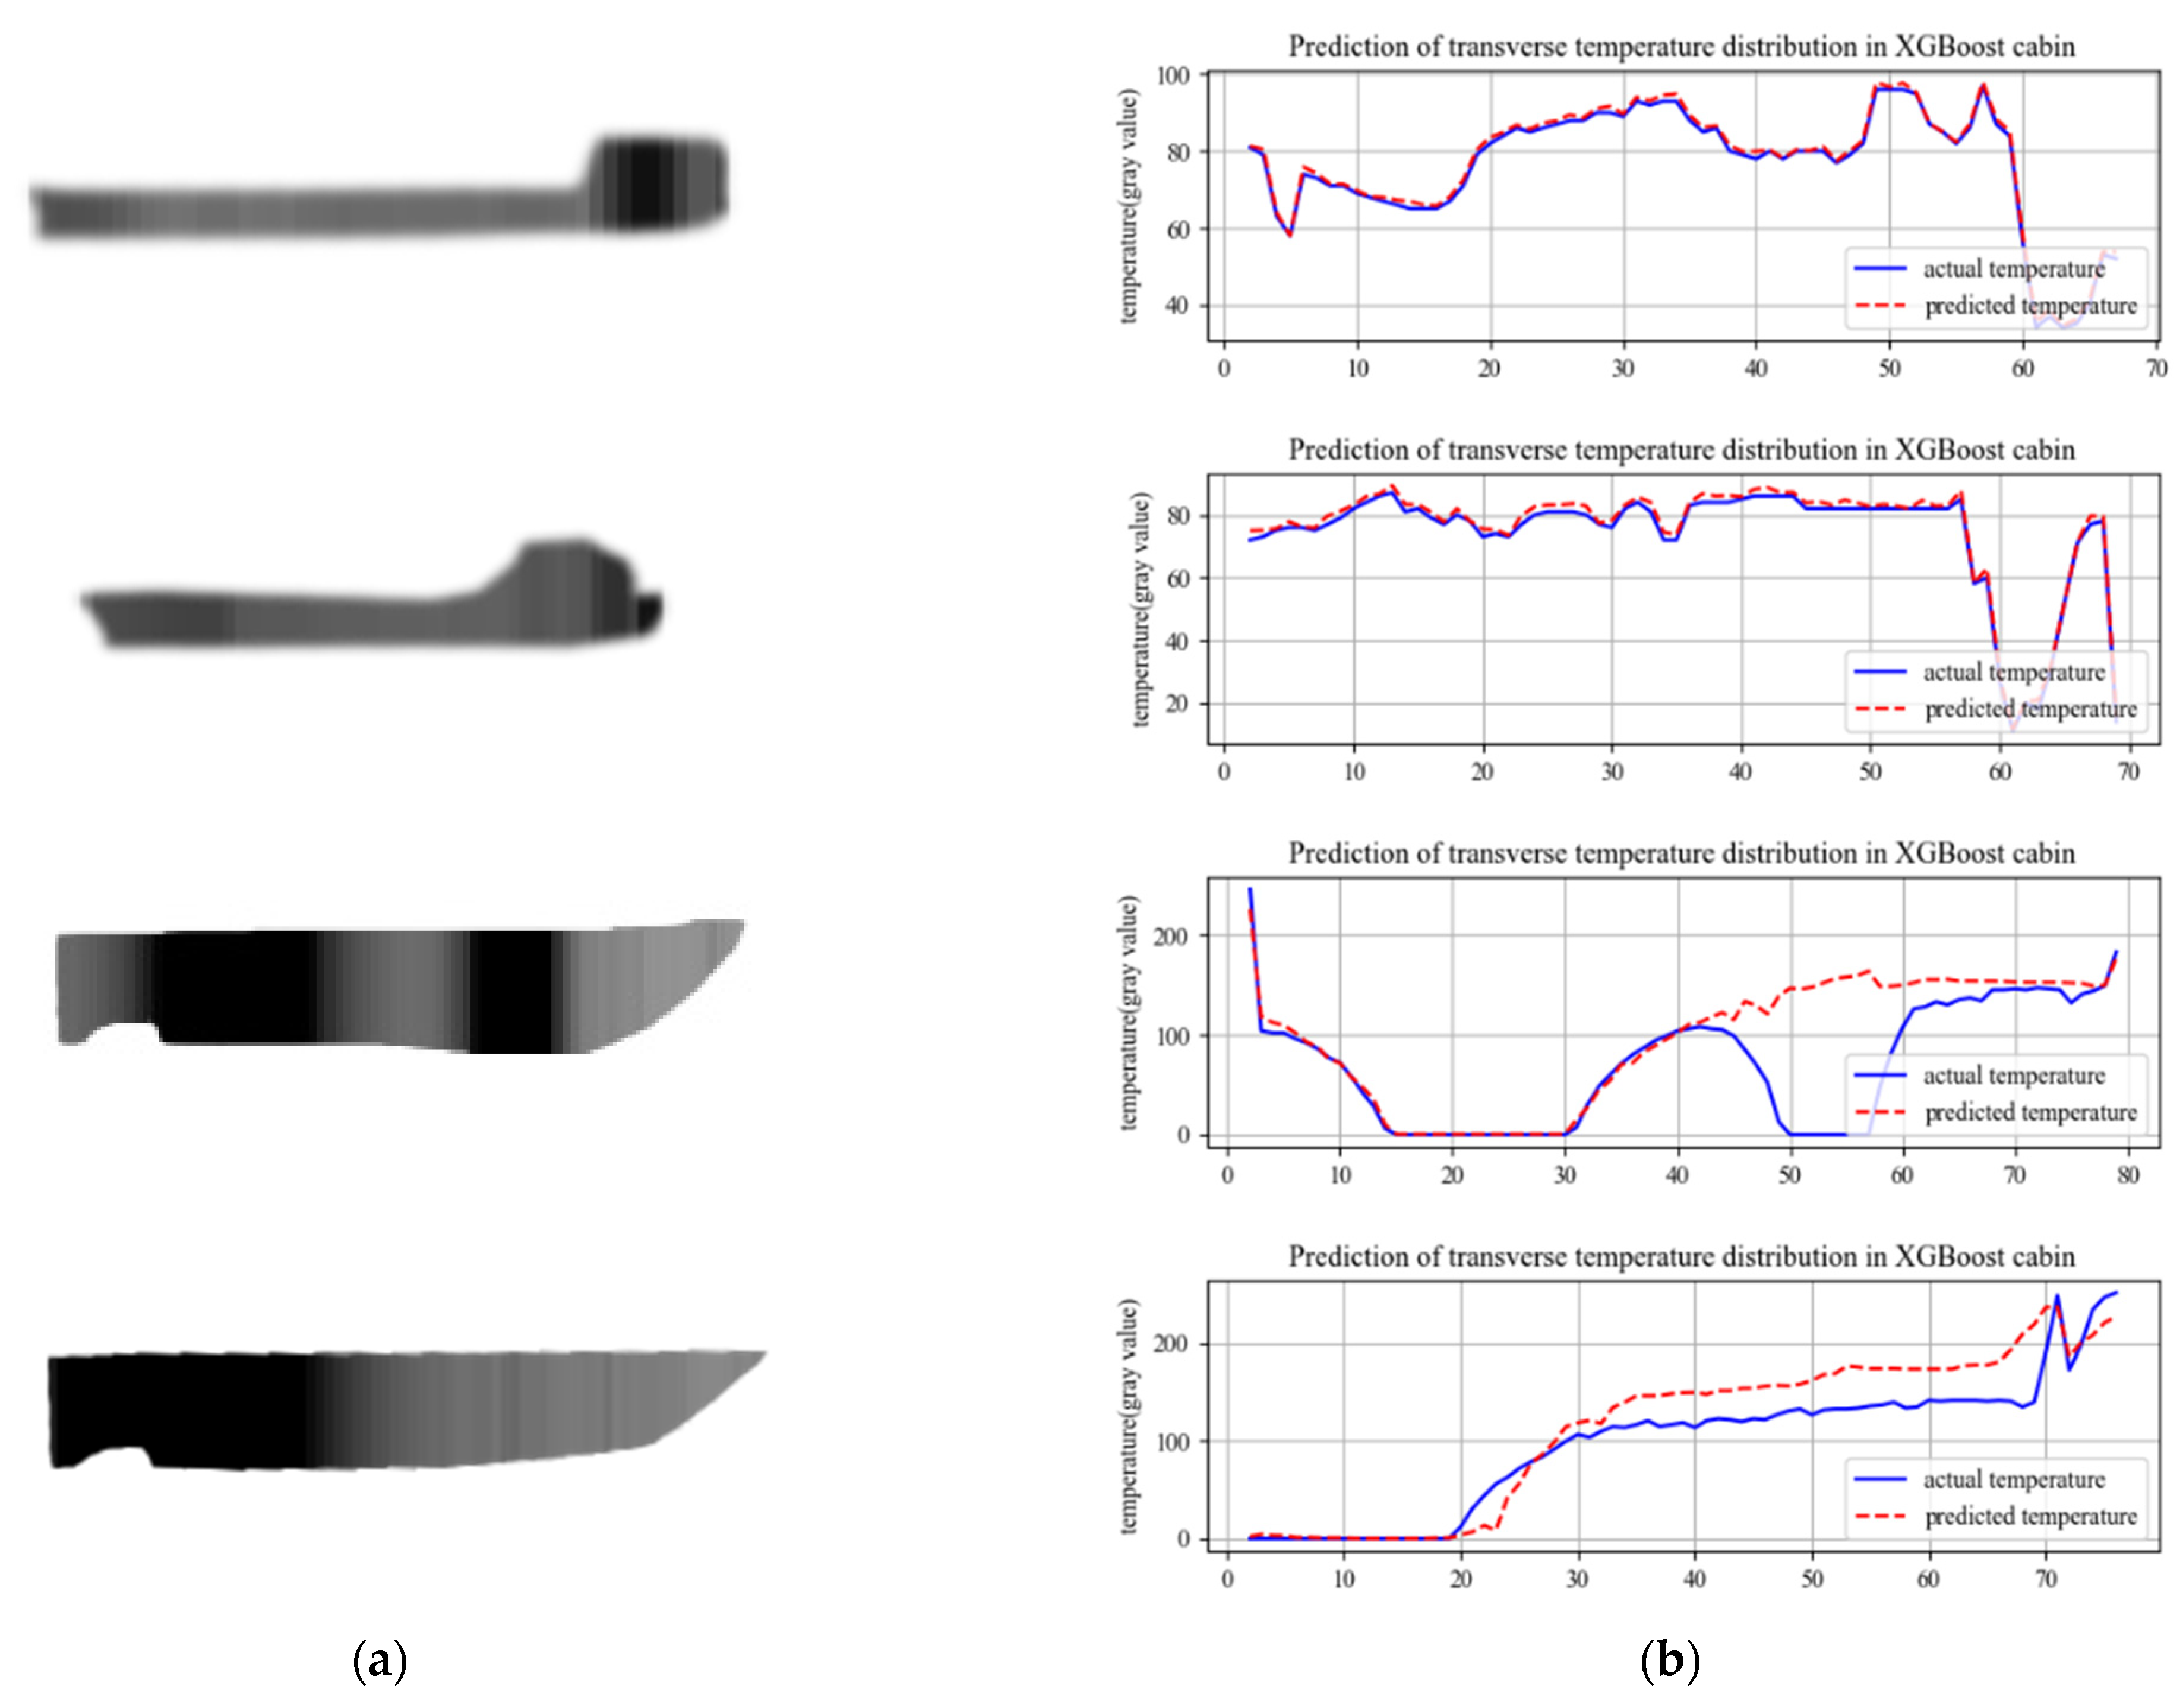
As shown in Figure 16, the longitudinal fitting curves of the ship are depicted. In (a), the two sets represent simulated curves of normal propagation, exhibiting high goodness of fit and minimal fluctuations. In (b), the first sample simulates the appearance of an abnormal heat source in the midsection of the ship. According to the model prediction, there is a temperature difference of over 100 between the predicted temperature and the actual temperature between 49 and 56. This discrepancy indicates that the temperature in this area does not comply with the ship temperature model assuming a single heat source from the engine, thus suggesting an abnormal temperature range. In the second sample of (b), a simulated abnormal cold source appears in the midsection of the ship. The model predicts an abnormal temperature decrease in the range of 19–73, which deviates from the ship temperature model. Consequently, it is determined that an abnormal cold zone exists in the range of 19–73, affecting the transmission of temperature in the engine compartment.
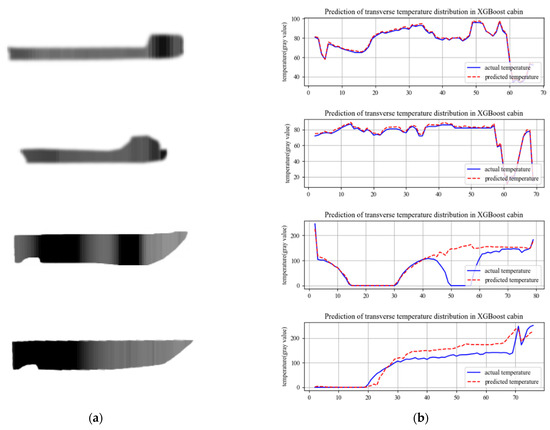
Figure 16.
Numerical curve for predicting ship temperature. (a) Sampling diagram of ship brightness temperature. (b) Horizontal temperature curve.
4. Conclusions
In this paper, we propose a multi-feature fusion encode–decode semantic segmentation network for infrared ship images. Considering the issues of blurred edges and few target features in infrared images, we introduce an edge feature extraction network to enhance the edge information of the images. At the same time, we design a multi-scale feature fusion module to retain more shallow features. To extract sufficient features, we use ResNet50 as the base network and incorporate the ASPP module to detect ships at multiple scales. Since ship targets are usually small and occupy a small proportion of the image, with background pixels being the majority, we use the data from the edge extraction network as weighting parameters. By adding edge weights into the Dice Loss function, we achieve segmentation of small ship targets in infrared images. In the decoder, we replace standard convolutions with dilated convolutions, which reduces the number of parameters while ensuring detection accuracy. Due to the scarcity of infrared ship segmentation datasets, we collected and annotated a large number of infrared images of ships in waterways at night. Experimental results demonstrate that our method significantly outperforms DeepLabv3+ in edge segmentation, achieving an mIoU of 89.17%. When compared to state-of-the-art algorithms like DeepLabv3+, PSPNet, and DANet, our method shows improvements of 6.38%, 13.21%, and 9.16% in segmentation performance, respectively.
The prediction of cabin temperature is based on brightness temperature information, assuming the ship as a single heat source. We establish a transverse temperature regression model for ships based on extreme gradient boosting trees. By sampling the transverse temperature from the collected infrared images of ships, we obtain the transverse temperature distribution gradient. Using the engine room, water body, ship boundary brightness temperature, and temperature transfer distance as elements, we predict the overall temperature of the ship. Experimental results indicate that the XGBoost model demonstrates a high degree of fit, with goodness of fit exceeding 70% and an RMSE value of 3.472, reflecting minimal errors in both the training and testing sets. Statistical analysis also shows that less than 0.020% of the predicted ship temperature differences exceed 2 °C, confirming the model’s reliability and accuracy in predicting cabin temperatures.
Looking ahead, several potential directions can be explored to enhance this system. One promising avenue is to incorporate attention mechanisms, particularly the spatial attention network, to focus on small or distant ships more effectively, especially in scenarios with complex backgrounds or low visibility. This could allow for better differentiation between ships and surrounding objects by prioritizing the most relevant regions of the image. Another improvement would be the integration of temporal data through a recurrent neural network (RNN) or long short-term memory (LSTM) network, which could capture dynamic changes over time and improve the robustness of segmentation in real-world maritime scenarios, where ships may move across frames or appear intermittently. Moreover, while the model primarily focuses on infrared images, a valuable next step would be to implement multi-modal fusion techniques, combining infrared, visible light, and radar imagery to create a robust detection system that operates effectively in various lighting and weather conditions. By fusing these different data types, the system could enhance its resilience to environmental challenges such as fog, rain, or nighttime conditions, where infrared images alone might be insufficient. In terms of cabin temperature prediction, future work could incorporate a more sophisticated model that factors in environmental variables such as ambient weather conditions, wind speed, and water temperature, which influence the ship’s temperature dynamics. This could improve the accuracy of the temperature prediction, especially under changing weather conditions. Additionally, integrating sensor-based data, such as from on-board temperature sensors, could allow for real-time adjustments to predictions, making the model more adaptable and responsive. Lastly, integrating this system into a real-time operational platform would allow for continuous, automatic ship temperature monitoring, enabling operators to detect temperature anomalies and perform predictive maintenance, ensuring operational safety and proactively identifying potential issues before they affect the vessel’s performance.
Author Contributions
Conceptualization, X.H. and G.C.; Data curation, G.C. and R.C.; Formal analysis, X.H. and Y.C.; Funding acquisition, X.H.; Investigation, R.C.; Methodology, X.H., G.C. and Y.C.; Project administration, Y.C.; Resources, Y.C.; Software, G.C.; Supervision, X.H. and Y.C.; Validation, G.C. and R.C.; Writing—original draft, X.H. and G.C.; Writing—review and editing, Y.C. All authors have read and agreed to the published version of the manuscript.
Funding
This research was funded by the 2024 Guangdong Provincial Marine Economy Development Special Project under grant GDNRC [2024]20.
Institutional Review Board Statement
Not applicable.
Informed Consent Statement
Not applicable.
Data Availability Statement
Data are contained within the article.
Conflicts of Interest
Author Ruimou Cai was employed by the Guangzhou Shipyard International Company Limited. The remaining authors declare that this research was conducted in the absence of any commercial or financial relationships that could be construed as a potential conflict of interest.
Abbreviations
The following abbreviations are used in this manuscript:
| IERNet | Infrared Image Edge-Enhanced Segmentation Network |
| CBAM | Convolutional Block Attention Module |
| XGBoost | eXtreme Gradient Boosting |
| SAR | Synthetic Aperture Radar |
| ORS | Optical Remote Sensing |
| FCM | Fuzzy c-means |
| CNN | convolutional neural network |
| PSANet | Point-wise Spatial Attention Network |
| IRDCLNet | Interference Reduction and Dynamic Contour Learning Network |
| GBDT | Gradient Boosting Decision Tree |
| MCNet | Multi-level Correction Network |
| MAM | Multi-level Attention Module |
| EEM | Edge Enhancement Module |
| MPSA | Multi-level Pixel Attention Module |
| PAM | Pixel Attention Module |
| M-LCNN | Multi-long short-term memory Convolution Neural Network |
| ASPP | Atrous Spatial Pyramid Pooling |
| GT | ground truth |
| mIoU | mean Intersection over Union |
| mPA | mean Pixel Accuracy |
| PSPNet | Pyramid Scene Parsing Network |
References
- Yang, F.; Liu, Z.; Bai, X.; Zhang, Y. An Improved Intuitionistic Fuzzy C-Means for Ship Segmentation in Infrared Images. IEEE Trans. Fuzzy Syst. 2022, 30, 332–344. [Google Scholar] [CrossRef]
- Zhang, T.; Shen, H.; Rehman, S.U.; Liu, Z.; Li, Y.; Rehman, O.U. Two-Stage Domain Adaptation for Infrared Ship Target Segmentation. IEEE Trans. Geosci. Remote Sens. 2023, 61, 4208315. [Google Scholar] [CrossRef]
- Han, Y.; Liao, J.; Lu, T.; Pu, T.; Peng, Z. KCPNet: Knowledge-Driven Context Perception Networks for Ship Detection in Infrared Imagery. IEEE Trans. Geosci. Remote Sens. 2023, 61, 5000219. [Google Scholar] [CrossRef]
- Li, Y.; Li, Z.; Xu, B.; Dang, C.; Deng, J. Low-Contrast Infrared Target Detection Based on Multiscale Dual Morphological Reconstruction. IEEE Geosci. Remote Sens. Lett. 2022, 19, 7001905. [Google Scholar] [CrossRef]
- Li, L.; Jiang, L.; Zhang, J.; Wang, S.; Chen, F. A Complete YOLO-Based Ship Detection Method for Thermal Infrared Remote Sensing Images under Complex Backgrounds. Remote Sens. 2022, 14, 1534. [Google Scholar] [CrossRef]
- Zhao, L.; Qiu, S.; Chen, Y. Enhanced Water Surface Object Detection with Dynamic Task-Aligned Sample Assignment and Attention Mechanisms. Sensors 2024, 24, 3104. [Google Scholar] [CrossRef]
- Dai, X.; Yuan, X.; Wei, X. TIRNet: Object detection in thermal infrared images for autonomous driving. Appl. Intell. 2021, 51, 1244–1261. [Google Scholar] [CrossRef]
- Qiu, Y.; Yang, Y.; Lin, Z.; Chen, P.; Luo, Y.; Huang, W. Improved denoising autoencoder for maritime image denoising and semantic segmentation of USV. China Commun. 2020, 17, 46–57. [Google Scholar] [CrossRef]
- Sun, Y.; Zuo, W.; Liu, M. RTFNet: RGB-Thermal Fusion Network for Semantic Segmentation of Urban Scenes. IEEE Robot. Autom. Lett. 2019, 4, 2576–2583. [Google Scholar] [CrossRef]
- Yang, W.; Cai, L.; Wu, F. Image segmentation based on gray level and local relative entropy two dimensional histogram. PLoS ONE 2020, 15, e0229651. [Google Scholar] [CrossRef]
- Peng, Z.; Wang, L.; Tong, L.; Zou, H.; Liu, D.; Zhang, C. Multi-threshold image segmentation of 2D OTSU inland ships based on improved genetic algorithm. PLoS ONE 2023, 18, e0290750. [Google Scholar] [CrossRef]
- Comaniciu, D.; Meer, P. Mean shift: A robust approach toward feature space analysis. IEEE Trans. Pattern Anal. Mach. Intell. 2002, 24, 603–619. [Google Scholar] [CrossRef]
- Feng, D.; Wenkang, S.; Liangzhou, C.; Yong, D.; Zhenfu, Z. Infrared image segmentation with 2-D maximum entropy method based on particle swarm optimization (PSO). Pattern Recognit. Lett. 2005, 26, 597–603. [Google Scholar] [CrossRef]
- Liu, Z.; Zhou, F.; Chen, X.; Bai, X.; Sun, C. Iterative infrared ship target segmentation based on multiple features. Pattern Recognit. 2014, 47, 2839–2852. [Google Scholar] [CrossRef]
- Sinaga, K.P.; Yang, M.S. Unsupervised K-Means Clustering Algorithm. IEEE Access 2020, 8, 80716–80727. [Google Scholar] [CrossRef]
- Chuang, K.-S.; Tzeng, H.-L.; Chen, S.; Wu, J.; Chen, T.-J. Fuzzy c-means clustering with spatial information for image segmentation. Comput. Med. Imaging Graph. 2006, 30, 9–15. [Google Scholar] [CrossRef]
- Askari, S. Fuzzy C-Means clustering algorithm for data with unequal cluster sizes and contaminated with noise and outliers: Review and development. Expert Syst. Appl. 2021, 165, 113856. [Google Scholar] [CrossRef]
- Chan, T.F.; Vese, L.A. Active contours without edges. IEEE Trans. Image Process. 2001, 10, 266–277. [Google Scholar] [CrossRef]
- Chan, T.F.; Sandberg, B.Y.; Vese, L.A. Active Contours Without Edges for Vector-Valued Images. J. Vis. Commun. Image Represent. 2000, 11, 130–141. [Google Scholar] [CrossRef]
- Zhao, H.; Zhang, Y.; Liu, S.; Shi, J.; Loy, C.C.; Lin, D.; Jia, J. PSANet: Point-wise Spatial Attention Network for Scene Parsing. In Proceedings of the European Conference on Computer Vision (ECCV), Munich, Germany, 8–14 September 2018. [Google Scholar]
- Sun, X.; Xie, Y.; Jiang, L.; Cao, Y.; Liu, B. DMA-Net: DeepLab with Multi-Scale Attention for Pavement Crack Segmentation. IEEE Trans. Intell. Transp. Syst. 2022, 23, 18392–18403. [Google Scholar] [CrossRef]
- Sun, Y.; Su, L.; Luo, Y.; Meng, H.; Zhang, Z.; Zhang, W.; Yuan, S. IRDCLNet: Instance Segmentation of Ship Images Based on Interference Reduction and Dynamic Contour Learning in Foggy Scenes. IEEE Trans. Circuits Syst. Video Technol. 2022, 32, 6029–6043. [Google Scholar] [CrossRef]
- Yu, J.; He, Y.; Liu, H.; Zhang, F.; Li, J.; Sun, G.; Zhang, X.; Yang, R.; Wang, P.; Wang, H. An Improved U-Net Model for Infrared Image Segmentation of Wind Turbine Blade. IEEE Sens. J. 2023, 23, 1318–1327. [Google Scholar] [CrossRef]
- Xiong, H.; Cai, W.; Liu, Q. MCNet: Multi-level Correction Network for thermal image semantic segmentation of nighttime driving scene. Infrared Phys. Technol. 2021, 113, 103628. [Google Scholar] [CrossRef]
- Sun, Y.; Su, L.; Luo, Y.; Meng, H.; Li, W.; Zhang, Z.; Wang, P.; Zhang, W. Global Mask R-CNN for marine ship instance segmentation. Neurocomputing 2022, 480, 257–270. [Google Scholar] [CrossRef]
- Bai, X.; Liu, M.; Wang, T.; Chen, Z.; Wang, P.; Zhang, Y. Feature based fuzzy inference system for segmentation of low-contrast infrared ship images. Appl. Soft Comput. 2016, 46, 128–142. [Google Scholar] [CrossRef]
- Li, Y.; Li, Z.; Zhu, Y.; Li, B.; Xiong, W.; Huang, Y. Thermal Infrared Small Ship Detection in Sea Clutter Based on Morphological Reconstruction and Multi-Feature Analysis. Appl. Sci. 2019, 9, 3786. [Google Scholar] [CrossRef]
- Xu, H.; Yu, Y.; Zhang, X.; He, J. Cross-Granularity Infrared Image Segmentation Network for Nighttime Marine Observations. J. Mar. Sci. Eng. 2024, 12, 2082. [Google Scholar] [CrossRef]
- Cheng, D.; Meng, G.; Xiang, S.; Pan, C. FusionNet: Edge Aware Deep Convolutional Networks for Semantic Segmentation of Remote Sensing Harbor Images. IEEE J. Sel. Top. Appl. Earth Obs. Remote Sens. 2017, 10, 5769–5783. [Google Scholar] [CrossRef]
- Li, C.; Xia, W.; Yan, Y.; Luo, B.; Tang, J. Segmenting Objects in Day and Night: Edge-Conditioned CNN for Thermal Image Semantic Segmentation. IEEE Trans. Neural Netw. Learn. Syst. 2021, 32, 3069–3082. [Google Scholar] [CrossRef]
- Chen, S.; Xu, X.; Yang, N.; Chen, X.; Du, F.; Ding, S.; Gao, W. R-Net: A novel fully convolutional network–based infrared image segmentation method for intelligent human behavior analysis. Infrared Phys. Technol. 2022, 123, 104164. [Google Scholar] [CrossRef]
- Rosenfeld, A. The Max Roberts Operator is a Hueckel-Type Edge Detector. IEEE Trans. Pattern Anal. Mach. Intell. 1981, PAMI-3, 101–103. [Google Scholar] [CrossRef]
- Prewitt, J.M.S. Object enhancement and extraction. Pict. Process. Psychopictorics 1970, 10, 15–19. [Google Scholar]
- Kanopoulos, N.; Vasanthavada, N.; Baker, R.L. Design of an image edge detection filter using the Sobel operator. IEEE J. Solid-State Circuits 1988, 23, 358–367. [Google Scholar] [CrossRef]
- Ghosal, S.K.; Chatterjee, A.; Sarkar, R. Image steganography based on Kirsch edge detection. Multimed. Syst. 2021, 27, 73–87. [Google Scholar] [CrossRef]
- Chen, L.C.; Papandreou, G.; Kokkinos, I.; Murphy, K.; Yuille, A.L. DeepLab: Semantic Image Segmentation with Deep Convolutional Nets, Atrous Convolution, and Fully Connected CRFs. IEEE Trans. Pattern Anal. Mach. Intell. 2018, 40, 834–848. [Google Scholar] [CrossRef]
- Takikawa, T.; Acuna, D.; Jampani, V.; Fidler, S. Gated-SCNN: Gated Shape CNNs for Semantic Segmentation. In Proceedings of the IEEE/CVF International Conference on Computer Vision (ICCV), Seoul, Republic of Korea, 27 October–2 November 2019. [Google Scholar]
- Chen, L.-C.; Papandreou, G.; Schroff, F.; Adam, H. Rethinking Atrous Convolution for Semantic Image Segmentation. arXiv 2017, arXiv:1706.05587. [Google Scholar]
- Wang, Z.-f.; Yu, Y.-f.; Wang, J.; Zhang, J.-q.; Zhu, H.-l.; Li, P.; Xu, L.; Jiang, H.-n.; Sui, Q.-m.; Jia, L.; et al. Convolutional neural-network-based automatic dam-surface seepage defect identification from thermograms collected from UAV-mounted thermal imaging camera. Constr. Build. Mater. 2022, 323, 126416. [Google Scholar] [CrossRef]
- Ren, S.; Liu, Q.; Zhang, X. MPSA: A multi-level pixel spatial attention network for thermal image segmentation based on Deeplabv3+ architecture. Infrared Phys. Technol. 2022, 123, 104193. [Google Scholar] [CrossRef]
- Jin, D.; Lee, K.S.; Choi, S.; Seo, M.; Lee, D.; Kwon, C.; Kim, H.; Lee, E.; Han, K.S. Determination of Dynamic Threshold for Sea-Ice Detection Through Relationship Between 11 µm Brightness Temperature and 11–12 µm Brightness Temperature Difference. Korean J. Remote Sens. 2017, 33, 243–248. [Google Scholar]
- Deng, Z.; Zhang, G. An Improved Forest Fire Monitoring Algorithm with Three-Dimensional Otsu. IEEE Access 2021, 9, 118367–118378. [Google Scholar] [CrossRef]
- Xu, L.; Li, Y.; Yu, J.; Li, Q.; Shi, S. Prediction of sea surface temperature using a multiscale deep combination neural network. Remote Sens. Lett. 2020, 11, 611–619. [Google Scholar] [CrossRef]
- Gong, J.; Chu, S.; Mehta, R.K.; McGaughey, A.J.H. XGBoost model for electrocaloric temperature change prediction in ceramics. npj Comput. Mater. 2022, 8, 140. [Google Scholar] [CrossRef]
- Ding, Y.; Wang, M.; Fu, Y.; Zhang, L.; Wang, X. A Wildfire Detection Algorithm Based on the Dynamic Brightness Temperature Threshold. Forests 2023, 14, 477. [Google Scholar] [CrossRef]
- Chen, T.; Guestrin, C. XGBoost: A Scalable Tree Boosting System. In Proceedings of the 22nd ACM SIGKDD International Conference on Knowledge Discovery and Data Mining, San Francisco, CA, USA, 13–17 August 2016. [Google Scholar]
- Feng, Y.; Gao, Z.; Xiao, H.; Yang, X.; Song, Z. Predicting the Tropical Sea Surface Temperature Diurnal Cycle Amplitude Using an Improved XGBoost Algorithm. J. Mar. Sci. Eng. 2022, 10, 1686. [Google Scholar] [CrossRef]
- Qu, N.; Li, Z.; Li, X.; Zhang, S.; Zheng, T. Multi-parameter fire detection method based on feature depth extraction and stacking ensemble learning model. Fire Saf. J. 2022, 128, 103541. [Google Scholar] [CrossRef]
- Liwen, D.; Xiaojun, L. Intelligent fire detection method based on fuzzy neural network. Xiaofang Kexue Yu Jishu/Fire Sci. Technol 2019, 38, 522–525. [Google Scholar]
- Woo, S.; Park, J.; Lee, J.-Y.; Kweon, I.-S.J.A. CBAM: Convolutional Block Attention Module. In Proceedings of the Proceedings of the European Conference on Computer Vision (ECCV), Munich, Germany, 8–14 September 2018. [Google Scholar]
- He, K.; Zhang, X.; Ren, S.; Sun, J. Deep residual learning for image recognition. In Proceedings of the IEEE conference on Computer Vision and Pattern Recognition, Las Vegas, NV, USA, 27–30 June 2016; pp. 770–778. [Google Scholar]
- Chen, L.-C.; Zhu, Y.; Papandreou, G.; Schroff, F.; Adam, H. Encoder-Decoder with Atrous Separable Convolution for Semantic Image Segmentation. In Proceedings of the European Conference on Computer Vision, Munich, Germany, 8–14 September 2018. [Google Scholar]
- Howard, A.G.; Zhu, M.; Chen, B.; Kalenichenko, D.; Wang, W.; Weyand, T.; Andreetto, M.; Adam, H.J.A. MobileNets: Efficient Convolutional Neural Networks for Mobile Vision Applications. arXiv 2017, arXiv:1704.04861. [Google Scholar]
- Milletari, F.; Navab, N.; Ahmadi, S.A. V-Net: Fully Convolutional Neural Networks for Volumetric Medical Image Segmentation. In Proceedings of the 2016 Fourth International Conference on 3D Vision (3DV), Stanford, CA, USA, 25–28 October 2016; pp. 565–571. [Google Scholar]


Disclaimer/Publisher’s Note: The statements, opinions and data contained in all publications are solely those of the individual author(s) and contributor(s) and not of MDPI and/or the editor(s). MDPI and/or the editor(s) disclaim responsibility for any injury to people or property resulting from any ideas, methods, instructions or products referred to in the content. |
© 2025 by the authors. Licensee MDPI, Basel, Switzerland. This article is an open access article distributed under the terms and conditions of the Creative Commons Attribution (CC BY) license (https://creativecommons.org/licenses/by/4.0/).