Article

Investigation the Effects of Different Earthquake Scaling Methods on Nonlinear Site-Amplification Analyzes

1
Sivrihisar VHS, Eskişehir Osmangazi University, Eskişehir 26000, Türkiye
2
Department of Civil Engineering, Eskişehir Osmangazi University, Eskişehir 26000, Türkiye
*
Author to whom correspondence should be addressed.
Appl. Sci. 2025, 15(7), 3566; https://doi.org/10.3390/app15073566
Submission received: 23 January 2025 / Revised: 26 February 2025 / Accepted: 13 March 2025 / Published: 25 March 2025

Abstract

:
The behavior of the soils under dynamic loads is of great importance for the structures to be built in earthquake zones. As a result of the determination of the site-specific dynamic parameters of the soils and the analyzes to be made with these parameters, the ground response that will occur on the surface during the earthquake will be determined. Turkey is located in one of the important earthquake belts of Europe. Studies are carried out on the North Anatolian Fault Zone (NAFZ), which is one of the important and active fault lines here. In this study, as a result of 4 drilling studies on NAFZ, firstly, dynamic triaxial (TRX) and resonant column (RC) test systems were used to obtain site-specific shear modulus and damping curves depending on depth. 11 earthquake acceleration records reflecting the seismic characteristics of the region were selected and scaled in both time-history and frequency-time domains. Two different scaling methods were compared with the nonlinear soil amplification analysis. In addition, surface response spectra were examined according to the Turkish Building Earthquake Code (TEC 2018). Although there is not a big difference in amplification values in two different scaling methods, it has been determined that the design spectrum values are very different.

1. Introduction

Turkey, located in one of Europe’s major earthquake-prone regions, experiences seismic activity due to the compression of the Anatolian Plate as it moves toward the Eurasian Plate [1]. This movement is further influenced by the advancing Arabian and African Plates. Significant earthquakes, such as the 6.9 Erzincan (1992), 7.4 Kocaeli (1999), 7.2 Düzce (1999), 7.2 Van (2011), 6.8 Elazığ (2020), 6.9 Seferihisar (2020), 7.7 Pazarcık (2023), and 7.6 Elbistan (2023) earthquakes, have caused extensive destruction of buildings and significant loss of life. The presence of industrial cities along these fault lines, combined with increasing urbanization, places a substantial portion of the country’s population at high risk from earthquakes [2]. Consequently, it is critical to design structures based on site-specific conditions and to thoroughly analyze the interaction between structures and soil.
For earthquake-resistant structural design, understanding the behavior of soil layers under seismic loads is crucial for mitigating damage in earthquake-prone areas. The forces acting on structures during an earthquake vary depending on the properties of the soil layers and their response to dynamic loads [3]. To determine site-specific soil dynamic behavior, obtaining undisturbed soil samples from the region and conducting shear wave velocity (Vs) measurements in the field are of great importance. These measurements provide valuable information about how soil profiles change with depth, making them essential for site-specific analyses [4,5]. In Turkey and other parts of the world, structural damage often occurs due to soil amplification [6].
In such analyses, earthquake acceleration records are as critical as determining the dynamic parameters of soils. The selection of these records must comply with regulatory requirements. Earthquakes are selected based on factors such as the fault type of the region and local soil conditions, followed by detailed analyses. National regulations typically outline the procedures for selecting and scaling earthquake acceleration records and deriving design spectrum curves [7].
In studies conducted in earthquake-prone regions, earthquake records are chosen according to the seismic characteristics of the area. These records are scaled using various methods and applied in analyses as bedrock acceleration. When scaling is performed in the time-history domain—a common method in the literature—the frequency content of the acceleration remains unchanged. However, when scaling is conducted in the frequency domain, an equivalent acceleration record is generated based on the design acceleration spectrum, resulting in changes to the frequency content. As a result of site-specific earthquake scaling, the response spectrum differences observed at the surface affect superstructure designs. Additionally, the examination of soil amplification effects in the region also varies depending on the scaling method used. Therefore, the choice of scaling method is crucial for analyses conducted in earthquake-prone areas.
Turkey’s earthquake code studies began in 1975 and were subsequently revised in 1998 and 2007, following significant earthquakes and the accumulation of new knowledge. The latest regulation, published in 2018, further emphasized the impact of local soil conditions. The Turkish Earthquake Code (TEC 2018), which has been in effect since 2019, introduced recommendations for calculating earthquake ground motion spectra based on the location of the structure, its distance from the fault, and soil properties. This regulation also expanded the section on site-specific soil classifications compared to previous codes.
As part of this study, laboratory tests and computer analyses were conducted using undisturbed soil samples collected from field studies in Sakarya, one of Turkey’s critical earthquake regions. The amplification effect of soil was particularly evident during the region’s 1999 earthquakes, with magnitudes of M7.2 and M7.4. The alluvial and water-saturated nature of the region played a significant role in this amplification.
Bol [8] investigated the geology of Sakarya province, identifying the geomorphological characteristics of its alluvial soils and analyzing their geotechnical index properties. The study also examined the formation of Adapazarı soils and predicted the distribution of potential earthquake damage. Sancio [9] conducted field experiments in 12 locations in the Adapazarı district, focusing on soil profiles and evaluating the liquefaction potential based on the region’s seismicity.
Various laboratory tests are employed to determine the dynamic parameters of undisturbed soils. These include dynamic triaxial (TRX) tests, resonant column (RC) tests, and bender element tests [8,10,11]. To estimate the stress-strain behavior of in situ soils under cyclic loads, dynamic properties must first be assessed before conducting site-specific analyses to predict the behavior of both the ground and superstructures. Parameters such as the initial dynamic shear modulus (Gmax), normalized dynamic shear modulus (G/Gmax), and damping ratio (D) are essential for defining dynamic soil properties [10,11]. TRX and RC tests are widely used, as recommended by ASTM D4015-15 and D4767-11 [12,13]. The choice of test depends on the shear strain level: RC tests are suitable for shear strains below 0.01%, while TRX tests are used for higher strain levels.
Saxena and Reddy [14] used Monterey sand in RC tests to derive shear modulus and damping ratio curves, proposing formulations that link Young’s modulus, Poisson’s ratio, shear modulus, and damping values. Dutta et al. [15] explored the dynamic properties of clay samples using RC tests, examining the effects of saturation on shear modulus and Poisson’s ratio. Li and Senetakis [16] compared RC test results with a reference model and developed a new model incorporating additional parameters. Morsy et al. [17] performed RC tests on samples under varying conditions of density, saturation, and ambient confining pressure, obtaining shear modulus and damping ratio values. Güler and Afacan [18] calculated the dynamic parameters of sands using the RC test system.
Kokusho [19] conducted TRX tests using Toyoura sand, investigating the effects of void ratios and comparing results with other studies. Kumar et al. [20] evaluated the dynamic properties of sand samples using TRX tests under different densities and confining pressures, comparing the results with reference models.
In studies combining RC and TRX test systems, Khan et al. [21] assessed the effects of bentonite additives on sand samples, while El Mohtar et al. [22] investigated similar conditions both with and without drainage. Bayat and Ghalandarzadeh [11] used a combination of RC, bender element, and TRX tests on samples with varying sand and gravel ratios, densities, and void ratios to analyze their effects on dynamic parameters. Banerjee and Balaji [23] studied Chennai marine clay using RC and TRX tests, correlating strain rate with dynamic properties. Sobolev and Martirosyan [24] determined the dynamic properties of sand and clay samples using RC and TRX tests, later analyzing the results using finite element methods.
Darendeli [25], in his doctoral research, conducted dynamic tests on undisturbed soil samples collected from 20 locations at various depths. These samples underwent RC and torsional shear tests, and the results were used to examine the effects of confining pressure, over-consolidation ratio, and frequency. Based on statistical analyses, a reference model was proposed for determining dynamic soil properties. Afacan [26] conducted centrifuge tests on clay samples over a wide stress range, scaling different earthquake records for one-dimensional analyses. The study concluded that nonlinear behavior dominated for periods shorter than T = 1.0 s, while linear behavior was more pronounced in longer periods. Güler and Afacan [27] combined RC and TRX experimental results and proposed new models for shear modulus and damping ratio.
In this study, soil amplification analyses were performed using the DeepSoil program [28]. Two earthquake acceleration scaling methods—time-domain and frequency-domain scaling—were applied; incorporating site-specific ground dynamic parameters. Peak ground acceleration (PGA) values, ground amplification factors, and design spectra obtained from both methods were compared. Additionally, the design spectrum envelope proposed by TEC 2018 for the region was evaluated for performance.
With these results, it was determined in the study that the values recommended by the regulation for the region should be evaluated point by point as a result of site-specific main analyzes. It is known that the size and behavior of structural elements will also change as the spectrum graph, which is one of the important parameters in building designs, changes. For this reason, site-specific analyses can be performed to ensure safer construction of structures in earthquake zones.

2. Study Area

2.1. Geology and Seismicity of the Area

The name “Sakarya” comes from the Sakarya River, which flows through the lower basin, empties into the Black Sea within the province’s territory, and divides the land in a north-south direction. The Adapazarı Plain, also known as Akova, is covered with fertile alluvium deposited by the Sakarya River. Covering an area of 620 km2, it is one of the largest plains in the Marmara region. Streams such as the Sakarya River, Mudurnu Stream, and Darıçayırı Stream occasionally cause floods, which typically occur due to sudden downpours and snowmelt. Studies have determined that the groundwater level in the region is high [8,29].
The Adapazarı Plain is predominantly composed of Quaternary (Q) deposits. A large portion of the region lies on this alluvium, with formations at varying elevations in the surrounding areas (Figure 1). Boring studies conducted at different times by the General Directorate of State Hydraulic Works (DSİ) have not encountered bedrock even at depths of 200–300 m [8]. Significant damage and casualties occurred during the 1999 Kocaeli (M:7.4) and Düzce (M:7.2) earthquakes. Studies have shown that soil amplification and liquefaction were the primary causes of destruction.
Turkey is one of the most seismically active regions in Europe, surrounded by the North Anatolian Fault (NAF) in the north and the East Anatolian Fault (EAF) in the southeast. Both active fault lines continue to generate earthquakes. The NAF does not consist of a single slip plane but is composed of multiple segments. This fault system forms a “fault zone” with a width of 500–1000 m and is classified as a right-lateral strike-slip fault. Right-lateral horizontal displacement dominates across all segments of the fault, with minor vertical movements also observed. It is known that the land to the north of the fault moves rightward and downward. However, there is no exact geological information on when the North Anatolian Fault initially formed or the total displacement that has occurred since its inception (Figure 2) [30].
Fractures along the NAF continue from east to west. Significant earthquakes along the fault, such as 1929 Suşehri/Sivas (M:6.1), 1939 Erzincan (M:7.8), 1942 Niksar-Erbaa (M:7.0), 1943 Tosya-Ladik (M:7.2), 1944 Bolu-Gerede (M:7.2), 1951 Kurşunlu (M:6.9), 1957 Abant (M:7.1), 1966 Varto (M:6.9), 1967 Mudurnu (M:7.1), 1992 Erzincan (M:6.7), 1999 Gölcük (M:7.6), and 1999 Düzce (M:7.2), demonstrate that the fault is still active and rupturing westward. As a result, research in this region has intensified.
Figure 1. Geology map of Adapazarı [31].
Applsci 15 03566 g001
Figure 2. Seismicity of the Adapazarı [32].
Applsci 15 03566 g002

2.2. Determination of the Site-Specific Dynamic Shear Modulus and Damping Ratio

Determining the dynamic properties of the soil in earthquake zone analyses and incorporating these parameters into the analyses will provide a more accurate representation of the region. In this study, undisturbed samples were obtained from four boreholes in the region using undisturbed sampling tubes. These samples were collected at 1 m intervals every 5 m. In addition, shear wave velocity (Vs) was measured at each drilling point (Figure 3a,b).
Using the obtained samples, TRX tests at high deformation levels and RC tests at low deformation levels were conducted at the Eskişehir Osmangazi University Geotechnical Laboratory to determine soil characteristics and dynamic parameters. It was found that the groundwater level in the region is high (0.5 m) and that the samples were saturated with water (Figure 3c,d).
The variation of the soil profile with depth was determined through soil identification tests performed on the undisturbed samples in the laboratory. Additionally, the BH-1 borehole log, including shear wave velocity (Vs) measurements taken in the field, is shown in Figure 4. In the laboratory, tests were conducted at a frequency of 1 Hz on undisturbed samples, applying ambient confining pressure to simulate in-situ conditions at each depth. Based on the obtained data, shear modulus vs. unit strain and damping vs. unit strain values were determined for both low and high deformation levels.
Identification and UU tests were performed on 18 undisturbed samples taken from four drilling points, and the soil layers were classified (Table 1). After the experimental studies, it was determined that the results of the RC and TRX tests should be combined. At this stage, shear modulus vs. unit strain values obtained from different deformation levels were analyzed.
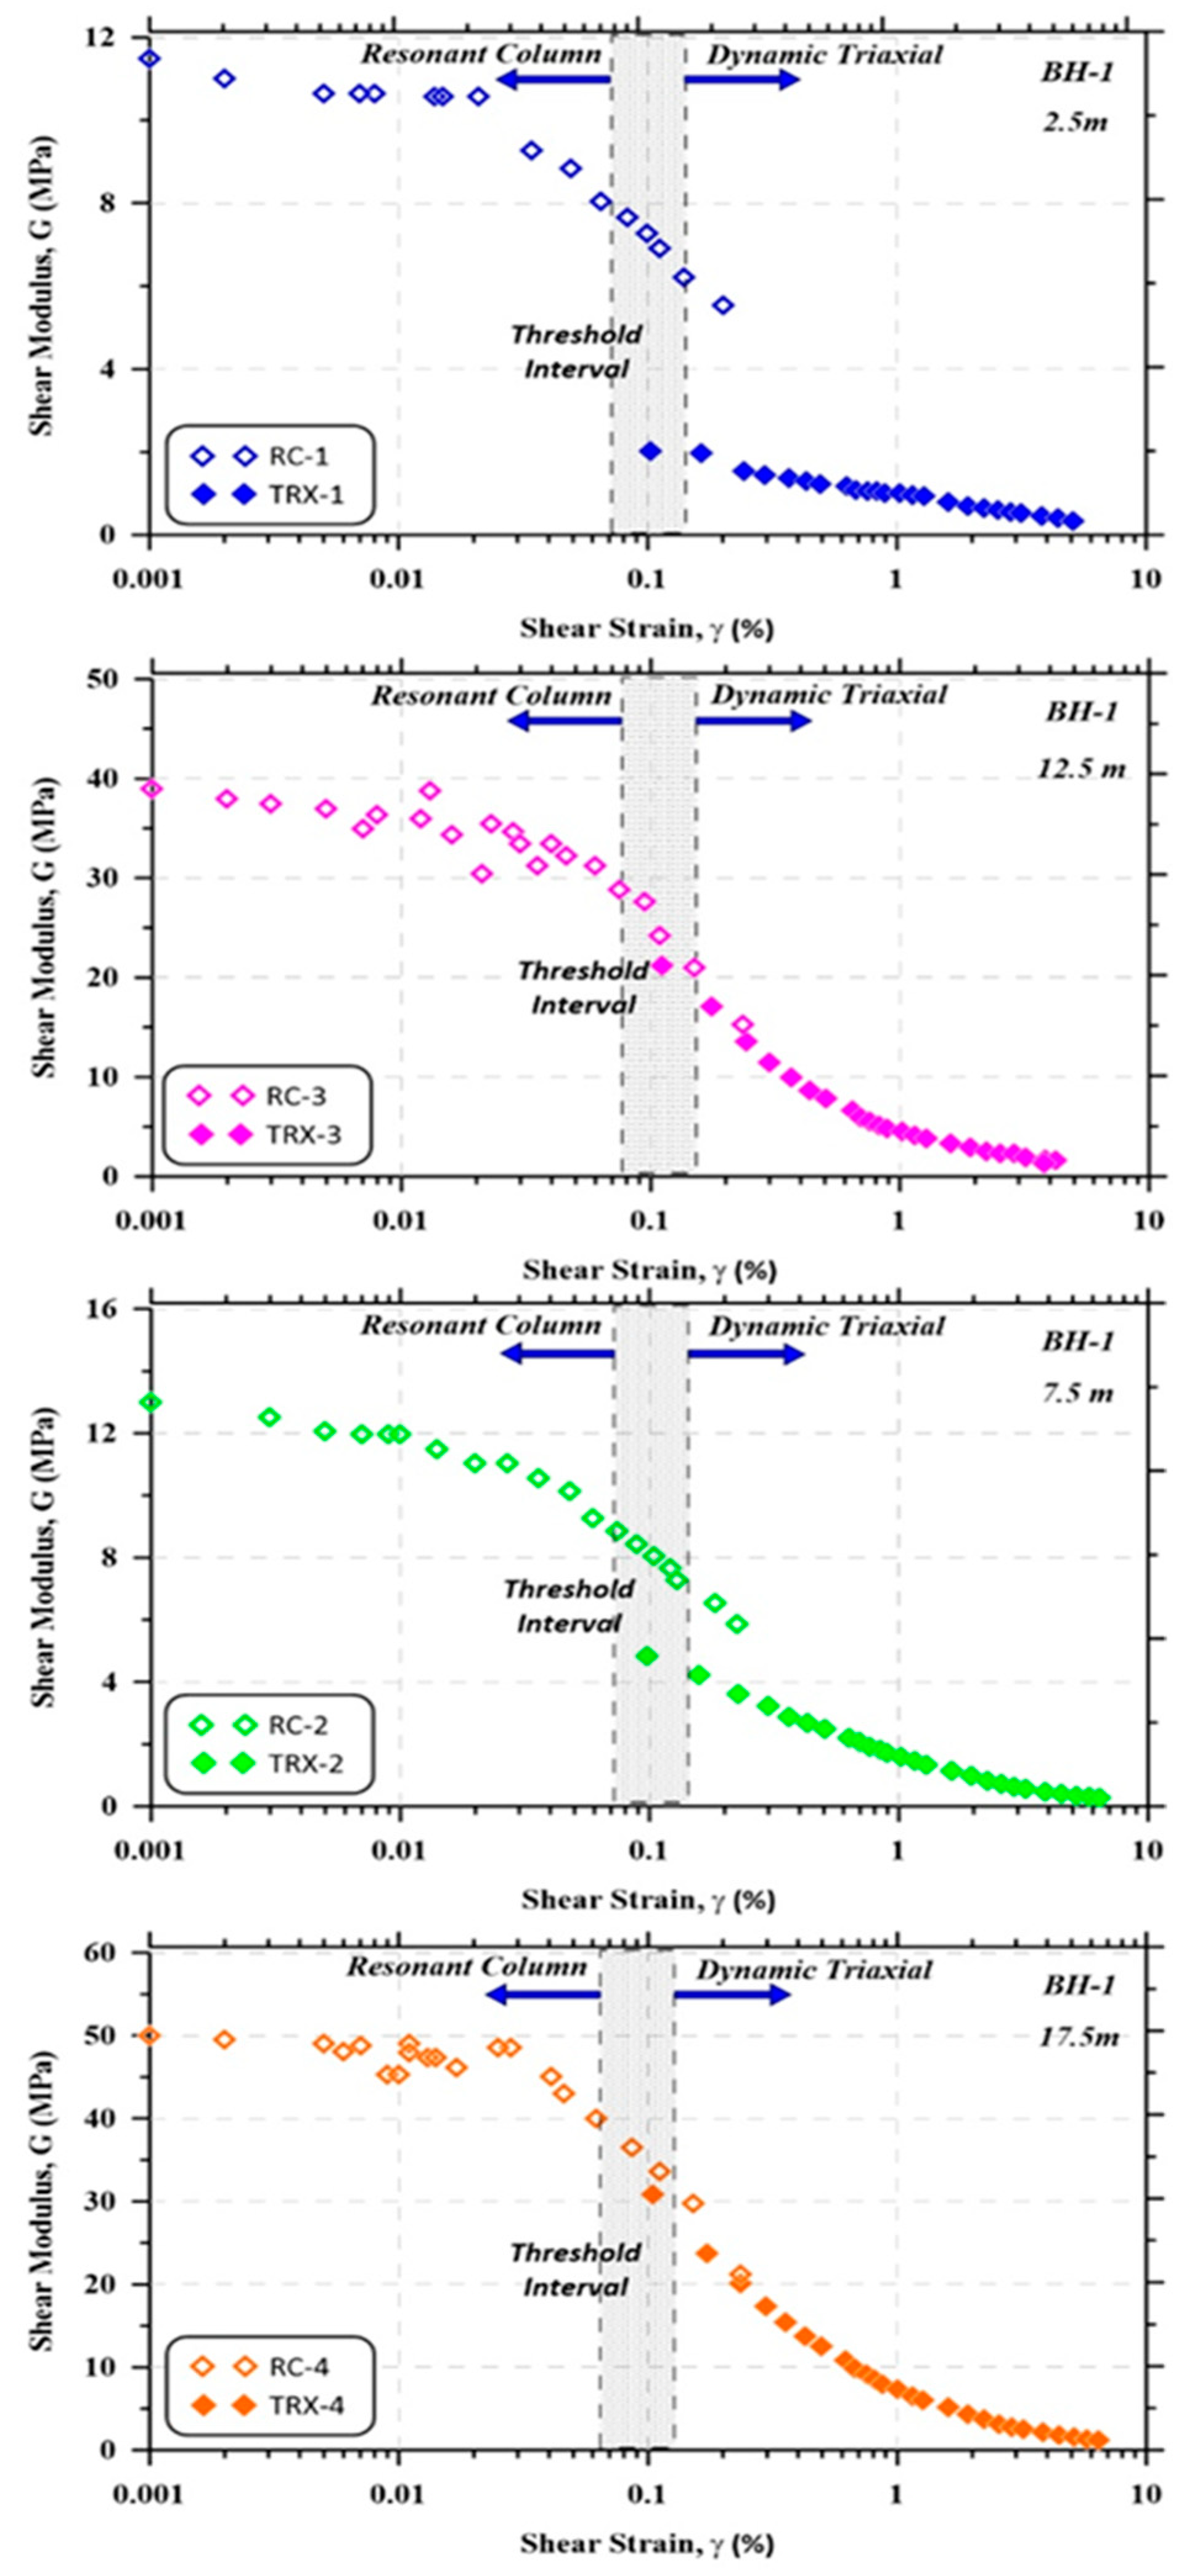
By combining the RC and TRX test results, the most appropriate curve was derived to represent the dynamic properties of the study region (Figure 5). In this process, MATLAB (Matrix Laboratory), a widely used numerical computing software and programming language, was utilized. The experimental results were processed using MATLAB R2018a. Güler and Afacan [27] provided a detailed analysis of these results in their study.

3. Site-Specific Soil Behavior and TEC 2018

The seismic performance of floors must be evaluated for buildings constructed in earthquake-prone areas. Local soil conditions should be identified, and the geotechnical parameters required for structural design must be determined and documented.
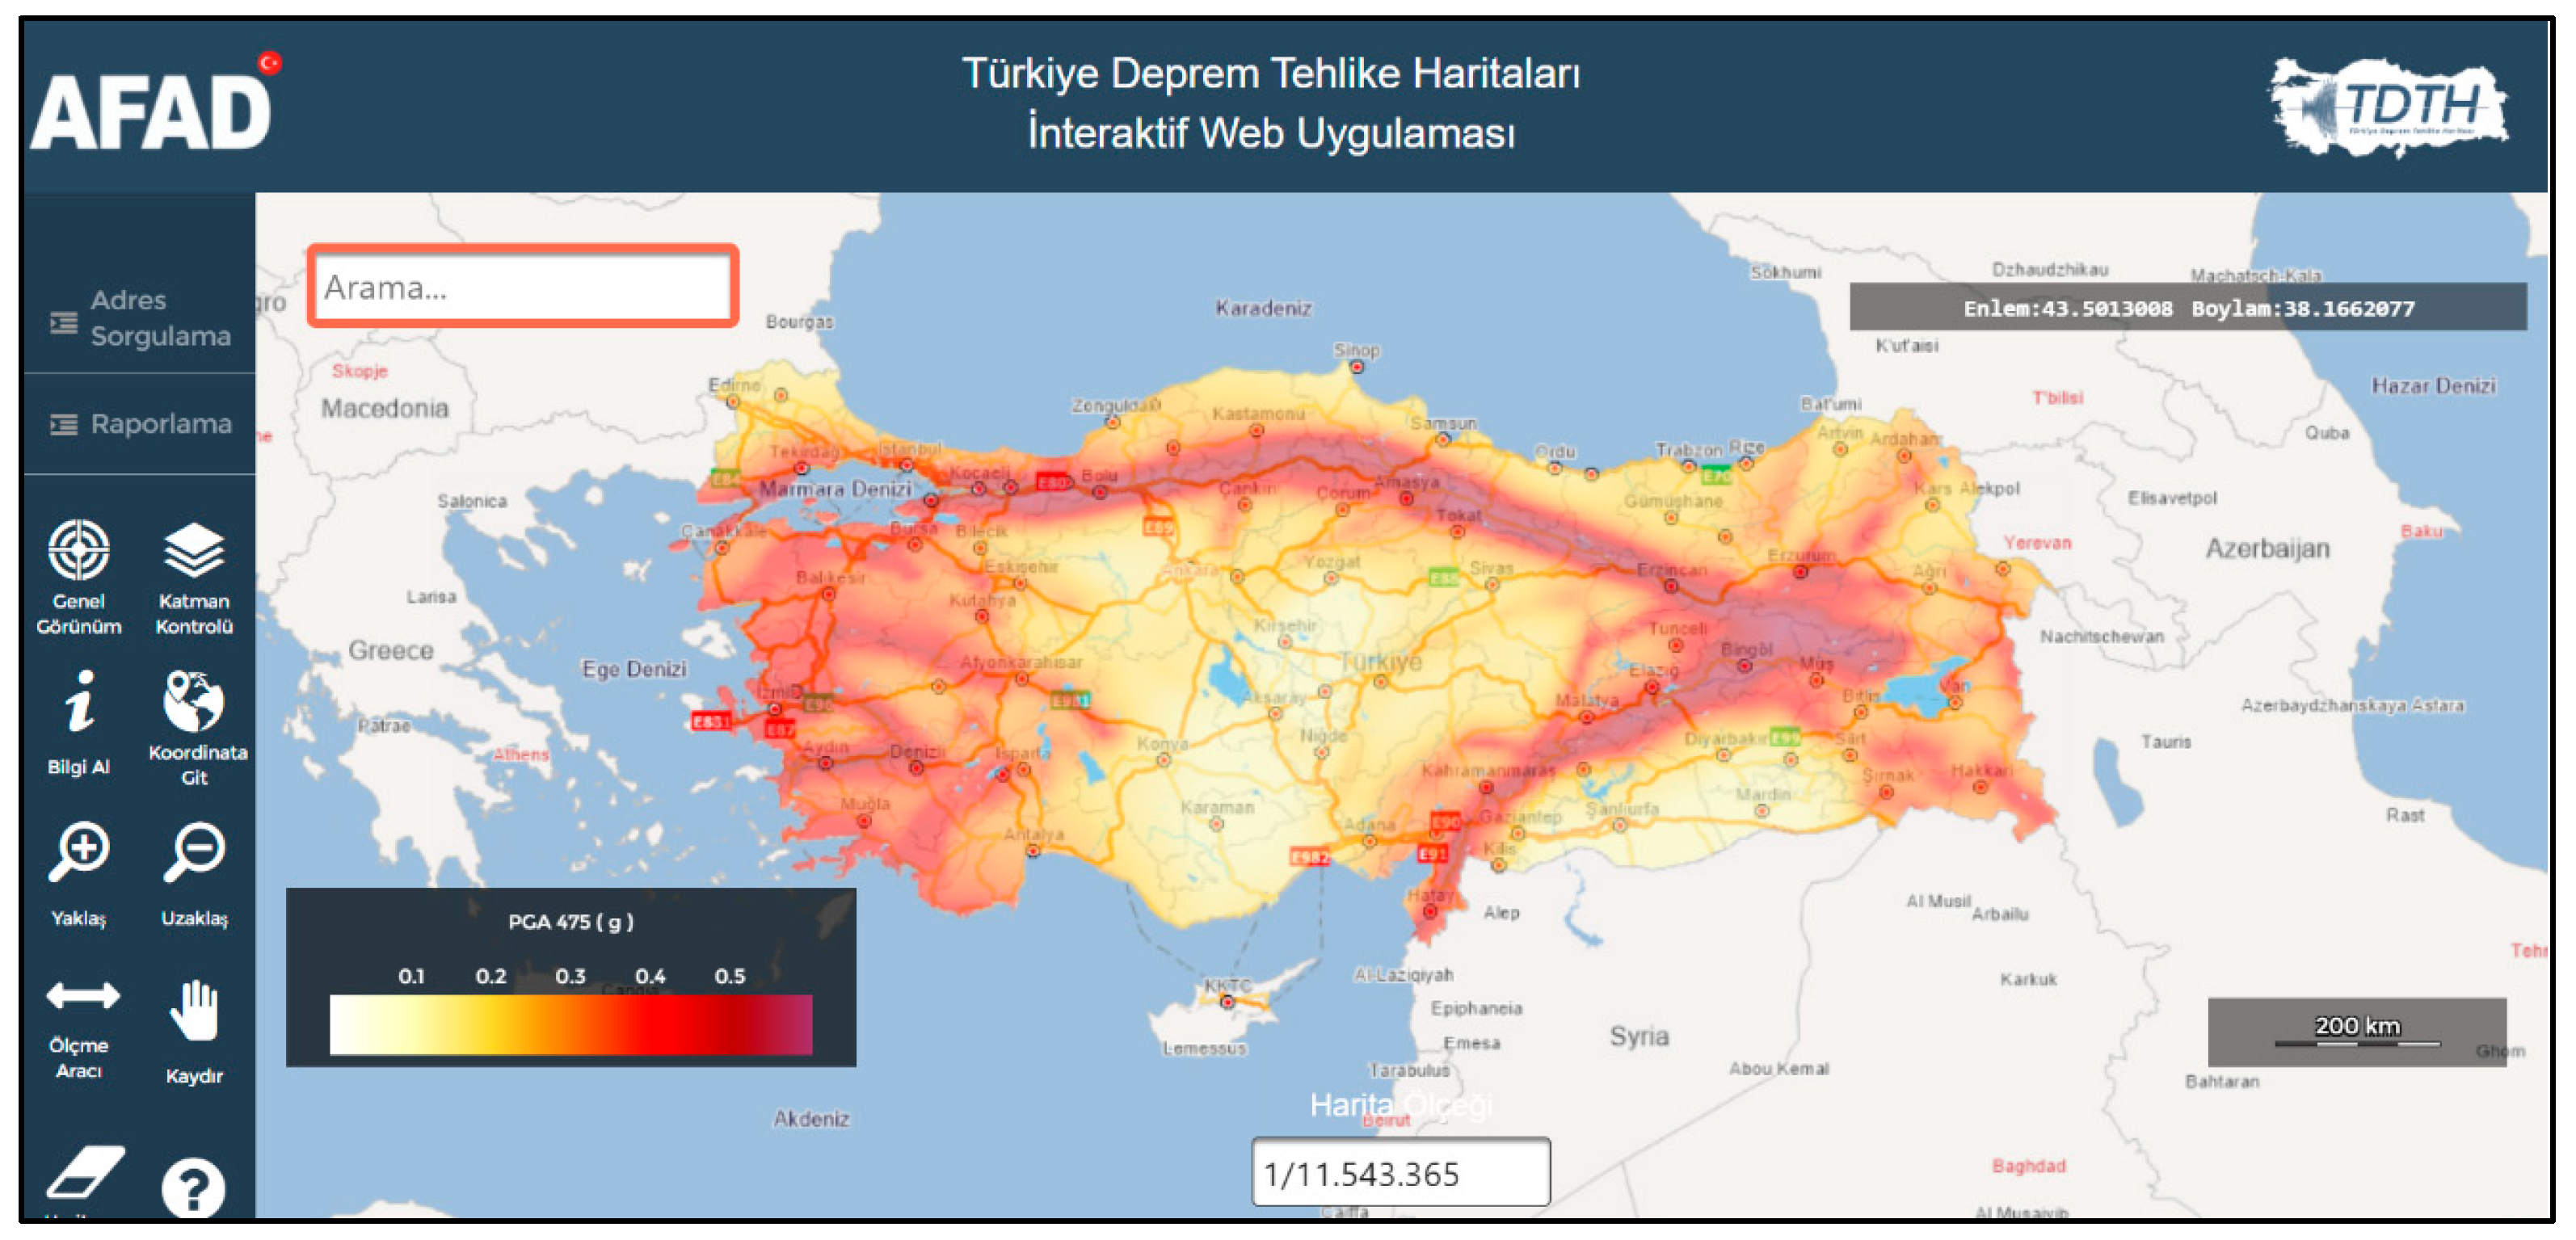
The new Turkey Earthquake Hazard Map was developed based on knowledge gained from past earthquakes and earthquake regulation studies in Turkey (Figure 6) [33]. A new regulation was ultimately published in 2018, further emphasizing the impact of local ground conditions. The most recent Turkey Earthquake Code (TEC, 2018), which has been in effect since 2019, introduced an expanded section for determining site-specific local soil classifications, recommending that earthquake ground motion spectra be calculated based on the structure’s location, distance to the fault, and soil properties, in contrast to previous regulations.
As part of the regulation, local soil classes were revised, and design acceleration spectrum values were determined based on regional maps. These parameters, which are essential for building design, are derived from the new regulation. Since Turkey has been continuously affected by earthquakes throughout its history, earthquake regulations have been periodically updated in response to advancements in research and technology.
According to TEC 2018, which came into effect in January 2019, soil is classified into six categories (Table 2). The classification is based on parameters such as Vs(30), N60(30), and cu(30). The ZF category, which represents the weakest soil conditions according to the regulation, consists of soils that require site-specific investigation and evaluation.

4. Site Response Analyses

It is important to analyze the relationship between earthquakes and ground structure when improving soil conditions. For seismic analysis and design, factors such as fault type, site-specific soil characteristics, and shallow soil conditions must be considered. In earthquake-prone regions, the selection, budgeting, and design curves for seismic zones, as determined by national regulations (TEC, 2018), play a crucial role in structural planning.
Another key parameter in site-specific analyses is the response spectrum. From an engineering perspective, acceleration spectra are widely accepted as parameters that characterize earthquake motions and are essential for structural design [34]. Research on evaluating seismic analysis performance in compliance with regulations is ongoing, with continuous efforts to improve methodologies [35,36].
To minimize structural damage and enhance earthquake-resistant construction, it is necessary to assess soil behavior under seismic loads and properly design superstructures. The design spectrum values specified in earthquake codes serve as a basis for determining ground motions. These values account for the natural vibration periods of structures and help establish the horizontal and vertical loads affecting them. The design spectra represent the maximum response of a site to various seismic forces, considering local seismic characteristics and soil conditions. The spectra defined in regulations are generated by classifying soil based on shear wave velocity (Vs(30)), corrected SPT blow count (N60(30)), and undrained shear strength (cu(30)), without explicitly distinguishing between sand and clay behavior.
Historical earthquake records indicate that soil amplification has significantly contributed to structural damage. Notable examples include the 1985 Mexico City earthquake, the 1999 Kocaeli earthquake, and the 1989 Loma Prieta earthquake [37,38]. Therefore, site-specific analyses are crucial in mitigating seismic damage.
In the same way, the damping-unit deformation curve was obtained to define the damping of soils under dynamic loads. The damping ratio-shear strain curve of the BH-1 well is shown in Figure 7. This process was applied to other boreholes as well.
In this study, Hashash et al. [28] performed site-specific 1D soil amplification analyses using the DeepSoil program. This software allows for both equivalent linear and nonlinear analyses (in both the frequency and time domains). Acceleration, stress, amplification, Fourier response spectra, and response spectra are obtained for each soil layer in the analyses based on the defined soil layers and acceleration records.
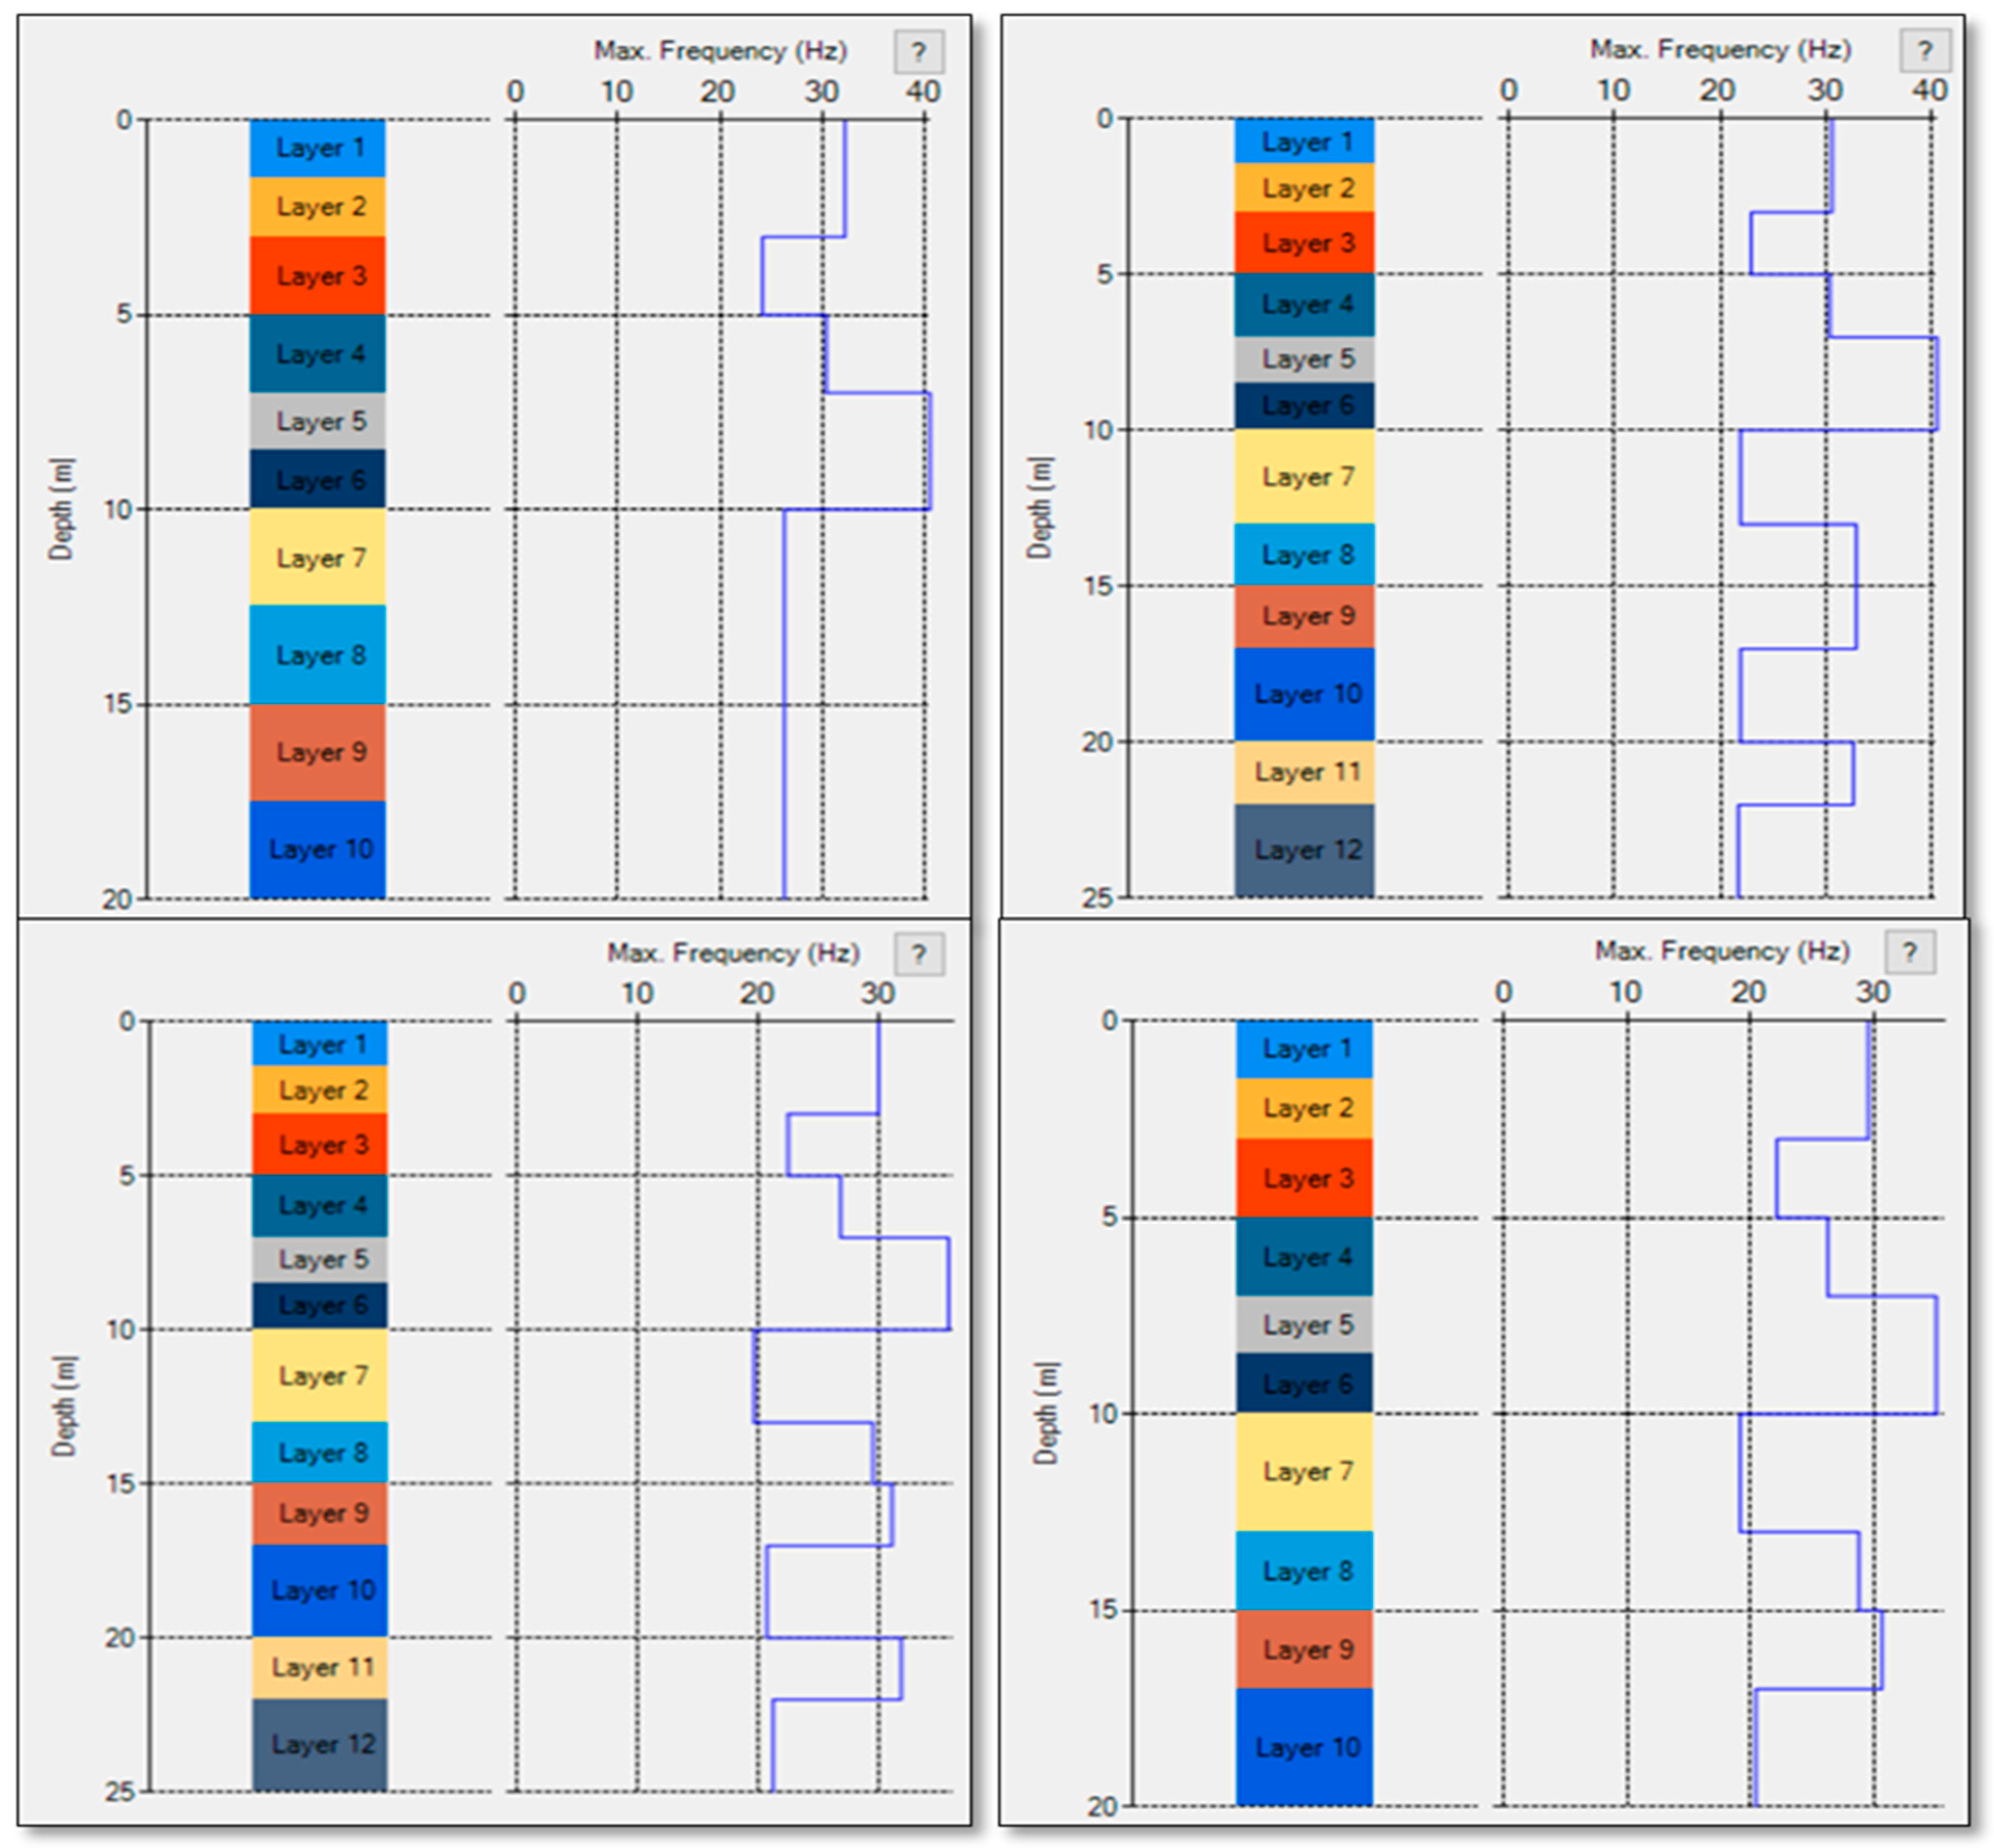
The selection of the analysis method, calculation method, pore water confinement changes, and the unit method to be used are all chosen in the program interface. Then, the layer name, thickness, unit weight, and shear wave velocity values of the defined soil layers are entered. In the second step, the shear stress value of each layer, as well as the shear modulus-strain curve and damping curves of each layer, should be determined. In this study, the curves obtained from site-specific undisturbed samples were manually input into the program (Figure 8).
Earthquakes selected for site-specific analyses should reflect the seismic characteristics of the region. The selection of earthquake records to be used in the earthquake calculation for the time history of the building’s structural systems will be made by taking into account the earthquake magnitudes, fault distances, source mechanisms, and local ground conditions, all of which should be compatible with the earthquake ground motion level based on the design. If past earthquake records compatible with the earthquake ground motion level based on the design are available in the area where the building is located, these records should be used first (TEC, 2018).
In this context, earthquake acceleration records shared by the Pacific Earthquake Engineering Research Center (PEER) [39] were examined, and 11 earthquake acceleration records were selected. As a result of the examination, eleven earthquakes were selected and are shown in Table 3.
Earthquake acceleration records to be scaled can be obtained through three different methods: artificial earthquake records, simulated records, and real earthquake records [40,41]. Earthquake acceleration records are obtained by scaling earthquakes that comply with the seismological conditions determined by different regulations, and various studies are carried out on the soil amplification effects on structures [42,43,44]. It was stated that earthquake acceleration records selected according to TEC 2018 should be scaled using the simple scaling method in order to be used. In this context, the proposed soil behavior spectrum for the region, whose coordinates are marked, is obtained with the interactive web application provided to users by AFAD.
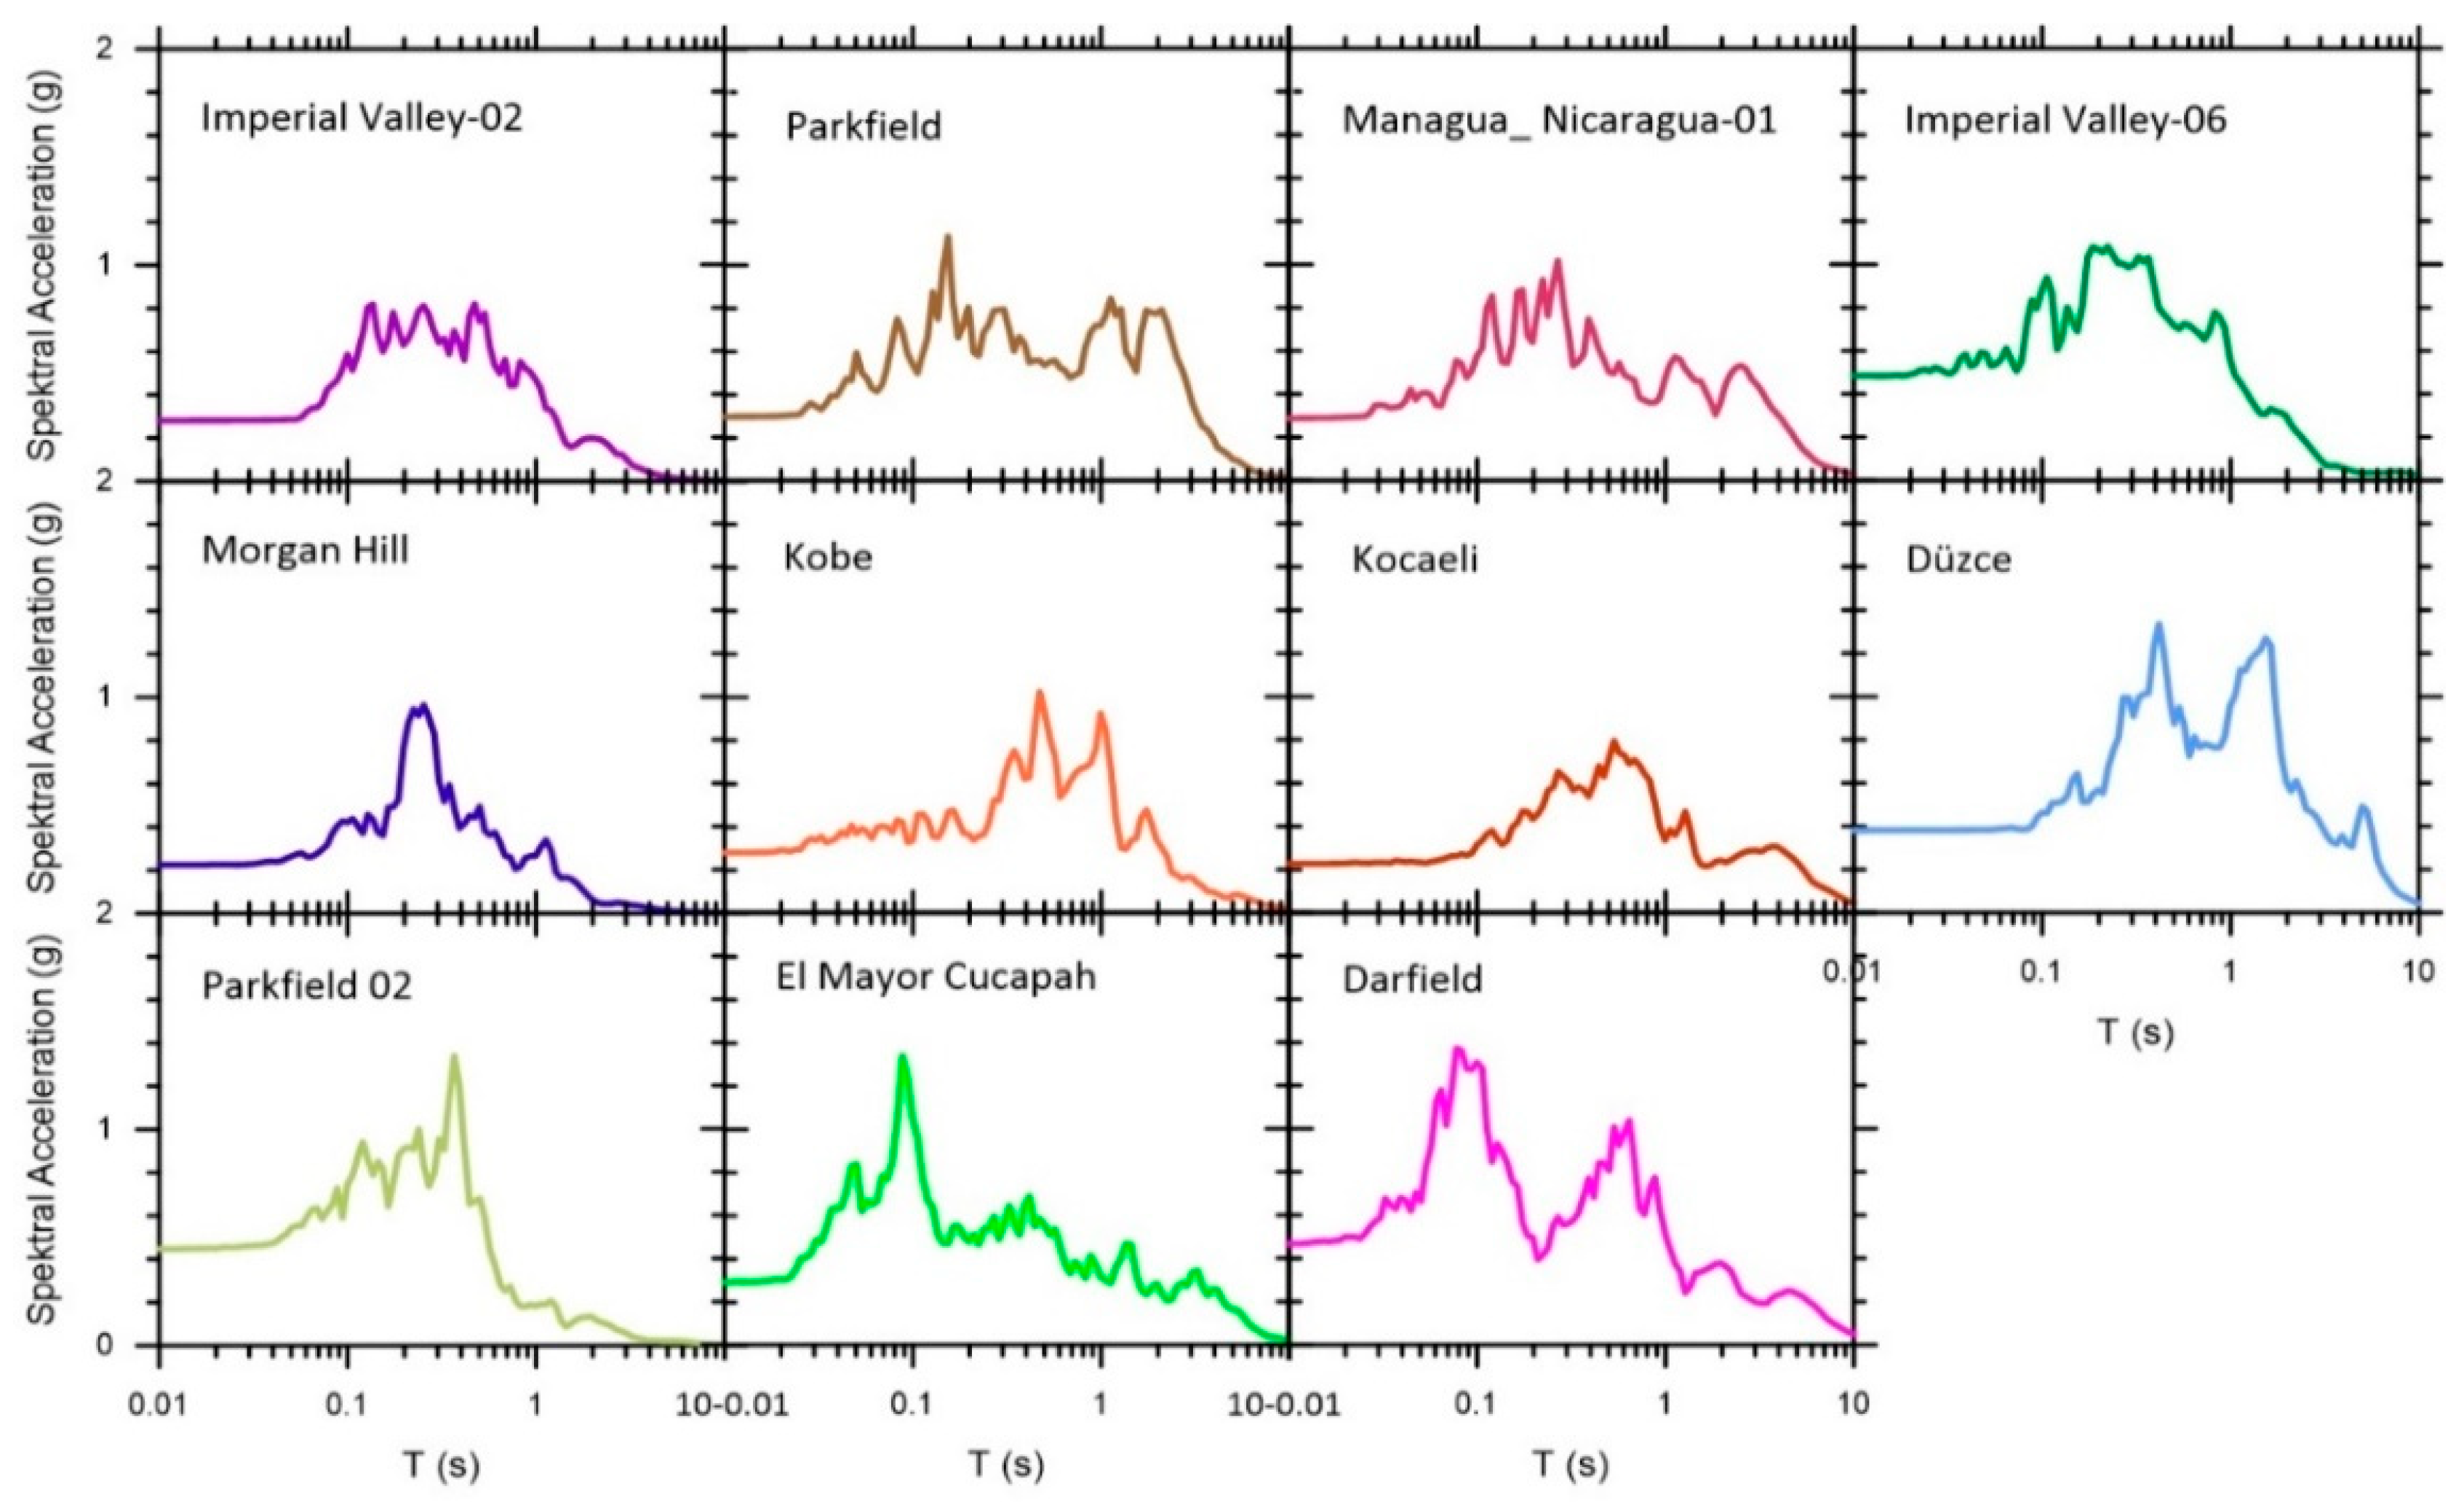
In this study, 11 earthquake acceleration-time records selected according to TEC 2018 are shown in Figure 9. The spectral acceleration-period graphs of the selected earthquakes, based on specific criteria, are shown in Figure 10. These acceleration records were scaled using two different methods: scaling according to the design spectrum curve (Sc-2) in the time-history domain (Sc-1) and scaling in the frequency-definition domain according to the PGA value of 0.689 g, which is recommended for the region by the regulation.
Earthquakes used in site-specific analyses must first be scaled according to the earthquake characteristics of the study area. Earthquake records can be scaled to fit the design spectrum using two different methods (time-history/frequency-definition). In this study, scaling was performed using both methods. With developments in the field of engineering, earthquake records are scaled using different methods. Real earthquake records can be scaled using either time-domain or frequency-domain scaling methods.
In time-history scaling methods, the frequency content of the record is changed only by adjusting the amplitude, without altering the frequency. In frequency-domain scaling methods, the frequency content of the ground motion record is modified to achieve parity with the design acceleration spectrum. When Figure 11 is examined, it can be seen that there are changes in the amplitude of the acceleration record in the Sc-1 method compared to 0.689 g, but in the Sc-2 method, there are changes in both the frequency and the duration of the peak acceleration value.
After scaling the site-specific dynamic parameters, shear wave velocities of the soil profile, and the 11 earthquakes with two different methods, analyses were performed at a total of 4 boreholes.

5. Results

Ground Surface Acceleration Values and Soil Amplification

Nonlinear analyses (NL) in the study were performed using Deepsoil v7.0 software. The Deepsoil software, which was preferred in this study, was first developed in 1998 based on the working principle of one-dimensional soil behavior analysis. With Deepsoil, both equivalent linear and nonlinear analyses can be performed, with analyses conducted in both frequency and time history domains [28].
As a result of 4 drillings obtained from the Adapazarı region, site-specific soil dynamic parameters were determined, and 88 nonlinear analyses (NL) were performed using two different scaling methods.
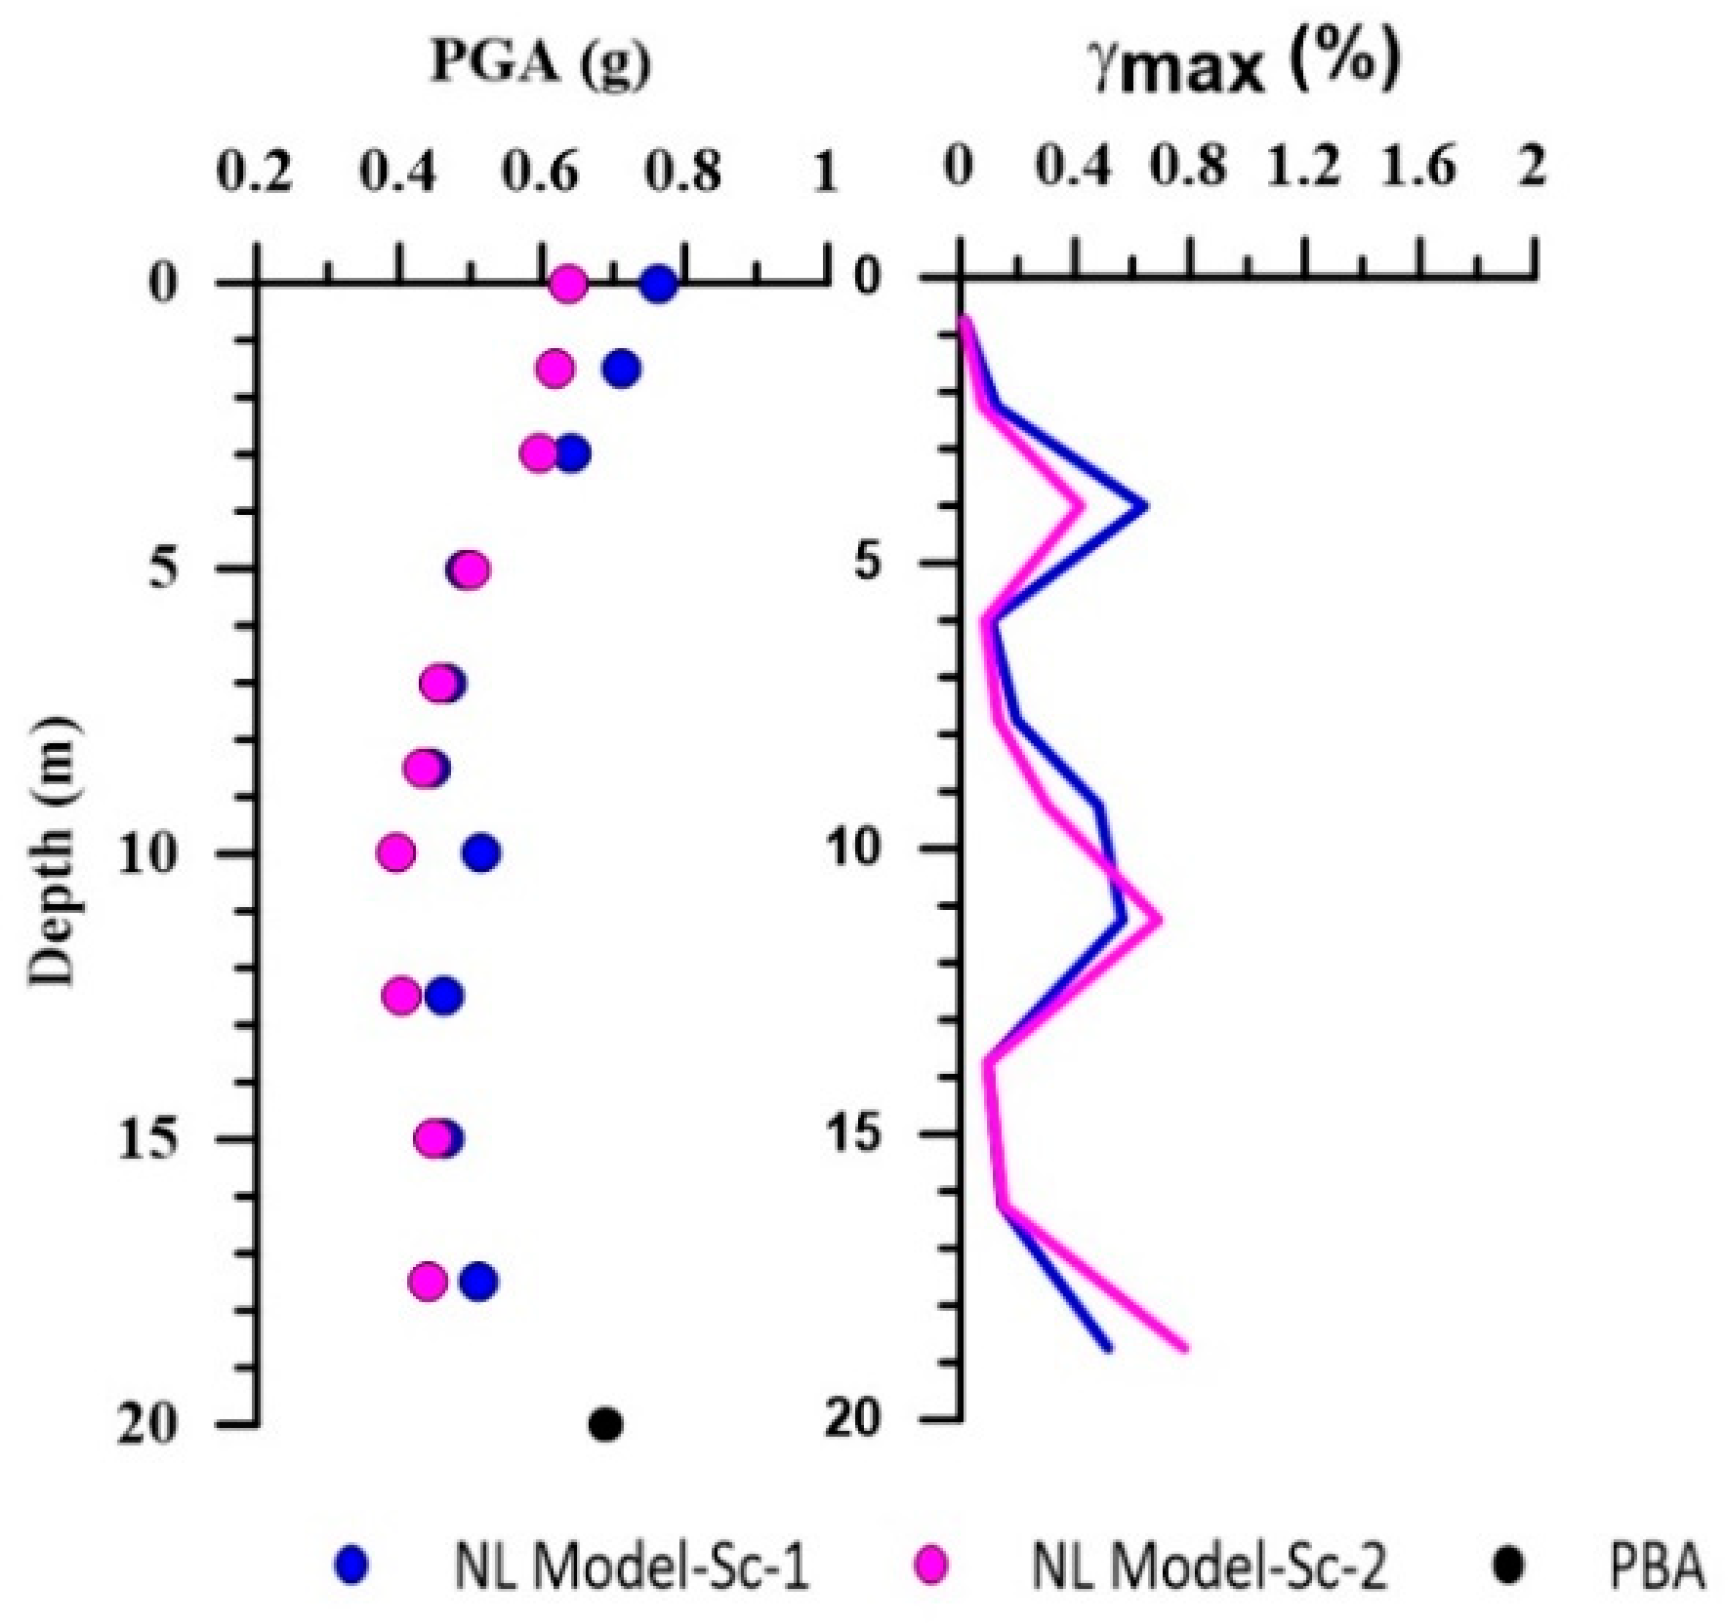
When the Morgan Hill earthquake, used in the analysis of the BH-1 well, one of the drillings in the region, is examined, the peak ground acceleration (PGA) is 0.689 g, and its variation depending on the depth is shown in Figure 12. In both scaling methods, the acceleration is initially damped, and then an increase towards the surface occurs. Sc-1 scaling achieved greater acceleration at the surface than Sc-2.
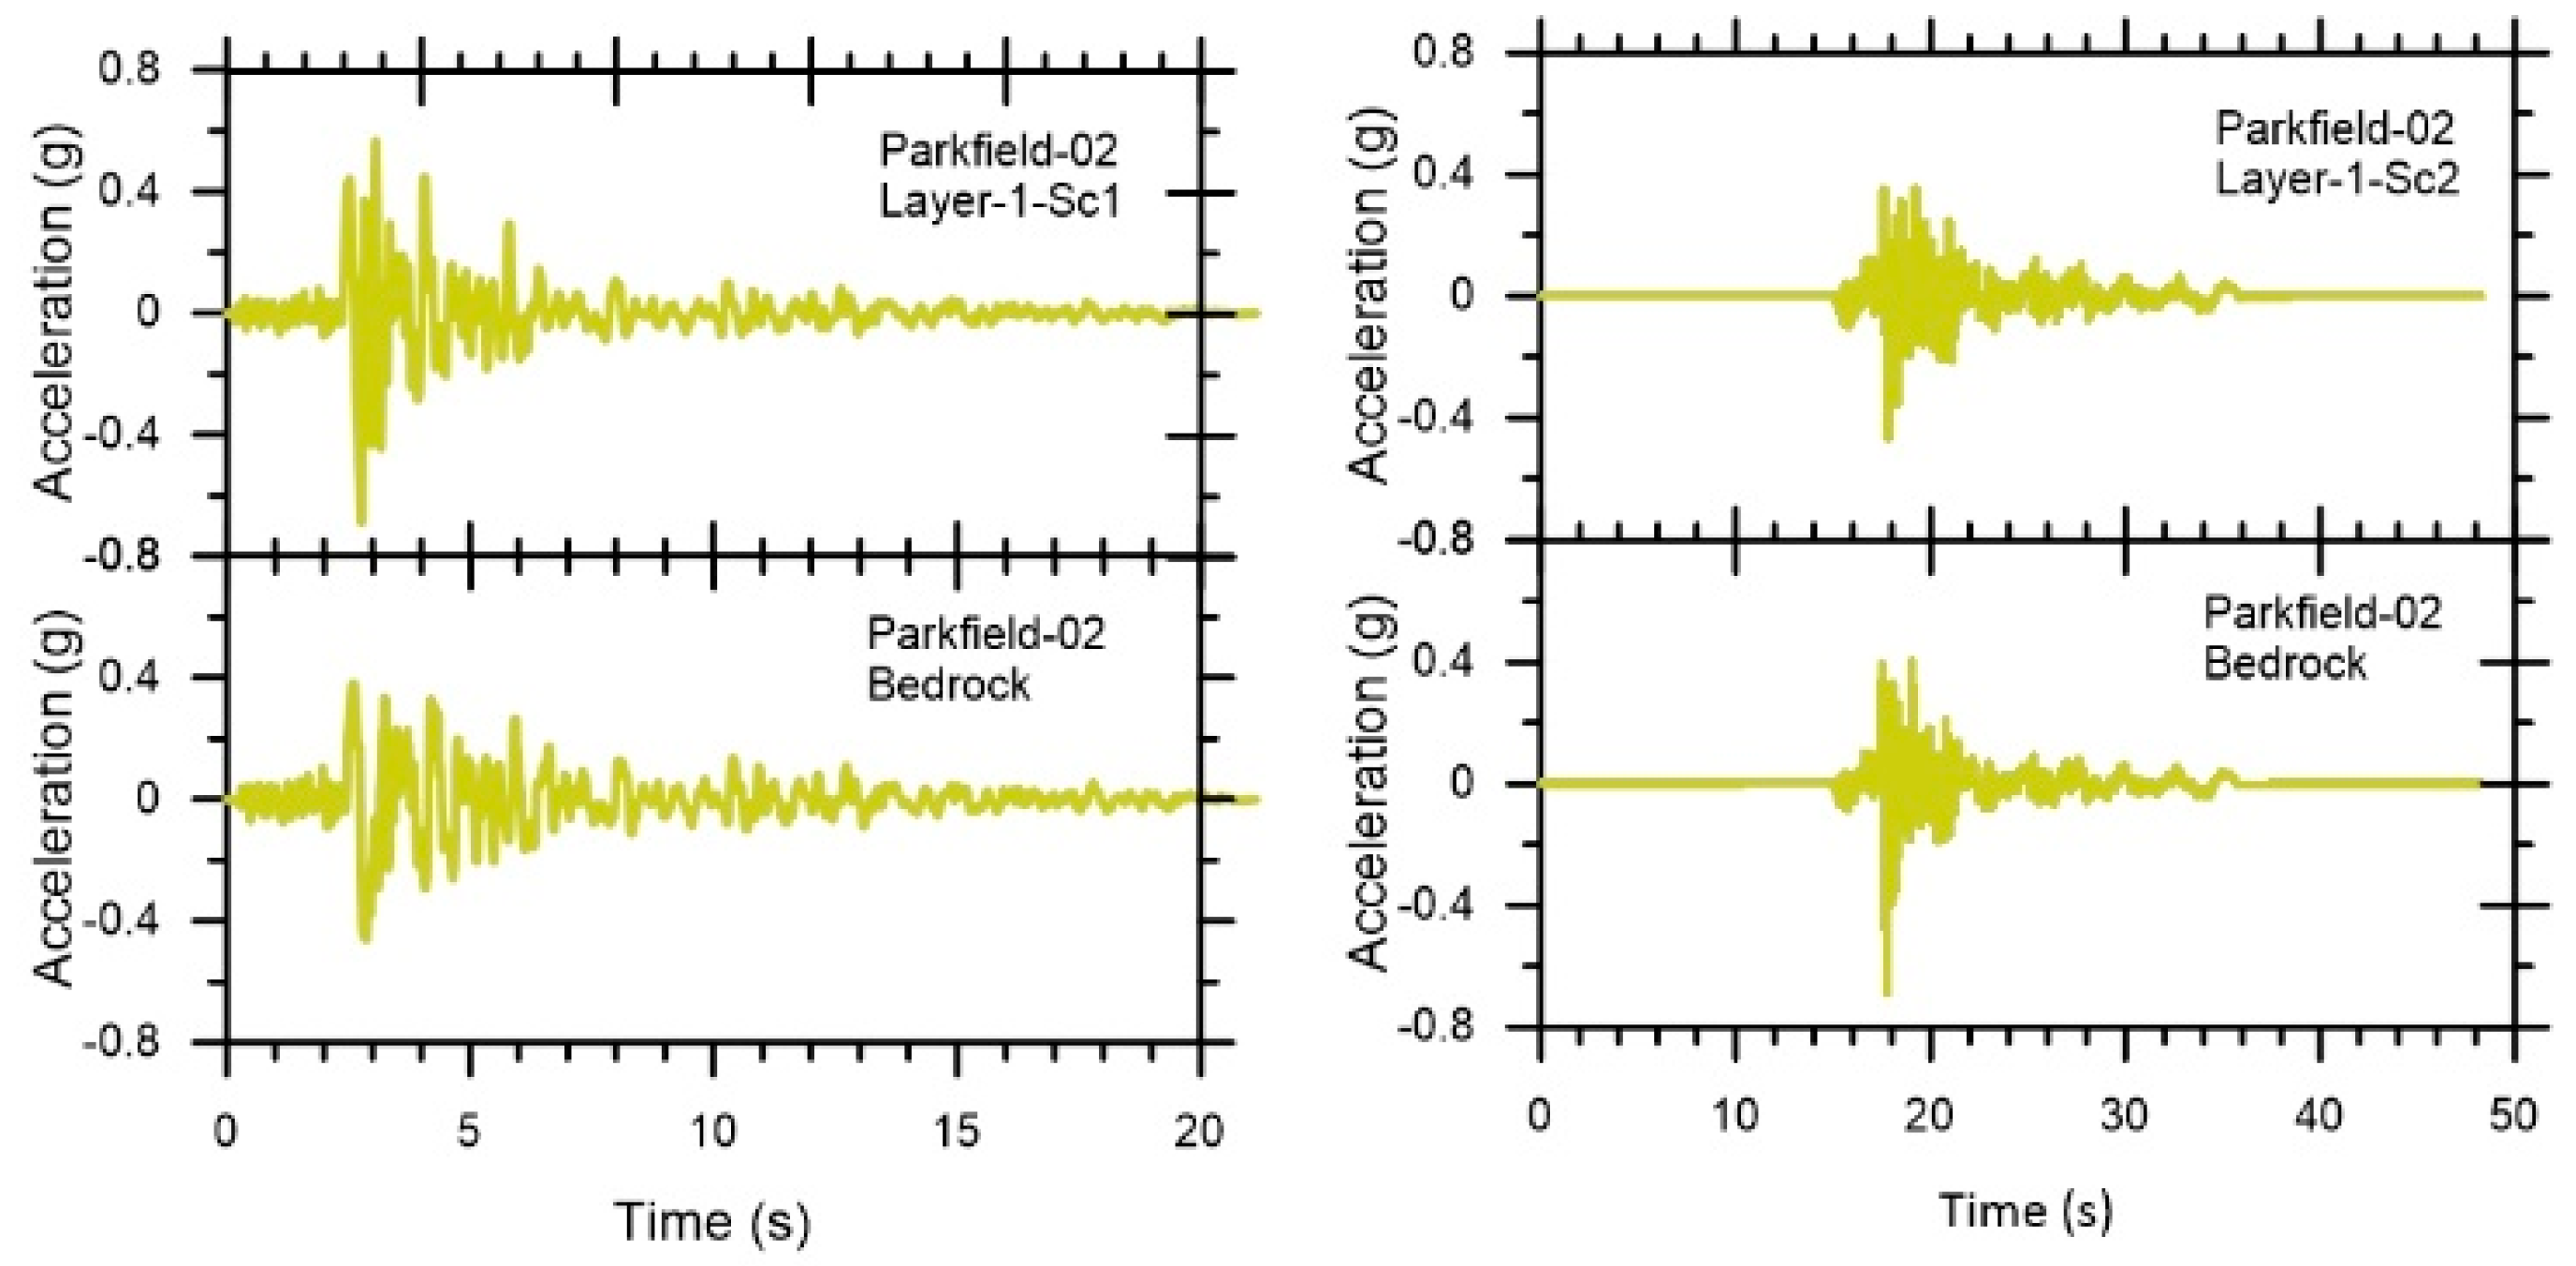
In the unit deformation change, it was determined that both scaling methods showed similar behavior, but Sc-2 at 11 m and Sc-1 at 3.5 m reached higher deformation levels. As a result of the soil amplification analysis, two different scaling methods in the BH-1 well were compared with the surface acceleration values (Figure 13). Here, we can see the change between the acceleration at the surface and the acceleration from the bedrock. There is a difference between the Parkfield 02 earthquake and the bedrock earthquakes due to scaling. In addition, the peak points of the change in the surface (Layer-1) of the earthquake passing through the layers from the bedrock to the surface show the soil amplification effect.
From these analyses, the spectral parameters of the surface soil were determined. Additionally, as a result of these analyses, Semi-Static Acceleration Response Spectrum (PGA) values, known as in situ design spectra, which represent 5% damping of the spectral velocity of motion between the bedrock and ground surface in the Fourier amplitude spectrum, were also obtained. The design response spectrum represents the maximum response of an area with a certain damping feature (5%) to different earthquake forces over various periods.
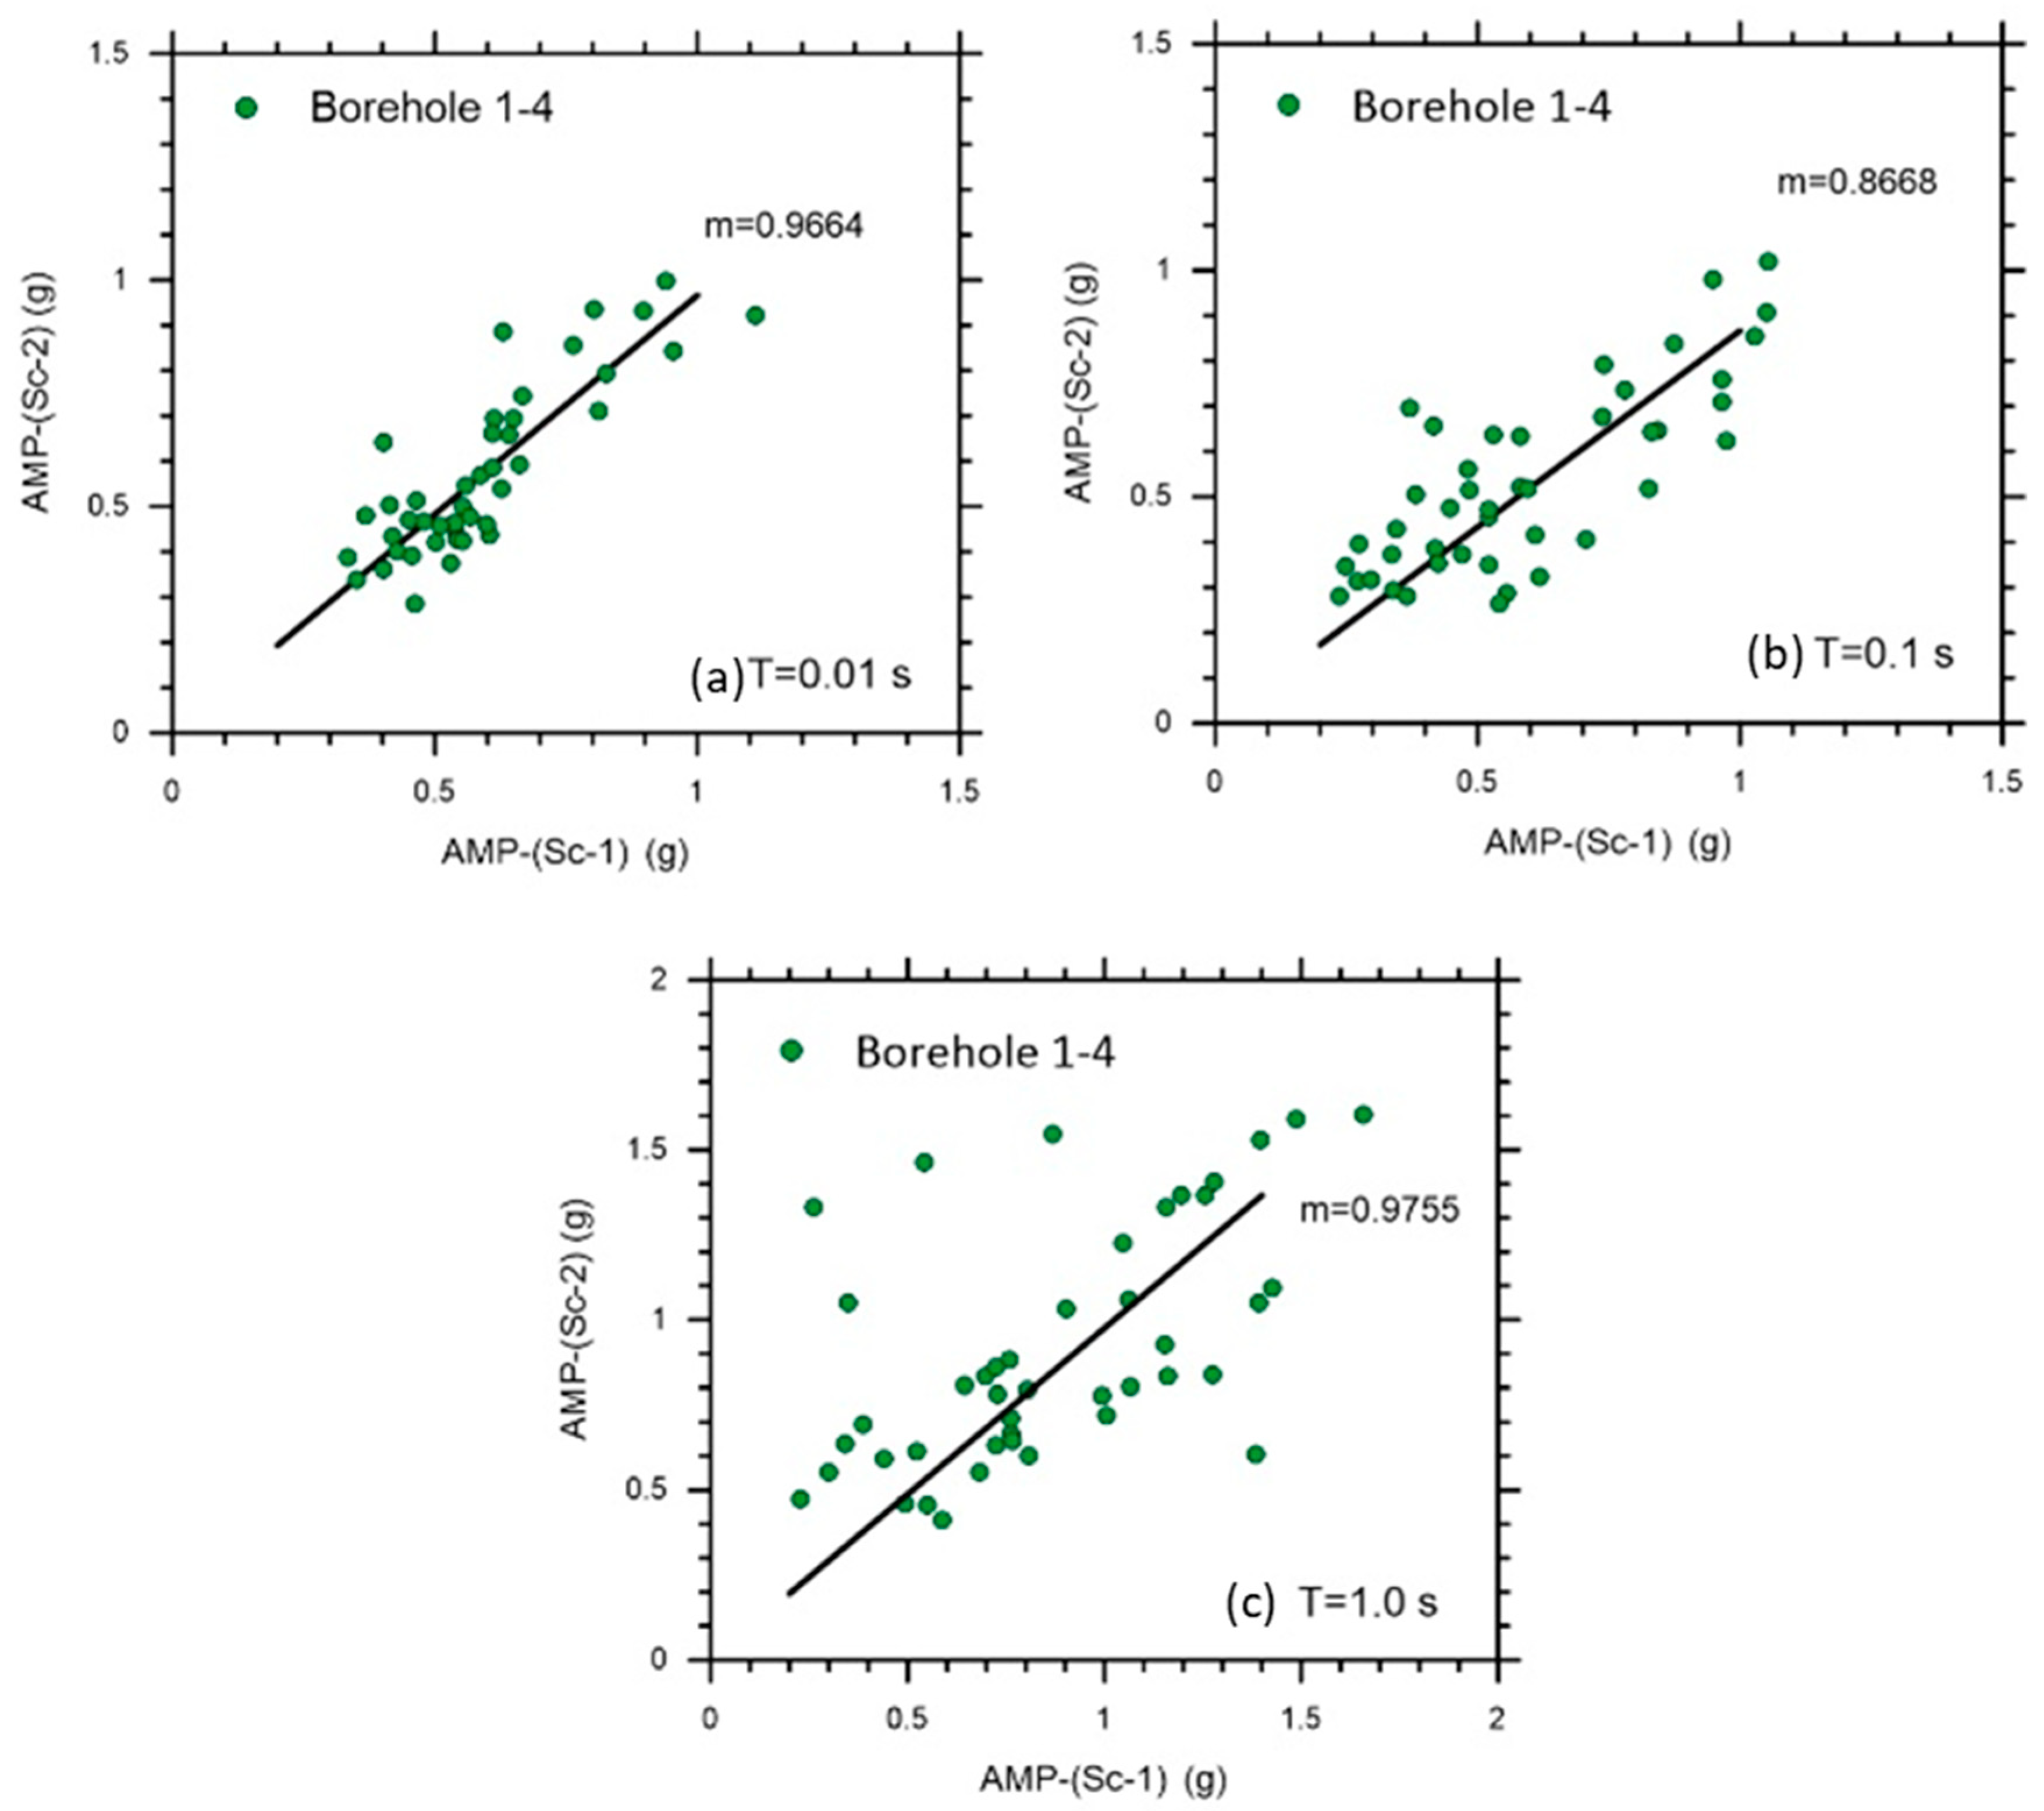
The design spectra are used to determine the earthquake load in new buildings. Comparison graphs of PGA values were created for the periods T = 0.01 s, T = 0.1 s, and T = 1.0 s. These three periods are preferred as a comparison to highlight their importance in building design and to provide insights into surface movement. When these values were compared to the PGA values in the bedrock, amplification (AMP) values were obtained. Comparisons were made in these three periods using both scaled records (Sc-1 and Sc-2) (Figure 14).
Amplification values obtained from two different scaling methods in three different periods were compared. Although highly similar values were observed at T = 0.01 and 1.0 s (m: 0.9664 and 0.9755), it was found that they showed less similar behavior at T = 0.1 s (m: 0.8668) (Figure 15). The periods in which soil amplification will occur depend on the thickness of the soft soil layer and the speed of the earthquake wave. The period of maximum amplification (T0) is defined as the dominant period of the ground [45]. The soil amplification ratio is obtained by the ratio of the response spectrum formed on the surface to the bedrock response spectrum.
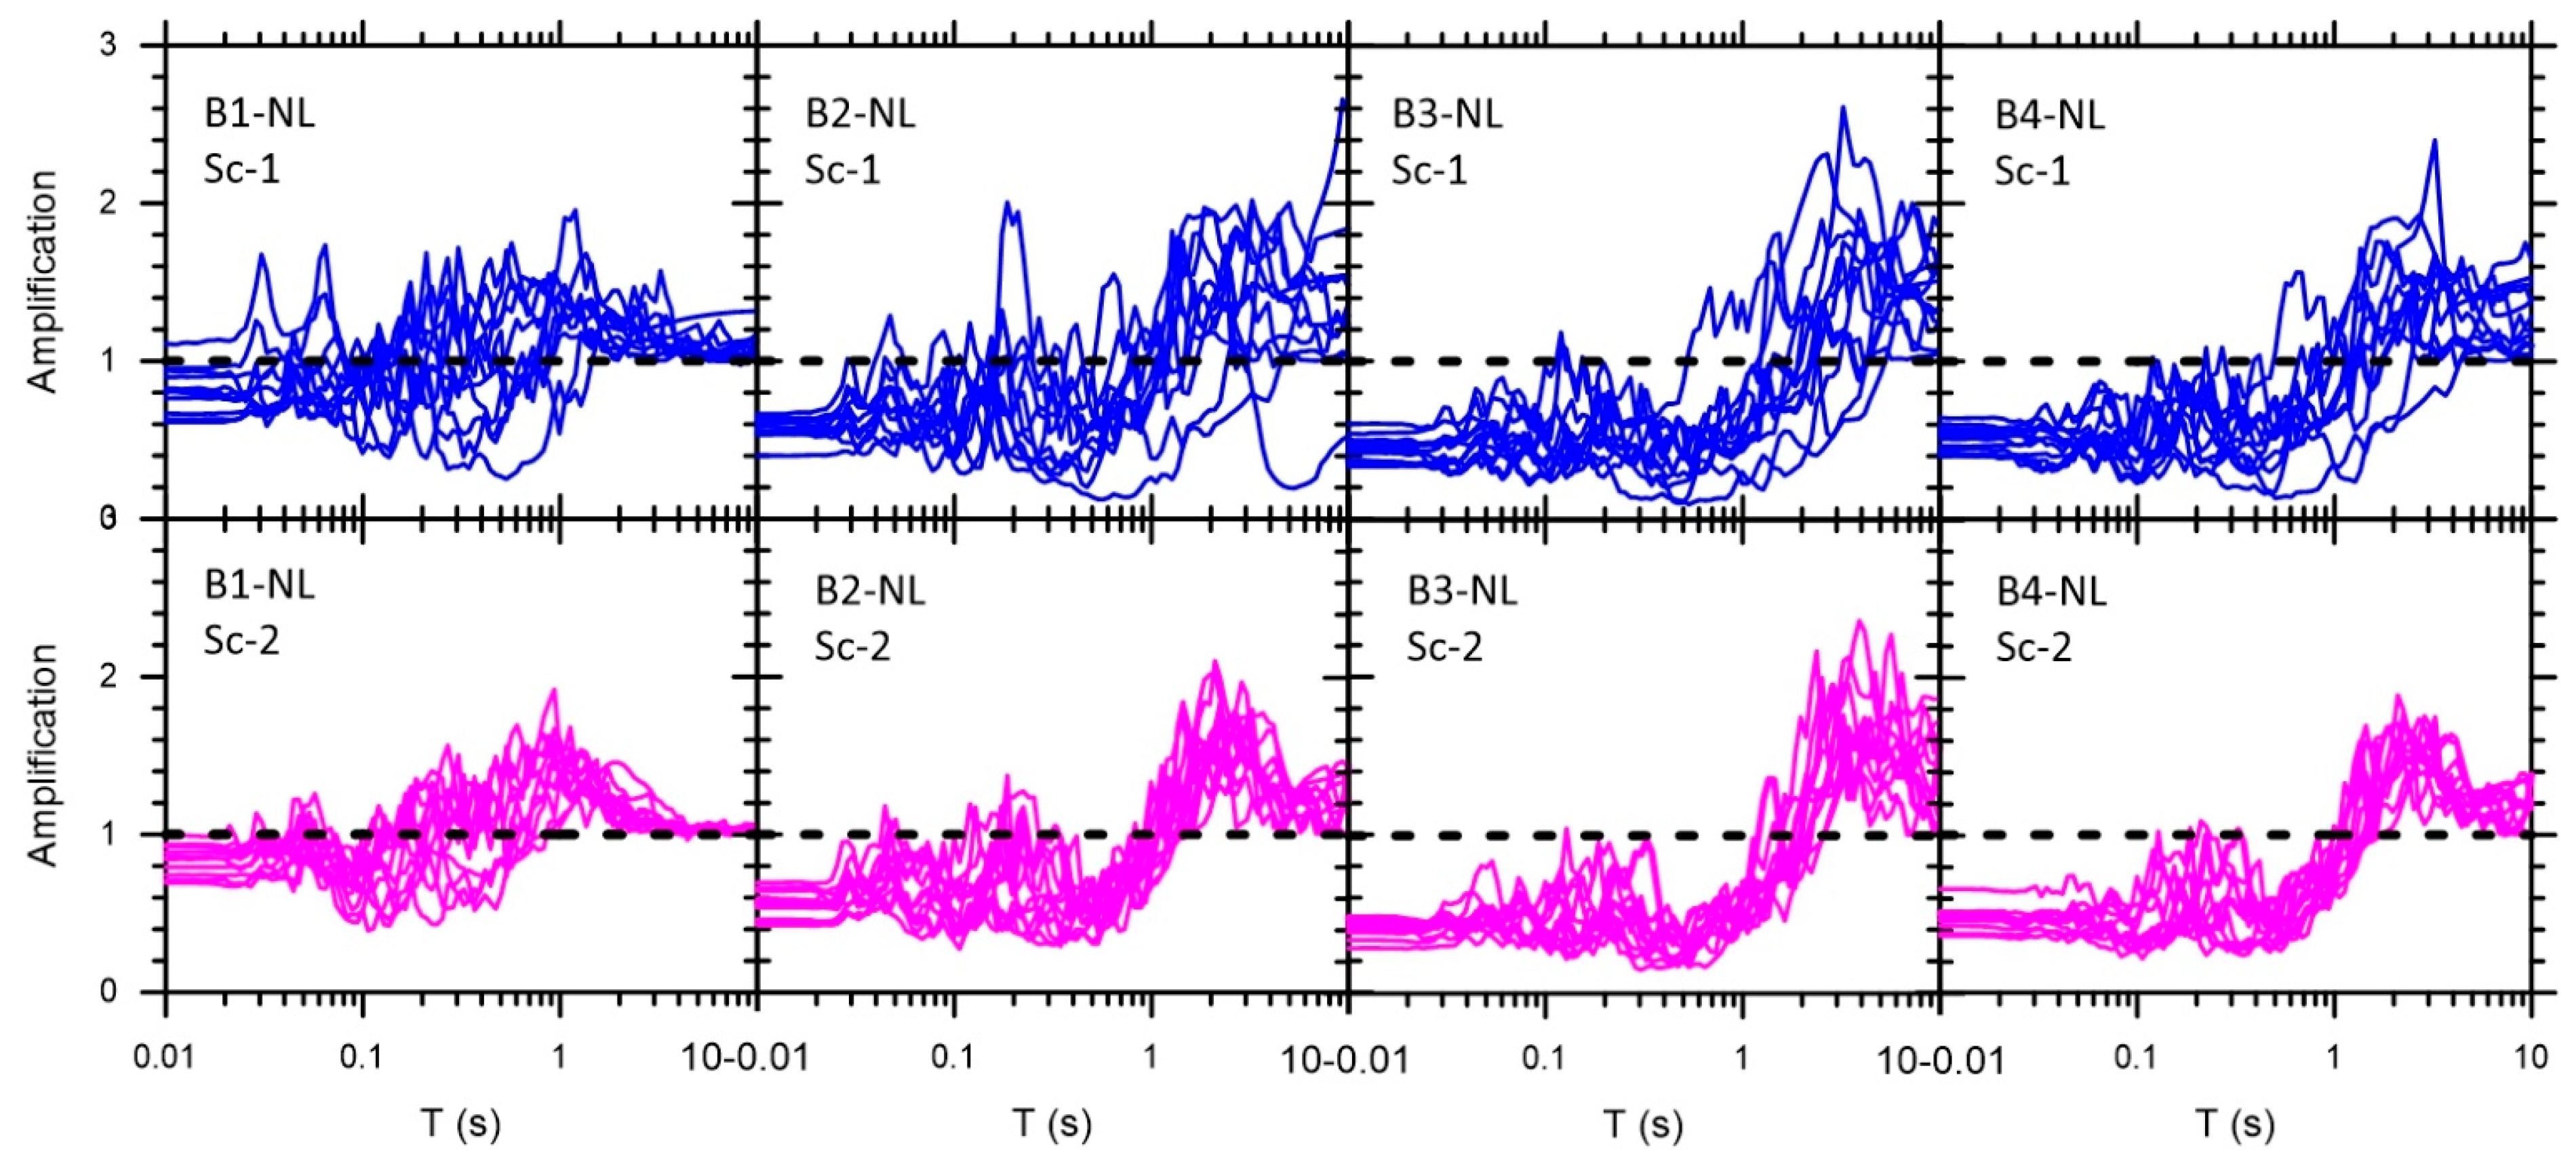
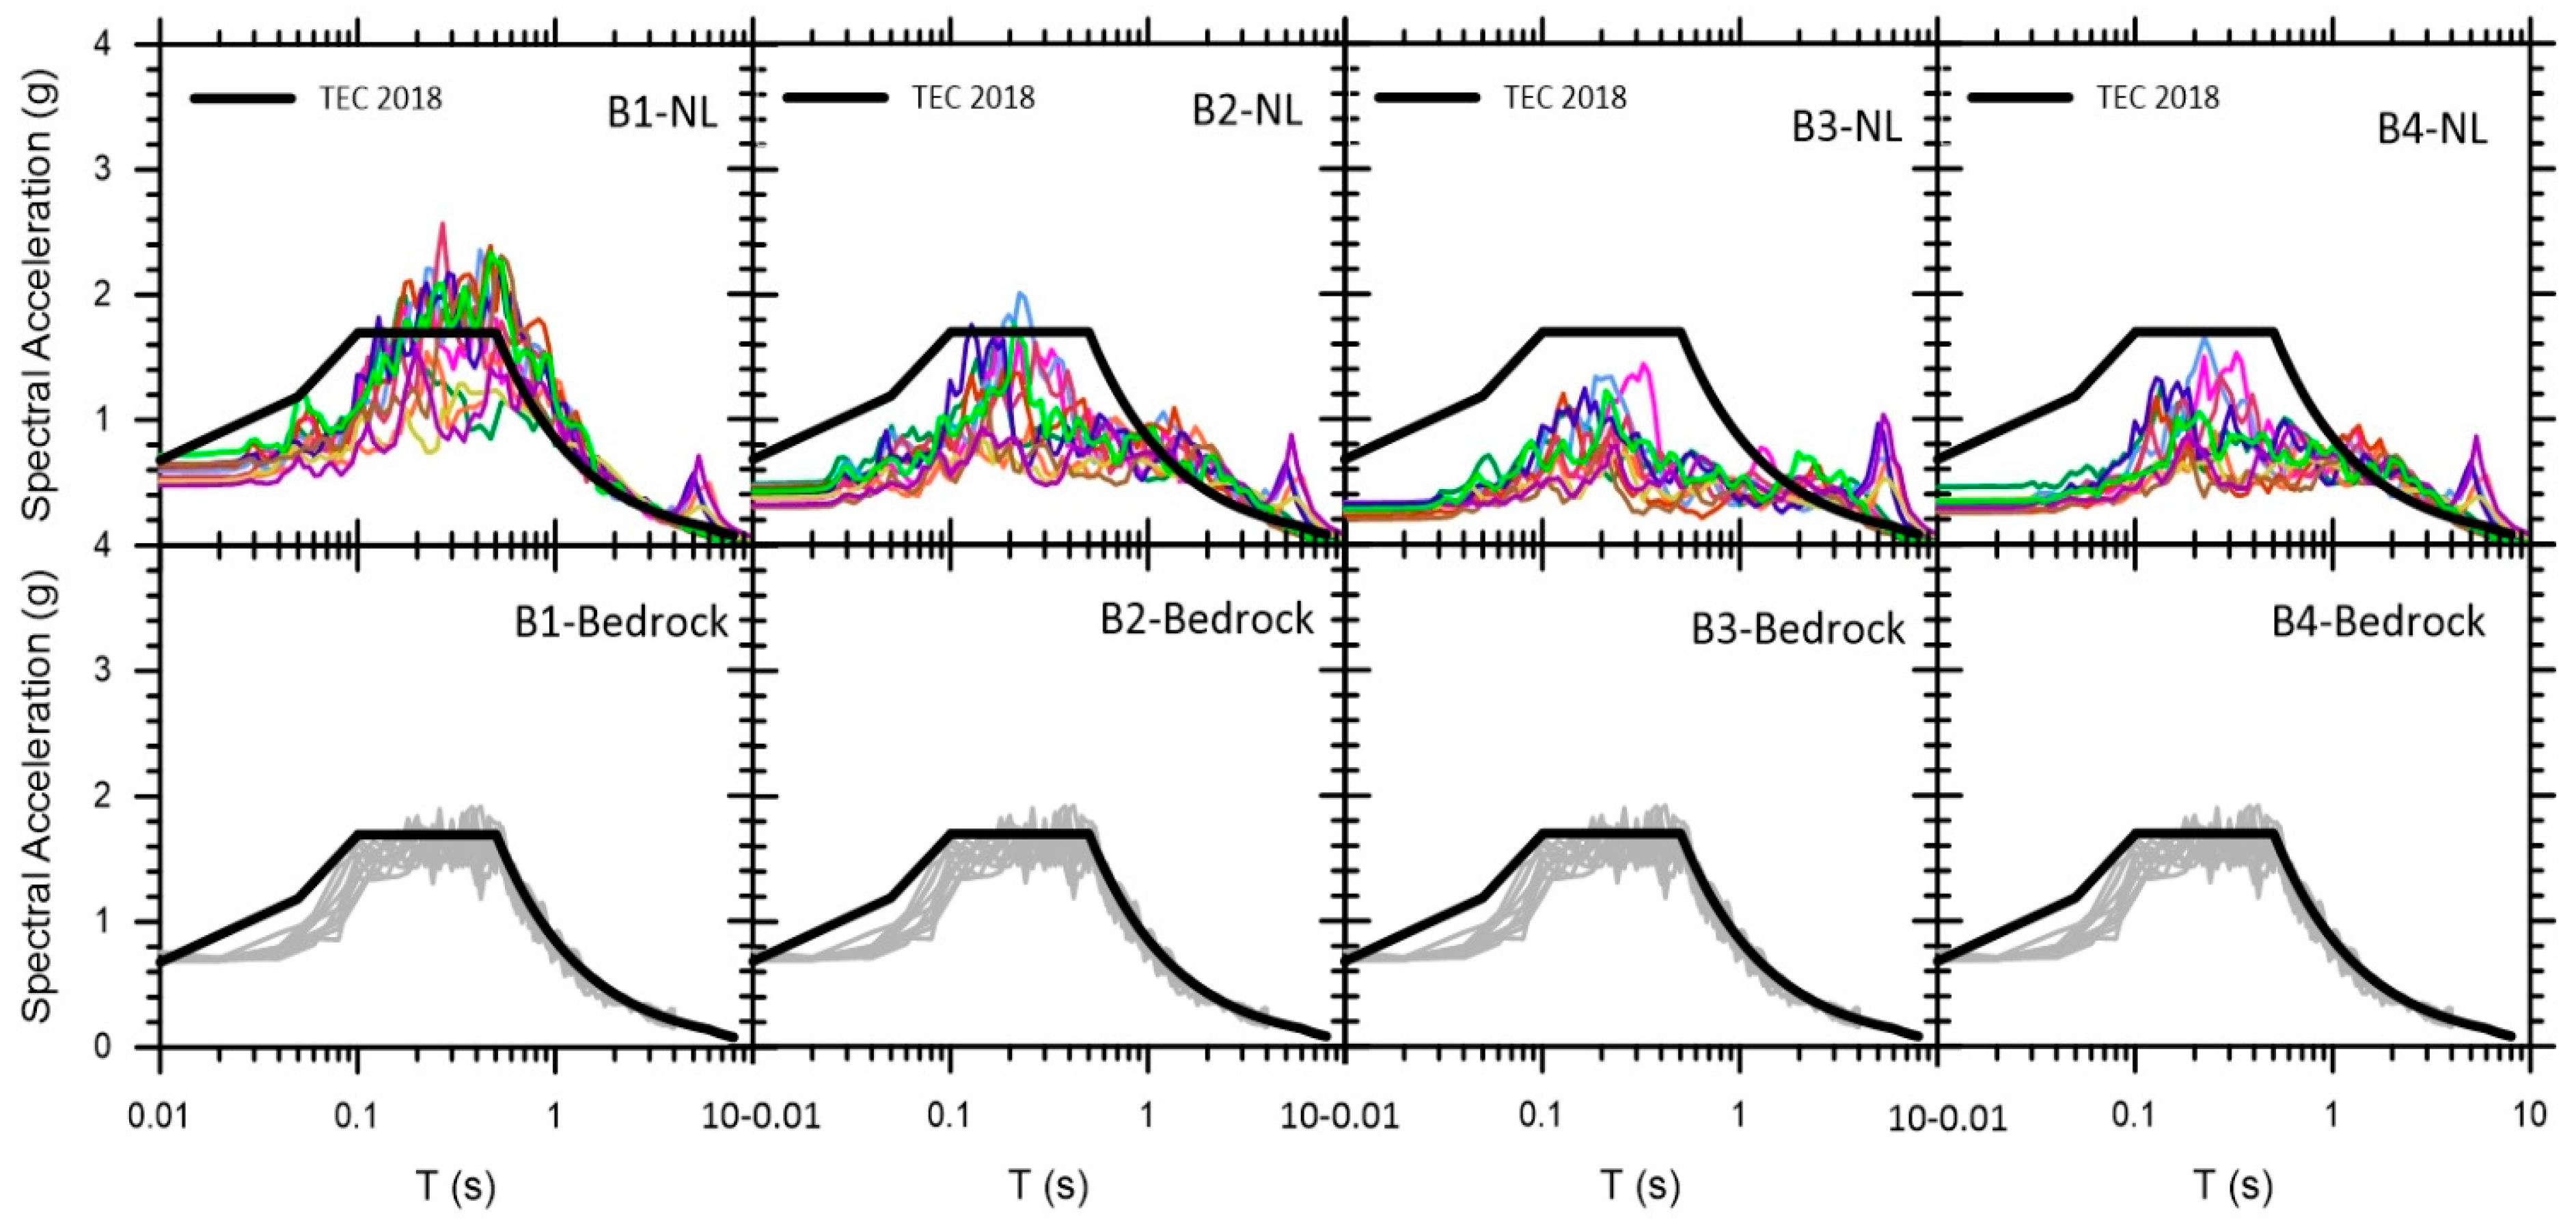
It was determined that the amplification ratios varied up to 2.7 in the nonlinear analysis results using 11 different scalings in each borehole. It was determined that the amplification effect was higher, especially after T = 1.0 s, i.e., at high periods. When all the used acceleration records were examined, it was determined that the accelerations created higher amplification values together in the Sc-2 method, but the analyses made in the Sc-1 method showed more dispersed values (Figure 14). As a result of the NL analyses, response spectrum parameters were calculated, and spectral acceleration (Sa)-Period (T) graphs were created. The values obtained according to 11 earthquake records, with the coloring specified in Figure 9, were used for each earthquake. When Figure 16 is examined, in the analyses made with the Sc-1 method, TEC 2018 captured the general trend in each borehole, but the spectral behavior of the plateau region in high periods was represented with lower values. In the analyses made with the other analysis method, it was determined that the upper plateau region of TEC 2018 in BH-1 showed lower values at high periods, while the other three boreholes did not fully reflect the period values of the region due to the high plateau region (Figure 17).

6. Conclusions

Site-specific analyses are required in the use of parameters to be used in the design of structures to be built in earthquake zones. For this reason, it is important to determine dynamic parameters with undisturbed samples to be collected in active earthquake zones. Analyses with these parameters better represent the region. In addition, the scaling of earthquake acceleration records to be used in the analysis is an important factor for soil amplification analysis.
For this purpose, soil dynamic parameters were determined by dynamic triaxial and resonant column tests using undisturbed samples within the borders of Sakarya province, which is located on the NAFZ in Turkey, one of the major earthquake zones of Europe. Then, 11 earthquake acceleration records reflecting the seismicity characteristics of the region were selected and scaled with two different scaling methods from the literature. As a result of the nonlinear analysis, soil amplification factors and spectral acceleration values were obtained.
There are numerous studies in the literature on site-specific analysis, most of which focus on regional investigations. Silahtar [29] conducted a one-dimensional soil amplification analysis and represented the region using GIS mapping. Unlike our study, soil dynamic parameters in Silahtar’s research were determined and introduced into the program through built-in functions rather than experimental methods. When comparing the results, both studies indicate that the regulation is insufficient in representing certain points.
Guzel et al. [46] performed a soil amplification analysis in Konya province and evaluated the results based on TEC 2018. Their study was conducted on a regional scale according to soil types, with soil dynamic parameters obtained through program-based models. The experimental approach in our study differs from theirs. However, when comparing the results, both studies reveal that TEC 2018 is not sufficiently representative at high-period values.
Makra et al. [47] conducted one- and two-dimensional analyses in Izmir province, incorporating both field observations and numerical modeling. Their study highlighted the weak points of the regulation and examined the basin effect. When comparing the experimental and analytical aspects of our study, a key difference is that their research did not include experimental soil dynamic parameter calculations, focusing solely on numerical analysis. Nevertheless, both studies conclude that the soil amplification effect in the regulation is not adequately represented.
Previous studies on soil amplification analysis have generally relied on shear modulus and damping curves obtained from reference curves suggested by software programs. However, in this study, these curves were derived through site-specific experimental research. Additionally, when evaluating the performance of TEC 2018 in light of recent studies, a common issue emerges: the regulation fails to sufficiently capture soil amplification effects, particularly at high periods.
The analysis results were first compared with the spectral envelope proposed by TEC 2018 for the region, and it was examined how well it represents the spectral acceleration values. Here, it can be said that the results obtained from the two different scaling methods are not fully representative.
In the Sc-1 method, it was determined that the spectrum envelope was low at high-period values of the peak region in each borehole analysis. In the Sc-2 method, it was determined that the peak was insufficient only in the B1 borehole and reached very high values in other borehole analyses. This discrepancy is due to the fact that the regulation recommends a spectrum envelope based on more general data. However, the general recommendation of such an important parameter in structural design significantly affects structural analysis and structural element sizing. For this reason, it is necessary to use the spectrum envelope graph obtained by performing site-specific analyses in the designs to be made in earthquake zones.
The methods by which the acceleration values used in the analysis are scaled are also important. In this study, analyses were performed using two different methods. The results show that the scaling method is an important factor in site-specific analysis. It is effective in obtaining the spectrum envelope graph or evaluating the existing one. The point to consider here is how the frequency change in the earthquake acceleration record is handled. Since there is no change in the frequency content of the earthquake acceleration record in the Sc-1 method, it can be said that it better represents earthquakes.
The performance of TEC 2018 should be examined in site-specific analyses, but the points that it does not represent should be determined, a better representative envelope graph should be proposed, and this graph should be used in structural analysis.
The study will continue to guide researchers by using mapping methods as a result of expanding the region and increasing the number of analyses.

Author Contributions

Fieldwork, analysis, review, and writing: E.G.; analysis and writing, review, and editing: K.B.A. All authors have read and agreed to the published version of the manuscript.

Funding

This work has been supported by Eskisehir Osmangazi University Scientific Research Projects Coordination Unit under grant number: 202015063. This work has been supported by Eskisehir Osmangazi University Scientific Research Projects Coordination Unit under grant number: 201915A211.

Institutional Review Board Statement

Not applicable.

Informed Consent Statement

Not applicable.

Data Availability Statement

Data are not publicly available due to privacy reasons.

Conflicts of Interest

The authors declare no conflicts of interest.

References

  1. Shah, S.H.; Lin, A.; Lin, S.; Patel, J.S.; Lam, M.; Zhu, K. Turkey’s Earthquakes: Damage Prediction and Feature Significance Using A Multivariate Analysis. arXiv 2024. [Google Scholar] [CrossRef]
  2. Dogan, K.; Yavuz, G.; Mehmet, K.; Kivanc, K. An overview of the current seismicity of the Sultandağı Fault Zone (Afyonkarahisar- Konya, Western Anatolia). Bull. Miner. Res. Explor. 2020, 163, 187–210. [Google Scholar] [CrossRef]
  3. Collins, O.; Molua, J.; Ataman, O. Dynamic Analysis of Soil-Structure Interaction in Earthquake-Prone Areas. Int. J. Appl. Struct. Mech. 2024, 1, 19–29. [Google Scholar] [CrossRef]
  4. Choi, Y.; Stewart, J.P. Nonlinear Site Amplification as Function of 30 m Shear Wave Velocity. Earthq. Spectra 2005, 21, 1–30. [Google Scholar] [CrossRef]
  5. Kempton, J.J.; Stewart, J.P. Prediction Equations for Significant Duration of Earthquake Ground Motions considering Site and Near-Source Effects. Earthq. Spectra 2006, 22, 985–1013. [Google Scholar] [CrossRef]
  6. Masi, A.; Santarsiero, G.; Chiauzzi, L.; Gallipoli, M.; Piscitelli, S.; Vignola, L.; Bellanova, J.; Calamita, G.; Perrone, A.; Lizza, C.; et al. Different damage observed in the villages of Pescara del Tronto and Vezzano after the M6.0 August 24, 2016 central Italy earthquake and site effects analysis. Ann. Geophys. 2017, 59, 1–12. [Google Scholar] [CrossRef]
  7. Buratti, N.; Stafford, P.J.; Bommer, J.J. Earthquake Accelerogram Selection and Scaling Procedures for Estimating the Distribution of Drift Response. J. Struct. Eng. 2010, 137, 345–357. [Google Scholar] [CrossRef]
  8. Bol, E. Adapazarı Zeminlerinin Dinamik Özellikleri. Ph.D. Thesis, Sakarya University, Serdivan, Türkiye, 2009. [Google Scholar]
  9. Sancio, R.B. Ground Failure and Building Performance in Adapazarı, Turkey. Ph.D. Thesis, University of California, Berkeley, CA, USA, 2003. [Google Scholar]
  10. Zhou, W.; Chen, Y.; Ma, G.; Yang, L.; Chang, X. A modified dynamic shear modulus model for rockfill materials under a wide range of shear strain amplitudes. Soil Dyn. Earthq. Eng. 2017, 92, 229–238. [Google Scholar] [CrossRef]
  11. Bayat, M.; Ghalandarzadeh, A. Stiffness degradation and damping ratio of sand-gravel mixtures under saturated state. Int. J. Civ. Eng. 2017, 16, 1261–1277. [Google Scholar] [CrossRef]
  12. ASTM. D4015-15; Standard Test Methods for Modulus and Damping of Soils by Resonant-Column Method. ASTM: West Conshohocken, PA, USA, 2021.
  13. ASTM D4767-11; Standard Test Method for Consolidated Undrained Triaxial Compression Test for Cohesive Soils. ASTM: West Conshohocken, PA, USA, 2020.
  14. Sexena, S.K.; Reddy, K.R. Dynamic moduli and damping ratios for monterey no.0 sand by resonant column tests. Soils Found. 1989, 29, 37–51. [Google Scholar] [CrossRef]
  15. Dutta, T.T.; Saride, S.; Jallu, M. Effect of saturation on dynamic properties of compacted clay in a resonant column test. Geomech. Geoengin. 2017, 12, 181–190. [Google Scholar]
  16. Li, H.; Senetakis, K. Effects of particle grading and stress state on strain-nonlinearity of shear modulus and damping ratio of sand evaluated by resonant-column testing. J. Earthq. Eng. 2020, 24, 1886–1912. [Google Scholar] [CrossRef]
  17. Morsy, A.M.; Salem, M.A.; Elmamlouk, H. Evaluation of dynamic properties of calcareous sands in Egypt at small and medium shear strain ranges. Soil Dyn. Earthq. Eng. 2019, 116, 692–708. [Google Scholar] [CrossRef]
  18. Güler, E.; Afacan, K.B. Düşük Deformasyon Seviyelerinde Kumların Dinamik Özelliklerinin Resonant Kolon Deneyi Yardımıyla Belirlenmesi. ECJSE 2020, 7, 572–580. [Google Scholar] [CrossRef]
  19. Kokusho, T. Cyclic triaxial test of dynamic soil properties for wide strain range. Soils Found. 1980, 20, 45–60. [Google Scholar]
  20. Kumar, S.; Krishna, A.M.; Dey, A. Evaluation of dynamic properties of sandy soil at high cyclic strains. Soil Dyn. Earthq. Eng. 2017, 99, 157–167. [Google Scholar] [CrossRef]
  21. Khan, Z.; El Naggar, M.H.; Cascante, G. Frequency dependent dynamic properties from resonant column and cyclic triaxial tests. J. Frankl. Inst. 2011, 348, 1363–1376. [Google Scholar] [CrossRef]
  22. El Mohtar, C.S.; Drnevich, V.P.; Santagata, M.; Bobet, A. Combined resonant column and cyclic triaxial tests for measuring undrained shear modulus reduction of sand with plastic fines. Geotech. Test. J. 2013, 36, 484–492. [Google Scholar] [CrossRef]
  23. Banerjee, S.; Balaji, P. Effect of anisotropy on cyclic properties of chennai marine clay. Int. J. Geosynth. Ground Eng. 2018, 4, 27. [Google Scholar] [CrossRef]
  24. Sobolev, E.; Ter-Martirosyan, A. Interaction of the base and construction under seismic action, with considering various characteristics of soil damping. MATEC Web Conf. 2018, 251, 04011. [Google Scholar] [CrossRef]
  25. Darendeli, M.B. Development of a New Family of Normalized Modulus Reduction and Material Damping Curves. Ph.D. Thesis, The University of Texas, Austin, TX, USA, 2001. [Google Scholar]
  26. Afacan, K.B. Evaluation of Nonlinear Site Response of Soft Clay Using Centrifuge Models. Ph.D Thesis, University of California, Los Angeles, CA, USA, 2014. [Google Scholar]
  27. Güler, E.; Afacan, K.B. Combined resonant column and cyclic triaxial tests to estimate the dynamic behavior of undisturbed saturated clayey soils of Adapazarı Turkey. Geomech. Eng. 2023, 33, 243–259. [Google Scholar] [CrossRef]
  28. Hashash, Y.M.A.; Musgrove, M.I.; Harmon, J.A.; Groholski, D.; Phillips, C.A.; Park, D. DEEPSOIL V6.1, User Manual; Board of Trustees of University of Illinois at Urbana-Champaign: Urbana, IL, USA, 2016. [Google Scholar]
  29. Silahtar, A. Evaluation of local soil conditions with 1D nonlinear site response analysis of Arifiye (Sakarya District), Turkey. Nat. Hazards 2023, 116, 727–751. [Google Scholar] [CrossRef]
  30. Ketin, İ. The North Anatolian Fault (Kuzey Anadolu Fayi Hakkinda). J. MTA. Bull. Miner. Res. Explor. 1969, 72, 1–27. [Google Scholar]
  31. Akat, U.; Akbaş, B.; Akdeniz, N.; Aksay, A.; Altun, İ.E.; Balcı, V.; Bilginer, E.; Bilgiç, T.; Duru, M.; Ercan, T.; et al. Prepared by the Geological Research Department of the General Directoate of Mineral Research and Exploration, Produced by ISLEM Geographic Information Systems Company in ARC/INFO 8.1 Environments, 2002 and Printed by General Command of Mapping. Topographic Information is Taken by Modifying from the 1:500.000 and 1:250.000 Scale Topographic Maps (Projection System is Lambert Conformal Conic) of General Command of Mapping (Ankara). 2002. Available online: https://www.mta.gov.tr/v3.0/hizmetler/jeoloji-haritalari (accessed on 4 January 2025).
  32. Emre, Ö.; Duman, T.Y.; Özalp, S.; Elmacı, H.; Olgun, Ş.; Şaroğlu, F. Açıklamalı Türkiye Diri Fay Haritası. Scale 1:1.250.000; Maden Tetkik ve Arama Genel Müdürlüğü: Ankara, Turkey, 2013; ISBN 978-605-5310-56-1. [Google Scholar]
  33. Afad, T.C. Ministry of Interior Disaster and Emergency Management Presidency. 2024. Available online: www.afad.gov.tr (accessed on 4 January 2025).
  34. Ansal, A.; Tönük, G.; Kurtuluş, A. Zemin büyütme analizleri ve sahaya özel tasarim depremi özelliklerinin belirlenmesi. In Proceedings of the 1. Türkiye Deprem Mühendisliği ve Sismoloji Konferansı, Ankara, Turkey, 11–14 October 2011; pp. 1–8. (In Turkish). [Google Scholar]
  35. Kalapodis, N.A.; Muho, E.V.; Beskos, D.E. Structure-specific, multi-modal and multi-level scalar intensity measures for steel plane frames. Soil Dyn. Earthq. Eng. 2025, 190, 109185. [Google Scholar]
  36. Muho, E.V.; Kalapodis, N.A.; Beskos, D.E. Multi-modal and multi-level structure-specific spectral intensity measures for seismic evaluation of reinforced concrete frames. Bull. Earthq. Eng. 2024, 22, 6955–6989. [Google Scholar]
  37. Liu, L.; Dobry, R. Seismic response of shallow foundation on liquefiable sand. J. Geotech. Eng. 2017, 123, 557–566. [Google Scholar] [CrossRef]
  38. Toksoz, M.N.; Reilinger, R.E.; Doll, G.; Barka, A.A. Izmit (Turkey) Earthquake of 17 August 1999: First Report. Seism. Res. Lett. 1999, 70, 669–679. [Google Scholar]
  39. PEER, Pacific Earthquake Engineering Research Center, Ground Motion Database. 2024. Available online: https://ngawest2.berkeley.edu/ (accessed on 4 January 2025).
  40. Özdemir, Z.; Fahjan, Y.M. Comparison of Time and Frequency Domain Scaling of Real Accelerograms to Match Earthquake Design Spectra. Sixth Natl. Conf. Earthq. Eng. 2007, 435, 446. [Google Scholar]
  41. Fahjan, Y.M. Selection and scaling of real earthquake accelerograms to fit the Turkish design spectra. Tek Dergi/Tech. J. Turk. Chamb. Civ. Eng. 2008, 19, 1231–1250. [Google Scholar]
  42. Alielahi, H.; Adampira, M. Seismic effects of two-dimensional subsurface cavity on the ground motion by BEM: Amplification patterns and engineering applications. Int. J. Civ. Eng. 2016, 14, 233–251. [Google Scholar] [CrossRef]
  43. Arslan, G.; Borekci, M.; Sahin, B.; Denizer, M.I.; Duman, K.S. Performance Evaluation of In-Plan Irregular RC Frame Buildings Based on Turkish Seismic Code. Int. J. Civ. Eng. 2018, 16, 323–333. [Google Scholar] [CrossRef]
  44. Ebrahimi Motlagh, H.R.; Rahai, A. Dynamic Response of a Continuous-Deck Bridge with Different Skew Degrees to Near-Field Ground Motions. Int. J. Civ. Eng. 2017, 15, 715–725. [Google Scholar] [CrossRef]
  45. Kramer, S.L. Geotechnical Earthquake Engineering; Prentice-Hall, Inc. Simon & Schuster/A Viacom Company: Upper Saddle River, NJ, USA, 1996. [Google Scholar]
  46. Güzel, Y.; Güzel, F. Investigation of local site efect considering the recordings of the 08.11.2021 earthquake event in Konya, Turkey. Nat. Hazards 2023, 116, 619–636. [Google Scholar]
  47. Makra, K.; Rovithis, E.; Riga, E.; Raptakis, D.; Pitilakis, K. Amplifcation features and observed damages in İzmir (Turkey) due to 2020 Samos (Aegean Sea) earthquake: Identifying basin efects and design requirements. Bull. Earthq. Eng. 2021, 19, 4773–4804. [Google Scholar]
Figure 3. (a) Drilling (b) Vs. measurement (c) TRX tests (d) RC tests.
Applsci 15 03566 g003
Figure 4. Vs measurement at the BH-1 drilling point.
Applsci 15 03566 g004
Figure 5. Shear modulus curves of the BH-1 drilling point at different depths.
Applsci 15 03566 g005
Figure 6. Turkey Earthquake Hazard Map [33].
Applsci 15 03566 g006
Figure 7. Shear modulus and damping curves of point BH 1.
Applsci 15 03566 g007
Figure 8. DeepSoil program interface.
Applsci 15 03566 g008
Figure 9. The acceleration-time graphs used in the analysis.
Applsci 15 03566 g009
Figure 10. Spectral acceleration-period graphs of earthquakes.
Applsci 15 03566 g010
Figure 11. The difference in acceleration of two different scaling methods.
Applsci 15 03566 g011
Figure 12. Variation of peak bedrock acceleration and shear strains along the profile of the BH-1 e Morgan Hill earthquake.
Applsci 15 03566 g012
Figure 13. Comparison of surface accelerations with two different scalings at point BH-1.
Applsci 15 03566 g013
Figure 14. The spectral amplification values calculated for two scaled accelerations.
Applsci 15 03566 g014
Figure 15. AMP of two different earthquakes at T = 0.01 (a), 0.1 (b), and 1.0 s (c). comparison of values.
Applsci 15 03566 g015
Figure 16. Comparison of NL analysis in Sc-1 method with TEC 2018 code.
Applsci 15 03566 g016
Figure 17. Comparison of NL analysis with TEC 2018 code in Sc-2 method.
Applsci 15 03566 g017
Table 1. Analyzed boreholes.
BH NoUndisturbed Sample NoLayer NoLayer Thickness (m)wn (%)Cu (kPa)PI
(%)
Soil Type
BH-1UD-1Layer-11.5041.485017ML
Layer-21.50
Layer-32.00
UD-2Layer-42.0043.566019MH
Layer-51.50
Layer-61.50
UD-3Layer-72.5044.536534CH
Layer-82.50
UD-4Layer-92.5046.009037CH
Layer-102.50
BH-2UD-1Layer-11.5043.95409CL
Layer-21.50
Layer-32.00
UD-2Layer-42.0050.954012CL
Layer-51.50
Layer-61.50
UD-3Layer-73.0050.354516MH
Layer-82.00
UD-4Layer-92.0053.467024CH
Layer-103.00
UD-5Layer-112.0058.137027CH
Layer-123.00
BH-3UD-1Layer-11.5048.404010ML
Layer-21.50
Layer-32.00
UD-2Layer-42.0045.924016CL
Layer-51.50
Layer-61.50
UD-3Layer-73.0046.684019MH
Layer-82.00
UD-4Layer-9
Layer-10
2.0050.524021MH
3.00
UD-5Layer-112.0049.896028CH
Layer-123.00
BH-4UD-1Layer-11.5042.24307ML
Layer-21.50
Layer-32.00
UD-2Layer-42.0045.884010ML
Layer-51.50
Layer-61.50
UD-3Layer-73.0045.304014CL
Layer-82.00
UD-4Layer-92.0048.585016ML
Layer-103.00
Table 2. Determine local soil classes according to TEC 2018.
Soil TypeDefinition
ZASound, hard rocks Vs(30) > 1500
ZBSlightly weathered, medium sound rocks 760< Vs(30) < 1500
ZCVery dense sand, gravel, and hard clay layers or dissociated, very cracked
weak rocks
360 < Vs(30) < 760
ZDMedium dense—dense sand, gravel, or very solid clay layers
180 < Vs(30) < 360
ZELoose sand, gravel, or soft—solid clay layers or profles with a soft clay
layer (cu < 25 kPa) thicker than 3 m, providing PI > 20 and w > 40%
conditions Vs(30) < 180
ZFSoils that require site-specific research and evaluation.
Table 3. Selected earthquakes and properties [39].
NoEarthquakeYearStationMagnitud
(M)
Fault TypePGARjb (km)Rrup (km)Vs30 (m/sec)
1“Imperial Valley-02”1940“El Centro Array #9”6.95Strike Slip0.2806.096.09213.44
2“Parkfield”1966“Cholame—Shandon Array #5”6.19Strike Slip0.4439.589.58289.56
3“Managua_ Nicaragua-01”1972“Managua_ Esso”6.24Strike Slip0.3713.514.06288.77
4“Imperial Valley-06”1979“El Centro Array #4”6.53Strike Slip0.4844.97.05208.91
5“Morgan Hill”1984“Gilroy Array #4”6.19Strike Slip0.22411.5311.54221.78
6“Kobe_ Japan”1995“Amagasaki”6.9Strike Slip0.27511.3411.34256.00
7“Kocaeli_ Turkey”1999“Yarimca”7.51Strike Slip0.2261.384.83297.00
8“Duzce_ Turkey”1999“Duzce”7.14Strike Slip0.40406.58281.86
9“Parkfield-02_ CA”2004“Parkfield—Cholame 4aw”6.0Strike Slip0.3024.815.53283.38
10“El Mayor-Cucapah_ Mexico”2010“Cerro Prieto Geothermal”7.2Strike Slip0.2868.8810.92242.05
11“Darfield_ New Zealand”2010“Linc”7.0Strike Slip0.4615.077.11263.2
Disclaimer/Publisher’s Note: The statements, opinions and data contained in all publications are solely those of the individual author(s) and contributor(s) and not of MDPI and/or the editor(s). MDPI and/or the editor(s) disclaim responsibility for any injury to people or property resulting from any ideas, methods, instructions or products referred to in the content.