Article

The Interaction of Fitness and Fatigue on Physical and Tactical Performance in Football

1
Performance and Analytics Department, Parma Calcio 1913, 43121 Parma, Italy
2
Department of Movement, Human and Health Sciences, University of Rome “Foro Italico”, 00135 Rome, Italy
3
Gabbett Performance Solutions, Brisbane 4011, Australia
4
Centre for Human Performance, Carnegie School of Sport, Leeds Beckett University, Leeds LS6 3QQ, UK
5
Sport Expertise and Performance Laboratory, French National Institute of Sports (INSEP), 75012 Paris, France
*
Author to whom correspondence should be addressed.
Appl. Sci. 2025, 15(7), 3574; https://doi.org/10.3390/app15073574
Submission received: 15 February 2025 / Revised: 21 March 2025 / Accepted: 23 March 2025 / Published: 25 March 2025
(This article belongs to the Special Issue Load Monitoring in Team Sports)

Abstract

:

Featured Application

The article describes the process to build a performance score and investigates the association with physical and tactical parameters.

Abstract

Elite football players face increasing physical and tactical demands due to rising match schedules emphasizing the need for effective load monitoring strategies to optimize performance and reduce injury risk. This study integrates fitness and fatigue indices derived from a machine learning approach to develop a performance score based on Banister’s fitness–fatigue model. Data were collected over two seasons (2022/23 and 2023/24) from 23 elite players of an Italian professional team. Fitness was assessed via heart rate collected during small-sided games, while fatigue was evaluated through PlayerLoad recorded during training sessions; both were normalized using z-scores. Match outcomes, including physical (e.g., total distance, high-sprint distance) and tactical metrics (e.g., field tilt, territorial domination), were analyzed in relation to performance conditions (optimal, intermediate, poor). Results revealed that players in the optimal performance condition exhibited significantly higher second-half physical outputs, including total distance (z-TD2ndHalf: p < 0.05, ES = 0.29) and distance covered at >14.4 km/h (z-D14.42ndHalf: p < 0.01, ES = 0.52), alongside improved match tactical parameters as territorial domination (%TDO2ndHalf: p < 0.01, r = 0.431). This study underscores the utility of invisible monitoring in football, providing actionable insights for weekly training periodization. This research establishes a foundation for integrating data-driven strategies to enhance physical and tactical performance in professional football.

1. Introduction

In recent years, elite football players have experienced a notable increase in the number of annual matches, resulting in congested weekly fixtures and heightened game demands. These demands include intensified pressing and counterattacking phases, frequent short accelerations and decelerations, and high-speed running actions interspersed throughout matches [1]. Consequently, the need for continuous “appropriate prescription, monitoring, and adjustment of external and internal loads” has become essential [2]. This ensures the ability to modify training loads for subsequent sessions, plan recovery phases, and protect players from injuries and illnesses [3]. Monitoring players’ daily fluctuations in load and associated responses has emerged as one of the most effective strategies in this context [4].
Based on Banister’s proposed model [5], a multidimensional monitoring system that calculates short- and long-term rolling averages can help identify both fitness and fatigue [6]. However, regular testing faces practical challenges, including its invasiveness, time constraints, and players’ reluctance to undergo frequent assessments [7]. As a solution, “invisible monitoring”—a collection of techniques and data analysis methods designed to measure one or multiple training effects using a single or combination of tools with minimal burden on athletes and staff—offers a less invasive and more efficient approach to optimizing performance, minimizing injury risk, and enhancing players’ physical and psychological well-being [7,8,9].
To address these challenges, recent studies have introduced invisible monitoring approaches to evaluate players’ fitness [10] and fatigue [11] on a weekly basis. The first study developed an in situ fitness index using machine learning, calculated as the difference between the observed HRdrill (heart rate during specific drills) and the predicted HRdrill, derived from game situations and possession-based drills [10]. According to the authors, a good fitness status was indicated by observed HRdrill values lower than predicted (Fitness Index < 0), while a poor fitness status was associated with higher observed values (higher heart rate responses than the expected values). This study demonstrated that machine learning techniques provided better predictive accuracy compared to traditional linear metrics. Moreover, the use of heart rate as a daily monitoring metric offered a less invasive alternative to additional testing [10].
The second study also employed machine learning to create a locomotor efficiency index, predicting Player Load (PL) to assess players’ neuromuscular status throughout the season [11]. Also in this work, a positive locomotor efficiency index, where the observed PL was lower than predicted, indicated neuromuscular readiness and ability to minimize the body load, while a negative index suggested fatigue. Additionally, the findings of this study showed clear fluctuations in the locomotor efficiency index according to the period of the season, the day within the weekly microcycle, and variations in training load [11].
Given the promising findings of these studies, combining the fitness and fatigue indices to develop a new performance score could offer significant insights. According to Banister’s model, performance results from the difference between fitness and fatigue. A weekly performance score derived from these indices could help investigate if its fluctuations correlate with changes in match performance. However, defining match performance is complex, as it encompasses not only physical elements (e.g., total distance, sprints, accelerations, decelerations) but also technical/tactical parameters.
Regarding players’ tactical behavior efficiency, decision-making ability is critical for managing fatigue during high-intensity periods or the latter stages of a match [12]. Indeed, muscular and/or central fatigue can alter how players perform physically and tactically [13]. Despite its importance, the football literature still lacks studies addressing individual and collective tactical performance under fatigue, and the few available studies present inconsistent results. For example, one study examining how mental fatigue and supplementary field markings influenced physical and tactical performance in small-sided games found unclear effects on both individual and team variables [14]. In contrast, Dambroz and Teoldo [15] assessed tactical behavior during a small-sided game following a 90 min fatigue-inducing protocol that simulated a full match. They found that players with poor decision-making skills exhibited reduced tactical efficiency under fatigue, whereas those with strong decision-making abilities maintained tactical performance. However, most existing research has focused on small-sided games, which differ metabolically from real matches, and has relied on youth samples over short observation periods. Thus, there is still a lack of research involving elite senior player samples, assessed during actual matches, and for a long period of observation to capture the daily fluctuations over the course of the football season.
To address these gaps, this paper aims to integrate the fitness [10] and fatigue [11] indices into a new performance score and investigate its relationship with physical and tactical performance metrics during official matches involving elite first-team players. The study details the development of the performance score, starting with the fitness and fatigue indices, and explores its association with various match metrics, including physical and technical/tactical parameters.

2. Materials and Methods

2.1. Participants

This study was conducted over the course of the 2022/23 and 2023/24 football seasons and involved a cohort of twenty-three elite male soccer players (age: 25.2 ± 3.3 years; body mass: 80.2 ± 6.5 kg; height: 184.5 ± 5.2 cm) from the first team of a professional Italian football club. The participants engaged in training sessions five times per week (training duration: 66.7 ± 15.2 min) and typically competed in one match per week, with an additional match during weeks involving the Coppa Italia competition. Data collection was conducted by the club, where players were monitored daily throughout the season. As the data were collected as part of the club’s routine monitoring process, formal ethical approval from an ethics committee was not required [16]. Nonetheless, all data were anonymized prior to analysis, and the study was conducted in strict accordance with the principles outlined in the Declaration of Helsinki, ensuring the confidentiality of both the team and the players. Participants were fully informed of their right to withdraw at any stage and were provided with comprehensive information regarding the study’s objectives and data handling procedures.

2.2. External and Internal Load Collection

The external load of the players was assessed using the WIMU Pro system (RealTrack Systems, Almería, Spain), which integrates multiple inertial sensors, including three 3D gyroscopes with an 8000°/s full-scale output range, a 3D magnetometer, a 10 Hz global positioning system (GPS), and a 20 Hz ultra-wideband system. The validity and reliability of this system have been previously established [17,18]. The GPS units were positioned between the scapulae of the players using a tightly fitting vest. The metrics extracted included total distance (TD [m]), distance covered at speeds greater than 14.4 km/h (D14.4 [m]), 19.8 km/h (D19.8 [m]), and 25.2 km/h (D25.2 [m]), mechanical work (MW [cnt]), defined as the sum of accelerations > 3.5 m/s2 and decelerations < −3.5 m/s2, and PlayerLoad™ (PL). Internal load data, represented by heart rate (HR), were collected at a sampling frequency of 4 Hz using a Garmin HR band (Garmin Ltd., Olathe, KS, USA), synchronized via the WIMU PRO telemetry system [18]. The physiological intensity of the training sessions was expressed as a percentage of individual maximum HR (HRmax), which was determined at the start of the season using an incremental treadmill protocol. The protocol commenced at 8 km/h, with the speed increasing by 2 km/h every 3 min until exhaustion [19].

3. Data Analysis

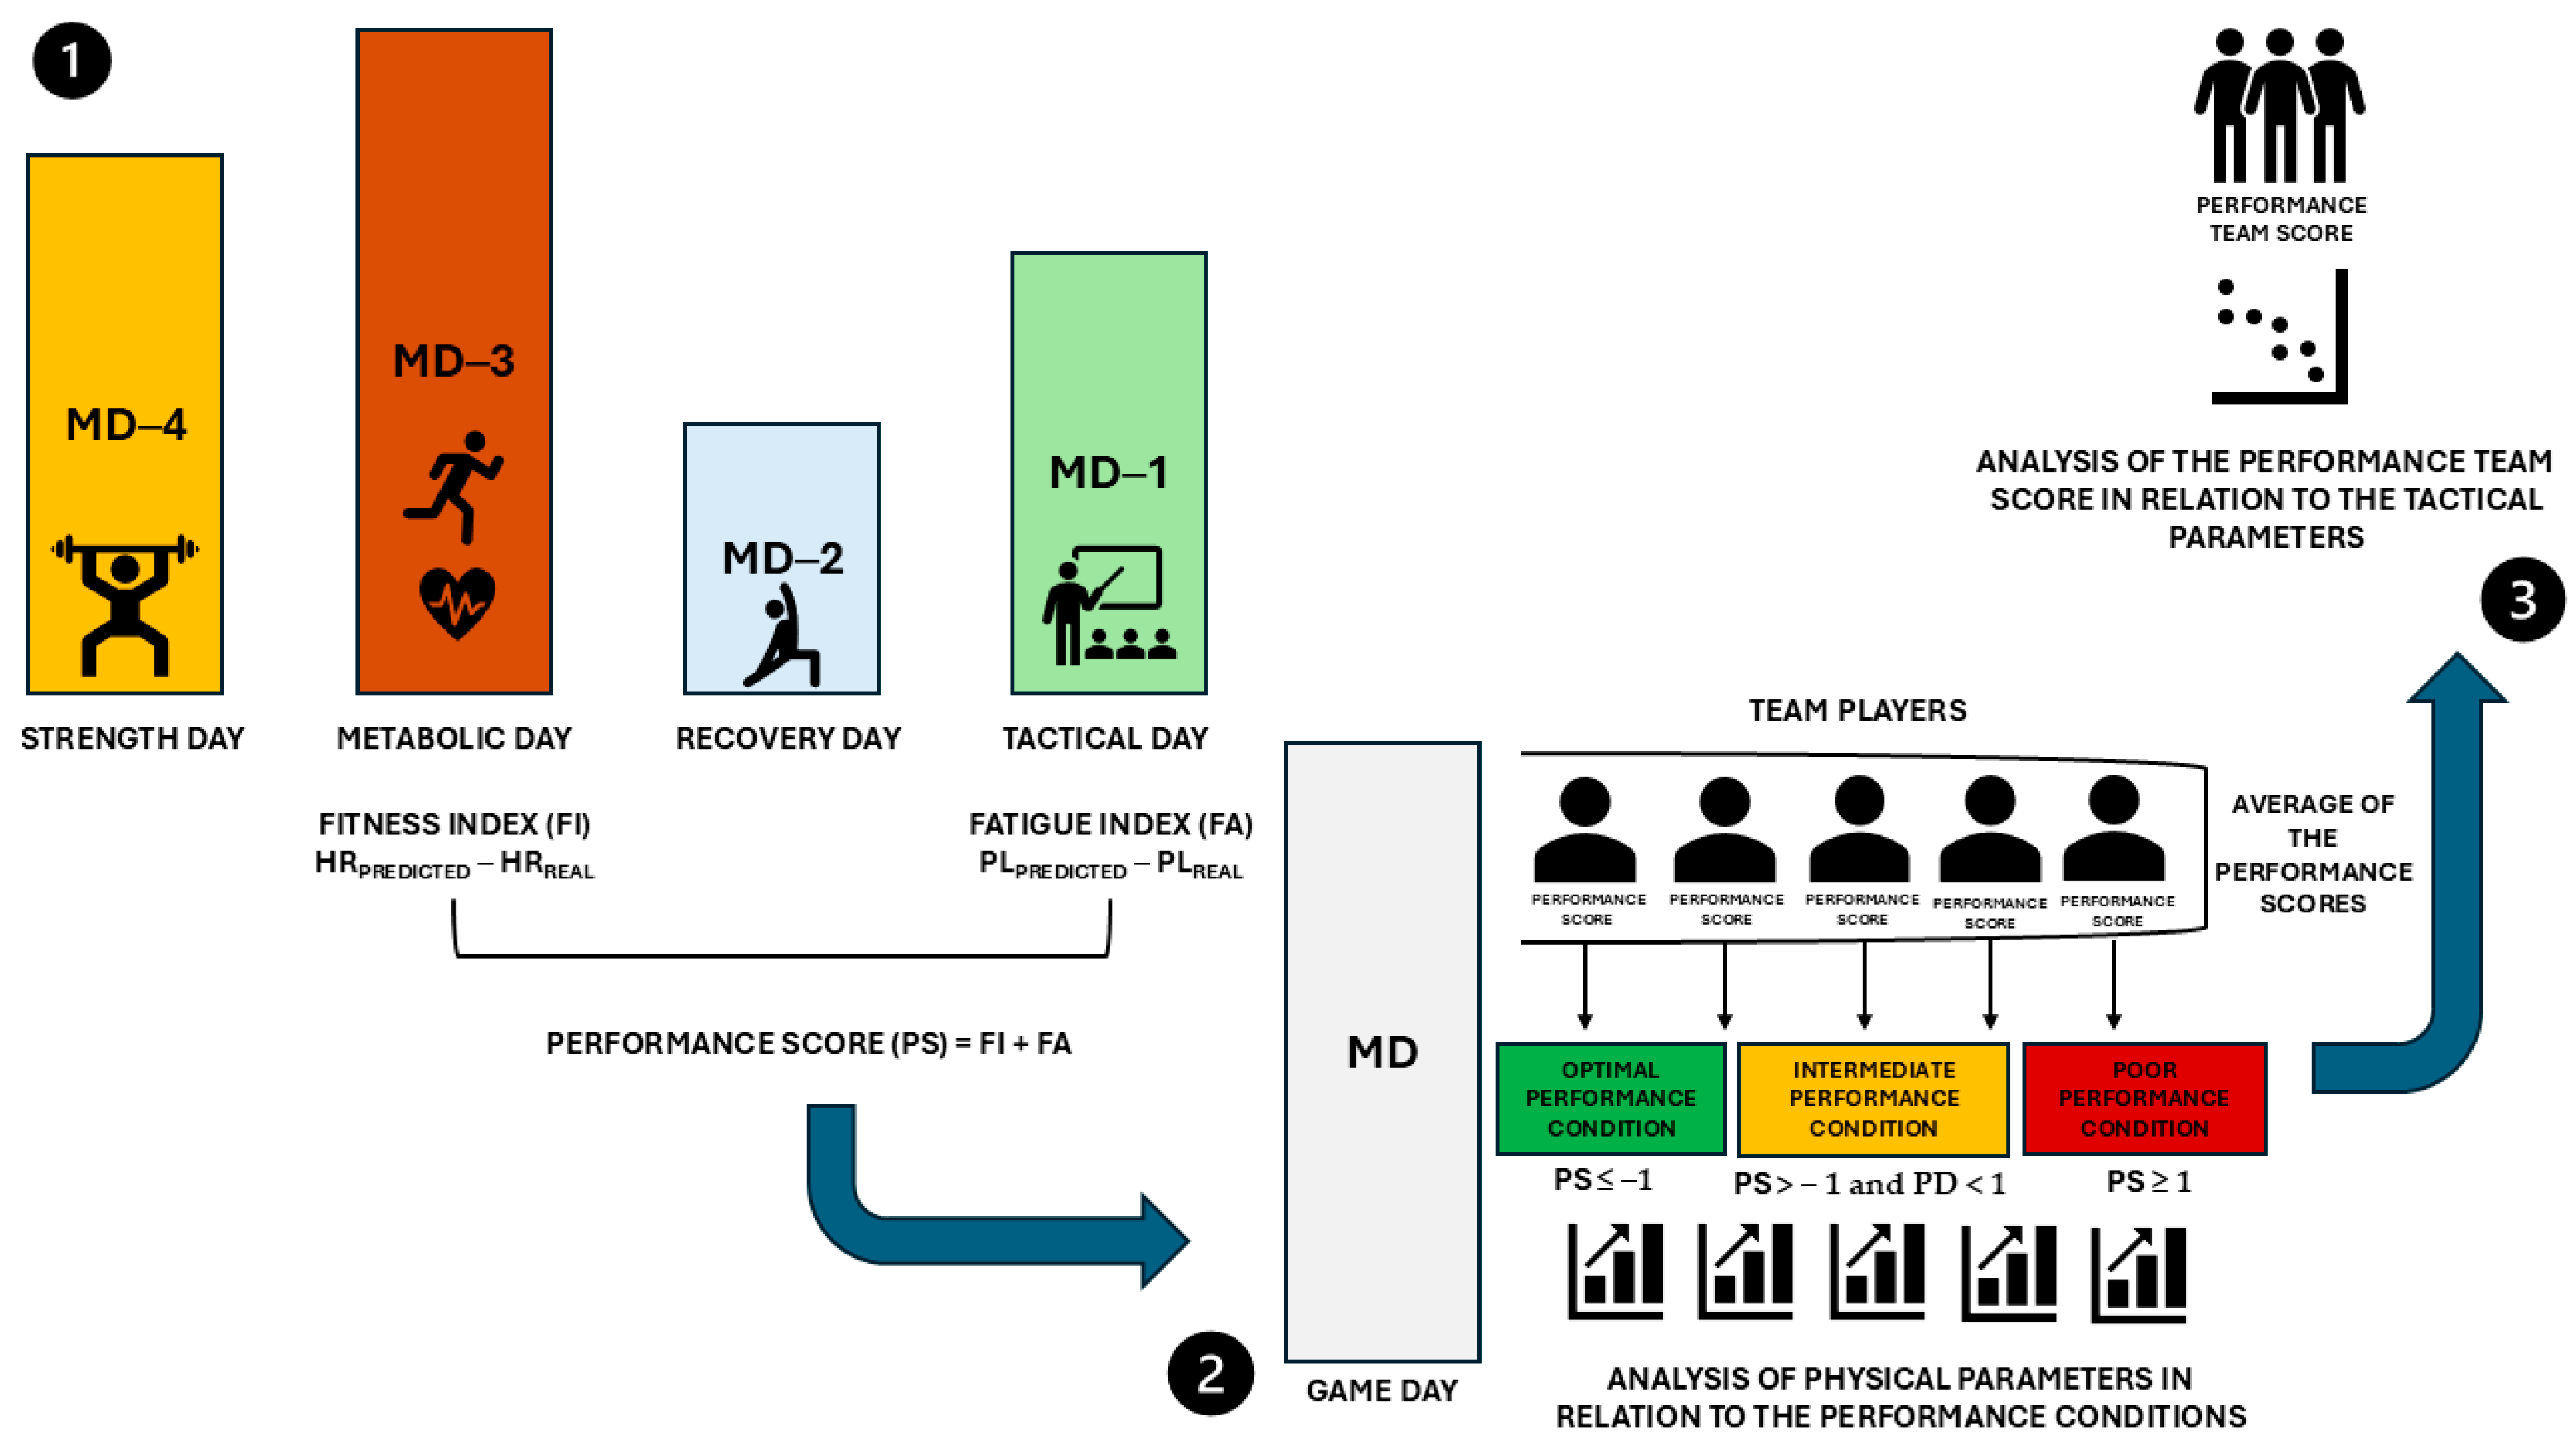
3.1. Definition of Fitness, Fatigue Indices and Performance Score

The fitness (FI) and fatigue (FA) indices were calculated using a machine learning (ML) approach, as detailed in previous studies [10,11]. The FI was determined by comparing the real HR (expressed as percentage of individual HRmax) recorded during training drills (specifically, small-sided games) to the HR predicted by an ML model (Random Forest Regression model), developed following the methodology described by Mandorino et al. [10]. To evaluate the HR responses, game simulations (games performed with two regular goals and goalkeepers) and possession games (possession drills performed without the goals) were considered. A positive FI (FI > 0) indicated that the actual HR was lower than the predicted HR, suggesting that the player demonstrated a good fitness status by minimizing HR responses relative to the external load. Conversely, a negative FI indicated a poor fitness status, where the player exhibited a higher HR response than predicted. The concurrent validity of the index was previously evaluated, demonstrating a large correlation (r = 0.7) with a submaximal fitness run test [10]. Both the actual and predicted HR values were expressed as a percentage of individual HRmax.
The FA index was computed as the difference between the predicted PL values, generated by the ML model (Random Forest Regression model), and the actual PL values recorded throughout the training session. Following the procedures detailed by Mandorino et al. [11], we posited that a higher predicted PL compared to the real PL indicated the player’s efficiency in locomotor activity, minimizing body load in response to external demands. In contrast, a higher actual PL suggested decreased locomotor efficiency, indicative of a potential state of fatigue [20]. The FA index demonstrated sensitivity to the period of the season, day of the week, and cumulative load from the prior week, showing a significant decrease following increased weekly load [11]. In addition, the FA index exhibited different behaviors according to different weekly periodization strategies [7].
To account for individual variability, both FI and FA indices were expressed in relation to the individual’s absolute average and normal variation throughout the entire seasons using a z-score transformation (z-FI, z-FA). The z-FI was assessed weekly on match-day minus 3 (MD-3), typically used for metabolic training involving small-sided games, making it ideal for evaluating specific player fitness. The z-FA was assessed on MD-1, after a recovery day (MD-2), to reflect the players’ readiness before the match.
In alignment with the fitness–fatigue model [5], players’ performance is determined by the summation of positive (fitness) and negative (fatigue) responses to the training stimulus [21]. Using the summation, the signs of the numbers involved are preserved. This means that no changes are made to the signs of the values during the operation. Each number contributes to the total sum based on its original sign—positive or negative. Thus, an individual performance score (PSindividual) was calculated using the following formula:
P S i n d i v i d u a l = z - F I + z - F A
Based on the weekly PSindividual, players were categorized into three performance conditions:
  • Poor performance condition: PS ≤ −1.
  • Intermediate performance condition: PS > −1 and PS < 1.
  • Optimal performance condition: PS ≥ 1.
The PSindividual was calculated individually each week and at the team level to quantify the overall performance of players participating in the match (PSteam). The PSteam was computed as the average of the different PSindividual scores. To ensure a robust team-level analysis, only matches that included complete FI and FA training datasets from at least five players were considered. This approach ensures that the analysis is based on comprehensive data from a sufficient number of players. Matches were excluded if there were insufficient data due to issues such as GPS data absence or HR monitor malfunction during the week. All the steps performed to calculate the PSindividual and PSteam scores are summarized in Figure 1.

3.2. Evaluation of Match Physical and Tactical Outcomes

Match physical outcomes were assessed using the external load metrics previously described. Given the individual variability related to playing position and playing style, these metrics were normalized using z-scores: z-TD, z-D14.4, z-19.8, z-25.2, z-MW. The team tactical data of the matches were extracted by a video tracking system (OPTA client system, SportVU 2.0). The OPTA system generates match statistics from every action through a combination of human annotation, computer vision, and artificial intelligence modeling. The system exhibited a strong degree of inter-operator reliability and low standardized typical errors [22]. Expert analysts selected specific tactical parameters related to offensive and defensive behaviors to describe the team’s tactical approach, which were subsequently analyzed:
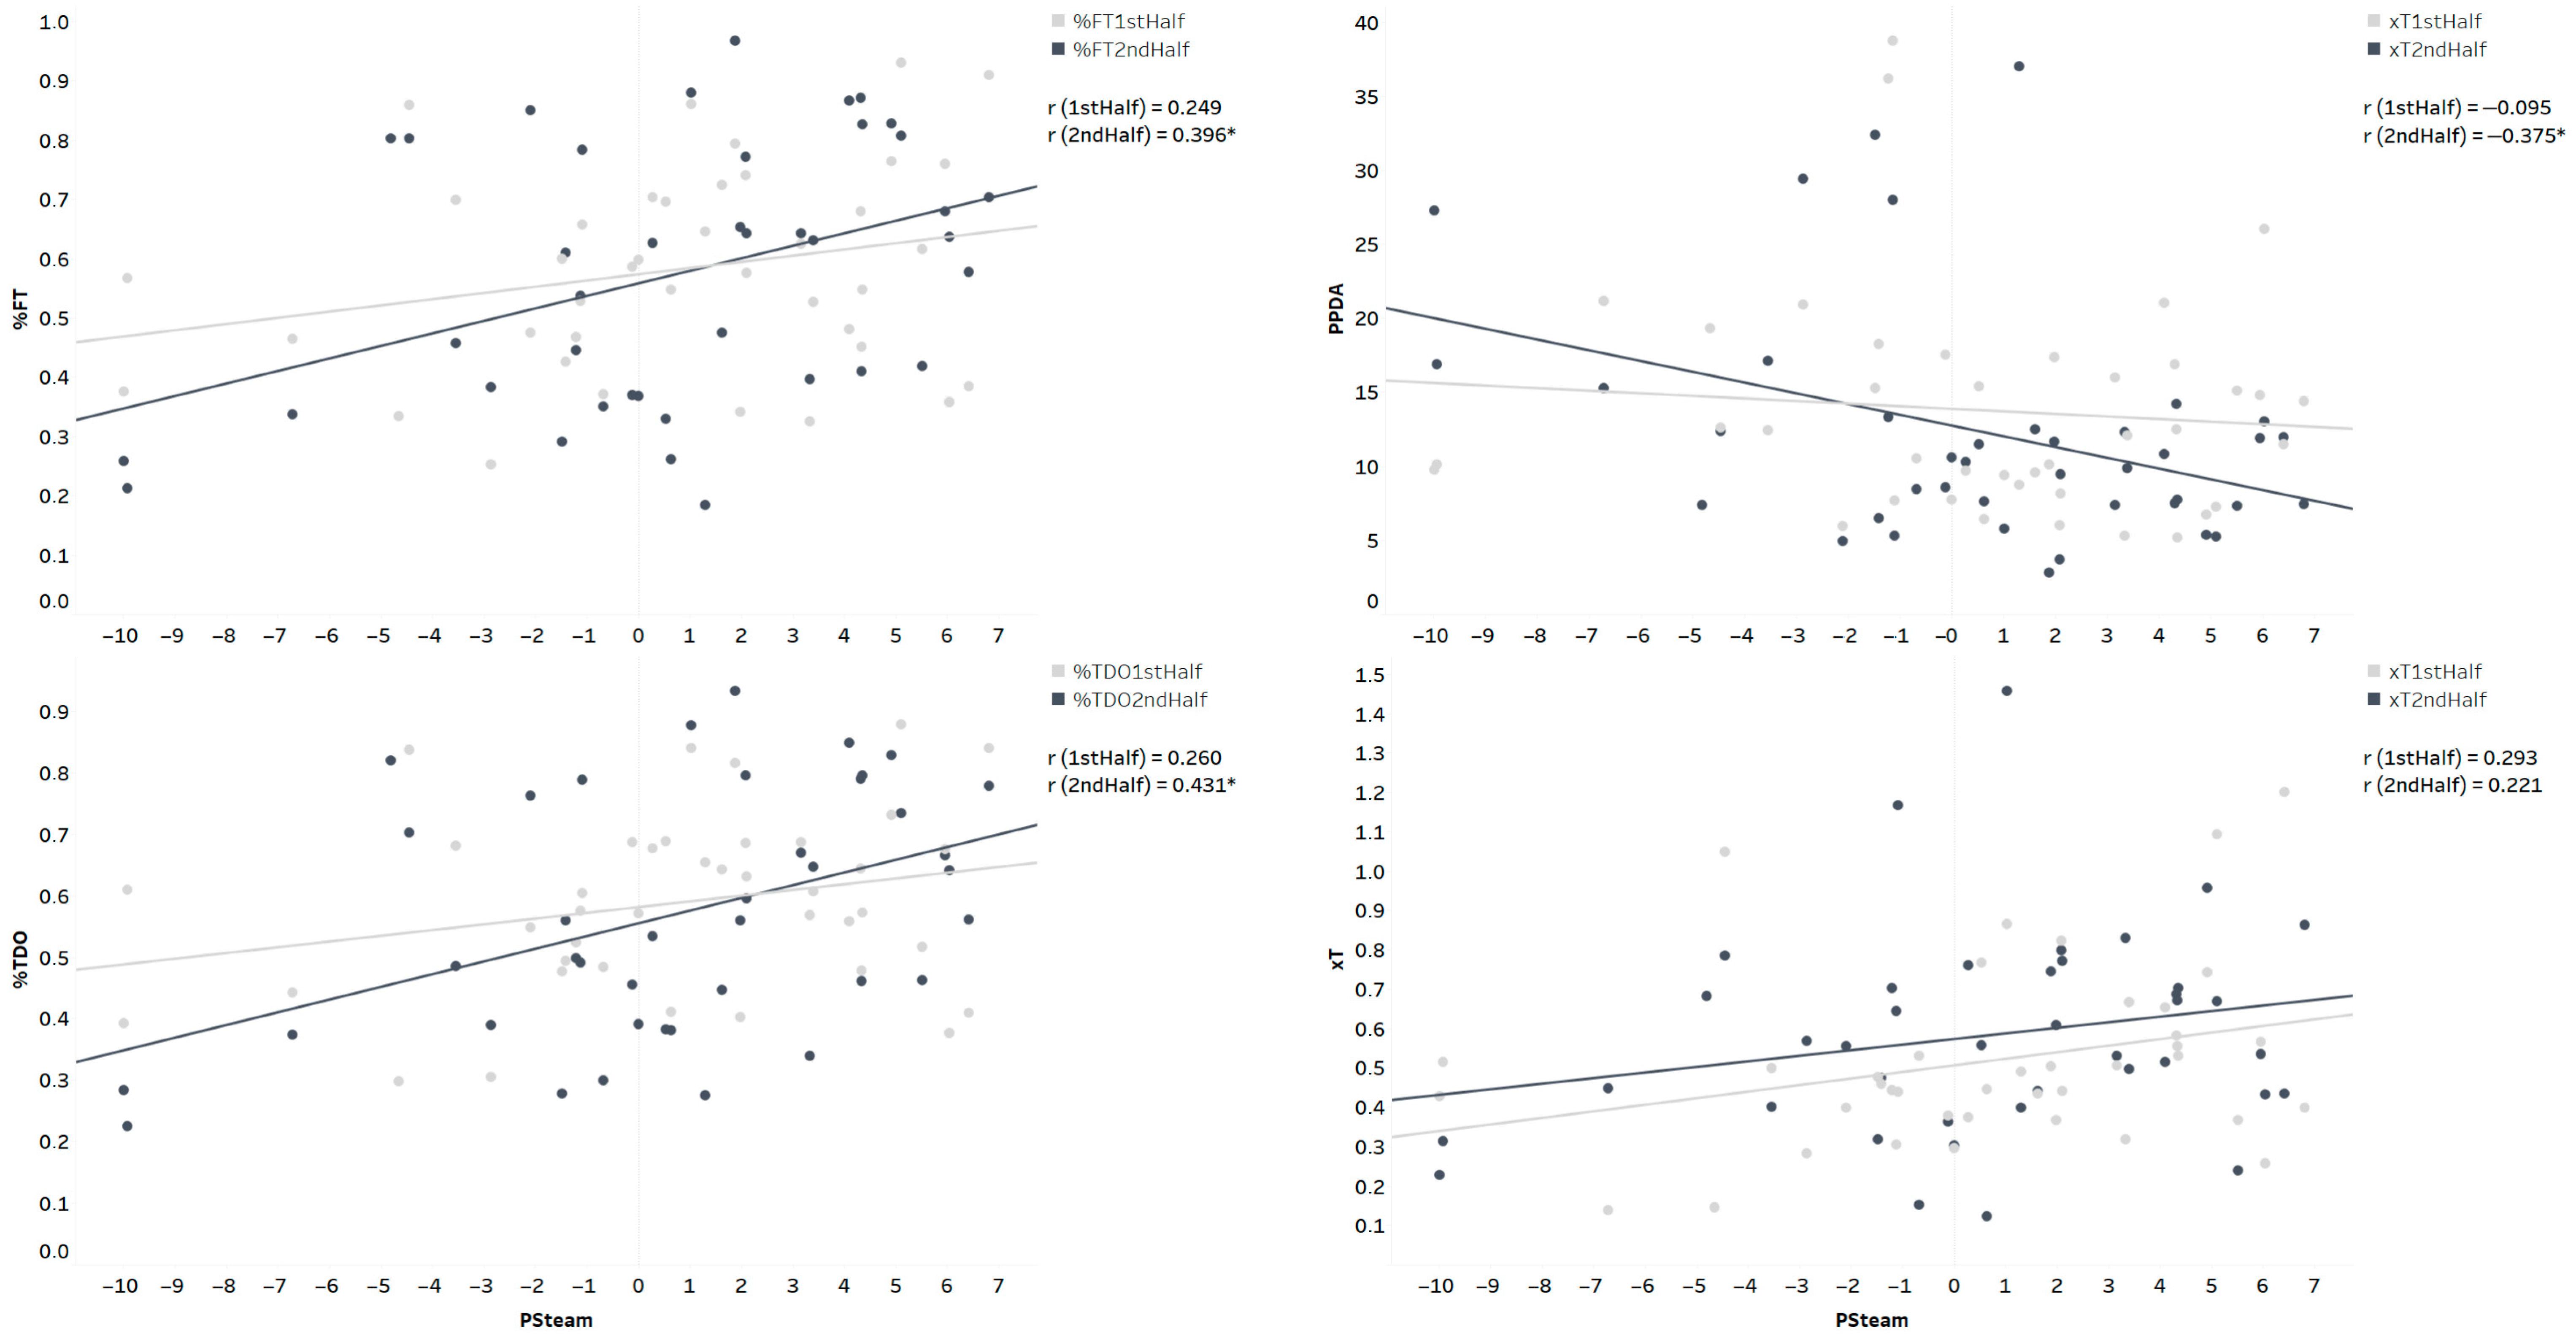
  • Percentage of field tilt (%FT): Field tilt is used to show the territorial dominance of the team. It measures the share of possession a team has in the game, considering only touches or passes in the attacking third. Higher values reflect greater attacking ability.
  • Passes per defensive actions (PPDA): The metric is calculated by dividing the number of passes performed by the attacking team by the total number of defensive actions performed by the defending team (e.g., tackles and interceptions). Therefore, this metric counts how many passes a team allows the opponents to make before attempting to win the ball back with a defensive action. Lower PPDA values suggest higher defensive intensity.
  • Percentage of territorial domination (%TDO): This metric represents the percentage of time spent in possession within the opponent’s half.
  • Expected Threat (xT): The value quantifies the change in goal-scoring probability before and after an action, allowing us to provide a value to the actions that lead the team toward more dangerous situations.
The external load data were normalized per playing minutes to enable easier comparisons. Only players who played at least 70 min were included to avoid the confounding influence of substitutes, who might display greater physical output due to different pacing strategies [23].

4. Statistical Analysis

A within-subject linear mixed model was employed to analyze the mean differences in physical parameters, with 95% confidence intervals, across the three performance groups (poor, intermediate, and optimal performance conditions). The analysis was conducted separately for the first half (z-TD1stHalf, z-D14.41stHalf, z-19.81stHalf, z-25.21stHalf, z-MW1stHalf) and second half (z-TD2ndHalf, z-D14.42ndHalf, z-19.82ndHalf, z-25.22ndHalf, z-MW2ndHalf) of the matches. When statistically significant differences were observed, the least significant difference approach to multiple comparisons was adopted, as suggested by Thorpe et al. [24]. Standardized effect sizes, defined as the ratio of the mean difference to the pooled standard deviation, were also calculated. Effect size (ES) values of 0.2, 0.5, and 0.8 were interpreted as small, moderate, and large differences, respectively [25]. Pearson product-moment correlation coefficient (r) was calculated to establish the strength and direction of the relationship between the PSteam score, and the different tactical parameters recorded during the first half (%FT1stHalf, PPDA1stHalf, %TDO1stHalf, xT1stHalf) and second half (%FT2ndHalf, PPDA2ndHalf, %TDO2ndHalf, xT2ndHalf). The following criteria were used to define the magnitude of the relationship: ≤0.1 (trivial), 0.1 to 0.3 (small), 0.3 to 0.5 (moderate), 0.5 to 0.7 (large), 0.7 to 0.9 (very large), and ≥0.9 (nearly perfect) [26]. All the statistical analyses were performed using the Statistical Package for the Social Sciences, version 28.0 (SPSS Inc., Chicago, IL, USA). The threshold for statistical significance was set at p < 0.05.

5. Results

A total of forty matches were included in the analyses. An average of 17 ± 12 observations per player were recorded. The mean and standard deviation of the physical and tactical parameters recorded during the first half and second half of the matches are presented in Table 1.
The match-by-match percentage distribution of players across the three performance conditions over the two seasons is presented in Figure 2. The linear mixed model analysis revealed a statistically significant higher z-25.21stHalf in the intermediate performance condition compared to the poor performance condition (p < 0.05, ES = 0.32). No significant differences were observed for z-TD1stHalf, z-D14.41stHalf, z-19.81stHalf, and z-MW1stHalf across the performance groups. Analyzing the second half, z-TD2ndHalf (optimal vs. intermediate performance condition [p < 0.05, ES = 0.29]), z-D14.42ndHalf (optimal vs. intermediate performance condition [p < 0.05, ES = 0.25], optimal vs. poor performance condition [p < 0.01, ES = 0.52]), and z-MW2ndHalf (optimal vs. poor performance condition [p < 0.05, ES = 0.43]) showed significant differences, with the highest values registered in the optimal performance condition group. All the results are presented in Figure 3. The Pearson product-moment correlation analysis identified a significant relationship between the PSteam and %FT2ndHalf (p < 0.05, r = 0.396), PPDA2ndHalf (p < 0.05, r = −0.375), and %TDO2ndHalf (p < 0.01, r = 0.431). The correlation results are shown in Figure 4.

6. Discussion

The primary aim of this study was to investigate the interaction between fitness and fatigue by developing a new performance score and analyzing its impact on match physical and tactical performance. The main findings revealed that the performance score indicator effectively discriminated lower physical output during matches and identified potential relationships with team tactical performance. These results underscore the value of invisible monitoring methods in tracking player status throughout the weekly microcycle and highlight the importance of integrating such approaches in elite sports environments to optimize match performance.
  • Feasibility and usefulness of invisible monitoring in the context of Elite Team Sport
This study proposed to use the fitness–fatigue model to objectively quantify performance and its relative effect on match day physical and technical performances. The use of statistical models to explain the relationship between training and performance has existed for a long time [4,27,28]. Interestingly, in the context of team sport, the interest of such an approach has been limited due to the so-called multifactorial nature of performance reducing its application to mainly endurance sports (e.g., running, swimming, cycling) where physical performance is central. However, with the use of new technology and advanced statistical analysis, the (re)integration of fitness–fatigue modelling in the context of team sports is now within reach. In the context of this research, such seamless integration within an elite performance environment has been possible with the incorporation of advanced statistical methods allowing continuous measure of multiple constructs (fitness and fatigue). This type of approach should be encouraged as it clearly showed some added value to optimize weekly training periodization in the context of elite football.
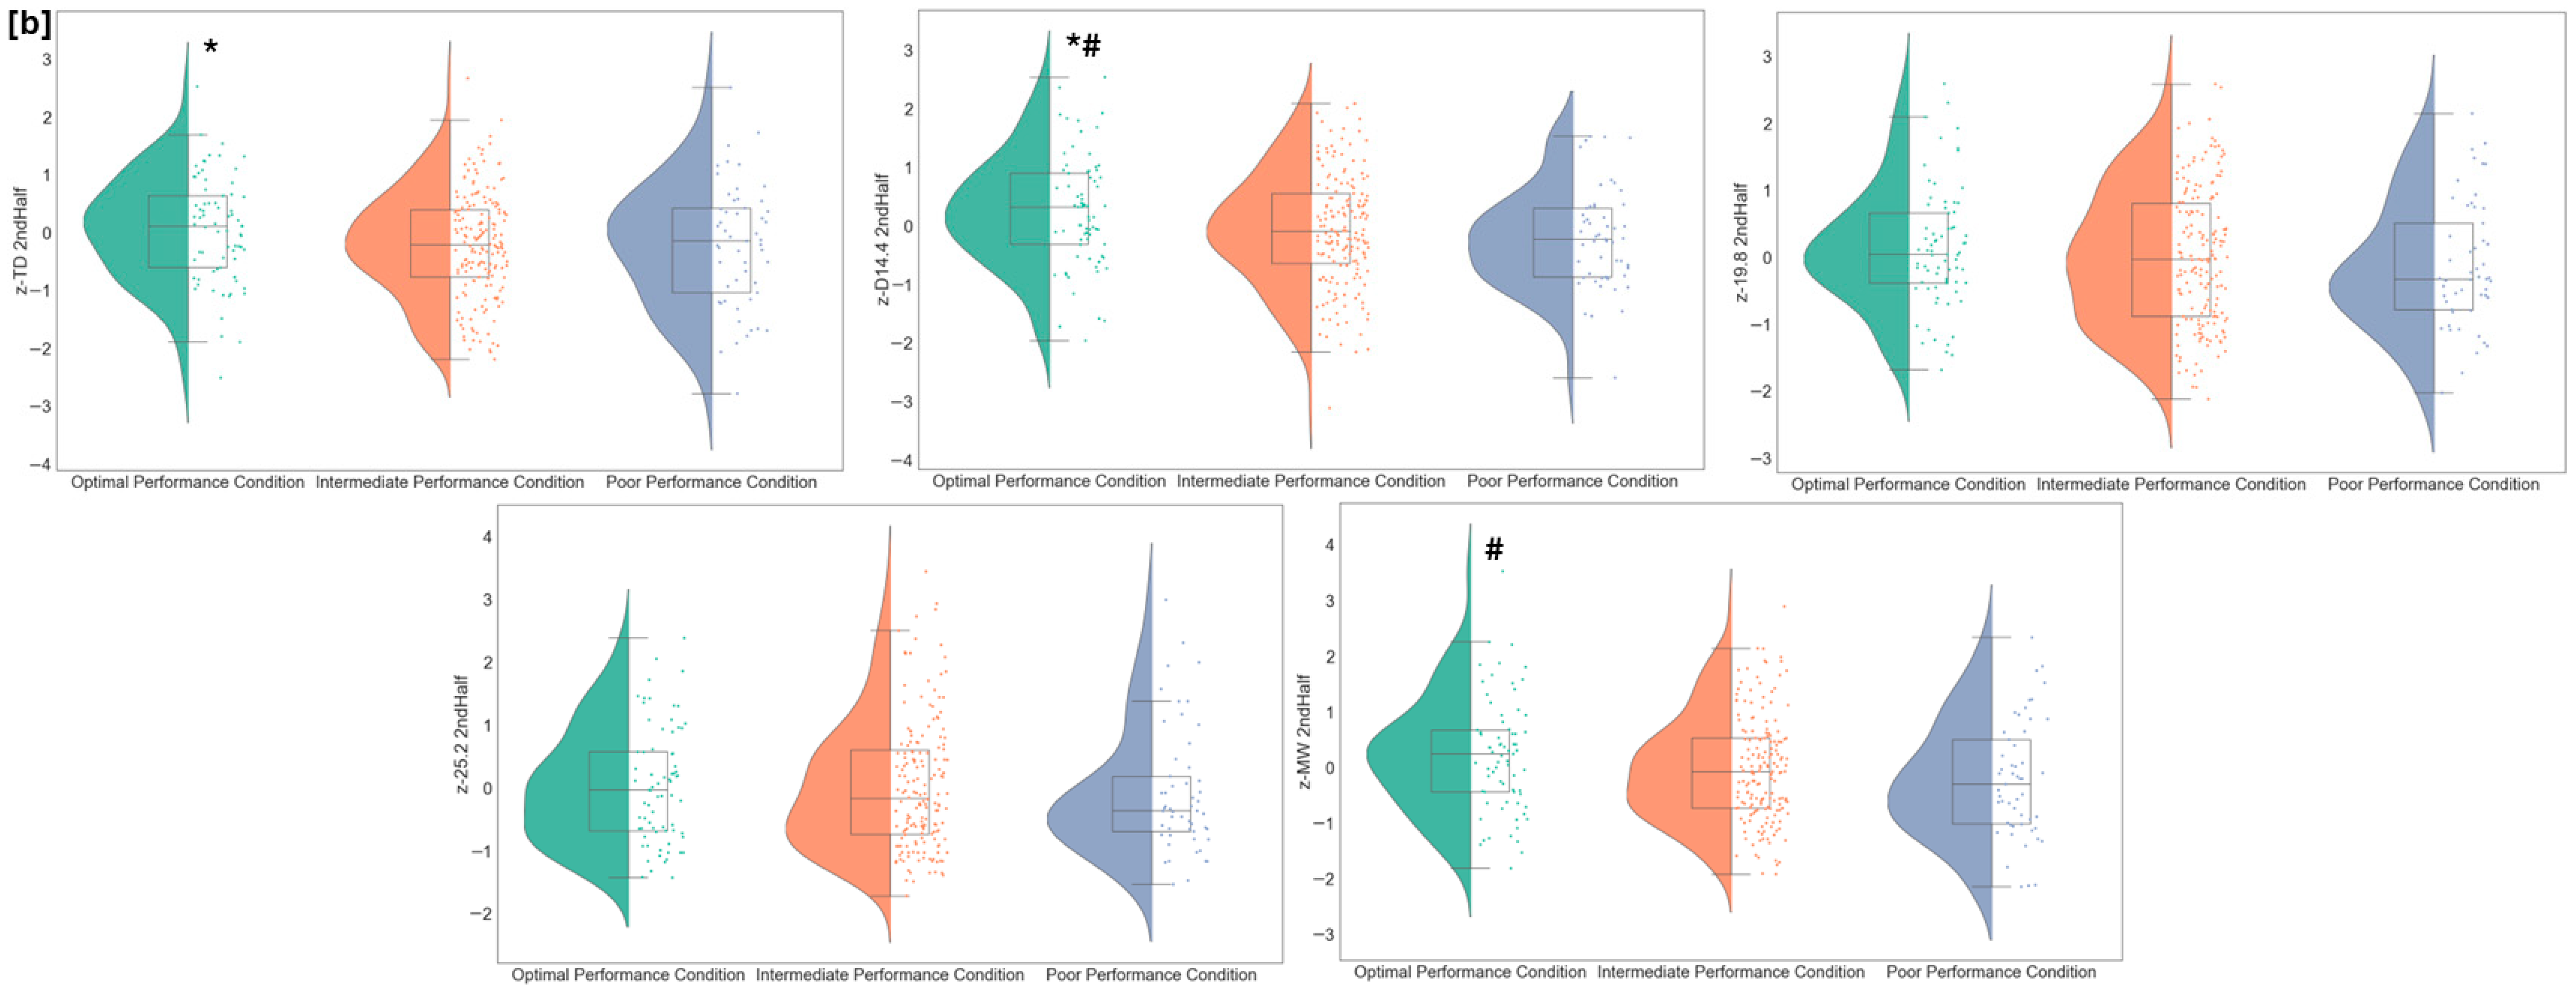
  • The effect on individual physical performance
One of the main results of this study showed a clear difference between players with different player status, suggesting that an adequate fitness–fatigue balance has a clear positive effect on individual physical performance. Indeed, the classification of players in the three conditions (optimal, intermediate and poor) changed from match to match. As highlighted in Figure 2, it is difficult during the season to have the entire team always in the optimal state. One interesting finding of this research highlights that when the players were categorized into the poor performance condition, they exhibited the lowest physical performance output, and this was even clearer in the second half, where moderate effects were found. This suggests that the expected transient fatigue state in the second half was more important for this specific category. Research is relatively scarce on this topic, making comparisons with other studies difficult. Indeed, recent literature has questioned the effect of previous physical status on physical performance, requiring performance staff to choose monitoring practices that ensure an optimal player status for weekly scheduling [29]. To the best of our knowledge, this is the first study showing that the balance between fitness and fatigue pre-match influences running performance. From a physiological standpoint, our results are logical; an optimal player status should result in a better physical performance. However, this has never been explicitly shown through original research, which is required in order to demonstrate the construct validity of the present approach. Such findings have clear practical implications. First, it highlights the necessity to implement appropriate monitoring strategies throughout the microcycle to observe potential abnormalities, intervene and ensure an optimal player status before a match. Indeed, the high inter-individual variability in performance scores reinforces such a need. Second, this could be used as a practical tool to assess and adjust training load proactively, rather than making solely subjective decisions about the weekly training program. Despite this, more research determining the most appropriate training dose to ensure optimal physical status is warranted.
  • The Effect of Performance Score on Team Technical and Tactical Performance
It is worth mentioning that we attempted to assess the effect of player status on technical and tactical performance indicators. Surprisingly, the performance team score (i.e., encompassing the fitness–fatigue status of each player for a given match) was moderately correlated with tactical parameters, with higher correlations found in the second half, when a higher state of fatigue is often reported. Therefore, arriving to the match in an optimal performance condition was associated with greater physical and tactical outcomes, as demonstrated by the higher field tilt, territorial dominance, and the lower PPDA. The magnitude of correlation remains similar to previous research in the Rugby Union, highlighting that low wellness scores might impact subsequent technical performance [30]. This has important practical implications, as it should allow technical and performance staff to work more closely together. Indeed, while there are many ways to periodize the weekly microcycle in elite football [31], it is worth noting that this has predominantly been driven by experience rather than a scientific approach. Hence, the present results should help performance staff to provide objective information to adapt the training schedule and optimize team performance due to the potential link observed between physical status and team technical and tactical performance. However, it is important to note that the association between PS and match technical–tactical parameters was moderate, suggesting that over 50% of match tactical performance is influenced by additional factors not accounted for in this study.

7. Limitations

Despite the added value of the present investigation, there are some limitations that should be noted. First, the current results might only apply to the team used to build the performance model applied in this study. To strengthen investigations on this topic, we encourage researchers to share datasets across sporting organizations [30]. Second, the potential effects of contextual factors (e.g., scoreline, playing style, opponent level) should be taken into account, as they may influence physical performance. While it was not possible to include contextual factors in our performance model due to the limited dataset (2 years and one team), these factors should be considered in future work. Finally, some consideration should be given to the construct validity of the parameters used to create the performance score. Indeed, both fitness and fatigue indicators showed promise in terms of construct, content, and face validity in previous research [10,11], although further investigation is required to ensure these results can be translated to other contexts.

8. Practical Application

Implementing an invisible monitoring strategy based on the estimation of the FI and FA indices can assist football practitioners in optimizing training periodization. By tracking heart rate and locomotor data, it is possible to quantify players’ responses to training load and recovery interventions. Based on the performance score developed, coaches and performance staff could identify players who may exhibit a reduction in performance in the latter stage of the game. This data-informed method reduces subjective decision-making and encourages a more evidence-based approach. From a tactical standpoint, the moderate association between the team-level performance score and second-half metrics such as field tilt, PPDA, and territorial domination highlight the interconnected nature of physiological and tactical performance. Ultimately, the use of machine learning in predicting the fitness and fatigue status of the players provides a continuous, invisible monitoring approach, suitable for elite football environments that face time constraints and player reluctance toward frequent testing. As technology evolves, further research is encouraged to refine invisible monitoring models and expand their applicability to different team contexts. In practical terms, implementing such an approach requires minimal equipment, daily data capture, and a coordinated effort among sports scientists, coaches, and medical staff.

9. Conclusions

This study quantified the effect of fitness and fatigue on physical and technical performance. The results from the present investigation reinforce (1) the need for appropriate monitoring processes, (2) the suitability of “invisible monitoring” strategies and (3) the benefits of objective feedback to optimize training scheduling over the weekly microcycle in elite football. Despite the clear added value of such an approach, practitioners need to carefully consider the utility of the model created before deploying similar strategies within their own context. Future research confirming the construct validity of each parameter of the model tested in this study is warranted.

Author Contributions

M.M., T.J.G. and M.L. were responsible for the conception and design of the study. M.M. conducted the analyses. All authors contributed to the interpretation of the findings and had full access to all data. M.M., A.T. and C.L. wrote the first draft of the paper, which was critically revised by T.J.G., V.P. and M.L. The final manuscript was approved by all authors. All authors have read and agreed to the published version of the manuscript.

Funding

This research received no external funding.

Institutional Review Board Statement

Approval for data collection was obtained from the club (as player’s data were routinely collected over the course of the season). The study was conducted in accordance with the Declaration of Helsinki (2013).

Informed Consent Statement

Informed consent was obtained from all subjects involved in the study.

Data Availability Statement

Data are available upon reasonable request.

Acknowledgments

The authors would like to thank Parma Calcio 1913, including the contact persons, medical staff, coaching staff, and all players, for their invaluable participation in this study. Additionally, the authors extend their gratitude to Jo Clubb for their valuable assistance in proofreading and providing feedback on earlier drafts of this manuscript, which greatly enhanced its clarity and quality.

Conflicts of Interest

The authors declare no conflicts of interest.

References

  1. Ekstrand, J.; Spreco, A.; Bengtsson, H.; Bahr, R. Injury rates decreased in men’s professional football: An 18-year prospective cohort study of almost 12,000 injuries sustained during 1.8 million hours of play. Br. J. Sports Med. 2021, 55, 1084–1092. [Google Scholar] [PubMed]
  2. Soligard, T.; Schwellnus, M.; Alonso, J.-M.; Bahr, R.; Clarsen, B.; Dijkstra, H.P.; Gabbett, T.; Gleeson, M.; Hägglund, M.; Hutchinson, M.R. How much is too much? (Part 1) International Olympic Committee consensus statement on load in sport and risk of injury. Br. J. Sports Med. 2016, 50, 1030–1041. [Google Scholar] [PubMed]
  3. Bourdon, P.C.; Cardinale, M.; Murray, A.; Gastin, P.; Kellmann, M.; Varley, M.C.; Gabbett, T.J.; Coutts, A.J.; Burgess, D.J.; Gregson, W. Monitoring athlete training loads: Consensus statement. Int. J. Sports Physiol. Perform. 2017, 12, S2-161–S2-170. [Google Scholar]
  4. Thorpe, R.T.; Strudwick, A.J.; Buchheit, M.; Atkinson, G.; Drust, B.; Gregson, W. Monitoring fatigue during the in-season competitive phase in elite soccer players. Int. J. Sports Physiol. Perform. 2015, 10, 958–964. [Google Scholar]
  5. Banister, E.W.; Calvert, T.W.; Savage, M.V.; Bach, T. A systems model of training for athletic performance. Aust. J. Sports Med. 1975, 7, 57–61. [Google Scholar]
  6. Halson, S.L. Monitoring training load to understand fatigue in athletes. Sports Med. 2014, 44, 139–147. [Google Scholar]
  7. Mandorino, M.; Tessitore, A.; Lacome, M. Loading or Unloading? This Is the Question! A Multi-Season Study in Professional Football Players. Sports 2024, 12, 148. [Google Scholar] [CrossRef]
  8. West, S.W.; Clubb, J.; Torres-Ronda, L.; Howells, D.; Leng, E.; Vescovi, J.D.; Carmody, S.; Posthumus, M.; Dalen-Lorentsen, T.; Windt, J. More than a metric: How training load is used in elite sport for athlete management. Int. J. Sports Med. 2021, 42, 300–306. [Google Scholar] [PubMed]
  9. Leduc, C.; Tee, J.; Lacome, M.; Weakley, J.; Cheradame, J.; Ramirez, C.; Jones, B. Convergent validity, reliability, and sensitivity of a running test to monitor neuromuscular fatigue. Int. J. Sports Physiol. Perform. 2020, 15, 1067–1073. [Google Scholar]
  10. Mandorino, M.; Clubb, J.; Lacome, M. Predicting Soccer Players’ Fitness Status Through a Machine-Learning Approach. Int. J. Sports Physiol. Perform. 2024, 1, 1–11. [Google Scholar]
  11. Mandorino, M.; Tessitore, A.; Leduc, C.; Persichetti, V.; Morabito, M.; Lacome, M. A New Approach to Quantify Soccer Players’ Readiness through Machine Learning Techniques. Appl. Sci. 2023, 13, 8808. [Google Scholar] [CrossRef]
  12. Silva, J.R.; Rumpf, M.C.; Hertzog, M.; Castagna, C.; Farooq, A.; Girard, O.; Hader, K. Acute and residual soccer match-related fatigue: A systematic review and meta-analysis. Sports Med. 2018, 48, 539–583. [Google Scholar] [CrossRef]
  13. Coutinho, D.; Gonçalves, B.; Wong, D.P.; Travassos, B.; Coutts, A.J.; Sampaio, J. Exploring the effects of mental and muscular fatigue in soccer players’ performance. Hum. Mov. Sci. 2018, 58, 287–296. [Google Scholar] [CrossRef]
  14. Coutinho, D.; Gonçalves, B.; Travassos, B.; Wong, D.P.; Coutts, A.J.; Sampaio, J.E. Mental fatigue and spatial references impair soccer players’ physical and tactical performances. Front. Psychol. 2017, 8, 1645. [Google Scholar] [CrossRef] [PubMed]
  15. Dambroz, F.; Teoldo, I. Better decision-making skills support tactical behaviour and reduce physical wear under physical fatigue in soccer. Front. Physiol. 2023, 14, 1116924. [Google Scholar] [CrossRef] [PubMed]
  16. Winter, E.M.; Maughan, R.J. Requirements for ethics approvals. J. Sports Sci. 2009, 27, 985. [Google Scholar] [CrossRef]
  17. Gomez-Carmona, C.D.; Bastida-Castillo, A.; García-Rubio, J.; Ibáñez, S.J.; Pino-Ortega, J. Static and dynamic reliability of WIMU PRO™ accelerometers according to anatomical placement. Proc. Inst. Mech. Eng. Part P J. Sports Eng. Technol. 2019, 233, 238–248. [Google Scholar] [CrossRef]
  18. Gomez-Carmona, C.D.; Bastida-Castillo, A.; Gonzalez-Custodio, A.; Olcina, G.; Pino-Ortega, J. Using an inertial device (WIMU PRO) to quantify neuromuscular load in running: Reliability, convergent validity, and influence of type of surface and device location. J. Strength Cond. Res. 2020, 34, 365–373. [Google Scholar] [CrossRef]
  19. Buchheit, M.; Simpson, B.M.; Lacome, M. Monitoring cardiorespiratory fitness in professional soccer players: Is it worth the prick? Int. J. Sports Physiol. Perform. 2020, 15, 1437–1441. [Google Scholar] [CrossRef]
  20. Barrett, S.; Midgley, A.W.; Towlson, C.; Garrett, A.; Portas, M.; Lovell, R. Within-match PlayerLoad™ patterns during a simulated soccer match: Potential implications for unit positioning and fatigue management. Int. J. Sports Physiol. Perform. 2016, 11, 135–140. [Google Scholar] [CrossRef]
  21. Stone, M.H.; Sands, W.A.; Pierce, K.C.; Ramsey, M.W.; Haff, G.G. Power and power potentiation among strength–power athletes: Preliminary study. Int. J. Sports Physiol. Perform. 2008, 3, 55–67. [Google Scholar] [CrossRef]
  22. Barthelemy, B.; Ravé, G.; Govindasamy, K.; Ali, A.; Del Coso, J.; Demeaux, J.; Bideau, B.; Zouhal, H. Impact of Technical-Tactical and Physical Performance on the Match Outcome in Professional Soccer: A Case Study. J. Hum. Kinet. 2024, 94, 203. [Google Scholar]
  23. Mandorino, M.; Lacome, M. Defining Worst-Case-Scenario Thresholds in Soccer: Intensity Versus Volume. Int. J. Sports Physiol. Perform. 2024, 1, 1–5. [Google Scholar] [CrossRef]
  24. Thorpe, R.T.; Strudwick, A.J.; Buchheit, M.; Atkinson, G.; Drust, B.; Gregson, W. Tracking morning fatigue status across in-season training weeks in elite soccer players. Int. J. Sports Physiol. Perform. 2016, 11, 947–952. [Google Scholar]
  25. Cohen, J. Quantitative methods in psychology: A power primer. Psychol. Bull. 1992, 112, 1155–1159. [Google Scholar]
  26. Hopkins, W.; Marshall, S.; Batterham, A.; Hanin, J. Progressive statistics for studies in sports medicine and exercise science. Med. Sci. Sports Exerc. 2009, 41, 3. [Google Scholar] [CrossRef]
  27. Taha, T.; Thomas, S.G. Systems modelling of the relationship between training and performance. Sports Med. 2003, 33, 1061–1073. [Google Scholar] [PubMed]
  28. Calvert, T.W.; Banister, E.W.; Savage, M.V.; Bach, T. A systems model of the effects of training on physical performance. IEEE Trans. Syst. Man Cybern. 1976, SMC-6, 94–102. [Google Scholar]
  29. Carling, C.; Lacome, M.; McCall, A.; Dupont, G.; Le Gall, F.; Simpson, B.; Buchheit, M. Monitoring of post-match fatigue in professional soccer: Welcome to the real world. Sports Med. 2018, 48, 2695–2702. [Google Scholar] [CrossRef]
  30. Ramírez-López, C.; Till, K.; Weaving, D.; Boyd, A.; Peeters, A.; Beasley, G.; Bradley, S.; Giuliano, P.; Venables, C.; Jones, B. Does perceived wellness influence technical–tactical match performance? A study in youth international rugby using partial least squares correlation analysis. Eur. J. Sport Sci. 2022, 22, 1085–1093. [Google Scholar]
  31. Buchheit, M.; Settembre, M.; Hader, K.; McHugh, D. Planning the microcycle in elite football: To rest or not to rest? Int. J. Sports Physiol. Perform. 2023, 18, 293–299. [Google Scholar]
Figure 1. Summary of the steps performed to calculate the PSindividual and PSteam scores.
Applsci 15 03574 g001
Figure 2. Players’ percentage distribution in the three performance conditions during the 2022/23 and 2023/24 seasons. MD = match day.
Applsci 15 03574 g002
Figure 3. Box plots with kernel density estimation for the physical parameters’ variation (first half (a) and second half (b)) in relation to the three different performance groups. # denotes sig. difference vs. poor performance condition; * denotes sig. difference vs. intermediate performance condition; z-TD1stHalf = individual z-score of total distance recorded in the first half; z-D14.41stHalf = individual z-score of distance > 14.4 km/h recorded in the first half; z-19.81stHalf = individual z-score of distance > 19.8 km/h recorded in the first half; z-25.21stHalf = individual z-score of distance > 25.2 km/h recorded in the first half; z-MW1stHalf = individual z-score of mechanical work recorded in the first half; z-TD2ndHalf = individual z-score of total distance recorded in the second half; z-D14.42ndHalf = individual z-score of distance > 14.4 km/h recorded in the second half; z-19.82ndHalf = individual z-score of distance > 19.8 km/h recorded in the second half; z-25.22ndHalf = individual z-score of distance > 25.2 km/h recorded in the second half; z-MW2ndHalf = individual z-score of mechanical work recorded in the second half.
Applsci 15 03574 g003aApplsci 15 03574 g003b
Figure 4. Relationship between the PSteam score and the tactical parameters collected in the first and second half of matches. %FT = percentage of field tilt; PPDA = passes per defensive actions; %TDO = percentage of territorial domination; xT = expected threat; r = Pearson correlation coefficient. * denotes significant correlation.
Applsci 15 03574 g004
Table 1. Mean and standard deviation of the physical and tactical parameters collected in the first and second half of the matches.
Physical ParametersFirst HalfSecond Half
TD [m]5260 ± 5054643 ± 1007
D14.4 [m]1093 ± 299880 ± 290
D19.8 [m]319 ± 188248 ± 107
D25.2 [m]63 ± 4645 ± 40
MW [cnt]34 ± 928 ± 10
Tactical Parameters
FT (%)58 ± 1757 ± 22
PPDA (a.u.)13.7 ± 7.512.2 ± 7.9
TDO (%)59 ± 1456 ± 19
xT (a.u.)0.51 ± 0.230.58 ± 0.26
TD [m] = total distance; D14.4 [m] = distance covered above 14.4 km/h; D19.8 [m] = distance covered above 19.8 km/h; D25.2 [m] = distance covered above 25.2 km/h; MW [cnt] = sum of accelerations above 3.5 m/s2 and below −3.5 m/s2; FT (%) = percentage of field tilt; PPDA (a.u.) = passes per defensive actions; TDO (%) = percentage of territorial domination; xT (a.u.) = expected threat.
Disclaimer/Publisher’s Note: The statements, opinions and data contained in all publications are solely those of the individual author(s) and contributor(s) and not of MDPI and/or the editor(s). MDPI and/or the editor(s) disclaim responsibility for any injury to people or property resulting from any ideas, methods, instructions or products referred to in the content.

