Cleaner Processes for Making Laundry Soap from Vegetable Oils and an Essential Oil

 , , and
Abstract
:1. Introduction
- -
- In the case of natural soaps: (1) raw materials: renewable plant-based oils, biodegradable ingredients; (2) production: simpler, low energy consumption, minimal waste generation; (3) packaging: paper, cardboard, and therefore biodegradable packaging; (4) use: biodegradable product, minimal environmental impact, low water consumption; (5) end of life: biodegradable, minimal waste if the packaging is ecological [22].
- -
- In the case of detergents: (1) raw materials: non-renewable chemicals, petroleum-based, high carbon footprint; (2) production: more complex, energy-consuming, generates chemical waste; (3) packaging: non-ecological packaging, in plastic bags that lead to significant waste generation; (4) use: pollute water, contain non-biodegradable compounds, high water consumption; (5) end of life: plastic waste, non-biodegradable chemicals persist in water systems [23,24,25,26,27,28,29].
- In the case of cold saponification, very-good-quality soaps are obtained, with a smooth surface and a well-defined geometric shape, which preserve the nutrients in the raw material, retain the additives better, as well as the glycerin.
- In the case of hot saponification, good-quality soaps are obtained but are harder, slightly shiny, with a less fine appearance and a rougher texture because they contain fewer nutrients and glycerin due to its thermal degradation during processing.
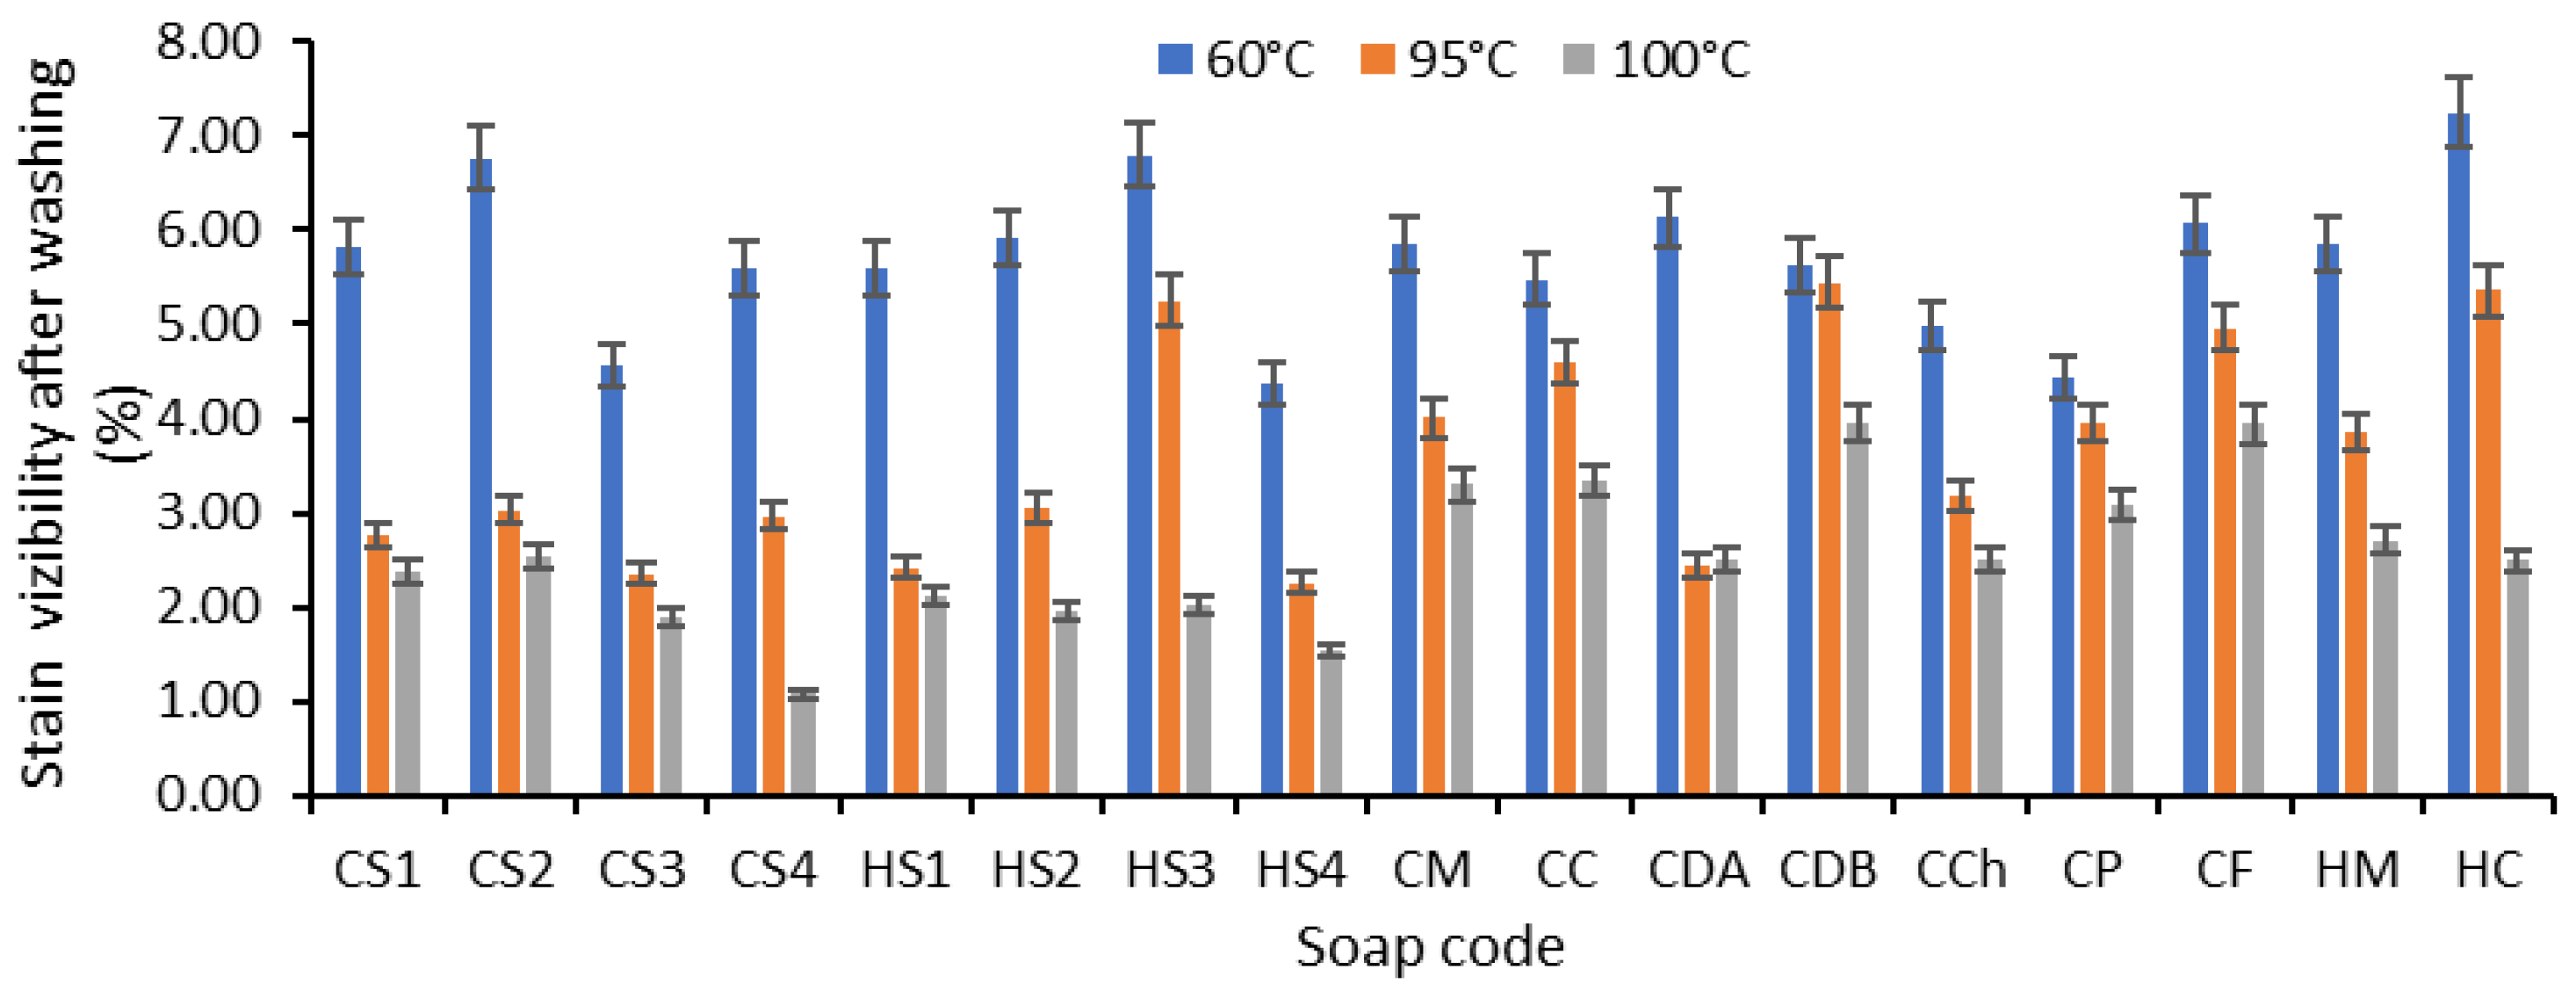
- Hidden stain visibility after washing (Hs);
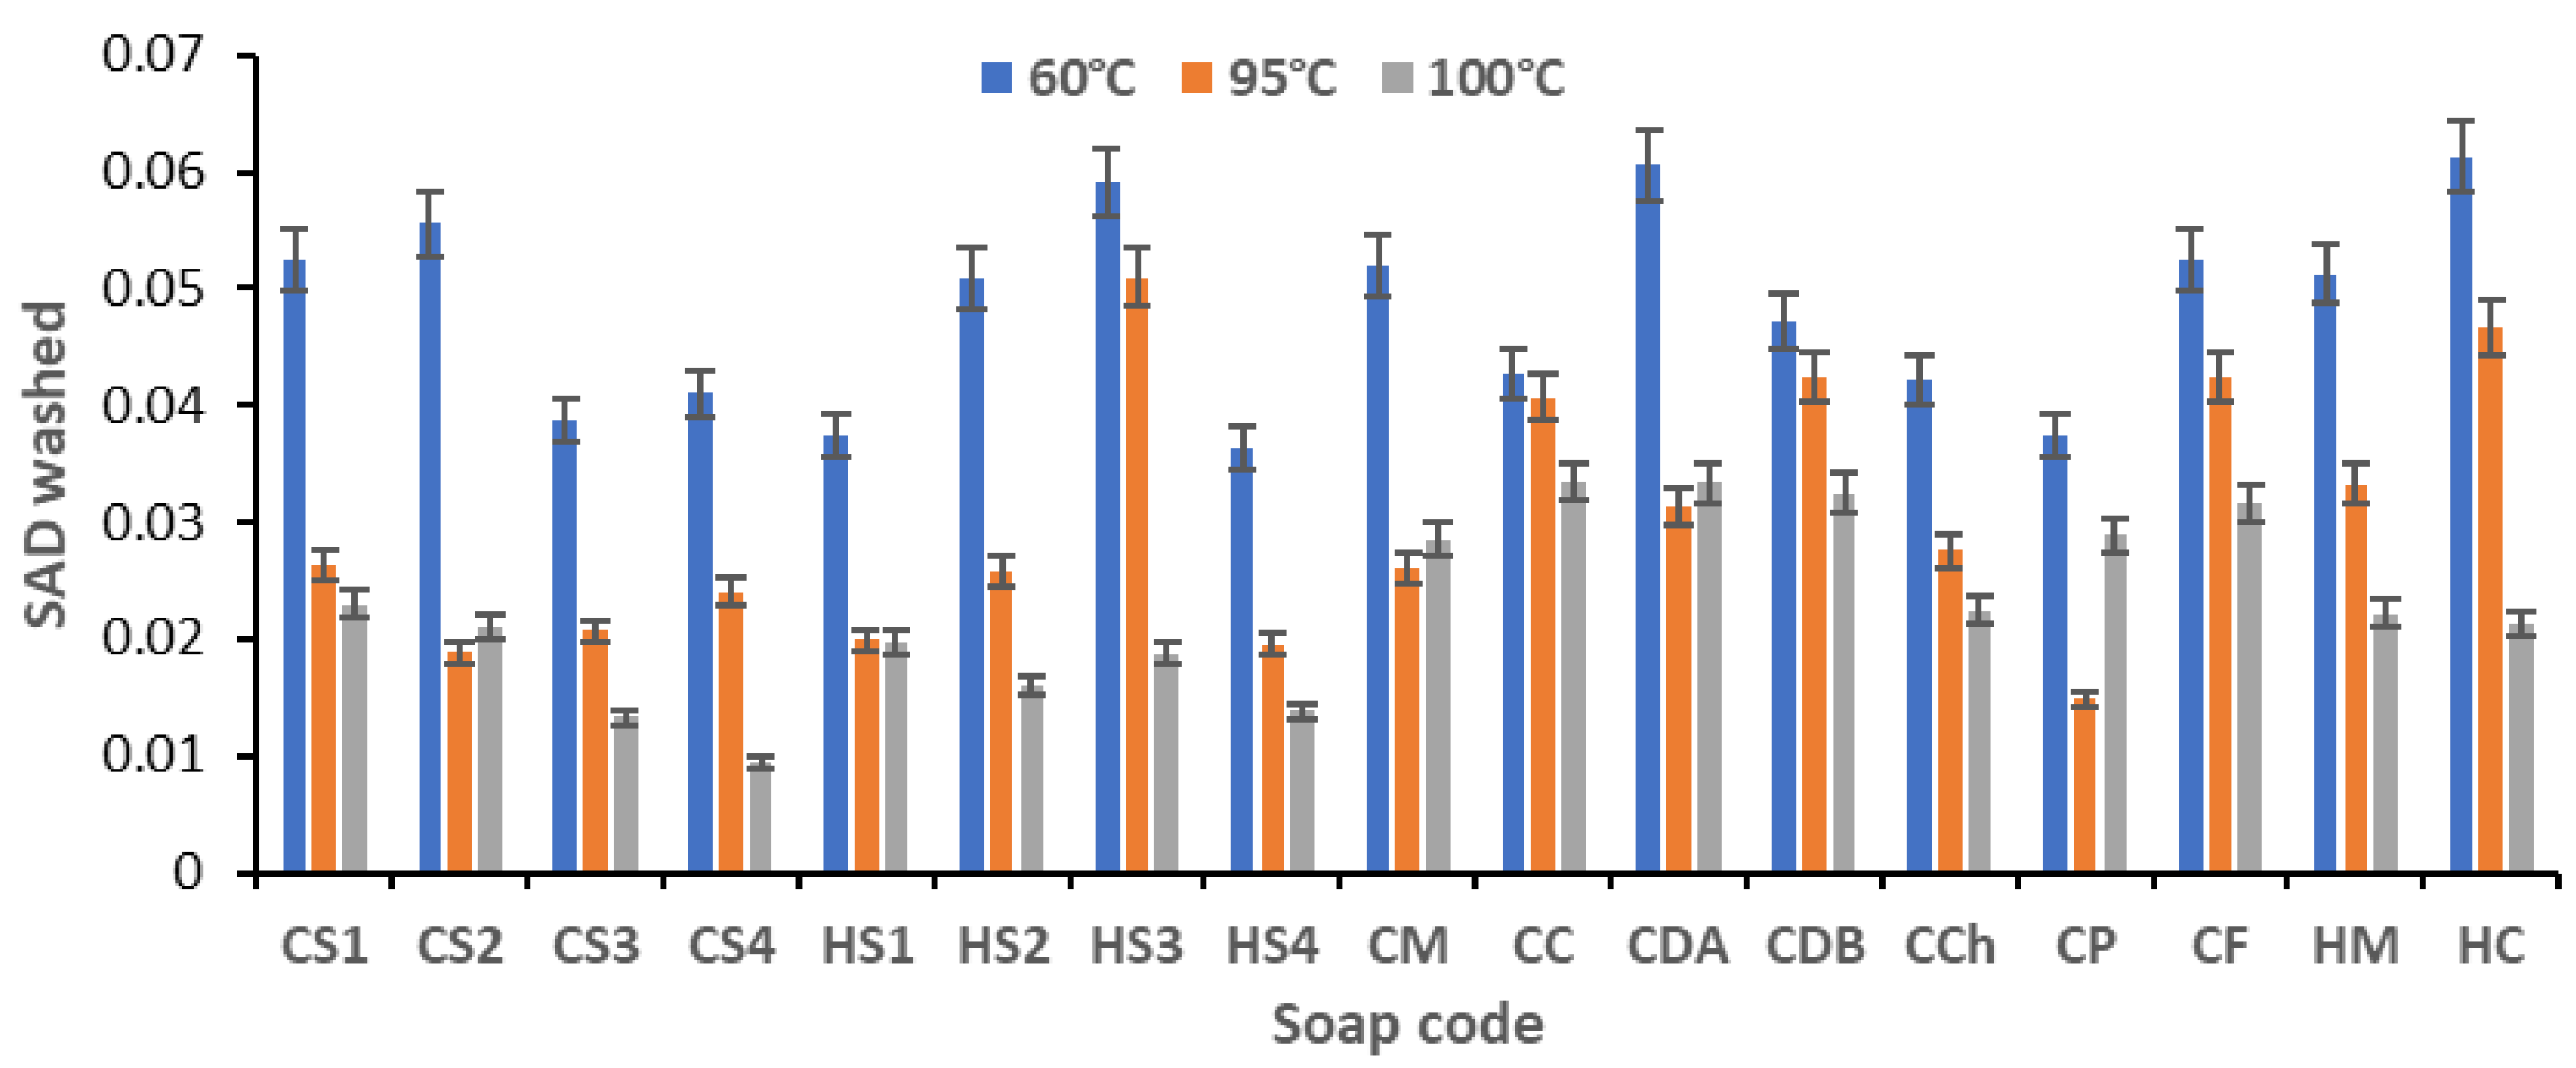
- Soiling Additional Density (SAD);
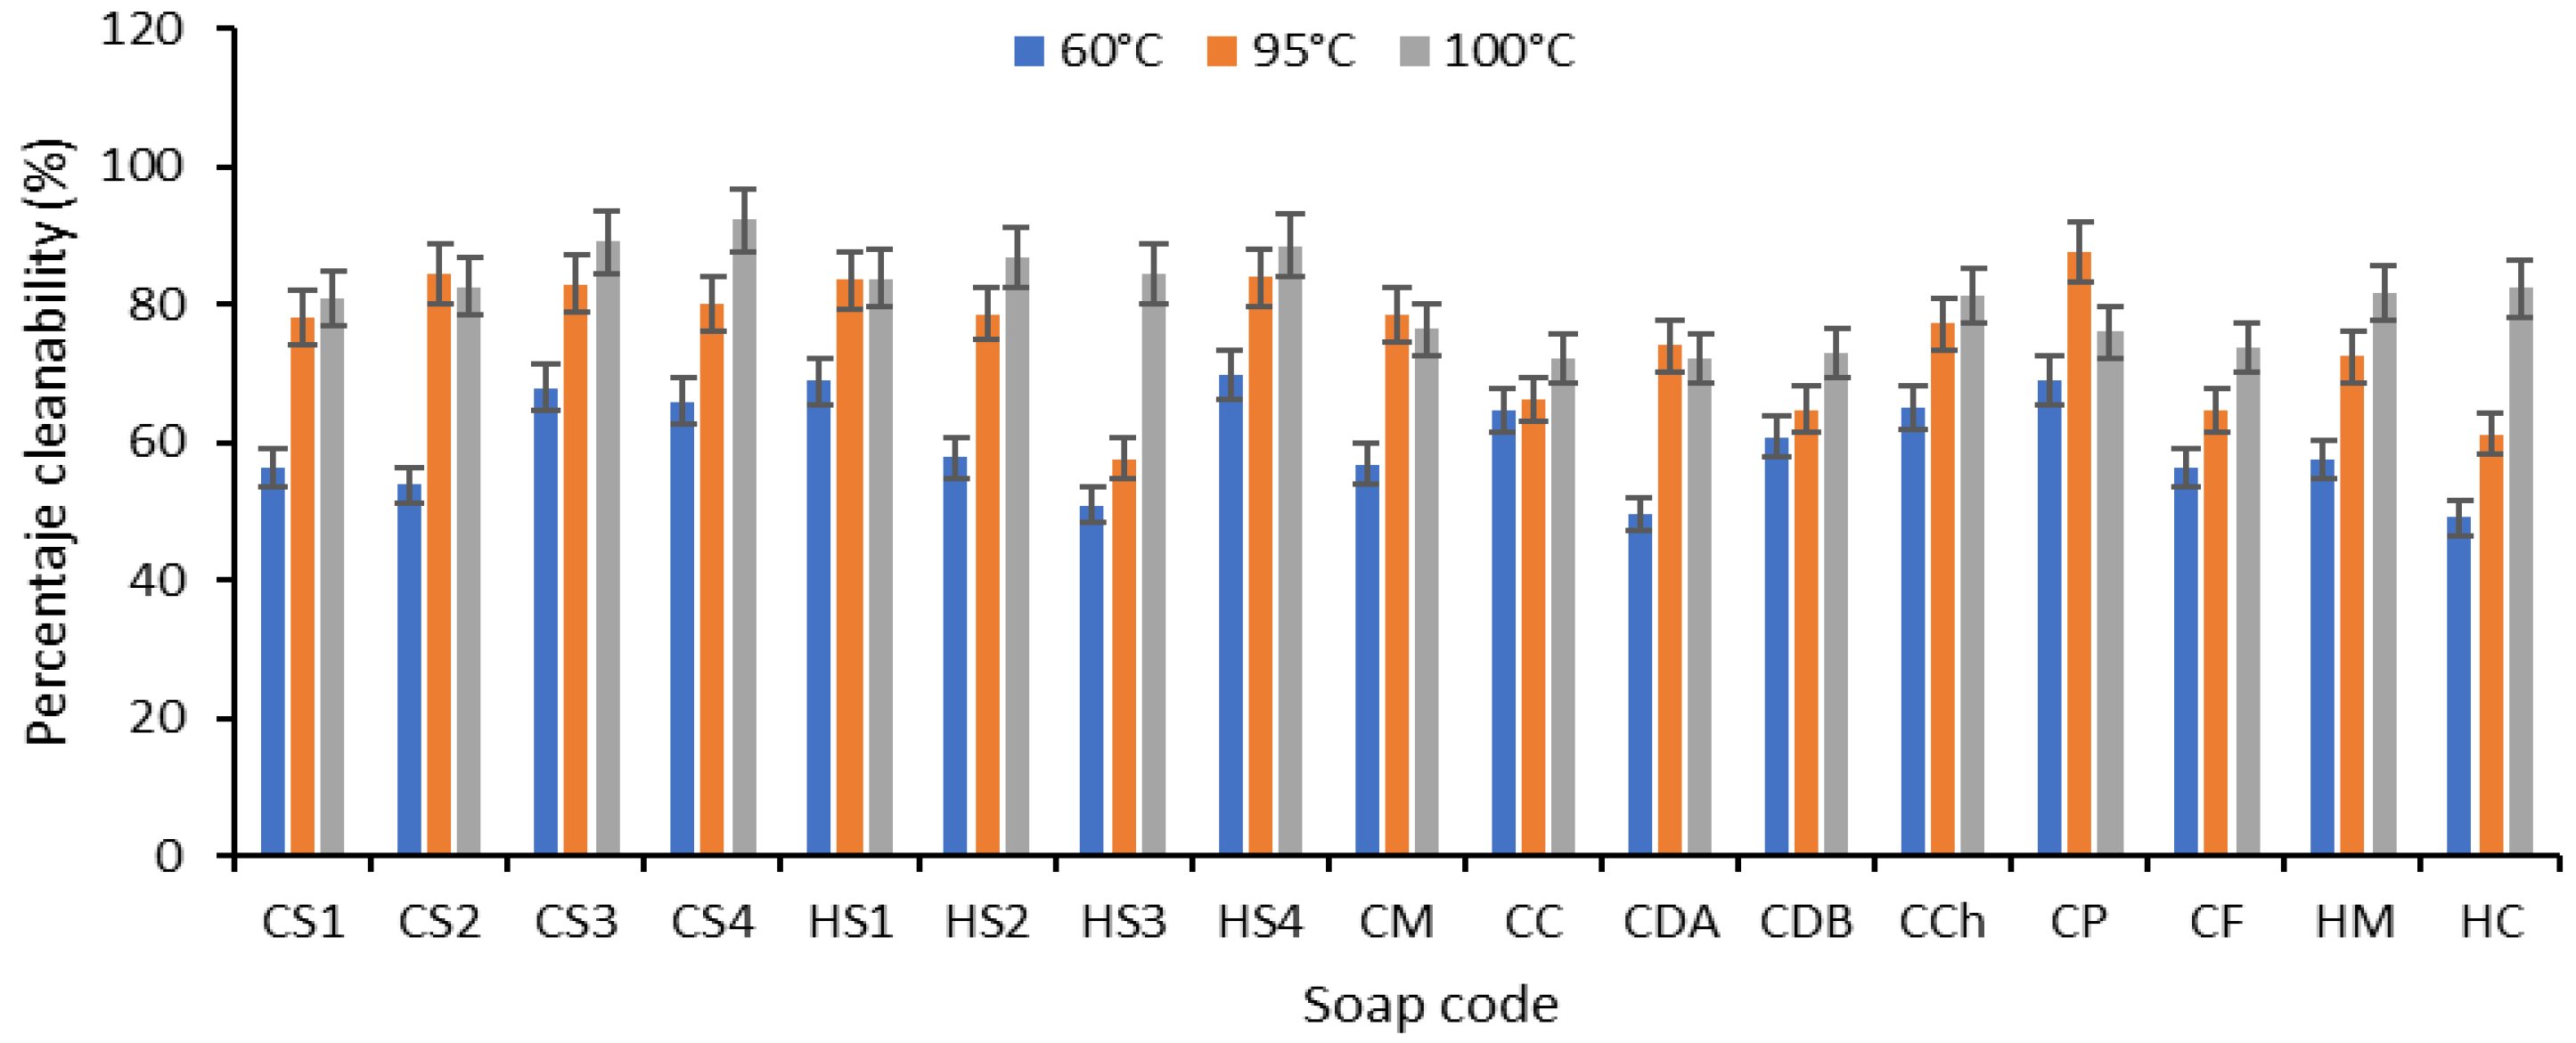
- Percentage cleanability (PC).
2. Materials and Methods
2.1. Experimental Protocol
2.2. Methods and Analyses
2.2.1. Analysis of Vegetable Oils Used in Soap Formulation
Determination of Saponification Value (SAP) of Oils
Iodine Number (IN)
- Cleansing capacity: when the IN value of the triglycerides is higher (as a measure of the unsaturation of the component fatty acids), the cleansing capacity of soap is higher; in this case, the soaps have a greater capacity to extract/displace and emulsify oils and dirt.
- Texture and hardness: Low IN values often occur with saturated fats and indicate the attainment of harder and more solid soaps at room temperature. High IN values are specific to unsaturated fats and indicate the creation of softer soaps.
- Stability and durability: high IN values indicate a risk of rancidity, which is caused by the oxidation of unsaturated fatty acids and can be accelerated by factors such as exposure to light, heat, and air; in this case, the soap has a shorter shelf life [65].
Saponification Iodine Number (INS)
Analysis of the Mixture of Oils in Soap: SAP, IN and INS of Oil Mixture
2.2.2. Analyses Confirming the Presence of Essential Oil in Soap
2.2.3. Analyses Indicating the Physical Characteristics of Soap
- For each analyzed sample, the color is measured (as L*, a* and b*) in 5 points of the sample and the device indicates the average of the results, which is subsequently taken into account in various calculations or comparisons.
- Each sample (soap or cotton sample washed after soiling) is reproduced 5 times (under the same working conditions); then, its color is measured.
- The data resulting from the 5 copies are used to calculate the color differences from the standard.
- The arithmetic mean of the 5 color differences is calculated and, subsequently, so is the root mean square.
2.2.4. Analyses Indicating the Quality and Effectiveness of the Soap
Efficiency of Soaps Revealed After Washing the Soiled Samples
- Hidden stain visibility after washing (Hs);
- Soiling Additional Density (SAD);
- Percentage cleanability (PC).
The Presence of Residual Essential Oil in the Washed Sample
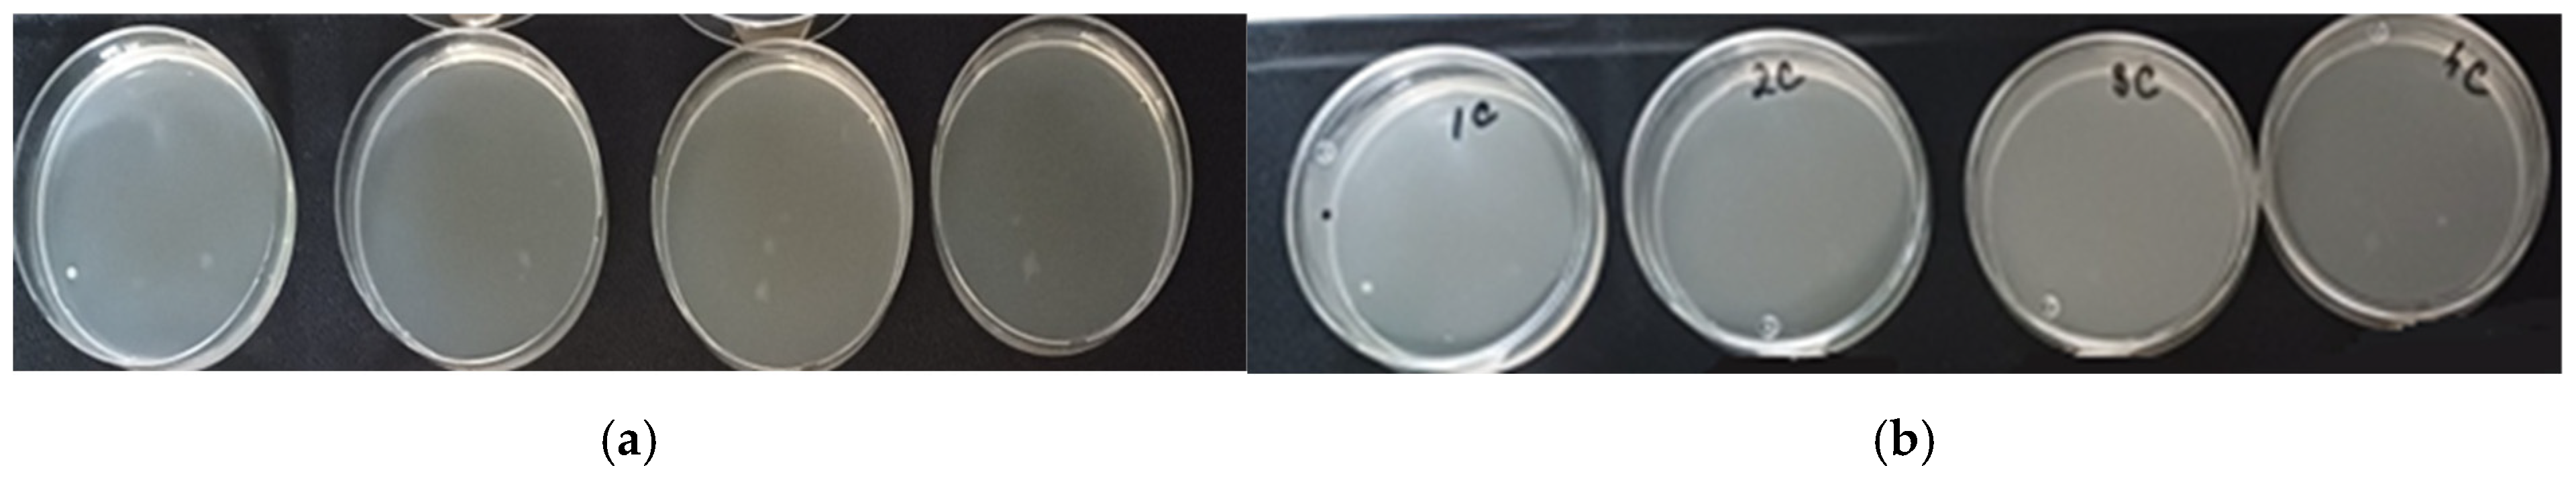
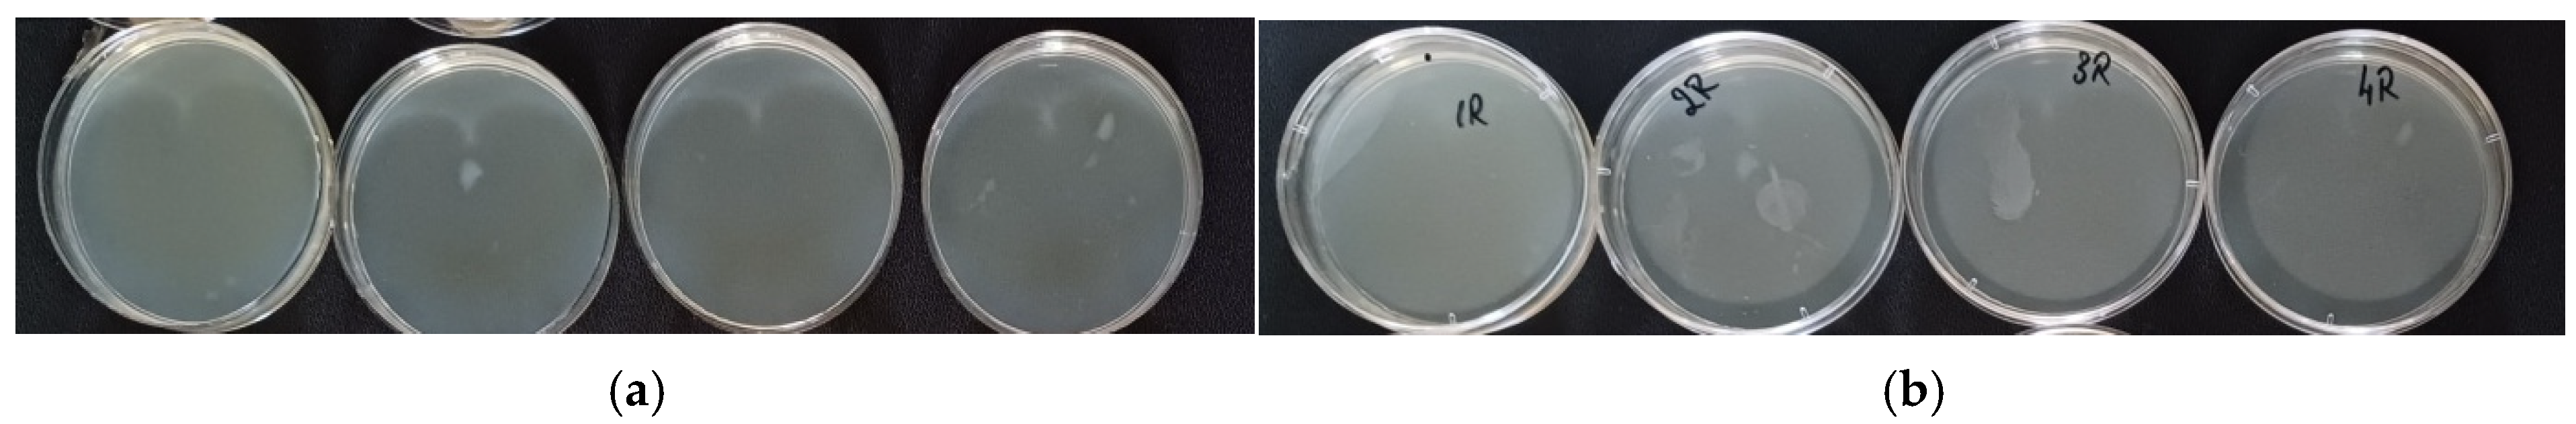
Method for Determining Antimicrobial Capacity
2.3. Statistical Analysis
3. Results and Discussion
3.1. Characterization of Oils Used in Soap Formulation
- -
- Coconut oil: It is a mixture of saturated (89%) and unsaturated (11%) fatty acids, of which lauric acid, myristic acid and palmitic acid predominate. The lack of double bonds in the chemical structures of some of the constituent fatty acids gives coconut oil a solid, white consistency [72]. In addition to fatty acids, coconut oil also contains other organic substances, such as phytosterols, vitamins (E and K) and antioxidants. The exact composition of coconut oil may vary depending on its origin and processing.
- -
- Olive oil: Unlike coconut oil, unsaturated fatty acids predominate in olive oil (83%), the rest being saturated (17%). Olive oil is a greenish yellow liquid rich in oleic acid, which has 18 carbon atoms in the molecule and one unsaturation. The components of the polyphenol type, Tocopherols and Tocotrienols (Vitamin E), give olive oil important antioxidant capacities [73,74].

| Vegetal Oil | Oil Percent [%] | SAP (mg KOH/g Oil) | SAPstandard (mg KOH/g oil) | IN (g Iodine/100 g Oil) | INstandard (g Iodine/100 g Oil) | INS |
|---|---|---|---|---|---|---|
| Olive pomace oil | 70.42 | 184.66 | 182–193 [75] | 84.07 | 75–92 [75] | 100.59 |
| Coconut oil 76 degrees | 29.58 | 256.23 | 248–265 [76] | 11.536 | 6–11 [76] | 244.694 |
| Olive pomace oil + Coconut oil 76 degrees | 100 | 205.83 | - | 62.61 | - | 143.22 |
3.2. Confirmation of the Presence of Essential Oil in Soap
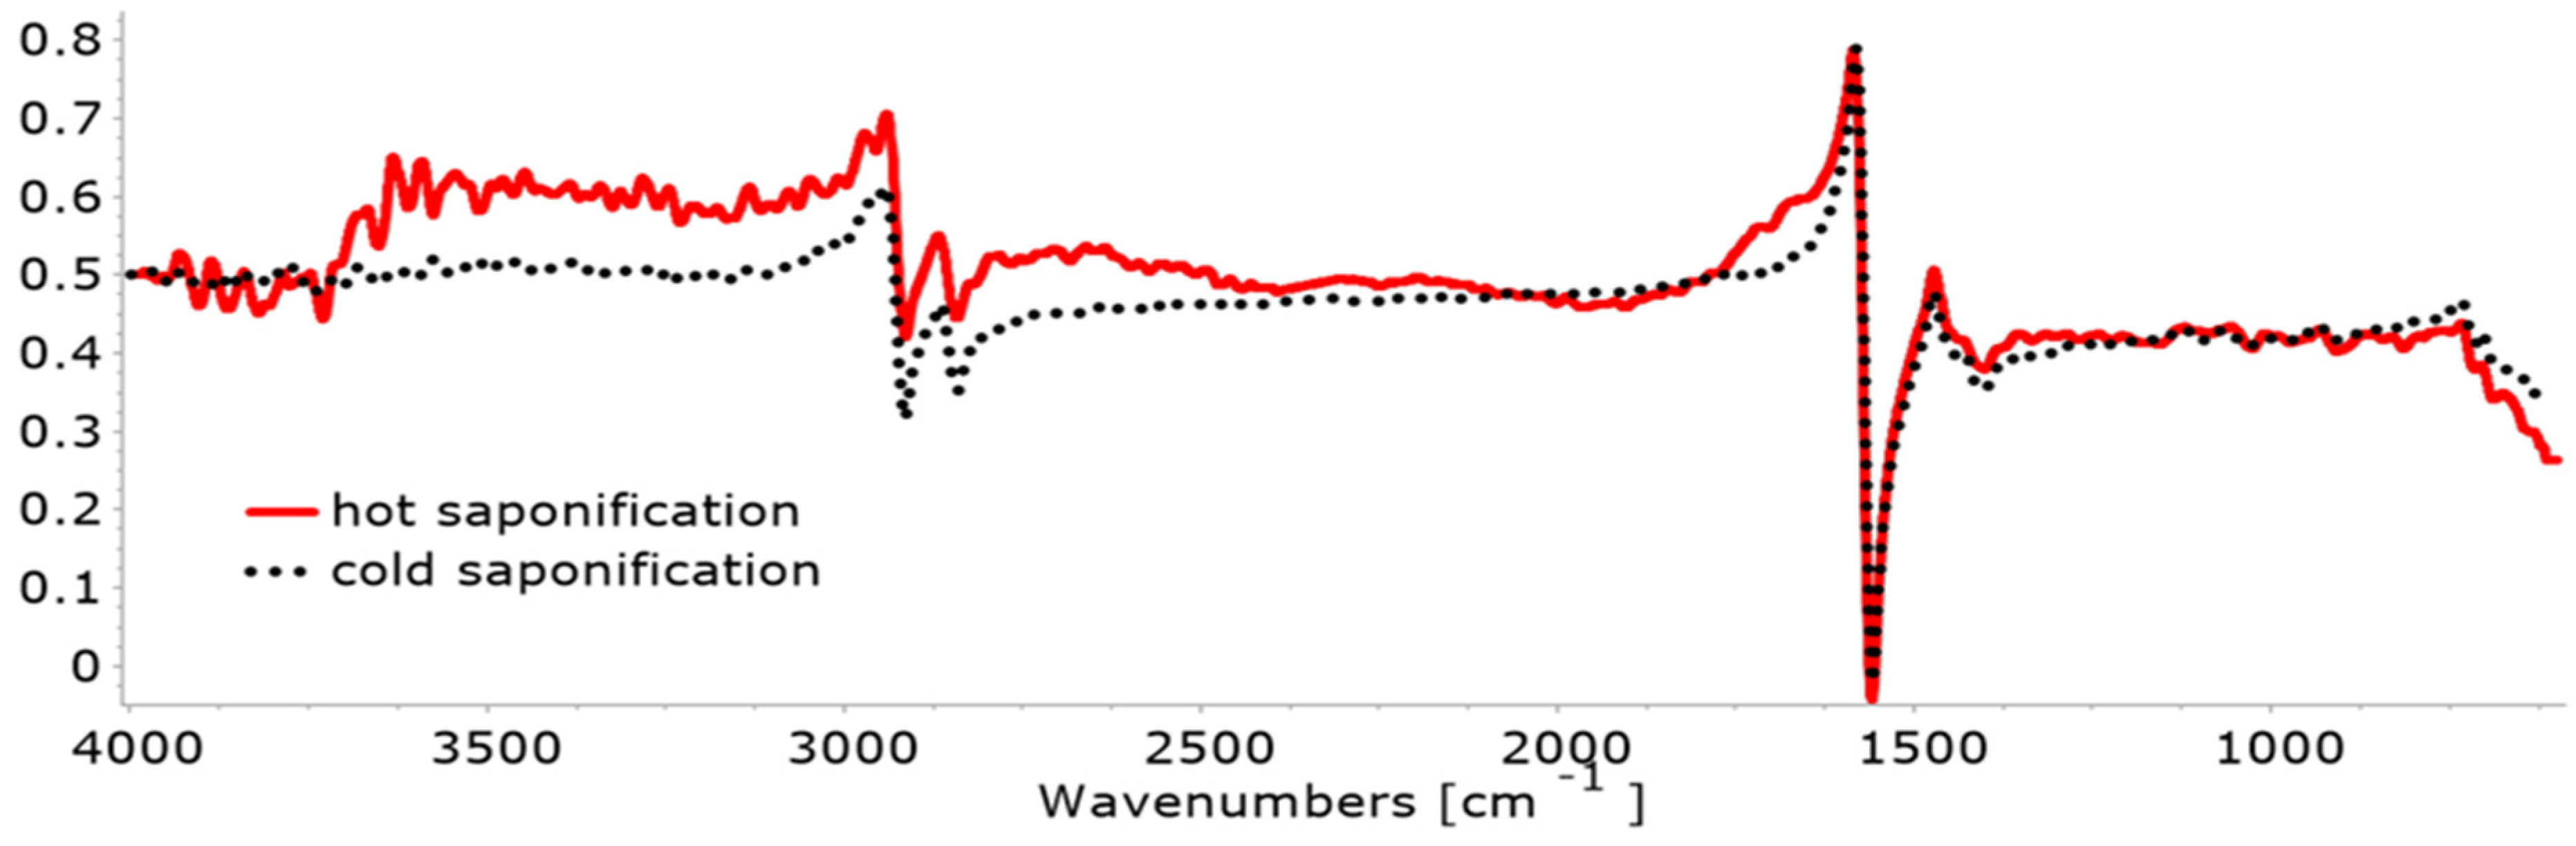
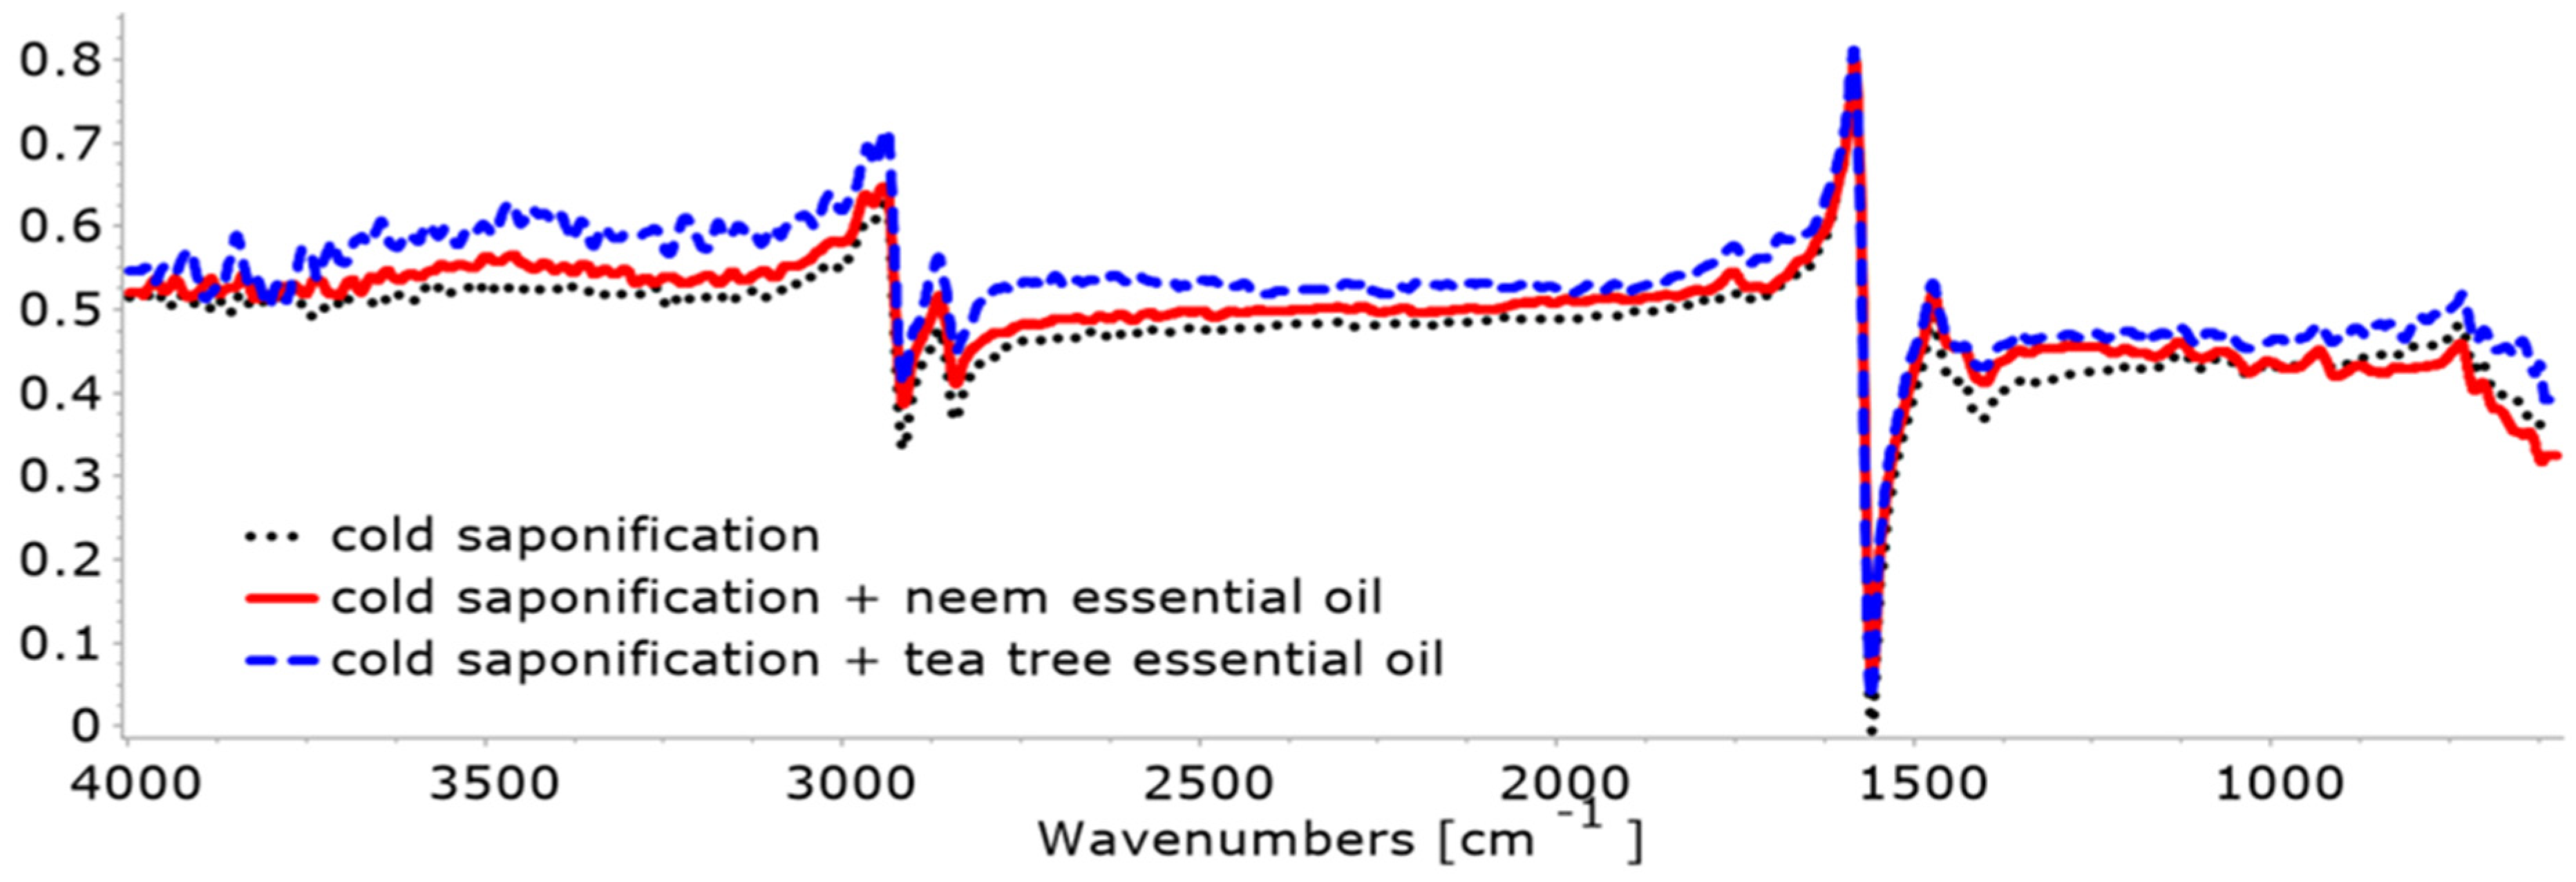
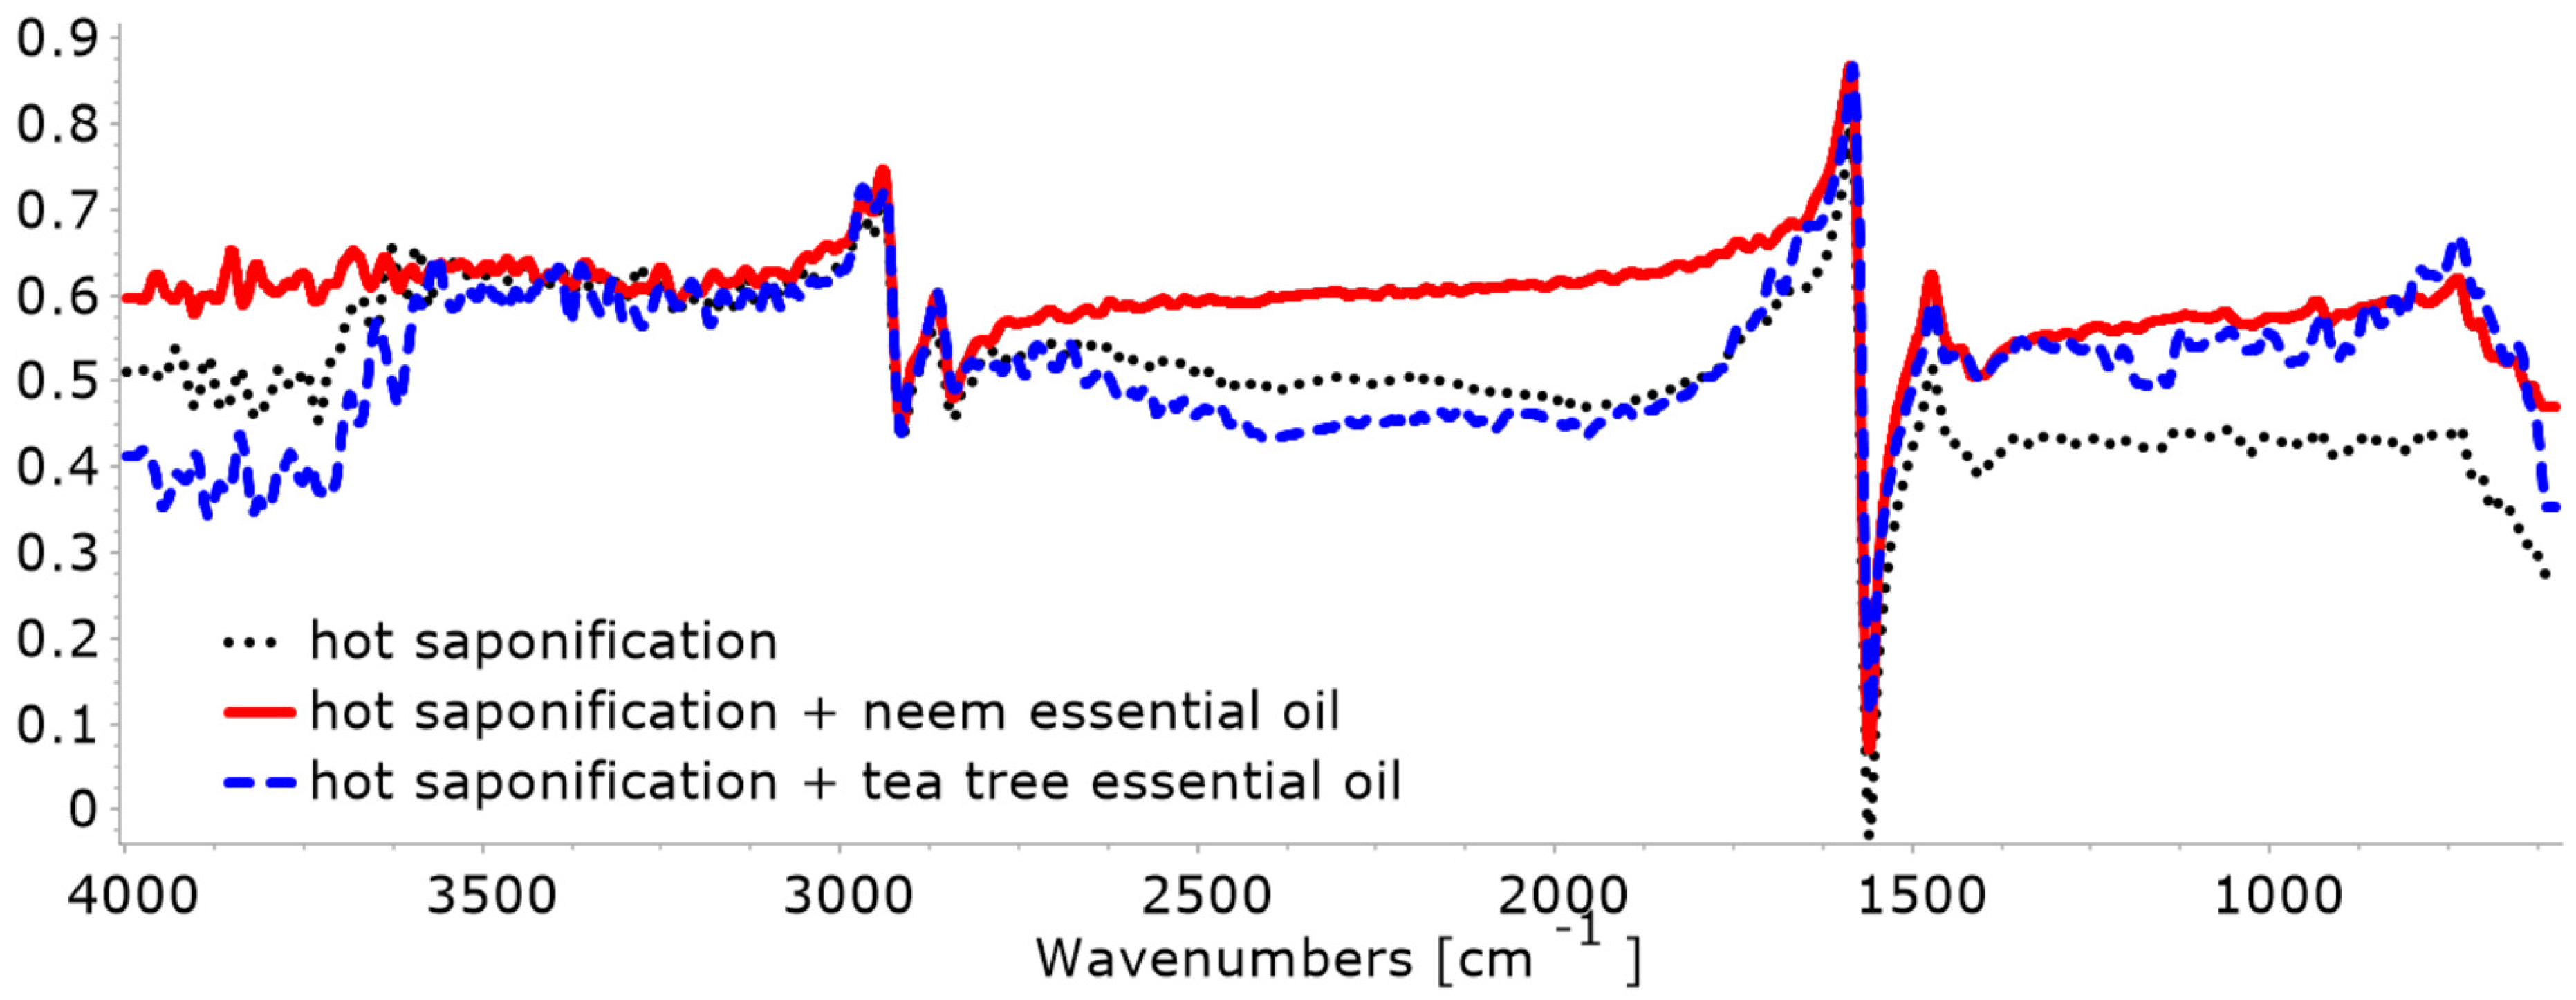
3.2.1. FTIR
3.2.2. EDX Results
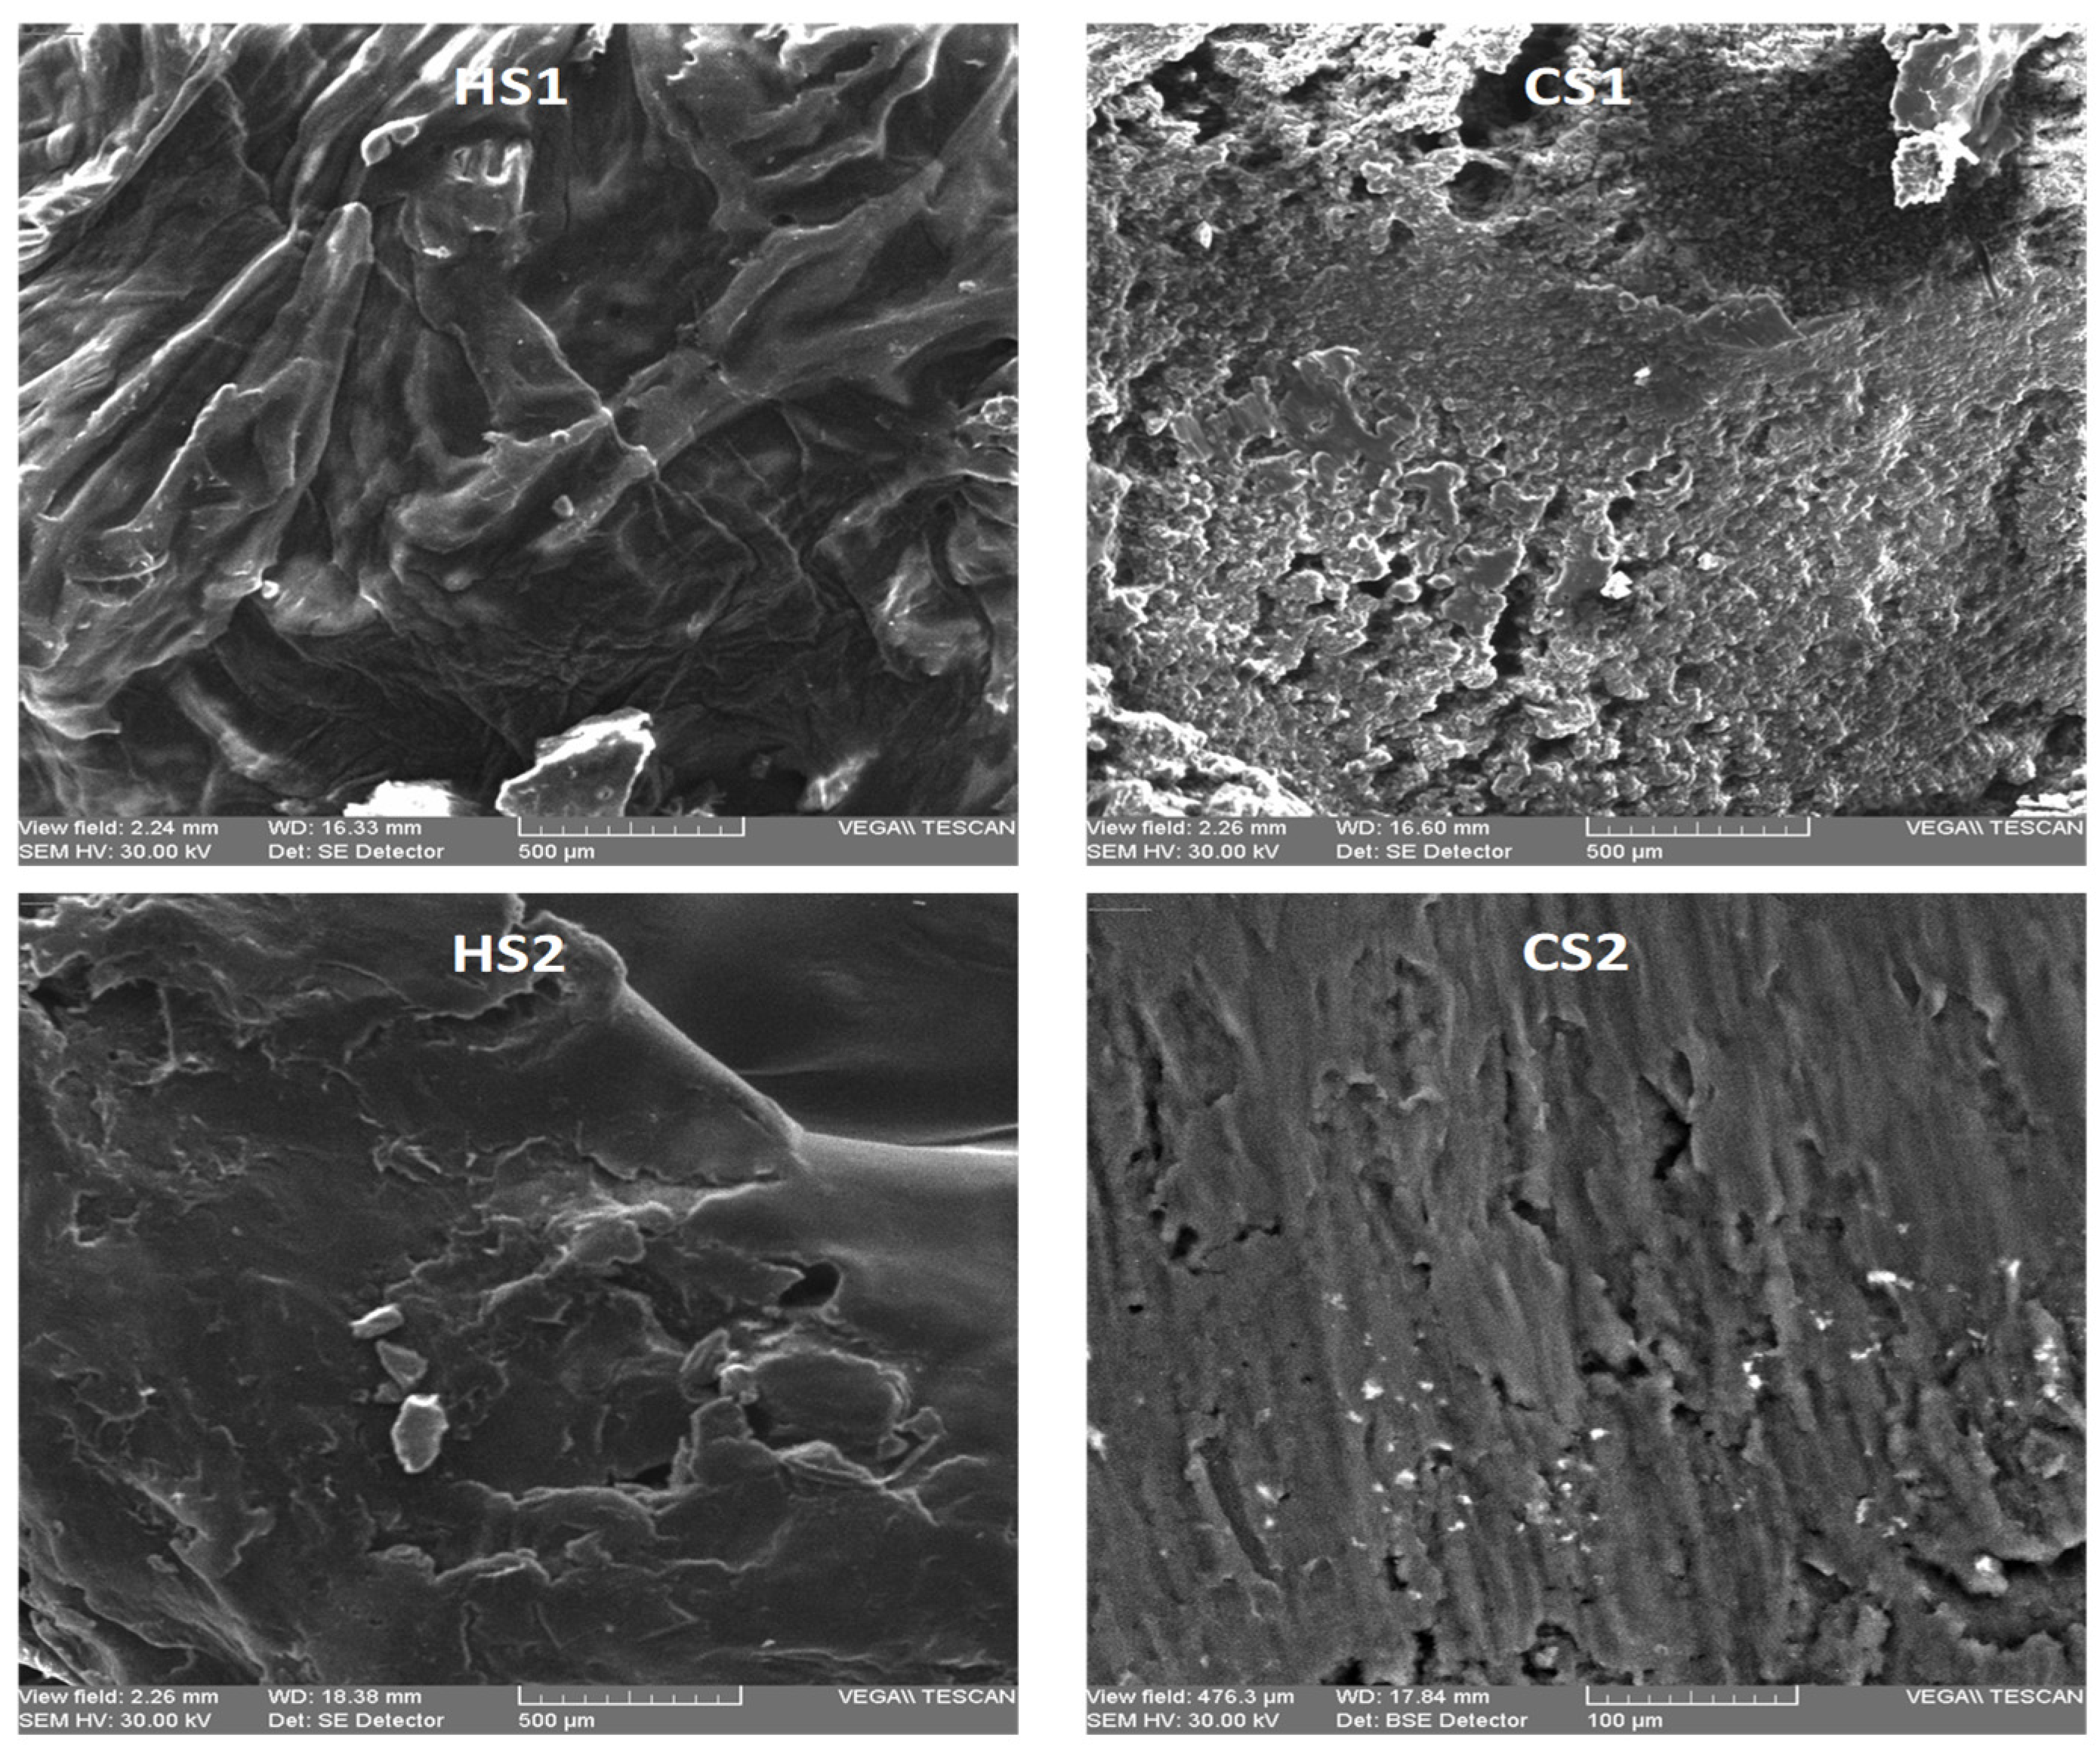
3.2.3. SEM Results
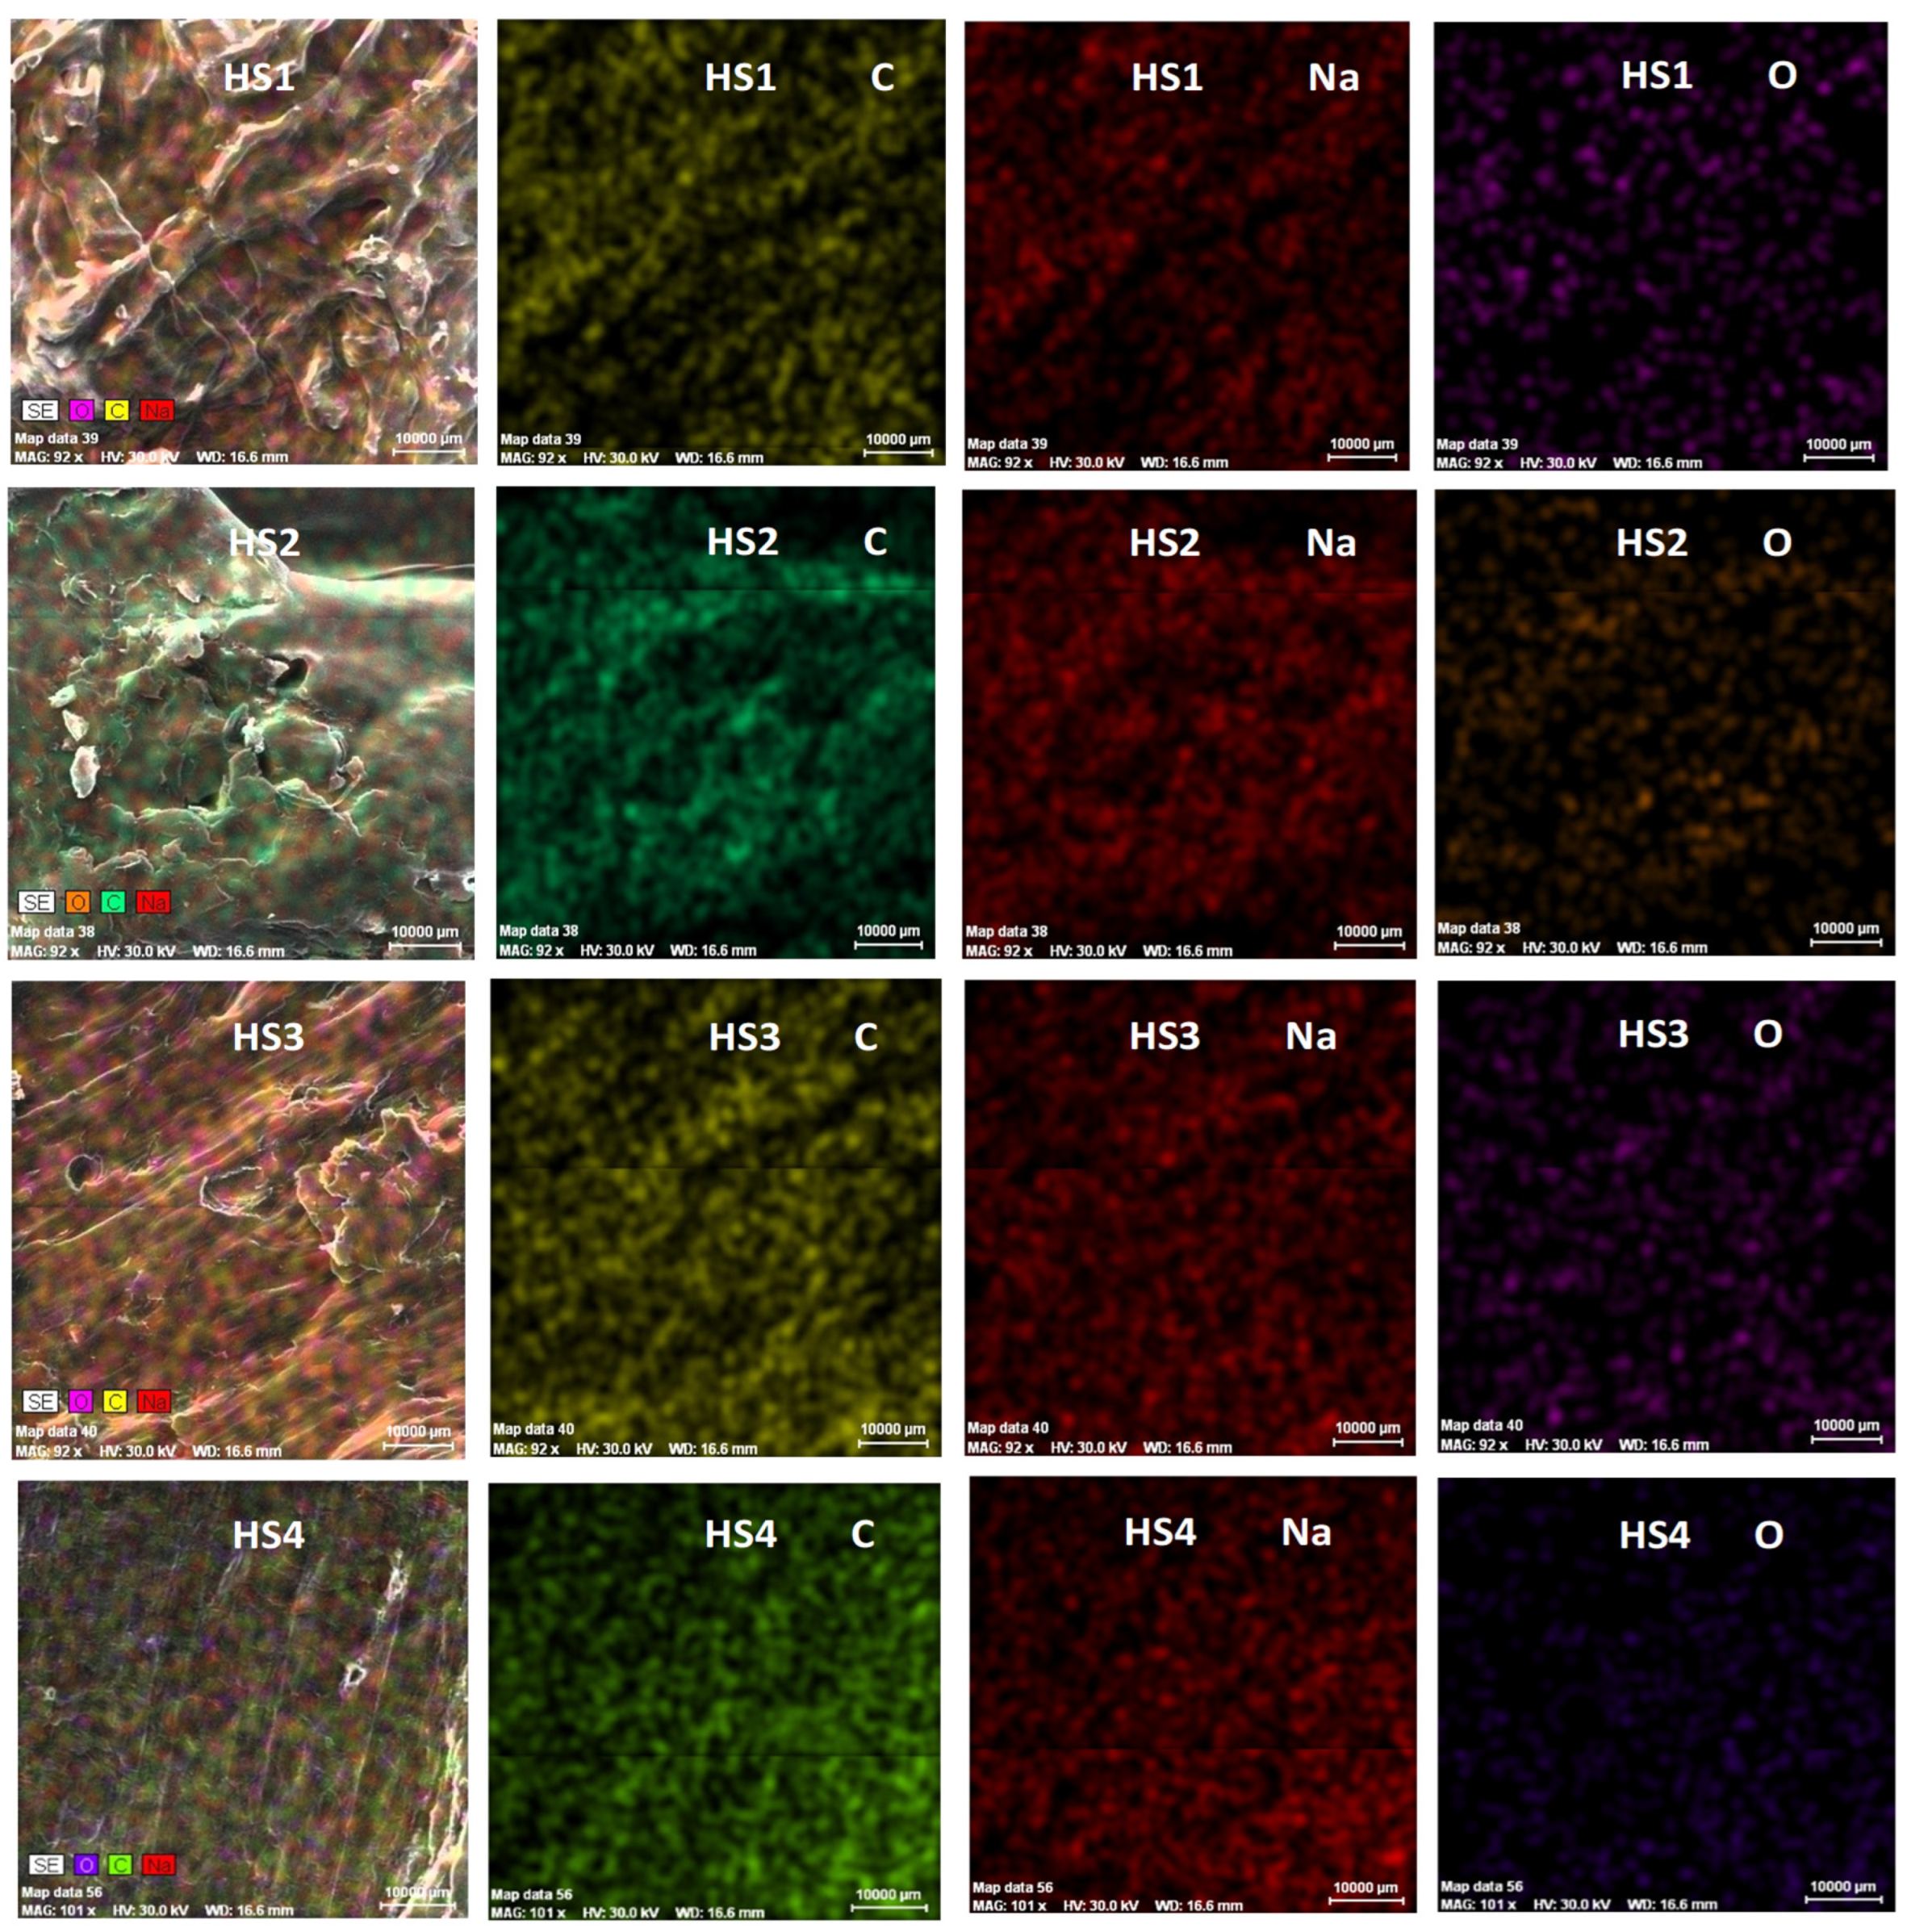
3.2.4. Elemental Mapping Results
3.2.5. Thermal Analyses: Thermogravimetric Analysis (TGA) and Differential Thermal Analysis (DTA)
- In the case of cold saponification: Ease of application, better control of the components in the recipe, no alteration in the quality of the base oils, and better preservation of the properties of the essential oils due to the preservation of compounds susceptible to volatilization because the processing temperature during saponification is low. As regards disadvantages: long ripening time (at least one month) and the risk of degradation of the base oils and essential oil during the ripening period, due to different storage conditions (air, humidity, heat, oxygen).
- In the case of hot saponification, a ripening stage is no longer necessary, resulting in faster soap production. However, part of the volatile components of the essential oil evaporates even if their addition is made at the end of saponification, as the volatilization process cannot be controlled.
- In both saponification processes (hot/cold), glycerin is also a result of the reaction by-product, which, by not being removed, gives laundry soap the ability to improve the feel of washed laundry (as a fabric softener) and reduce electrostatic charge in textiles.
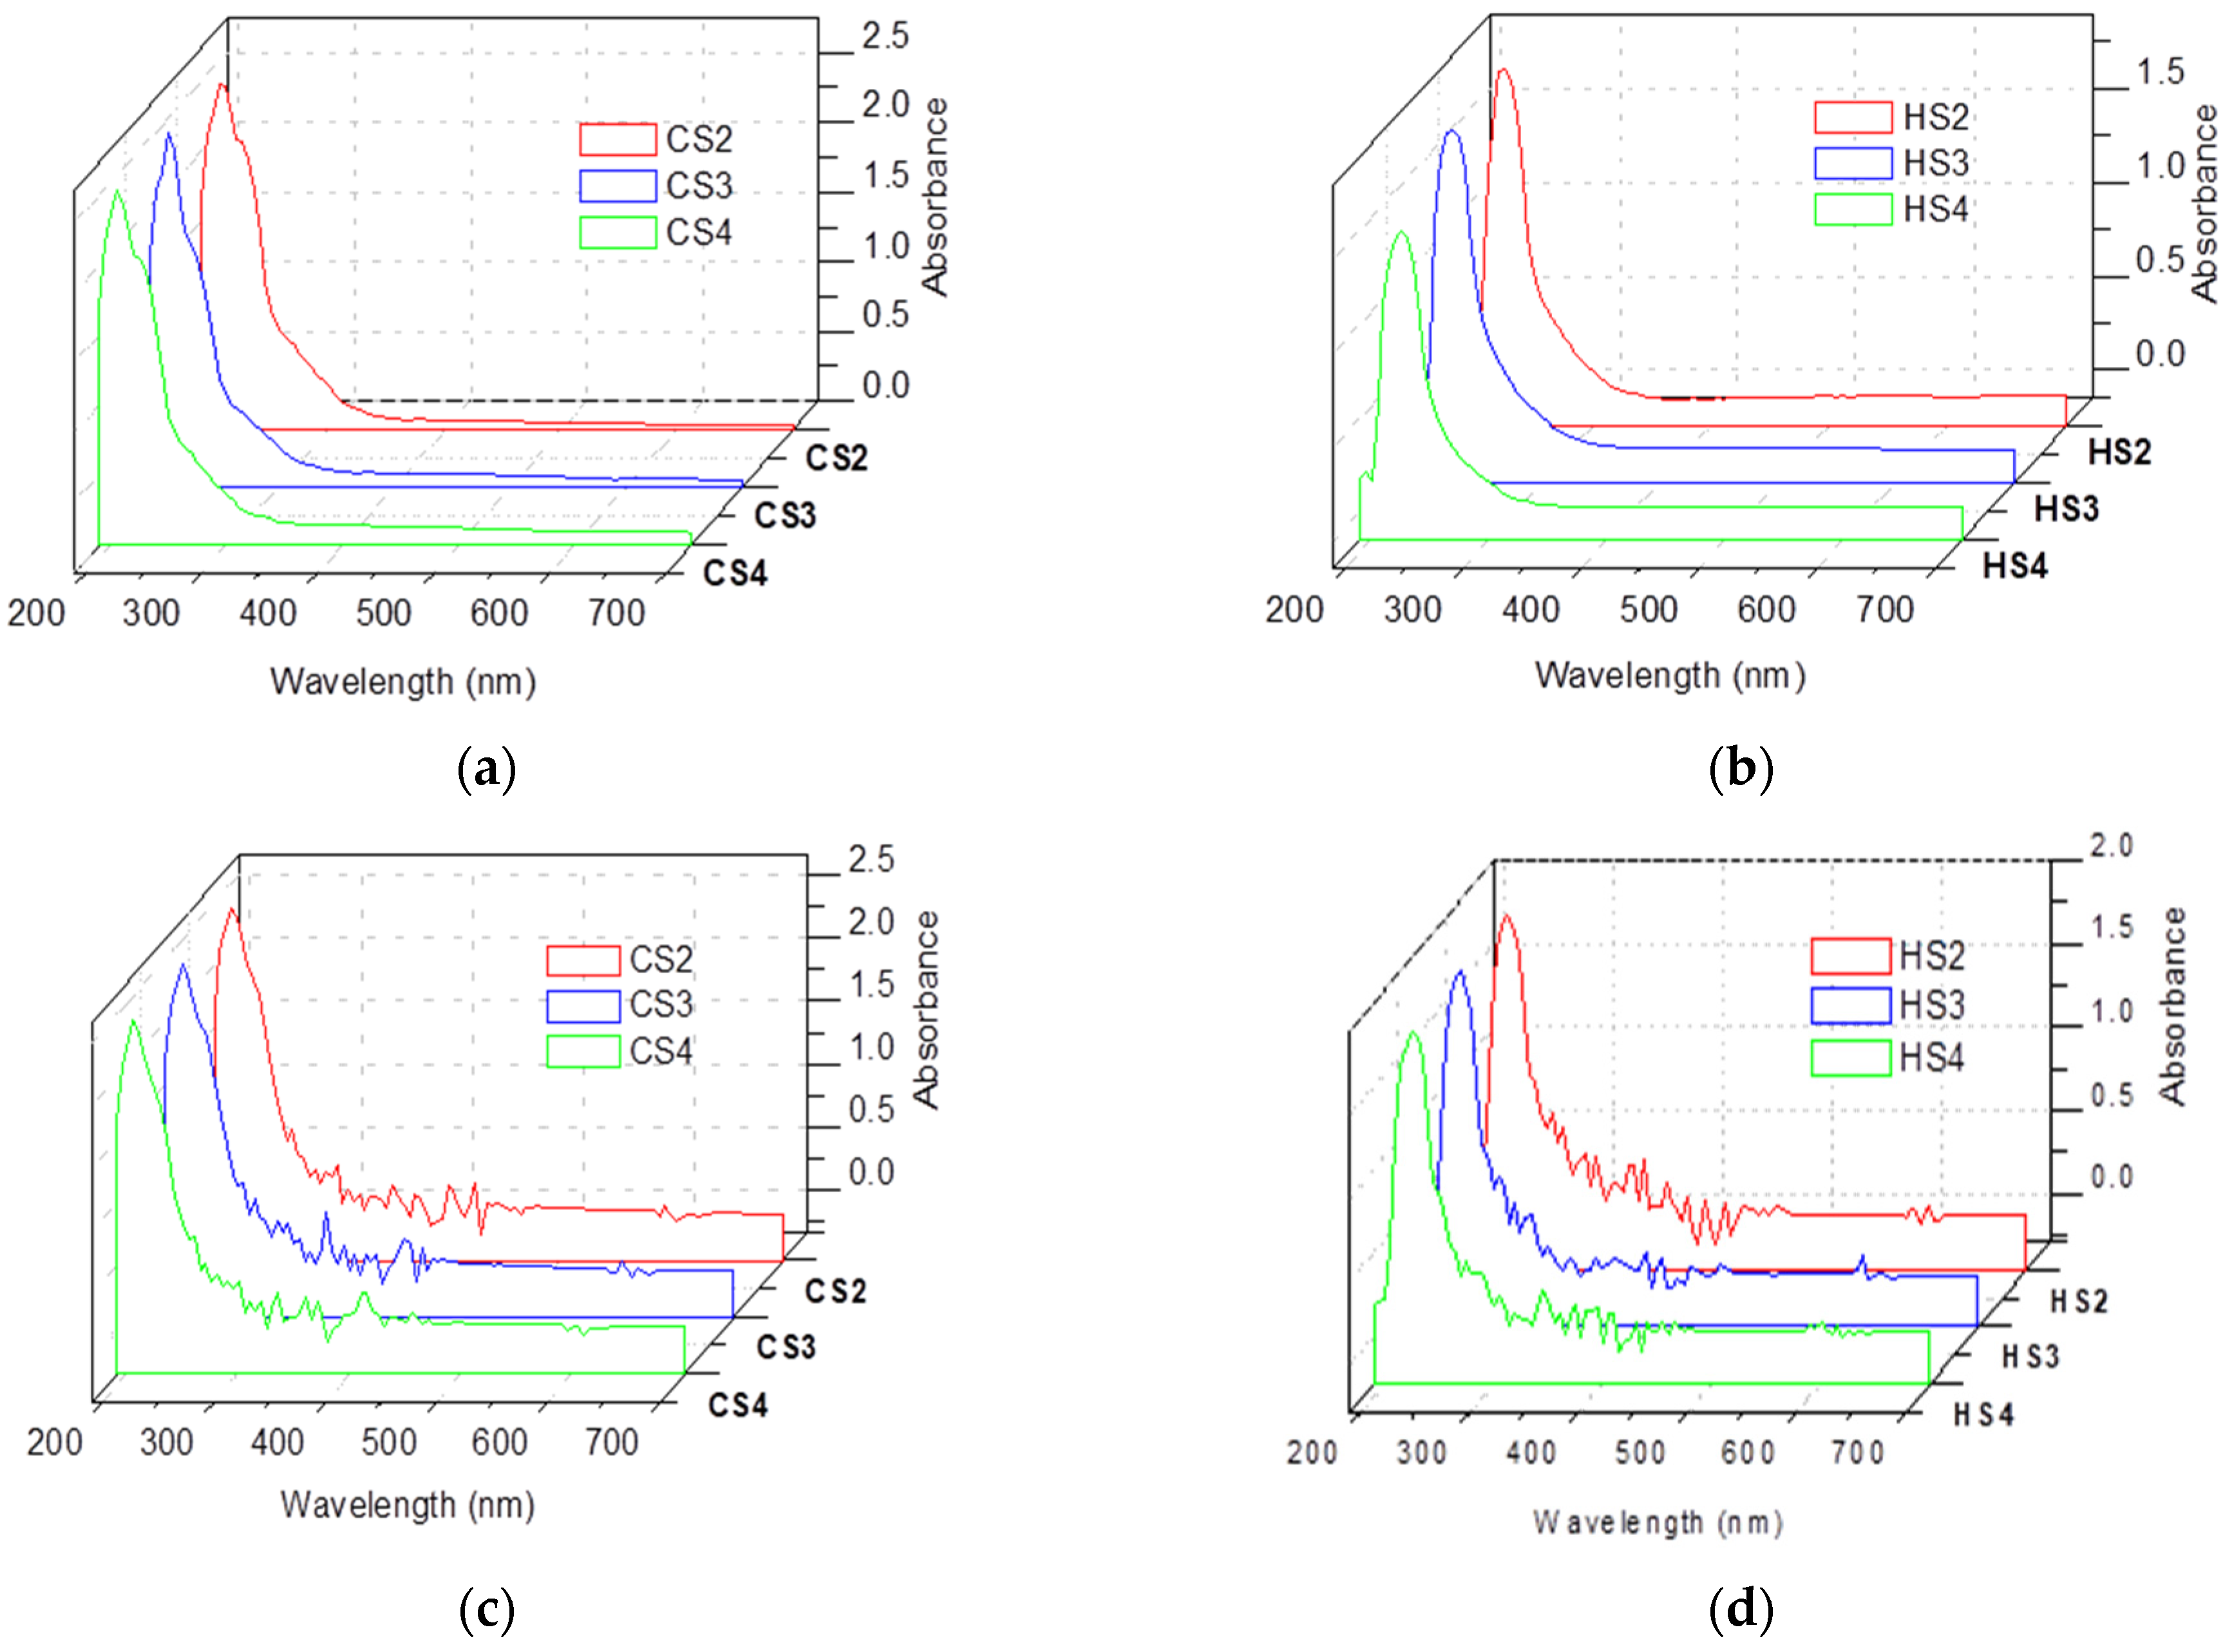
3.3. UV-VIS Results for Soap Solutions
3.4. Soap Characteristics
3.5. The Ability to Clean Fatty Dirt
- The value of the CMC color difference (which is based on the colorimetric principles of the CIE 1976 system) to appreciate the tolerance of the “residual stain” to the cotton sample before dirt. The CMC test stipulates that between the tested sample (dirty but washed with soap) and the control test (before dirt), there should not be a color difference greater than 1. The conclusion of the CMC test is expressed by a qualification: PASS or FAIL [88].
3.6. The Presence of Essential Oil in Soap-Washed Samples
3.7. Antimicrobial Capacity
3.8. Limitations
- It does not account for the long-term instability of volatile essential oil components in the soaps;
- Dermatological testing is absent, which would be beneficial since laundry can be washed both using an automatic washing machine and by hand;
- The lack of antimicrobial capacity testing in clinical settings;
- Lack of a calculation regarding economic efficiency.
4. Conclusions
Supplementary Materials
Author Contributions
Funding
Institutional Review Board Statement
Informed Consent Statement
Data Availability Statement
Acknowledgments
Conflicts of Interest
References
- Achaw, O.W.; Danso-Boateng, E. Chemical and Process Industries with Examples of Industries in Ghana, 1st ed.; Springer Nature: Gewerbestrasse, Switzerland, 2021; pp. 1–39. [Google Scholar]
- Mousavi, S.A.; Khodadoost, F. Effects of detergents on natural ecosystems and wastewater treatment processes: A review. Environ. Sci. Pollut. Res. Int. 2019, 26, 26439–26448. [Google Scholar] [CrossRef]
- Sudheshna, A.A.; Srivastava, M. Laundry Detergents: A potential resource of pollution and over utilization. Lond. J. Press 2022, 22, 15–23. [Google Scholar]
- Pareek, C.; Nirwan, N.; Pareek, G. Chemistry of detergents and their impact on environment. Int. J. Innov. Res. Sci. Eng. Technol. 2014, 3, 17116–17122. [Google Scholar] [CrossRef]
- Kogawa, A.C.; Cernic, B.G.; Domingos do Couto, L.G.; Salgado, H.R.N. Synthetic detergents: 100 years of history. Saudi Pharm. J. 2017, 25, 934–938. [Google Scholar] [CrossRef] [PubMed]
- Warwick, C.; Guerreiro, A.; Soares, A. Sensing and analysis of soluble phosphates in environmental samples: A review. Biosens. Bioelectron. 2013, 41, 1–11. [Google Scholar] [CrossRef]
- Cai, Z.; Hakkinen, P.J. Detergent Encyclopedia of Toxicology, 2nd ed.; Elseiver: Amsterdam, The Netherlands, 2005; pp. 739–742. [Google Scholar]
- Gupta, N.; Seema, S. Impact of laundry detergents on environment-A review. J. ARAHE 2014, 21, 149–158. [Google Scholar]
- Laitala, K.; Kjeldsberg, M. Cleaning effect of alternative laundry products. A comparison of soap nuts, laundry balls, washing pellets, laundry magnets, water and regular detergent. Househ. Pers. Care Today 2012, 7, 53–56. [Google Scholar]
- Chirani, M.R.; Kowsari, E.; Teymourian, T.; Ramakrishna, S. Environmental impact of increased soap consumption during COVID-19 pandemic: Biodegradable soap production and sustainable packaging. Sci. Total Environ. 2021, 796, 149013. [Google Scholar] [CrossRef]
- Ozokan, G.; Bilginer, A. Development of natural castile soaps from vegetable oils. Experimed 2024, 14, 194–202. [Google Scholar] [CrossRef]
- Smulders, E. Laundry Detergents, 1st ed.; Wiley-VCH Verlag GmbH: Weinheim, Germany, 2002; pp. 157–165. [Google Scholar]
- Félix, S.; Araújo, J.; Pires, A.M.; Sousa, A.C. Soap production: A green prospective. Waste Manag. 2017, 66, 190–195. [Google Scholar] [CrossRef]
- Muhammed, H.A.; Abdulrazaq, Y.; Abdullah, S.S.; Adam, A.A. Formulation of laundry soap using locally made palm kernel oil in Nigeria. Dutse J. Pure Appl. Sci. 2022, 8, 51–57. [Google Scholar]
- Lakshmana Prabu, S.; Suriya Prakash, T.N.K.; Thirumurugan, R. Cleaning validation and its regulatory aspects in the pharmaceutical industry. In Developments in Surface Contamination and Cleaning, 2nd ed.; Kohli, R., Mittal, K.L., Eds.; William Andrew Publishing: Oxford, UK, 2015; pp. 129–186. [Google Scholar] [CrossRef]
- Fernandez, R.X.E.; Shier, N.W.; Watkins, B.A. Effect of alkali saponification, enzymatic hydrolysis and storage time on the total carotenoid concentration of Costa Rican crude palm oil. J. Food Compos. Anal. 2000, 13, 179–187. [Google Scholar] [CrossRef]
- Fagundes, M.B.; Alvarez-Rivera, G.; Vendruscolo, R.G.; Voss, M.; Arrojo da Silva, P.; Barin, J.S.; Jacob-Lopes, E.; Zepka, L.Q.; Wagner, R. Green microsaponification-based method for gas chromatography determination of sterol and squalene in cyanobacterial biomass. Talanta 2021, 224, 121793. [Google Scholar] [CrossRef]
- García-González, A.; Velasco, J.; Velasco, L.; Ruiz-Méndez, M.V. An analytical simplification for faster determination of fatty acid composition and phytosterols in seed oils. Food Anal. Methods 2018, 11, 1234–1242. [Google Scholar] [CrossRef]
- Hoque, A.; Tanbi, T.A.; Saha, N.; Howlader, S.; Sarker, N.; Chowdhury, A.I.; Bandyopadhyay, A.; Islam, S.; Bakar, M.A.; Alam, N.E.; et al. Assessing trace metal-based human health risks for commonly used body soaps in Bangladesh. Biol. Trace Elem. Res. 2024, 202, 4802–4812. [Google Scholar]
- Russo, S.; Brambilla, L.; Thomas, J.B.; Joseph, E. But aren’t all soaps metal soaps? A review of applications, physico-chemical properties of metal soaps and their occurrence in cultural heritage studies. Herit. Sci. 2023, 11, 172. [Google Scholar]
- Subramanian, V.; Shah, P. Soap Bars Comprising Insoluble Multivalent Ion Soap Complexes European Patent Specification. EP1 885 835 B1, 4 November 2009. [Google Scholar]
- Rapa, M.; Ciano, S. A Review on life cycle assessment of the olive oil production. Sustainability 2022, 14, 654. [Google Scholar] [CrossRef]
- Getachew, M.; Gebre, T. Life Cycle Analysis of Star Soap and Detergents Factory; PROJECT 2013; Institute of Urban Development Studies: Addis Ababa, Ethiopia, 2013; Available online: https://www.researchgate.net/publication/331927720_Life_Cycle_Analysis_of_Star_Soap_and_Detergents (accessed on 16 January 2025).
- Van Hoof, G.; Schowanek, D.; Feijtel, T.C.J. Comparative Life-Cycle Assessment of Laundry Detergent Formulations in the UK. Tenside Surf. Det. 2003, 40, 266–275. [Google Scholar]
- Mezzanotte, V.; Venturelli, S.; Paoli, R.; Collina, E.; Romagnoli, F. Life Cycle Assessment of an industrial laundry: A case study in the Italian context. Clean. Environ. Syst. 2025, 16, 100246. [Google Scholar] [CrossRef]
- Saravanan, A.; Thamarai, P.; Deivayanai, V.C.; Karishma, S.; Shaji, A.; Yaashikaa, P.R. Current strategies on bioremediation of personal care products and detergents: Sustainability and life cycle assessment. Chemosphere 2024, 354, 141698. [Google Scholar]
- Kora, A.J. Plant saponin biosurfactants used as soap, hair cleanser, and detergent in India. In Applications of Next Generation Biosurfactants in the Food Sector; Inamuddin, Adetunji, C.O., Eds.; Academic Press: Cambridge, MA, USA, 2023; pp. 459–477. [Google Scholar] [CrossRef]
- Villota-Paz, J.M.; Osorio-Tejada, J.L.; Morales-Pinzon, T. Comparative life cycle assessment for the manufacture of bio-detergents. Environ. Sci. Pollut. Res. 2023, 30, 34243–34254. [Google Scholar] [CrossRef]
- Tomšič, B.; Ofentavšek, l.; Fink, R. Toward sustainable household laundry. Washing quality vs. environmental impacts. Int. J. Environ. Health Res. 2024, 34, 1011–1022. [Google Scholar] [CrossRef] [PubMed]
- Zahran, H.A. From Fat to Foam: The fascinating world of soap chemistry and technology. Egypt. J. Chem. 2024, 67, 9–17. [Google Scholar] [CrossRef]
- Miron (Stanescu), V.G.; Mancași, N.V.; Popescu, V.; Popescu, A. A physico-chemical characteristics of some ecological products used for textile care. Bul. Inst. Polit. Iasi 2025, 71, 101–112. [Google Scholar] [CrossRef]
- Vidal, N.P.; Adigun, O.A.; Pham, T.H.; Mumtaz, A.; Manful, C.; Callahan, G.; Stewart, P.; Keough, D.; Thomas, R.H. The Effects of cold saponification on the unsaponified fatty acid composition and sensory perception of commercial natural herbal soaps. Molecules 2018, 23, 2356. [Google Scholar] [CrossRef]
- Sebranek, J.G.; Neel, S. Rancidity and antioxidants. In WFLO Commodity Storage Manual; World Food Logistics Organization: Alexandria, VA, USA, 2008; pp. 1–3. [Google Scholar]
- Classic Bells. Rancidity and DOS (Dreaded Orange Spots). Available online: https://classicbells.com/soap/rancidity.asp (accessed on 30 January 2025).
- Bhoyar, A. Rancidity in Fats and Oils: Considerations for Analytical Testing. 2023. Available online: https://ew-nutrition.com/rancidity-fats-oils-considerations-analytical-testing/ (accessed on 15 March 2025).
- Berger, K.G. Practical measures to minimize rancidity in processing and storage. In Rancidity in Foods, 3rd ed.; Allen, J.C., Hamilton, R.J., Eds.; Blackie Academic & Professional: Glasgow, UK, 1994; pp. 68–83. [Google Scholar]
- Hamilton, R.J. The Chemistry of Rancidity in Foods. In Rancidity in Foods, 3rd ed.; Allen, J.C., Hamilton, R.J., Eds.; Blackie Academic & Professional: London, UK, 1994; pp. 1–21. [Google Scholar]
- Rossel, J.B. Measurement of rancidity. In Rancidity in Foods, 3rd ed.; Allen, J.C., Hamilton, R.J., Eds.; Chapman and Hall: Glasgow, UK, 1994; pp. 22–53. [Google Scholar]
- Alum, B.N. Saponification process and soap chemistry. INOSR Appl. Sci. 2024, 12, 51–56. [Google Scholar] [CrossRef]
- Abdulkadir, A.G.; Jimoh, W.L.O. Comparative analysis of physico-chemical properties of extracted and collected palm oil and tallow. Chem. Search J. 2013, 4, 44–54. [Google Scholar]
- Dabhade, P.N.; Pathan, S.C. Synthesis and comparison of cleaning power of edible oil soaps with commercial detergents. J. Emerg. Technol. Innov. Res. 2020, 7, 723–725. [Google Scholar]
- Chryssou, K.; Stassinopoulou, M.; Lampi, E. Analysis and identification of two soaps by infrared absorption spectra and reflectance graphs. Ann. Chem. Sci. Res. 2019, 1, 1–7. [Google Scholar] [CrossRef]
- Winska, K.; Maczka, W.; Lyczko, J.; Grabarczyk, M.; Czubaszek, A.; Szumny, A. Essential Oils as Antimicrobial Agents—Myth or Real Alternative? Molecules 2019, 24, 2130. [Google Scholar] [CrossRef]
- Raut, J.S.; KaruppayiL, S.M. A status review on the medicinal properties of essential oils. Ind. Crop. Prod. 2014, 62, 250–264. [Google Scholar] [CrossRef]
- Hanan, E.; Dar, A.H.; Shams, R.; Goksen, G. New insights into essential oil nano emulsions loaded natural biopolymers recent development, formulation, characterization and packaging applications: A comprehensive review. Int. J. Biol. Macromol. 2024, 280, 135751. [Google Scholar] [CrossRef]
- Zhu, L.; Liu, Y.; Liu, J.; Qiu, X.; Lin, L. Preparation and characterization of tea tree essential oil microcapsule-coated packaging paper with bacteriostatic effect. Food Chem. 2024, 23, 101510. [Google Scholar] [CrossRef]
- Kurose, K.; Yatagai, M. Components of the essential oils of Azadirachta indica A. Juss, Azadirachta siamensis Velton, and Azadirachta excelsa (Jack) Jacobs and their comparison. J. Wood Sci. 2005, 51, 185–188. [Google Scholar] [CrossRef]
- Dastan, D.; Pezhmanmehr, M.; Askari, N.; Ebrahimi, S.N.; Hadian, J. Essential oil compositions of the leaves of Azadirachta indica A. Juss from Iran. J. Essent. Oil Bear. Plants 2010, 13, 357–361. [Google Scholar] [CrossRef]
- El-Hawary, S.; Tantawy, E.; Rabeh, M.; Badr, W.K. Chemical composition and biological activities of essential oils of Azadirachta indica A. Juss. Int. J. Appl. Res. Nat. Prod. 2013, 6, 33–42. [Google Scholar]
- Siddiqui, B.S.; Ali, S.T.; Rajput, M.T.; Gulzar, T.; Rasheed, M.; Mehmood, R. GC-based analysis of insecticidal constituents of the flowers of Azadirachta indica A. Juss. Nat. Prod. Res. 2009, 23, 271–283. [Google Scholar] [CrossRef] [PubMed]
- Aromdee, C.; Sriubolmas, N. Essential oil of the flowers of Azadirachta indica (Meliaceae). J. Sci. Technol. 2006, 28, 115–119. [Google Scholar] [CrossRef]
- Sidhu, O.P.; Kumar, V.; Behl, H.M. Variability in triterpenoids (nimbin and salanin) composition of neem among different provenances of India. Ind. Crop. Prod. 2004, 19, 69–75. [Google Scholar] [CrossRef]
- Ghoshal, G.; Sandal, S. Neem essential oil: Extraction, characterization, and encapsulation. Food Chem. Adv. 2024, 4, 100702. [Google Scholar] [CrossRef]
- Diedhiou, D.; Faye, M.; Candy, L.; Vandenbossche, V.; Raynaud, C.; Sock, O.; Rigal, L. Chemical composition of the essential oil of Neem (Azadirachta indica A. Juss.) seeds harvested in Senegal. Indian J. Sci. Technol. 2023, 16, 118–122. [Google Scholar] [CrossRef]
- Perveen, S. Introductory Chapter: Terpenes and Terpenoids. In Terpenes and Terpenoids—Recent Advances; Perveen, S., Al-Taweel, A., Eds.; IntechOpen: London, UK, 2021; pp. 1–12. [Google Scholar] [CrossRef]
- Awadh, M.M.; Kahindo, J.M.; Swaleh, M.M.; Kiti, H.M. A systematic review of terpenoids in Azadirachta indica: Classes, Structures and Medicinal Uses. Chem. Sci. Int. J. 2022, 31, 27–43. [Google Scholar] [CrossRef]
- Brophy, J.J.; Davies, N.W.; Southwell, I.A.; Stiff, I.A.; Williams, L.R. Gas chromatographic quality control for oil of Melaleuca terpinen-4-ol type (Australian tea tree). J. Agric. Food Chem. 1989, 37, 1330–1335. [Google Scholar] [CrossRef]
- Carson, C.F.; Hammer, K.A.; Riley, T.V. Melaleuca alternifolia (Tea Tree) oil: A review of antimicrobial and other medicinal properties. Clin. Microbiol. Rev. 2006, 19, 50–62. [Google Scholar] [CrossRef] [PubMed]
- Imelouane, B.; Amhamdi, H.; Wathelet, J.P.; Ankit, M.; Khedid, K.; El Bachiri, A. Chemical composition and antimicrobial activity of essential oil of thyme (Thymus vulgaris) from Eastern Morocco. Int. J. Agric. Biol. 2009, 11, 205–208. [Google Scholar]
- Lusiak, P.; Różyło, R.; Mazur, J.; Sobczak, S.; Matwijczuk, A. Evaluation of physical parameters and spectral characterization of the quality of soaps containing by-products from the food industry. Sci. Rep. 2024, 14, 4687. [Google Scholar] [CrossRef]
- Vassiliou, E.; Awoleye, O.; Davis, A.; Mishra, S. Anti-Inflammatory and antimicrobial properties of Thyme oil and its main constituents. Int. J. Mol. Sci. 2023, 24, 6936. [Google Scholar] [CrossRef]
- Warra, A.A.; Hassan, L.G.; Gunu, S.Y.; Jega, S.A. Cold-process synthesis and properties of soaps prepared from different triacylglycerol sources. Niger. J. Basic Appl. Sci. 2010, 18, 315–321. [Google Scholar] [CrossRef]
- AOCS. Official Methods and Recommended Practices of the American Oil Chemists’ Society; AOC Press: Washington, DC, USA, 1993. [Google Scholar]
- Odoom, W.; Edusei, V.O. Evaluation of saponification value, iodine value and insoluble impurities in coconut oils from Jomoro district in the western region of Ghana. Asian J. Agric. Food Sci. 2015, 3, 494–499. [Google Scholar]
- Hussain, M.S.; (Federal Urdu University of Arts, Science and Technology, Karachi, Pakistan). Soap-making manual for engineers, chemists, and technologists. Personal communication, 2023. [Google Scholar]
- Zauro, S.A.; Abdullahi, M.T.; Aliyu, A.; Muhammad, A.; Abubakar, I.; Sani, Y.M. Production and analysis of soap using locally available raw-materials. Appl. Chem. 2016, 96, 41479–41483. [Google Scholar]
- Chebet, J.; Kinyanjui, T.; Cheplogoi, P.K. Impact of frying on iodine value of vegetable oils before and after deep frying in different types of food in Kenya. J. Sci. Innov. Res. 2016, 5, 193–196. [Google Scholar] [CrossRef]
- Warra, A.A.; Wawata, I.G.; Umar, R.A.; Gunu, S.Y. Soxhlet extraction, physicochemical analysis and cold process saponification of Nigerian Jatropha curcas L. seed oil. Can. J. Pure Appl. Sci. 2012, 6, 1803–1809. [Google Scholar]
- Yang, H.; Ding, S.; Jiang, P.; Yang, Z.; Zhang, G.; Cui, S. Precision Analysis of Color Measurement by Different Spectrophotometers. In Proceedings of the 3rd International Conference on Material, Mechanical and Manufacturing Engineering (IC3ME 2015), Guangzhou, China, 27–28 June 2015; pp. 983–986. [Google Scholar]
- Badrul Hasan, M.M.; Dutschk, V.; Calvimontes, A.; Hoffmann, G.; Heinrich, G.; Cherif, C. Influence of the cross-sectional geometry on wettability and cleanability of polyester woven fabrics. Tenside Surf. Det. 2008, 45, 274–279. [Google Scholar] [CrossRef]
- Calvimontes, A.; Dutschk, V.; Breitzke, B.; Offermann, P.; Voit, B. Soiling degree and cleanability of differently treated polyester textile materials. Tenside Surf. Det. 2005, 42, 17–22. [Google Scholar] [CrossRef]
- Srivastava, Y.; Semwal, A.D.; Sharma, G.K. Virgin Coconut Oil as Functional Oil. In Therapeutic, Probiotic, and Unconventional Foods; Grumezescu, A.M., Holban, A.M., Eds.; Academic Press: Cambridge, MA, USA, 2018; pp. 291–301. [Google Scholar] [CrossRef]
- Boskou, D. Olive Oil Chemistry_and_Technology, 2nd ed.; AOCS Publishing: Urbana, IL, USA, 2006. [Google Scholar]
- Kamarul Azme, S.N.; Mohd Yusoff, N.S.I.; Chin, L.Y.; Mohd, Y.; Hamid, R.D.; Jalil, M.N.; Zaki, H.M.; Saleh, S.H.; Ahmat, N.; Manan, M.A.F.A.; et al. Recycling waste cooking oil into soap: Knowledge transfer through community service learning. Clean. Waste Syst. 2023, 4, 100084. [Google Scholar] [CrossRef]
- CODEX Alimentarius: CODEX STAN 33-1981, Rev. 1-1989. Available online: https://www.fao.org/4/y2774e/y2774e04.htm#bm4.2 (accessed on 27 January 2025).
- CODEX-STAN CXS 210–1999. Available online: https://www.fao.org/fao-who-codexalimentarius/sh-proxy/tr/?lnk=1&url=https%253A%252F%252Fworkspace.fao.org%252Fsites%252Fcodex%252FStandards%252FCXS%2B210-1999%252FCXS_210e.pdf (accessed on 27 January 2025).
- Certificat D’analyse Chromatographique; Produit issu de L’agriculture Biologique Certifié par FR-BIO-01, B891—Huile Essentielle 100% Pure et Naturelle TEA-TREE Feuille AFS HE BIO. Available online: www.euflora.ro (accessed on 7 March 2024).
- Ellemental Essential Care and Clean Elements; Material Safety Data Sheet (M-1040_MSDS_S); According to EU Regulation 1907/2006 in the Current Version Organic Pur Tea Tree Essential Oil. Available online: https://www.ellemental.ro (accessed on 7 March 2024).
- Rohman, A.; Che Mana, Y.B. Fourier transform infrared (FTIR) spectroscopy for analysis of extra virgin olive oil adulterated with palm oil. Food Res. Int. 2010, 43, 886–892. [Google Scholar] [CrossRef]
- Dumancas, G.G.; Carreto, N.; Generalao, O.; Ke, G.; Bello, G.; Lubguban, A.; Malaluan, R. Chemometrics for quantitative determination of terpenes using Attenuated Total Reflectance–Fourier Transform Infrared Spectroscopy: A pedagogical laboratory exercise for undergraduate instrumental analysis students. J. Chem. Educ. 2023, 100, 3050–3060. [Google Scholar] [CrossRef]
- Popa, R.M.; Fetea, F.; Socaciu, C. Attenuated Total Reflectance–Fourier Transform Infrared Spectroscopy applied for the evaluation of essential oils’ pattern recognition and thermo-oxidative stability: A comparative study. Studia UBB Chem. 2021, 66, 33–50. [Google Scholar] [CrossRef]
- Srilatha, K.; Bhagawan, D.; Himabindu, V. Pyrolysis of garden waste: Comparative study of Leucaena leucocephala (Subabul Leaves) and Azadirachta indica (Neem Leaves) Wastes. In Waste Valorisation and Recycling; Ghosh, S.K., Ed.; Springer Nature: Singapore, 2019; Volume 2, pp. 705–7012. [Google Scholar] [CrossRef]
- Manjula, B.P.; Joshi, V.G.; Ramachandra Setty, S.; Geetha, M. Simultaneous estimation of tea tree oil and neem seed oil in bulk and cosmeceutical formulation by UV spectrophotometry. Indian J. Pharm. Ed. Res. 2021, 12, 3264–3271. [Google Scholar] [CrossRef]
- Manjula, B.P.; Joshi, V.G.; Ramachandra Setty, S.; Geetha, M. Development and validation of UV spectrophotometric method for estimation of Tea Tree oil in bulk and cosmeceutical creams. Indian J. Pharm. Ed. Res. 2021, 55, S285–S292. [Google Scholar] [CrossRef]
- Cai, C.; Ma, R.; Duan, M.; Lu, D. Preparation and antimicrobial activity of thyme essential oil microcapsules prepared with gum Arabic. RSC Adv. 2019, 9, 19740–19747. [Google Scholar] [CrossRef] [PubMed]
- AATCC Test Method 130-2000; Soil Release Test. American Association of Textile Chemists and Colorists: Durham, NC, USA, 2000.
- ISO 6330-2012; Textiles—Domestic Washing and Drying Procedures for Testing Textiles. International Organization for Standardization (ISO): Geneva, Switzerland, 2012.
- Color Differences & Tolerances Commercial Color Acceptability. Available online: www.datacolor.com (accessed on 30 January 2025).


| Saponification Method | Soap Code | Saponification Recipe | |||
|---|---|---|---|---|---|
| Oil Name | Oil Percent (%) | Essential Oil Name | Weight of Essential Oil (%) (g/100 g Base Oil Mixture) | ||
| Cold saponification | CS1 | Olive pomace oil Coconut oil 76 degrees | 70.42 29.58 | - | - |
| CS2 | Olive pomace oil Coconut oil 76 degrees | 70.42 29.58 | Neem | 3.1 | |
| CS3 | Olive pomace oil Coconut oil 76 degrees | 70.42 29.58 | Tea Tree | 3.1 | |
| CS4 | Olive pomace oil Coconut oil 76 degrees | 70.42 29.58 | Thyme | 1.69 | |
| CM | Olive pomace oil | 100 | - | - | |
| CC | Coconut oil 76 degrees | 100 | - | - | |
| Hot saponification | HS1 | Olive pomace oil Coconut oil 76 degrees | 70.42 29.58 | - | - |
| HS2 | Olive pomace oil Coconut oil 76 degrees | 70.42 29.58 | Neem | 3.1 | |
| HS3 | Olive pomace oil Coconut oil 76 degrees | 70.42 29.58 | Tea Tree | 3.1 | |
| HS4 | Olive pomace oil Coconut oil 76 degrees | 70.42 29.58 | Thyme | 1.69 | |
| HM | Olive pomace oil | 100 | - | - | |
| HC | Coconut oil 76 degrees | 100 | - | - | |
| Norm. at % | |||||
|---|---|---|---|---|---|
| Saponification Type | Atoms | Soap Without Essential Oil | Soap + Neem Essential Oil | Soap + Tea Tree Essential Oil | Soap + Thyme Essential Oil |
| Hot saponification | C | 39.36 | 39.57 | 39.81 | 39.71 |
| Na | 9.98 | 9.42 | 9.33 | 8.79 | |
| O | 50.66 | 51.01 | 50.86 | 51.50 | |
| Cold saponification | C | 39.70 | 39.85 | 39.92 | 40.49 |
| Na | 9.27 | 9.29 | 9.20 | 8.62 | |
| O | 51.03 | 51.31 | 50.88 | 50.89 | |
| Soap Type | Loss of Soap Mass by Burning (mg) | |
|---|---|---|
| Hot Saponification | Cold Saponification | |
| Soap without essential oil | 10 | 8.6 |
| Soap with Neem essential oil | 11 | 12.64 |
| Soap with Tea Tree essential oil | 8.7 | 11.71 |
| Crt. No. | Soap Component | Soap Code | pH | Foam Height [cm] | L* | a* | b* |
|---|---|---|---|---|---|---|---|
| 1 | olive and coconut oils | CS1 | 9.95 | 9.5 | 71.57 | −3.41 | 5.54 |
| 2 | olive and coconut oils + Neem | CS2 | 9.82 | 9.5 | 63.00 | −2.48 | 11.92 |
| 3 | olive and coconut oils + Tea Tree | CS3 | 9.85 | 9.5 | 66.09 | −3.58 | 6.62 |
| 4 | olive and coconut oils + Thyme | CS4 | 9.82 | 9 | 59.78 | −2.66 | 7.94 |
| 5 | olive and coconut oils | HS1 | 9.97 | 16.5 | 68.65 | −3.2 | 7.79 |
| 6 | olive and coconut oils + Neem | HS2 | 9.74 | 9.5 | 59.42 | −3.21 | 6.8 |
| 7 | olive and coconut oils + Tea Tree | HS3 | 10.1 | 12.5 | 65.56 | −3.51 | 7.71 |
| 8 | olive and coconut oils + Thyme | HS4 | 9.9 | 14 | 57.00 | −2.87 | 6.97 |
| 9 | 100% olive oil cold-formulated | CM | 9.74 | 8 | 78.26 | −3.28 | −8.68 |
| 10 | 100% coconut oil cold-formulated | CC | 9.755 | 7 | 69.46 | −2.35 | −5.68 |
| 11 | detergent A | CDA | 9.805 | 1 | 86.85 | 0.22 | −0.09 |
| 12 | detergent B | CDB | 7.96 | 0.5 | 80.96 | 0.55 | 1.16 |
| 13 | ChanteClair soap | CCh | 9.7 | 7 | 48.43 | −3.42 | 0.41 |
| 14 | Popular soap | CP | 9.215 | 9 | 90.44 | −1.11 | 5.75 |
| 15 | Fairy detergent | CF | 8.325 | 5 | 75.68 | −4.31 | 42.54 |
| 16 | 100% olive oil hot-formulated | HM | 9.76 | 8.5 | 76.52 | −2.83 | 12.76 |
| 17 | 100% coconut oil hot-formulated | HC | 9.255 | 15 | 83.06 | −0.14 | 4.90 |
| Saponification Type | Soap Code * | Color Staining After Washing at the Temperature of: ** | CMC *** | ||
|---|---|---|---|---|---|
| 60 °C | 95 °C | 100 °C | |||
| Cold saponification | CS1 | 4 | 4–5 | 4–5 | FAIL |
| CS2 | 3–4 | 4–5 | 4–5 | FAIL | |
| CS3 | 4 | 4–5 | 4–5 | PASS | |
| CS4 | 4 | 4–5 | 5 | PASS | |
| CM | 4 | 4–5 | 4–5 | FAIL | |
| CC | 4 | 4 | 4–5 | FAIL | |
| Hot saponification | HS1 | 4 | 4–5 | 4–5 | PASS |
| HS2 | 4 | 4–5 | 4–5 | PASS | |
| HS3 | 4 | 4 | 4–5 | PASS | |
| HS4 | 4 | 4–5 | 4–5 | PASS | |
| HM | 4 | 4–5 | 4–5 | FAIL | |
| HC | 3–4 | 4 | 4–5 | FAIL | |
| CDA | 3–4 | 3–4 | 3–4 | FAIL | |
| CDB | 4 | 4 | 4 | FAIL | |
| CCh | 4 | 4–5 | 4–5 | FAIL | |
| CP | 4 | 4–5 | 4–5 | FAIL | |
| CF | 3–4 | 4 | 4 | FAIL | |
| CFU */Sample 3 × 3 cm/mL Washing Suspension | |
|---|---|
| Soap Code (Number on the Lid) | CFU * |
| CS1 (1R) | 0 |
| CS2 (2R) | 0 |
| CS3 (3R) | 0 |
| CS4 (4R) | 0 |
| HS1 (1C) | 1 |
| HS2 (2C) | 0 |
| HS3 (3C) | 0 |
| HS4 (4C) | 0 |
Disclaimer/Publisher’s Note: The statements, opinions and data contained in all publications are solely those of the individual author(s) and contributor(s) and not of MDPI and/or the editor(s). MDPI and/or the editor(s) disclaim responsibility for any injury to people or property resulting from any ideas, methods, instructions or products referred to in the content. |
© 2025 by the authors. Licensee MDPI, Basel, Switzerland. This article is an open access article distributed under the terms and conditions of the Creative Commons Attribution (CC BY) license (https://creativecommons.org/licenses/by/4.0/).
Share and Cite
Stănescu, V.-G.; Popescu, V.; Vasilache, V.; Popescu, G.; Rîmbu, C.M.; Popescu, A. Cleaner Processes for Making Laundry Soap from Vegetable Oils and an Essential Oil. Appl. Sci. 2025, 15, 3821. https://doi.org/10.3390/app15073821
Stănescu V-G, Popescu V, Vasilache V, Popescu G, Rîmbu CM, Popescu A. Cleaner Processes for Making Laundry Soap from Vegetable Oils and an Essential Oil. Applied Sciences. 2025; 15(7):3821. https://doi.org/10.3390/app15073821
Chicago/Turabian StyleStănescu, Valentina-Gabi, Vasilica Popescu, Viorica Vasilache, Gabriel Popescu, Cristina Mihaela Rîmbu, and Andrei Popescu. 2025. "Cleaner Processes for Making Laundry Soap from Vegetable Oils and an Essential Oil" Applied Sciences 15, no. 7: 3821. https://doi.org/10.3390/app15073821
APA StyleStănescu, V.-G., Popescu, V., Vasilache, V., Popescu, G., Rîmbu, C. M., & Popescu, A. (2025). Cleaner Processes for Making Laundry Soap from Vegetable Oils and an Essential Oil. Applied Sciences, 15(7), 3821. https://doi.org/10.3390/app15073821