Article

First Insights into Macromolecular Components Analyses of an Insect Meal Using Hyperspectral Imaging

by
Flávia Matias Oliveira da Silva
1,2,
Liliana G. Fidalgo
1,2,3,*,
Rita S. Inácio
1,2,4,
Rafaela Fantatto
5,6,
Maria J. Carvalho
1,2,7,*,
Daniel Murta
5,6 and
Nuno S. A. Pereira
8,*
1
Department of Applied Technologies and Sciences, School of Agriculture, Polytechnic Institute of Beja, Rua Pedro Soares, 7800-309 Beja, Portugal
2
MED—Mediterranean Institute for Agriculture, Environment and Development & CHANGE–Global Change and Sustainability Institute, Universidade de Évora, Pólo da Mitra, 7006-554 Évora, Portugal
3
Associated Laboratory for Green Chemistry-Network of Chemistry and Technology (LAQV-REQUIMTE), Chemistry Department, Campus Universitario de Santiago, University of Aveiro, 3810-193 Aveiro, Portugal
4
Centre for Biotechnology and Fine Chemistry (CBQF), School of Biotechnology, Portuguese Catholic University, 4169-005 Porto, Portugal
5
CiiEM—Egas Moniz Center for Interdisciplinary Research (CiiEM), Egas Moniz School of Health & Science, University Campus, Quinta da Granja, 2829-511 Caparica, Portugal
6
Ingredient Odyssey SA—EntoGreen, 2005-002 Várzea, Portugal
7
MARE—Marine and Environmental Science Centre, Polytechnic of Leiria, 2411-901 Peniche, Portugal
8
Department of Mathematics and Physical Sciences, School of Technology and Management, Polytechnic Institute of Beja, Rua Pedro Soares, 7800-309 Beja, Portugal
*
Authors to whom correspondence should be addressed.
Appl. Sci. 2025, 15(7), 3822; https://doi.org/10.3390/app15073822
Submission received: 11 February 2025 / Revised: 19 March 2025 / Accepted: 27 March 2025 / Published: 31 March 2025

Abstract

:
The non-invasive nutritional analysis of feed through images captured by hyperspectral cameras represents an innovative and promising approach in the field of biotechnology. With this technology, it is possible to capture images at multiple wavelengths and identify unique spectral patterns associated with different molecular components, such as total fat and moisture. The technique is particularly valuable in biological environments, enabling a more detailed and comprehensive analysis of the presence and distribution of nutrients. The objective of this work was to perform a nutritional pre-characterization of Hermetia illucens (Black Soldier Fly-BSF) larvae meal, using hyperspectral images in the range of 400–1000 nm, with a spectral resolution of 7 nm and a spatial sampling of 512 pixels, and correlate them to traditional chemical analysis methods. The results were also compared to wheat flour samples. The chemical results of BSF meal indicated 7.2% ± 0.05% (w/w) and 28.15% ± 0.15% (w/w) in moisture and total fat content, respectively. When compared to wheat flour, BSF meal contains less total fat and this difference was clearly identified in the spectra derived from the hyperspectral images, which underscores the efficiency and utility of multispectral cameras to conduct real-time and non-destructive analyses. Furthermore, this analysis can be extended to other components (e.g., protein content), increasing the potential of the technique for feed characterization.

1. Introduction

Recently, the European Union approved a regulation allowing the use of insect meal for feed production, especially aquafeed [1]. This regulation included seven approved insects: Hermetia illucens (black soldier fly), Gryllodes sigillatus (tropical house cricket), Gryllus assimilis (Jamaican field cricket), Acheta domesticus (house cricket), Alphitobius diaperinus (small mealworm), Tenebrio molitor (yellow mealworm), and Musca domestica (common housefly) [2].
Although the Black Fly Soldier (BFS), H. illucens, is not yet approved for human consumption, its larvae gained a special status in recent years due to its potential to convert organic waste and manure into high-quality, nutrient-rich protein [3]. For this reason, BFS meal has been used in poultry [4,5], swine [6], and aquaculture [7] industries as feed or for specific manure management (e.g., botanical origin, composition, etc.).
In this regard, the search for methodologies to analyze the nutritional compounds of these insects has been steadily increasing. Comprehensive research on the molecular (nutritional) composition of these insects is necessary, using physicochemical, safe, accurate analytical methods that preferably do not destroy the samples, and that comply with food safety and control standards. Currently, it is possible to obtain results on the physicochemical composition through the application of image analysis in scientific and analytical fields.
Spectral imaging combines imaging and spectroscopy to capture both spatial and spectral information. By examining the spectral signatures of different regions within an image, researchers can identify and quantify the presence of specific chemical compounds or elements. This technique is particularly useful in areas such as remote sensing, biomedical imaging, and environmental monitoring [1,3,7]. The use of images offers a non-destructive and non-contact approach for sample analysis, providing valuable insights into material properties, aiding quality control, and supporting research across various scientific and industrial fields. However, it is essential to implement appropriate image acquisition techniques, as well as calibration and validation methods, to ensure accurate and reliable results [8,9,10]. In recent years, many authors have reported the use of near-infrared hyperspectral imaging (NIR-HSI) to assess quality attributes in food and other products [9,11].
Alamu et al. (2019) [8] conducted a review on the use of NIR-HSI as a high-throughput phenotyping tool for root and tuber cultures. Several authors describe the application of this tool for physicochemical analysis, such as the biochemical composition of starch, potatoes, sweet potatoes [12,13], fungal growth in rice, sugar content, and color of potato tubers [12,14]. NIR-HSI is a powerful method for the non-destructive evaluation of various quality characteristics of processed and raw foods [11]. These techniques, when integrated with established laboratory quality control methods, such as control charts, can optimize data analysis by enabling more rigorous monitoring and facilitating the identification and correction of deviations. The application of the control line in the respective control chart allows for the early detection of potential errors in the treatment process, ensuring greater reliability of results. The combination of these methodologies enhances the efficiency and accuracy of data processing, contributing to the continuous improvement of laboratory procedures [15,16].
NIR-HIS allows for capturing images at multiple wavelengths, enabling the identification of unique spectral patterns associated with various molecular components, such as humidity and fat. Based on the available literature [15,16,17], the spectral regions associated with moisture and fat parameters have been investigated. For instance, moisture is linked to spectral ranges at 970 nm and 1410 nm [15], while fat is associated with spectral ranges at 928 nm, 1170 nm, and 1190–1390 nm [16]. Zhou et al. (2023) [17] used HSI with effective band range of 387–1035 nm to identify honey varieties and the adulteration of single honey varieties with different mass fractions of fructose syrup; to detect peanut mildew [18]; and also for the identification of adulterated safflower seed oil [19].
In this study, the authors performed a nutritional pre-characterization of Hermetia illucens (Black Soldier Fly-BSF) larvae meal, relating to moisture and crude fat composition, using hyperspectral images, and compared the results to traditional wheat flour (type 65).

2. Materials and Methods
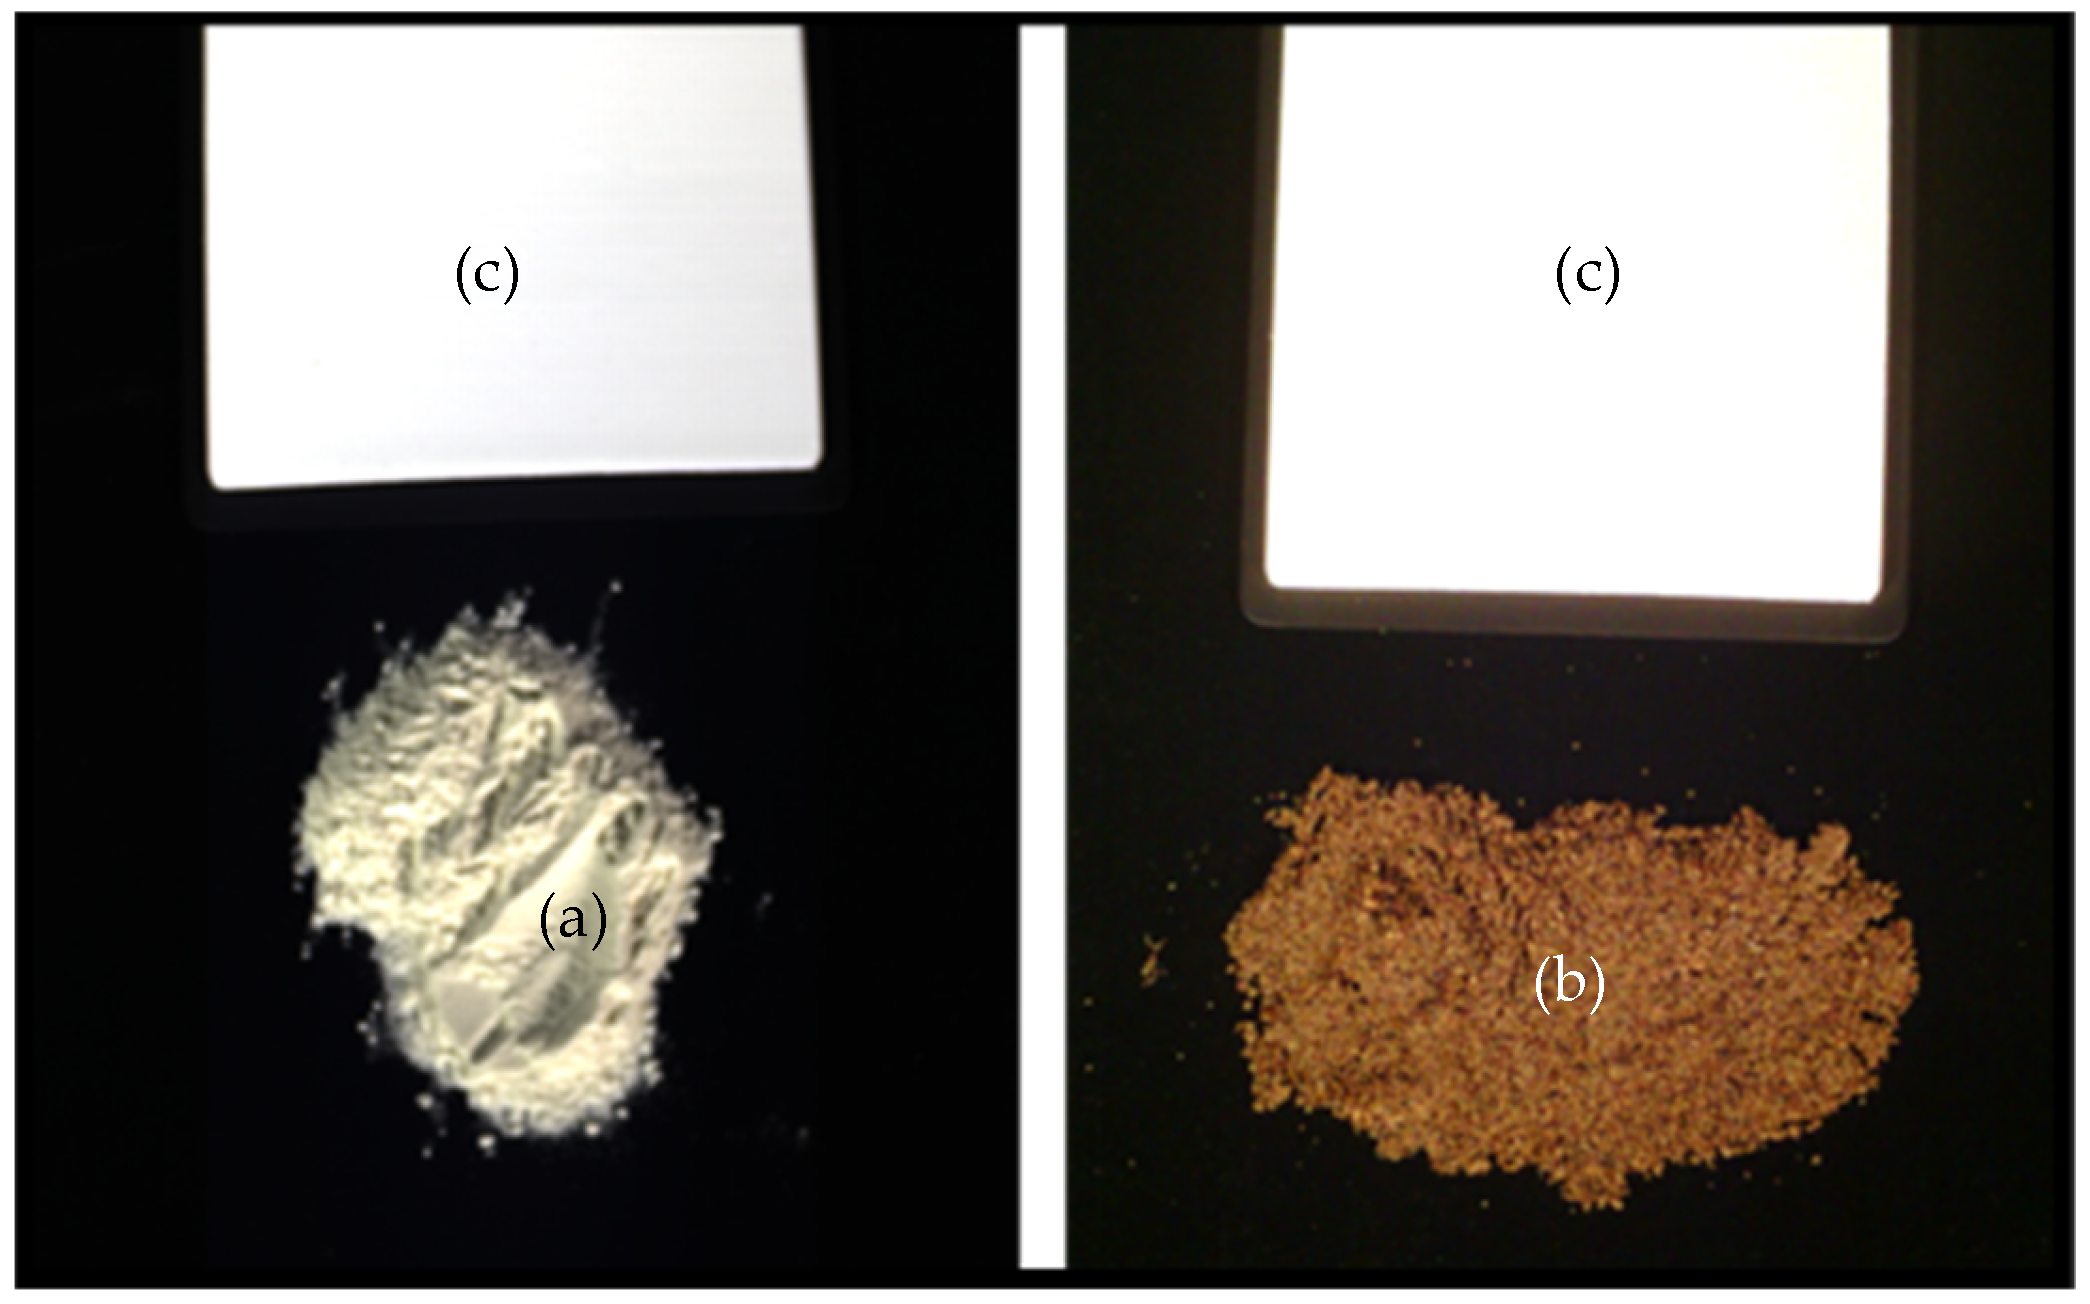
2.1. Samples

Black soldier fly (BSF) larvae were supplied by EntoGreen® (Santarém, Portugal). Following the biodigestion process, the larvae were sieved to separate them from the frass, slaughtered, and dehydrated using microwave technology. They were then packed in heat- and humidity-resistant packaging and sent to IPBeja. Prior to the analyses, the samples were ground and processed into larval meal. The wheat flour was purchased in the form of flour 65 commercial model.

2.2. Moisture and Total Fat Content Determination

Moisture content was determined using the oven-drying method. Approximately 10 g of each sample were placed in pre-weighed porcelain capsules and dried at 105 °C for 3 h. After cooling in a desiccator for 30 min, the samples were weighed to a constant weight. Analyses were performed in triplicate. For crude fat content, a total of 3 g of dry flour was sampled from each batch for total fat analysis, which was performed using the Soxhlet extraction method. The procedure involved a prior acid hydrolysis step to release bound lipids, followed by the use of ethanol as the solvent, with the extraction process carried out over three complete cycles to ensure thorough crude fat recovery.

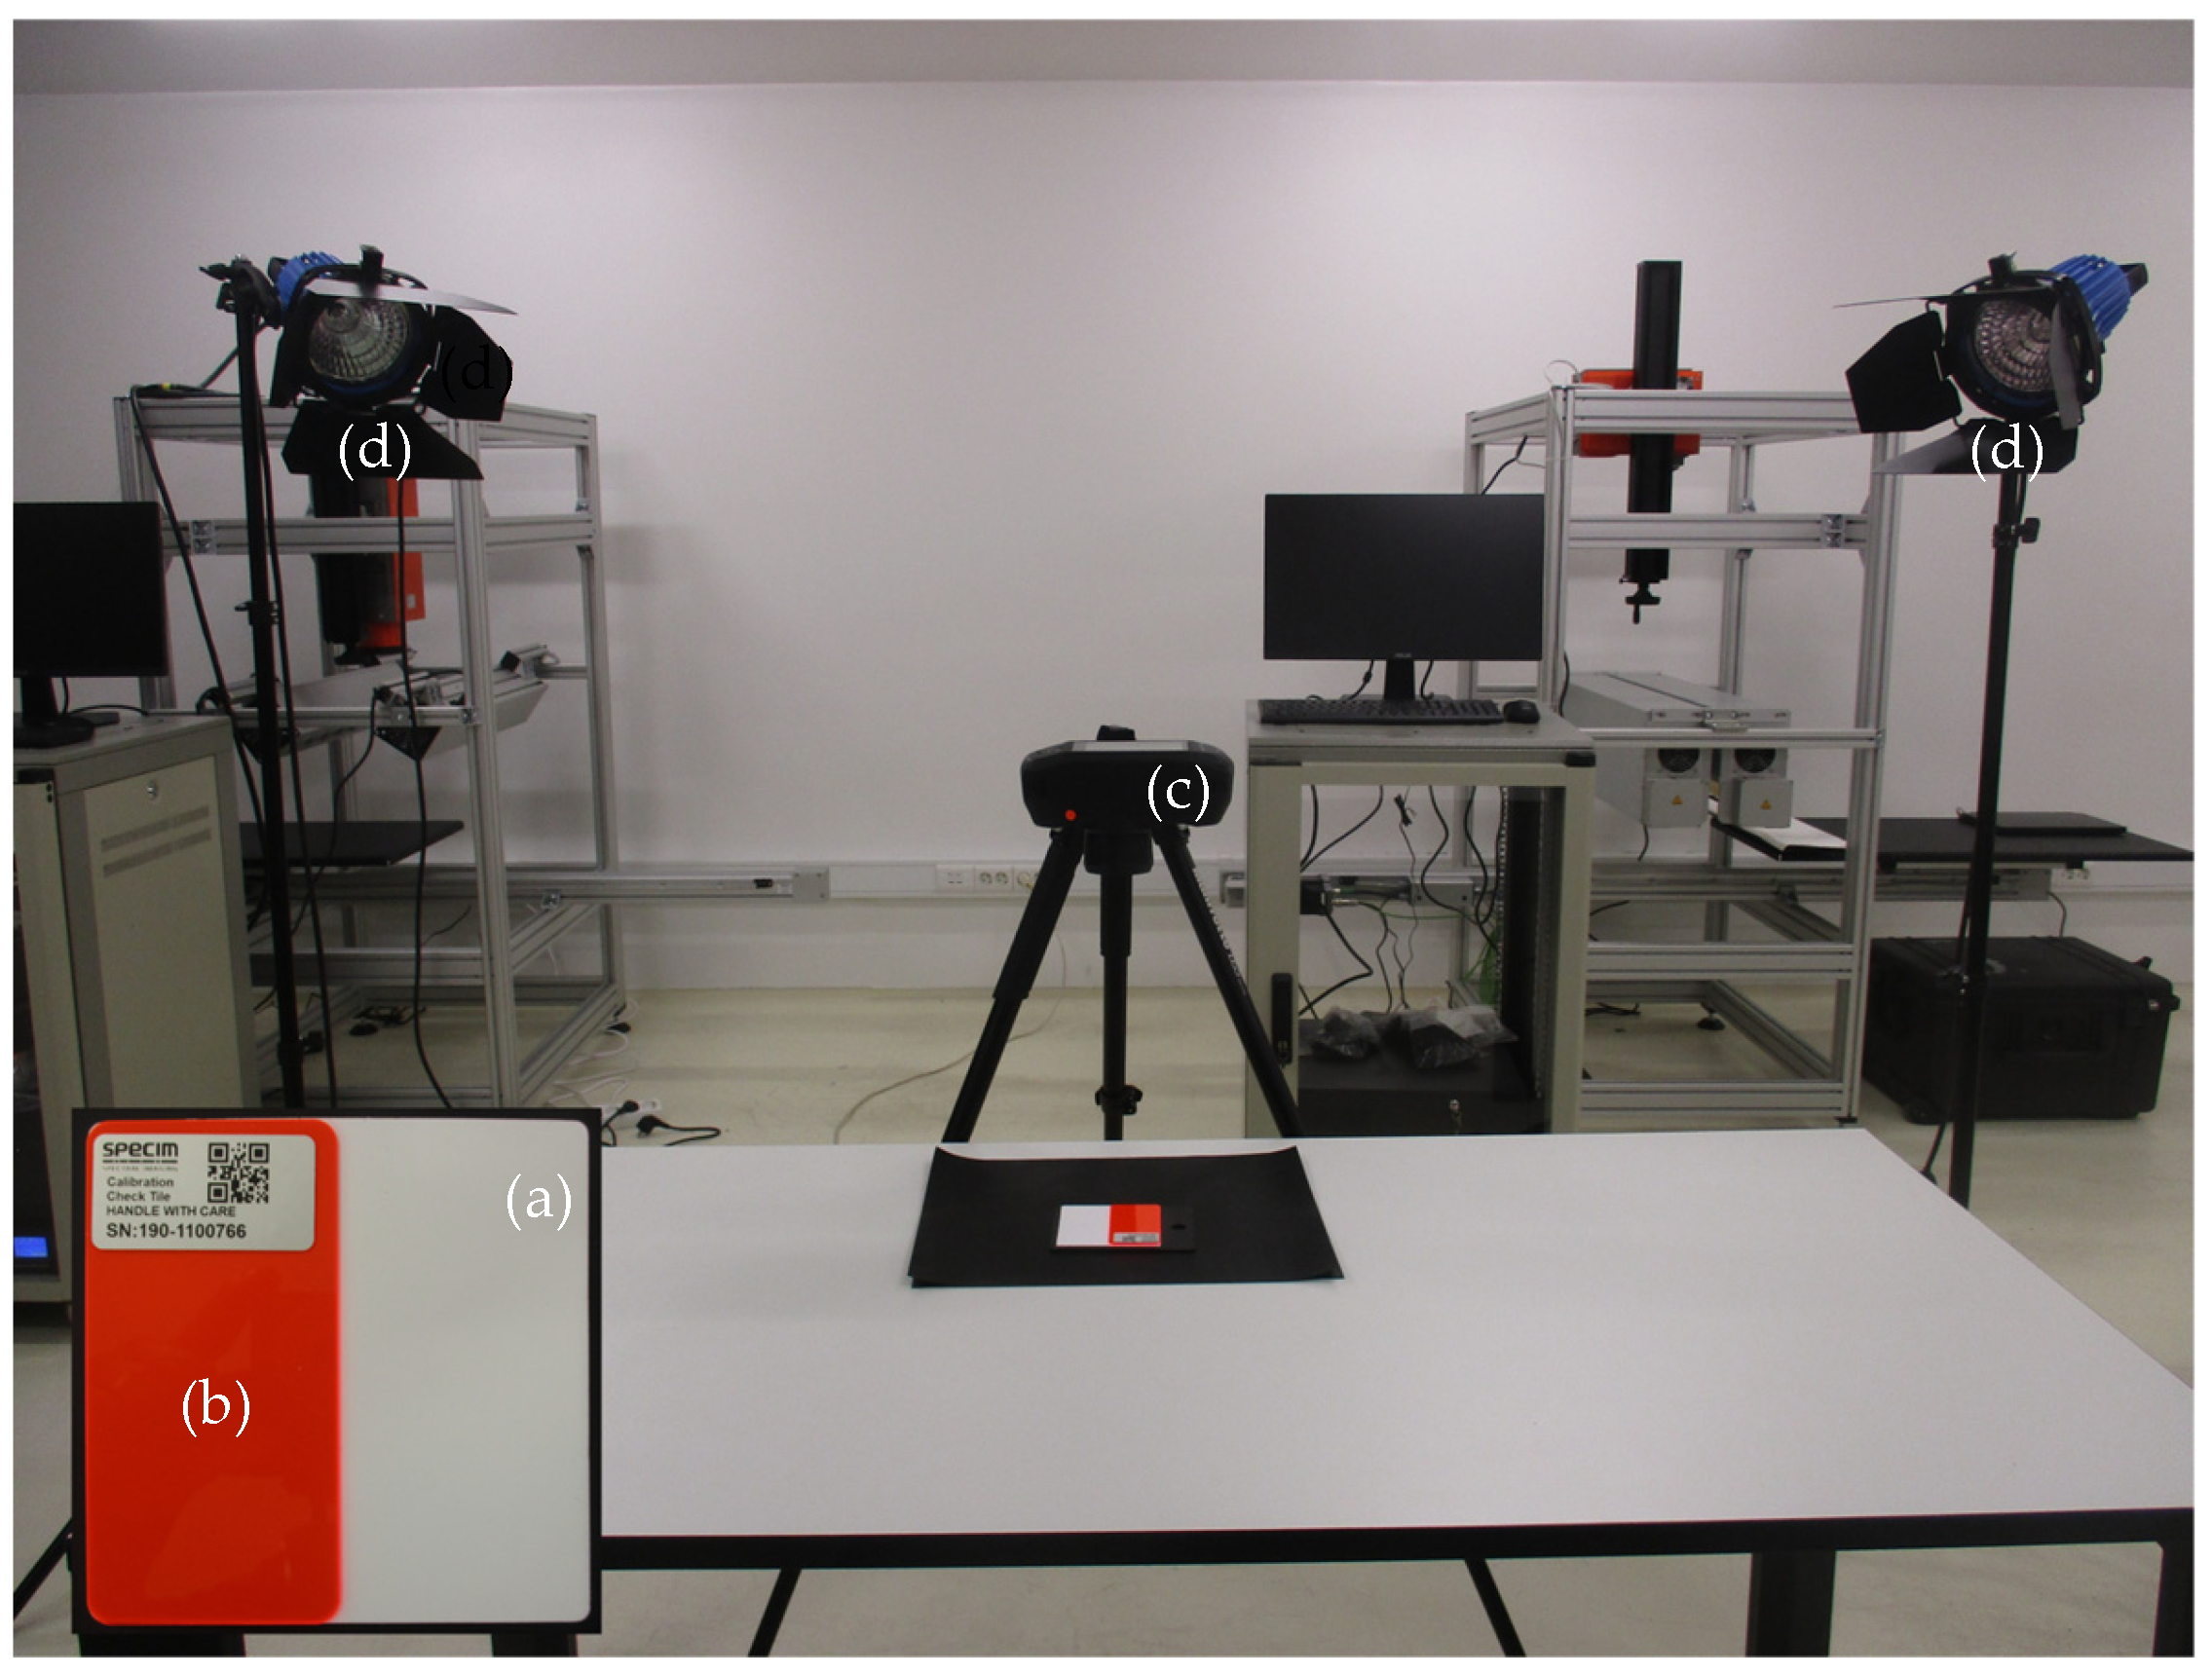
2.3. HSI Data Acquisition

In this study, the HSI samples were acquired with a line scan push broom camera, the Specim IQ [20], equipped with a VNIR (400–1000 nm) CMOS sensor with the following specifications: a spectral resolution (FWHM) of 7 nm, a spatial sampling of 512 pixels, 204 spectral bands, a pixel size of 17.58 μm × 17.58 μm, and 12-bit data output (Figure 1). This configuration achieves a peak quantum efficiency greater than 45%, a full-well capacity >32 k e and a signal-to-noise ratio greater than 400:1. After the scan, the final image has 512 × 512 pixels of spatial resolution. This model is equipped with a 21 mm focal length F/2.2 objective with a FOV of 0.55 × 0.55 m, at a distance of 1 m. Although portable, the system presents specifications and performance similar to laboratory cameras. Moreover, the computational power installed in the system (NVIDIA Tegra K1 GPU and Kepler Mobile CPU) allows the processing of the raw data and visualization of the samples’ reflectance spectra on the camera-integrated display. This is particularly helpful in evaluating data immediately after the acquisition.
When the camera is switched on, the system performs an automatic internal verification of the current spectral range calibration. If the date of the last check is older than 30 days, the system requests a new validation check. The procedure, as described by the manufacturer [21], involves scanning the white reference and the calibration tile simultaneously (Figure 2). After the data acquisition, the system compares the obtained reflectance values with the internal calibration data and warns if there is any deviation that requires a factory calibration. This procedure ensures that data cubes are acquired within the intended spectral range and that the reflectance for each spectral band is adequately computed. For this study, a validation check was performed, and no deviations were detected.
During the scans, whether for calibration check or data acquisition, the targets were simultaneously illuminated using two ARRI Arrilite 750 Plus projectors, each equipped with a 750 W G9.5 2-pin HPL OSRAM halogen lamp, positioned behind the camera as shown in Figure 2, to ensure uniform lighting. The projectors were placed at a distance of approximately 1.5 m to prevent overheating of both the camera and samples. A stable illumination was achieved after approximately 4 min of preheating (see Supplementary Materials for details).
For each data acquisition, the samples and the white reference (Figure 3) The data is saved in ENVI format, consisting of a flat-binary raster file accompanied by an ASCII header file [22]. For processing, the ENVI files are converted into corresponding datacubes, represented as 3D arrays (xyλ), with 512 × 512 spatial pixels (xy), and 204 spectral bands (λ). Each “hyper-pixel” at spatial coordinates (x, y) is a vector with 204 components, one for each band, representing the intensity of the spatial pixel across all bands (Figure 4).

2.4. Spectra Processing

During each acquisition, three datasets are generated by the system: (i) the raw data cube (RD) with the intensities of measured light from the scanned target; (ii) a dark frame (D) captured without illumination to remove the sensor noise (temperature and integration time dependent) and bad pixels (e.g., hot pixels); (iii) a white (W) reference frame, captured from the scanned area of the white reference (WR) tile, to take into account the spectrum of the illumination source for reflectance computation. The white frame not only contains information on the signal of the source but also on the response of the camera system (optics, sensor, electronics) and how it affects the measured spectrum. In theory, the WR tile has a reflectance of 100% without any spectral features. However, in practice, the presence of small deviations from this ideal value will introduce perturbations in the processing of the raw data cube. The reflectance computation is performed according to the following equation [20]:
R = R D t 1 D ( t 1 ) W t 2 D ( t 2 ) × t 2 t 1
where tk (k = 1, 2) refers to the integration times to acquire the data cubes. During this study, the WR tile was always present during the data acquisition (simultaneous mode), and both times are equal.
HSI acquisition was conducted using samples from the same batch of wheat flour and BSF larvae meal as those used for the analytical characterization in order to have comparable results. To define the representative spectra of each sample, a python script was created in order to perform all the computations. The process involves the following steps:
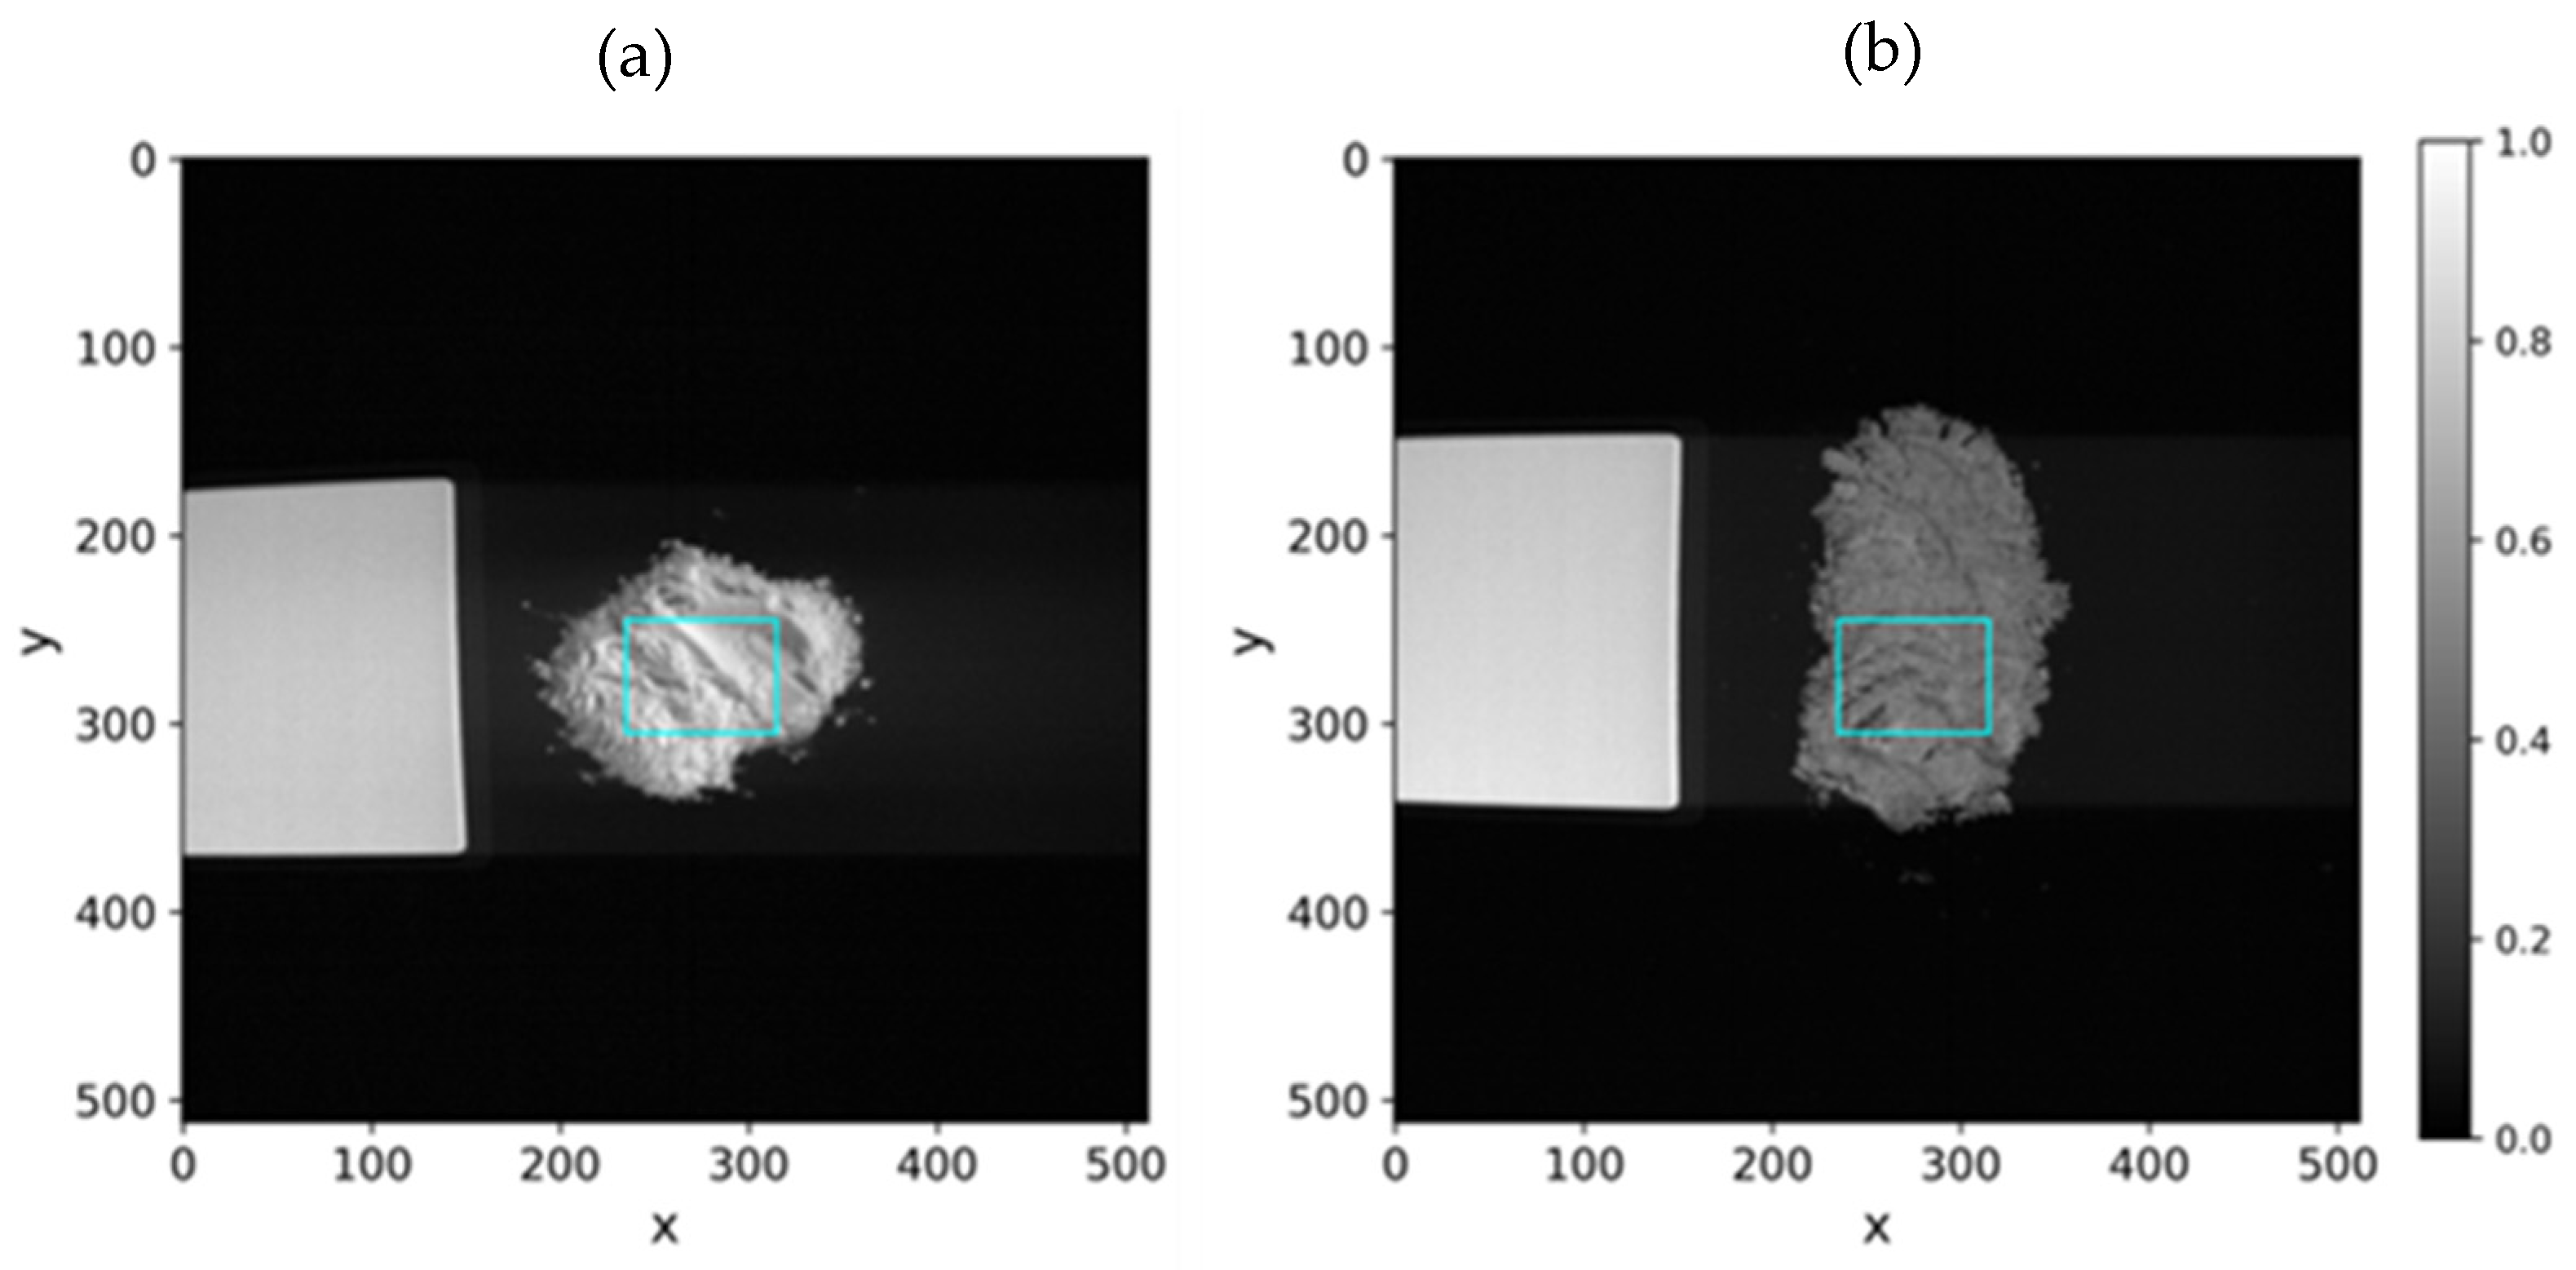
  • Normalization of the bands to allow pixel intensity comparison between different hypercubes and definition of a Region Of Interest (ROI) within the sample (Figure 5);
  • Computation of the mean spectra of the pixels inside the ROI, for noise reduction and increase representativeness (Figure 6).
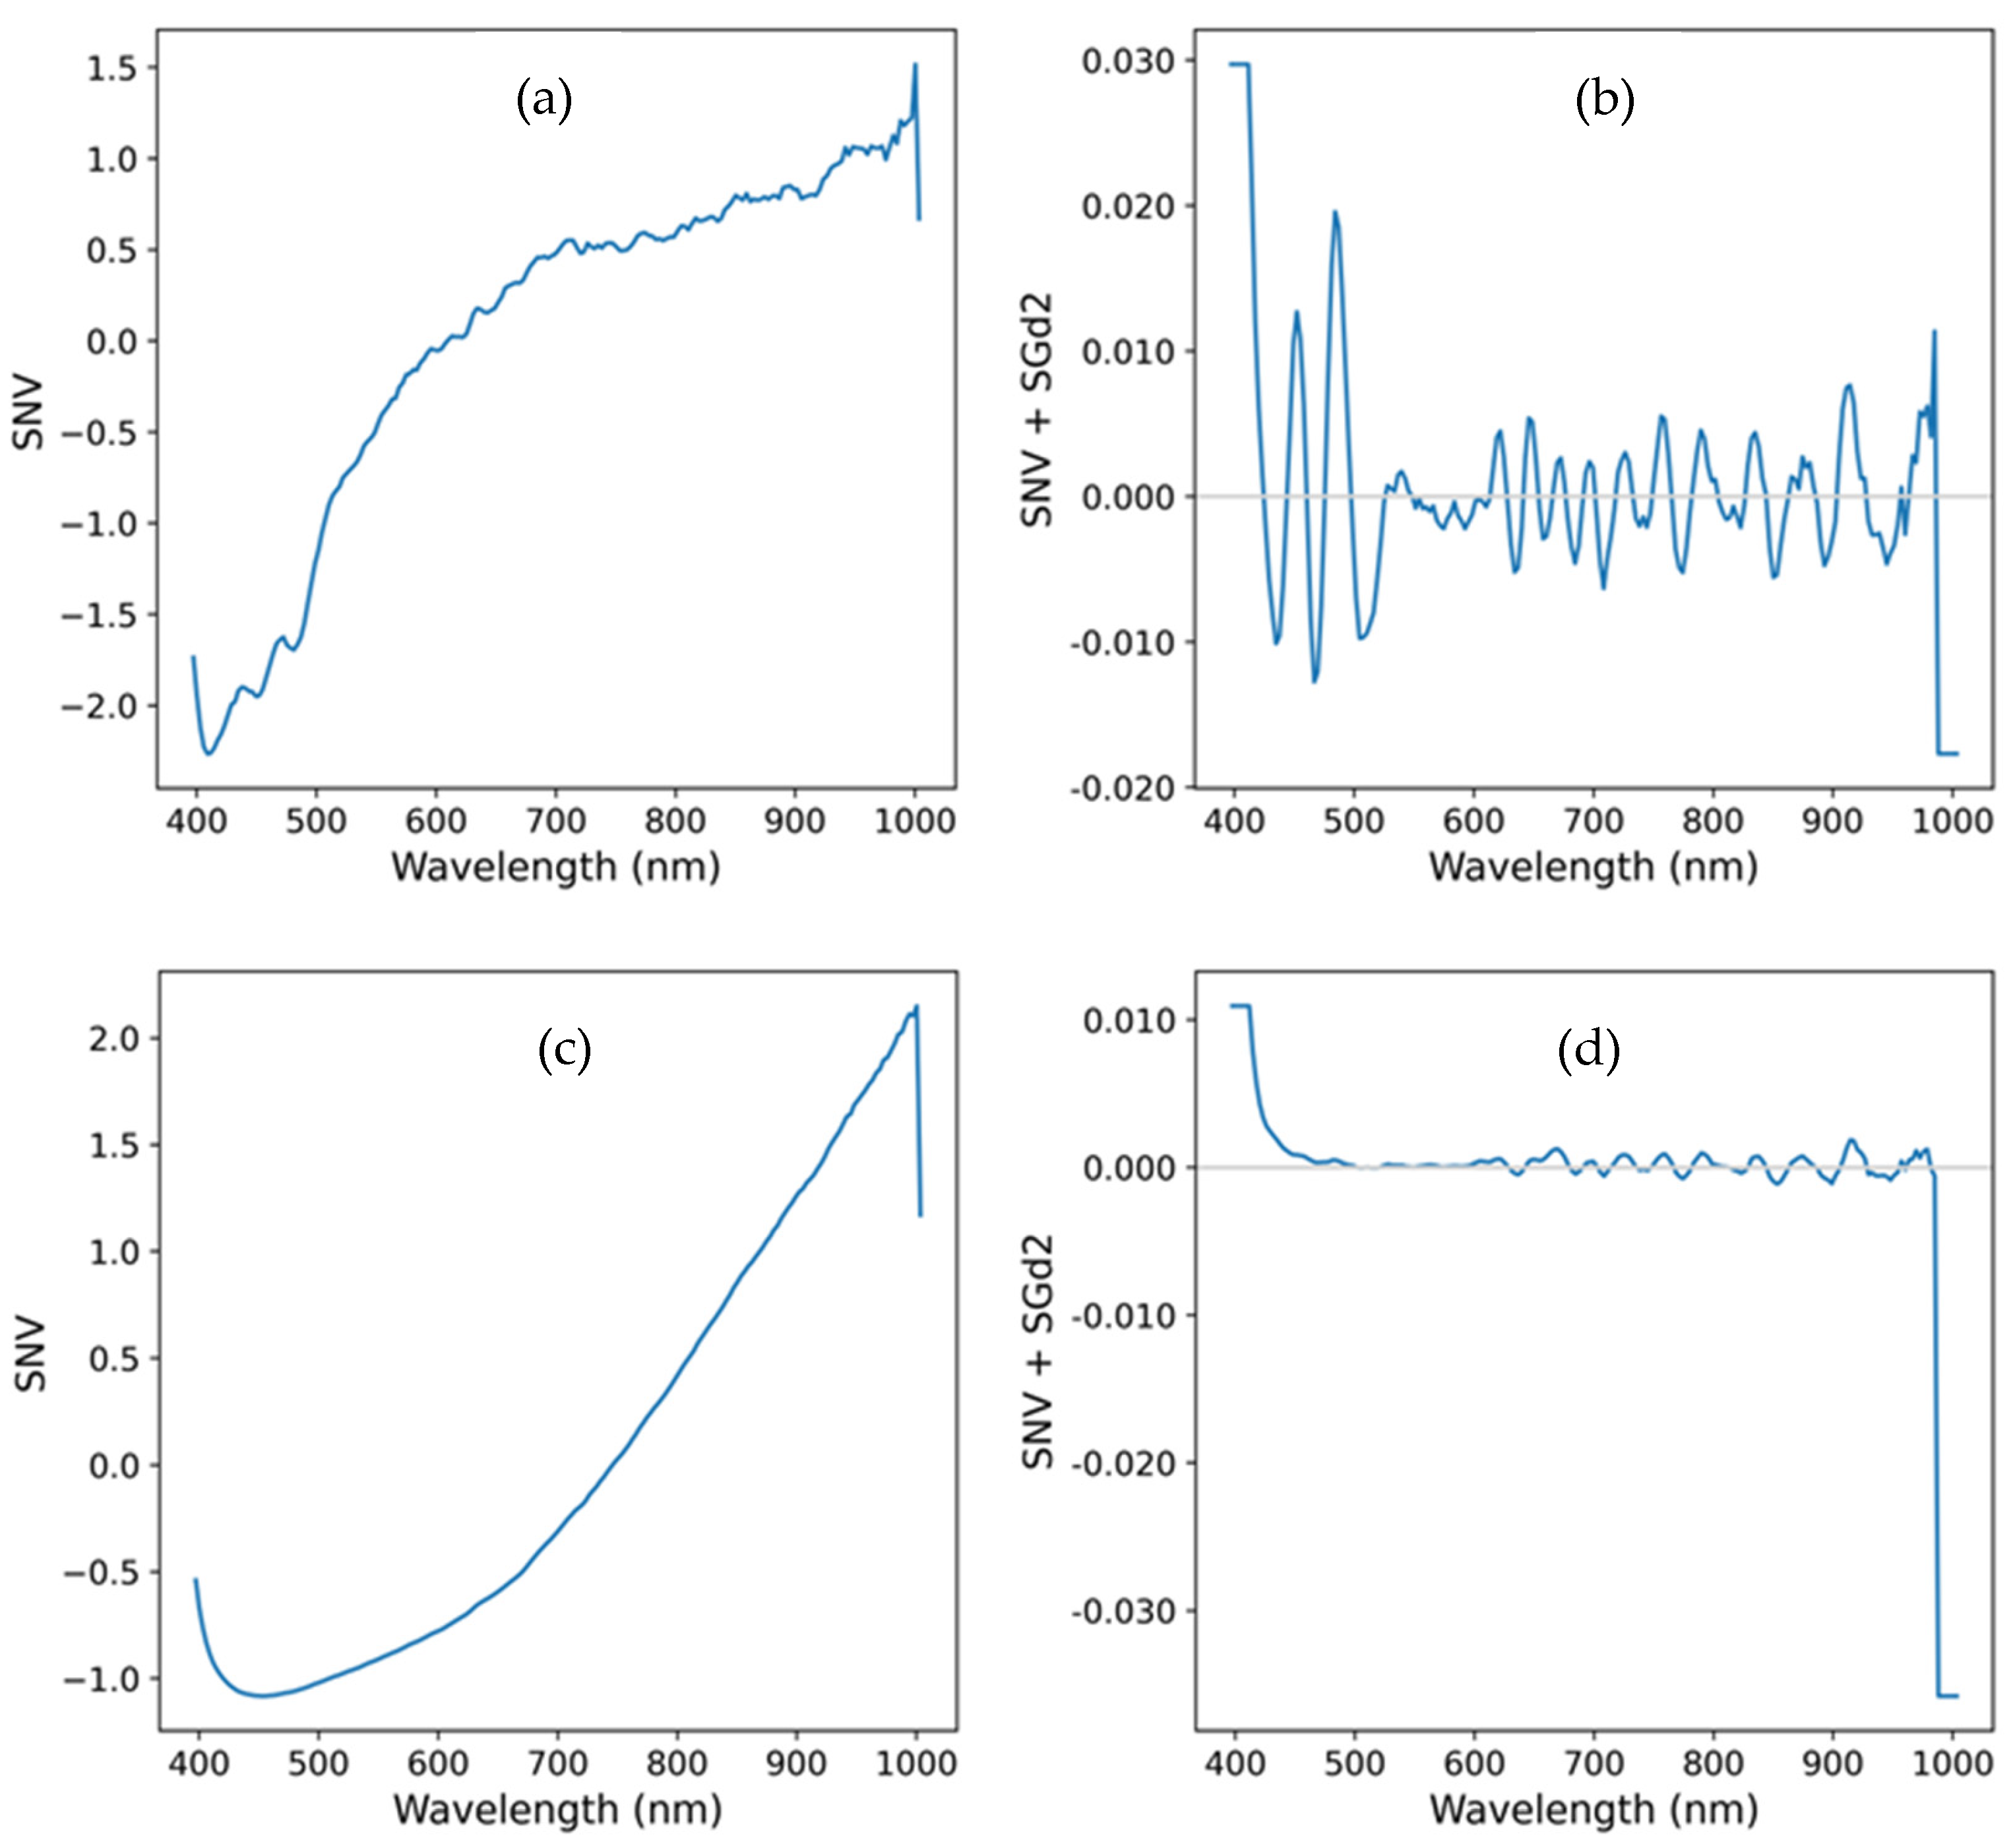
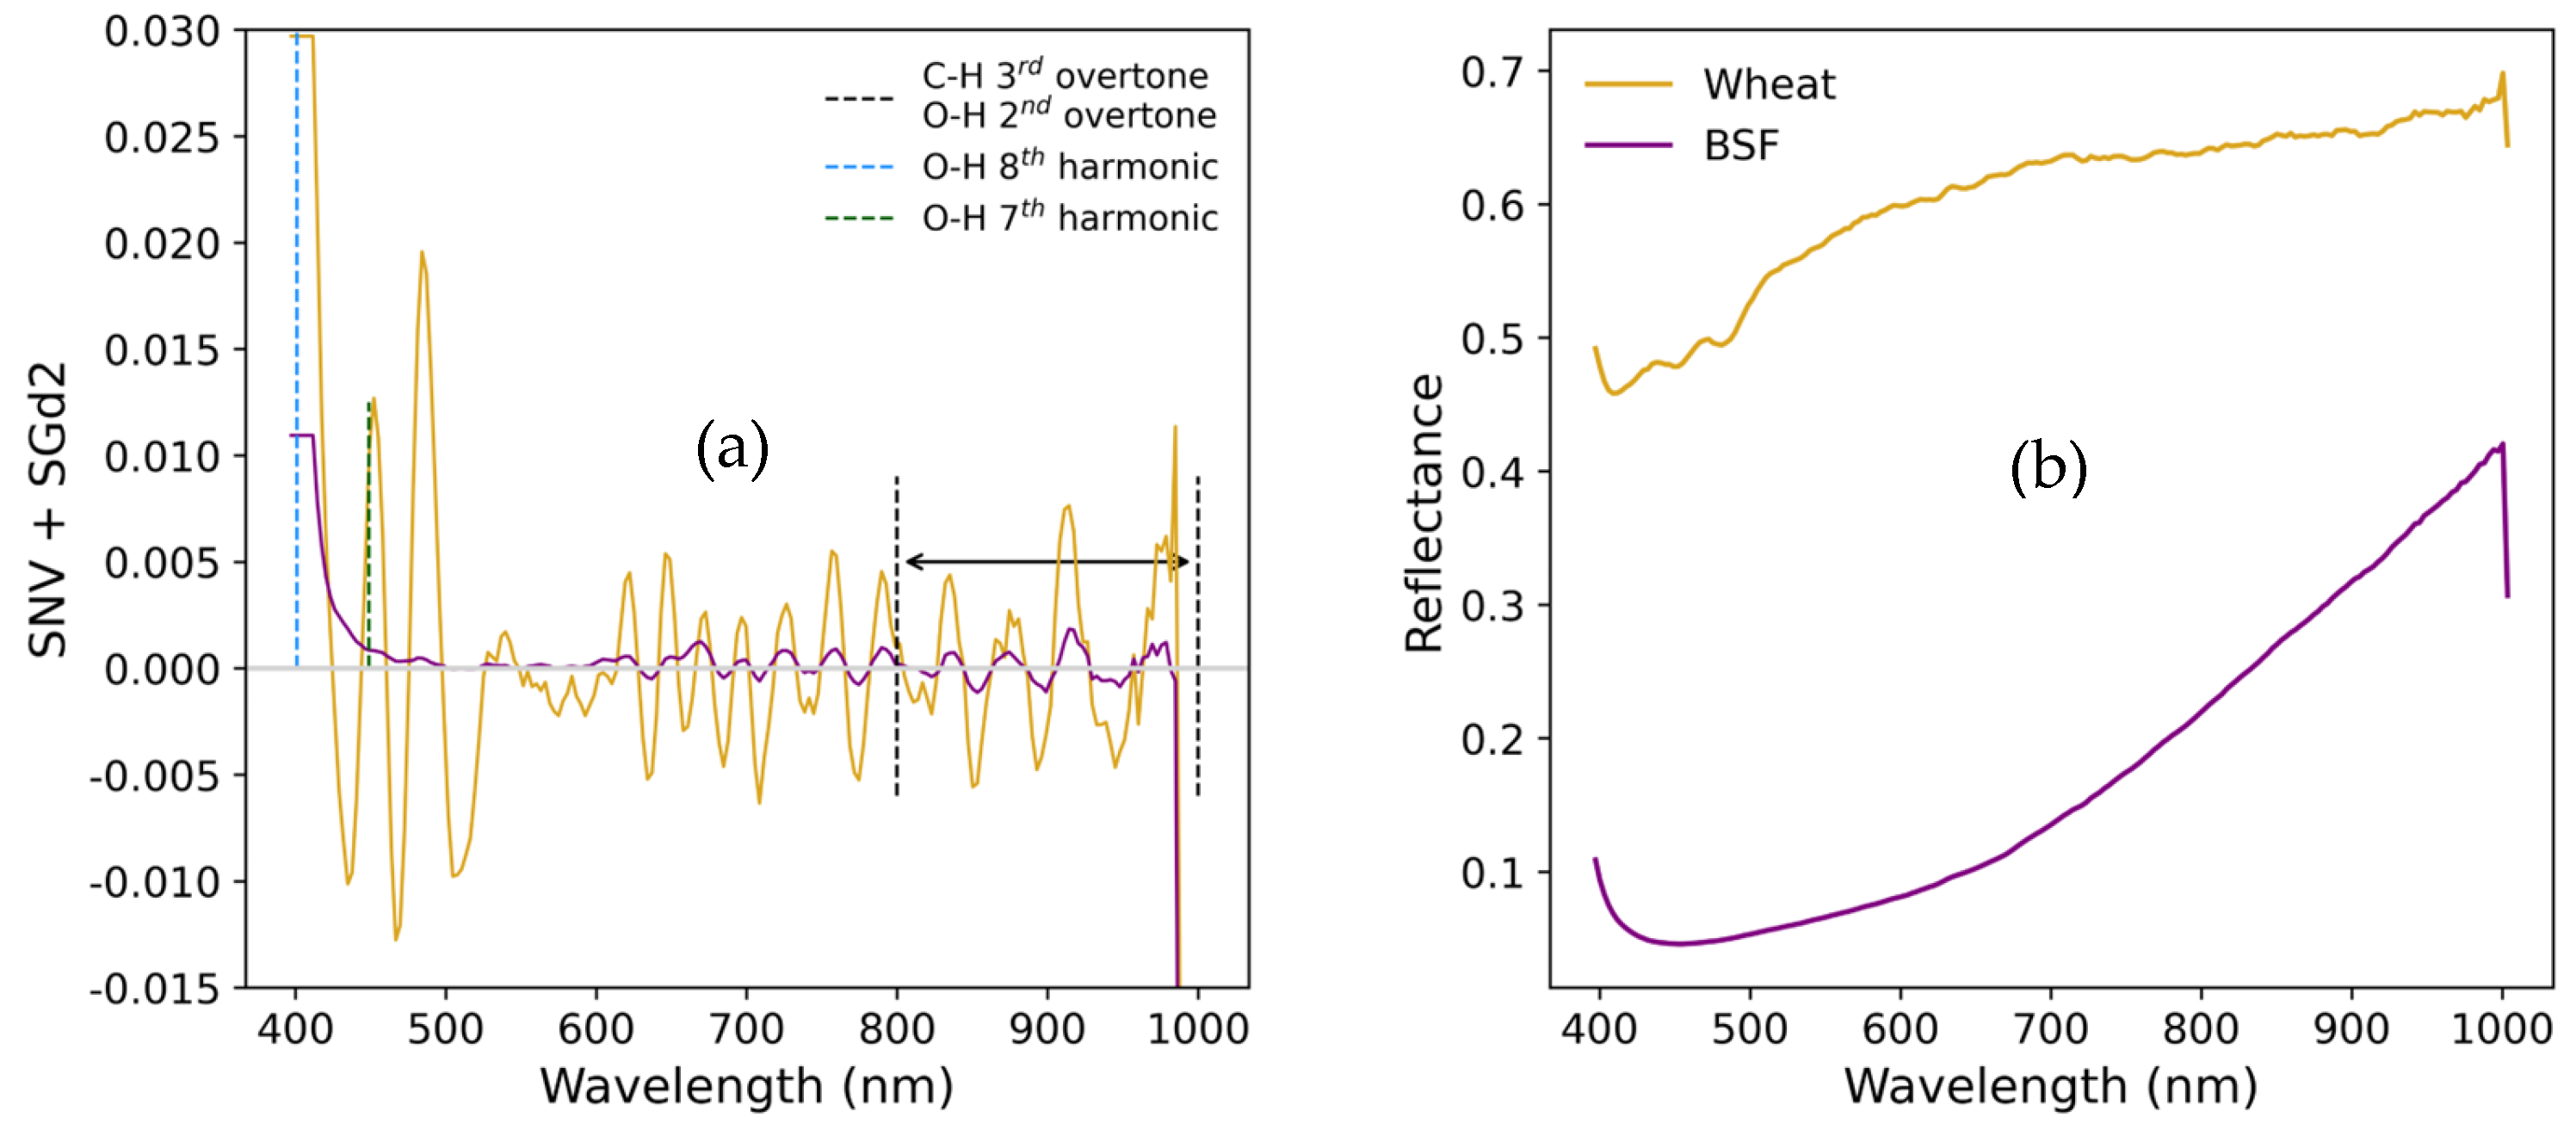
  • Mean spectrum pre-processing (Figure 7):
    • Computation of the Standard Normal Variate to reduce variability introduced by particle size, surface scattering effects, and correct baseline shifts [23];
    • Determination of quantitative similarity metrics for the SNV-transformed spectra of each sample: Spectral Angle Mapper (SAM) [24], and Pearson Coefficient of Correlation;
    • Application of the Savitzky-Golay filter with a 7-points window and a 2nd order polynomial, for noise reduction, and 2nd derivative computation (SGd2) to highlight spectral features, namely, absorption peaks not visible in the raw spectrum [25].

3. Results and Discussion

Table 1 summarizes the results of the evaluated parameters for BSF meal and wheat flour, obtained using standard analytical methods. For wheat flour, the moisture and total fat contents were approximately 3% and 1%, respectively. Typically, wheat flour has a moisture content ranging from 10% to 14%, depending on the type and storage conditions, [26,27] which differs from the values observed in this study. In contrast, the total fat content of wheat flour is generally low, approximately 1%, aligning with the results obtained in this study.
Regarding BSF meal, higher moisture and total fat contents were observed, reaching approximately 7% and 28%, respectively. According to previous studies [15], the water content in BSF meal ranges from 8% to 15%, while the total fat content varies between 20% and 40%, depending on the larval lifespan. Compared to wheat flour, BSF meal exhibits higher percentages for both parameters. In both cases, other compounds were quantified, which may correspond to protein, fiber, high-quality amino acids, minerals, etc. [28,29]. The BSF meal sample provided by the company is defatted, so its fat content may vary when compared to other studies in the literature where whole meal was evaluated. However, another factor that may contribute to these differences in fat content is the substrates used to feed the larvae [30]. According to Gutierrez et al. (2020) [31], the effect of diet is closely related to the nutrient composition of the insect feeding substrates. Normally, the results found in the literature indicate that BSF meal contains 50% crude protein, 35% lipids, and has a quite interesting amino acid profile [32]. However, the sample used in this study does not represent the standard BSF or company production pad, where it is only partially degreased. This process involves pressing several dehydrated larvae to remove a large percentage of fat, which justifies the lower fat percentage observed compared to other studies.
The similarity of both spectra can be evaluated using several metrics, namely, the Pearson correlation coefficient and the Spectral Angle Mapper (SAM) [24], which computes the angle between the two SNV-transformed spectra when viewed as vectors in a multidimensional space, with the number of dimensions equal to the number of bands in the hypercube. A small value of the angle indicates that the vectors are closely aligned in that space, which in turn means that the spectra are similar. In the case of the Pearson coefficient, a value close to one indicates a strong correlation between the spectra. Considering the mean spectra of the samples, the computed value SAM is 0.664, which indicates the presence of significant differences. On the other hand, the value of 0.787 for the Pearson correlation coefficient indicates a strong correlation between the two spectra caused by the presence of common features and components (e.g., water and fat).
To correlate the analytical and spectral results, the focus will be on identifying spectral signatures of fat and water content in the samples, typically associated with the presence of C-H and O-H functional groups, respectively [15]. Within the wavelength of data acquisition, it is possible to identify in the SGd2 plots (Figure 8a) absorption features associated with those groups, namely, the C-H 3rd and O-H 2nd overtones in the region 800–1000 nm [16], and 401 nm + 449 nm peaks, associated, respectively, to the shoulders due to the 7th and 8th harmonics of the O-H fundamental stretching mode [33]. These features are indicative of the presence of water and fat content. When correlated with the reflectance spectra of each sample (Figure 8b), it is evident that the BSF sample exhibits higher absorption (lower reflectance) in each case, consistent with the analytical results.

4. Conclusions

Hyperspectral imaging is a powerful tool for the characterization of a broad range of materials, namely food and feed components. The objective of this work was threefold: (i) develop a generic HSI processing tool in python, agnostic in terms of hypercube dimensions; (ii) develop a procedure that combines analytical assays and HSI acquisition, in or-der to establish a correlation between the two sources of data; and (iii) apply the procedure to real components: a common food component (wheat flour) and a feed component (BSF larvae meal).
From an operational perspective, the study demonstrates that it is possible to obtain a quantitative and qualitative correlation between analytical results and HSI methodologies for food or feed product component characterization, specifically regarding moisture and total fat parameters, even when only the 400–1000 nm spectral range is considered. However, to fully exploit the characterization capabilities of the HSI methodology, it is essential to acquire data in the NIR above 1000 nm and up to 2500 nm. This extended range would allow for the detection of critical spectral features, particularly those associated with protein content. Future work will address this spectral range extension and the continuous upgrade of the software to include different HSI processing tools.
In the future, the interactions between different feed components and the specific applications of hyperspectral technology in real-time quality control can be further explored to enhance their translational value. This topic has been growing in recent years and will play a crucial role in establishing important correlations for the health and food industries.

Supplementary Materials

The following supporting information can be downloaded at: https://www.mdpi.com/article/10.3390/app15073822/s1, Figure S1. Band 80 (λ = 631.15 nm) and definition of the ROI (170 × 100 pixels): WR (cyan), and CT (orange). The circles were used to align the ROI; Figure S2. Mean spectrum of each tile: WR (cyan) and CT (orange). The bands correspond to the 17000 spectra obtained from the entire ROI of each tile; Figure S3. Mean spectra derived from the ROI, for each tile: (a) WR and CI band (cyan); (b) CT and CI band (orange). For each mean spectrum the 99% CI is presented; Figure S4. Mean spectra derived from the ROI, for each tile, for heating times 4, 6, 8, 12 min: (a) WR and CI band (cyan); (b) CT and CI band (orange). For each mean spectrum the 99% CI is presented; Figure S5. Mean spectra derived from the ROI, for each tile, for heating times 16, 20, 24, 28 min: (a) WR and CI band (cyan); (b) CT and CI band (orange). For each mean spectrum the 99% CI is presented (dark line); Figure S6. Variation of the 99% CI: (a) CI for each wavelength for all heating times for the WR mean spectrum (blue) and the CT mean spectrum (orange); (b) Maximum and minimum CI across the wavelengths for each heating time for the WR (blue) and the CT (orange). The dashed lines show the linear data fit. The heating time shows no significant influence on the CI of the mean spectra of either tile; Figure S7. Pearson correlation coefficients for each pair of spectra obtained with different heating times: (a) WR spectra; (b) CT spectra; Figure S8. Spearman rank correlation coefficients for each pair of spectra obtained with different heating times: (a) WR spectra; (b) CT spectra.

Author Contributions

Conceptualization, F.M.O.d.S. and L.G.F.; methodology, F.M.O.d.S.; software, N.S.A.P.; validation, R.F., D.M., M.J.C. and R.S.I.; formal analysis, F.M.O.d.S. and N.S.A.P.; investigation, F.M.O.d.S., L.G.F. and N.S.A.P.; resources, F.M.O.d.S., R.F., D.M. and N.S.A.P.; data curation, F.M.O.d.S. and N.S.A.P.; writing—original draft preparation, F.M.O.d.S., L.G.F. and N.S.A.P.; writing—review and editing, L.G.F., M.J.C., N.S.A.P. and R.S.I.; visualization, F.M.O.d.S., L.G.F. and N.S.A.P.; supervision, F.M.O.d.S.; project administration, N.S.A.P.; funding acquisition, D.M. All authors have read and agreed to the published version of the manuscript.

Funding

This research was funded by project “InsectERA” (01/C05-i09/2024.PC644917393-00000032), financed by Plano de Recuperação e Resiliência (PRR), República Portuguesa, Medida RE-C05—Agendas Mobilizadoras para a Inovação Empresarial e União Europeia, NextGenerationEU. Research Centres: MED (https://doi.org/10.54499/UIDB/05183/2020; https://doi.org/10.54499/UIDP/05183/2020); CHANGE (https://doi.org/10.54499/LA/P/0121/2020); University of Aveiro and FCT/MCTES (https://doi.org/10.54499/LA/P/0008/2020, https://doi.org/10.54499/UIDP/50006/2020 and https://doi.org/10.54499/UIDB/50006/2020), through national funds.

Institutional Review Board Statement

Not applicable.

Data Availability Statement

The raw data supporting the conclusions of this article will be made available by the authors on request.

Acknowledgments

We extend our gratitude to Daniela Chaparro for her invaluable assistance in performing the fat content analyses of the wheat flour samples used in this study.

Conflicts of Interest

Authors Rafaela Fantatto and Daniel Murta were employed by the company Ingredient Odyssey SA—EntoGreen. The remaining authors declare that the research was conducted in the absence of any commercial or financial relationships that could be construed as a potential conflict of interest.

References

  1. Daniso, E.; Tulli, F.; Cardinaletti, G.; Cerri, R.; Tibaldi, E. Molecular Approach for Insect Detection in Feed and Food: The Case of Gryllodes Sigillatus. Eur. Food Res. Technol. 2020, 246, 2373–2381. [Google Scholar] [CrossRef]
  2. COMMISSION REGULATION (EU) 2017/893 of 24 May 2017-Amending Annexes I and IV to Regu-518 Lation (EC) No 999/2001 of the European Parliament and of the Council and Annexes X, XIV and XV to Commission Regulation 519 (EU). Available online: https://eur-lex.europa.eu/eli/reg/2017/893/oj/eng (accessed on 1 January 2025).
  3. Tan, X.; Yang, H.S.; Wang, M.; Yi, Z.F.; Ji, F.J.; Li, J.Z.; Yin, Y.L. Amino Acid Digestibility in Housefly and Black Soldier Fly Prepupae by Growing Pigs. Anim. Feed Sci. Technol. 2020, 263, 114446. [Google Scholar] [CrossRef]
  4. Star, L.; Arsiwalla, T.; Molist, F.; Leushuis, R.; Dalim, M.; Paul, A. Gradual Provision of Live Black Soldier Fly (Hermetia illucens) Larvae to Older Laying Hens: Effect on Production Performance, Egg Quality, Feather Condition and Behavior. Animals 2020, 10, 216. [Google Scholar] [CrossRef] [PubMed]
  5. Zhang, J.; Zhang, J.; Li, J.; Tomerlin, J.K.; Xiao, X.; ur Rehman, K.; Cai, M.; Zheng, L.; YU, Z. Black Soldier Fly: A New Vista for Livestock and Poultry Manure Management. J. Integr. Agric. 2021, 20, 1167–1179. [Google Scholar] [CrossRef]
  6. Parodi, A.; Gerrits, W.J.J.; Van Loon, J.J.A.; De Boer, I.J.M.; Aarnink, A.J.A.; Van Zanten, H.H.E. Black Soldier Fly Reared on Pig Manure: Bioconversion Efficiencies, Nutrients in the Residual Material, Greenhouse Gas and Ammonia Emissions. Waste Manag. 2021, 126, 674–683. [Google Scholar] [CrossRef] [PubMed]
  7. Mohan, K.; Rajan, D.K.; Muralisankar, T.; Ganesan, A.R.; Sathishkumar, P.; Revathi, N. Use of Black Soldier Fly (Hermetia illucens L.) Larvae Meal in Aquafeeds for a Sustainable Aquaculture Industry: A Review of Past and Future Needs. Aquaculture 2022, 553, 738095. [Google Scholar] [CrossRef]
  8. Alamu, E.; Maziya-Dixon, B.; Zum Felde, T.; Kulakow, P.; Parkes, E. Application of near Infrared Reflectance Spectroscopy in Screening of Fresh Cassava (Manihot Esculenta Crantz) Storage Roots for Provitamin A Carotenoids. In Proceedings of the 18th International Conference on Near Infrared Spectroscopy, Gold Cost, Australia, 15–20 September 2019; IM Publications Open LLP: Chichester, UK, 2019; pp. 91–97. [Google Scholar]
  9. Adebayo, S.E.; Hashim, N.; Abdan, K.; Hanafi, M. Application and Potential of Backscattering Imaging Techniques in Agricultural and Food Processing—A Review. J. Food Eng. 2016, 169, 155–164. [Google Scholar] [CrossRef]
  10. Adesokan, M.; Alamu, E.O.; Otegbayo, B.; Maziya-Dixon, B. A Review of the Use of Near-Infrared Hyperspectral Imaging (NIR-HSI) Techniques for the Non-Destructive Quality Assessment of Root and Tuber Crops. Appl. Sci. 2023, 13, 5226. [Google Scholar] [CrossRef]
  11. Li, L.; Zhang, Q.; Huang, D. A Review of Imaging Techniques for Plant Phenotyping. Sensors 2014, 14, 20078–20111. [Google Scholar] [CrossRef]
  12. Rady, A.; Guyer, D.; Lu, R. Evaluation of Sugar Content of Potatoes Using Hyperspectral Imaging. Food Bioproc. Technol. 2015, 8, 995–1010. [Google Scholar] [CrossRef]
  13. Amjad, W.; Crichton, S.O.J.; Munir, A.; Hensel, O.; Sturm, B. Hyperspectral Imaging for the Determination of Potato Slice Moisture Content and Chromaticity during the Convective Hot Air Drying Process. Biosyst. Eng. 2018, 166, 170–183. [Google Scholar] [CrossRef]
  14. Nguyen Do Trong, N.; Erkinbaev, C.; Nicolaï, B.; Saeys, W.; Tsuta, M.; De Baerdemaeker, J. Spatially Resolved Spectroscopy for Nondestructive Quality Measurements of Braeburn Apples Cultivated in Sub-Fertilization Condition; Kondo, N., Ed.; SPIE: Bellingham, WA, USA, 2013; p. 88810L. [Google Scholar]
  15. Cruz-Tirado, J.P.; Amigo, J.M.; Barbin, D.F. Determination of Protein Content in Single Black Fly Soldier (Hermetia illucens L.) Larvae by near Infrared Hyperspectral Imaging (NIR-HSI) and Chemometrics. Food Control 2023, 143, 109266. [Google Scholar] [CrossRef]
  16. Osborne, B.G. Near-Infrared Spectroscopy in Food Analysis. In Encyclopedia of Analytical Chemistry; Wiley: Hoboken, NJ, USA, 2000. [Google Scholar]
  17. Zhou, M.; Long, T.; Zhao, Z.; Chen, J.; Wu, Q.; Wang, Y.; Zou, Z. Honey Quality Detection Based on Near-Infrared Spectroscopy. Food Sci. Technol. 2023, 43, e98822. [Google Scholar] [CrossRef]
  18. Zou, Z.; Chen, J.; Wang, L.; Wu, W.; Yu, T.; Wang, Y.; Zhao, Y.; Huang, P.; Liu, B.; Zhou, M.; et al. Nondestructive Detection of Peanuts Mildew Based on Hyperspectral Image Technology and Machine Learning Algorithm. Food Sci. Technol. 2022, 42, e71322. [Google Scholar] [CrossRef]
  19. Zou, Z.; Long, T.; Chen, J.; Wang, L.; Wu, X.; Zou, B.; Xu, L. Rapid Identification of Adulterated Safflower Seed Oil by Use of Hyperspectral Spectroscopy. Spectrosc. Lett. 2021, 54, 675–684. [Google Scholar] [CrossRef]
  20. Specim, Spectral Imaging Datacube, Specim IQ and Spectral Imaging. Available online: https://www.specim.com/downloads/iq/manual/software/iq/topics/data-cube.html (accessed on 6 March 2025).
  21. Specim. Specim IQ Check Calibration. Specim IQ User Manual. Available online: https://www.specim.com/downloads/iq/manual/spectral-cameras/IQ/topics/checking-the-calibration.html (accessed on 6 March 2025).
  22. NV5. ENVI Image Files. Docs Center. Available online: https://www.nv5geospatialsoftware.com/docs/enviimagefiles.html (accessed on 6 March 2025).
  23. Barnes, R.J.; Dhanoa, M.S.; Lister, S.J. Standard Normal Variate Transformation and De-Trending of Near-Infrared Diffuse Reflectance Spectra. Appl. Spectrosc. 1989, 43, 772–777. [Google Scholar] [CrossRef]
  24. Kruse, F.A.; Lefkoff, A.B.; Boardman, J.W.; Heidebrecht, K.B.; Shapiro, A.T.; Barloon, P.J.; Goetz, A.F.H. The Spectral Image Processing System (SIPS)—Interactive Visualization and Analysis of Imaging Spectrometer Data. Remote Sens. Environ. 1993, 44, 145–163. [Google Scholar] [CrossRef]
  25. Abraham, S.; Golay, M.J.E. Smoothing and Differentiation of Data by Simplified Least Squares Procedures. Anal. Chem. 1964, 36, 1627–1639. [Google Scholar] [CrossRef]
  26. Sindhu, M. Physicochemical Properties and Nutritional Evaluation of Wheat and Water Chestnut Composite Flour. Int. J. Chem. Stud. 2020, 8, 1914–1919. [Google Scholar] [CrossRef]
  27. Sujitha, J.; Muneer, M.R.S.; Mahendran, T.; Kiruthiga, B. Influence of Storage Temperature on the Quality Parameters of Wheat Flour during Short Term Storage. Sabaragamuwa Univ. J. 2018, 16, 53–57. [Google Scholar] [CrossRef]
  28. David, O.; Arthur, E.; Kwadwo, S.O.; Badu, E.; Sakyi, P. Proximate Composition and Some Functional Properties of Soft Wheat Flour. Int. J. Innov. Res. Sci. Eng. Technol. 2015, 4, 753–758. [Google Scholar]
  29. Lu, S.; Taethaisong, N.; Meethip, W.; Surakhunthod, J.; Sinpru, B.; Sroichak, T.; Archa, P.; Thongpea, S.; Paengkoum, S.; Purba, R.A.P.; et al. Nutritional Composition of Black Soldier Fly Larvae (Hermetia illucens L.) and Its Potential Uses as Alternative Protein Sources in Animal Diets: A Review. Insects 2022, 13, 831. [Google Scholar] [CrossRef]
  30. Tognocchi, M.; Abenaim, L.; Adamaki-Sotiraki, C.; Athanassiou, G.C.; Rumbos, I.C.; Mele, M.; Conti, B.; Conte, G. Effect of Different Diet Composition on the Fat Profile of Two Different Black Soldier Fly Larvae Populations. Animal 2024, 18, 101205. [Google Scholar] [CrossRef] [PubMed]
  31. Gutiérrez, Y.; Fresch, M.; Ott, D.; Brockmeyer, J.; Scherber, C. Diet Composition and Social Environment Determine Food Consumption, Phenotype and Fecundity in an Omnivorous Insect. R. Soc. Open Sci. 2020, 7, 200100. [Google Scholar] [CrossRef] [PubMed]
  32. Elwert, C.; Ivonne, K.; Peter, K. A Novel Protein Source: Maggot Meal of the Black Soldier Fly (Hermetia illucens) in Broiler Feed. Tag. Schweine Geflügelernährung 2010, 11, 140–142. [Google Scholar]
  33. Pope, R.M.; Fry, E.S. Absorption Spectrum (380–700 Nm) of Pure Water II Integrating Cavity Measurements. Appl. Opt. 1997, 36, 8710. [Google Scholar] [CrossRef]
Figure 1. Detail of the experimental apparatus: (a) Hyperspectral camera, (b) BSF meal sample, and (c) white reference, over a Teflon® sheet (black sheet).
Applsci 15 03822 g001
Figure 2. Experimental setup during the Specim IQ spectral range calibration check: (a) White reference and (b) calibration tile (SN: 190-110766), provided by the manufacturer (bottom left corner); (c) camera; (d) projectors with halogen lamps.
Applsci 15 03822 g002
Figure 3. (a) Wheat flour and (b) BSF larvae meal, with the (c) white reference disposed on a Teflon® sheet, during HSI acquisition in simultaneous mode. The white reference is used by the acquisition system to convert the raw measurements into reflectance (a spectral range calibration check with a valid result is required).
Applsci 15 03822 g003
Figure 4. Simplified version of the hypercubes generated during the HSI acquisition. Each layer (XY plane) corresponds to spatial data for a specific band, characterized by its central wavelength (λ). A hyper-pixel, illustrated as red squares, is a vector whose components represent the reflectance values associated with each band, forming a spectrum.
Applsci 15 03822 g004
Figure 5. Band 200 (λ = 994.31 nm) of the wheat flour (a) and BSF meal (b), after normalization, with a 40 × 30 pixels ROI (cyan rectangle) used for mean spectrum computation.
Applsci 15 03822 g005
Figure 6. Mean spectrum inside the ROI computed with 1200 pixels (pale blue lines), for the wheat flour (a) and the BSF larvae flour (b) samples.
Applsci 15 03822 g006
Figure 7. Mean spectrum processing: (a) Wheat flour spectrum after Standard Normal Variate (SNV) transformation; (b) Wheat flour spectrum + SNV after applying the SGd2 filter; (c) BSF larvae meal spectrum after Standard Normal Variate (SNV) transformation; (d) BSF larvae spectrum + SNV after applying the SGd2 filter.
Applsci 15 03822 g007
Figure 8. Comparison of processed spectra of BSF larvae meal and wheat flour: mean spectra of each sample derived from the ROI (b); corresponding spectra processed with SNV and SGd2 filtering (a). Vertical dashed lines indicate the positions of the relevant absorption features.
Applsci 15 03822 g008
Table 1. Evaluated parameters for BSF meal and wheat flour using standard analytical methods (in g/100 g of samples).
ParametersBSF Meal (%)Wheat Flour (%)
Moisture7.20 ± 0.073.10 ± 0.13
Crude fat28.40 ± 0.211.00 ± 0.07
Other compounds 164.40 ± 0.1895.90 ± 0.13
1 Protein, fiber, high-quality amino acids, minerals, among others.
Disclaimer/Publisher’s Note: The statements, opinions and data contained in all publications are solely those of the individual author(s) and contributor(s) and not of MDPI and/or the editor(s). MDPI and/or the editor(s) disclaim responsibility for any injury to people or property resulting from any ideas, methods, instructions or products referred to in the content.

