
Key Performance Indicators for Food Supply Chain: A Bibliometric and Systematic Literature Review


Abstract
:1. Introduction
- RQ1. How is the research on KPIs for the FSC characterized?
- RQ2. What are the most frequent and persistent topics over time, and how do they relate to main research themes?
- RQ3. How can KPIs for the FSC be classified? Which different products have been predominantly studied? What FSC processes and activities are covered by KPIs?
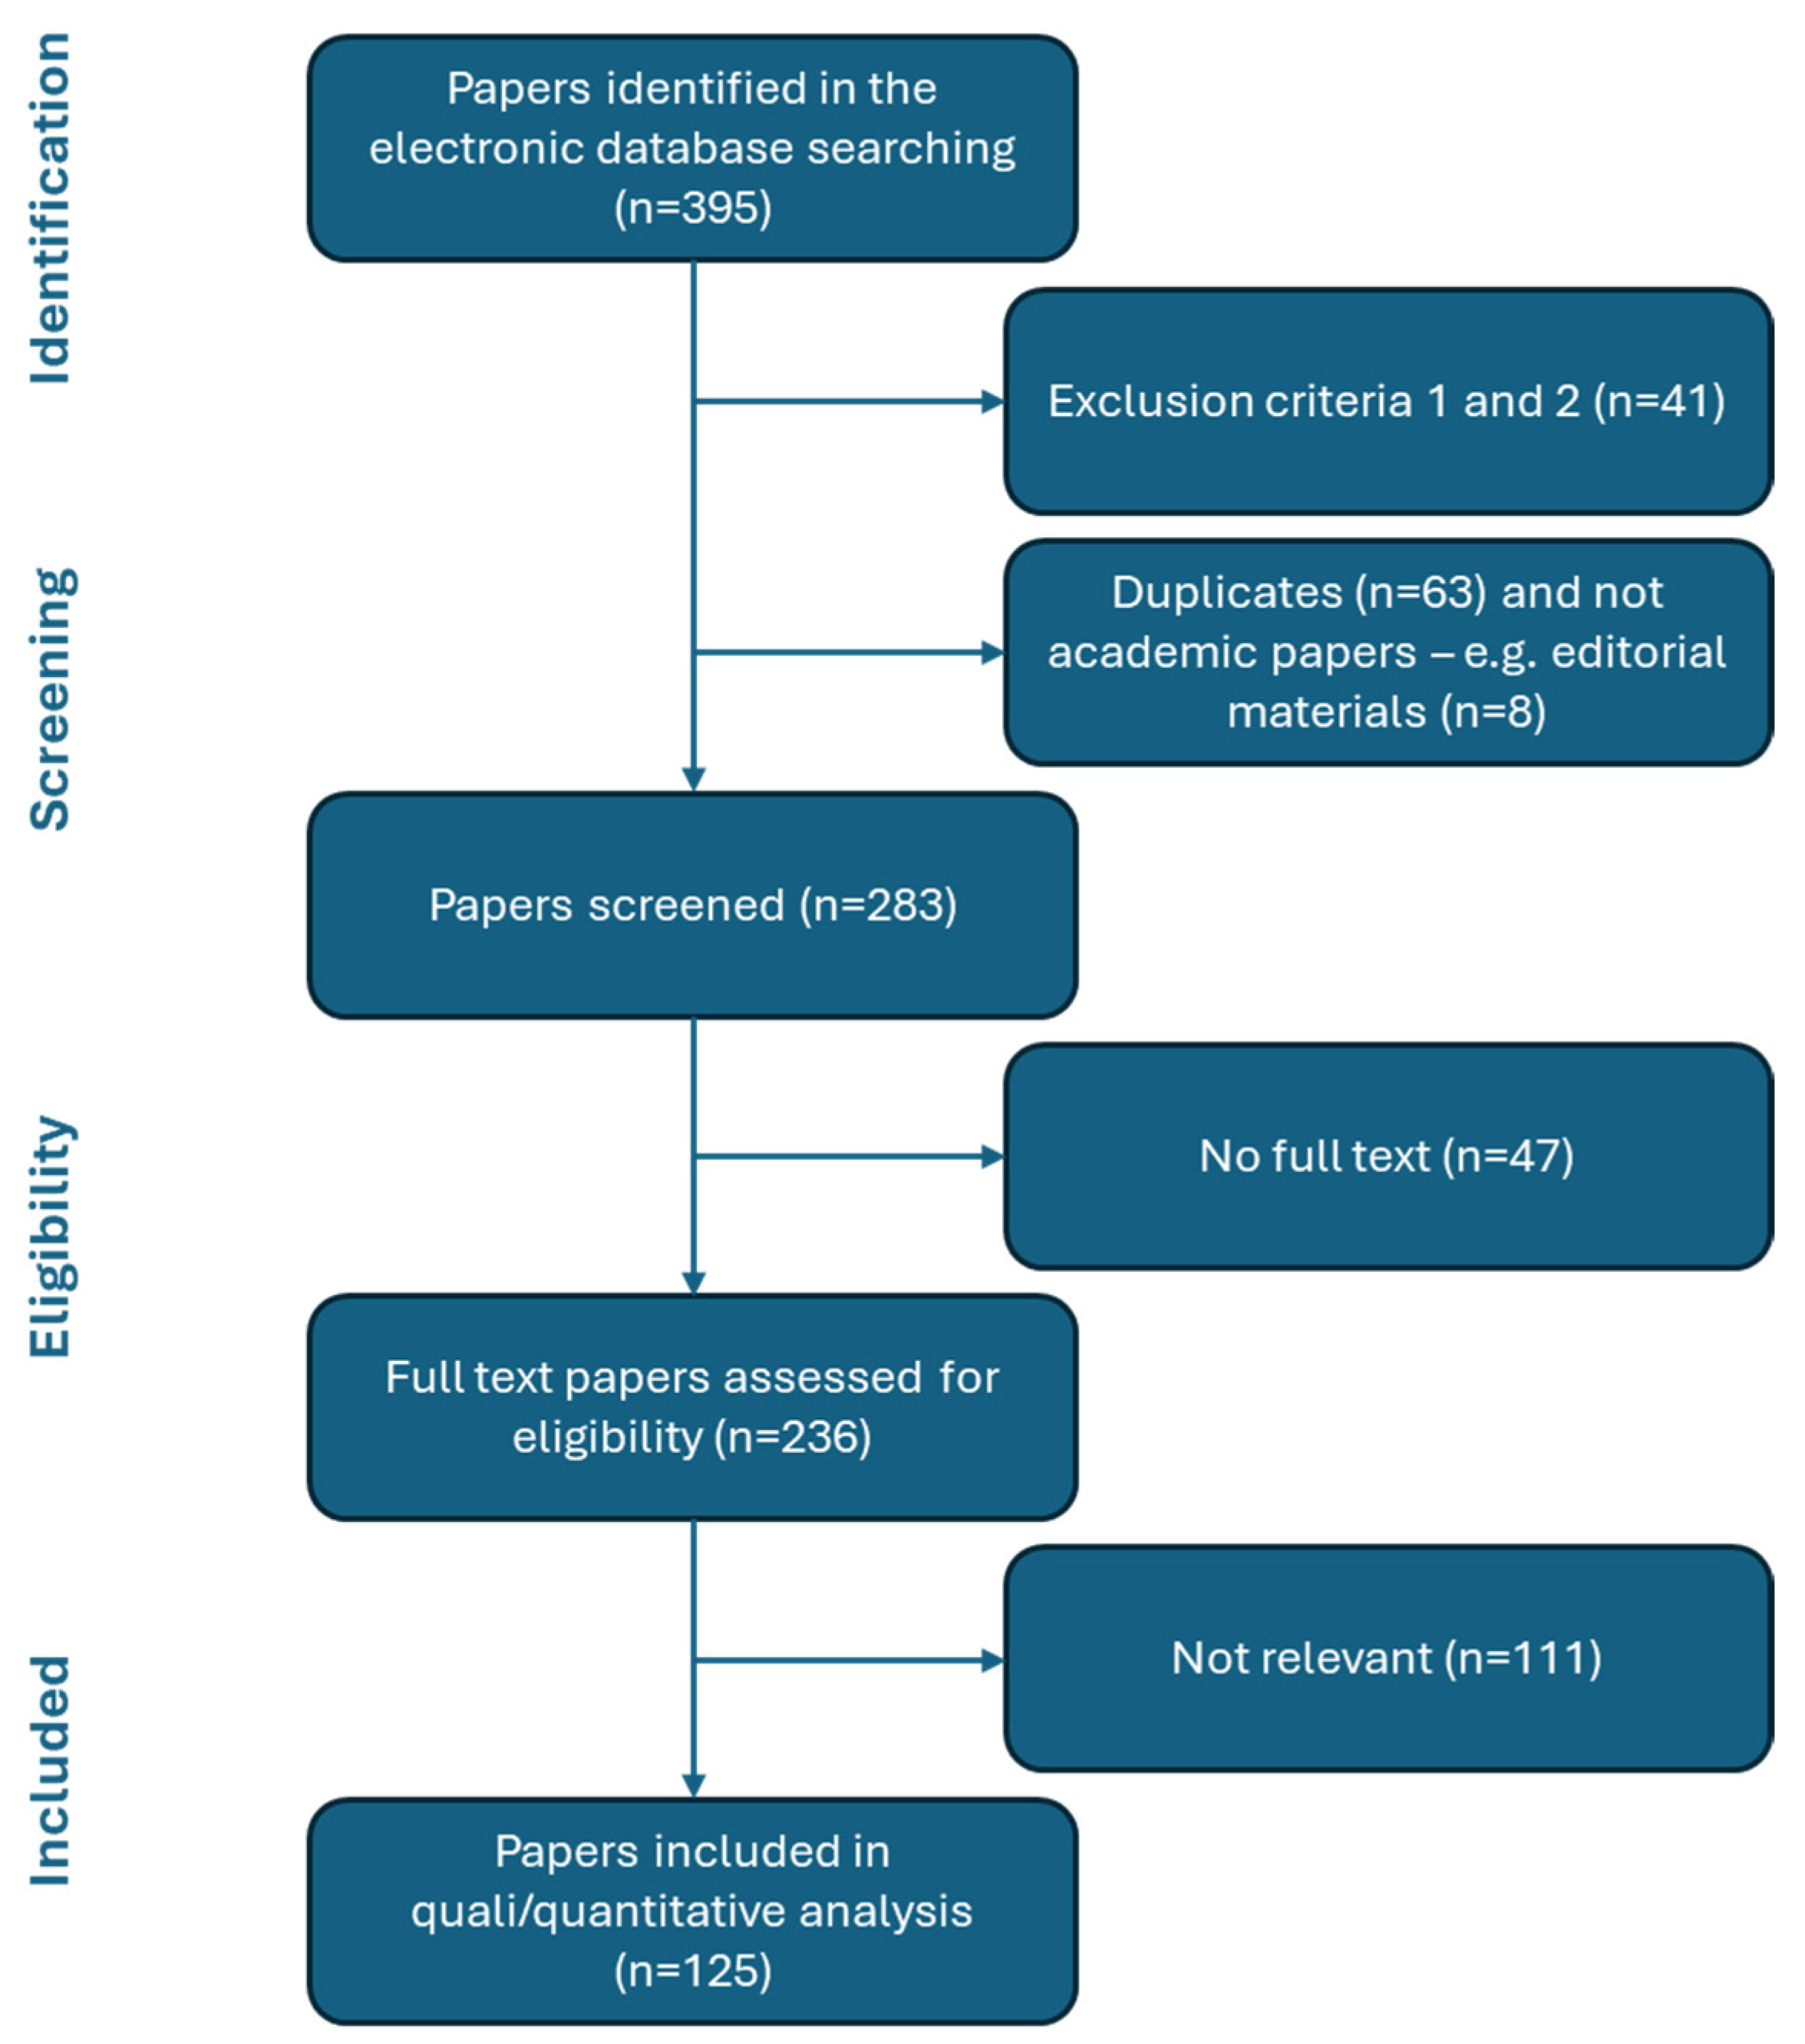
2. Review Methodology
2.1. Sample Creation
- Documents different from journal articles, reviews, and conference papers as document types (Exclusion criterium #1)
- Studies not in English language (Exclusion criterium #2)
2.2. Procedure for Analyzing the Papers
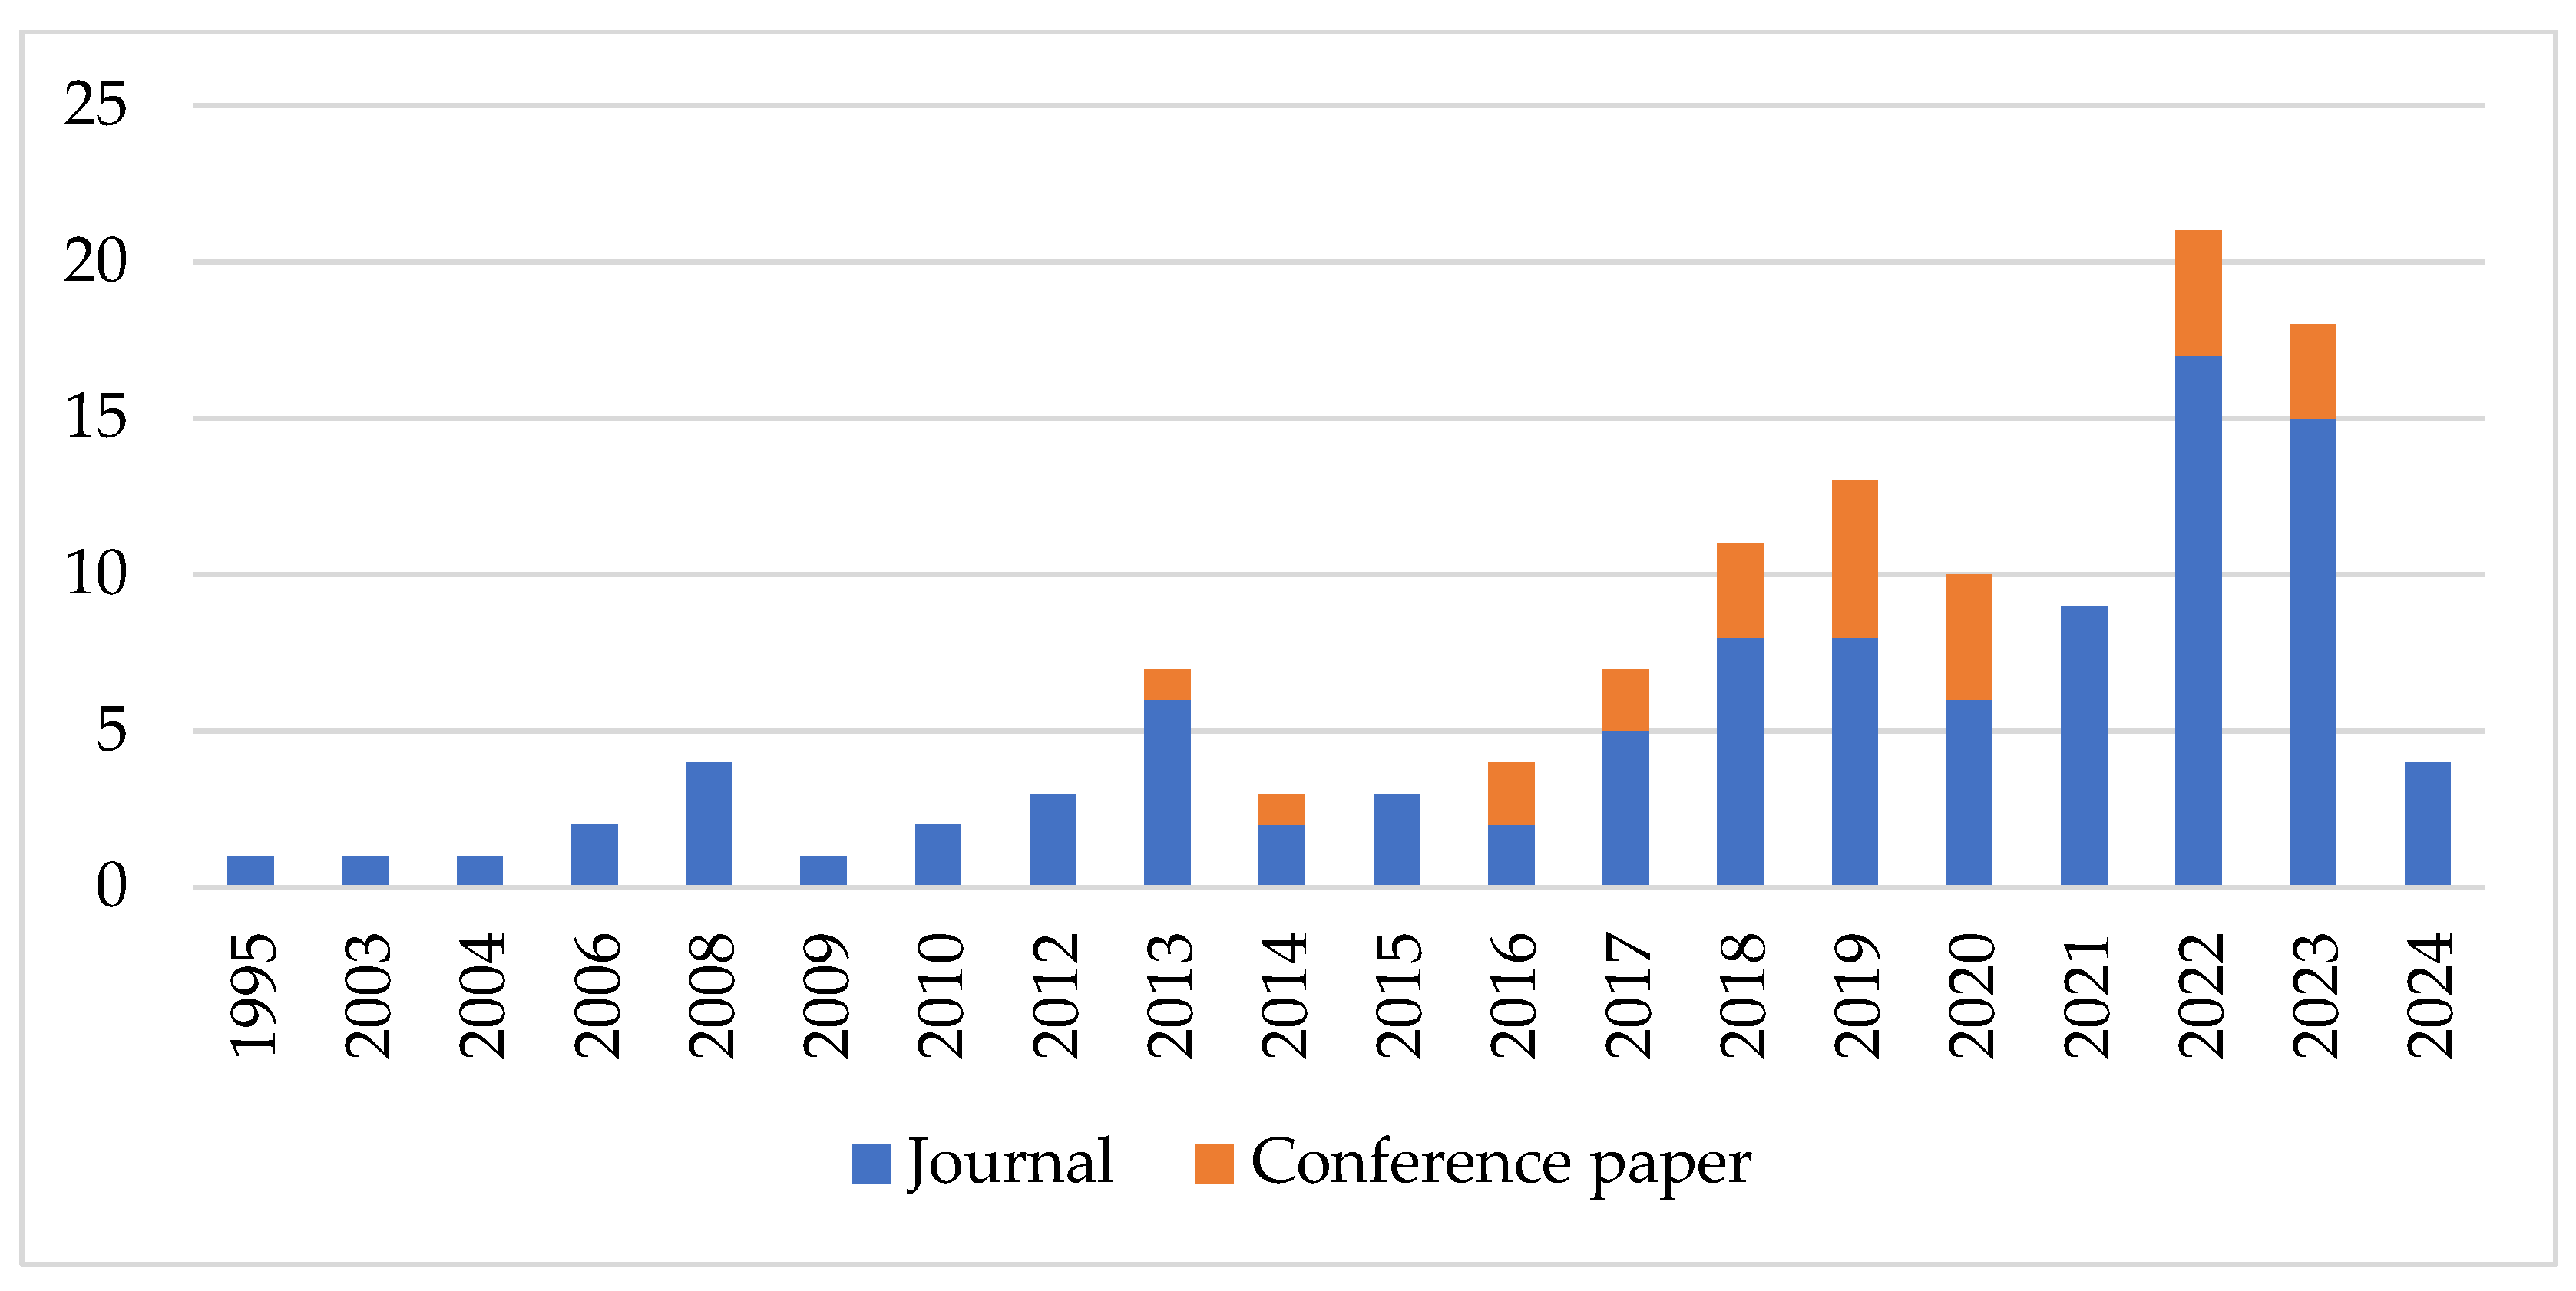
2.2.1. Statistical Analyses
- (i)
- The temporal evolution of the papers by publication year;
- (ii)
- The papers’ distribution by publication type and research methodology, according to the classes in Table 2;
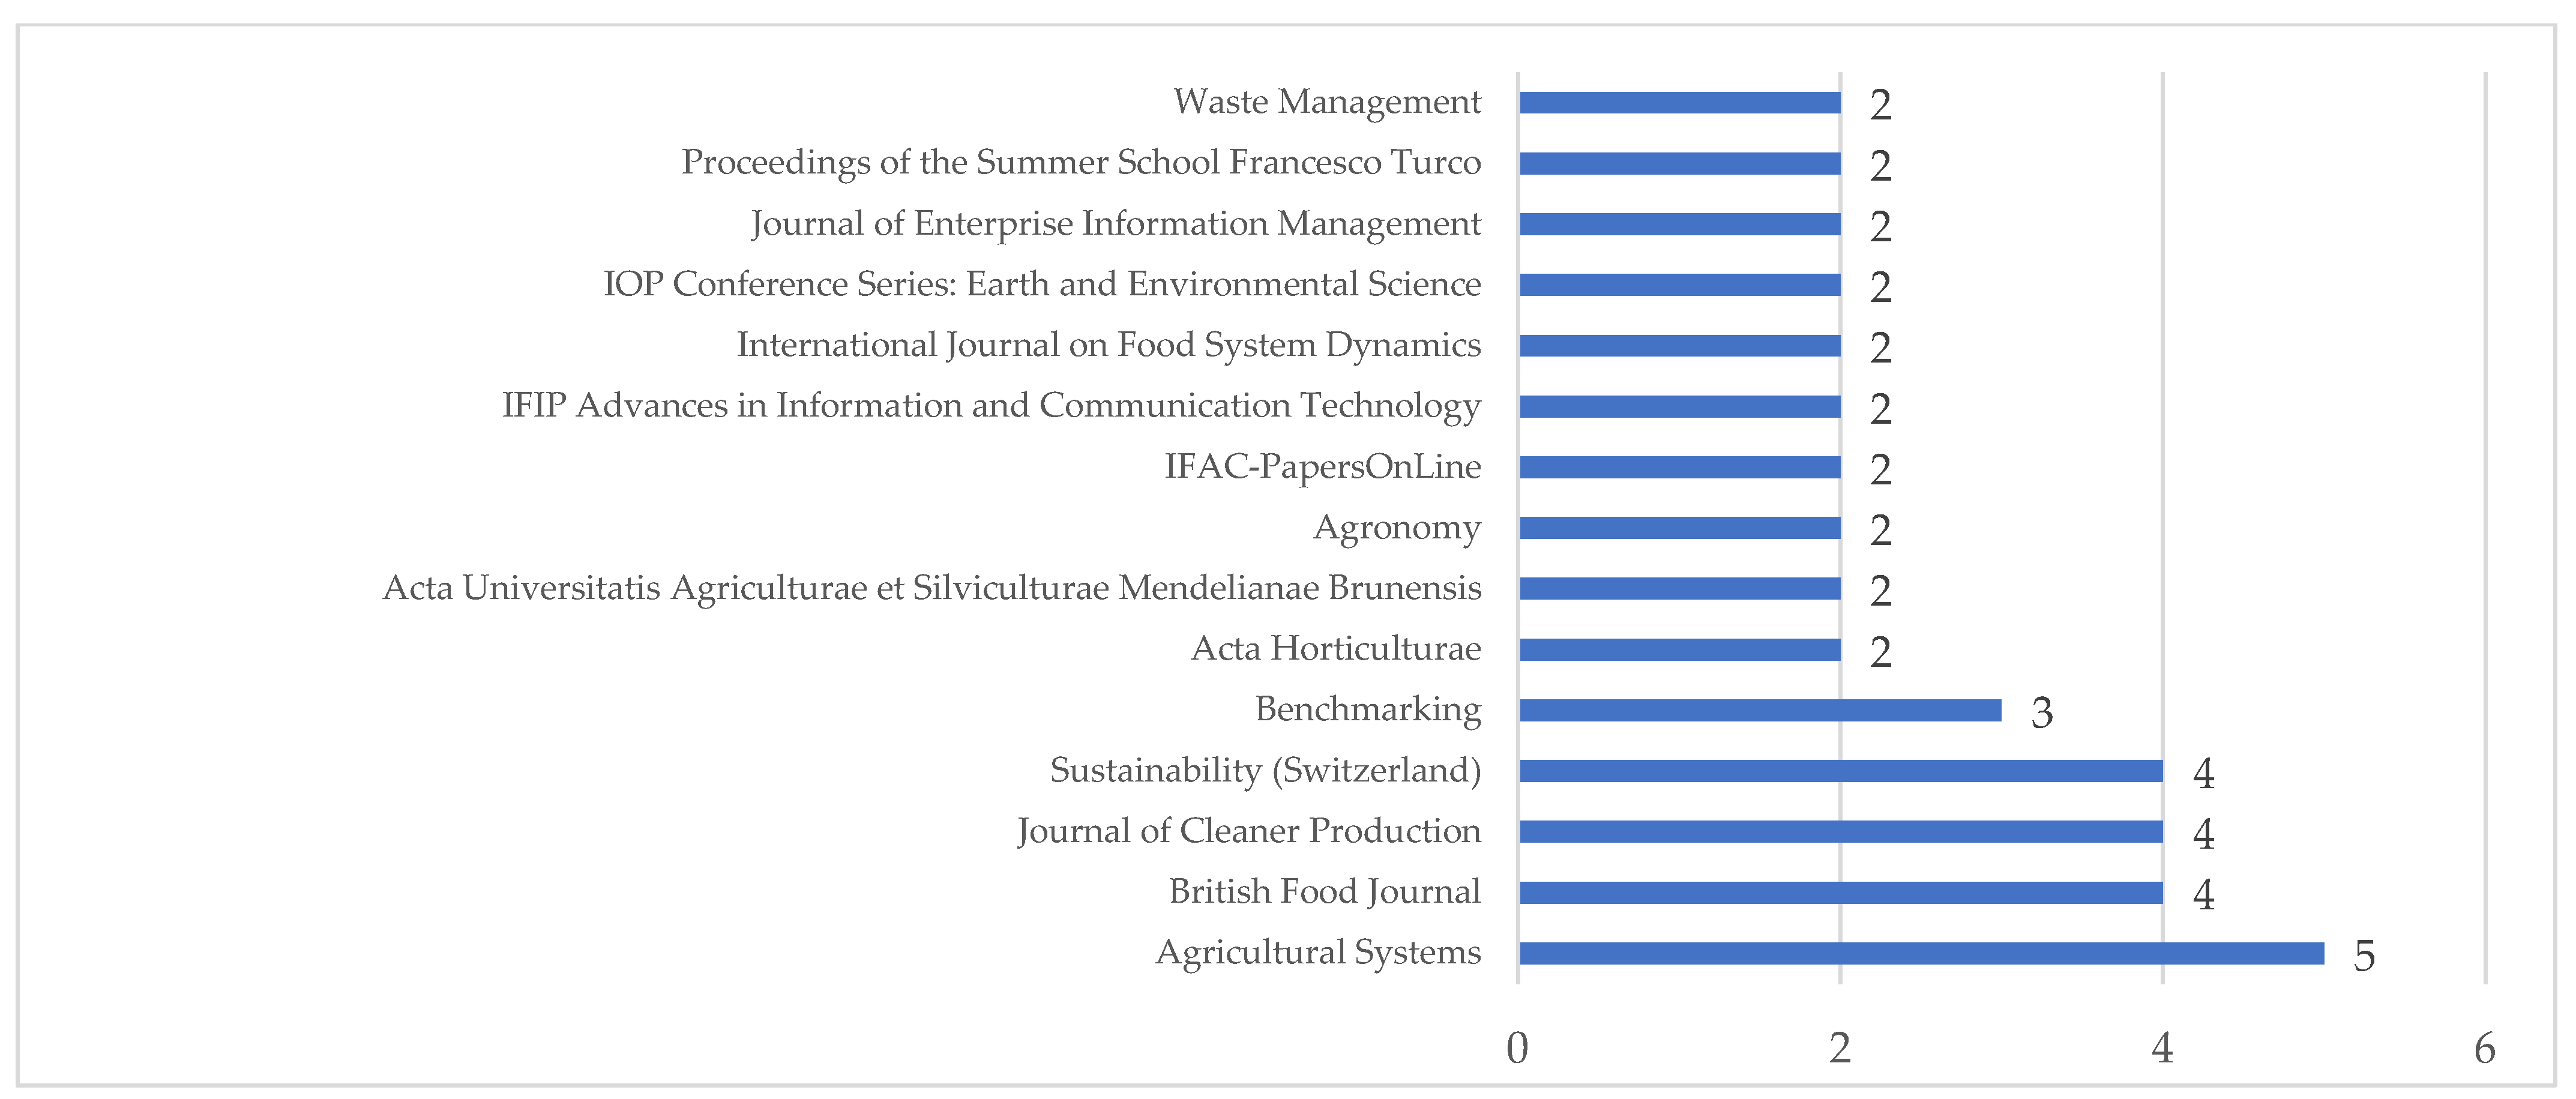
- (iii)
- The most productive journals;
- (iv)
- A geographic mapping of the publications according to the author’s nationality;
- (v)
- The top-cited papers;
- (vi)
- The outstanding authors, as a function of the number of documents written.
2.2.2. Keyword Analysis
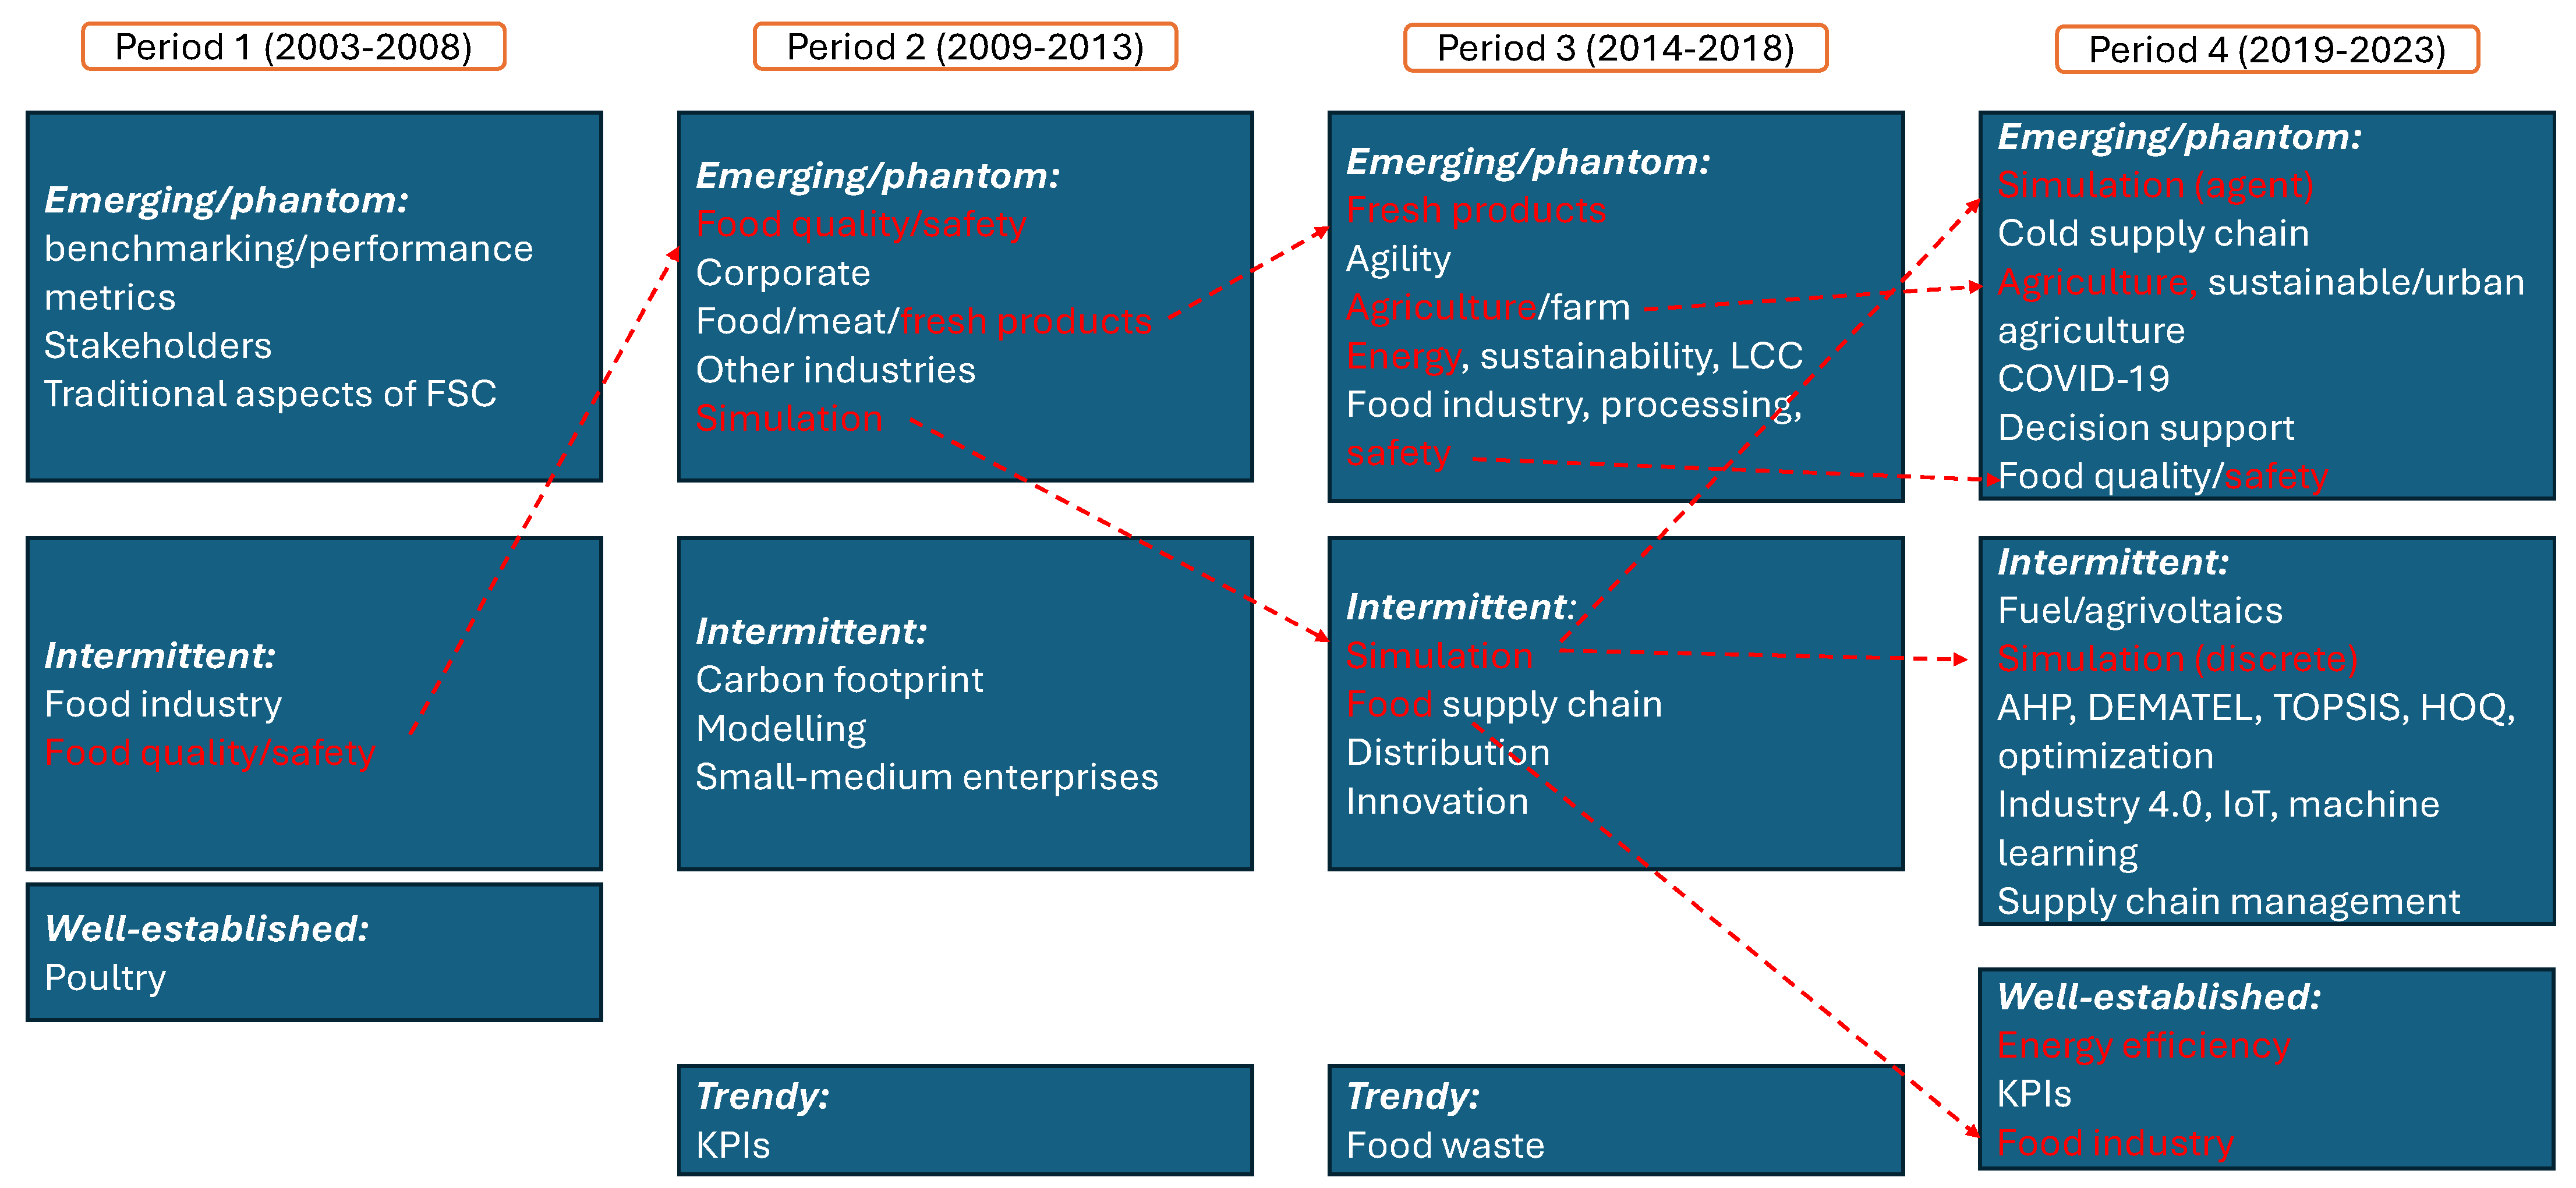
- Low-persistence and low-frequency: emerging/phantom concepts. These topics could be relatively new to the research field or could describe themes that have progressively disappeared.
- Low-persistence and high-frequency: trendy concepts. These topics are relatively new but have already attracted the attention of numerous researchers in the field.
- High-persistence and low-frequency: intermittent concepts. Terms in this category denote themes that have been known for many years, but have been studied with low continuity.
- High-persistence and high-frequency: well-established (core) concepts. Relating terms are expected to denote themes that have long been studied by many authors in the field.
2.2.3. Content Analysis
- (i)
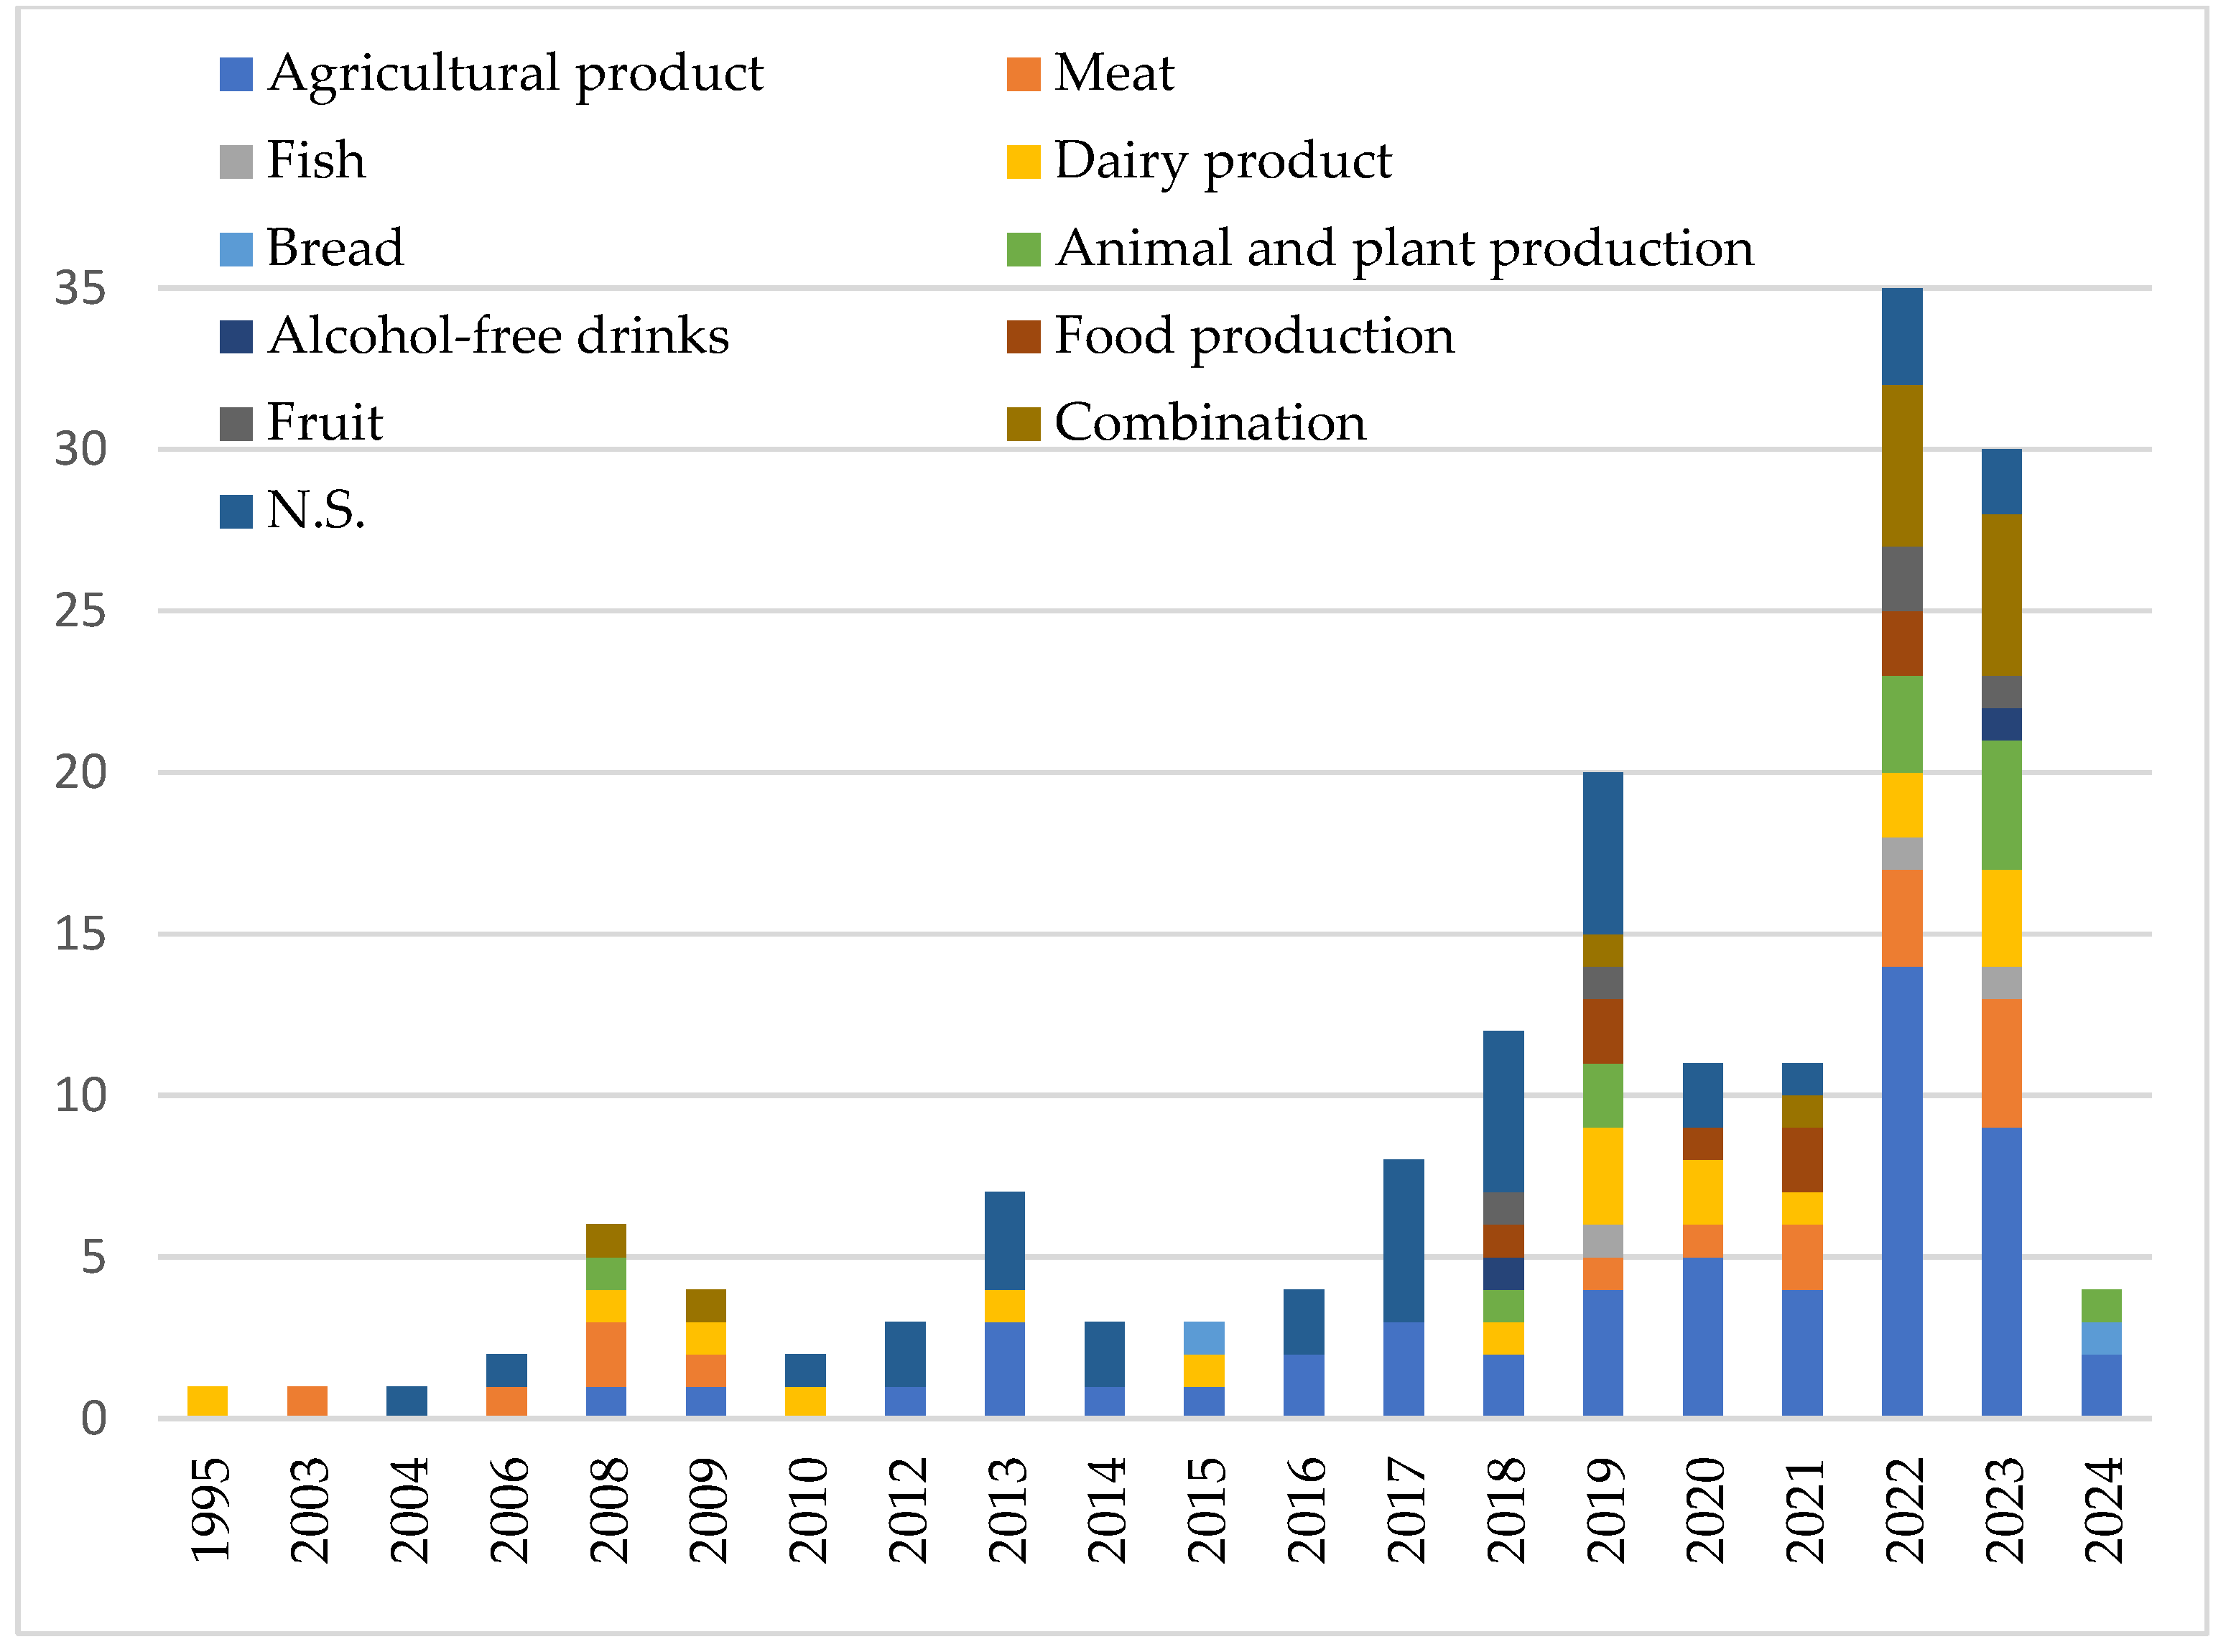
- The time distribution of papers for the different products treated in the FSC;
- (ii)
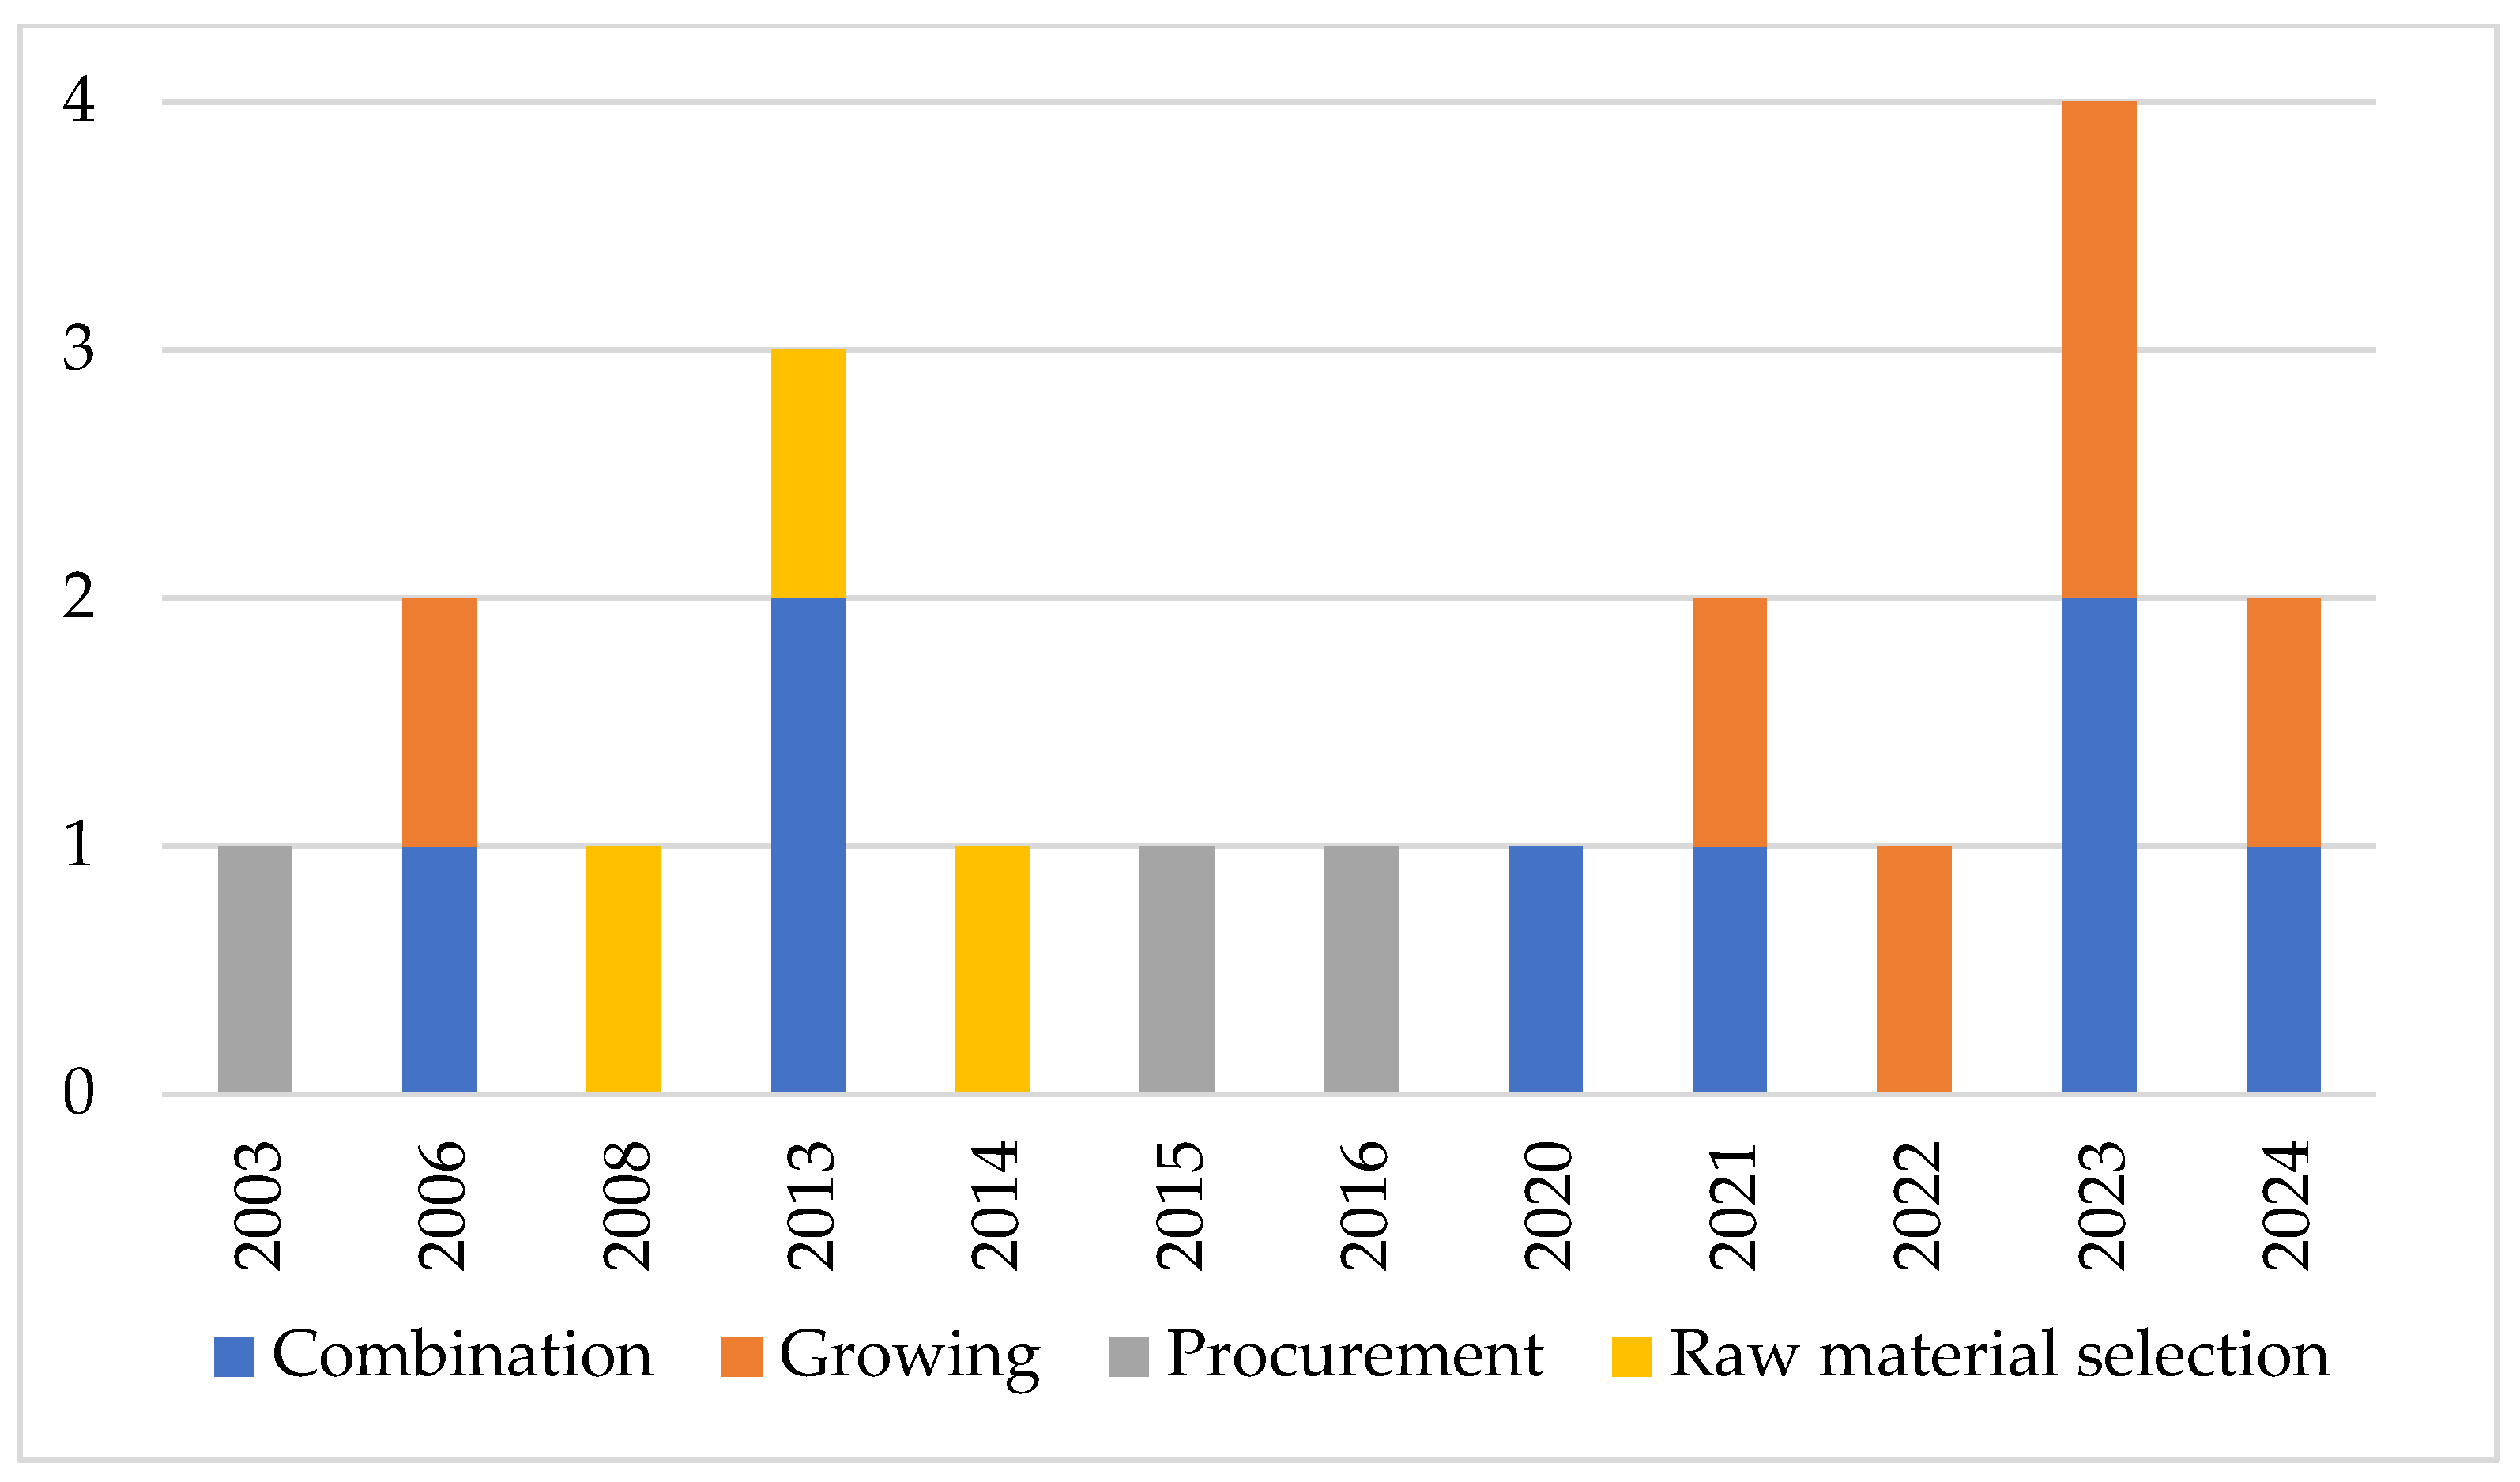
- The papers’ distribution by FSC areas;
- (iii)
- The trend of publications by KPI categories.
3. Results
3.1. Outcomes of the Statistical Analyses
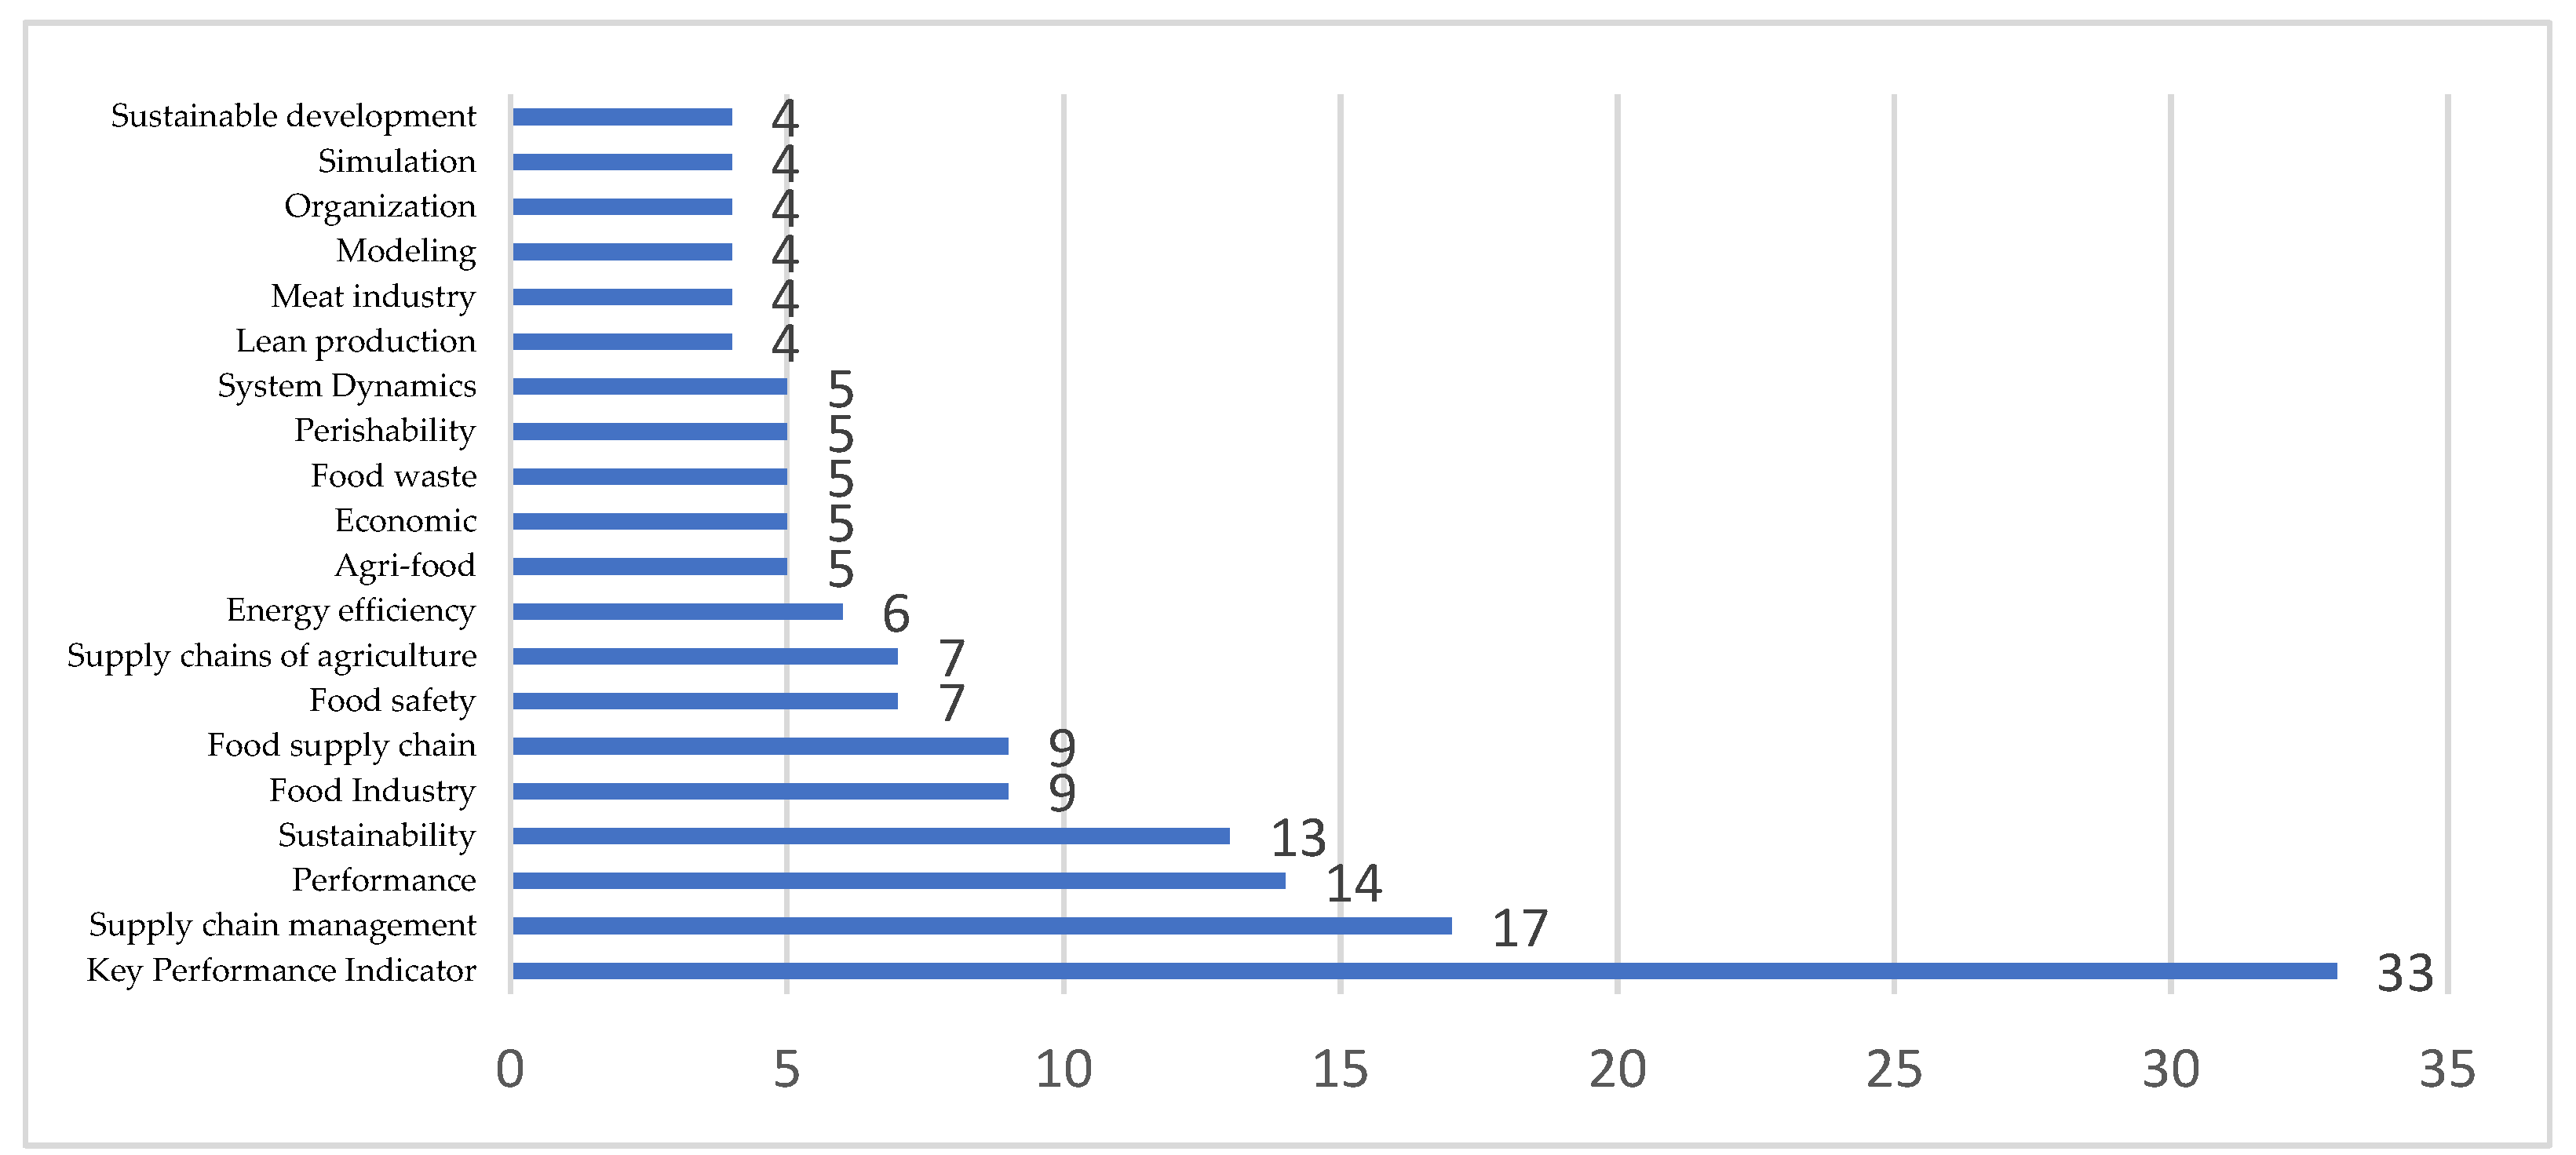
3.2. Outcomes of the Keyword Analysis
- Persistence: half of the timespan covered by the 114 studies, i.e.,
- Frequency: median value of the observations, i.e.,
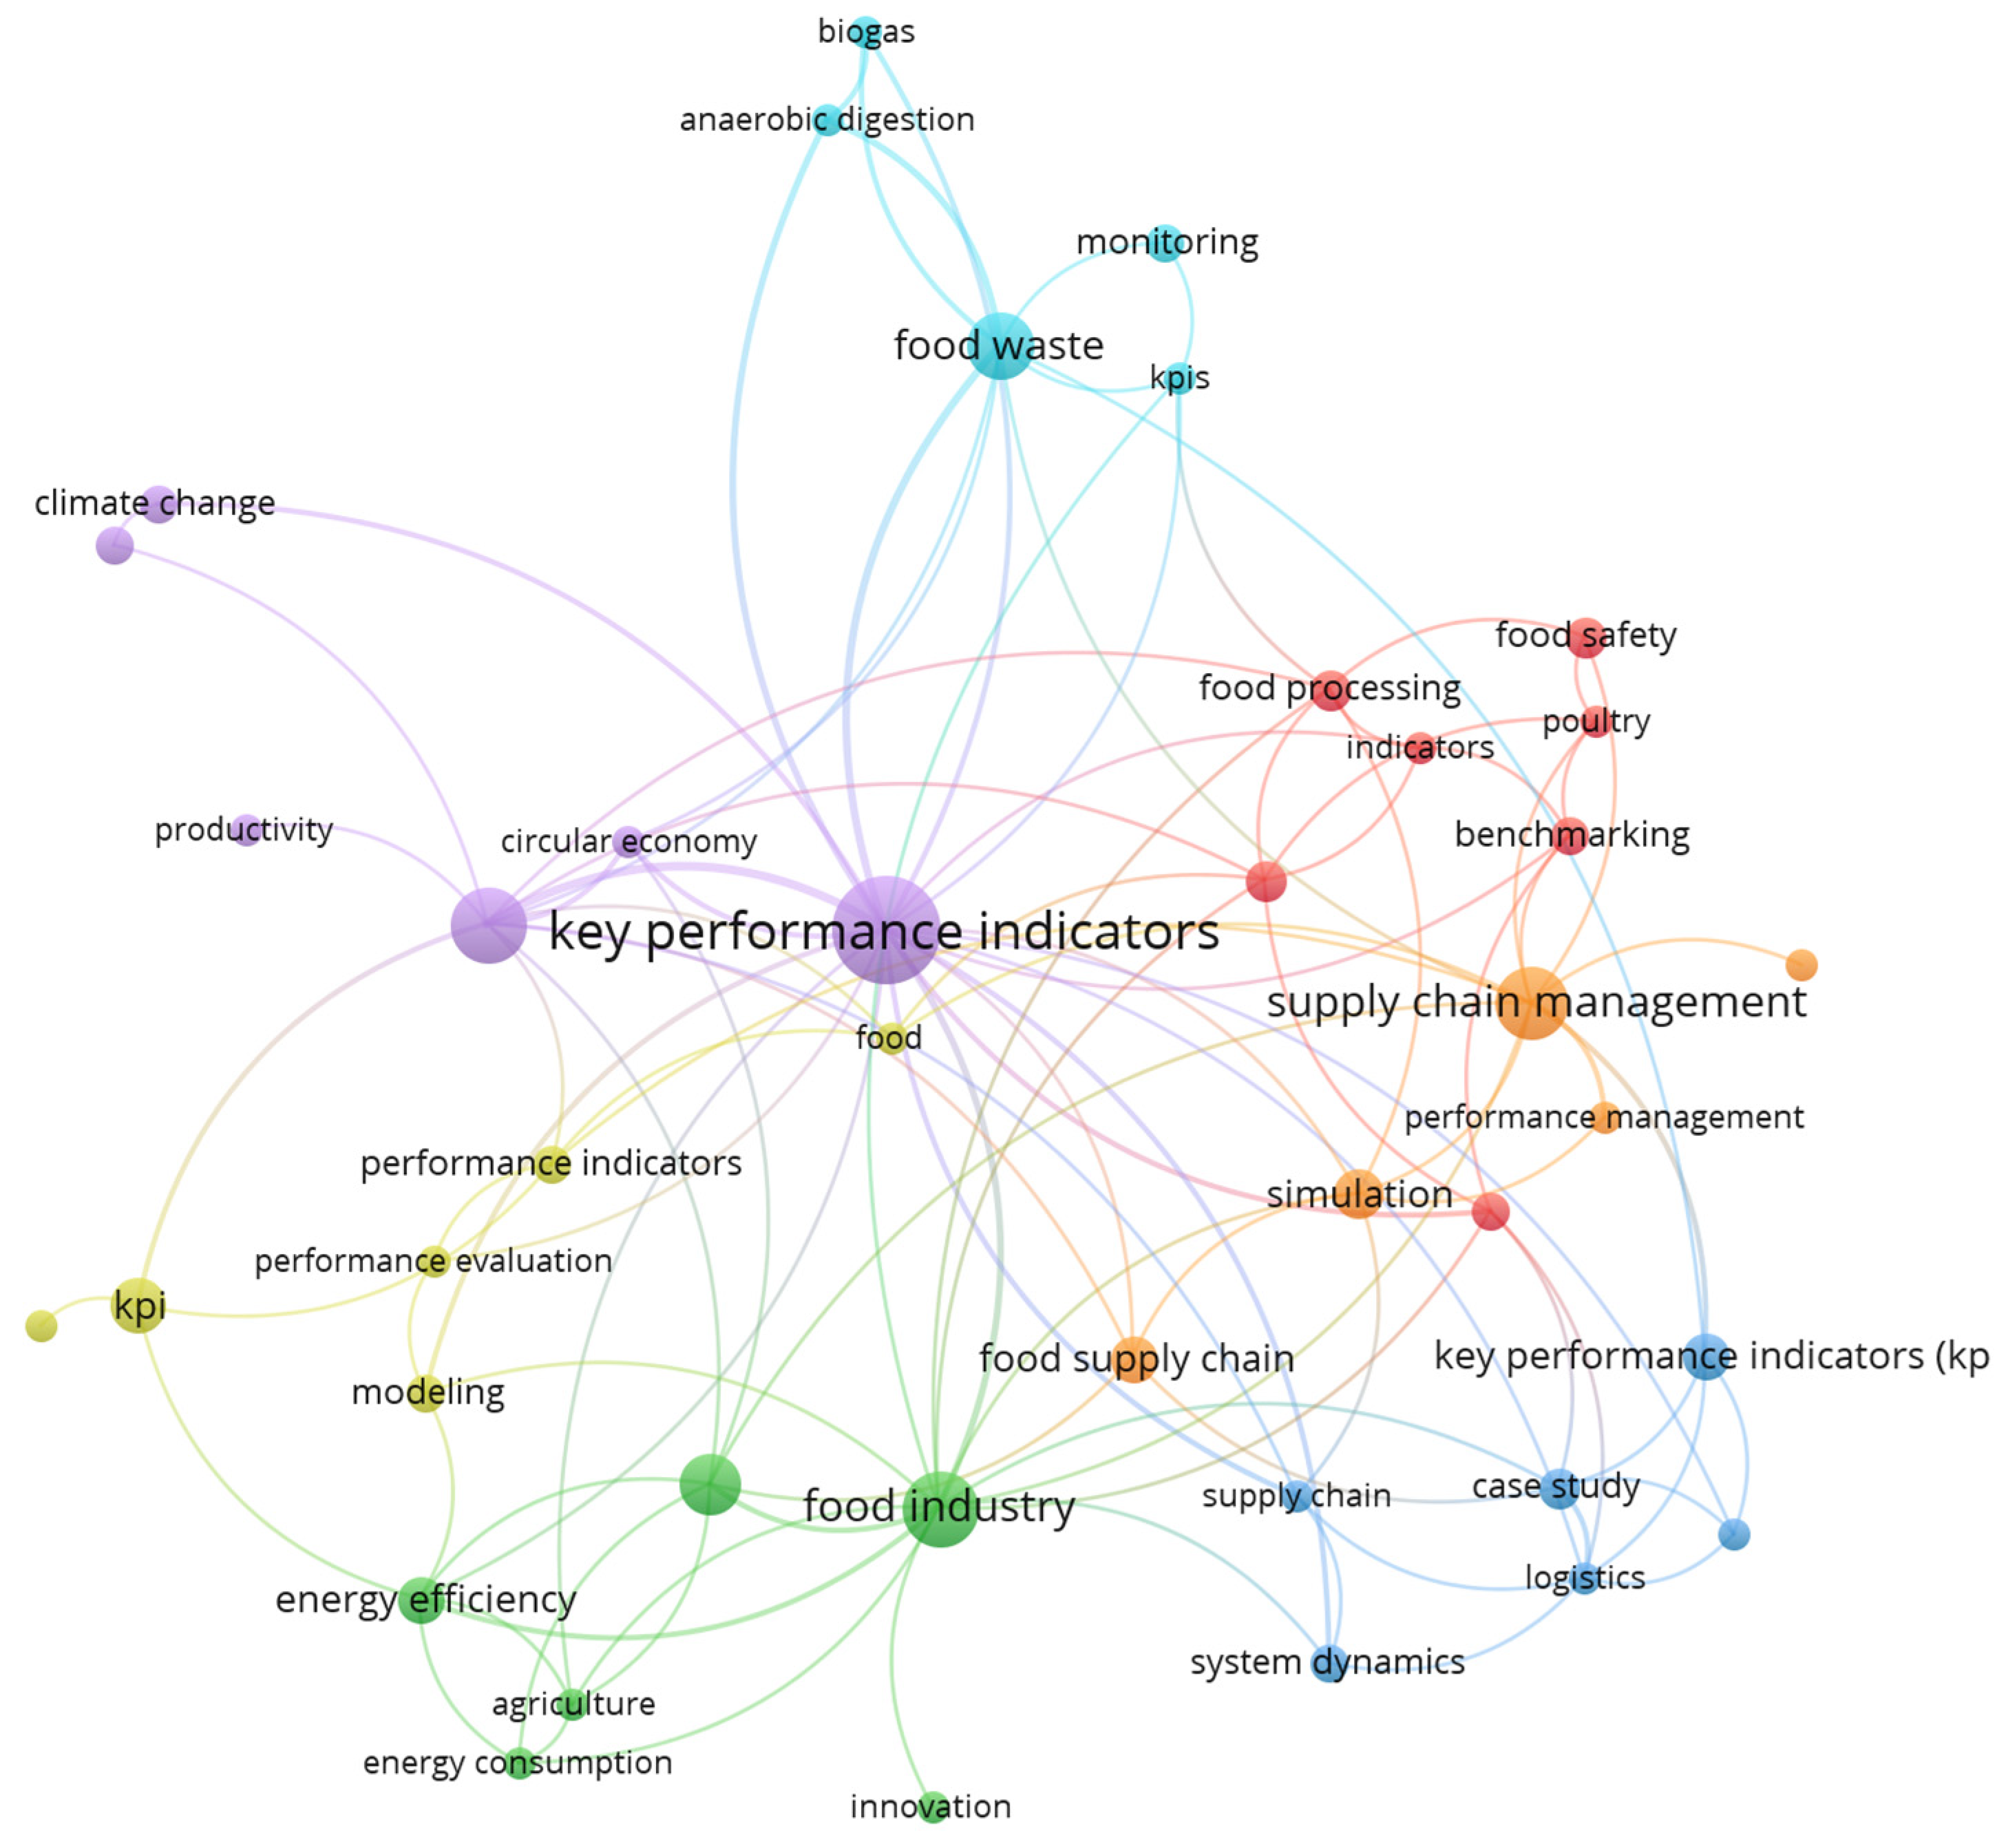
- Simulation, performance management, and supply chain management (orange cluster): this suggests that simulation-based techniques have been exploited by authors as effective tools for performance measurement and management.
- Food industry, agriculture, energy consumption, and energy efficiency (green cluster). This outcome indicates an increasingly important role of energy-related issues in the agri-FSC.
- KPIs, productivity, climate change, circular economy (violet cluster): possibly, these relationships suggest that KPIs have been used for measuring efficiency, but at the same time, are increasingly being used for measuring environmental-related aspects (in line with the presence of “sustainable development” among the core topics).
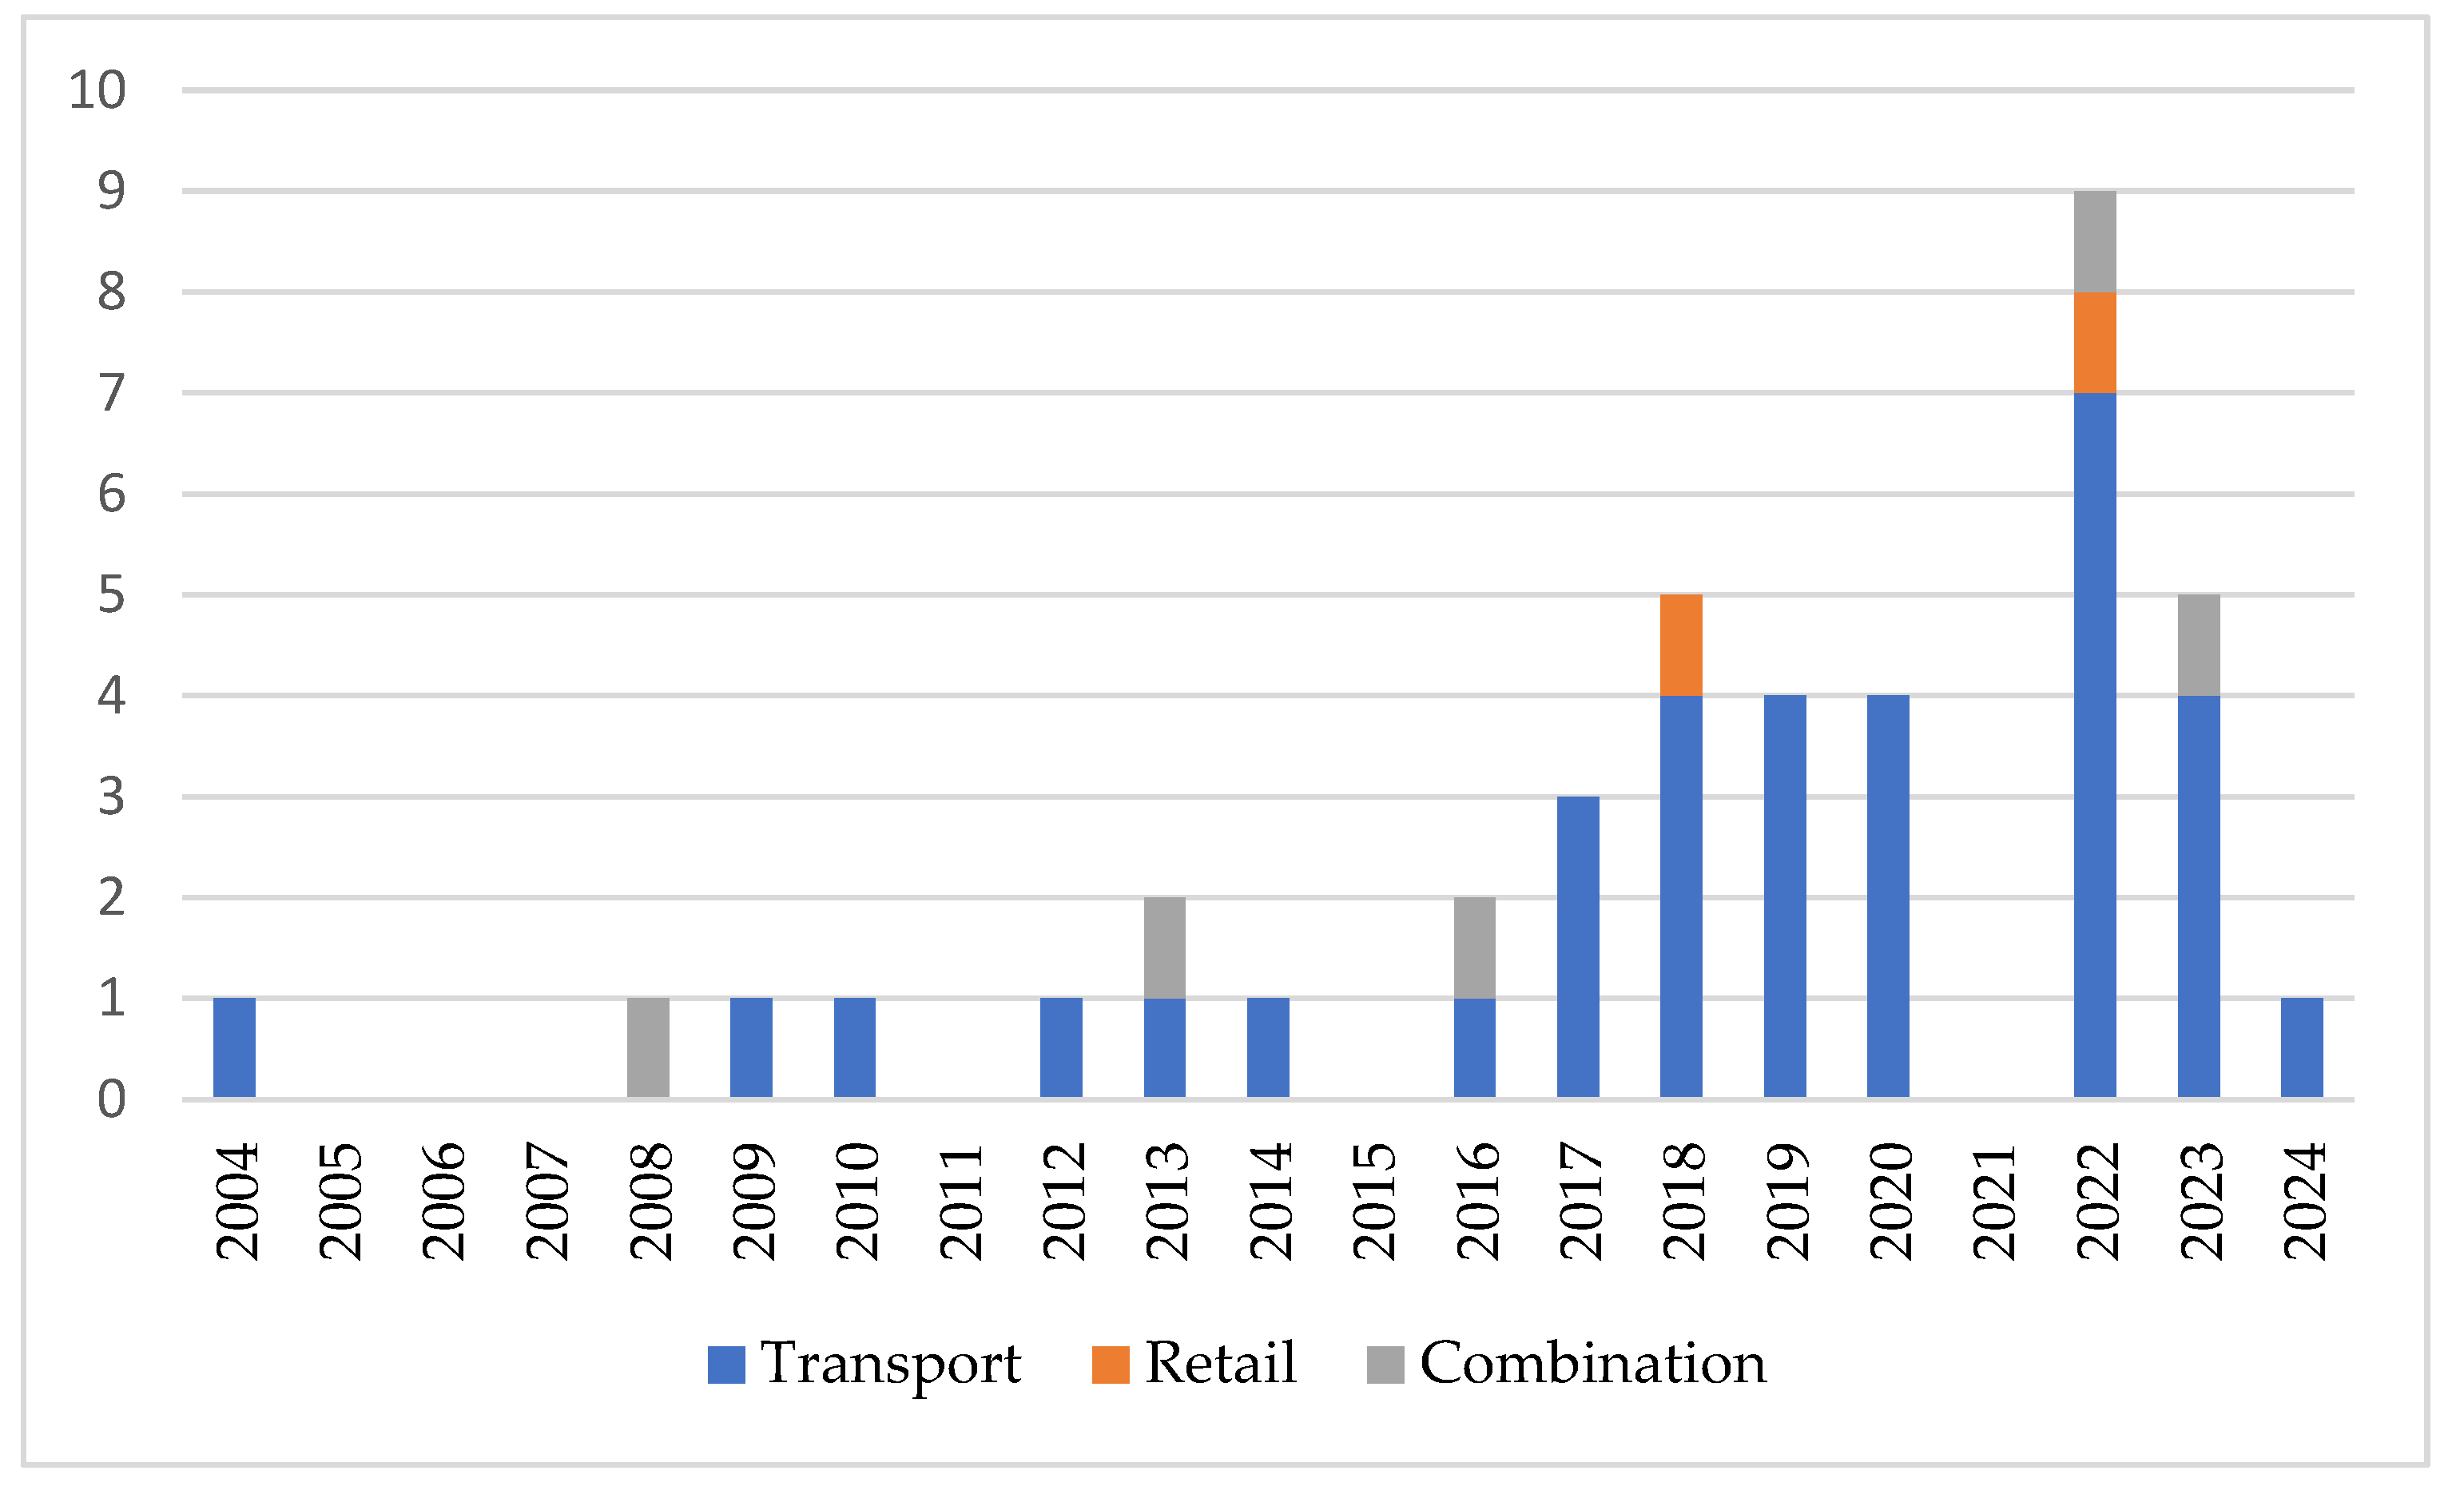
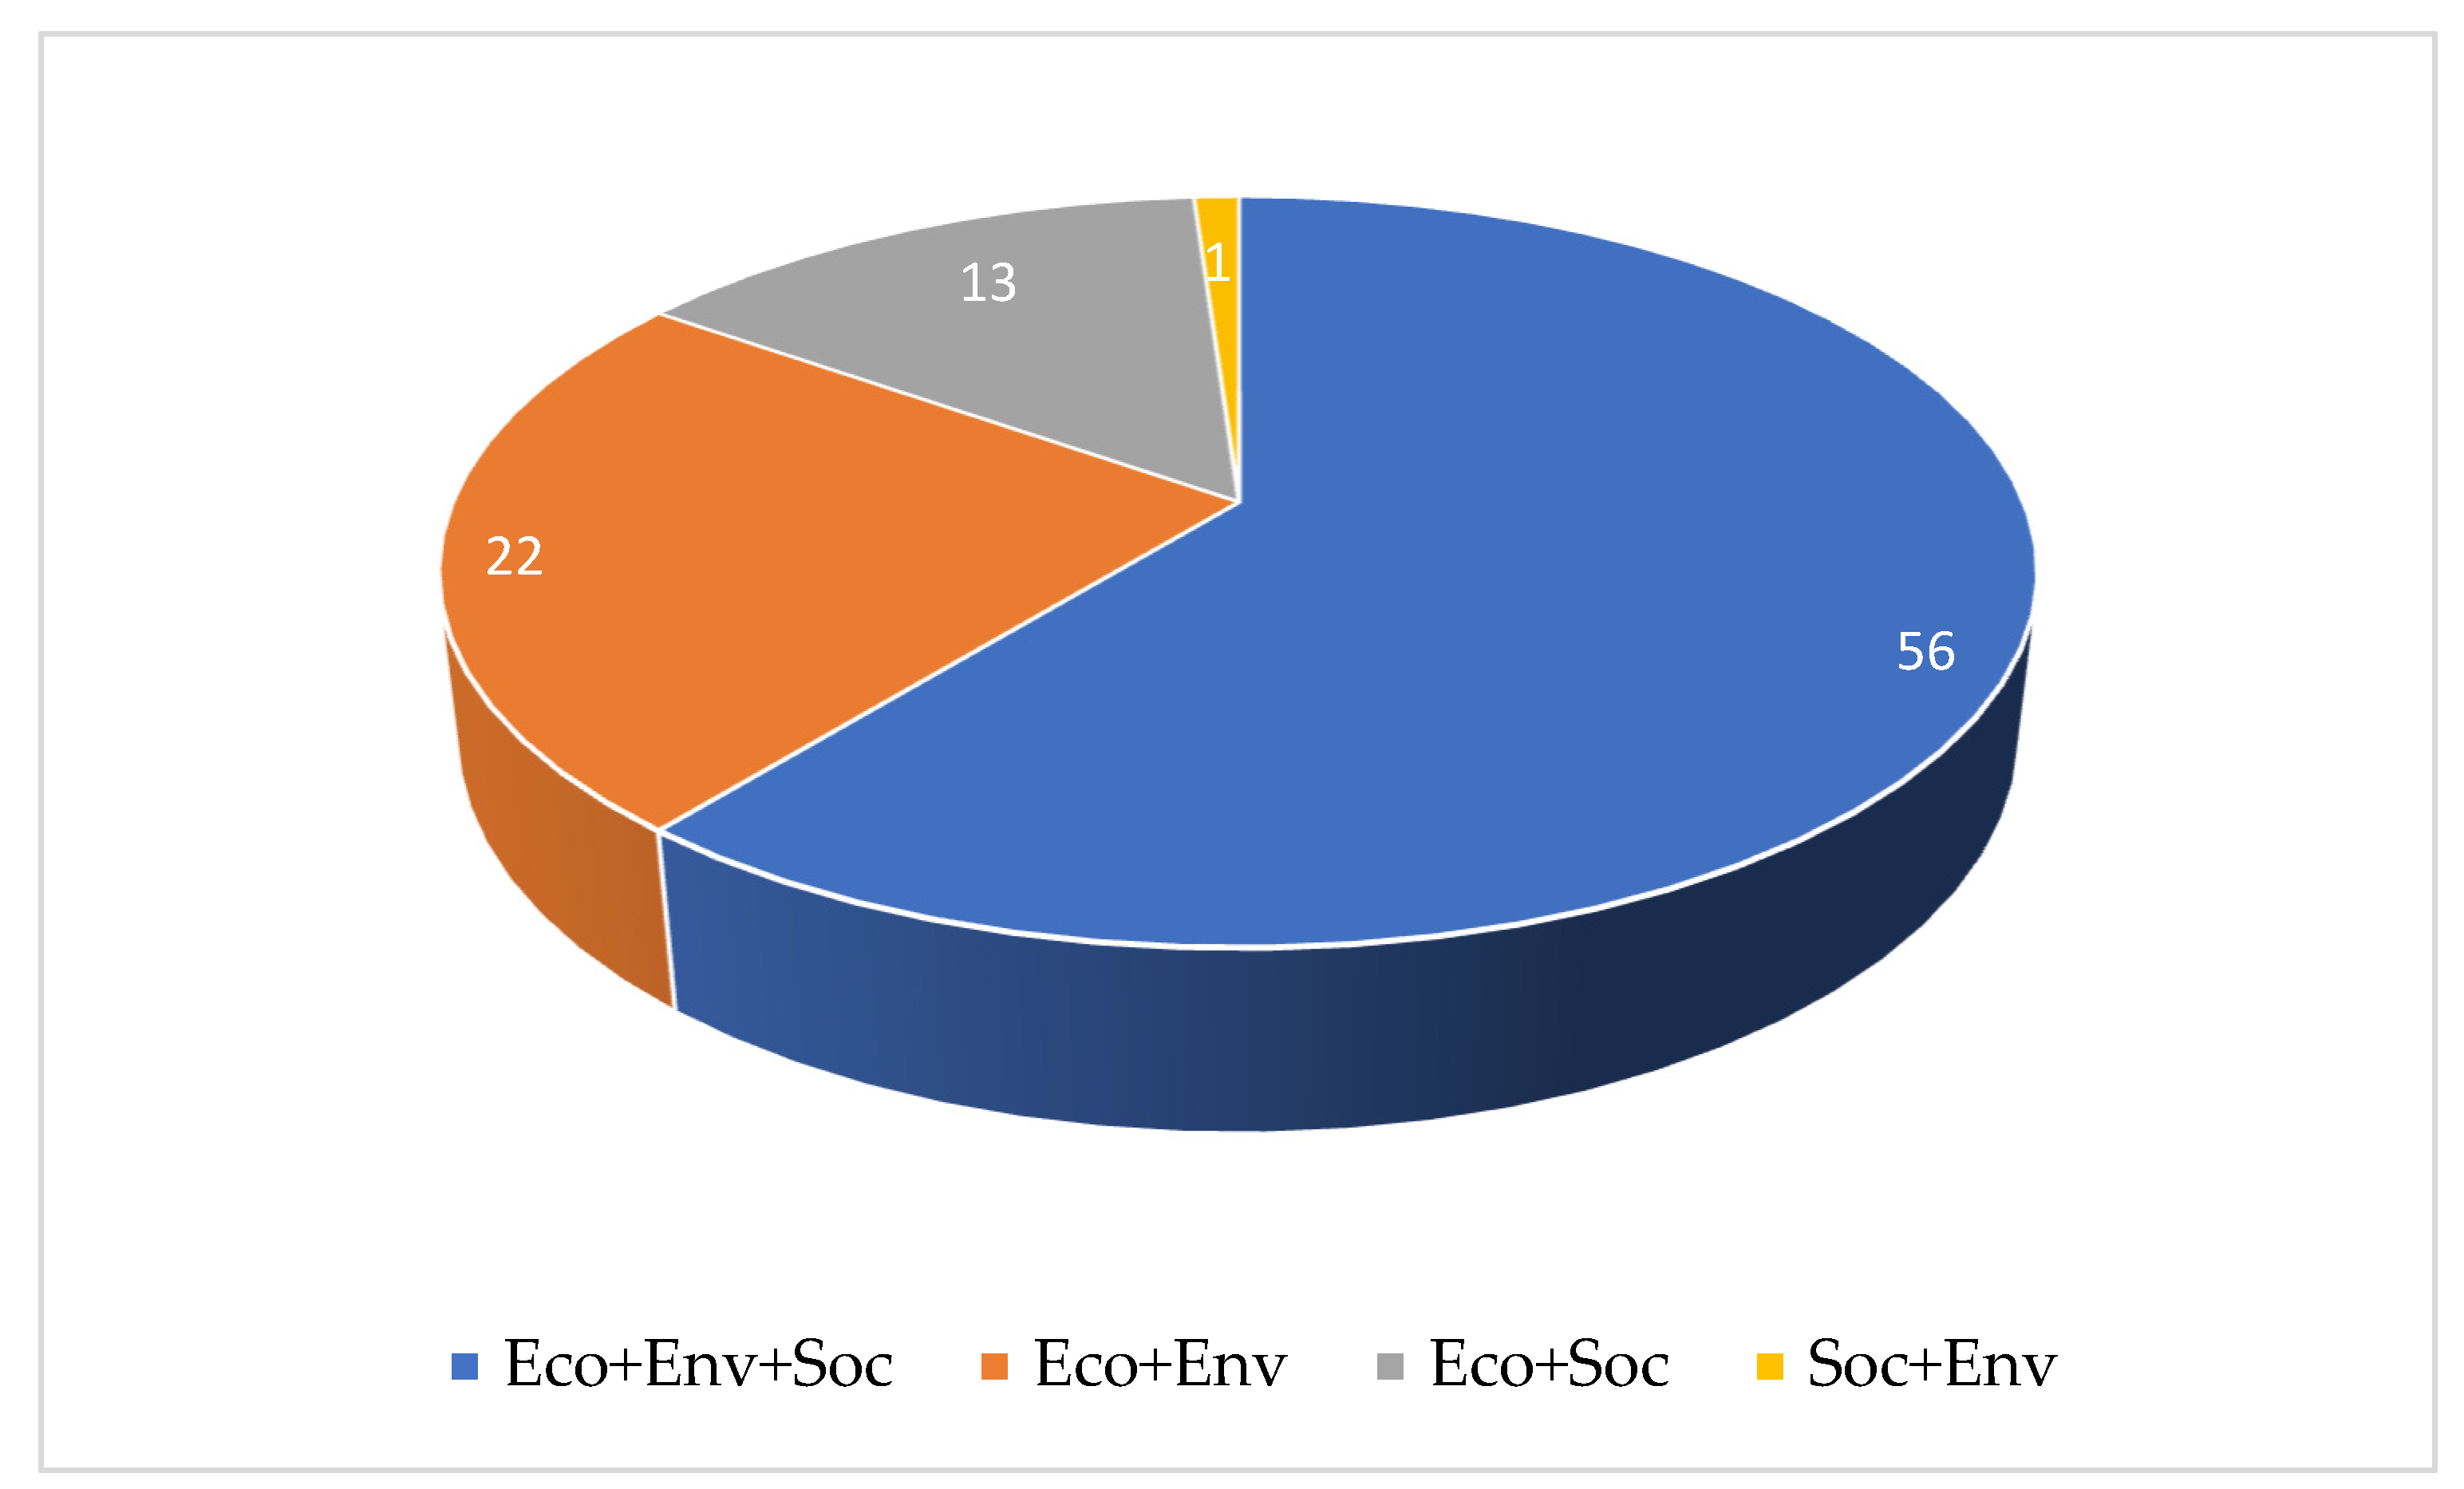
3.3. Outcomes of the Content Analysis
4. Discussion
4.1. Theoretical Implications
4.2. Practical Implications
5. Conclusions
Author Contributions
Funding
Data Availability Statement
Conflicts of Interest
Appendix A

| References | Year | Research Methodologies | |||
|---|---|---|---|---|---|
| Analytic/Model | Empirical | Case Study | Conceptual | ||
| Reinemann & Mein [81] | 1995 | X | X | ||
| Lindgreen & Hingley [43] | 2003 | X | |||
| McKinnon & Ge [82] | 2004 | X | |||
| Manning, Baines & Chadd [45] | 2006 | X | |||
| Rimmington, Smith & Hawkins [44] | 2006 | X | |||
| Dodd et al. [38] | 2008 | X | |||
| Gellynck, Molnár & Aramyan [83] | 2008 | X | |||
| Manning, Baines & Chadd [67] | 2008 | X | X | ||
| Trevisani & Rosmini [84] | 2008 | X | |||
| Ilic, Staake & Fleisch [61] | 2009 | X | |||
| Beukes et al. [85] | 2010 | X | |||
| Shokri, Nabhani & Hodgson [86] | 2010 | X | |||
| Hřebíček et al. [70] | 2012 | X | X | ||
| Soysal et al. [36] | 2012 | X | |||
| Wauters et al. [87] | 2012 | X | X | X | |
| Flipse et al. [88] | 2013 | X | |||
| Manning & Soon [19] | 2013 | X | |||
| Popelka et al. [37] | 2013 | X | |||
| Sigl et al. [89] | 2013 | X | |||
| Torkko et al. [90] | 2013 | X | |||
| Vlachos [15] | 2013 | X | X | ||
| Vlajic et al. [65] | 2013 | X | X | X | |
| Chen & Yu [91] | 2014 | X | X | ||
| Flipse, van der Sanden & Osseweijer [92] | 2014 | X | X | ||
| Woodford et al. [57] | 2014 | X | X | ||
| Corsini et al. [93] | 2015 | X | X | ||
| De Marco et al. [94] | 2015 | X | |||
| Sharma, Chandana & Bhardwaj [95] | 2015 | X | X | ||
| Aivazidou et al. [20] | 2016 | X | X | ||
| Fortuin & Omta [96] | 2016 | X | |||
| Jimenez, Mediavilla & Temponi [97] | 2016 | X | X | ||
| Van Der Waal et al. [98] | 2016 | X | X | ||
| Crandall et al. [99] | 2017 | X | |||
| Derqui & Fernandez [100] | 2017 | X | |||
| Fisseler, Kemeny & Reiners [101] | 2017 | X | X | ||
| Kassem et al. [71] | 2017 | X | |||
| Reynoso [102] | 2017 | X | X | ||
| Sel, Soysal, Çimen [46] | 2017 | X | |||
| Siriwatthanaphan, Jansuwan & Chen [103] | 2017 | X | X | ||
| Alamar et al. [104] | 2018 | X | |||
| Barabanova et al. [105] | 2018 | X | X | ||
| Biswal & Jenamani [106] | 2018 | X | |||
| Bottani, Rinaldi & Solari [68] | 2018 | X | |||
| De menna et al. [58] | 2018 | X | |||
| Demartini et al. [49] | 2018 | X | |||
| Immawan, Asmarawati & Cahyo [107] | 2018 | X | |||
| Kuznetsov et al. [108] | 2018 | X | X | ||
| Lambin & Corpart [109] | 2018 | X | |||
| Nejatian et al. [75] | 2018 | X | X | ||
| Soysal et al. [56] | 2018 | X | |||
| Baba et al. [16] | 2019 | X | |||
| Bastos, Scarpin & Pecora [110] | 2019 | X | X | ||
| Blažková & Dvouletý [111] | 2019 | X | |||
| Casino et al. [60] | 2019 | X | X | ||
| Correa et al. [59] | 2019 | X | |||
| Gardas et al. [112] | 2019 | X | |||
| Guido et al. [113] | 2019 | X | |||
| Kataike et al. [114] | 2019 | X | X | ||
| Klychova et al. [115] | 2019 | X | |||
| Kubo & Okoso [116] | 2019 | X | |||
| Nejatian et al. [117] | 2019 | X | |||
| Nozari et al. [118] | 2019 | X | |||
| Pradella et al. [119] | 2019 | X | |||
| Assa & Wang [77] | 2020 | X | X | ||
| Chen & Voigt [120] | 2020 | X | X | ||
| Chichenkov & Faizullin [121] | 2020 | X | |||
| Kurnianto et al. [122] | 2020 | X | |||
| Kusrini, Safitri & Fole [123] | 2020 | X | X | ||
| Lagarda-Leyva et al. [124] | 2020 | X | X | ||
| Nuseir [125] | 2020 | X | |||
| Ojo et al. [126] | 2020 | X | X | ||
| Tadić et al. [127] | 2020 | X | |||
| Yadav, Garg & Luthra [64] | 2020 | X | X | ||
| Campana et al. [47] | 2021 | X | X | ||
| Devkota et al. [39] | 2021 | X | |||
| Iten, Fernandes & Oliveira [128] | 2021 | X | |||
| Jones et al. [129] | 2021 | X | X | ||
| Morella et al. [21] | 2021 | X | X | ||
| Salah & Mustafa [130] | 2021 | X | |||
| Singh, Berkvens & Weyn [63] | 2021 | X | |||
| Talukder et al. [80] | 2021 | X | |||
| Walkiewicz, Lay-Kumar & Herzig [131] | 2021 | X | |||
| Abeysiriwardana & Jayasinghe-Mudalige [132] | 2022 | X | X | ||
| Abeysiriwardana, Jayasinghe-Mudalige & Seneviratne [133] | 2022 | X | |||
| Al Akasheh, Eleyan & Ertek [134] | 2022 | X | |||
| Alrobaish et al. [135] | 2022 | X | |||
| Badraoui, Boulaksil & Van der Vorst [66] | 2022 | X | X | X | |
| Battarra et al. [136] | 2022 | X | |||
| Bayir et al. [137] | 2022 | X | |||
| Bottani et al. [69] | 2022 | X | |||
| Chen et al. [62] | 2022 | X | X | ||
| Diaz et al. [79] | 2022 | X | |||
| Giedelmann, Guerrero & Solano-Charris [138] | 2022 | X | X | ||
| Guan et al. [139] | 2022 | X | X | ||
| Hong et al. [50] | 2022 | X | |||
| Kumar et al. [48] | 2022 | X | X | ||
| Martínez-López et al. [76] | 2022 | X | X | ||
| Onwude et al. [140] | 2022 | X | X | ||
| Rahman, Nguyen & Lu [40] | 2022 | X | |||
| Rajmis et al. [141] | 2022 | X | |||
| Saint-Ges et al. [142] | 2022 | X | X | ||
| Trienekens et al. [143] | 2022 | X | |||
| Wohlenberg et al. [144] | 2022 | X | |||
| Bojar et al. [145] | 2023 | X | |||
| Bottani et al. [23] | 2023 | X | X | ||
| Cagliano et al. [146] | 2023 | X | |||
| Darbyshire et al. [147] | 2023 | X | X | ||
| Firman et al. [148] | 2023 | X | |||
| Gilligan, Moran & McDermott [149] | 2023 | X | |||
| Gómez-Ramos & Rico Gonzalez [150] | 2023 | X | |||
| Iranshahi et al. [151] | 2023 | X | X | ||
| Kumar, Tyagi & Sachdeva [152] | 2023 | X | |||
| Loemba, Kichonge & Kivevele [153] | 2023 | X | |||
| Martin, Elnour & Siñol [154] | 2023 | X | |||
| Meitz et al. [51] | 2023 | X | |||
| Mohamed, Mogili & Kasup [155] | 2023 | X | |||
| Obe et al. [156] | 2023 | X | |||
| Ros et al. [157] | 2023 | X | |||
| Shen et al. [78] | 2023 | X | X | ||
| Wang et al. [42] | 2023 | X | X | X | |
| Wei et al. [41] | 2023 | X | |||
| Dyson et al. [158] | 2024 | X | |||
| Kasztelan & Nowak [159] | 2024 | X | X | ||
| Marrucci, Daddi & Iraldo [160] | 2024 | X | |||
| Mostafa et al. [52] | 2024 | X | |||
References
- Peterson, E. The Big Book of Key Performance Indicators; Book Two in the Web Analytics Demystified Series; 2006; Available online: https://analyticsdemystified.com/wp-content/uploads/2019/01/The_Big_Book_of_Key_Performance_Indicators_by_Eric_Peterson.pdf (accessed on 30 September 2024).
- Dominguez, E.; Perez, B.; Rubio, A.; Zapata, M. A taxonomy for key performance indicators. Comput. Stand. Interfaces 2019, 64, 24–40. [Google Scholar] [CrossRef]
- Nikolaieva, L.; Omelchenko, T.; Haichenia, O. Formalization of Hybrid Systems Models for Port Terminal Management with considering of Key Performance Indicators. Eng. Rep. 2025, 7, e70004. [Google Scholar] [CrossRef]
- Lashgari, F.; Teimoury, E.; Seyedhosseini, S.M.; Radfar, R. Designing key performance indicators (KPIs) for decent work in the pharmaceutical supply chain of Iran. Decis. Sci. Lett. 2024, 13, 161–170. [Google Scholar] [CrossRef]
- Gallardo-Amores, F.J.; Del-Real, C.; Díaz-Fernández, A.M. Assessing urban security and safety smartness: A systematic review of key performance indicators. IET Smart Cities 2025, 7, e70000. [Google Scholar] [CrossRef]
- Gonçalves, M.; Oliveira, M.; Thuillier, S.; Andrade-Campos, A. Key performance indicators for heterogeneous mechanical tests. Int. J. Mech. Sci. 2024, 264, 108821. [Google Scholar] [CrossRef]
- Camilleri, E. Key Performance Indicators: The Complete Guide to KPIs for Business Success; Routledge, Taylor & Francis Group: London, UK, 2024; Available online: https://www.routledge.com/Key-Performance-Indicators-The-Complete-Guide-to-KPIs-for-Business-Success/Camilleri/p/book/9781032648897?srsltid=AfmBOopKyB67EDL-dSIUa7eYIEuaKT1hn4Txh_c74OrDUnyAp-hqmNVq (accessed on 30 September 2024).
- da Silva, A.N.; Fontana, M.E.; Vidal, R.; Marques, P.C. Key performance indicators in humanitarian logistics: A systematic literature review 2010–2020. AIP Conf. Proc. 2024, 2951, 030005. [Google Scholar]
- Salmina, M.; Munzir, S.; Syahrini, I.; Halfiani, V.; Rizal, S. Dynamics Modeling for Key Performance Indicators in Higher Education Through Optimization Methods. Int. J. Math. Eng. Manag. Sci. 2025, 10, 92–112. [Google Scholar] [CrossRef]
- Clubb, J.; Allen, S.V.; Yung, K.K. Selection of Key Performance Indicators for Your Sport and Program: Proposing a Complementary Process-Driven Approach. Strength Cond. J. 2024, 46, 90–97. [Google Scholar] [CrossRef]
- Lloyd, N.; Williams, M.; Williams, H.W. Key Performance Indicators as Predictors of Enterprise Gross Margin in English and Welsh Suckler Beef and Sheep Farms. Agriculture 2025, 15, 249. [Google Scholar] [CrossRef]
- Morgulev, E.; Lebed, F. Beyond key performance indicators: Theoretical-methodological discussion of performance analysis (sports analytics) research. Ger. J. Exerc. Sport Res. 2024, 54, 335–340. [Google Scholar] [CrossRef]
- Singh, D.; Carvalho, A.L.; Mosquera, I.; Vilaseca, J.; Patasius, A.; Miksiene, G.; Tupikowski, K.; Antelo, M.T.; Quinteiro, M.C.; Galvin, D.; et al. Monitoring of prostate cancer screening in the European Union: Development of key performance indicators through the PRAISE-U project. eClinicalMedicine 2025, 80, 103022. [Google Scholar] [CrossRef] [PubMed]
- Faveto, A.; Traini, E.; Bruno, G.; Chiabert, P. Review-based method for evaluating key performance indicators: An application on warehouse system. Int. J. Adv. Manuf. Technol. 2023, 130, 297–310. [Google Scholar] [CrossRef]
- Vlachos, I.P. Key performance indicators of the impact of radio frequency identification technologies on supply chain management. Int. J. RF Technol. Res. Appl. 2013, 4, 127–146. [Google Scholar] [CrossRef]
- Baba, A.A.M.; Ma’aram, A.; Ishak, F.I.; Sirat, R.M.; Kadir, A.Z.A. Key performance indicator of sustainability in the Malaysian food supply chain. In IOP Conference Series: Materials Science and Engineering; IOP Publishing: Kuala Terengganu, Malaysia, 2019. [Google Scholar]
- Sharma, R. Industry 4.0 technologies in agri-food supply chains: Key performance indicators. In Advanced Series in Management; Emerald Group Holdings Ltd.: Leeds, UK, 2022; pp. 179–187. [Google Scholar]
- Kumar, M.; Choubey, V.K. Modelling the interaction among the key performance indicators of sustainable supply chain from the perspective of perishable food. Int. J. Logist. Syst. Manag. 2023, 45, 108. [Google Scholar] [CrossRef]
- Manning, L.; Soon, J.M. GAP framework for fresh produce supply. Br. Food J. 2013, 115, 796–820. [Google Scholar] [CrossRef]
- Aivazidou, E.; Tsolakis, N.; Iakovou, E.; Vlachos, D. The emerging role of water footprint in supply chain management: A critical literature synthesis and a hierarchical decision-making framework. J. Clean. Prod. 2016, 137, 1018–1037. [Google Scholar] [CrossRef]
- Morella, P.; Lambán, M.P.; Royo, J.; Sánchez, J.C. Study and Analysis of the Implementation of 4.0 Technologies in the Agri-Food Supply Chain: A State of the Art. Agronomy 2021, 11, 2526. [Google Scholar] [CrossRef]
- Zhao, G.; Liu, S.; Wang, Y.; Lopez, C.; Ong, A.; Chen, X. Reducing food waste from social innovation perspective: A review of measures, research gaps and future directions. Int. Food Agribus. Manag. Rev. 2023, 26, 199–223. [Google Scholar]
- Bottani, E.; Tebaldi, L.; Casella, G.; Mora, C.; Vitri, I. Exploring Key Performance Indicators in the Food Supply Chain: A survey, analysis and taxonomy. In Proceedings of the International Food Operations and Processing Simulation Workshop, FOODOPS, Athens, Greece, 18–20 September 2023. [Google Scholar]
- Budimir, G.; Rahimeh, S.; Tamimi, S.; Južnič, P. Comparison of self-citation patterns in WoS and Scopus databases based on national scientific production in Slovenia (1996–2020). Scientometrics 2021, 126, 2249–2267. [Google Scholar] [CrossRef]
- Restrepo-Franco, A.M.; Valencia-Rodríguez, O.; Toro-Ocampo, E.M. The vehicle routing problem as applied to residential solid waste collection operations: Systematic literature review. Int. J. Ind. Eng. Comput. 2025, 16, 197–220. [Google Scholar] [CrossRef]
- Ismail, N.H.; Kamal, E.M.; Fizal, M.F.M. A Systematic Literature Review: Implementing Building Information Modelling (BIM) for TVET Educators in Malaysia. J. Adv. Res. Appl. Sci. Eng. Technol. 2025, 49, 194–210. [Google Scholar] [CrossRef]
- Page, M.J.; McKenzie, J.E.; Bossuyt, P.M.; Boutron, I.; Hoffmann, T.C.; Mulrow, C.D.; Shamseer, L.; Tetzlaff, J.M.; Akl, E.A.; Brennan, S.E.; et al. The PRISMA 2020 statement: An updated guideline for reporting systematic reviews. BMJ 2021, 372, n71. [Google Scholar]
- Chiang, C.-T. Developing an eMarketing model for tourism and hospitality: A keyword analysis. Int. J. Contemp. Hosp. Manag. 2020, 32, 3091–3114. [Google Scholar] [CrossRef]
- Zhang, J.; Yu, Q.; Zheng, F.; Long, C.; Lu, Z.; Duan, Z. Comparing keywords plus of WOS and author keywords: A case study of patient adherence research. J. Assoc. Inf. Sci. Technol. 2015, 67, 967–972. [Google Scholar] [CrossRef]
- Tebaldi, L.; Casella, G.; Bottani, E. Fashion Supply Chain: A literature review to define the trends of research (2012–2019). In Proceedings of the 26th Summer School Francesco Turco, Virtual, 8–10 September 2021. [Google Scholar]
- van Eck, N.; Waltman, L. Visualizing bibliometric networks. In Measuring Scholarly Impact: Methods and Practice; Springer: Heidelberg, Germany, 2014; pp. 285–320. [Google Scholar]
- Rinaldi, M.; Bottani, E. How did COVID-19 affect logistics and supply chain processes? Immediate, short and medium-term evidence from some industrial fields of Italy. Int. J. Prod. Econ. 2023, 262, 108915. [Google Scholar]
- Ramakumar, R. Agriculture and the COVID-19 pandemic: An analysis with special reference to India. Rev. Agrar. Stud. 2020, 10, 72–110. [Google Scholar] [CrossRef]
- Montenegro, L.D.; Young, M.N. Operational challenges in the food industry and supply chain during the COVID-19 pandemic: A literature review. In Proceedings of the 2020 7th International Conference on Frontiers of Industrial Engineering (ICFIE), Singapore, 27–29 September 2020; pp. 1–5. [Google Scholar]
- Shafiee, M.; Zare-Mehrjerdi, Y.; Govindan, K.; Dastgoshade, S. A causality analysis of risks to perishable product supply chain networks during the COVID-19 outbreak era: An extended DEMATEL method under Pythagorean fuzzy environment. Transp. Res. Part E Logist. Transp. Rev. 2022, 163, 102759. [Google Scholar] [CrossRef]
- Soysal, M.; Bloemhof-Ruwaard, J.; Meuwissen, M.; van der Vorst, J. A Review on Quantitative Models for Sustainable Food Logistics Management. Int. J. Food Syst. Dyn. 2012, 3, 136–155. [Google Scholar] [CrossRef]
- Popelka, O.; Hodinka, M.; Hřebíček, J.; Trenz, O. Information System for Global Sustainability Reporting. In IFIP Advances in Information and Communication Technology; Springer: Berlin/Heidelberg, Germany, 2013. [Google Scholar]
- Dodd, M.; Wedderburn, M.; Parminter, T.; Thorrold, B.; Quinn, J. Transformation toward agricultural sustainability in New Zealand hill country pastoral landscapes. Agric. Syst. 2008, 98, 95–107. [Google Scholar] [CrossRef]
- Devkota, K.P.; Devkota, M.; Paudel, G.P.; McDonald, A.J. Coupling landscape-scale diagnostics surveys, on-farm experiments, and simulation to identify entry points for sustainably closing rice yield gaps in Nepal. Agric. Syst. 2021, 192, 103182. [Google Scholar] [CrossRef]
- Rahman, M.; Nguyen, R.; Lu, L. Multi-level impacts of climate change and supply disruption events on a potato supply chain: An agent-based modeling approach. Agric. Syst. 2022, 201, 103469. [Google Scholar] [CrossRef]
- Wei, Z.; Zhuang, M.; Hellegers, P.; Cui, Z.; Hoffland, E. Towards circular nitrogen use in the agri-food system at village and county level in China. Agric. Syst. 2023, 209, 103683. [Google Scholar] [CrossRef]
- Wang, H.; Ren, H.; Zhang, L.; Zhao, Y.; Liu, Y.; He, Q.; Li, G.; Han, K.; Zhang, J.; Zhao, B.; et al. A sustainable approach to narrowing the summer maize yield gap experienced by smallholders in the North China Plain. Agric. Syst. 2023, 204, 103541. [Google Scholar] [CrossRef]
- Lindgreen, A.; Hingley, M. The impact of food safety and animal welfare policies on supply chain management: The case of the Tesco meat supply chain. Br. Food J. 2003, 105, 328–349. [Google Scholar]
- Rimmington, M.; Smith, J.C.; Hawkins, R. Corporate social responsibility and sustainable food procurement. Br. Food J. 2006, 108, 824–837. [Google Scholar] [CrossRef]
- Manning, L.; Baines; Chadd, S. Food safety management in broiler meat production. Br. Food J. 2006, 108, 605–621. [Google Scholar] [CrossRef]
- Sel, Ç.; Pınarbaşı, M.; Soysal, M.; Çimen, M. A green model for the catering industry under demand uncertainty. J. Clean. Prod. 2017, 167, 459–472. [Google Scholar] [CrossRef]
- Campana, P.E.; Stridh, B.; Amaducci, S.; Colauzzi, M. Optimisation of vertically mounted agrivoltaic systems. J. Clean. Prod. 2021, 325, 129091. [Google Scholar] [CrossRef]
- Kumar, M.; Sharma, M.; Raut, R.D.; Mangla, S.K.; Choubey, V.K. Performance assessment of circular driven sustainable agri-food supply chain towards achieving sustainable consumption and production. J. Clean. Prod. 2022, 372, 133698. [Google Scholar] [CrossRef]
- Demartini, M.; Pinna, C.; Aliakbarian, B.; Tonelli, F.; Terzi, S. Soft drink supply chain sustainability: A case based approach to identify and explain best practices and key performance indicators. Sustainability 2018, 10, 3540. [Google Scholar] [CrossRef]
- Hong, P.; Balasudarsun, N.L.; Vivek, N.; Sathish, M. Sustainable Agricultural Business Model: Case Studies of Innovative Indian Farmers. Sustainability 2022, 14, 10242. [Google Scholar] [CrossRef]
- Meitz, S.; Reiter, J.; Fluch, J.; Tugores, C.R. Decarbonization of the Food Industry—The Solution for System Design and Operation. Sustainability 2023, 15, 14262. [Google Scholar] [CrossRef]
- Mostafa, N.A.; Hussein, A.A.; Elsheeta, M.; Romagnoli, G. Impacts of COVID-19 and the Russian–Ukrainian Conflict on Food Supply Chain: A Case Study from Bread Supply Chain in Egypt. Sustainability 2024, 16, 994. [Google Scholar] [CrossRef]
- Agronotizie. Agroalimentare: Volano Export e Investimenti, ma cala il Valore Aggiunto in Agricoltura. 2024. Available online: https://agronotizie.imagelinenetwork.com/agricoltura-economia-politica/2024/11/22/agroalimentare-volano-export-e-investimenti-ma-cala-il-valore-aggiunto-in-agricoltura/86214#:~:text=Agricoltura%20e%20industria%20alimentare%20realizzano,(40%2C5%20miliardi (accessed on 16 November 2024).
- Agriculture, U.D.O. What Is Agriculture’s Share of the Overall U.S. Economy? 2024. Available online: https://www.ers.usda.gov/data-products/chart-gallery/gallery/chart-detail/?chartId=58270 (accessed on 13 May 2024).
- Park, J.; Jeong, E. Service Quality in Tourism: A Systematic Literature Review and Keyword Network Analysis. Sustainability 2019, 11, 3665. [Google Scholar] [CrossRef]
- Soysal, M.; Bloemhof-Ruwaard, J.M.; Haijema, R.; van der Vorst, J.G. Modeling a green inventory routing problem for perishable products with horizontal collaboration. Comput. Oper. Res. 2018, 89, 168–182. [Google Scholar] [CrossRef]
- Woodford, N.; Wareham, D.W.; Guerra, B.; Teale, C. Carbapenemase-producing Enterobacteriaceae and non-Enterobacteriaceae from animals and the environment: An emerging public health risk of our own making? J. Antimicrob. Chemother. 2014, 69, 287–291. [Google Scholar] [CrossRef]
- De Menna, F.; Dietershagen, J.; Loubiere, M.; Vittuari, M. Life cycle costing of food waste: A review of methodological approaches. Waste Manag. 2018, 73, 1–13. [Google Scholar] [CrossRef]
- Correa, J.C.; Garzón, W.; Brooker, P.; Sakarkar, G.; Carranza, S.A.; Yunado, L.; Rincón, A. Evaluation of collaborative consumption of food delivery services through web mining techniques. J. Retail. Consum. Serv. 2019, 46, 45–50. [Google Scholar] [CrossRef]
- Casino, F.; Kanakaris, V.; Dasaklis, T.K.; Moschuris, S.; Rachaniotis, N.P. Modeling food supply chain traceability based on blockchain technology. IFAC-PapersOnLine 2019, 52, 2728–2733. [Google Scholar] [CrossRef]
- Ilic, A.; Staake, T.; Fleisch, E. Using sensor information to reduce the carbon footprint of perishable goods. IEEE Pervasive Comput. 2009, 8, 22–29. [Google Scholar] [CrossRef]
- Chen, L.; Guttieres, D.; Koenigsberg, A.; Barone, P.W.; Sinskey, A.J.; Springs, S.L. Large-scale cultured meat production: Trends, challenges and promising biomanufacturing technologies. Biomaterials 2022, 280, 121274. [Google Scholar] [CrossRef]
- Singh, R.K.; Berkvens, R.; Weyn, M. AgriFusion: An Architecture for IoT and Emerging Technologies Based on a Precision Agriculture Survey. IEEE Access 2021, 9, 136253–136283. [Google Scholar] [CrossRef]
- Yadav, S.; Garg, D.; Luthra, S. Development of IoT based data-driven agriculture supply chain performance measurement framework. J. Enterp. Inf. Manag. 2020, 34, 292–327. [Google Scholar] [CrossRef]
- Vlajic, J.; Van Lokven, S.; Haijema, R.; Van Der Vorst, J. Using vulnerability performance indicators to attain food supply chain robustness. Prod. Plan. Control. 2013, 24, 785–799. [Google Scholar]
- Badraoui, I.; Boulaksil, Y.; Van der Vorst, J.G. A typology of horizontal logistics collaboration concepts: An illustrative case study from agri-food supply chains. Benchmarking Int. J. 2022, 29, 1214–1240. [Google Scholar] [CrossRef]
- Manning, L.; Baines, R.; Chadd, S. Benchmarking the poultry meat supply chain. Benchmarking Int. J. 2008, 15, 148–165. [Google Scholar] [CrossRef]
- Bottani, E.; Rinaldi, M.; Solari, F. Corporate sustainability assessment through fuzzy TOPSIS. In Proceedings of the 6th International Workshop on Simulation for Energy, Sustainable Development & Environment, Budapest, Hungary, 17–19 September 2018; pp. 47–55. [Google Scholar]
- Bottani, E.; Bigliardi, B.; Rinaldi, M.; Montanari, R. Evaluation of the LARG (lean, agile, resilient, green) performance in a food supply chain: A case study in Italy. In Proceedings of the Summer School Francesco Turco, Riviera dei Fiori, Sanremo, Italy, 7–9 September 2022. [Google Scholar]
- Hřebíček, J.; Popelka, O.; Štencl, M.; Trenz, O. Corporate performance indicators for agriculture and food processing sector. Acta Univ. Agric. Silvic. Mendel. Brun. 2012, 60, 121–132. [Google Scholar] [CrossRef]
- Kassem, E.; Trenz, O.; Hřebíček, J.; Faldík, O. Sustainability assessment & reporting in agriculture sector. Acta Univ. Agric. Silvic. Mendel. Brun. 2017, 65, 1359–1369. [Google Scholar]
- Fadlalla, A.; Amani, F. A keyword-based organizing framework for ERP intellectual contributions. J. Enterp. Inf. Manag. 2015, 28, 637–657. [Google Scholar] [CrossRef]
- Tebaldi, L.; Vignali, G.; Bottani, E. Digital Twin in the Agri-Food Supply Chain: A Literature Review. In Proceedings of the International Conference on Advances in Production Management Systems, APMS 2021, Nantes, France, 5–9 September 2021. [Google Scholar]
- Bottani, E.; Tebaldi, L.; Lazzari, I.; Casella, G. Economic and environmental sustainability dimensions of a fashion supply chain: A quantitative model. Production 2020, 30, e20190156. [Google Scholar] [CrossRef]
- Nejatian, M.; Zarei, M.; Nejati, M.; Zanjirchi, S. A hybrid approach to achieve organizational agility: An empirical study of a food company. Benchmarking Int. J. 2018, 25, 201–236. [Google Scholar]
- Martínez-López, J.A.; López-Urrea, R.; Martínez-Romero, Á.; Pardo, J.J.; Montero, J.; Domínguez, A. Sustainable Production of Barley in a Water-Scarce Mediterranean Agroecosystem. Agronomy 2022, 12, 1358. [Google Scholar] [CrossRef]
- Assa, H.; Wang, M. Price Index Insurances in the Agriculture Markets. N. Am. Actuar. J. 2020, 25, 286–311. [Google Scholar] [CrossRef]
- Shen, X.; Shi, G.; Cheng, L.; Gu, L.; Rao, Y.; He, Y. Chipless RFID-inspired sensing for smart agriculture: A review. Sens. Actuators A Phys. 2023, 363, 114725. [Google Scholar] [CrossRef]
- Diaz, F.; Romagnoli, F.; Neusel, L.; Hirzel, S.; Paulus, J.; Marchi, B.; Zanoni, S. The ICCEE Toolbox. A Holistic Instrument Supporting Energy Efficiency of Cold Food and Beverage Supply Chains. Sci. J. Riga Tech. Univ. Environ. Clim. Technol. 2022, 26, 428–440. [Google Scholar] [CrossRef]
- Talukder, B.; Agnusdei, G.P.; Hipel, K.W.; Dubé, L. Multi-indicator supply chain management framework for food convergent innovation in the dairy business. Sustain. Futur. 2021, 3, 100045. [Google Scholar] [CrossRef]
- Reinemann, D.J.; Mein, G.A. Prediction of Milkline Fill and Transition from Stratified to Slug Flow. Trans. ASAE 1995, 38, 975–978. [Google Scholar] [CrossRef]
- McKinnon, A.C.; Ge, Y. Use of a synchronised vehicle audit to determine opportunities for improving transport efficiency in a supply chain. Int. J. Logist. Res. Appl. 2004, 7, 219–238. [Google Scholar] [CrossRef]
- Gellynck, X.; Molnár, A.; Aramyan, L. Supply chain performance measurement: The case of the traditional food sector in the EU. J. Chain Netw. Sci. 2008, 8, 47–58. [Google Scholar] [CrossRef]
- Trevisani, M.; Rosmini, R. Duties and functions of veterinary public health for the management of food safety: Present needs and evaluation of efficiency. Vet.-Res. Commun. 2008, 32, 25–32. [Google Scholar] [CrossRef]
- Beukes, P.; Burke, C.; Levy, G.; Tiddy, R. Using a whole farm model to determine the impacts of mating management on the profitability of pasture-based dairy farms. Anim. Reprod. Sci. 2010, 121, 46–54. [Google Scholar] [CrossRef] [PubMed]
- Shokri, A.; Nabhani, F.; Hodgson, S. Supplier development practice: Arising the problems of upstream delivery for a food distribution SME in the UK. Robot. Comput. Manuf. 2010, 26, 639–646. [Google Scholar] [CrossRef]
- Wauters, T.; Verbeeck, K.; Verstraete, P.; Berghe, G.V.; De Causmaecker, P. Real-world production scheduling for the food industry: An integrated approach. Eng. Appl. Artif. Intell. 2012, 25, 222–228. [Google Scholar] [CrossRef]
- Flipse, S.M.; van der Sanden, M.C.; van der Velden, T.; Fortuin, F.T.; Omta, S.; Osseweijer, P. Identifying key performance indicators in food technology contract R&D. J. Eng. Technol. Manag. 2013, 30, 72–94. [Google Scholar] [CrossRef]
- Sigl, T.; Gellrich, K.; Meyer, H.; Kaske, M.; Wiedemann, S. Multiparous cows categorized by milk protein concentration and energy-corrected milk yield during early lactation—Metabolism, productivity and effect of a short-term feed restriction. J. Anim. Physiol. Anim. Nutr. 2013, 97, 278–296. [Google Scholar]
- Torkko, M.; Linna, A.; Katajavuori, N.; Juppo, A.M. Quality KPIs in Pharmaceutical and Food Industry. J. Pharm. Innov. 2013, 8, 205–211. [Google Scholar] [CrossRef]
- Chen, J.; Yu, H. Performance simulation and optimization of agricultural supply chains. In Proceedings of the International Conference on Information Science and Cloud Computing, ISCC, Funchal, Portugal, 23–26 June 2014. [Google Scholar]
- Flipse, S.M.; van der Sanden, M.C.; Osseweijer, P. Improving industrial R&D practices with social and ethical aspects: Aligning key performance indicators with social and ethical aspects in food technology R&D. Technol. Forecast. Soc. Change 2014, 85, 185–197. [Google Scholar] [CrossRef]
- Corsini, A.; Bonacina, F.; De Propris, L.; Feudo, S.; Marchegiani, A. Multivariate Key Performance Indicator of Baking Process. Energy Procedia 2015, 82, 554–561. [Google Scholar] [CrossRef]
- De Marco, I.; Iannone, R.; Miranda, S.; Riemma, S. Life cycle assessment of apple powders produced by a drum drying process. Chem. Eng. Trans. 2015, 43, 193–198. [Google Scholar]
- Sharma, V.K.; Chandana, P.; Bhardwaj, A. Critical factors analysis and its ranking for implementation of GSCM in Indian dairy industry. J. Manuf. Technol. Manag. 2015, 26, 911–922. [Google Scholar] [CrossRef]
- Fortuin, F.; Omta, S. Innovation in the Dutch food processing industry. In Proceedings of the IEEE International Technology Management Conference, ICE, Bangkok, Thailand, 19–22 September 2016. [Google Scholar]
- Jimenez, J.; Mediavilla, F.; Temponi, C. A dataintensive analysis augmented simulation model of a distribution center operations. In Proceedings of the International Conference on Information Systems, Logistics and Supply Chain, ILS, Bordeaux, France, 1–4 June 2016. [Google Scholar]
- van der Waal, J.; Clercx, J.; González, G.G.; Elhassan, B.; Babiker, S.; Bolton, M. Organic bananas in Sudan: Challenges and opportunities for developing export chains. Acta Hortic. 2016, 1114, 285–290. [Google Scholar] [CrossRef]
- Crandall, P.G.; Mauromoustakos, A.; O’Bryan, C.A.; Thompson, K.C.; Yiannas, F.; Bridges, K.; Francois, C. Impact of the global food safety initiative on food safety worldwide: Statistical analysis of a survey of international food processors. J. Food Prot. 2017, 80, 1613–1622. [Google Scholar] [CrossRef]
- Derqui, B.; Fernandez, V. The opportunity of tracking food waste in school canteens: Guidelines for self-assessment. Waste Manag. 2017, 69, 431–444. [Google Scholar] [CrossRef]
- Fisseler, D.; Kemeny, Z.; Reiners, R. Monitoring and Control Framework for Business Processes in Ubiquitous Environments. In Proceedings of the International Conference on Ubiquitous Intelligence and Computing, Maui, HI, USA, 11–15 September 2017. [Google Scholar]
- Reynoso, R.N. Food defense KPI in the business processes of the food supply chain. Contad. Adm. 2017, 63, 1–23. [Google Scholar] [CrossRef]
- Siriwatthanaphan, P.; Jansuwan, S.; Chen, A. Modeling agricultural supply chain flexibility: A case study of cassava farming business in Thailand. In Proceedings of the 22nd International Conference of Hong Kong Society for Transportation Studies: Transport and Society, Hong Kong, China, 9–11 December 2017. [Google Scholar]
- Alamar, M.d.C.; Falagán, N.; Aktas, E.; A Terry, L. Minimising food waste: A call for multidisciplinary research. J. Sci. Food Agric. 2018, 98, 8–11. [Google Scholar] [CrossRef]
- St. Petersburg State University of Economics; Barabanova, M.; Lebedeva, L.; Rastova, Y.; Uvarov, S. Use of system dynamics tools in value-oriented approach in management. Econ. Ann. 2018, 173, 32–37. [Google Scholar] [CrossRef]
- Biswal, A.K.; Jenamani, M. Leveraging ICT for Food Security: An Analysis in the Context of PDS in India. In Proceedings of the Communications in Computer and Information Science, Kolkata, India, 19–21 January 2018. [Google Scholar]
- Immawan, T.; Asmarawati, C.I.; Cahyo, W.N. Business Process Reengineering in a Sago Production Process. In Proceedings of the 2018 4th International Conference on Science and Technology (ICST), Yogyakarta, Indonesia, 7–8 August 2018. [Google Scholar]
- Kuznetsov, N.; Sukhanova, I.; Lyavina, M.; Vorotnikov, I. Import substitution as the basis for ensuring Russia’s food security. Espacios 2018, 39, 28. [Google Scholar]
- Lambin, A.; Corpart, J.-M. UN sustainable development goals and green chemistry, key points for sustainably innovating at Roquette, a global leader in plant-based ingredients. Curr. Opin. Green Sustain. Chem. 2018, 13, 137–139. [Google Scholar] [CrossRef]
- Bastos, F.Z.L.; Scarpin, C.T.; Junior, J.E.P. Picking planning and quality control analysis using discrete simulation: Case in a food industry. Dyna 2019, 86, 271–280. [Google Scholar] [CrossRef]
- Blažková, I.; Dvouletý, O. Investigating the differences in entrepreneurial success through the firm-specific factors: Microeconomic evidence from the Czech food industry. J. Entrep. Emerg. Econ. 2019, 11, 154–176. [Google Scholar] [CrossRef]
- Gardas, B.; Raut, R.; Jagtap, A.H.; Narkhede, B. Exploring the key performance indicators of green supply chain management in agro-industry. J. Model. Manag. 2019, 14, 260–283. [Google Scholar] [CrossRef]
- Guido, R.; Longo, F.; Mirabelli, G.; Solina, V. A framework for a make-to-order scheduling problem with sequence-dependent set up times and product perishability: A case study in the food industry. In Proceedings of the Summer School Francesco Turco, Brescia, Italy, 11–13 September 2019. [Google Scholar]
- Kataike, J.; Aramyan, L.H.; Schmidt, O.; Molnár, A.; Gellynck, X. Measuring chain performance beyond supplier–buyer relationships in agri-food chains. Supply Chain Manag. Int. J. 2019, 24, 484–497. [Google Scholar] [CrossRef]
- Klychova, G.; Zakirova, A.; Mannapova, R.; Pinina, K.; Ryazanova, Y. Assessment of the efficiency of investing activities of organizations. In Proceedings of the E3S Web of Conferences, Kazan, Russia, 18–20 September 2019. [Google Scholar]
- Kubo, H.; Okoso, K. Business ecosystem strategy using new hydroponic culture method. In Proceedings of the Portland International Conference on Management of Engineering and Technology: Technology Management in the World of Intelligent Systems-PICMET, Portland, OR, USA, 25–29 August 2019. [Google Scholar]
- Nejatian, M.; Zarei, M.; Rajabzadeh, A.; Azar, A.; Khadivar, A. Paving the path toward strategic agility: A methodological perspective and an empirical investigation. J. Enterp. Inf. Manag. 2019, 32, 538–562. [Google Scholar]
- Nozari, H.; Najafi, E.; Fallah, M.; Lotfi, F.H. Quantitative analysis of key performance indicators of Green Supply Chain in FMCG industries using non-linear fuzzy method. Mathematics 2019, 7, 1020. [Google Scholar] [CrossRef]
- Pradella, A.; de Freitas Rocha Loures, E.; da Costa, S.; de Lima, E. Energy efficiency in the food industry: A systematic literature review. Braz. Arch. Biol. Technol. 2019, 62, e19190002. [Google Scholar] [CrossRef]
- Chen, X.; Voigt, T. Implementation of the Manufacturing Execution System in the food and beverage industry. J. Food Eng. 2020, 278, 109932. [Google Scholar] [CrossRef]
- Chichenkov, I.; Faizullin, R. Development of a KPI system for pig farms based on the criteria for evaluating the efficiency of the enterprise. In Proceedings of the IOP Conference Series: Earth and Environmental Science, Bali, Indonesia, 2–3 November 2019; Volume 411. [Google Scholar]
- Kurnianto, M.; Wibowo, M.J.; Hariono, B.; Wijaya, R.; Brilliantina, A. The Analysis of Consumer Perception on Quality of Soybean Milk Used Importance Performance Analysis Method. In Proceedings of the IOP Conference Series: Earth and Environmental Science, Bali, Indonesia, 2–3 November 2019; Volume 411. [Google Scholar]
- Kusrini, E.; Safitri, K.N.; Fole, A. Design Key Performance Indicator for Distribution Sustainable Supply Chain Management. In Proceedings of the International Conference on Decision Aid Sciences and Application, DASA, Sakheer, Bahrain, 8–9 November 2020. [Google Scholar]
- Lagarda-Leyva, E.A.; Bueno-Solano, A.; Vea-Valdez, H.P.; Machado, D.O. Dynamic model and graphical user interface: A solution for the distribution process of regional products. Appl. Sci. 2020, 10, 4481. [Google Scholar] [CrossRef]
- Nuseir, M.T. Designing business intelligence (BI) for production, distribution and customer services: A case study of a UAE-based organization. Bus. Process. Manag. J. 2020, 27, 1275–1295. [Google Scholar] [CrossRef]
- Ojo, O.O.; Shah, S.; Zigan, S.; Orchard, J. Sustainability Performance of Rice Manufacturing in Nigerian Supply Chains. In Proceedings of the International Conference on Technology Management, Operations and Decisions, ICTMOD, Marrakech, Morocco, 24–27 November 2020. [Google Scholar]
- Tadić, J.; Medved, I.; Bojanić, R.; Tasić, N. R&D product development KPIs and performance of companies in Serbia. Teh. Vjesn. 2020, 27, 990–995. [Google Scholar] [CrossRef]
- Iten, M.; Fernandes, U.; Oliveira, M.C. Framework to assess eco-efficiency improvement: Case study of a meat production industry. Energy Rep. 2021, 7, 7134–7148. [Google Scholar] [CrossRef]
- Jones, A.; Takahashi, T.; Fleming, H.; Griffith, B.; Harris, P.; Lee, M. Quantifying the value of on-farm measurements to inform the selection of key performance indicators for livestock production systems. Sci. Rep. 2021, 11, 16874. [Google Scholar] [CrossRef]
- Salah, S.A.; Mustafa, A. Integration of energy saving with lean production in a food processing company. J. Mach. Eng. 2021, 21, 118–133. [Google Scholar] [CrossRef]
- Walkiewicz, J.; Lay-Kumar, J.; Herzig, C. The integration of sustainability and externalities into the “corporate DNA”: A practice-oriented approach. Corp. Gov. Int. J. Bus. Soc. 2021, 21, 479–496. [Google Scholar] [CrossRef]
- Abeysiriwardana, P.C.; Jayasinghe-Mudalige, U.K. Role of key performance indicators on agile transformation of performance management in research institutes towards innovative commercial agriculture. J. Sci. Technol. Policy Manag. 2022, 13, 213–243. [Google Scholar] [CrossRef]
- Abeysiriwardana, P.C.; Jayasinghe-Mudalige, U.K.; Seneviratne, G. Probing into the concept of ‘research for society’ to utilize as a strategy to synergize flexibility of a research institute working on eco-friendly commercial agriculture. All Life 2022, 15, 220–233. [Google Scholar] [CrossRef]
- Al Akasheh, M.; Eleyan, N.; Ertek, G. A Predictive Data Analytics Methodology for Online Food Delivery. In Proceedings of the International Conference on Social Networks Analysis, Management and Security, SNAMS, Milan, Italy, 29 November–1 December 2022. [Google Scholar]
- Alrobaish, W.S.; Jacxsens, L.; Spagnoli, P.; Vlerick, P. Assessment of food integrity culture in food businesses through method triangulation. Food Control. 2022, 141, 109168. [Google Scholar] [CrossRef]
- Battarra, I.; Accorsi, R.; Manzini, R.; Rubini, S. Storage efficiency in a deep-lane AVS/RS. IFAC-PapersOnLine 2022, 55, 1337–1342. [Google Scholar] [CrossRef]
- Bayir, B.; Charles, A.; Sekhari, A.; Ouzrout, Y. Performance Measurement and Improvement in Short Food Supply Chains: A Case Study from Lyon, France. In Proceedings of the International Conference on Software, Knowledge Information, Industrial Management and Applications, SKIMA, Phnom Penh, Cambodia, 2–4 December 2022. [Google Scholar]
- Giedelmann-L, N.; Guerrero, W.J.; Solano-Charris, E.L. System dynamics approach for food inventory policy assessment in a humanitarian supply chain. Int. J. Disaster Risk Reduct. 2022, 81, 103286. [Google Scholar] [CrossRef]
- Guan, Z.; Li, H.; Chen, X.; Mu, S.; Jiang, T.; Zhang, M.; Wu, C. Development of Impurity-Detection System for Tracked Rice Combine Harvester Based on DEM and Mask R-CNN. Sensors 2022, 22, 9550. [Google Scholar] [CrossRef]
- Onwude, D.I.; Iranshahi, K.; Rubinetti, D.; Schudel, S.; Schemminger, J.; Martynenko, A.; Defraeye, T. How much do process parameters affect the residual quality attributes of dried fruits and vegetables for convective drying? Food Bioprod. Process. 2022, 131, 176–190. [Google Scholar] [CrossRef]
- Rajmis, S.; Karpinski, I.; Pohl, J.-P.; Herrmann, M.; Kehlenbeck, H. Economic potential of site-specific pesticide application scenarios with direct injection and automatic application assistant in northern Germany. Precis. Agric. 2022, 23, 2063–2088. [Google Scholar] [CrossRef]
- Saint-Ges, V.; Conan, Y.; Cirone, F.; Vittuari, M.; Wiese, C.; Pölling, B.; Graamans, L. A systematic review on food bioeconomy innovative business model—Case study of the Cité Maraichère. Acta Hortic. 2022, 1356, 99–108. [Google Scholar]
- Trienekens, J.; Sanna, F.; Busato, P.; Berruto, R. A European skills strategy for the agri-food and forestry sectors—Key challenges and prerequisites. Int. J. Food Syst. Dyn. 2022, 13, 395–410. [Google Scholar]
- University of Santa Cruz do Sul; Wohlenberg, J.; Hoeltz, M.; Schaefer, J.L.; Nara, E.O.B.; Benitez, G.B.; Fderal University of Rio Grande do Sul; Schneider, R.C.S. Sustainability in agriculture: Analysing the environmental and social aspects of the family farmers’ economy. J. Sustain. Sci. Manag. 2022, 17, 247–257. [Google Scholar] [CrossRef]
- Bojar, W.; Żarski, W.; Kuśmierek-Tomaszewska, R.; Żarski, J.; Baranowski, P.; Krzyszczak, J.; Lamorski, K.; Sławiński, C.; Mattas, K.; Staboulis, C.; et al. A Comprehensive Approach to Assess the Impact of Agricultural Production Factors on Selected Ecosystem Services in Poland. Resources 2023, 12, 99. [Google Scholar] [CrossRef]
- Cagliano, A.C.; Zenezini, G.; Rafele, C.; Grimaldi, S.; Mangano, G. A Design Science—Informed Process for Lean Warehousing Implementation. In Advances in Production Management Systems. Production Management Systems for Responsible Manufacturing, Service, and Logistics Futures. APMS 2023. IFIP Advances in Information and Communication Technology; Alfnes, E., Romsdal, A., Strandhagen, J.O., von Cieminski, G., Romero, D., Eds.; Springer: Cham, Switzerland, 2023; Volume 689. [Google Scholar] [CrossRef]
- Darbyshire, M.; Salazar-Gomez, A.; Gao, J.; Sklar, E.I.; Parsons, S. Towards practical object detection for weed spraying in precision agriculture. Front. Plant Sci. 2023, 14, 1183277. [Google Scholar] [CrossRef]
- Firman, A.; Kuswaryan, S.; Nurlina, L.; Hadiana, M.H.; Sulistyati, M.; Yunasaf, U.; Budinuryanto, D.C.; Trisman, I. Valuation of Massive Artificial Insemination Programs and the Economic Impact for Indonesia. Adv. Anim. Vet.-Sci. 2023, 11, 1037–1046. [Google Scholar] [CrossRef]
- Gilligan, R.; Moran, R.; McDermott, O. Six Sigma application in an Irish meat processing plant to improve process yields. TQM J. 2023, 35, 210–230. [Google Scholar] [CrossRef]
- Gómez-Ramos, A.; Gonzalez, M.R. The contribution of green public food procurement to sustainability: Evidence from two case studies in Spain. Agroecol. Sustain. Food Syst. 2023, 47, 1158–1185. [Google Scholar] [CrossRef]
- Iranshahi, K.; Rubinetti, D.; Onwude, D.I.; Psarianos, M.; Schlüter, O.K.; Defraeye, T. Electrohydrodynamic drying versus conventional drying methods: A comparison of key performance indicators. Energy Convers. Manag. 2023, 279, 116661. [Google Scholar] [CrossRef]
- Kumar, N.; Tyagi, M.; Sachdeva, A. Visualization and analysis of key performance indicators for agricultural cold supply chain in Indian context using fuzzy DEMATEL approach. J. Agribus. Dev. Emerg. Econ. 2023, 15, 368–390. [Google Scholar] [CrossRef]
- Loemba, A.B.T.; Kichonge, B.; Kivevele, T. Comprehensive assessment of heat pump dryers for drying agricultural products. Energy Sci. Eng. 2023, 11, 2985–3014. [Google Scholar] [CrossRef]
- Martin, M.; Elnour, M.; Siñol, A.C. Environmental life cycle assessment of a large-scale commercial vertical farm. Sustain. Prod. Consum. 2023, 40, 182–193. [Google Scholar] [CrossRef]
- Mohamed, A.; Mogili, U.; Kasup, C. How to reduce production Losses-South Pacific Brewery limited and paradise foods limited. In Proceedings of the in AIP Conference Proceedings, Karaikal, India, 14–16 September 2023. [Google Scholar]
- Obe, T.; Siceloff, A.T.; Crowe, M.G.; Scott, H.M.; Shariat, N.W. Combined Quantification and Deep Serotyping for Salmonella Risk Profiling in Broiler Flocks. Appl. Environ. Microbiol. 2023, 89, e0203522. [Google Scholar] [CrossRef]
- Ros, M.B.; Godber, O.F.; Olivo, A.J.; Reed, K.F.; Ketterings, Q.M. Key nitrogen and phosphorus performance indicators derived from farm-gate mass balances on dairies. J. Dairy Sci. 2023, 106, 3268–3286. [Google Scholar] [CrossRef]
- Dyson, K.; Nicolau, A.P.; Tenneson, K.; Francesconi, W.; Daniels, A.; Andrich, G.; Caldas, B.; Castaño, S.; de Campos, N.; Dilger, J.; et al. Coupling remote sensing and eDNA to monitor environmental impact: A pilot to quantify the environmental benefits of sustainable agriculture in the Brazilian Amazon. PLoS ONE 2024, 19, e0289437. [Google Scholar]
- Kasztelan, A.; Nowak, A. Green growth in agriculture―New measurement concept and its empirical verification. Sustain. Dev. 2024, 32, 325–335. [Google Scholar]
- Marrucci, L.; Daddi, T.; Iraldo, F. Creating environmental performance indicators to assess corporate sustainability and reward employees. Ecol. Indic. 2024, 158, 111489. [Google Scholar] [CrossRef]


| # Query | Search | Exclusion Criteria | # Papers Identified After Exclusion Criteria | ||
|---|---|---|---|---|---|
| Terms in “Title, Abstract, Keywords” | # Papers Identified Before Exclusion Criteria | # Criteria and Description | # Papers Removed | ||
| 1 | “food supply chain” AND “key performance indicator” | 35 | #1: book chapter | 4 | 30 |
| #2: Chinese | 1 | ||||
| 2 | “agriculture supply chain” AND “key performance indicator” | 1 | - | - | 1 |
| 3 | Food AND “key performance indicator” | 252 | #1: book chapter; Note; Editorial; Short survey; Letter; Data paper; Book | 16; 2; 2; 1; 1; 1; 1 | 224 |
| #2: Chinese; Ukrainian; Russian; German; French | 2; 1; 1; 1; 1 | ||||
| 4 | Agriculture AND “key performance indicator” | 107 | #1: Book chapter | 5 | 99 |
| #2: Chinese; German | 2; 1 | ||||
| Papers identified in the electronic database searching | 354 | ||||
| Categories | Description |
|---|---|
| Year | Year of publication |
| Paper classification | Type of document |
| Journal | Research and review paper published in international journal |
| Conference paper | Research paper published in conference proceedings |
| Methodology | Methodology used by the authors to carry out the research |
| Empirical | Any research where conclusions of the study are strictly drawn from concrete empirical evidence and data, and therefore originates from verifiable evidence |
| Analytic/model | Research that provides an analytical model to quantify some KPIs in the FSC |
| Case study | Study that presents one or more applications to real contexts |
| Conceptual | Paper that discusses some specific KPIs in FSC, without any direct application (i.e., mostly theoretical) |
| Source title | Journal/conference in which the document was published |
| Geography | Country of the first author |
| Citations | Number of citations received (at the time of data extraction) |
| Author | Who has contributed to the study |
| Author keywords | Main topics of a research paper [28] |
| Types of SC | FSC classification based on the type of products studied |
| Agricultural; Meat; Fish; Dairy; Bread; Animal and plant production; Alcohol-free drinks; Food production; Fruit | |
| Stage of SC | FSC classification according to its different stages [23] |
| Supply | |
| Production | |
| Distribution | |
| KPIs measured | Dimension of its performance over time |
| Economic | How the FSC interacts with the economic impacts |
| Environmental | How the FSC interacts with environmental emissions |
| Social | How the FSC interacts with the local community and society as a whole |
| # | Paper | Year | Citations | Topic Covered | Approach/Technique Adopted |
| 1 | [56] | 2018 | 206 | Perishability | Inventory Routing Problem |
| 2 | [57] | 2014 | 196 | Food security | Literature review |
| 3 | [58] | 2018 | 97 | Food waste | Literature review |
| 4 | [59] | 2019 | 89 | Food delivery services | Web mining techniques |
| 5 | [36] | 2012 | 85 | Sustainable food logistics management | Literature review |
| 6 | [60] | 2019 | 80 | Traceability | Blockchain technology |
| 7 | [44] | 2006 | 76 | Sustainable food procurement | Focus group |
| 8 | [20] | 2016 | 75 | Water footprint | Critical literature synthesis; hierarchical decision-making framework |
| 9 | [61] | 2009 | 72 | Carbon footprint of perishable goods | Sensor information |
| 10 | [43] | 2003 | 69 | Food safety and animal welfare policies | Case study discussion |
| # | Paper | Year | Citations per Year | Topic Covered | Approach/Technique Adopted |
| 1 | [56] | 2018 | 29.42 | Perishability | Inventory Routing Problem |
| 2 | [57] | 2014 | 17.82 | Food security | Literature review |
| 3 | [59] | 2019 | 14.83 | Food delivery services | Web mining techniques |
| 4 | [58] | 2018 | 13.86 | Food waste | Literature review |
| 5 | [62] | 2022 | 13.67 | Bioprocess technologies needed for cell-based meat production | Literature review |
| 6 | [60] | 2019 | 13.33 | Traceability | Blockchain technology |
| 7 | [47] | 2021 | 11.25 | Agrivoltaic systems | Optimization model |
| 8 | [63] | 2021 | 10 | Precision agriculture | Multidisciplinary architecture: AgriFusion |
| 9 | [64] | 2020 | 9.2 | Agriculture supply chain | Framework for supply chain performance measurement based on IoT |
| 10 | [20] | 2016 | 8.33 | Water footprint | Critical literature synthesis; hierarchical decision-making framework |
| Author | No. of Papers | References | Citations |
|---|---|---|---|
| Van der Vorst J.G.A.J. | 4 | [36] | 85 |
| [65] | 36 | ||
| [56] | 206 | ||
| [66] | 8 | ||
| Manning L. | 3 | [45] | 26 |
| [67] | 32 | ||
| [19] | 8 | ||
| Bottani E. | 3 | [68] | 2 |
| [69] | 0 | ||
| [23] | 0 | ||
| Trenz O. | 3 | [70] | 22 |
| [37] | 3 | ||
| [71] | 7 |
| Frequency Count | N° of Keywords | Persistency Count | N° of Keywords |
|---|---|---|---|
| 1 | 250 | 1 | 9 |
| 2 | 57 | 2 | 47 |
| 3 | 16 | 3 | 65 |
| 4 | 6 | 4 | 23 |
| 5 | 5 | 5 | 17 |
| 6 | 1 | 6 | 25 |
| 7 | 2 | 7 | 28 |
| 9 | 2 | 8 | 17 |
| 13 | 1 | 9 | 14 |
| 14 | 1 | 10 | 5 |
| 17 | 1 | 11 | 14 |
| 33 | 1 | 12 | 23 |
| - | - | 13 | 17 |
| - | - | 15 | 7 |
| - | - | 16 | 4 |
| - | - | 17 | 14 |
| - | - | 19 | 8 |
| - | - | 22 | 6 |
| Total | 343 | Total | 343 |
| Class | List of Keywords |
|---|---|
| Well-established topics (19 terms) | Key Performance Indicator; Supply chain management; Performance; Sustainability; Food Industry; Food supply chain; Food safety; Supply chains of agriculture; Energy efficiency; Agri-food; Economic; Food waste; Perishability; Lean production; Meat industry; Modeling; Organization; Simulation; Sustainable development |
| Trendy topics (6 terms) | Energy efficiency; Agri-food; Food waste; System Dynamics; Organization; Sustainable development |
| Emerging/phantom topics (51 terms) | Automated Warehouse; Case study; Cold supply chain; Decision making; Food integrity; Food processing industry; Industry 4.0; Internet of Things; Life cycle assessment (LCA); Logistics; Manufacture; Agent-based modeling; Analytic Hierarchy Process; Balanced scorecard; Biomanufacturing; bread; Business process reengineering; Circularity; Climate change; Commercial agriculture; Data analytics; Demand-side management; Discrete simulation Distribution centers; Efficiency; Enterprise agility; Financial performance; Fuzzy TOPSIS; Green economy; Horizontal logistics collaboration; House of quality; ICT; Imports; Industrial dryers; Irrigation; Machine learning; Management; Multi criteria analysis; Online food delivery; Quality function deployment; Renewable energy; Risk analysis; Scenario analysis; School canteen; Skills strategy; Smart agriculture; Smart industry; Stochastic programming; Sustainable intensification; Urban agriculture; Yield gap |
| Intermittent topics (12 terms) | Literature review; Nutrition; Production; Sensors; Benchmarking; Catering food production; Dairy business; Environmental performance; Food distribution; Plant factory; Public sector organizations; Quantitative models |
| Keyword Class | Period 1 (2003–2008) | Period 2 (2009–2013) | Period 3 (2014–2018) | Period 4 (2019–2023) |
|---|---|---|---|---|
| Well established | 1 | 0 | 0 | 4 |
| Trendy | 0 | 1 | 1 | 0 |
| Intermittent | 8 | 9 | 25 | 62 |
| Emerging/phantom | 11 | 26 | 45 | 109 |
| Total keywords | 20 | 36 | 71 | 175 |
| Number of papers | 7 | 13 | 26 | 68 |
| period 1 -> period 2 | period 2 | |||||
| well established | trendy | intermittent | emerging/ phantom | disappeared | ||
| period 1 | well established | 1 | ||||
| trendy | ||||||
| intermittent | 2 | 6 | ||||
| emerging/phantom | 11 | |||||
| new | 1 | 9 | 24 | |||
| period 2 -> period 3 | period 3 | |||||
| well established | trendy | intermittent | emerging/ phantom | disappeared | ||
| period 2 | well established | |||||
| trendy | 1 | |||||
| intermittent | 9 | |||||
| emerging/phantom | 1 | 4 | 21 | |||
| new | 1 | 24 | 41 | |||
| period 3 -> period 4 | period 4 | |||||
| well established | trendy | intermittent | emerging/ phantom | disappeared | ||
| period 3 | well established | |||||
| trendy | 1 | |||||
| intermittent | 1 | 1 | 23 | |||
| emerging/phantom | 1 | 2 | 3 | 39 | ||
| new | 2 | 59 | 106 | |||
| Products | Economic KPIs | Social KPIs | Environmental KPIs |
|---|---|---|---|
| Agricultural products; Fruits; Animal and plant production | Farm profit per hectare | Employment in agriculture | Soil fertility |
| Weight of the fruit/vegetable | Number of agri-tourists | Plant growth and well-being | |
| Volume and dimensions of the fruit/vegetable | Agricultural food safety | Water quality indicators | |
| Crops distance | Foodborne diseases | Water footprint | |
| Crops yield | Flavor of the product | Pesticide usage | |
| Net/Gross economic irrigation water productivity (NEWP–GEWP) | Rural community participation | Soil Ph | |
| Agronomic productivity | Landowner independence in decision making | Weed Coverage Rate | |
| Farmers income | |||
| Dried product quality | |||
| % of permanent grassland and pasture areas | |||
| % of the area for biological agriculture | |||
| Weight of parturient sheep | |||
| Value of sheep bodies at slaughter | |||
| Meat | Number of livestock | Animal well-being | Reducing meat waste |
| Meat consumption rate | |||
| Dairy products | Young versus adult cows | - | - |
| % of self-produced food | |||
| Animal density | |||
| Calf births | |||
| Bread | Wheat level in silos | - | - |
Disclaimer/Publisher’s Note: The statements, opinions and data contained in all publications are solely those of the individual author(s) and contributor(s) and not of MDPI and/or the editor(s). MDPI and/or the editor(s) disclaim responsibility for any injury to people or property resulting from any ideas, methods, instructions or products referred to in the content. |
© 2025 by the authors. Licensee MDPI, Basel, Switzerland. This article is an open access article distributed under the terms and conditions of the Creative Commons Attribution (CC BY) license (https://creativecommons.org/licenses/by/4.0/).
Share and Cite
Bottani, E.; Tebaldi, L.; Casella, G.; Mora, C. Key Performance Indicators for Food Supply Chain: A Bibliometric and Systematic Literature Review. Appl. Sci. 2025, 15, 3841. https://doi.org/10.3390/app15073841
Bottani E, Tebaldi L, Casella G, Mora C. Key Performance Indicators for Food Supply Chain: A Bibliometric and Systematic Literature Review. Applied Sciences. 2025; 15(7):3841. https://doi.org/10.3390/app15073841
Chicago/Turabian StyleBottani, Eleonora, Letizia Tebaldi, Giorgia Casella, and Cristina Mora. 2025. "Key Performance Indicators for Food Supply Chain: A Bibliometric and Systematic Literature Review" Applied Sciences 15, no. 7: 3841. https://doi.org/10.3390/app15073841
APA StyleBottani, E., Tebaldi, L., Casella, G., & Mora, C. (2025). Key Performance Indicators for Food Supply Chain: A Bibliometric and Systematic Literature Review. Applied Sciences, 15(7), 3841. https://doi.org/10.3390/app15073841