Article

Universal Modeling for Non-Destructive Testing of Soluble Solids Content in Multi-Variety Blueberries Based on Hyperspectral Imaging Technology

1
College of Computer and Control Engineering, Northeast Forestry University, Harbin 150040, China
2
College of Science, Northeast Forestry University, Harbin 150040, China
*
Author to whom correspondence should be addressed.
Appl. Sci. 2025, 15(7), 3888; https://doi.org/10.3390/app15073888
Submission received: 1 March 2025 / Revised: 25 March 2025 / Accepted: 31 March 2025 / Published: 2 April 2025

Abstract

:
The soluble solids content (SSC) of blueberry is a key index for evaluating its quality. In view of the demand for rapid non-destructive testing of blueberry SSC and the shortcomings of the existing single-variety testing models in cross-variety applications, a universal prediction model construction method based on hyperspectral imaging (HSI) technology is proposed in this study. The spectral data of three blueberry varieties were obtained by using a 935∼1720 nm hyperspectral imaging system. A partial least squares regression (PLSR) model was constructed by combining different preprocessing methods such as Savitzky–Golay (S-G), multiplicative scatter correction (MSC) and standard normal variable transformation (SNV). The results showed that the PLSR model pretreated by S-G-MSC-SNV had the best performance, and the determination coefficient, root mean square error and residual prediction deviation of the prediction set were 0.94, 0.33 % and 3.94, respectively. The characteristic wavelengths were optimized in stages by uninformative variables elimination (UVE) and the successive projections algorithm (SPA), and the model was simplified by multiple linear regression (MLR). Finally, a high-precision UVE-PLSR model and a simple and efficient UVE-SPA-MLR hybrid model were obtained. The construction of this universal model effectively solves the limitation of the single-variety model and has important application value in the optimization of food industry production and quality control.

1. Introduction

Blueberries, also known as “bilberries”, are popular for their unique flavor and remarkable health benefits. The fruit is rich in natural antioxidants such as ascorbic acid, anthocyanins and phenolic compounds, and has outstanding nutritional value [1,2]. As a popular high-value fruit, blueberries are mainly grown in the core production areas of Canada, the United States and China. With the deepening development of global agricultural trade, China has become the largest blueberry producer and exporter in Asia [3]. Under the trend of global consumption upgrading, the requirements for blueberry quality in the international market have been improving, and the demand for high-quality blueberries has shown rapid growth [4].
Among the internal quality parameters of fruits, soluble solids content (SSC), pH and moisture content (MC) are important indicators for evaluating the internal quality of blueberries [5]. The pH directly affects the flavor of blueberries by regulating the acidity intensity, and MC can effectively reflect the freshness of the fruit, which is closely related to the taste [6]. While the SSC measured in this study is rich in a variety of substances, in which the balance between sugars and organic acids determines the overall flavor of blueberries, the vitamins and antioxidants contained in SSC have an important impact on the nutritional value and health benefits of blueberries [7,8]. However, traditional SSC detection methods are mostly destructive experiments with cumbersome processes, which are unable to realize rapid and non-destructive quality detection, making it difficult to meet modern agricultural production and market demand.
Hyperspectral imaging (HSI) technology has become an important technical means for fruit internal quality assessment due to its high efficiency and non-destructive advantages [9]. Currently, hyperspectral imaging technology has achieved remarkable results in the internal quality detection of a variety of fruits, such as apples [10,11,12], blueberries [13], kiwifruit [14], etc. Weng et al. [15] established a non-destructive detection model of apple brix by using hyperspectral imaging and combining it with spectral super-resolution technology, which provided a low-cost and high-efficiency way of acquiring hyperspectral images, realizing convenient and fast detection of apple brix. Leiva-Valenzuela et al. [16] used a hyperspectral imaging system to simultaneously detect and analyze blueberry hardness and soluble solids content. The results showed that the prediction accuracy of hardness was significantly higher than that of soluble solids content in the prediction model constructed by the partial least squares method, and the feasibility of hyperspectral imaging technology in blueberry hardness and SSC sorting was proved. Fan et al. [17] presented a combined partial least squares regression method combining spectral and texture features, proving the significant potential of combining spectral and texture features in the non-destructive detection of SSC in apples. A study by Zhang et al. [18] also utilized hyperspectral imaging combined with the partial least squares regression (PLSR) method to establish a monitoring model for textural and structural characteristics of pears under different freezing and thawing conditions, which provided a reliable method for non-destructive evaluation of the quality of frozen agricultural products. In addition to the above applications, hyperspectral imaging technology also shows significant advantages in the field of fruit pest detection and defect recognition. Haghbin et al. [19] used hyperspectral imaging technology in combination with chemometrics to realize the early nondestructive detection of Staphylococcus griseus-infected kiwifruit and the prediction of quality attributes. There are many other studies like these, but all of these studies have used a single variety of fruit as the object to establish quality detection models. However, due to the wide variety of fruits and certain spectral differences between different varieties, the development of a universal model for multi-variety fruit quality testing is important for the improvement of testing efficiency, reducing in equipment costs, and the fulfillment of global market demand.
Hyperspectral imaging techniques are capable of acquiring high-dimensional spectral data, but the question of how to efficiently extract valuable information from these complex datasets remains a major challenge at present. In recent years, machine learning methods have shown significant advantages in the field of hyperspectral data analysis by virtue of their powerful data processing and analysis capabilities [20]. PLSR, a classical machine learning method adopted in this study, was able to show excellent performance in multi-variety blueberry SSC prediction. In addition, in the process of constructing a universal model, screening out the key wavelengths that contribute significantly to the model performance is essential to improve the detection efficiency and enhance the model quality. However, due to the significant heterogeneity of spectral features among blueberry varieties, this intrinsic difference not only increases the difficulty of feature wavelength screening, but also puts higher demands on the robustness and the ability of prediction models to generalize.
At present, the relevant literature on the universal model of multi-variety blueberry quality detection is relatively limited. Compared with the existing research, this paper mainly focuses on the use of a joint preprocessing method and multi-level wavelength screening strategy to realize the fusion of multi-variety data and the generalization training of different scene models, so as to overcome the limitations of cross-variety detection and maintain the efficiency of the model in limited scenarios. The purpose of this study is to achieve the following specific objectives: (1) to construct a universal prediction model applicable to three varieties of blueberry SSC based on hyperspectral imaging; (2) to explore methods for eliminating inter-variety heterogeneity and to assess the feasibility of establishing a multi-species universal model; and (3) to optimize the model structure through multilevel feature selection to achieve improved detection efficacy.

2. Materials and Methods

2.1. Sample Preparation

In April 2024, blueberry experimental samples were collected from an orchard in Dandong City, Liaoning Province, China. After screening, the blueberry samples with intact appearance and no obvious defects were placed in a 4 °C cryogenic environment for storage. The experimental samples included three varieties of “L25”, “Bluecrop” and “Lexi”, each of which had 300 samples. The experiment was divided into three days. Twelve hours before the start of the experiment, 100 blueberry samples of three varieties were selected from the refrigerated room for the experiment. During the experiment, the indoor temperature was kept stable (about 24 °C), and the relative humidity was 30∼40% [21,22].

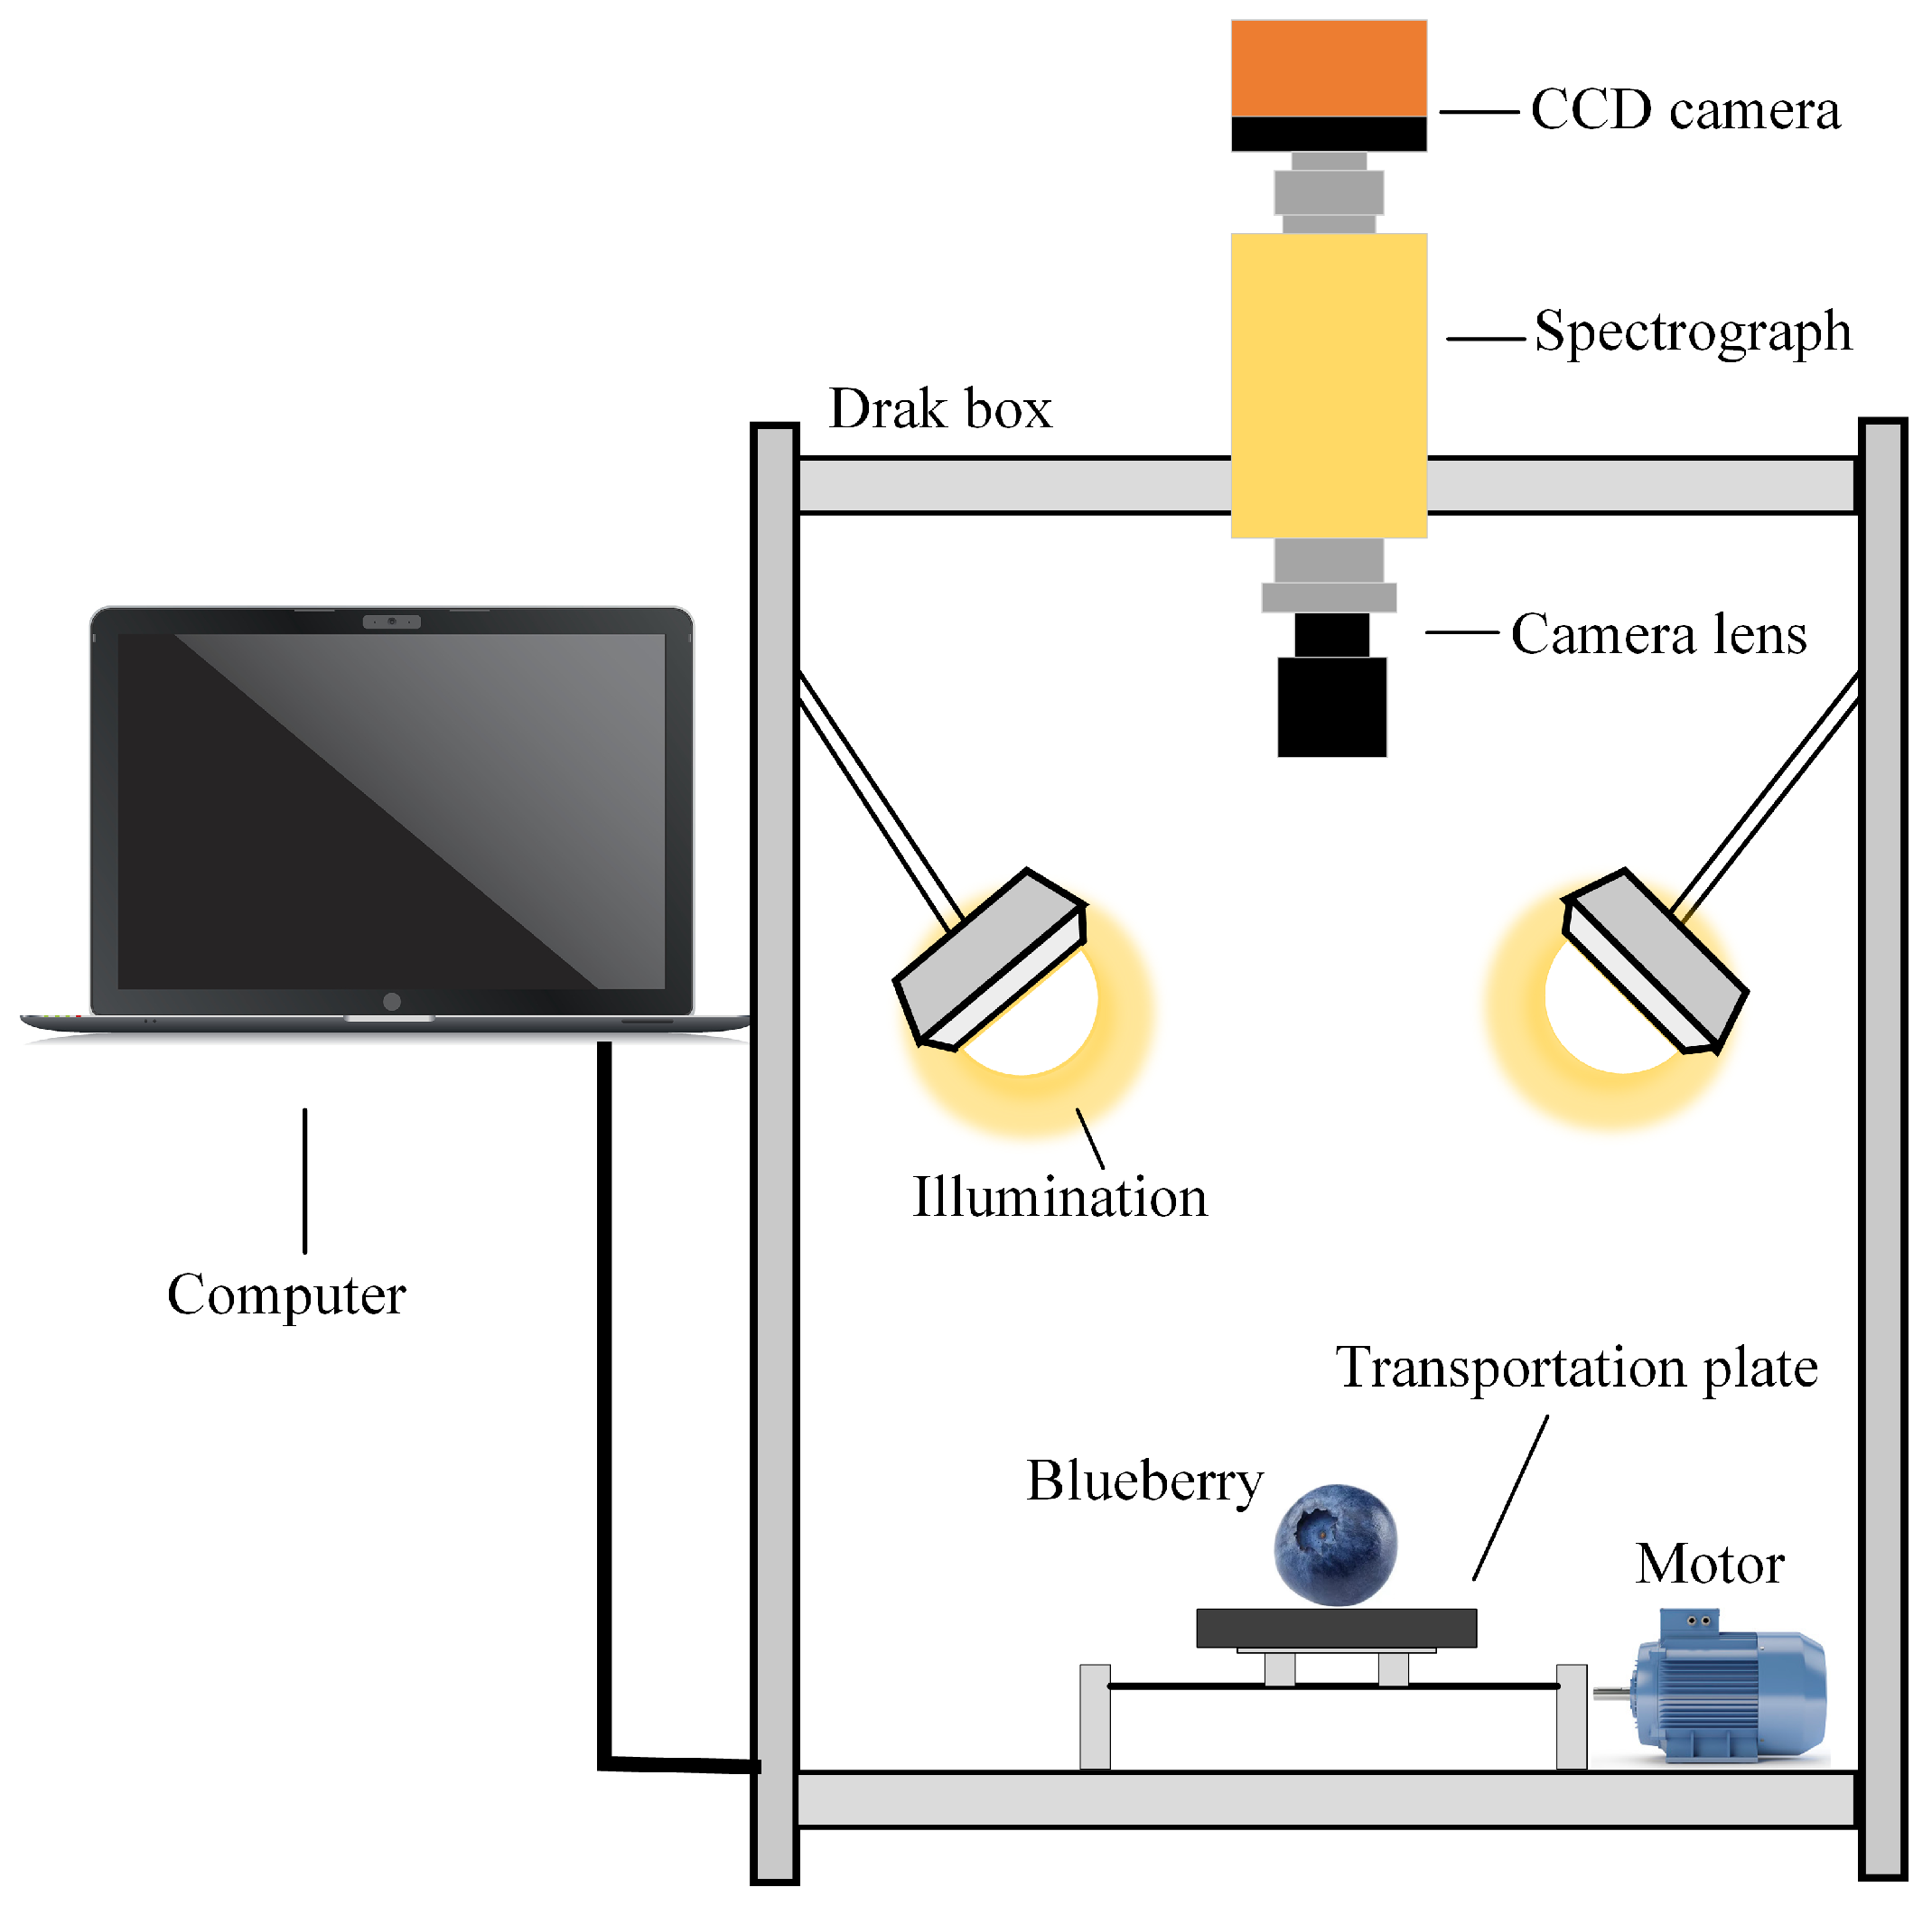
2.2. Hyperspectral Image Acquisition

In this experiment, the hyperspectral imaging system shown in Figure 1 was used to collect the spectral data of three varieties of blueberry samples, and the spectral range was 935∼1720 nm. The major components comprising the imaging system included a hyperspectral imager (Specim FX17, Specim, Oulu, Finland) capable of capturing 224 spectral channels with a resolution of 8 nm; an illumination section utilizing six 20 W halogen lamps; a displacement stage and stepper motor for sample movement control; and a computer for system control and data processing.
To eliminate the effect of random thermal fluctuations on image quality, the hyperspectral imaging system needs to be thermally stabilized by 30 min of preheating before the experiment. In addition, black and white correction of the acquired raw images using Equation (1) is required to eliminate the effect of camera dark current.
R = I r a w I d a r k I w h i t e I d a r k
where R is the corrected hyperspectral image, I r a w is the raw image, I w h i t e is the all-white image and I d a r k is the all-black image [23]. After black-and-white correction of the original image, the blueberry region was selected using the ‘Region of Interest (ROI)’ tool of ENVI 5.3.1 (Exelis Visual Information Solutions, America), and the ‘Build Mask’ plug-in was used to generate and apply a binary mask to remove background interference and retain blueberry data. Finally, the ROI of the blueberry was marked by the ‘growth’ module of ENVI, and the average spectrum of the pixels in the region was calculated to obtain the average spectral data representing the spectral characteristics of the blueberry.

2.3. Soluble Solids Content Measurement

The initial step was to divide each blueberry in half along its equatorial plane and randomly select one half to be wrapped in a nonwoven fabric for juice extraction. The extracted juice was analyzed using a digital refractometer (PAL-3; ATAGO Co., Ltd., Tokyo, Japan), with triplicate measurements conducted to establish a mean SSC value for the selected half [24]. This procedure was subsequently replicated on the remaining half. The final SSC value for each sample was derived by calculating the mean of the two half-berry measurements, ensuring representative and reliable data.

2.4. Spectral Preprocessing Methods

In hyperspectral data analysis, data preprocessing can effectively solve the problems of noise interference, the scattering effect and inter-sample heterogeneity in spectral data, and guarantee the model prediction accuracy and robustness. The Savitzky–Golay (S-G) algorithm smooths the spectral data through local polynomial fitting, which effectively suppresses random noise while retaining the detailed features of the spectral signal to the greatest extent. The multiplicative scatter correction (MSC) algorithm can eliminate the multiplicative scattering interference caused by the difference of sample particle size and surface roughness [25]. The standard normal variable transformation (SNV) algorithm eliminates the additive baseline offset between samples by centralizing and standardizing each spectrum separately [26].
In view of the fact that it is difficult for a single preprocessing method to completely remove noise interference, the combined use of multiple methods can often achieve better denoising results [27]. Based on this, this study not only used independent preprocessing methods, but also combined the S-G algorithm with other methods. By evaluating the impact of different preprocessing strategies on model performance, the optimal data processing scheme was selected.

2.5. Principal Component Analysis Algorithm

Principal component analysis (PCA) is a classical multivariate data dimensionality reduction method, which can transform high-dimensional correlated variables into low-dimensional independent principal components through orthogonal transformations and maximize the preservation of the main information of the original data [28]. Each principal component represents the direction of maximizing the variance of the original data, in which the first principal component (PC-1) contributes the largest variance, and the contribution of the rest of the principal components decreases in order. The main purpose of using PCA in this paper was to analyze the heterogeneity among the three blueberry varieties and to assess the feasibility of data fusion.

2.6. Feature Wavebands Selection Algorithms

Since hyperspectral data contain a large number of wavelength variables, and many wavelengths may not provide useful information for model construction, screening effective characteristic wavelengths is crucial for constructing robust and efficient prediction models. Aiming at the problems of low modeling efficiency, high computational complexity and low model accuracy caused by redundant wavelengths, this study adopted a phased wavelength screening strategy. Firstly, the uninformative variables elimination (UVE) algorithm is used to extract the effective characteristic wavelengths from the preprocessed spectral data, and then the wavelength subset was further optimized by the successive projections algorithm (SPA). This hierarchical screening strategy effectively balances the detection accuracy and computational efficiency, and can satisfy the fast and efficient detection needs in practical applications.

2.6.1. Uninformative Variables Elimination

The UVE algorithm is a feature wavelength selection algorithm based on statistical stability analysis. Its core is to first introduce a matrix of random variables of the same dimension into the original spectral matrix to construct an extension matrix, then use PLSR to calculate the regression coefficient matrix B of this extension matrix, and calculate the coefficient of variation (CV) of each variable with Equation (2), so as to select the characteristic wavelengths that have a stable contribution to the target variables.
C V = m e a n ( b i ) S t d ( b i )
where b represents the regression coefficient, i represents the i-th column vector in the spectral matrix and CV is defined as the ratio of the mean value to the standard deviation of the regression coefficient. The CV value is used to evaluate the stability of the regression coefficient of the variable. The larger the CV, the more significant the contribution of the variable to the model. The maximum CV value ( C V m a x ) of the random variable matrix is used as the screening threshold, and the variables whose CV values are lower than the threshold are eliminated, and the effective variables are retained for the construction of the final regression model [29].

2.6.2. Successive Projections Algorithm

SPA, a wavelength screening method utilizing vector projection analysis, employs an iterative projection process to identify the most representative variables. This approach effectively addresses issues related to data redundancy and multicollinearity. Starting from the initial wavelength, each iteration needs to calculate the orthogonal projection residual between the selected wavelength and the selected wavelength, and select the wavelength that maximizes the new information until the optimal wavelength selection number is achieved. In this way, SPA can significantly reduce the feature dimension while retaining the key information of spectral data, thereby improving the prediction efficiency and robustness of the model [30].

2.7. Partial Least Squares Regression Modeling Algorithm

As an efficient multivariate statistical analysis method, partial least squares regression (PLSR) plays an important role in high-dimensional spectral data processing [31]. Its mathematical expression is given by Equation (3).
Y = b X + e
where b represents the vector of regression coefficients and e represents the residual term. The algorithm associates the spectral matrix X with the SSC matrix Y, which are jointly mapped into the space of latent variables (LVs), to extract the feature components that can explain the maximum covariance information of both. During the modeling process, cross-validation is applied to assess the prediction accuracy under different numbers of LVs to determine the optimal model complexity, thus effectively preventing the model from overfitting or underfitting.

2.8. Model Performance Evaluation

The performance evaluation of the model adopts a multi-index comprehensive evaluation system, including the determination coefficient of the calibration set ( R C 2 ), the determination coefficient of the prediction set ( R P 2 ), the root mean square error of the calibration (RMSEC) and the root mean square error of the prediction (RMSEP). Residual prediction deviation (RPD) is used as a criterion for model quality [32]. The specific calculation formulas of each evaluation index are shown in Equations (4)–(6).
R C 2 , R P 2 = 1 i = 1 n ( y i y i ^ ) 2 i = 1 n ( y i y m ) 2
R M S E C , R M S E P = 1 n i = 1 n ( y i y i ^ ) 2
R P D = S D R M S E P 1 n 1 i = 1 n ( y i y m ) 2 1 n i = 1 n ( y i y i ^ ) 2
where y i and y i ^ represent the measured and predicted values of the SSC of the i-th blueberry sample, respectively, y m denotes the mean value of the SSC of the blueberry sample and n denotes the number of blueberry samples in the calibration or prediction set. In general, an ideal model should have higher determination coefficients and smaller root mean square errors. The range of RPD values reflects the predictive ability of the model: with RPD < 1.5 , the model is unavailable; with 1.5 RPD < 2.0 , the model can distinguish between high and low values of the target variable; with 2.0 RPD < 2.5 , the model has the ability to make quantitative predictions; and with RPD ⩾ 2.5, the model has an excellent predictive performance, and the quality of the model is improved with the increase in the RPD [33,34].

3. Results

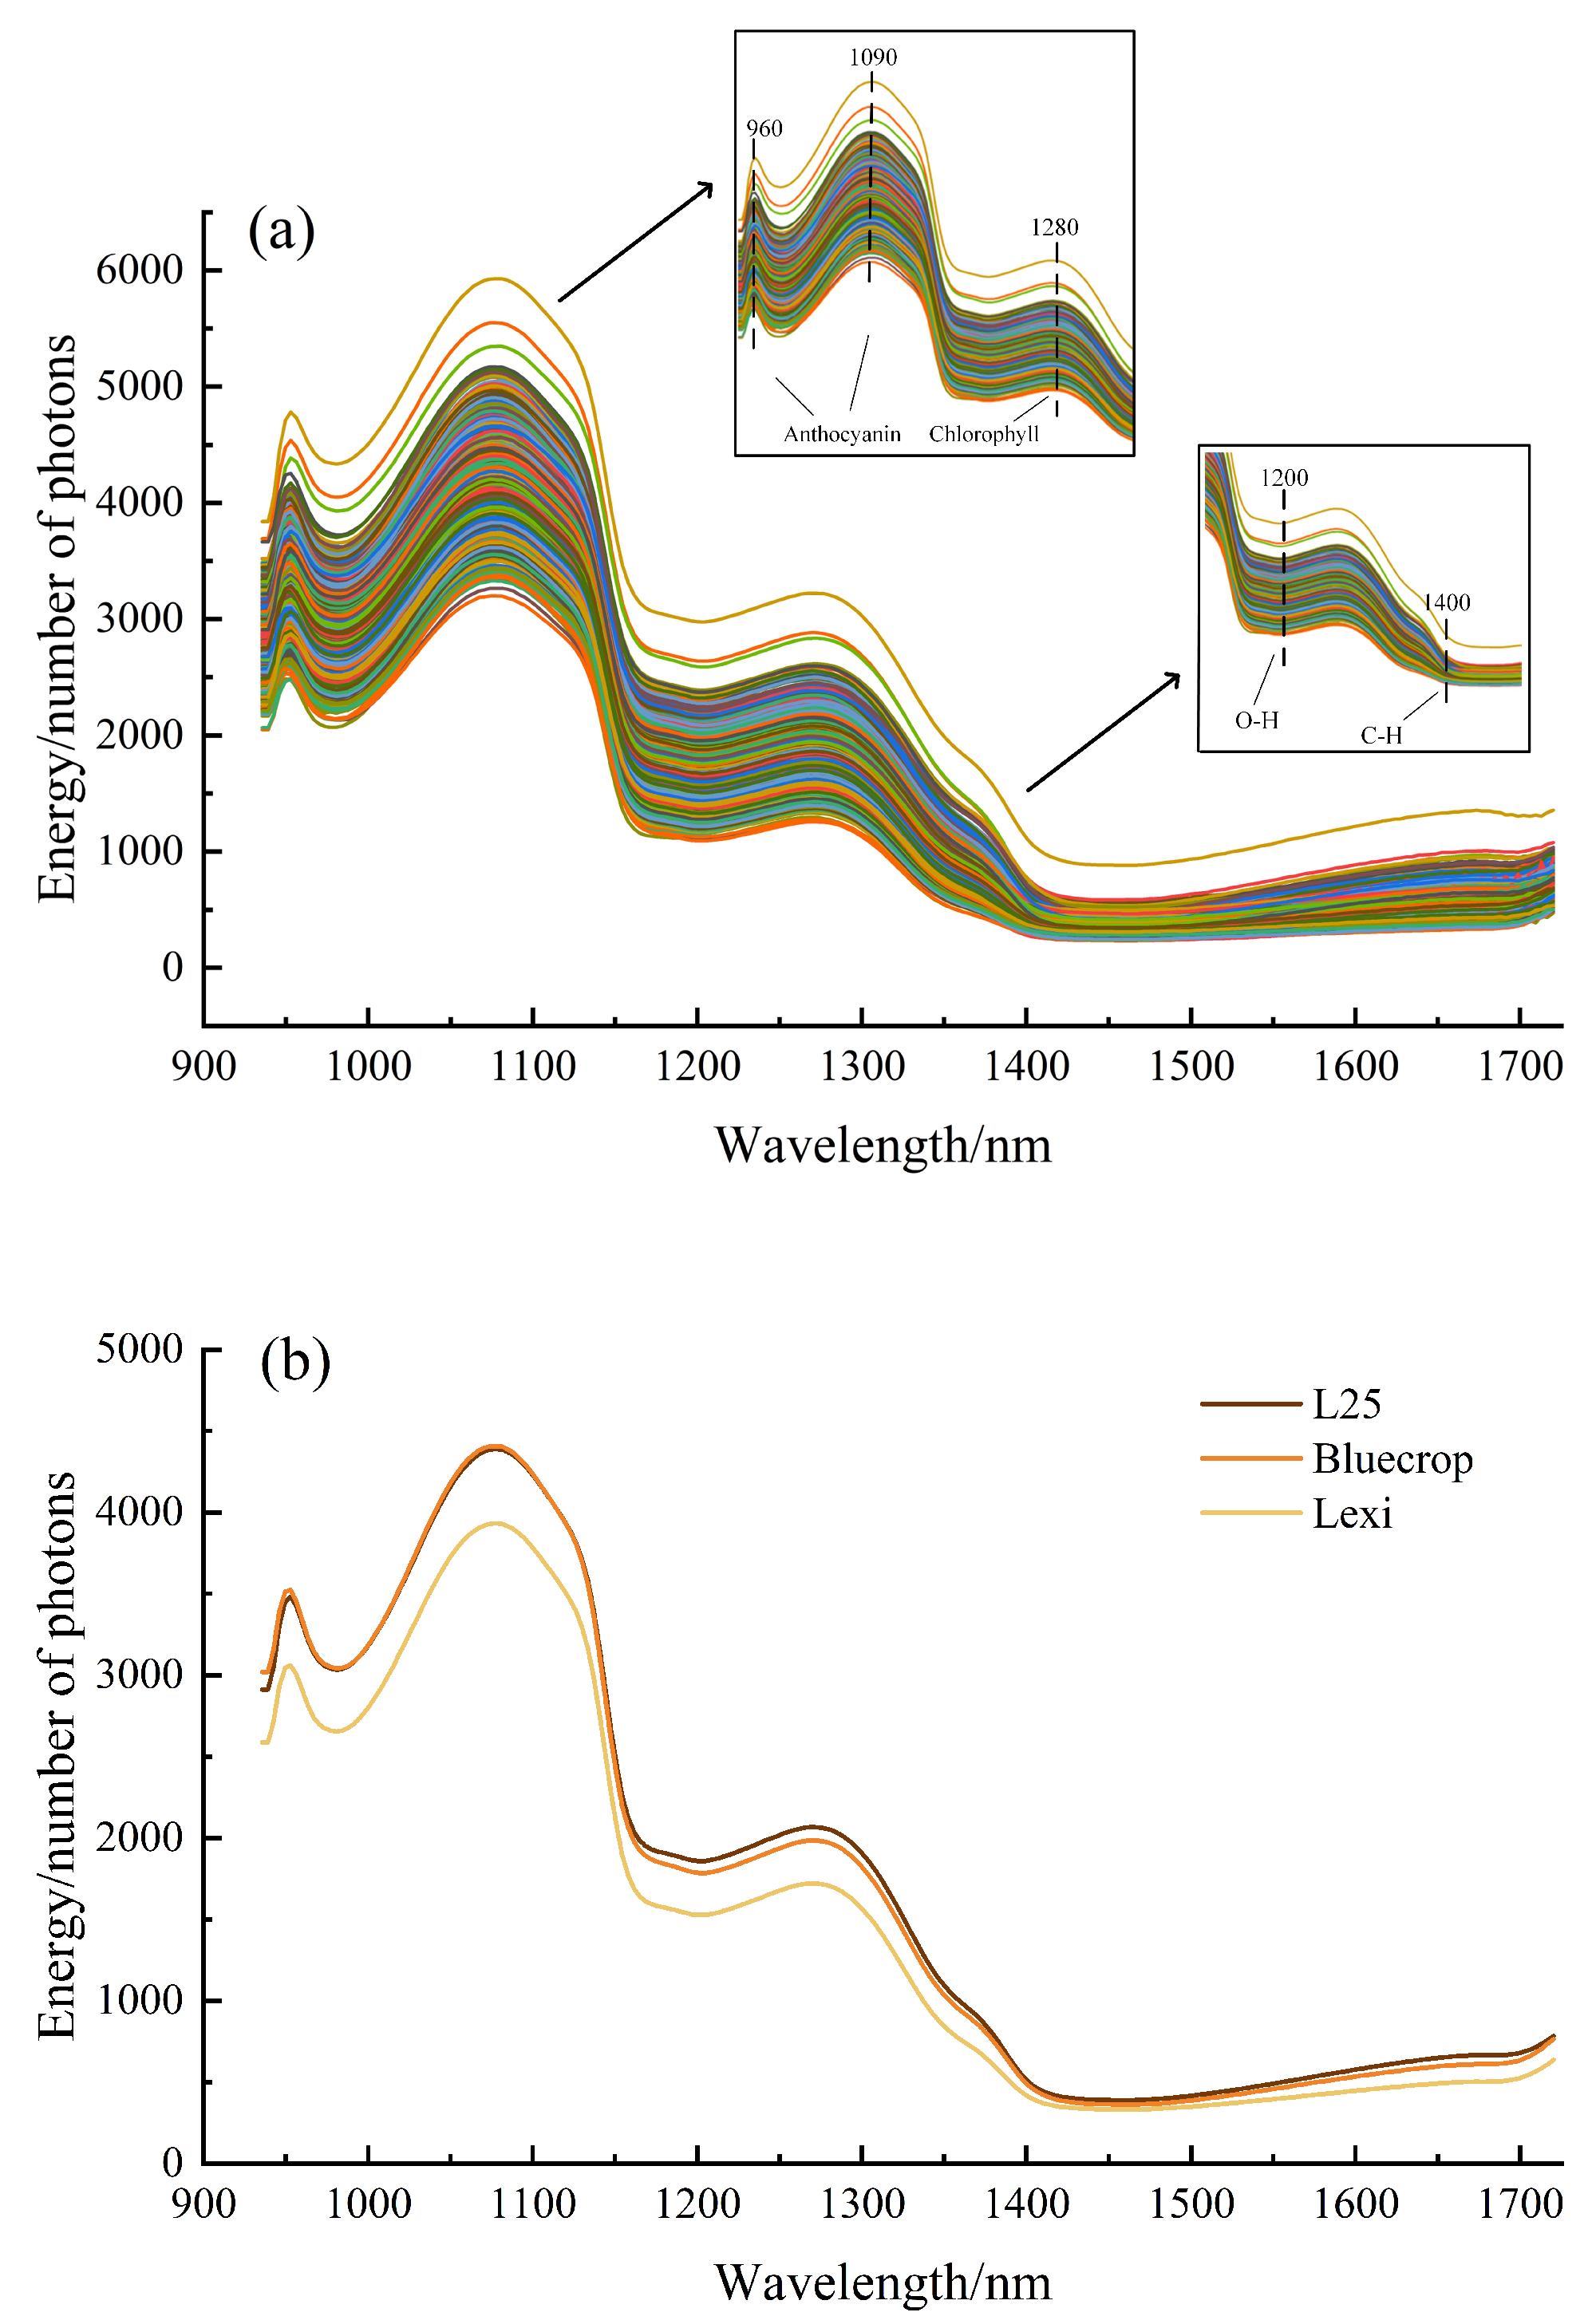
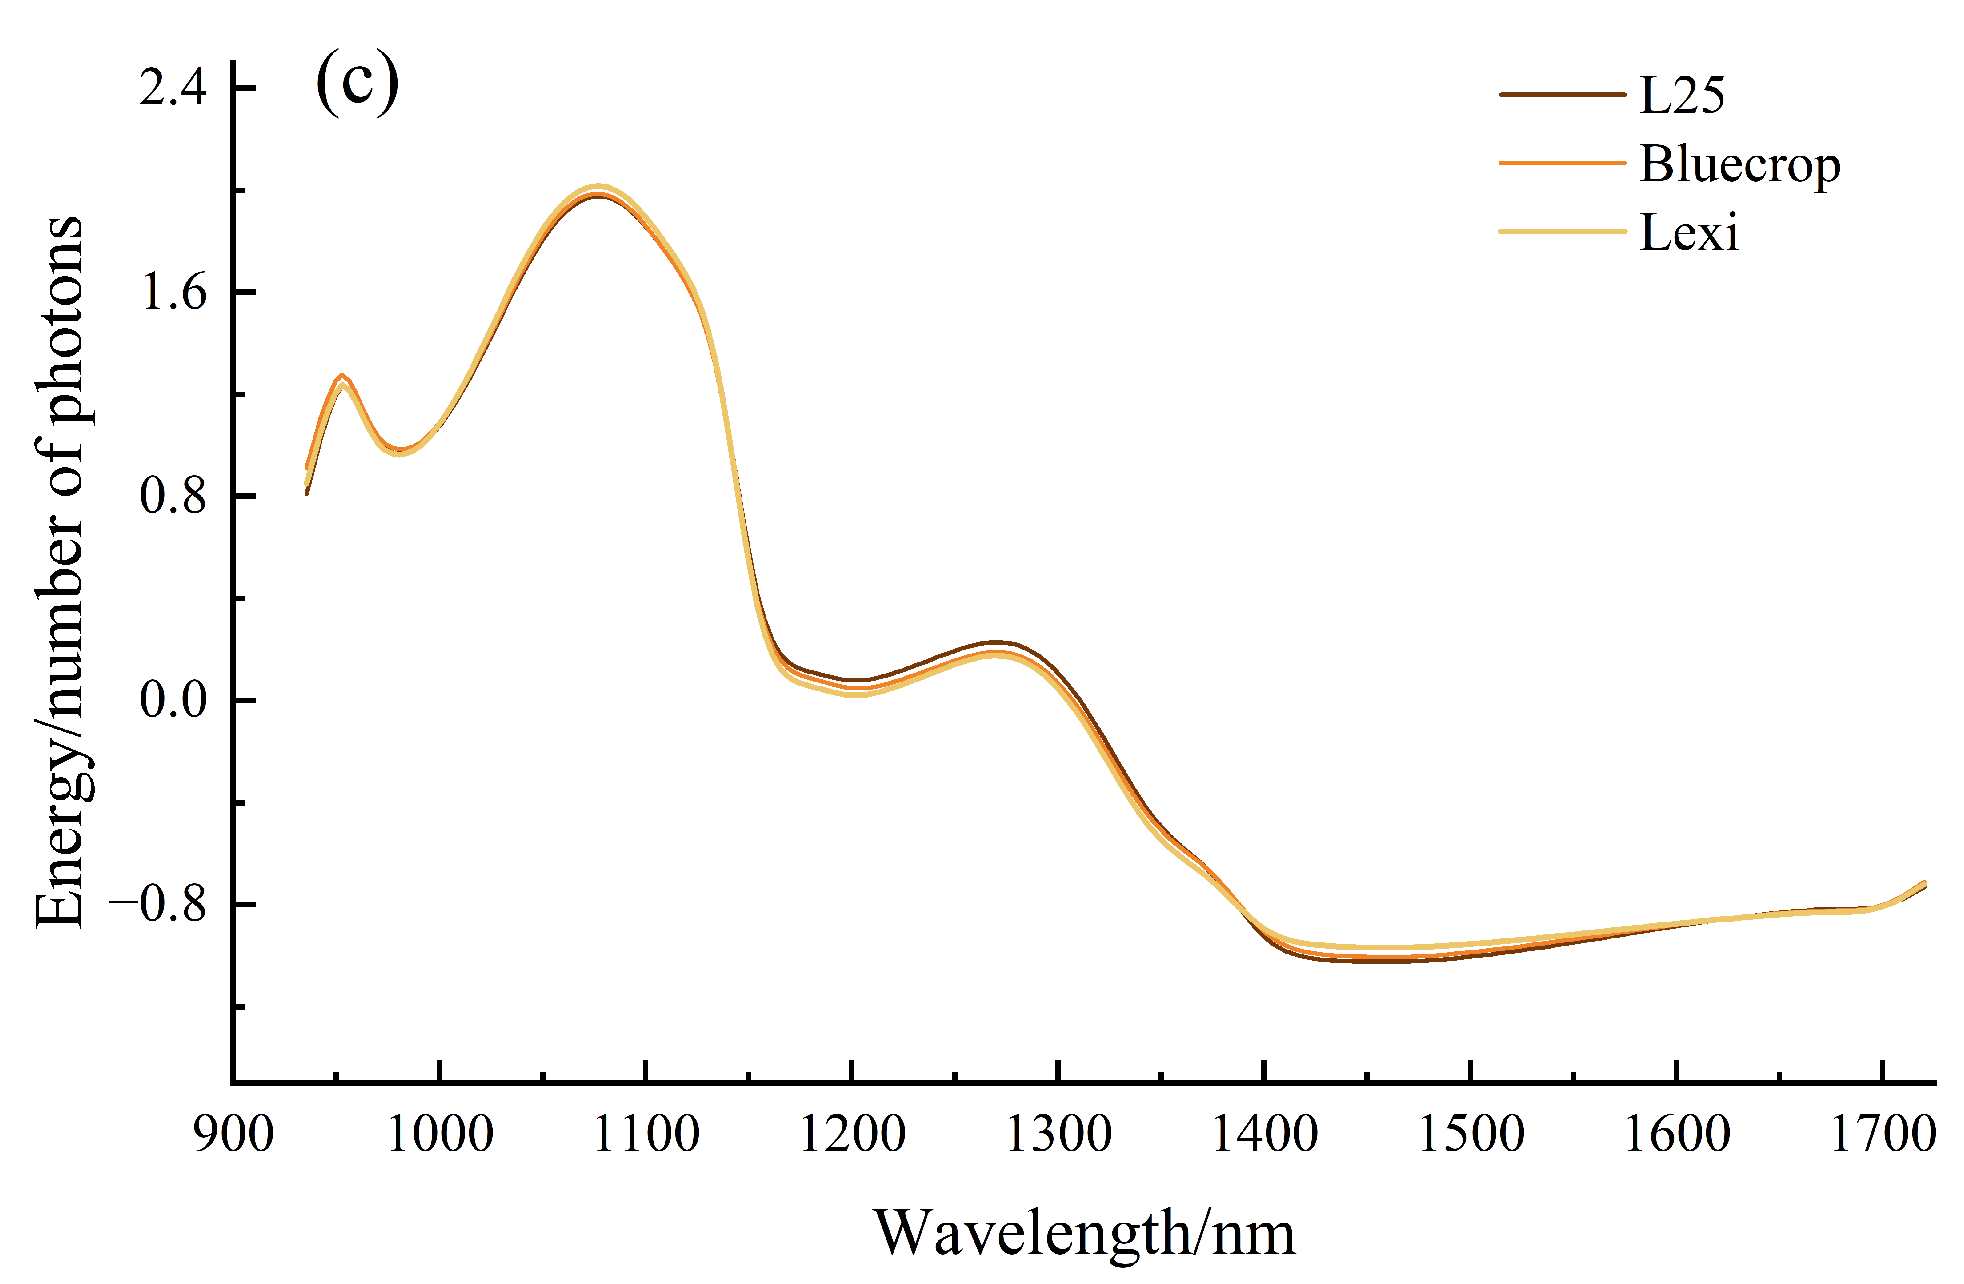
3.1. Spectral Analysis

In view of the obvious noise at both ends of the original spectrum, this study focused on the analysis of spectral data with wavelengths ranging from 935 to 1720 nm. Figure 2a presents the original spectral profiles of 900 blueberry samples, displaying distinct absorption maxima around 960 nm, 1090 nm and 1280 nm, alongside pronounced minima near 1200 nm and 1400 nm. The prominent peaks at 960 nm and 1090 nm are likely attributed to anthocyanin absorption in blueberries [35], while the 1280 nm peak corresponds to chlorophyll characteristics [36,37,38]. Conversely, the absorption troughs at 1200 nm and 1400 nm are likely associated with triple-frequency O-H stretching vibrations and the combined stretching modes of C-H and O-H bonds, respectively [39].
Figure 2b demonstrates the average spectral curves of the three blueberry varieties. Overall, the general trends of the three curves are basically the same, showing a trend of first high and then low, but there are some differences in the absorbance at different wavelengths. Among them, the spectral absorption intensity of ‘Lexi’ is significantly lower than that of ‘L25’ and ‘Bluecrop’, and the spectral absorption intensity of the latter two is basically the same. This difference may be related to the shape and flesh state of different blueberry varieties. In order to reduce the spectral differences between varieties and improve the robustness of the model, the S-G algorithm was firstly adopted in this study to smooth the data and reduce the spectral variability, and at the same time, the MSC and SNV treatments were combined to further minimize the systematic errors due to the scattering of particles and the uneven size of the samples. The average spectral curves after processing are shown in Figure 2c. The results show that the processed spectral data can effectively support the construction of a universal prediction model for multi-variety blueberry SSC.

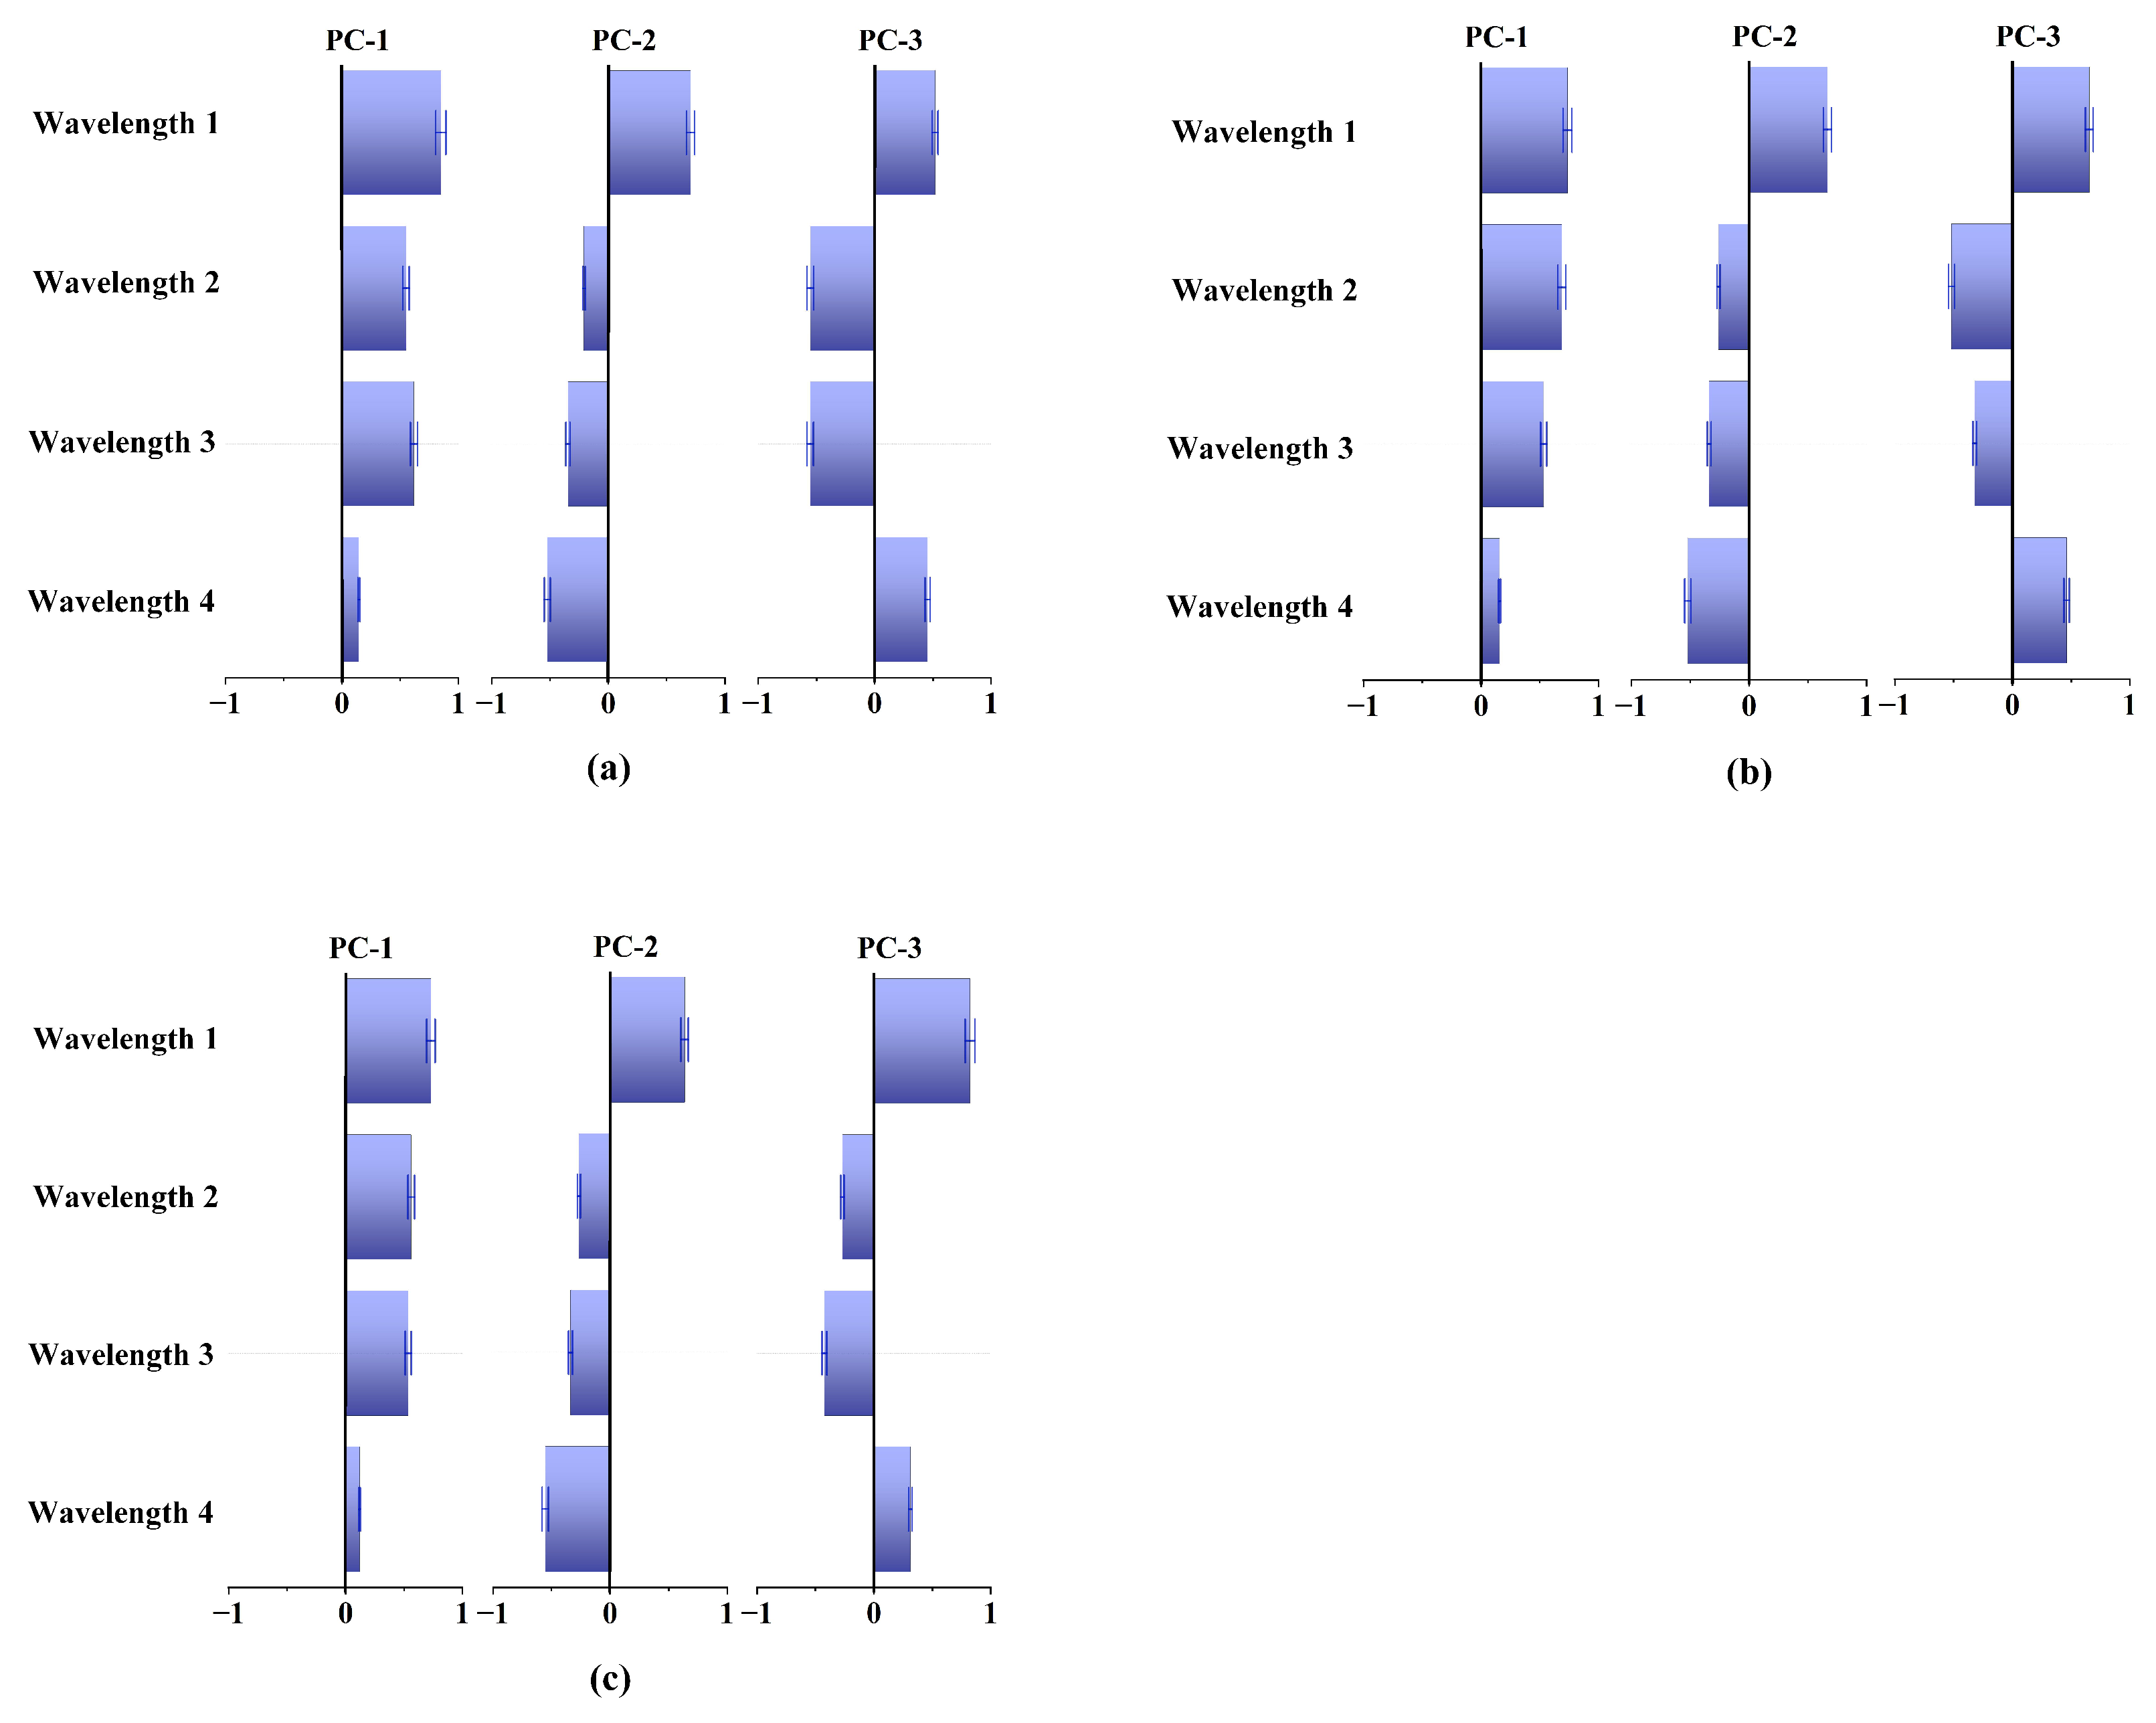
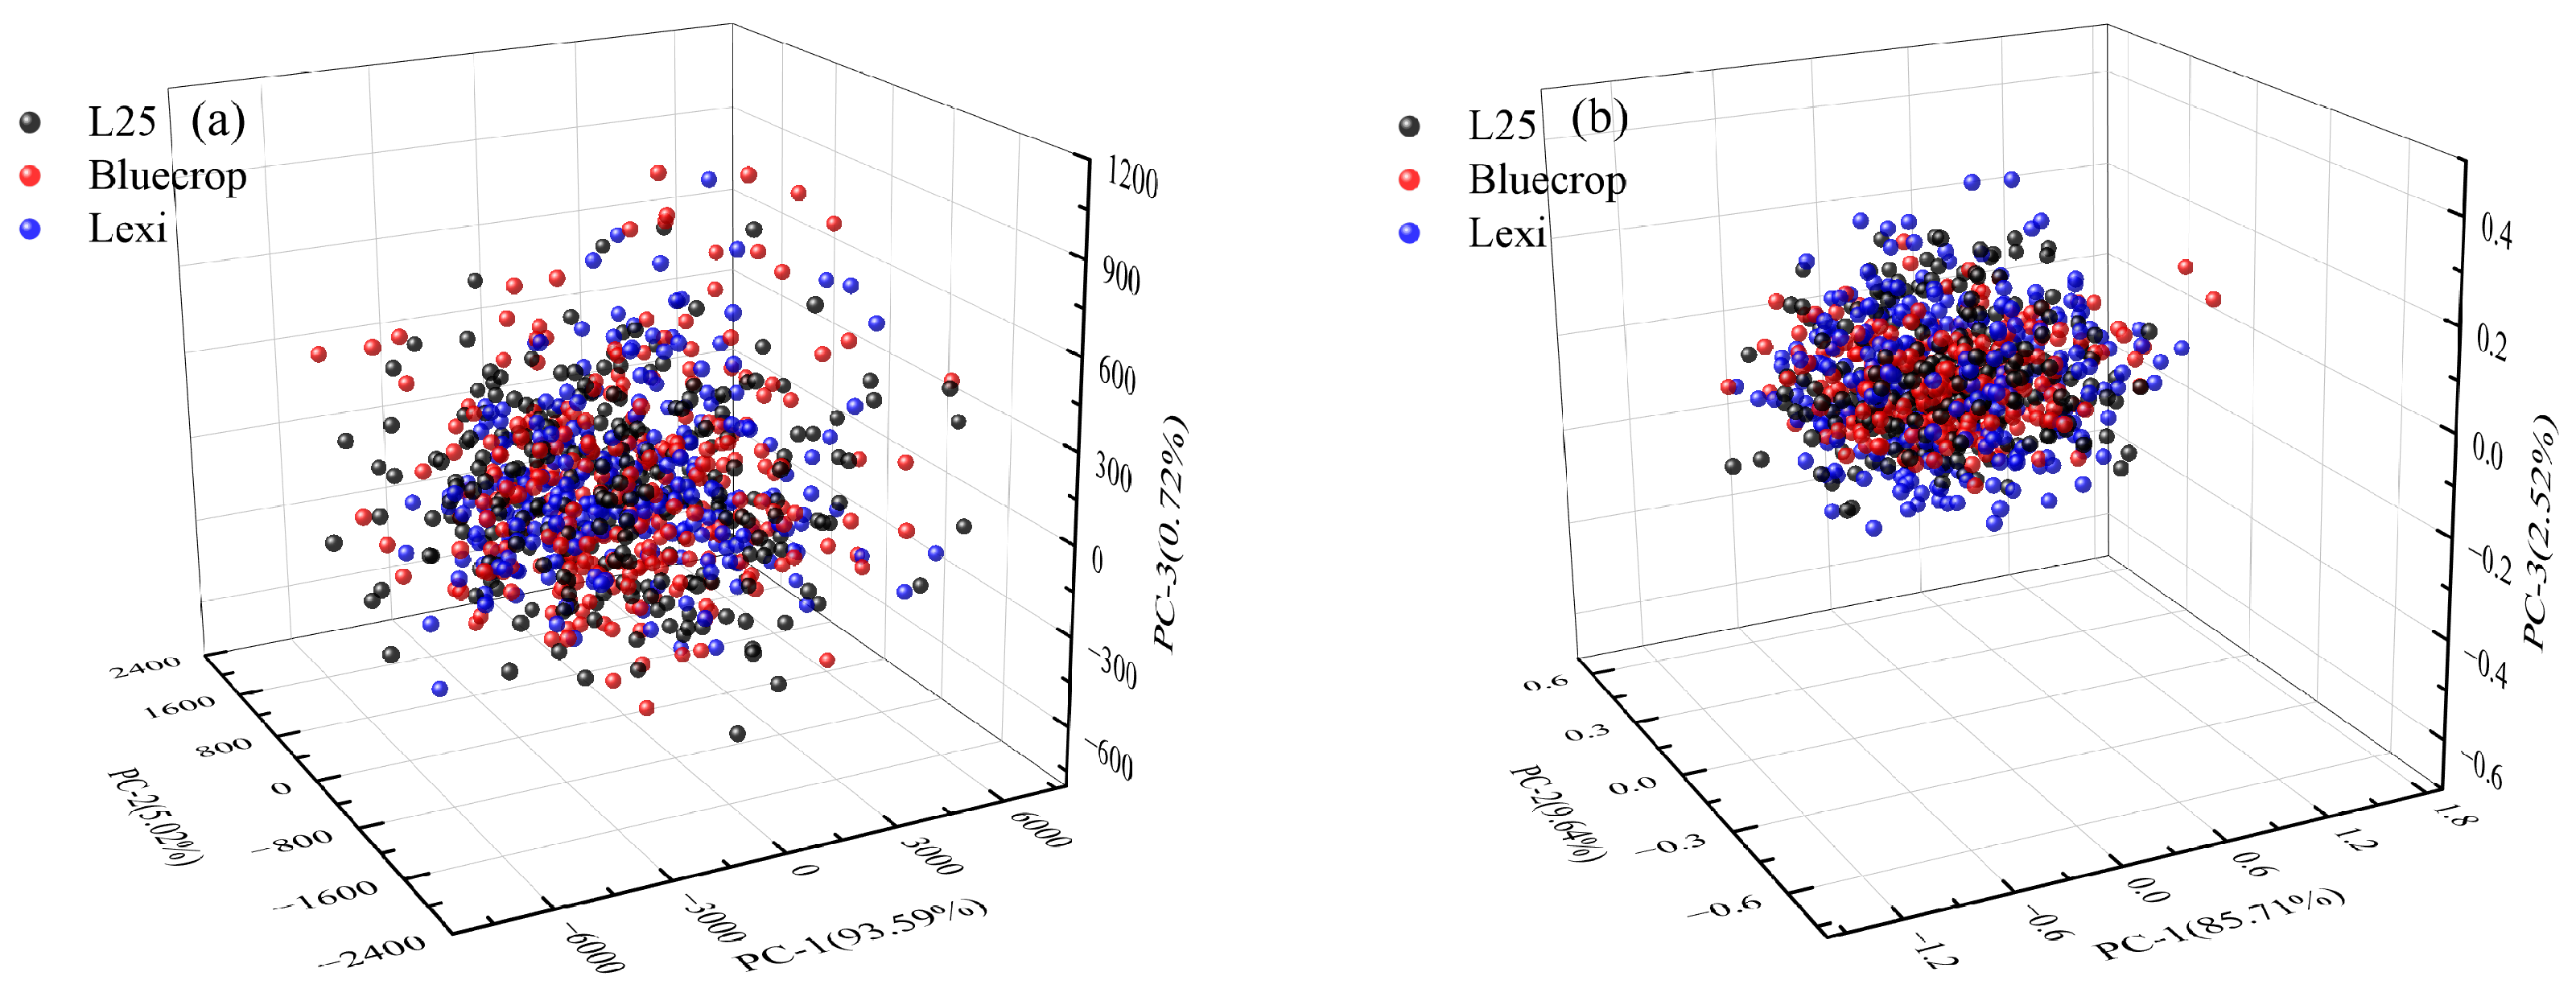
3.2. Principal Component Analysis

In this study, PCA was performed on the hyperspectral data of three blueberry varieties, ‘L25’, ‘Bluecrop’ and ‘Lexi’. The cumulative variance contribution of the first three principal components (PC-1, PC-2 and PC-3) reached 99.33 % , of which PC-1, PC-2 and PC-3 contributed 93.59 % , 5.02 % and 0.72 % , respectively, and were able to effectively characterize the main features of the spectral data.
Figure 3 demonstrates the loading distributions of the three blueberry varieties in the first three principal components, which are plotted based on the loading matrices of the four characteristic wavelengths (1090 nm, 1280 nm, 1200 nm and 1400 nm). Combined with the results of spectral analysis, these four characteristic wavelengths may be closely related to the octave vibrations of O-H and C-H bonds in anthocyanin, chlorophyll and pectin, respectively [35,36,37,38,39]. As can be seen from the figure, the first three characteristic wavelengths have loading values of more than 0.5 in PC-1, while the fourth wavelength has a significantly lower loading value on PC-1, indicating that the C-H bond in pectin is much less influential than the first three chemicals in the principal component score. In terms of the influence of the overall score distribution, the loading value of the first wavelength is the most prominent among the four wavelengths, which laterally shows that anthocyanin is the most critical factor in the contribution of principal components. For individual wavelengths with negative loading values, the content of the corresponding chemical components may be negatively correlated with the score of the principal component. In addition, there are still differences in the load values of different blueberry varieties at specific wavelengths. These differences can reflect the differences in the distribution of principal component scores of different varieties, and further reveal the influence of chemical composition content on principal component scores among varieties.
Therefore, the differences that exist among different blueberry varieties may be closely related to intrinsic factors such as blueberry pericarp pigment composition (e.g., anthocyanin, chlorophyll), pulp texture and pectin content. Figure 4a presents the principal component score plots of the three blueberry varieties. In order to further reduce the spectral differences between varieties, the original data were preprocessed by S-G, MSC and SNV in turn, and the principal component scores after processing were obtained as presented in Figure 4b. Obviously, the S-G and MSC algorithms can effectively eliminate the high-frequency noise in the spectrum and reduce the dispersion of the score distribution. After SNV processing, the degree of data fusion is further enhanced, and the distribution of principal components is more concentrated. This shows that the preprocessing method successfully highlights the common characteristics among varieties, verifies its effectiveness in multi-variety data fusion and lays a data foundation for constructing a universal prediction model.

3.3. Outlier Elimination

In spectral data analysis, the presence of abnormal samples may cause deviations in the model, resulting in reduced reliability of the prediction results. Therefore, before establishing a general model, this study uses the Mahalanobis distance anomaly detection algorithm to identify and eliminate potential abnormal samples in spectral data. For the spectral datasets of ‘L25’, ‘Bluecrop’ and ‘Lexi’, the Mahalanobis distances between each sample and the mean of the corresponding variety dataset were calculated, respectively, so as to realize the identification of outliers. Figure 5 illustrates the abnormal value calculation results of the three varieties. Among them, ‘L25’ removed two abnormal values, ‘Bluecrop’ removed three abnormal values, and ‘Lexi’ removed eight abnormal values.

3.4. Dataset Split

After the outliers were removed, 298, 297 and 292 samples were left in the three blueberry varieties of ‘L25’, ‘Bluecrop’ and ‘Lexi’, respectively. The remaining samples of each variety were divided into correction and prediction sets in a ratio of about 3:1 using the sample set partitioning based on joint X-Y distances (SPXY) [40]. The correction set and prediction set of all remaining samples consisted of correction subsets and prediction subsets of different varieties, respectively. The calibration set data enable training of the model and the prediction set data enable performance testing of the model to evaluate the calibration model. Table 1 gives the number of samples, range, mean and standard deviation of SSC for the correction and prediction sets of the three blueberry varieties, respectively. After combining the sample sets of the three varieties, the correction set covered the maximum and minimum values of SSC, and the range of SSC in the prediction set was completely included in the range of the correction set, which indicated that the samples were well represented and suitable for constructing a universal prediction model for blueberry SSC.

3.5. A Universal Prediction Model for SSC of Multiple Blueberry Varieties

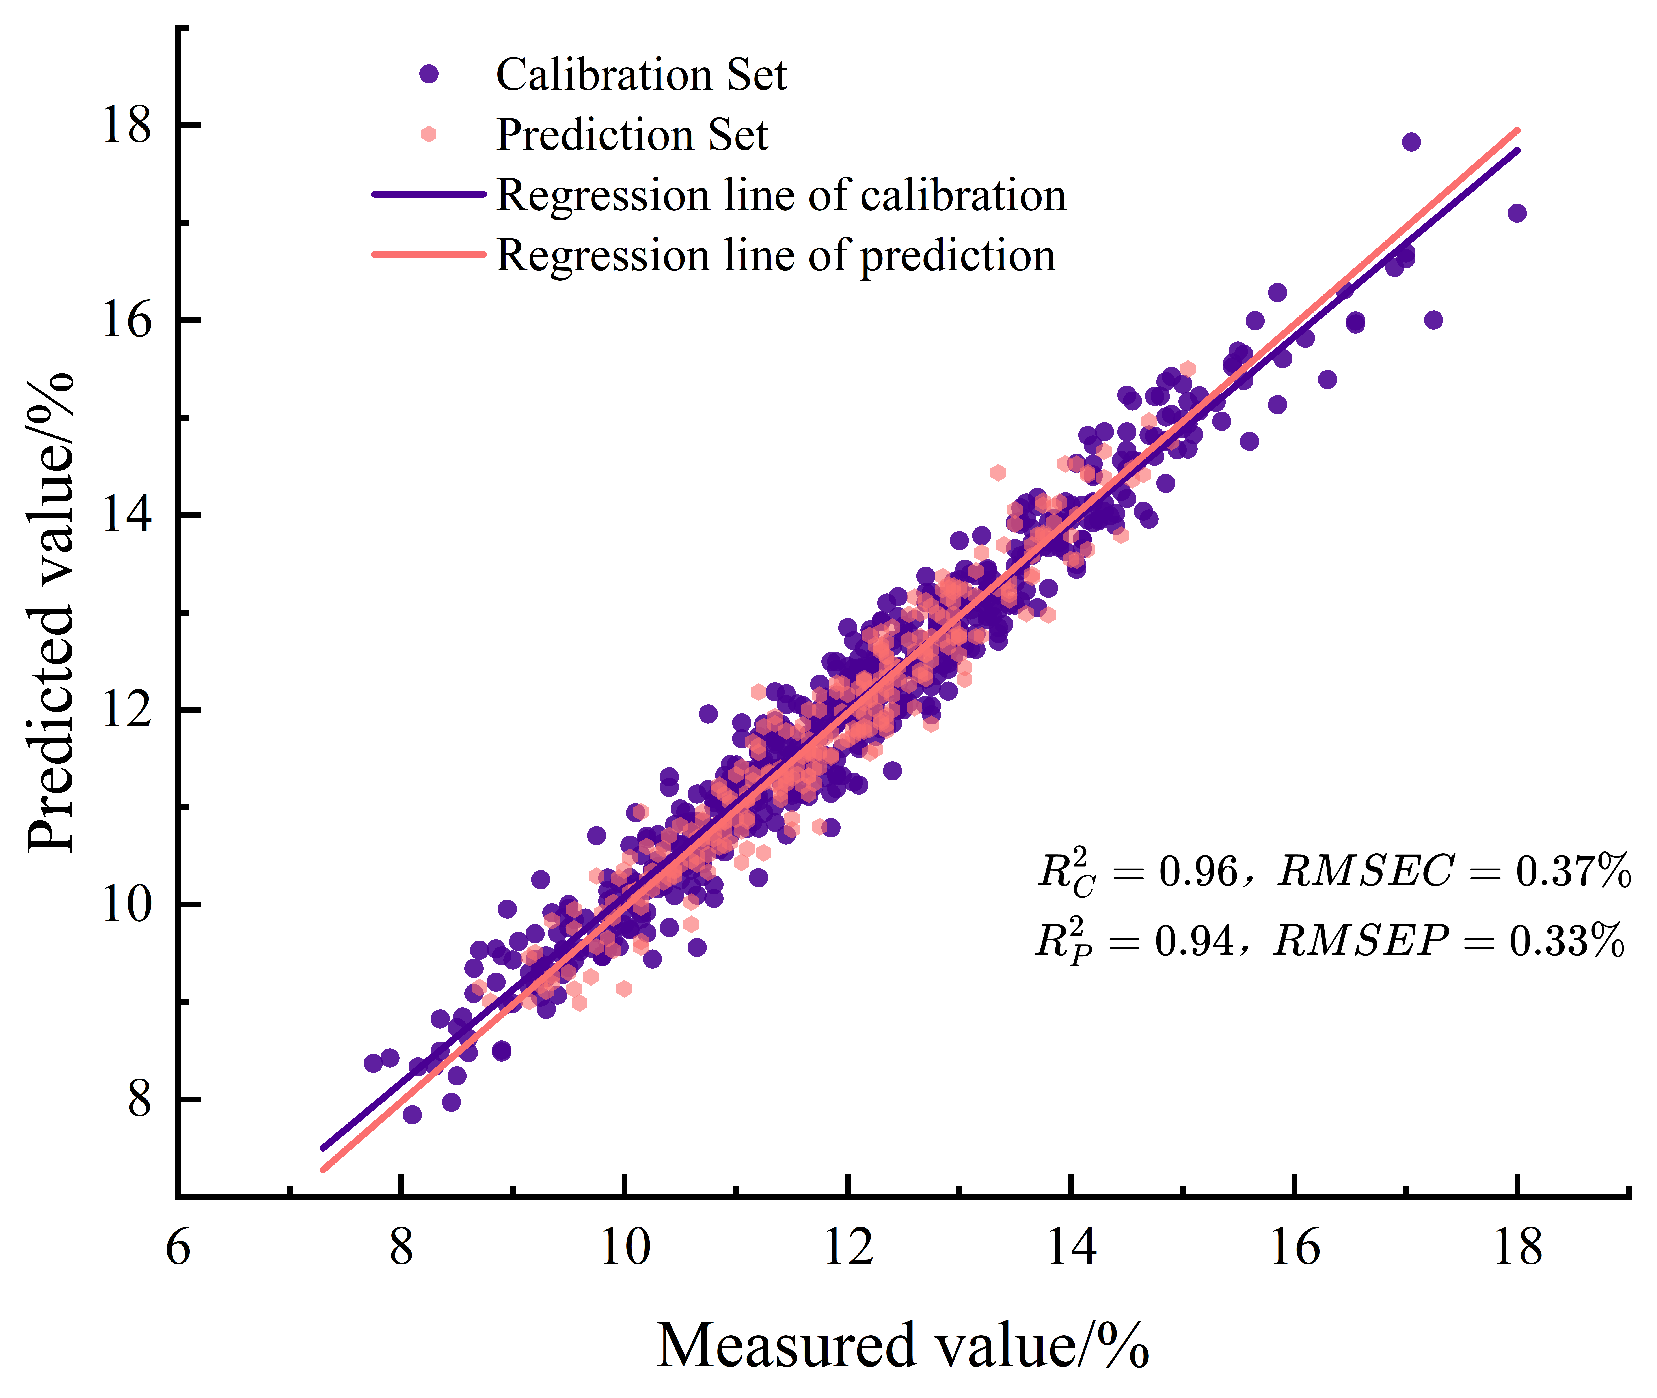
3.5.1. PLSR Model Based on Full-Wavelength Spectra with Different Pretreatments

During the modeling process, the range of LVs was established as 1∼25 to prevent over-fitting or under-fitting. Table 2 shows the prediction results of the full-wavelength PLSR model based on the original spectrum and different pretreatment methods. It can be seen from Table 2 that there are significant differences in the prediction performance of the models with different pretreatment methods. For the raw spectral data, the PLSR model had R P 2 = 0.89 , RMSEP = 0.40%, and RPD = 2.98 on the prediction set. In contrast, after MSC or SNV pretreatment, R P 2 increased to 0.93, RMSEP decreased to 0.34 % , RPD reached 3.90 and 3.89, respectively, and the model performance significantly improved.
In the combined treatment method, the model performance of S-G, MSC and SNV combined pretreatment was the best, and the PLSR model prediction results are plotted in Figure 6. The prediction set R P 2 of the combined preprocessing method reached 0.94, RMSEP decreased to 0.33 % , RPD increased to 3.94 and the number of latent variables remained at 21, indicating that the model achieved the improvement of prediction performance while ensuring low complexity, which further proved the effectiveness and feasibility of the method in the above spectral data processing. For all pretreatment methods, the RPD values exceeded 3.0, and the RPD of the combined method was close to 4.0, indicating that the PLSR model established after treatment had strong robustness for SSC prediction of multi-varieties blueberry, and was suitable for universal detection scenarios of mixed varieties.

3.5.2. PLSR Model Based on UVE Algorithm

In order to screen out the characteristic wavelengths that are highly correlated with blueberry SSC and reduce the influence of irrelevant variables on model stability, the UVE algorithm was used to select the features of the jointly preprocessed spectral data (224 data points). Two hundred random noise variables were introduced into the original spectral matrix, and the C V m a x of the random noise variables was used as the threshold to eliminate the uninformative variables, and finally, 117 variables were screened for modeling, and the processing results are shown in Figure 7.
As can be seen in Figure 7a, the vertical black solid line distinguishes the actual spectral feature wavelengths on the left side from the random noise variables on the right side, and each scatter in the figure represents the CV value of a single variable. The horizontal dashed line delineates the CV threshold range, and variables with CV values below the threshold are all uninformative variables for the blueberry SSC prediction model, while variables with CV values above the threshold are retained as valid characteristic wavelengths. Based on this criterion, 117 highly correlated wavelengths were screened out, and the results of the PLSR prediction model were constructed as illustrated in Figure 7b, whose predicted set dispersion point distributions showed a significant linear trend and a good fitting effect. In order to comprehensively evaluate the optimization effect of the UVE algorithm, Table 3 compares the model performance metrics for the three types of spectral data (original full spectrum, preprocessed full spectrum, and UVE-screened spectrum).
Analysis of the data in the table shows that after wavelength screening by the UVE algorithm, the number of variables in the model was reduced from the original 224 to 117, and at the same time, the number of LVs was also optimized from 21 to 20, which realized the streamlining and optimization of the model structure. Compared with the preprocessed full-spectrum model, the prediction accuracy of the model after UVE screening decreased slightly, with the R P 2 decreasing from 0.94 to 0.93, and the RMSEP increasing from 0.33 % to 0.35 % , with a decrease in accuracy of about 6.1 % . However, compared with the original full-spectrum model, the model after UVE screening still showed excellent prediction performance, and the RPD was kept at a high level of 3.70, indicating that the model still had high quality. Meanwhile, UVE screening also improves the computational efficiency of the model and reduces the development cost of efficient detection instruments.

3.6. Simplified Model

Although the UVE-PLSR model established above has screened 117 effective characteristic wavelengths and achieved ideal prediction performance, there are still many shortcomings for wavelength-limited spectrometers and actual production requirements for fast and real-time detection. Therefore, this study proposes a multi-level wavelength optimization strategy. On the basis of UVE preliminary screening, SPA is further introduced to realize the secondary screening of spectral variables, so as to minimize data redundancy and model complexity. At the same time, a simplified universal model is established by combining a simpler and more efficient version of multiple linear regression (MLR) to enhance the applicability of the model under different production demands.

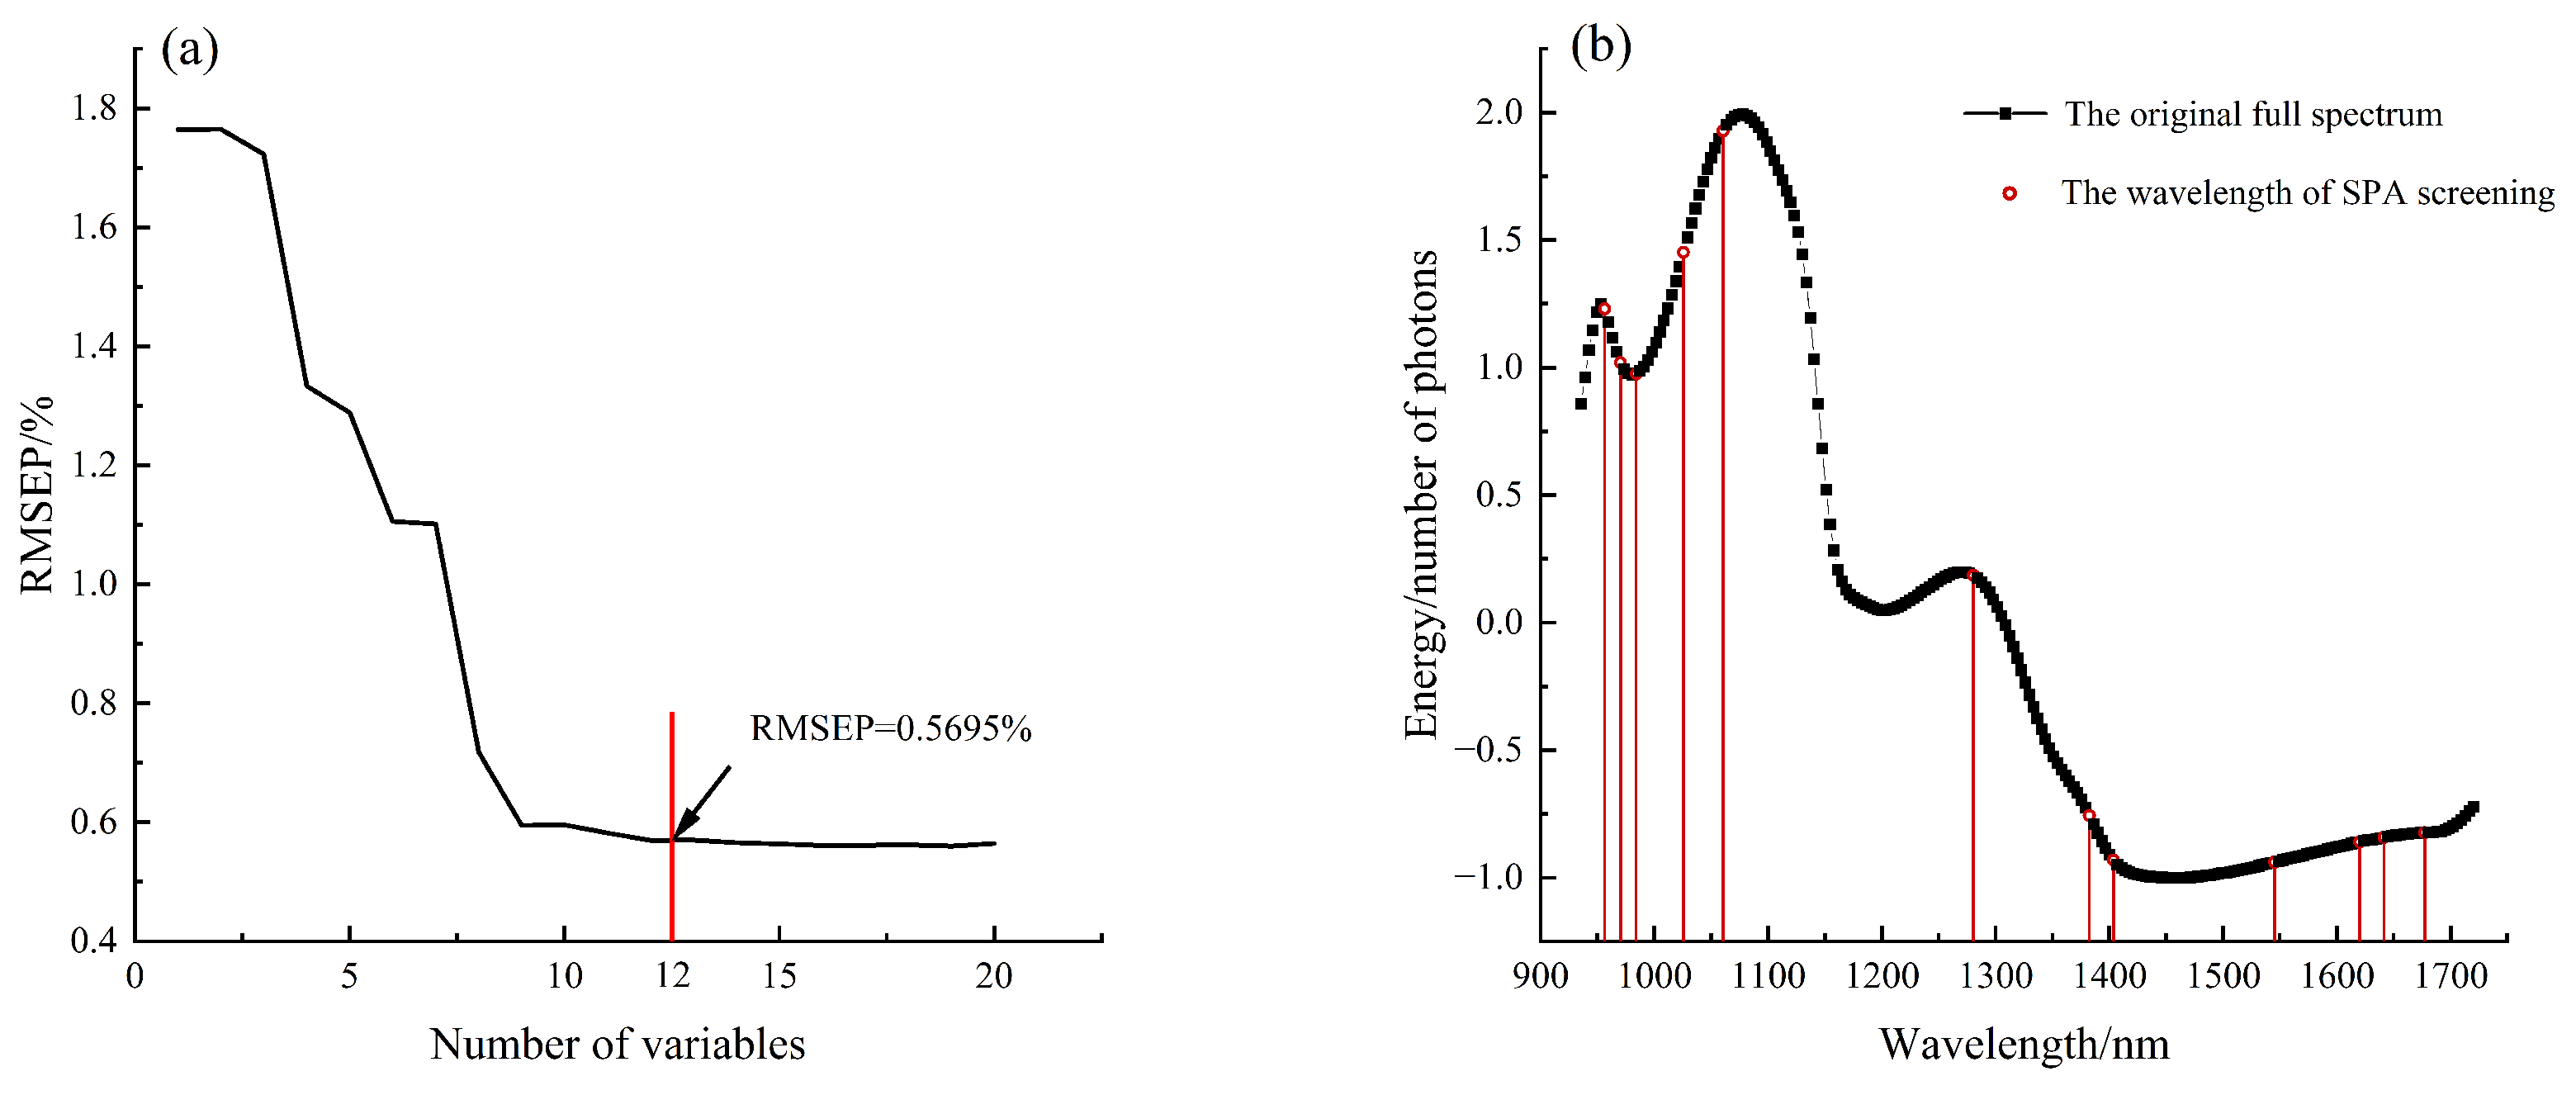
3.6.1. SPA for Further Variable Screening

The optimal number of characteristic wavelengths extracted by SPA is determined by analyzing the trend in RMSEP. Figure 8a is the change curve of RMSEP value when selecting a different number of variables. When the number of variables is 12, RMSEP = 0.5695 % . With the increase in the number of variables, the curve tends to be gentle, and the value of RMSEP is almost unchanged. Therefore, SPA finally selected 12 characteristic wavelengths for modeling. Figure 8b illustrates the distribution of SPA-selected bands in the spectral curve, and the selected bands cover most of the range of bands screened by UVE.

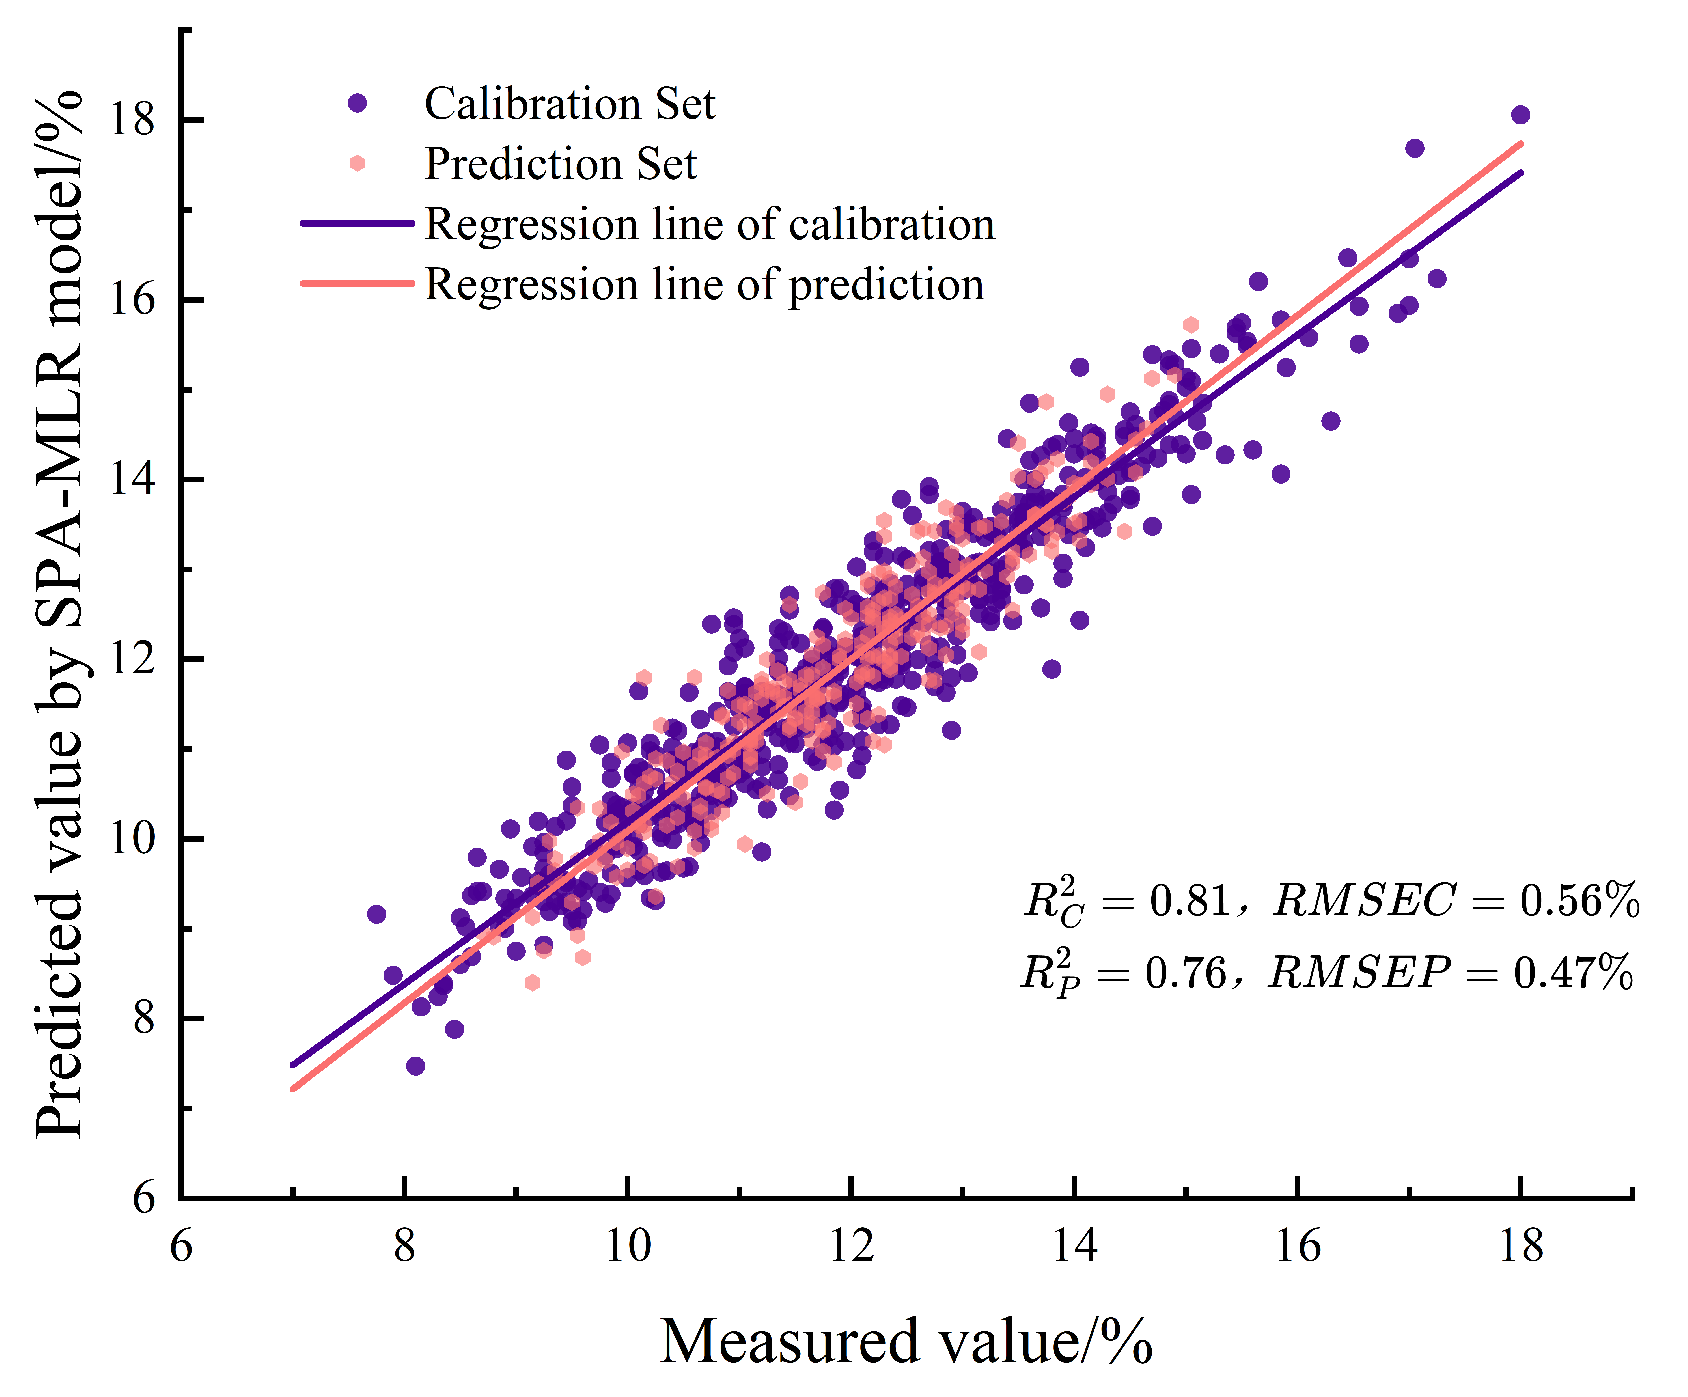
3.6.2. Simplified Prediction Model of UVE-SPA-MLR

After screening variables by SPA, the UVE-SPA-MLR model was established to simplify the prediction. The predicted scatter plot is presented in Figure 9, where R C 2 = 0.81 , R P 2 = 0.76 , RMSEC = 0.56 % and RMSEP = 0.47 % . The results indicate that compared with the UVE-PLSR model, the prediction accuracy of the UVE-SPA-MLR model is slightly reduced, but its computational efficiency is significantly improved, and the model structure is more concise and easy to understand and implement. In actual production, when the model accuracy requirements are relatively loose, the UVE-SPA-MLR model can significantly improve the computational efficiency by greatly reducing the number of variables, and has good potential application value in spectrometers with limited wavelengths.

4. Discussion

Hyperspectral imaging technology has demonstrated significant advantages in the field of non-destructive testing of fruit quality, providing important support for the quality monitoring system of the fruit industry. In this study, the spectral data of three blueberry varieties were collected using this technology, and the exploration of a universal model for cross-variety detection was accomplished by combining the optimized preprocessing scheme, the multilevel screening of variables, and the model simplification strategy, which provides reliable technical support for the quality control of the blueberry industry.
In this study, the combined pretreatment of S-G, MSC and SNV was applied to the fusion of multi-variety blueberry spectral data for the first time, which effectively solved the problem of spectral heterogeneity caused by variety differences (as shown in Figure 2). After PCA of the spectral data, the principal component distribution of different varieties was significantly concentrated after pretreatment (as shown in Figure 4). Xia et al. [41] systematically evaluated the effects of using different preprocessing methods (including normalization, MSC, SNV, S-G, centering and autoscaling) on the kiwifruit SSC prediction model. In their study, a PLSR model was developed by combining diffuse transmission and diffuse reflection spectra, respectively, and the preprocessing methods that could most strongly improve the model fitting and prediction performance were identified through comparative analysis. The results show that the optimal preprocessing method for both spectral modes is a single method rather than a combination of methods. However, the combined preprocessing strategy adopted in this study is designed not only to improve the prediction accuracy of the model, but more importantly, to effectively eliminate the heterogeneity among different varieties through the optimization of spectral features, so as to make up for the shortcomings of the traditional single preprocessing method in cross-species modeling.
In terms of the characteristic wavelength screening method, this study proposes a hierarchical wavelength screening strategy based on UVE-SPA, which makes the model more concise through two-stage optimization. This is very similar to the study by Zhu et al. [42]. In their study, the synergy interval partial least squares (SiPLS) was used to downscale the spectral data and combined with the competitive adaptive reweighted sampling (CARS), UVE and SPA methods for secondary screening of feature wavelengths to establish a deep belief network (DBN) and a PLSR model with optimal feature wavelengths, which realized efficient online detection of blueberry brix. This step-by-step screening of feature variables effectively reduces the interference of irrelevant information variables and significantly improves the effectiveness of the model.
The PLSR model constructed after screening variables by the UVE method showed excellent performance on the prediction set (see Table 3), with its R P 2 value reaching 0.93, RMSEP remaining at a low value of 0.35 % , and RPD exceeding 3.50 reaching 3.70. Wang et al. [43] developed a universal prediction model for detecting the quality of apples from different origins, and its core concept was similar to the universal model for detecting the quality of multi-variety blueberries constructed in this study. Wang et al. [43] used the CARS-PLS method to predict the SSC of apples and obtained good prediction results with R P 2 and RMSEP of 0.94 and 0.54 % , respectively, but the UVE-PLSR model constructed in this study had higher prediction performance. Fan et al. [17] recently proposed a model fusing texture features, which used the stability competitive adaptive reweighted sampling (SCARS) algorithm to optimally screen spectral features and related variables, and finally, extracted 91 key variables. The results show that the model has an R P 2 of 0.86 and RMSEP of 0.67 % , and the CPLS model constructed based on the SCARS algorithm for screening spectral and related variables exhibits superior prediction performance. However, the UVE-SPA-MLR model in this study can achieve higher model prediction accuracy with fewer feature variables, which not only simplifies the model structure, but also provides a more efficient solution for quality detection in resource-constrained scenarios.
The establishment of the universal prediction model realizes the mixed detection of multi-variety blueberries, which effectively solves the drawbacks of the traditional method in which multiple models need to be developed due to variety differences. However, some challenges still need to be overcome in practical application. The data of the current study only came from a single production area in Dandong, Liaoning Province, and the geographic adaptability of the model needs to be verified. In the future, it is necessary to integrate the sample data from different climatic zones and further optimize the model performance through the fusion of data from multiple sources.

5. Conclusions

In order to construct a universal prediction model for SSC of multiple blueberry varieties, this study first applied S-G, MSC and SNV processing methods to spectral data to eliminate noise interference and reduce spectral differences between samples. In the establishment of the PLSR universal prediction model, different preprocessing methods resulted in significant differences in the prediction performance of the model. Through comparative analysis, the PLSR model based on the combined treatment of S-G, MSC and SNV had the best prediction effect, with an R P 2 value of 0.94, RMSEP of 0.33 % and RPD of 3.94. In order to further optimize the performance of the model, the UVE algorithm was used to screen the spectral variables, which effectively reduced the complexity of the model and maintained a high predictive ability. On this basis, SPA was used to further extract 12 characteristic wavelengths significantly related to blueberry SSC, and a simplified model was constructed by integrating the MLR algorithm. The results show that the UVE-SPA-MLR model significantly improves the detection efficiency under the premise of ensuring a certain prediction accuracy, and shows its potential application value in spectrometers with limited wavelengths. In summary, the multi-variety universal model based on hyperspectral imaging technology can effectively overcome the limitations of a single-variety model, and meet the rapid and non-destructive testing requirements in actual production while ensuring detection accuracy.

Author Contributions

Conceptualization, L.M., G.C. and D.L.; methodology, L.M. and G.C.; software, L.M. and N.T.; writing—original draft preparation, L.M.; investigation, G.C.; writing—review and editing, D.L.; visualization, L.M. and N.T. All authors have read and agreed to the published version of the manuscript.

Funding

This work was supported by the National Natural Science Foundation of China (No. 32202147), China Postdoctoral Science Foundation (No. 2021M690573), and Fundamental Research Funds for the Central Universities (No. 2572020BF05).

Institutional Review Board Statement

Not applicable.

Informed Consent Statement

Not applicable.

Data Availability Statement

The raw data supporting the conclusions of this article will be made available by the authors on request.

Acknowledgments

The authors sincerely thank the editor and the anonymous reviewers for their valuable comments and suggestions.

Conflicts of Interest

The authors declare no conflicts of interest.

References

  1. Chen, Y.; Hung, Y.-C.; Chen, M.; Lin, M.; Lin, H. Enhanced storability of blueberries by acidic electrolyzed oxidizing water application may be mediated by regulating ROS metabolism. Food Chem. 2019, 270, 229–235. [Google Scholar] [CrossRef] [PubMed]
  2. Felgus-Lavefve, L.; Howard, L.; Adams, S.H.; Baum, J.I. The effects of blueberry phytochemicals on cell models of inflammation and oxidative stress. Adv. Nutr. 2022, 13, 1279–1309. [Google Scholar] [CrossRef] [PubMed]
  3. Li, D.; Li, B.; Ma, Y.; Sun, X.; Lin, Y.; Meng, X. Polyphenols, anthocyanins, and flavonoids contents and the antioxidant capacity of various cultivars of highbush and half-high blueberries. J. Food Compos. Anal. 2017, 62, 84–93. [Google Scholar] [CrossRef]
  4. Totad, M.G.; Sharma, R.R.; Sethi, S.; Joshi, A.; Verma, M.K.; Sharma, V.K.; Singh, S.; Dhiman, M.R.; Jaiswal, S. Genotypic variability in nutritional and functional attributes of blueberry varieties grown in northern-western Himalayas. J. Food Sci. Technol. 2020, 57, 2251–2258. [Google Scholar] [CrossRef]
  5. Duan, Y.; Tarafdar, A.; Chaurasia, D.; Singh, A.; Bhargava, P.C.; Yang, J.; Li, Z.; Ni, X.; Tian, Y.; Li, H.; et al. Blueberry fruit valorization and valuable constituents: A review. Int. J. Food Microbiol. 2022, 381, 109890. [Google Scholar] [CrossRef]
  6. ElMasry, G.; Wang, N.; ElSayed, A.; Ngadi, M. Hyperspectral imaging for nondestructive determination of some quality attributes for strawberry. J. Food Eng. 2007, 81, 98–107. [Google Scholar] [CrossRef]
  7. Te, M.; Xia, Y.; Inagaki, T.; Tsuchikawa, S. Rapid and nondestructive evaluation of soluble solids content (SSC) and firmness in apple using Vis–NIR spatially resolved spectroscopy. Postharvest Biol. Technol. 2021, 173, 111417. [Google Scholar] [CrossRef]
  8. Zheng, W.; Bai, Y.; Luo, H.; Li, Y.; Yang, X.; Zhang, B. Self-adaptive models for predicting soluble solid content of blueberries with biological variability by using near-infrared spectroscopy and chemometrics. Postharvest Biol. Technol. 2020, 169, 111286. [Google Scholar] [CrossRef]
  9. Lan, W.; Jaillais, B.; Renard, C.M.G.C.; Leca, A.; Chen, S.; Le Bourvellec, C.; Bureau, S. A method using near infrared hyperspectral imaging to highlight the internal quality of apple fruit slices. Postharvest Biol. Technol. 2021, 175, 111497. [Google Scholar] [CrossRef]
  10. Wang, F.; Zhao, C.; Yang, H.; Jiang, H.; Li, L.; Yang, G. Non-destructive and in-site estimation of apple quality and maturity by hyperspectral imaging. Comput. Electron. Agric. 2022, 195, 106843. [Google Scholar] [CrossRef]
  11. Mo, C.; Kim, M.S.; Kim, G.; Lim, J.; Delwiche, S.R.; Chao, K.; Lee, H.; Cho, B.-K. Spatial assessment of soluble solid contents on apple slices using hyperspectral imaging. Biosyst. Eng. 2017, 159, 10–21. [Google Scholar] [CrossRef]
  12. Zhang, B.; Huang, W.; Li, J.; Zhao, C.; Liu, C.; Huang, D.; Gong, L. Detection of slight bruises on apples based on hyperspectral imaging and MNF transform. Spectrosc. Spectr. Anal. 2014, 5, 1367–1372. [Google Scholar]
  13. Qiao, S.; Tian, Y.; Wang, Q.; Song, S.; Song, P. Nondestructive detection of decayed blueberry based on information fusion of hyperspectral imaging (HSI) and low-field nuclear magnetic resonance (LF-NMR). Comput. Electron. Agric. 2021, 184, 106100. [Google Scholar] [CrossRef]
  14. Bu, Y.; Luo, J.; Li, J.; Chi, Q.; Guo, W. Detection of hidden bruises on kiwifruit using hyperspectral imaging combined with deep learning. Int. J. Food Sci. Technol. 2024, 59, 5975–5984. [Google Scholar] [CrossRef]
  15. Weng, S.; Pan, M.; Tan, Y.; Zhang, Q.; Zheng, L. Prediction of soluble solid content in apple using image spectral super-resolution. Spectrosc. Spectr. Anal. 2024, 44, 3095–3100. [Google Scholar]
  16. Leiva-Valenzuela, G.A.; Lu, R.; Aguilera, J.M. Prediction of firmness and soluble solids content of blueberries using hyperspectral reflectance imaging. J. Food Eng. 2013, 115, 91–98. [Google Scholar] [CrossRef]
  17. Fan, S.; Zhang, B.; Li, J.; Liu, C.; Huang, W.; Tian, X. Prediction of soluble solids content of apple using the combination of spectra and textural features of hyperspectral reflectance imaging data. Postharvest Biol. Technol. 2016, 121, 51–61. [Google Scholar] [CrossRef]
  18. Zhang, Z.; Shang, H.; Wang, H.; Zhang, Q.; Yu, S.; Wu, Q.; Tian, J. Hyperspectral imaging for the nondestructive quality assessment of the firmness of Nanguo pears under different freezing/thawing conditions. Sensors 2019, 19, 3124. [Google Scholar] [CrossRef]
  19. Haghbin, N.; Bakhshipour, A.; Zareiforoush, H.; Mousanejad, S. Non-destructive pre-symptomatic detection of gray mold infection in kiwifruit using hyperspectral data and chemometrics. Plant Methods 2023, 19, 53. [Google Scholar] [CrossRef]
  20. Qi, H.; Shen, C.; Chen, G.; Zhang, J.; Chen, F.; Li, H.; Zhang, C. Rapid and non-destructive determination of soluble solid content of crown pear by visible/near-infrared spectroscopy with deep learning regression. J. Food Compos. Anal. 2023, 123, 105585. [Google Scholar] [CrossRef]
  21. Wu, D.; Wan, G.; Jing, Y.; Liu, G.; He, J.; Li, X.; Yang, S.; Ma, P.; Sun, Y. Hyperspectral imaging combined with deep learning for discrimination of Lingwu long jujube in terms of the time after bruising. Microchem. J. 2023, 194, 109238. [Google Scholar] [CrossRef]
  22. Fan, S.; Huang, W.; Guo, Z.; Zhang, B. Prediction of soluble solids content and firmness of pears using hyperspectral reflectance imaging. Food Anal. Methods 2015, 8, 1936–1946. [Google Scholar] [CrossRef]
  23. Qiao, S.; Tian, Y.; Gu, W.; He, K.; Yao, P.; Song, S.; Wang, J.; Wang, H.; Zhang, F. Research on simultaneous detection of SSC and FI of blueberry based on hyperspectral imaging combined MS-SPA. Eng. Agric. Environ. Food 2019, 12, 540–547. [Google Scholar] [CrossRef]
  24. Fan, S.; Zhang, B.; Li, J.; Huang, W.; Wang, C. Effect of spectrum measurement position variation on the robustness of NIR spectroscopy models for soluble solids content of apple. Biosyst. Eng. 2016, 143, 9–19. [Google Scholar] [CrossRef]
  25. Silalahi, D.D.; Midi, H.; Arasan, J.; Mustafa, M.S.; Caliman, J.-P. Robust generalized multiplicative scatter correction algorithm on pretreatment of near infrared spectral data. Vib. Spectrosc. 2018, 97, 55–65. [Google Scholar] [CrossRef]
  26. Syvilay, D.; Detalle, V.; Wilkie-Chancellier, N.; Texier, A.; Martinez, L.; Serfaty, S. Novel approach of signal normalization for depth profile of cultural heritage materials. Spectrochim. Acta Spectrosc. 2017, 127, 28–33. [Google Scholar] [CrossRef]
  27. Mishra, P.; Woltering, E.; Brouwer, B.; Hogeveen-van Echtelt, E. Improving moisture and soluble solids content prediction in pear fruit using near-infrared spectroscopy with variable selection and model updating approach. Postharvest Biol. Technol. 2021, 171, 111348. [Google Scholar] [CrossRef]
  28. Femenias, A.; Gatius, F.; Ramos, A.J.; Sanchis, V.; Marín, S. Standardisation of near infrared hyperspectral imaging for quantification and classification of DON contaminated wheat samples. Food Control 2020, 111, 107074. [Google Scholar] [CrossRef]
  29. Cai, W.; Li, Y.; Shao, X. A variable selection method based on uninformative variable elimination for multivariate calibration of near-infrared spectra. Chemom. Intell. Lab. Syst. 2008, 90, 188–194. [Google Scholar] [CrossRef]
  30. Huang, M.; Tang, J.; Yang, B.; Zhu, Q. Classification of maize seeds of different years based on hyperspectral imaging and model updating. Comput. Electron. Agric. 2016, 122, 139–145. [Google Scholar] [CrossRef]
  31. Fu, P.; Meacham-Hensold, K.; Guan, K.; Wu, J.; Bernacchi, C. Estimating photosynthetic traits from reflectance spectra: A synthesis of spectral indices, numerical inversion, and partial least square regression. Plant Cell Environ. 2020, 43, 1241–1258. [Google Scholar] [CrossRef] [PubMed]
  32. Li, J.; Huang, W.; Zhao, C.; Zhang, B. A comparative study for the quantitative determination of soluble solids content, pH, and firmness of pears by Vis/NIR spectroscopy. J. Food Eng. 2013, 116, 324–332. [Google Scholar] [CrossRef]
  33. Li, J.; Huang, W.; Chen, L.; Zhang, B. Variable selection in visible and near-infrared spectral analysis for noninvasive determination of soluble solids content of ‘Ya’ pear. Food Anal. Methods 2014, 7, 1891–1902. [Google Scholar] [CrossRef]
  34. Wu, D.; Sun, D.-W. Potential of time series-hyperspectral imaging (TS-HSI) for non-invasive determination of microbial spoilage of salmon flesh. Talanta 2013, 111, 39–46. [Google Scholar] [CrossRef]
  35. Lleó, L.; Roger, J.M.; Herrero-Langreo, A.; Diezma-Iglesias, B.; Barreiro, P. Comparison of multispectral indexes extracted from hyperspectral images for the assessment of fruit ripening. J. Food Eng. 2011, 104, 612–620. [Google Scholar] [CrossRef]
  36. Zhang, C.; Guo, C.; Liu, F.; Kong, W.; He, Y.; Lou, B. Hyperspectral imaging analysis for ripeness evaluation of strawberry with support vector machine. J. Food Eng. 2016, 179, 11–18. [Google Scholar] [CrossRef]
  37. Liu, Y.; Xu, H.; Sun, X.; Jiang, X.; Rao, Y.; Zhang, Y. Development of multi-cultivar universal model for soluble solid content of apple online using near infrared spectroscopy. Spectrosc. Spectr. Anal. 2020, 40, 922–928. [Google Scholar]
  38. Pan, T.; Chyngyz, E.; Sun, D.-W.; Paliwal, J.; Pu, H. Pathogenetic process monitoring and early detection of pear black spot disease caused by Alternaria alternata using hyperspectral imaging. Postharvest Biol. Technol. 2019, 154, 96–104. [Google Scholar] [CrossRef]
  39. Liu, Q.; Sun, K.; Zhao, N.; Yang, J.; Zhang, Y.; Ma, C.; Pan, L.; Tu, K. Information fusion of hyperspectral imaging and electronic nose for evaluation of fungal contamination in strawberries during decay. Postharvest Biol. Technol. 2019, 153, 152–160. [Google Scholar] [CrossRef]
  40. Song, A.; Wang, C.; Wen, W.; Zhao, Y.; Guo, X.; Zhao, C. Predicting the oil content of individual corn kernels combining NIR-HSI and multi-stage parameter optimization techniques. Food Chem. 2024, 461, 140932. [Google Scholar] [CrossRef]
  41. Xia, Y.; Zhang, W.; Che, T.; Hu, J.; Cao, S.; Liu, W.; Kang, J.; Tang, W.; Li, H. Comparison of diffuse reflectance and diffuse transmittance Vis/NIR spectroscopy for assessing soluble solids content in kiwifruit coupled with chemometrics. Appl. Sci. 2024, 14, 10001. [Google Scholar] [CrossRef]
  42. Zhu, J.; Zhu, Y.; Feng, G.; Zeng, M.; Liu, S. Optimization of near-infrared detection model of blueberry sugar content based on deep belief network and hybrid wavelength selection method. Spectrosc. Spectr. Anal. 2022, 42, 3775–3782. [Google Scholar] [CrossRef]
  43. Wang, J.; Guo, Z.; Zou, C.; Jiang, S.; El-Seedi, H.R.; Zou, X. General model of multi-quality detection for apple from different origins by Vis/NIR transmittance spectroscopy. Food Biophys. 2022, 16, 2582–2595. [Google Scholar] [CrossRef]
Figure 1. Schematic diagram of hyperspectral imaging system.
Applsci 15 03888 g001
Figure 2. Spectral curves of three varieties of blueberries. (a) Raw spectrum. (b) Average raw spectrum. (c) Average spectrum after treatment.
Applsci 15 03888 g002aApplsci 15 03888 g002b
Figure 3. Loadings distribution of different chemical components in the first three principal components: (a) load value of L25; (b) load value of Bluecrop; (c) load value of Lexi.
Applsci 15 03888 g003
Figure 4. Distribution of the first 3 principal component scores for the three varieties. (a) Principal component scores for raw spectra. (b) Principal component scores of preprocessed spectra.
Applsci 15 03888 g004
Figure 5. Outlier detection results of Mahalanobis distance method. (a) Outlier results of L25. (b) Outlier results of Bluecrop. (c) Outlier results of Lexi.
Applsci 15 03888 g005
Figure 6. PLSR model prediction results based on S-G, MSC and SNV after joint processing.
Applsci 15 03888 g006
Figure 7. UVE processing results. (a) Results of UVE screening variables. (b) PLSR model predictions after wavelength selection by UVE.
Applsci 15 03888 g007
Figure 8. SPA processing results. (a) Number of SPA screening variables. (b) Distribution of the position of the selected variable in the spectrum of SPA.
Applsci 15 03888 g008
Figure 9. MLR model predictions after SPA screening variables.
Applsci 15 03888 g009
Table 1. SSC statistics of three varieties of blueberries.
Sample TypeSample SetQuantitiesRangeMean ValueStandard Deviation
L25Calibration Set2257.90∼ 17.0511.711.87
Prediction Set748.55∼15.6511.621.48
BluecropCalibration Set2258.10∼15.9011.641.56
Prediction Set739.15∼14.3011.621.22
LexiCalibration Set2257.75∼18.0012.541.72
Prediction Set739.30∼15.1012.461.19
TotalCalibration Set6757.75∼18.0011.961.77
Prediction Set2208.55∼15.6511.901.36
Table 2. SSC prediction results from PLSR models based on full-wavelength spectra with different preprocessing.
Sample SetPre-ProcessingThe Number of LVs R C 2 RMSEC/% R P 2 RMSEP/%RPD
Multi-variety blueberry mixed datasetRaw210.950.380.890.402.98
S-G230.950.390.900.393.13
MSC230.950.320.930.343.90
SNV240.960.320.930.343.89
S-G+MSC240.960.360.930.333.89
S-G+SNV210.960.370.930.333.92
S-G+MSC+SNV210.960.370.940.333.94
Table 3. Comparison of PLSR model prediction results of blueberry SSC.
Spectral BandNumber of
Spectral Variables
LVs R C 2 RMSEC/% R P 2 RMSEP/%RPD
The original full
spectrum
224210.950.380.890.402.98
The full spectrum after
pretreatment
224210.960.370.940.333.94
Spectral region after
UVE method
117200.960.380.930.353.70
Disclaimer/Publisher’s Note: The statements, opinions and data contained in all publications are solely those of the individual author(s) and contributor(s) and not of MDPI and/or the editor(s). MDPI and/or the editor(s) disclaim responsibility for any injury to people or property resulting from any ideas, methods, instructions or products referred to in the content.

