Article

The Impact of Total Replacement of Sodium Chloride with Potassium and Magnesium Chloride on Pickling of Granny Smith Apples

by
Daniela Constandache (Lungeanu)
,
Doina-Georgeta Andronoiu
*,
Oana Viorela Nistor
,
Oana Emilia Constantin
,
Dana Iulia Moraru
,
Ira-Adeline Simionov
,
Elisabeta Botez
and
Gabriel-Dănuț Mocanu
Faculty of Food Science and Engineering, Dunărea de Jos University of Galați, 111 Domnească Street, 800201 Galați, Romania
*
Author to whom correspondence should be addressed.
Appl. Sci. 2025, 15(7), 3924; https://doi.org/10.3390/app15073924
Submission received: 3 March 2025 / Revised: 26 March 2025 / Accepted: 31 March 2025 / Published: 3 April 2025
(This article belongs to the Special Issue New Trends and Advances in the Production of Functional Foods)

Abstract

:
This study investigated the effect of total substitution of NaCl with KCl and MgCl2 on the physicochemical, microbiological, and textural characteristics of pickled apples during 35 days of fermentation. The results showed that the pH for all brine-pickled apples decreased significantly (p < 0.05) during the fermentation process. The highest quantity (1077.59 ± 17.56 mg lactic acid/100 g product) of lactic acid was detected on the 28th day for the samples fermented with NaCl. The concentration of metallic ions (Na+, K+, Mg2+) in the brine-pickled apple samples showed a peak on the 14th day of fermentation, followed by a decrease on the 21st day. The antioxidant activity for all types of saline solutions increased as fermentation progressed. The total LAB count increased rapidly until the seventh day for all the samples. At the end of the storage period, a decrease in LAB count was observed for all tested samples. The obtained results revealed that replacing NaCl with KCl or MgCl2 led to small changes in the characteristics of the pickled apples, and is thus a promising option for dietary sodium reduction.

1. Introduction

Fruit, consumed fresh as well as in processed forms, is the main dietary source of vitamins, minerals, especially electrolytes, phytosterols, and healthy fibers. Evidence suggests that proper intake of fruit could be associated with body weight management, a reduced risk of chronic diseases, keeping blood pressure under control, and reducing the risk of hypercholesterolemia, osteoporosis, many cancers, chronic obstructive pulmonary diseases, liver dysfunction, diabetes, metabolic syndrome, and respiratory problems, as well as mental health problems [1].
Sodium chloride (NaCl) is an indispensable substance for human health that is used in regular diets and in food manufacturing to furnish saltiness, improve flavor, and act as a preservative [2,3]. Sodium chloride is the most important source of sodium for the human body. Most people consume 2.3–4.6 g/day of sodium [3], significantly exceeding the limit recommended by the World Health Organization (WHO) (approximately 2 g/day) [4]. High sodium intake from the daily diet can induce hypertension, and high blood pressure (BP) may further provoke cardiovascular disease (CVD) [2]. A strategy for reducing sodium consumption is to replace it in processed foods, considering that they are the source of about 75% of daily intake [5]. As a popular food product in Romanian cuisine [6], fermented fruits or vegetables, which are prepared with highly concentrated NaCl solutions, could be of interest with regards to this approach. Reducing the NaCl content in pickles without significantly compromising product quality involves the incorporation of other chloride salts such as KCl (E 508) and MgCl2 (E 511), which are frequently utilized as alternatives [7,8]. The literature presents few data regarding replacing NaCl with KCl or MgCl2 in the fermentation of raw vegetable materials like cucumbers [7,9] or table olives [10,11]. These studies took different approaches but concluded that, despite the need for further studies to clarify all the issues, NaCl replacement was successful. Reduction in cardiovascular risk and reduction in kidney stone development risk are among the benefits of potassium intake [12]. Several benefits have been also reported for magnesium intake, including maintaining normal cellular functions, reducing cardiac attacks and cerebrovascular strokes, and supporting bone health [13].
Of all the fruits, apples (Malus domestica) are enjoyed by many cultures and, beyond being appetizing, are an important source of antioxidants. Apples are among common fruits with the highest phenolic content [14]. Climate, harvest maturity, storage conditions, postharvest treatments, and processing methods highly influence the general phytochemical profile of the apples [15].
According to Lorn et al., pickling is one of the oldest preservation methods and can improve the sensorial, nutritional, and microbial profile of fruit, transforming the healthy biological compounds of apples into probiotics [16]. Moreover, the shelf life of pickled apples is improved by the transformation of carbohydrates, especially glucose, into lactic acid, which establishes a pH around 4–4.6 that is responsible for preventing the growth microorganisms during storage [17].
Lactic acid bacteria, which are defined as probiotic strains, stimulate autoimmune responses and prevent gastro–intestinal tumors by inhibiting the development of carcinogenic compounds through a decrease in fecal bacteria enzymatic activity and also by inhibiting the production of some enterotoxins [18]. A study by Alan et al. [19] on various strains of Leuconostoc pseudomesenteroides identified probiotic properties and anticancer activity resulting from natural pickles and their postbiotic effects.
Recent decades have seen an increased awareness of consumers regarding the health benefits of different types of food intake. Therefore, the aim of this study was to obtain a food product that combines the advantages of apple nutrients and the preventive and curative advantages of probiotics, with a reduction in sodium content. From a technological point of view this is a provocative approach, due to the major influence of sodium chloride on the qualities of the final product, including color and texture. The objective of the present study was to investigate the effect of total replacement of NaCl with KCl and MgCl2 during the traditional fermentation process on the physicochemical, microbiological, and textural properties of pickled Granny Smith apples.

2. Materials and Methods

2.1. Reagents and Chemicals

Sodium chloride-minimum 97% purity (Salrom, Târgu Ocna, Romania), potassium chloride minimum 99% purity (S.C. Remed Prodimpex S.R.L., București, Romania), and magnesium chloride 100% purity (Natur all Home, Bihor, Romania) were acquired from a local market in Galați, Romania.
The reagents and chemicals used for chemical analyses, namely lactic acid, iron (III) chloride, 3,5-dinitrosalicylic acid (DNSA), sodium-potassium tartaric acid, sodium hydroxide solution (0.5 N), D-(+)-glucose standard, carbazole, D-galacturonic acid, concentrated sulfuric acid, trisodium borate decahydrate (Borax), multi-element standard solution IV 23 elements, nitric acid (65% Suprapur), hydrogen peroxide (30% Emsure), DPPH (2,2-diphenyl-1-picryl-hydrazyl-hydrate), 6-hydroxy-2,5,7,8-tetramethylchromane-2-carboxylic acid (Trolox), methanol, plate count agar, Rose Bengal chloramphenicol agar, MRS agar, and MRS broth were obtained from Sigma-Aldrich (Merck KGaA, Darmstadt, Germany).

2.2. Preparation of Pickled Apples and Sampling

The preparation process of brine-pickled apples is summarized in Figure 1. Fresh, ripe Granny Smith apples were purchased from a local supermarket in Galați, Romania. Five to six small apples were washed with tap water, placed into 1600 mL sterilized jars, and prepared by brine-pickling. The brine was obtained by boiling about 3 L of tap water with 100 g of salt (sodium, potassium, and magnesium chloride), 2 g whole black peppercorns, 0.7 g bay leaves, 2 g mustard seeds, 8 g garlic, 3 g horseradish, and 0.5 g dill inflorescences. The fermentation process was started after the brine solution was poured over the apples. For each type of brine, five jars of brine-pickled apples were simultaneously prepared and stored at room temperature (20 ± 2 °C) in the dark for 35 days. Analyses were carried out on the 7th, 14th, 21st, 28th, and 35th day.

2.3. Physicochemical Analysis

2.3.1. Determination of pH and Lactic Acid, Reducing Sugar, and Uronic Acid Contents in Pickled Apples

Determination of pH. The pH was determined by direct measurement at 0, 7, 14, 21, 28 and 35 days of fermentation, using a benchtop pH meter InoLab 7310 (Xylem Analytics Germany Sales GmbH & Co, Weilheim, Germany). The measurements were performed in triplicate.
Determination of lactic acid content. An efficient method to determine lactic acid in biological matrices and cultural liquids is spectrophotometric analysis of the colored product of the reaction of lactate ions with iron (III) chloride at 390 nm, as described by [20].
Briefly, a lactic acid solution with a concentration of 10 g/L was added to iron (III) chloride solutions with concentrations in the range of 0.05% to 0.3%. Spectrophotometric measurements were performed of iron (III) chloride solutions; the absorbance of the solution increased with an increase in the concentration of iron (III) chloride, reaching an optimum value at a concentration 0.2%.
The method did not require complex sample preparation. The measurements were performed in triplicate.
Determination of reducing sugar content. The reducing sugar content was determined using the 3,5-dinitrosalicylic acid (DNSA) method. The measurement was performed according to [21], with a small change. At 540 nm, the absorbance of the sample extract was measured using a UV-VIS spectrophotometer (Biochrom Ltd., Cambridge, UK). The measurements were performed in triplicate.
Determination of uronic acid content. The quantity of uronic acid was measured using the colorimetric method described by Yu et al. [22], with small modifications. Uronic acid content was established after acid hydrolysis of the sample and reaction with carbazole. Briefly, 15 g of finely ground and well-homogenized apple samples were added to 100 mL using distilled water and allowed to stand for 30 min at room temperature, then centrifuged. Next, 1 mL of the clear supernatant was homogenized in a test tube with 3 mL Borax reagent (0.025 M in concentrated sulfuric acid) and 0.2 mL carbazole reagent (0.125% in absolute ethanol). The tubes were closed with Teflon stoppers and heated for 15 min in a boiling water bath, then cooled in an ice bath. The intensity of the purple-brownish color of the samples was measured on a UV-VIS spectrophotometer (Biochrom Ltd., Cambridge, UK) at 530 nm, in a 1 cm cuvette. A solution of D-galacturonic acid (100 μg/mL in distilled water) was used as a calibration standard.

2.3.2. Determination of Sodium, Potassium, and Magnesium Contents

Quantification of the metallic ions potassium (K), sodium (Na), and magnesium (Mg) was performed using the analytical method of high-resolution continuous source flame atomic absorption spectrometry (HR-CS-FAAS) on a ContrAAA 700 instrument (Analytik Jena, Germany). The xenon short-arc lamp (continuum source) and the high-resolution monochromator select the exact wavelength needed to measure the absorbance of each element. Before each working session, the instrument was calibrated using the ICP-MS multi-element standard solution IV 23 elements in diluted nitric acid.
Before performing the final analysis, the ions were extracted in an acidic aqueous solution from calcined apples samples. In brief, approximately 1 g of the sample was weighed and introduced into Teflon vessels to extract the targeted ions in an acidic aqueous solution by digestion. Digestion was achieved using an extraction matrix of nitric acid (HNO3 65% Suprapur) and hydrogen peroxide (H2O2 30% Emsure). The acidified samples were placed in a TopWave microwave digestion system produced by Analytik Jena Germany, and a program of 200 °C temperature for 45 min was applied. After sample disaggregation, dilution with ultrapure water (volume = 50 mL) was carried out in previously rinsed Falcon tubes. The liquid samples were introduced into the instrument in the form of aerosols via the nebulizer. The aerosols were then transported by the carrier gas (air-acetylene) with a flow of 80 L/h. Metal ions were reduced to free atoms to absorb light, and then the absorbance of each element was determined. The wavelengths specific to the analyzed elements were as follows: Mg—202.5 nm, Na—588.9, and K—769.8. Results are expressed as mg/g dry weight.

2.3.3. Antioxidant Activity Detection by DPPH Assay

A 70% methanol extraction in an ultrasonication water bath [23] was performed as follows: 1 g of a very smooth minced pickled apple solution was mixed with 10 mL of an alcoholic mixture (methanol and distilled water) in a 50 mL Falcon tube. The mixtures were homogenized and put into the ultrasonication water bath (ARGO LAB Digital Ultrasonic Cleaner, Carpi, Italy) for 30 min at 30–40 °C. After this, the Falcon tubes were centrifuged at 9000 rpm at 4 °C for 5–10 min using a Hettich 320 R centrifuge (Andreas Hettich GmbH, Tuttlingen, Germany). The extract was used for the antioxidant activity assay.
For the DPPH (2,2-diphenyl-1-picryl-hydrazyl-hydrate) assay, an aliquot of 0.50 µL of extract was mixed with 1950 µL DPPH stock and stored in darkness for 1.5 h at room temperature. The absorbance of the mixture was measured at 515 nm using a Biochrom Libra S22 UV/Vis spectrophotometer (Biochrom Ltd., Cambridge, UK). The values are expressed in mg Trolox/g and are the average of three determinations.

2.3.4. Texture Profile Analysis

Texture analysis was achieved using a Brookfield CT-3 texture analyzer (Brookfield Ametek, Middleborough, MA, USA) and the Texture Profile Analysis method. The apples were subjected to double indentation with a metallic cylinder (2 mm diameter, 20 mm length). The indentation speed was 0.5 mm/s, the indentation depth was 10 mm, and the load cell was 0.067 N. The textural parameters (firmness, cohesiveness, springiness, and chewiness) were determined from the deformation-resistance curves with TexturePro CT V1.5 software. The samples were analyzed in a fresh state (before introducing them into jars for fermentation) and during the 35 day fermentation process, with a 7-day frequency. Three samples from each batch were tested, and the results are presented as the mean ± standard deviation.

2.3.5. Color Assessment

The color of fresh apples and pickled apples was measured using a digital colorimeter (NR110 Shenzhen 3nh Technology Co., Shenzhen, China). Color parameters (L*, a*, b*, C*, h*) of the peels of the pickled samples were measured. The total color change (ΔE) of the fresh and pickled apples was calculated using Equation (1) [24],
E = L 0 * L * 2 + a 0 * a * 2 + b 0 * b * 2
where L0*, a0*, and b0* represent the fresh samples and L*, a*, and b* represent the pickled samples. L* indicates lightness/darkness, a* indicates redness (green to red), and b* indicates yellowness (blue to yellow). All experiments were performed in triplicate.

2.4. Microbiological Analysis

Enumeration of Lactic Acid Bacteria (LAB), Mesophilic Aerobic Bacteria (MAB), and Yeast and Mold (YM) Values

Lactic acid bacteria (LAB) count. The LAB were quantified by culturing on double-layer MRS agar [25] in duplicate, using appropriate dilutions, over 35 days. Briefly, different dilutions were made, and from each 100 μL was spread on MRS supplemented with 1.5% agar and 1% CaCO3. A second layer of medium was added (5 mL MRS with 0.75% agar and 1% CaCO3), and the plates were incubated at 43 °C for 72 h. The results are expressed as log CFU/g.
Mesophilic aerobic bacteria (MAB) count. The method involved inoculating corresponding dilutions onto plate count agar (PCA) medium, after which the plates were incubated at 37 °C for 48 h [26]. After incubation, the colonies were counted, and the colony-forming units were determined per gram product and expressed as log CFU/g.
Yeasts and mold (YM) count. The determination was performed by cultivation on Rose Bengal chloramphenicol agar medium, incubated at 25 °C, for 3–5 days [27]. The results are expressed as log CFU/g.

2.5. Statistical Analysis

Values are presented as means ± standard deviation. Statistically significant differences among the results were analyzed by one-way analysis of variance (ANOVA), followed by the Tukey test at a significance level of 5% (p < 0.05). All results were analyzed using Minitab statistical software (version 20, Romsym Data, Bucharest, Romania).
Pearson correlation analysis was also used to assess the strength and direction of relationships between the physicochemical parameters monitored.

3. Results and Discussion

3.1. Changes in pH, as Well as Lactic Acid, Reducing Sugar, and Uronic Acid Contents, During Pickling

3.1.1. Changes in pH Values During Pickling

When talking about pH values changes during fermentation, it is compulsory to relate them to the interdependence between several factors, such as reducing sugar content, lactic bacteria count, and lactic acid production.
As can be remarked in Figure 2, the pH of raw apples, with an average of 7.95 ± 0.005, was significantly (p < 0.05) decreased by the fermentation process, independent of the type of brine. Thus, similar changes in pH values occurred with NaCl (from 8.053 ± 0.003 for the raw sample to 4.036 ± 0.003 on the 35th day of fermentation), KCl (from 8.166 ± 0.005 for the raw sample to 4.209 ± 0.003 on the 35th day of fermentation), and MgCl2 (from 7.658 ± 0.02 for the raw sample to 3.381 ± 0.003 on the 35th day of fermentation). The greatest decrease was registered on the 7th day of fermentation, of almost 31–37%, which is expected due to the intensity of the first stage of the fermentation process, when lactic acid bacteria are producing lactic acid at a rate of 10% of their weight per minute, according to [28]. Thus, a pH value between 5.5 and 6.5 for the first stage of fermentation could prevent both metabolic repression and the loss of bacterial viability as a result of the extremely acidic pH [29].
From the 14th day of fermentation to the 35th day, only a similar slight decrease was observed for all the tested samples, except the samples fermented in MgCl2 brine, which registered an almost 25% decrease in pH value from the 14th to the 21st day of fermentation, which could be associated with the type of salt used.
From the first stage until the middle stage of fermentation, lactic acid bacteria, by using the fruit’s native fructose and glucose, produce lactate, acetate, and a small amount carbon dioxide, which could be related to the decrease that occurred in pH values, as Moore et al. reported as well [30].
Moreover, the changes in fermented apples pH values could be attributed to modification of the ratios between populations belonging to different categories of microorganisms present during the spontaneous fermentation process [31].

3.1.2. The Results of Lactic Acid Changes

The production of lactic acid in fermented foods has positive health benefits, especially for consumers with food allergies, due to the fact that lactic acid bacteria are producing a wide range of compounds such as vitamins, organic acids, polysaccharides, and antimicrobial compounds [32]. The lactic acid production curves (Figure 3) indicated a proper dynamic of lactic fermentation, which increased until the 28th day and then decreased to a maximum 50.15% for the fermented apples in KCl brine on the 35th day of fermentation.
As expected, the highest quantity (1077.59 ± 17.56 mg lactic acid/100 g product) of lactic acid was detected on the 28th day for the samples fermented with NaCl. The smallest quantity of lactic acid (967.64 ± 17.46 mg lactic acid/100 g product) was registered for the MgCl2 solution on the 28th day of fermentation. Similar results were reported for fermented cabbage [33], Sichuan pickles [34], and Kimchi [35]. Even after 28 days of fermentation, the pickles’ lactic acid content is considerably decreased, and other important metabolites could be developed; this is validated by the antioxidant activity results. The quantity of lactic acid produced depends on the type of salt used and the composition of the fermentation substrate [36]. The results for the production of lactic acid are directly correlated with lactic bacteria viability.
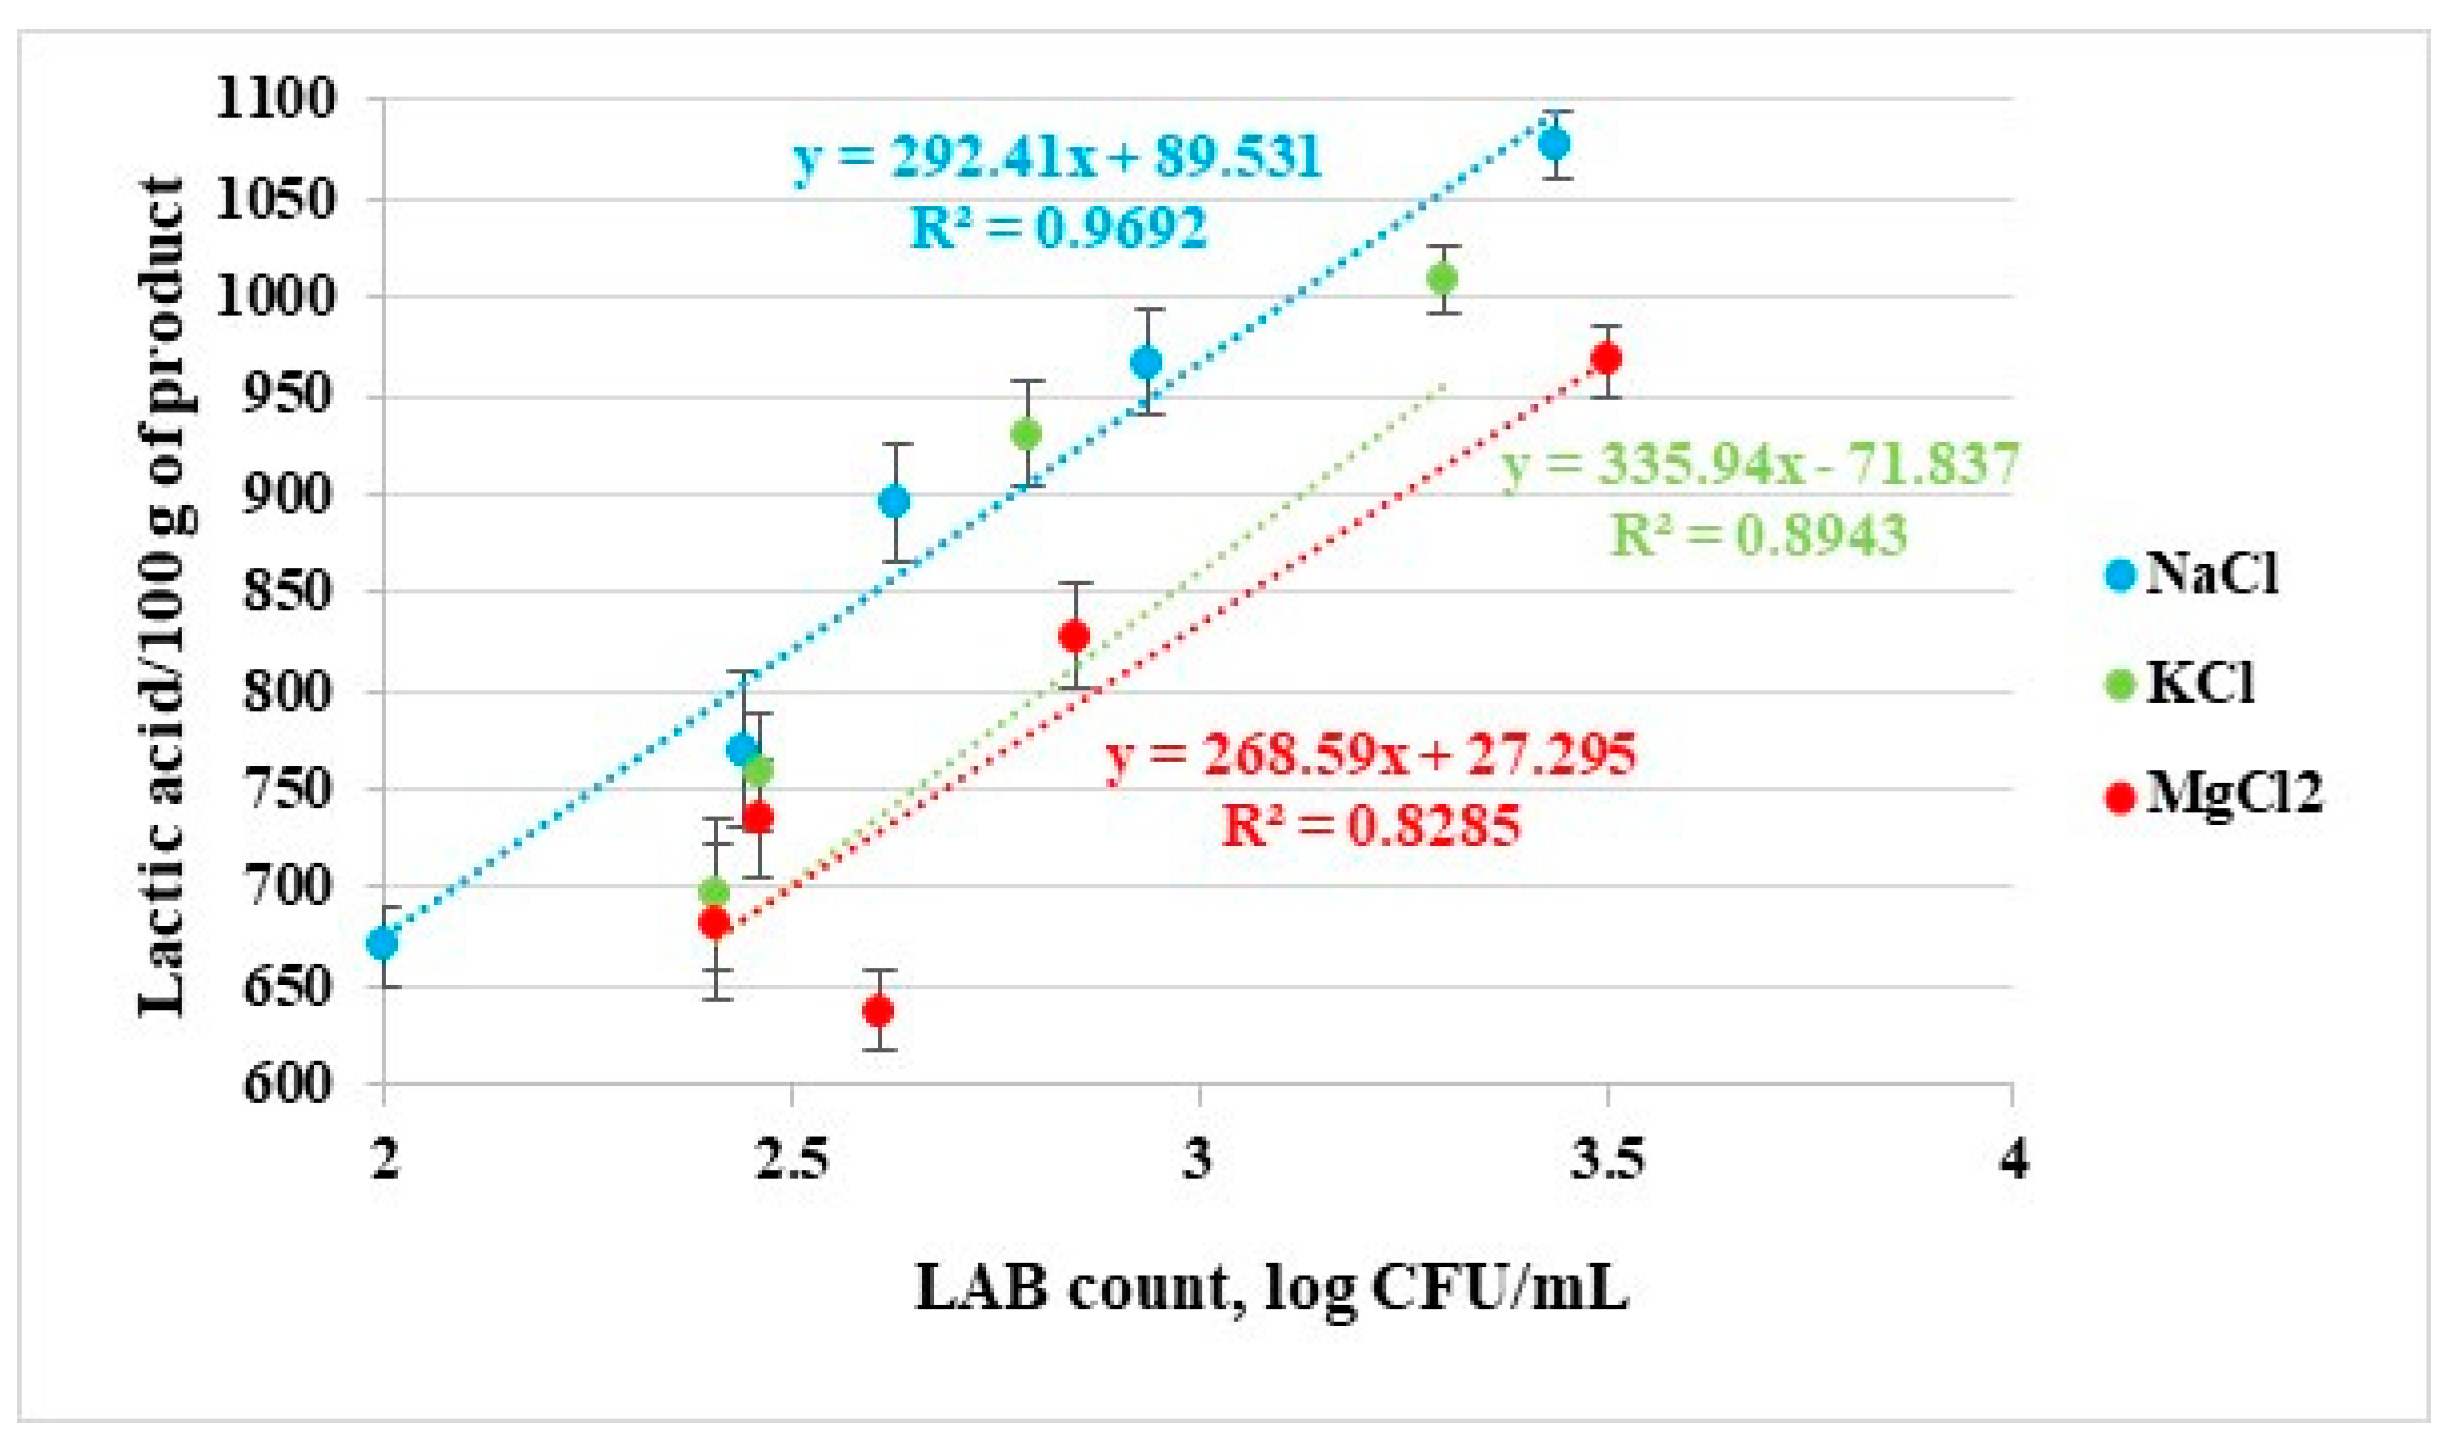
The results for the production of lactic acid are directly correlated with lactic acid bacteria count. A linear correlation was established, as shown in Figure 4, with high R2 values ranging from 0.8285 to 0.9692 for the three types of salts.
The correlation between LAB count and lactic acid content is a specific indicator of correct lactic fermentation, as lactic acid bacteria produce lactic acid.

3.1.3. Reducing Sugar Content

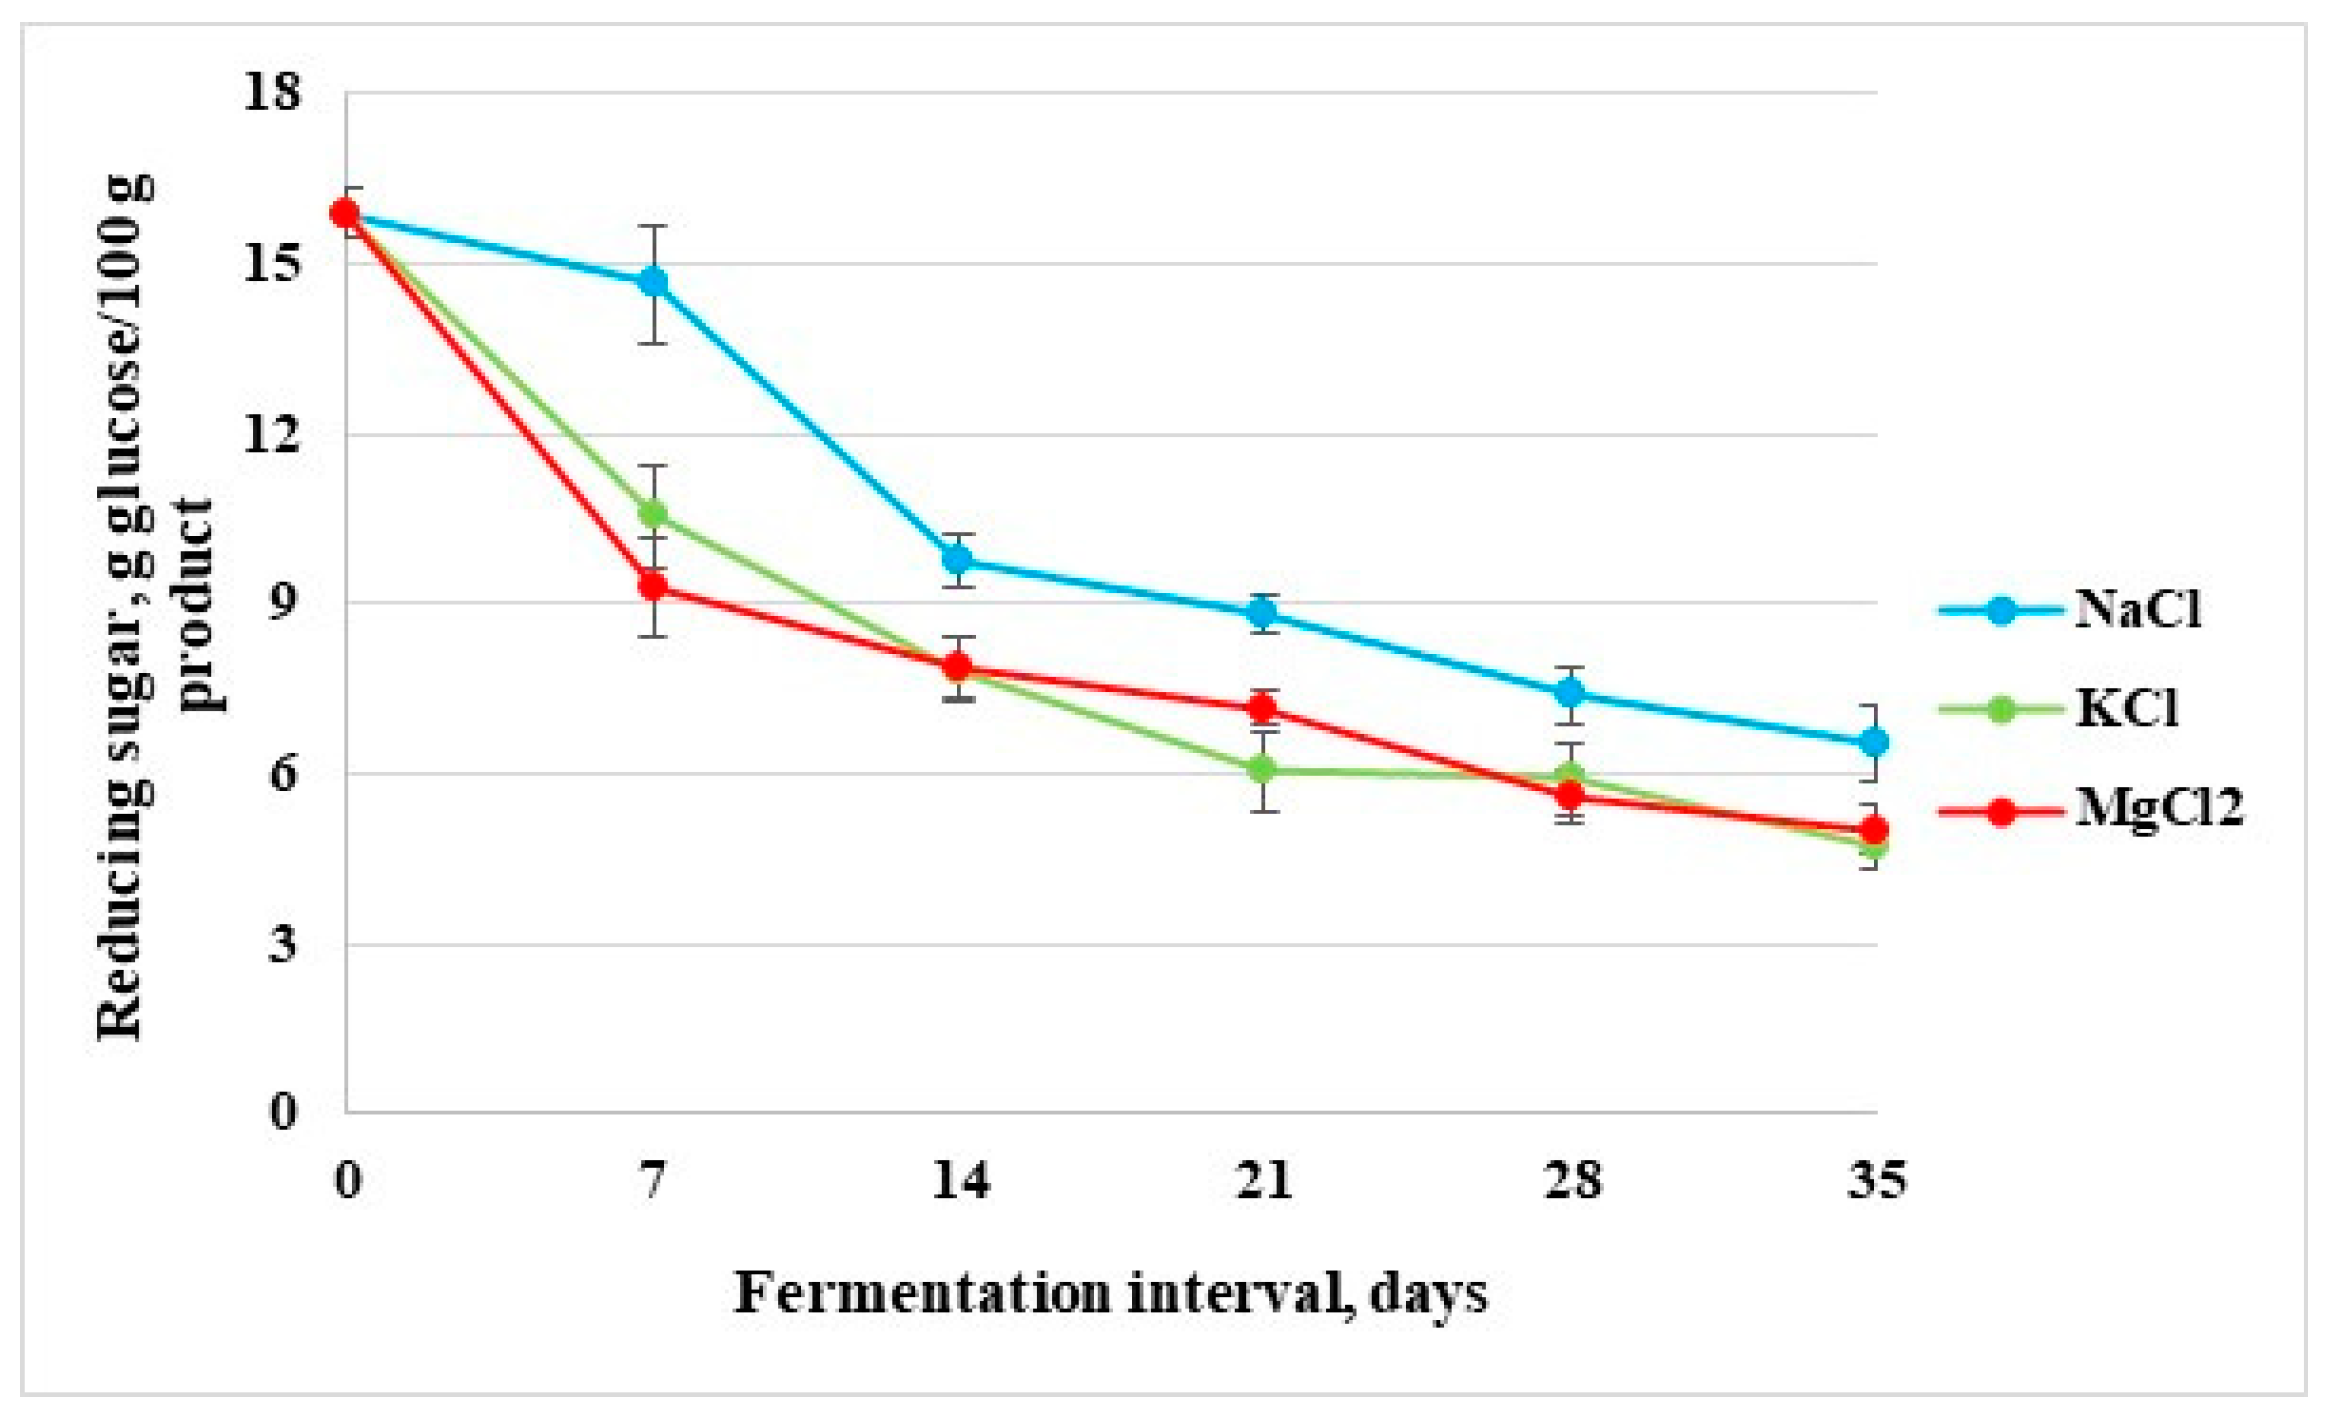
As shown in Figure 5, the amount of reducing sugar in all samples decreased along with fermentation time. The reducing sugar content decreased quickly in the first 7 days. After this interval, the decrease was slower and remained steady until the end of the fermentation period for all samples. According to our results, the reducing sugar content of pickled apples decreased from 15.9 ± 0.45 g/100 g on the 1st day to 6.52 ± 0.67 g/100 g in the NaCl brine, to 4.7 ± 0.39 g/100 g in the KCl brine, and to 5.03 ± 0.46 g/100 g in the MgCl2 brine on the 35th day of fermentation. The polysaccharides and other macromolecules present in fruits and vegetables can be deteriorated by some microorganisms, mostly by Lactobacillus species, which slowly increases the quantity of reducing sugar in pickles [37].
Further fermentation and continuous reproduction of microorganisms means that reducing sugar is used rapidly by microorganisms or dissolved in the pickle brine through osmosis and soaking. Thus, the content of reducing sugar decreased quickly in the KCl- and MgCl2-brined apples compared to the NaCl-brined apples. This may be because soaking pickled apples in brine could stimulate the elimination of sugars from apple tissue cells and quickly convert the reducing sugar into organic acids, causing a drop in the pH values of the brine. Similar results were found in the case of other brine-pickled vegetables, like sauerkraut [38], pickled cucumber [39], and pickled Chinese radishes [40].

3.1.4. Uronic Acid Content

The amount of uronic acid content in apples is related to the quantity of pectin, a cell wall component.
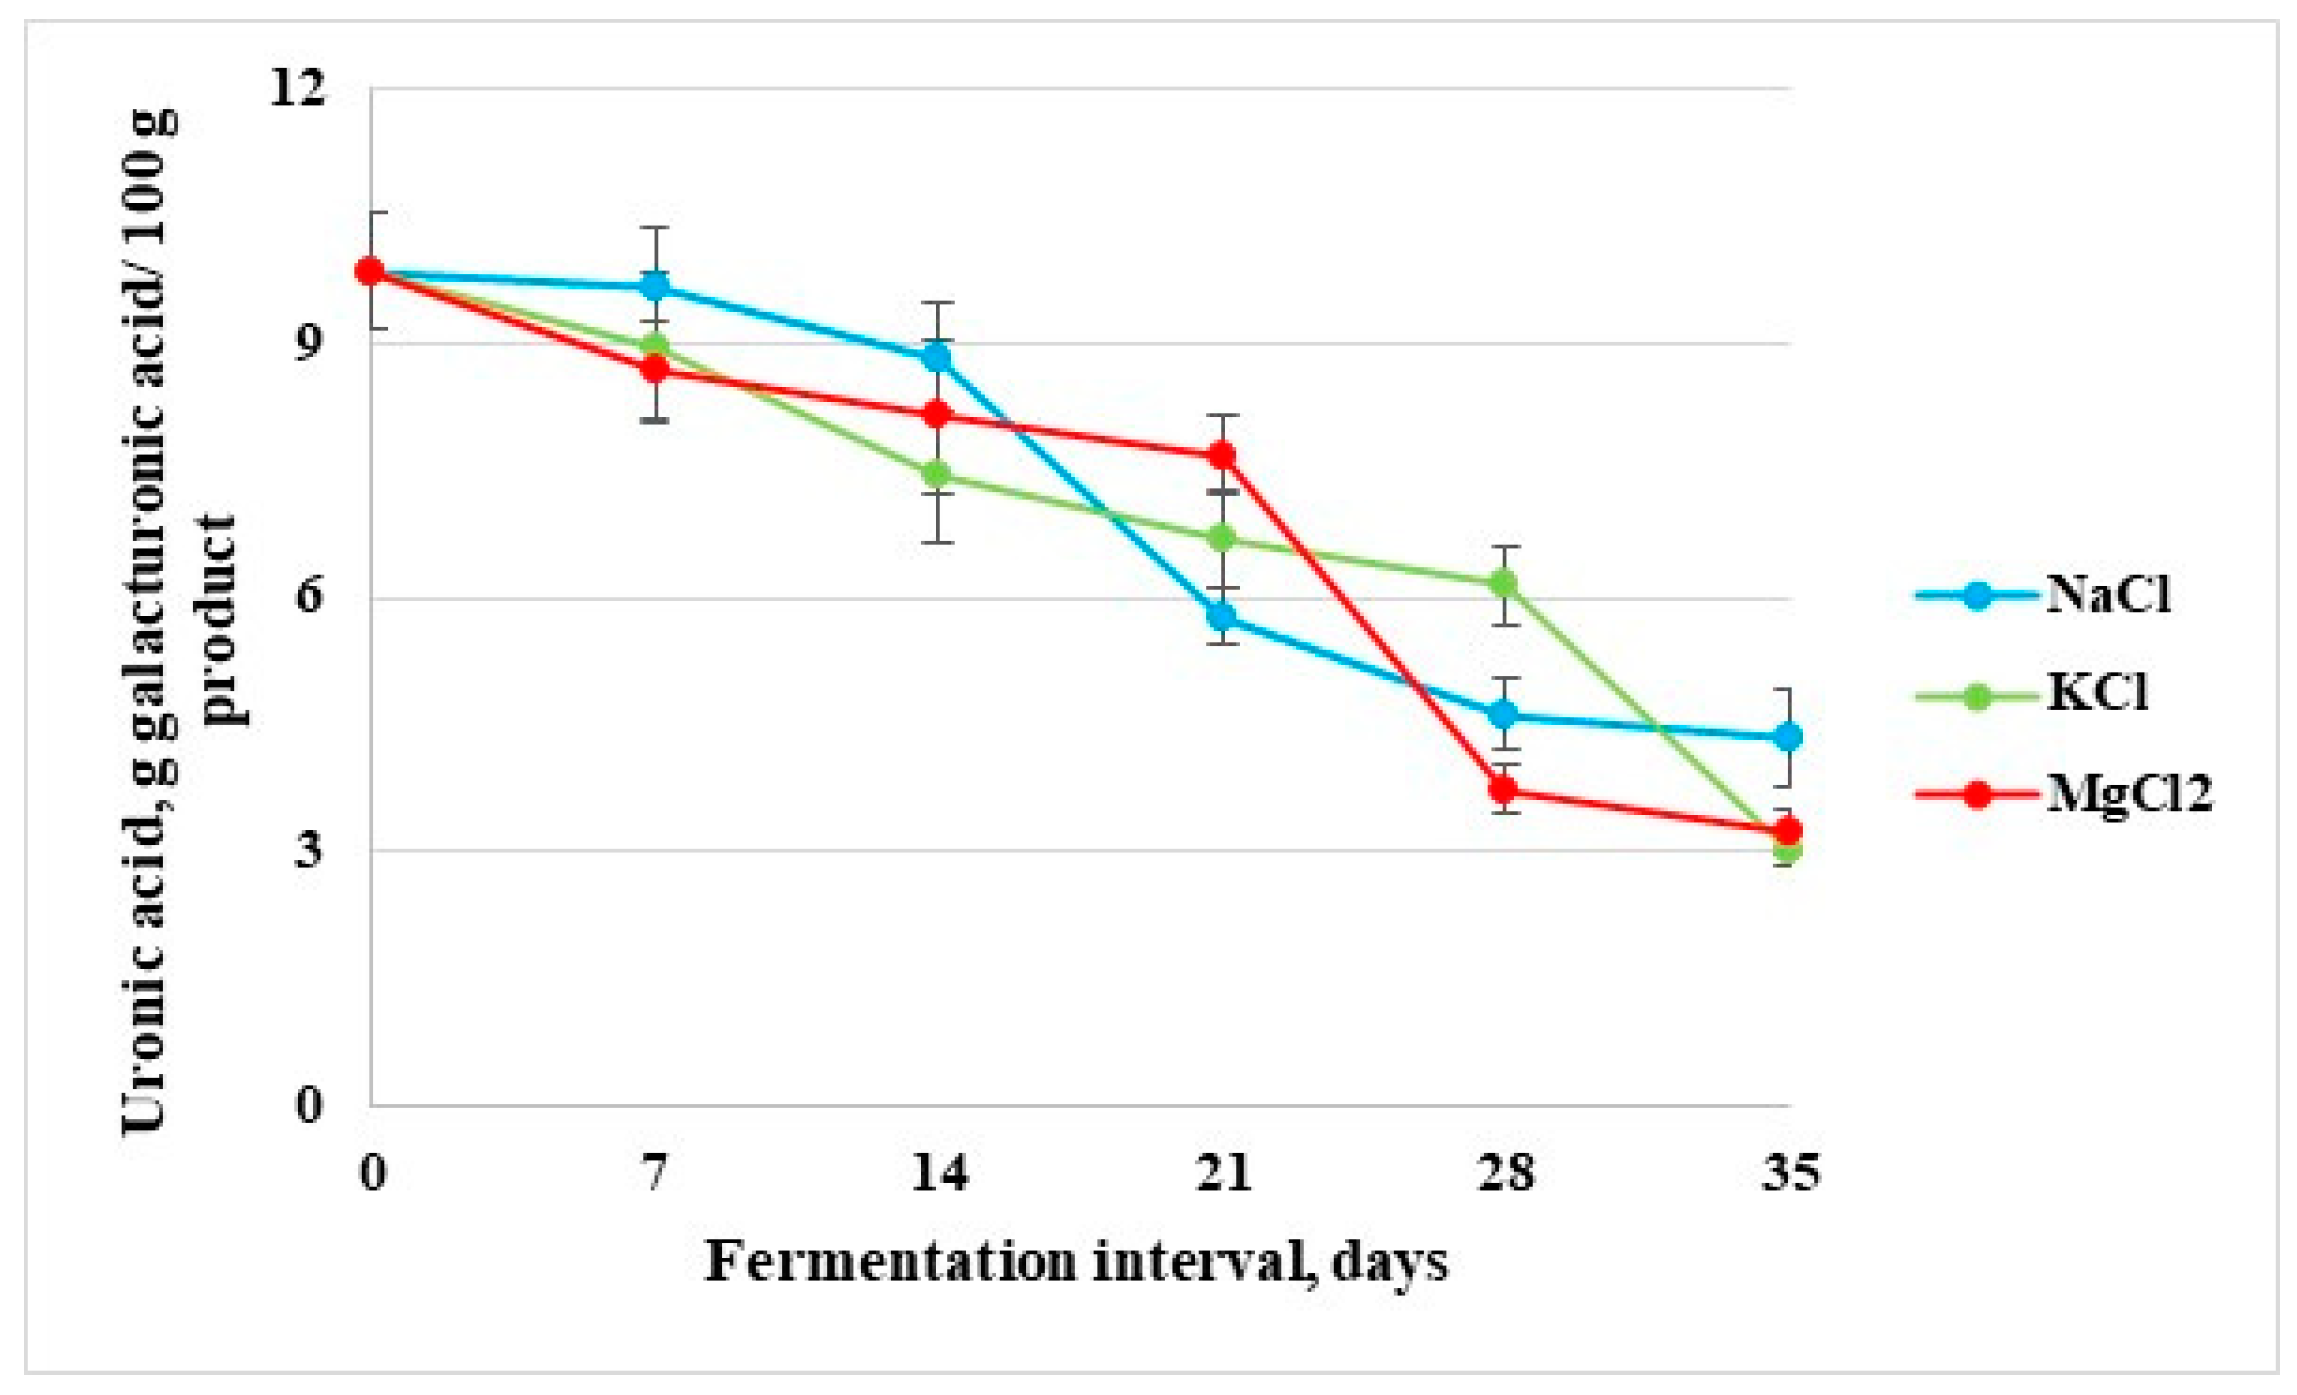
Pectin can be demethylated by pectin methyl esterase, obtaining low esterification pectin, which in combination with Ca2+ improves the texture of fruits and vegetables. Uronic acid content decreased continuously until the 35th day of fermentation, independent on the type of salt used (Figure 6).
These results support the variation of firmness values for the apple mesocarp tissues of all samples. Galacturonic acid, a monomer of pectin molecules, induces changes in textural parameters. Usually, pectin is water soluble, but the solubility depends on the degree esterification of galacturonic acid and the makeup of the side chain. Similar observations were also reported for pickled cucumber [41].
Table 1 shows that there were strong correlations (r > 0.75) between the physicochemical parameters that were observed during 35 days of fermentation. Thus, independent of the salt used to prepare the brine, the pH values were very well corelated both with the level of reducing sugars (r = 0.8245…0.9869) and uronic acids (r = 0.7043…0.7361). These correlations could be explained by the fact that the microbial population in the samples fermented the sugars and the uronic acids (r = 0.8023…0.9104) obtained by hydrolysis of the macromolecular carbohydrates from apples, starch, and pectic substances, inducing the decrease in pH [42].
Replacing NaCl with the two types of salt, KCl and MgCl2, did not influence the dynamics of the reactions of polysaccharide hydrolysis and fermentation, because both K+ and Mg2+ are mineral elements important in the nutrition of the native vegetal microbiome [43].

3.2. Mineral Content

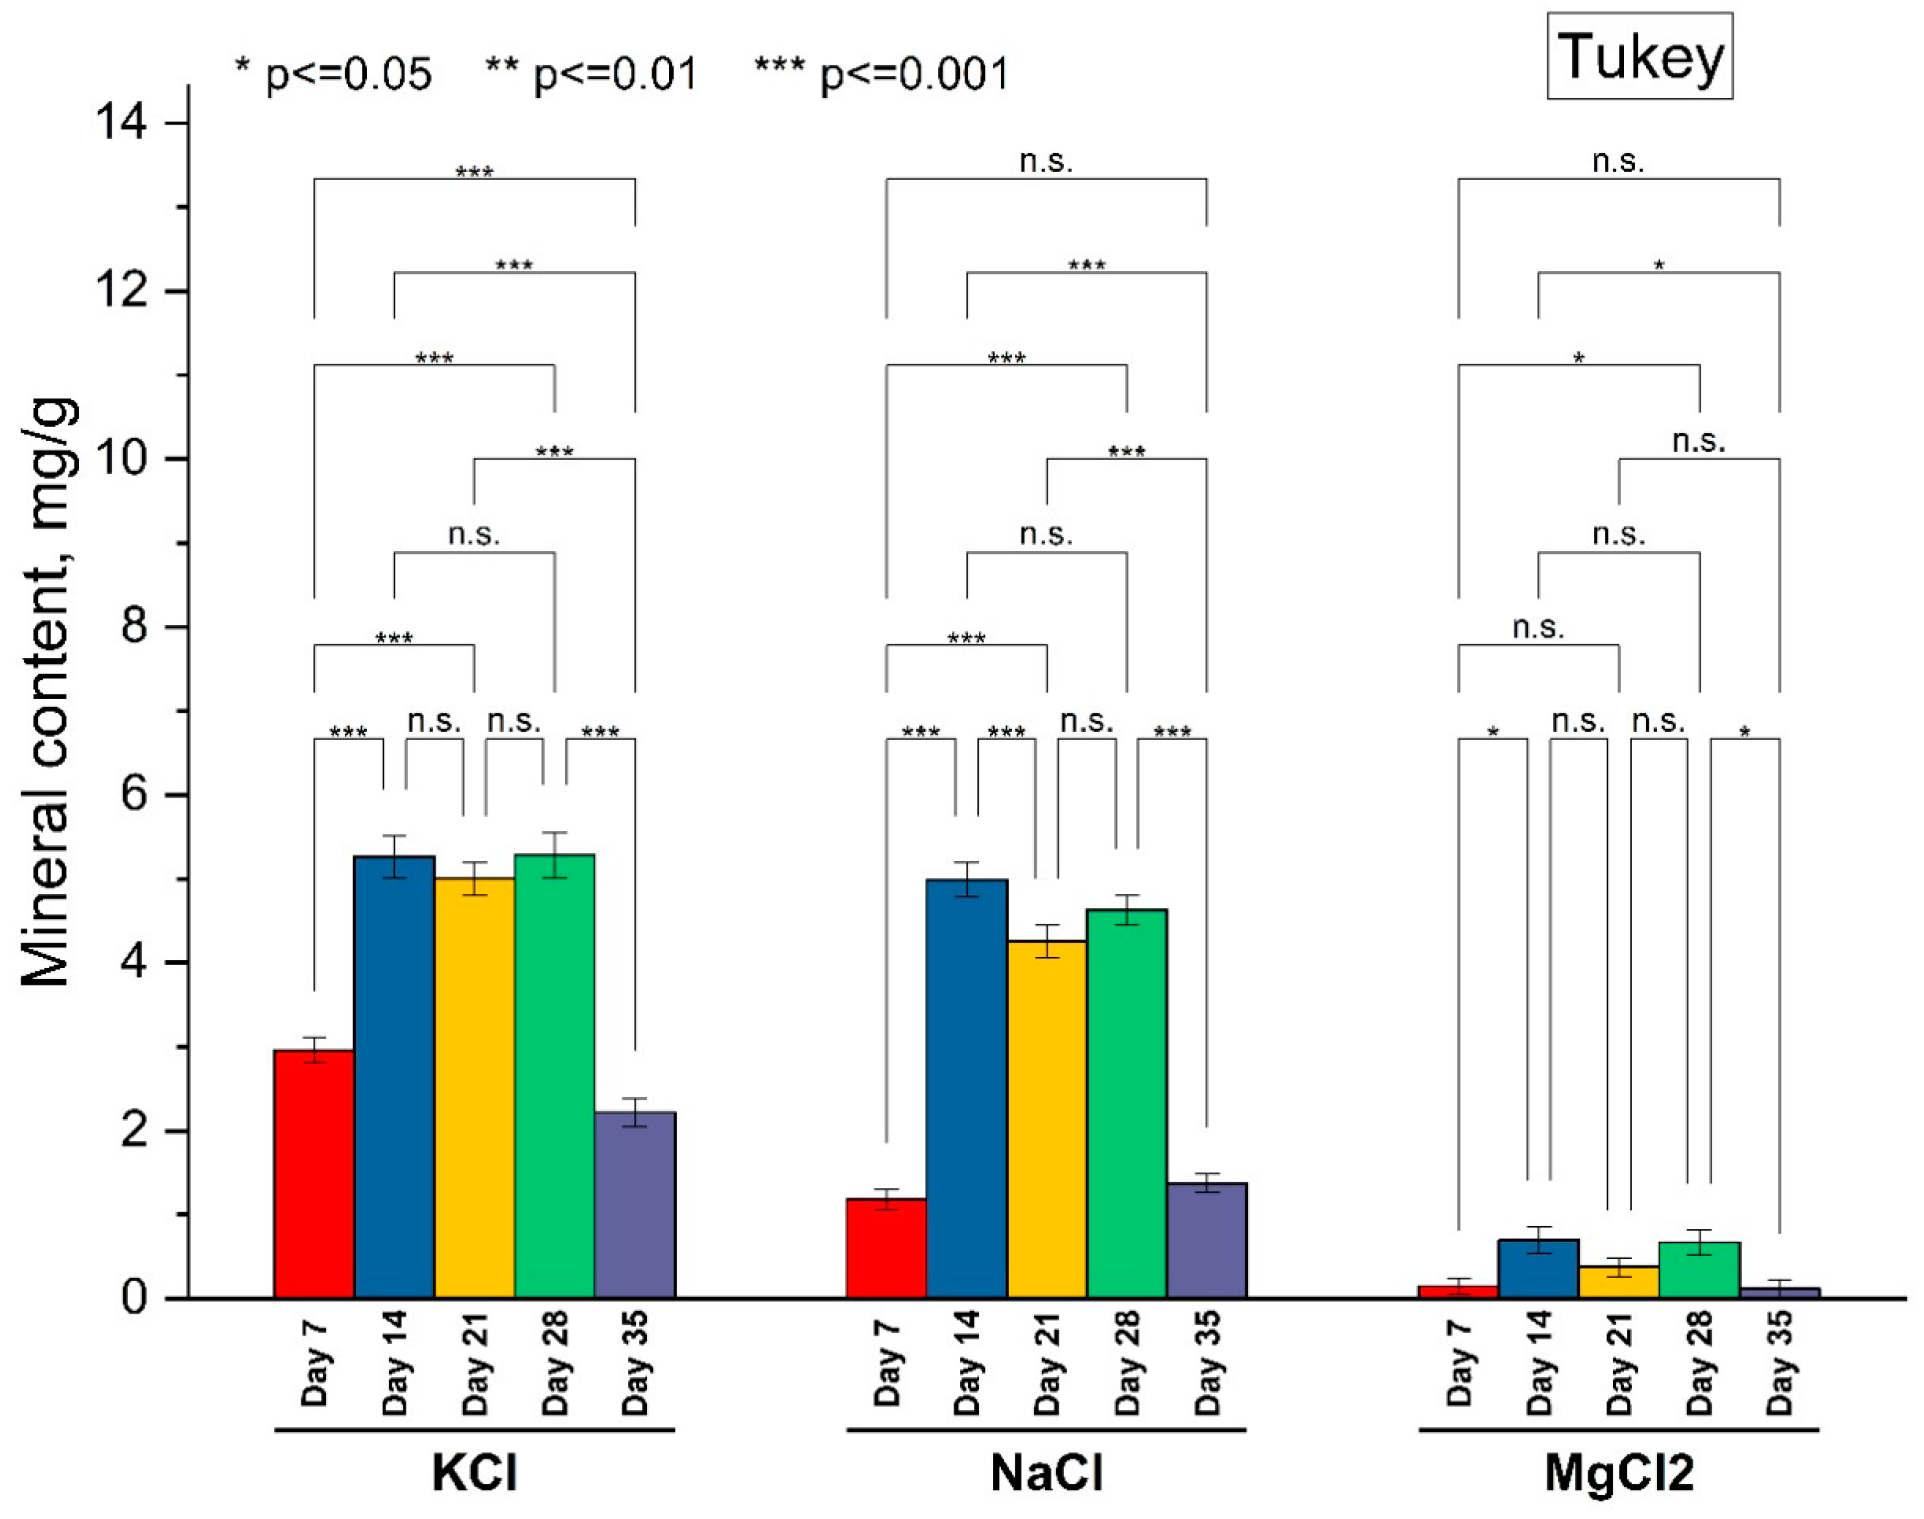
As can be observed in Figure 7, the saturation point for absorption of K, Na, and Mg in the apple flesh was reached on the 14th day of the experimental trial. The concentration dynamics of the ions in the apple samples showed a peak on the 14th day of the experiment, followed by a decrease on the 21st day, and then again, a sharp increase on the 28th day. The lowest concentration of minerals was registered on the 35th day of the experiment.
The concentrations of K and Na in the apple samples showed a similar trend (between 2.21 and 5.28 mg/g in the case of K and between 1.19 and 4.88 mg/g in the case of Na), and no significant difference was seen (p < 0.05) between KCl and NaCl in terms of ion accumulation during the experimental trial. This can be attributed to the fact that Na and K are monovalent cations, while Mg is a divalent cation, with a higher molecular weight [10]. All of these cations use passive diffusion to be transported via ion-specific channels along their respective gradients. It has been previously highlighted that cell membrane permeability to MgCl2 is six to seven times lower than cell membrane permeability to NaCl [44]. This phenomenon was also observed in our study, with significantly lower accumulation (p < 0.01) of Mg cations in the flesh of the apple samples (between 0.11 and 0.68 mg/g) in the case of the MgCl2 variant, compared to the NaCl variant.
According to Panagou et al., on the 55th day of fermentation of black olives with 8% NaCl, the Na concentration in the flesh of the olives was 10.08 mg/g, while in the case of olives fermented with 4% KCl and 4% CaCl2, the level of K in the flesh of the olives was 4.81 mg/g [45], which is similar to the results of the present study. In another study, Kiczorowski et al. recorded different values of Na in the flesh of fermented broccoli (85.22 g/kg), cucumber (81.3 g/kg), and pepper (44.5 g/kg) after 21 days of fermentation [46]. According to Bautista-Gallego et al., the penetration of NaCl into the flesh of olives is a matter of equilibrium, which does not depend on chemical reactions at the level of the brine [11]. As a general rule, fermented vegetables contain higher levels of macro-elements such as K, Na, or Mg, compared to fresh vegetables [47].

3.3. Antioxidant Activity Analysis

Antioxidant activity (AA) can be especially influenced by the polyphenols, flavonoids, and other valuable compounds with high biological value generated by lactic bacteria metabolism.
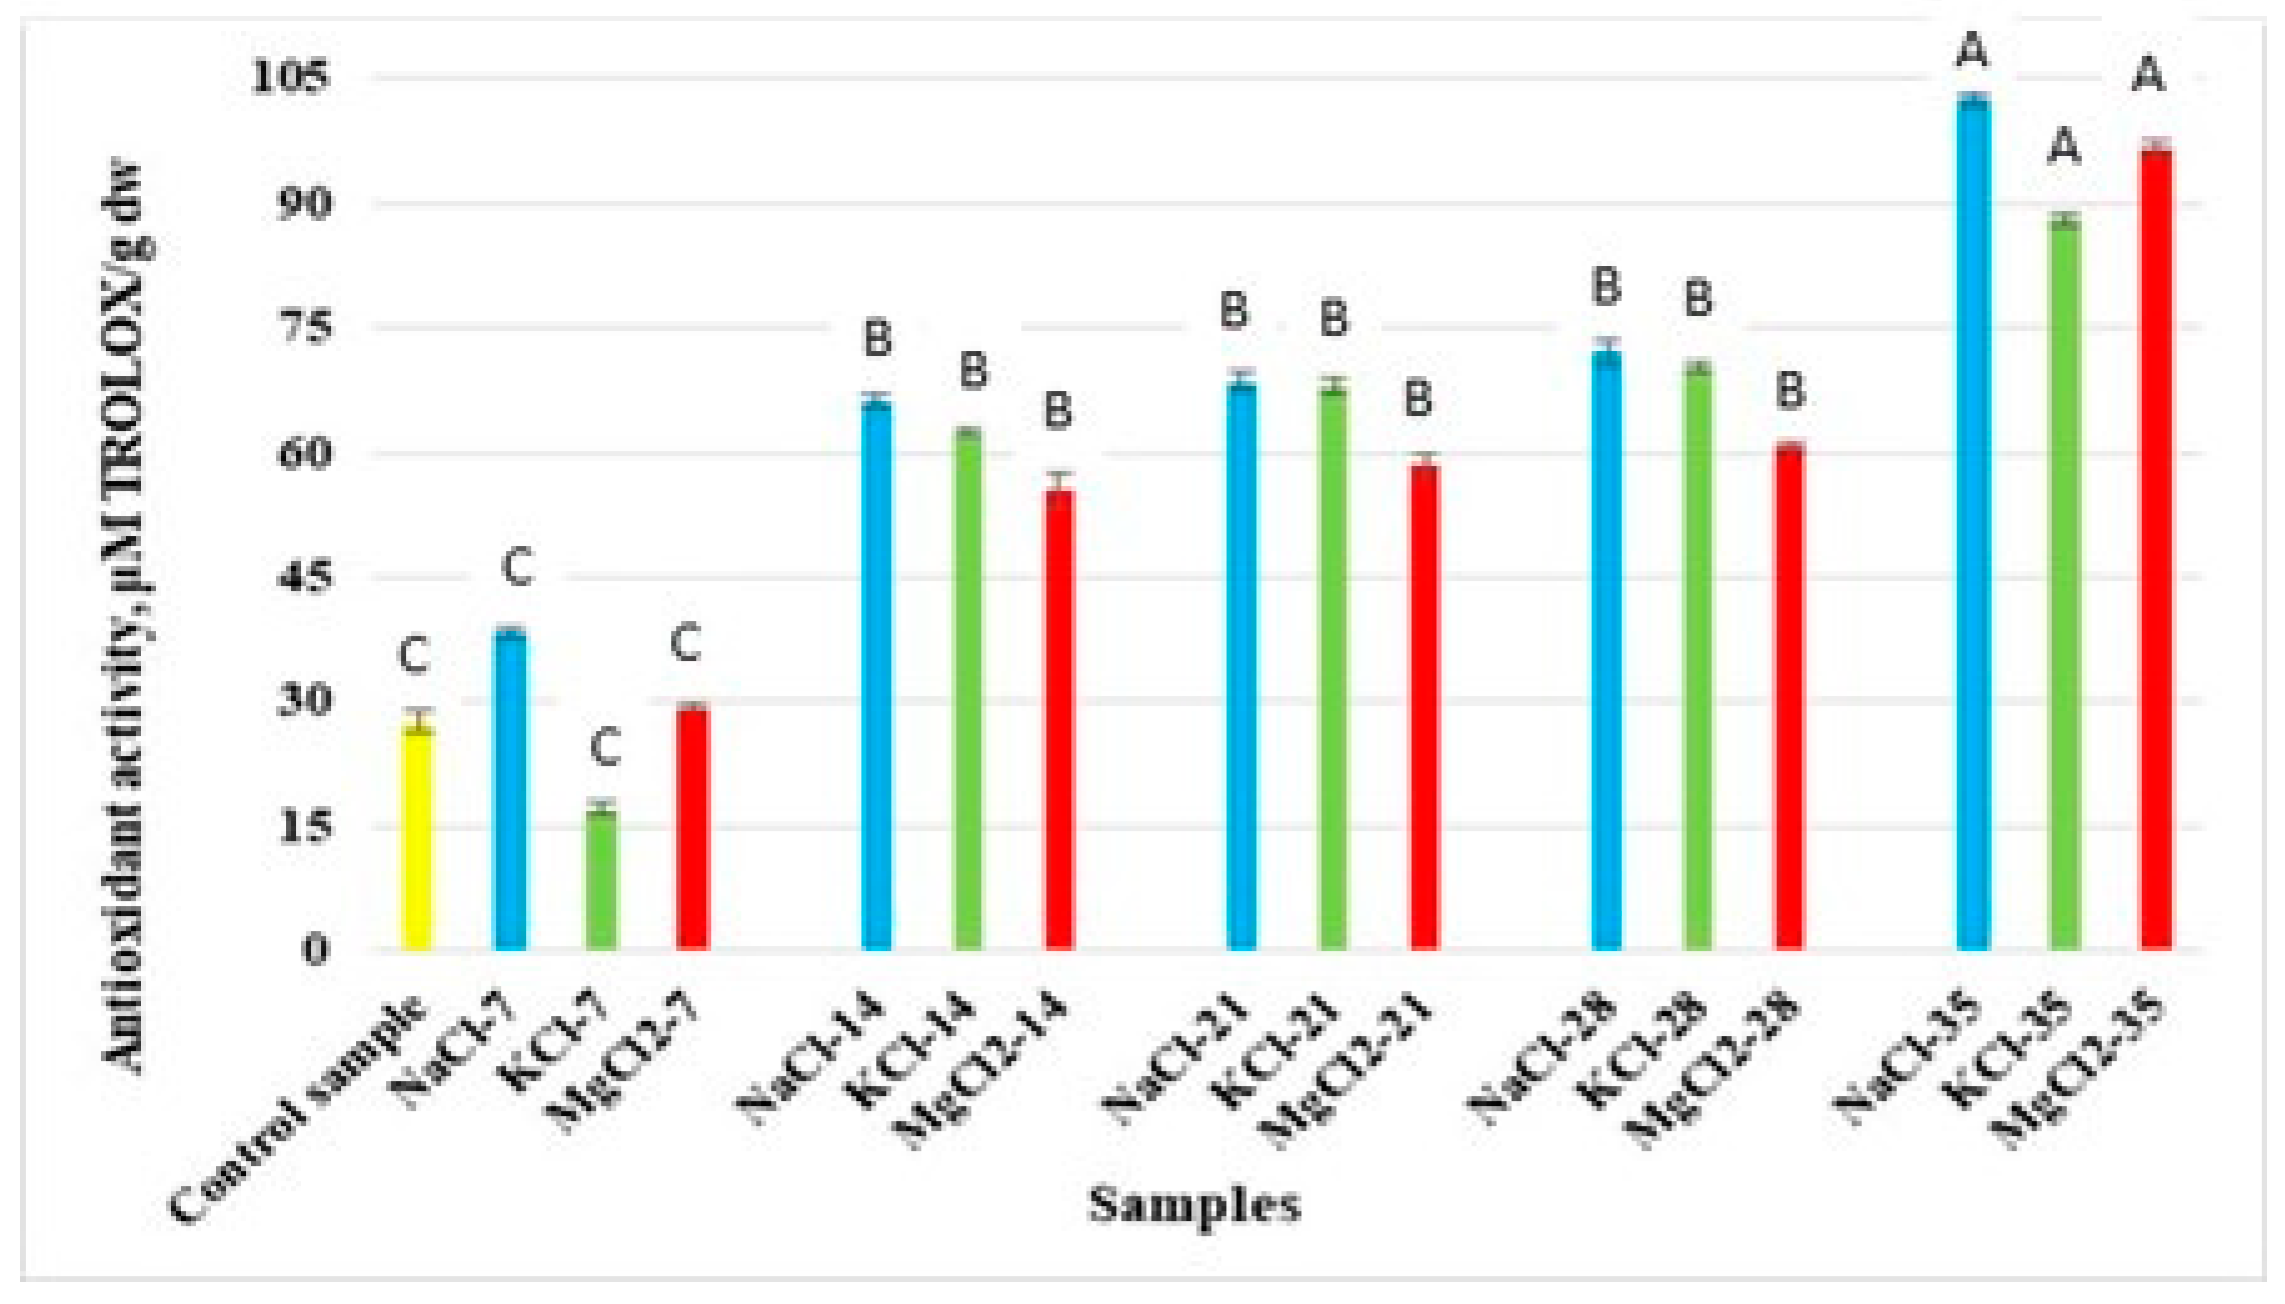
As can be seen in Figure 8, the antioxidant activity of pickled Granny Smith apples increased from the 7th to the 35th day of fermentation for all types of saline solutions. This is consistent with the findings of Mahidsanan et al., who showed that antioxidant activity is directly influenced by the production of exopolysaccharides, peptides, and amino acids [48]. On the 35th day of fermentation, a notable increase in AA capacity values was identified, as follows: 29% for the NaCl solution, 19% for the KCl solution, and 38% for MgCl2 solution. Kalinowska et al. reported similar results for pickled apples fermented under controlled conditions [49]. These findings, in relation with the lactic acid production and lactic bacteria viability, could be explained by the potential of probiotics to produce postbiotics when their viability is decreased or even when they are dead [50]. These kinds of compounds derived from probiotic metabolism could participate in enhancing AA and improving the nutritional value and shelf life of pickles.

3.4. Microbiological Changes in Apple Pickle Fermentation

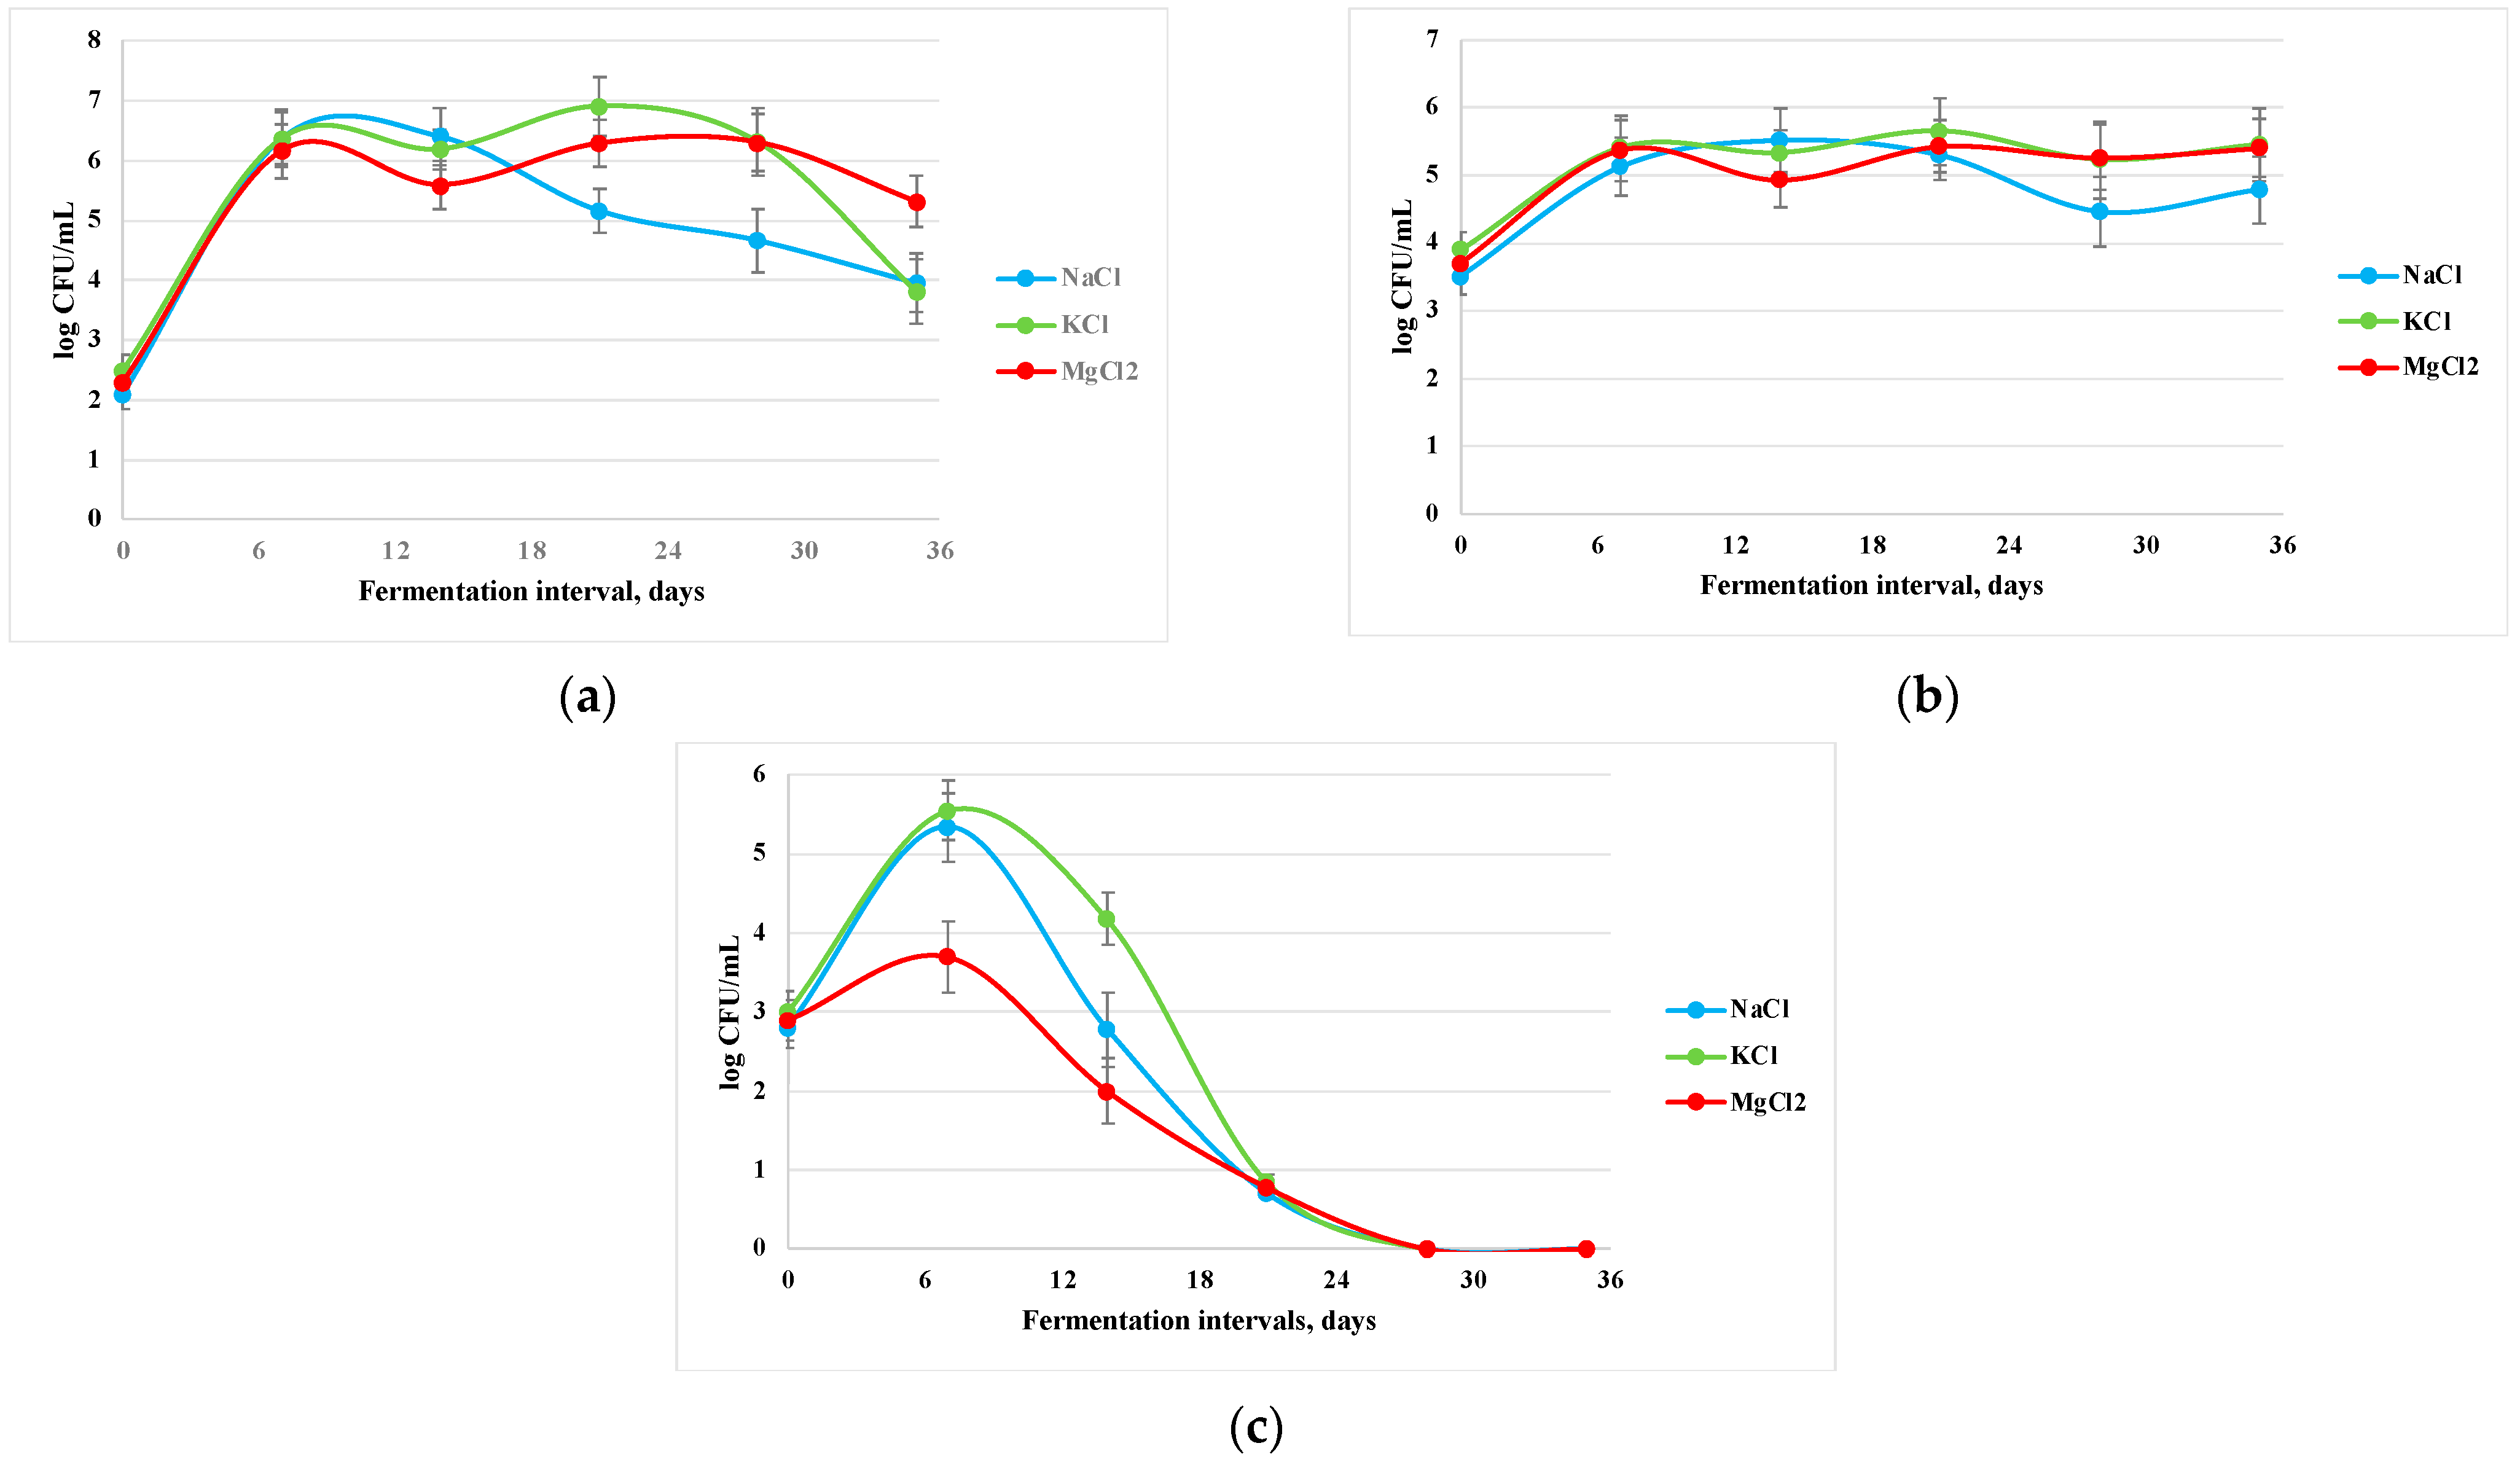
This study aimed to determine how the pickling process influences the microbiota, including LAB, yeast, and aerobic mesophilic bacteria, over the storage period. The Granny Smith apples’ microbiological quality obtained by pickling is shown in Figure 9. Four stages of microbial development can be distinguished during the natural fermentation of brined vegetables: initiation, primary fermentation, secondary fermentation, and post-fermentation deterioration [51]. Depending on environmental variables (salt type and concentration, temperature, vegetable matrix, etc.), aerobic spore-formers, LAB, and other types of bacteria and yeasts can remain active for days.
The LAB eventually take control by reducing the pH as primary lactic acid fermentation occurs. As seen in Figure 9a, the total LAB count increased rapidly until the seventh day for all the samples. Figure 9a also shows a significant difference in the number of LAB in the pickle samples analyzed. The total LAB count had a constant value from the 7th day to the 15th day and then increased for KCl- and NaCl-treated samples, whereas for the MgCl2-treated samples, a decrease was observed. At the end of the storage period, a decrease in LAB count was observed for all tested samples. The reduction in the total LAB count sample following the 15th day of the fermentation is considered to be associated with the fact that LAB may have a brief metabolic cycle, poor salt tolerance, and acid resistance [52]. The pH of canned pickles drops below a value of 4.6 or below, a level that does not allow the survival of most spoilage and pathogenic organisms, as Figure 2 shows. Lactic acid and maybe other metabolites that are commonly produced by lactic acid bacteria during pickle fermentation are the cause of the low pH. Our findings, which are consistent with prior research, indicate that KCl inhibits the growth of the majority of LAB strains, although the extent of this reduction is not as significant as that induced by NaCl [53]. Additionally, our findings suggest that their acidification capacity may not be significantly affected (Figure 3) [54]. This may be partially attributed to the fact that NaCl has a more substantial influence on water activity than KCl [55]. Since every food product has unique compositional and microbiological specificities that need to be considered, replacing NaCl with KCl or MgCl2 should not be a general rule in this respect [56].
The MAB (Figure 9b) of the pickled apple with various salt types fluctuated during storage, with pickles made with NaCl containing the highest levels (3.69–5.44 log CFU/mL). The cans of pickles made with MgCl2 had the lowest counts (4.78 log CFU/mL) after 35 days of storage. The MAB count may be considered safe if the aerobic plate counts of bacteria are as high as 5 log CFU/mL [51,57].
The lowest counts of YM were observed in pickles made with MgCl2 (2.69 log CFU/g) after seven days of storage (Figure 9c). For the apple pickles made with CaCl2 and KCl, the yeast concentration was relatively high compared with MgCl2 during the same storage interval. According to [58], yeasts can grow at a relatively low pH and in weak lactic acid concentrations. After 35 days, the yeast counts for all samples tested were below the detection limit (<1 log CFU/g). It is generally accepted that the critical yeast population that can cause spoilage is higher than log 6 CFU/g. Thus, the YM numbers observed in the current study are acceptable and may not affect the quality of pickled products obtained from other salt additions.

3.5. Textural Properties of Pickled Apples

The values of the textural parameters registered for fresh and fermented apples are presented in Table 2.
For firmness, a decrease was noted in the first 7 days of fermentation, with values ranging between 7.68% for the samples made with NaCl and 26.43% for the samples made with KCl. For the samples made with MgCl2, the decrease in firmness during the first seven day interval was 8.52%. In the last three weeks of fermentation, the firmness remained almost constant, with the values registering statistically insignificant variations. The decrease in firmness is attributed to solubilization and degradation of pectin from the cellular walls of the apple tissue, and has been reported for all fermented vegetal products. These processes are favored by the activity of pectin-methyl-esterase produced by the bacteria involved in fermentation [59]. For the samples with KCl, the accentuated decline in firmness could be due to a lesser inhibitor effect on microorganisms’ growth in comparison with NaCl. This effect upon microorganisms is also attributed to MgCl2, but the Mg2+ ions form cross-links between free carboxyl groups that remain after the action of pectin esterase, leading to an increase of vegetal tissue firmness [9].
Cohesiveness presented the highest value (0.69 ± 0.002) for the fresh sample. During fermentation, a change in cohesiveness similar to that seen for firmness was observed for the samples with NaCl and KCl, as well as a continuous decrease for the samples with MgCl2. The most accentuated decrease in cohesiveness for all the samples was registered within the first 7 days of fermentation. At the end of the fermentation interval, the lowest value of cohesiveness was observed for the samples with KCl. The drop in cohesiveness is correlated to vegetal tissue degradation and was also reported for other pickled vegetables like jalapeno [59] and cabbage [60].
For springiness, a sharp decrease was observed in the first 14 days of the fermentation interval, followed by a slower decrease in the next 7 days, and then it remained constant, at around 3 mm. Structural changes in plant tissue during fermentation result in its rupture during the first penetration cycle, making the deformation permanent and non-recoverable, which is why decreasing values of springiness were recorded. Similarly, the energy required to disintegrate the sample during the two successive penetrations was lower, revealing decreasing chewiness. The greatest decrease was recorded in the first 7 days of fermentation, with values ranging between 65.4% (for samples made with KCl) and 74.23% (for samples made with NaCl). In the next 7 days, the decrease was much slower and then remained constant. A similar change in textural parameters was reported for pickled carrots [61].

3.6. Color Analysis of Pickled Apples

The values of color parameters for the fresh and brine-pickled apples during fermentation are presented in Table 3. The color of the brine-pickled apples was analyzed at the beginning of the fermentation period and throughout fermentation up to the 35th day, with a frequency of seven days. The obtained results revealed that the pickling conditions influenced the color of all samples. Table 3 notes the decrease in lightness (L*) in the first seven days of fermentation, followed by a continuous increase until the end of fermentation for all brine-pickled samples. Throughout the fermentation period for all samples, the redness (a*) values increased until the 28th day of fermentation, while the yellowness (b*) values decreased. This phenomenon is related to the lactic acid produced by specific microorganisms during fermentation, which degrade chlorophylls into pheophytins and pheophorbides [62,63].
LAB fermentation decreased the quantity of chlorophyll in pickles, in accordance with [64]. Similar results were obtained by [65] in the case of non-pasteurized olives placed in sterile acidified brine solution. The hue angle h* values of brine-pickled apples increased during fermentation interval, while the chroma C* decreased, which indicates a yellowish color for the analyzed apple samples. Such yellowness can be due to chlorophyll biosynthesis [62].

4. Conclusions

The physicochemical results coupled with the microbiological results suggest that brine-pickled apples can be successfully manufactured using KCl or MgCl2 brine solution instead of the NaCl brine that is currently used to obtain this type of product. The antioxidant activity of pickled Granny Smith apples increased from the 7th to the 35th day of fermentation for all types of saline solutions. The obtained results revealed that pickling conditions influence the textural and color parameters of all samples. The total substitution of NaCl with KCl or MgCl2 in fermented vegetable products is crucially important from a human health perspective and needs further investigation.

Author Contributions

Conceptualization, E.B. and O.V.N.; methodology, D.-G.A. and G.-D.M.; software, G.-D.M.; validation, E.B., D.-G.A., O.V.N. and G.-D.M.; formal analysis, G.-D.M.; investigation, D.C., O.E.C., D.I.M., I.-A.S., D.-G.A. and O.V.N.; resources, E.B.; data curation, D.-G.A., O.V.N. and G.-D.M.; writing—original draft preparation, D.C., D.-G.A., O.V.N., O.E.C., D.I.M., I.-A.S. and G.-D.M.; writing—review and editing, D.-G.A., O.V.N. and G.-D.M.; visualization, D.-G.A., O.V.N. and G.-D.M.; supervision, E.B.; project administration, E.B.; funding acquisition, D.C. All authors have read and agreed to the published version of the manuscript.

Funding

This research received no external funding.

Data Availability Statement

The original contributions presented in this study are included in the article. Further inquiries can be directed to the corresponding authors.

Acknowledgments

The Integrated Center for Research, Expertise, and Technology Transfer in the Food Industry, as well as the MoRAS Center developed through the POSCCE ID 1815, SMIS number 48745 (www.moras.ugal.ro, accessed on 16 April 2022), are thanked for their technical assistance throughout this experiment.

Conflicts of Interest

The authors declare no conflicts of interest.

Abbreviations

The following abbreviations are used in this manuscript:
NaClSodium chloride
KClPotassium chloride
MgCl2Magnesium chloride
WHOWorld Health Organization
BPBlood pressure
CVDCardiovascular disease
LABLactic acid bacteria
MABMesophilic aerobic bacteria
YMYeast and molds
CFUColony-forming unit
MRSde Man, Rogosa, and Sharpe
AAAntioxidant activity

References

  1. Yuan, X.; Wang, T.; Sun, L.; Qiao, Z.; Pan, H.; Zhong, Y.; Zhuang, Y. Recent Advances of Fermented Fruits: A Review on Strains, Fermentation Strategies, and Functional Activities. Food Chem. X 2024, 22, 101482. [Google Scholar] [CrossRef] [PubMed]
  2. He, M.; Tan, M. Hollow Salt for Sodium Reduction in Foods: Mechanisms, Influence Factors, Applications and Challenges. Trends Food Sci. Technol. 2024, 147, 104451. [Google Scholar] [CrossRef]
  3. Khan, A.W.; Roobab, U.; Wang, Z.; Raza, M.M.; Nawazish, H.; Islam, F.; Aadil, R.M. Salt Reduction in Food Products: A Systematic Review of Clean-Label Ingredients and Non-Thermal Technologies. Trends Food Sci. Technol. 2024, 153, 104695. [Google Scholar] [CrossRef]
  4. Salt Intake—PAHO/WHO|Pan American Health Organization. Available online: https://www.paho.org/en/enlace/salt-intake (accessed on 25 February 2025).
  5. Ponzo, V.; Pellegrini, M.; Costelli, P.; Vázquez-Araújo, L.; Gayoso, L.; D’eusebio, C.; Ghigo, E.; Bo, S. Strategies for Reducing Salt and Sugar Intakes in Individuals at Increased Cardiometabolic Risk. Nutrients 2021, 13, 279. [Google Scholar] [CrossRef] [PubMed]
  6. Dragomir, C.M.; Ilie, S.-M.; Poiana, M.-A.; Misca, C.D.; Cocan, I.; Dumbravă, D.-G.; Moldovan, C.; Popa, V.-M.; Petcu, C.D.; Roman, C.; et al. Traditional Romanian culinary practices and their historical and cultural significance—A review. Sci. Papers. Ser. E. Land. Reclam. Earth Obs. Surv. Environ. Eng. 2024, XIII, 882–889. [Google Scholar]
  7. Youssef, M.E.; E Bhnsawy, R.M.; Gabal, S. Production of Low-Sodium Pickles for Hypertensive Patients. Middle East J. Agric. Res. 2017, 6, 99–106. [Google Scholar]
  8. Fouladkhah, A.; Berlin, D.; Bruntz, D. High-Sodium Processed Foods: Public Health Burden and Sodium Reduction Strategies for Industry Practitioners. Food Rev. Int. 2015, 31, 341–354. [Google Scholar] [CrossRef]
  9. Yoo, K.M.; Hwang, I.K.; Eog, G.; Moon, B. Effects of Salts and Preheating Temperature of Brine on the Texture of Pickled Cucumbers. J. Food Sci. 2006, 71, C97–C101. [Google Scholar] [CrossRef]
  10. López-López, A.; Moreno-Baquero, J.M.; Garrido-Fernández, A. Relationships between Na, K, and Ca Mineral Nutrients in Brine and Table Olive Flesh. Nutritional Labelling Implications. LWT 2023, 189, 115546. [Google Scholar] [CrossRef]
  11. Bautista-Gallego, J.; Arroyo-López, F.N.; López-López, A.; Garrido-Fernández, A. Effect of Chloride Salt Mixtures on Selected Attributes and Mineral Content of Fermented Cracked Aloreña Olives. LWT—Food Sci. Technol. 2011, 44, 120–129. [Google Scholar] [CrossRef]
  12. Effect of Increased Potassium Intake on Blood Pressure, Renal Function, Blood Lipids and Other Potential Adverse Effects. Available online: https://www.who.int/publications/i/item/9789241504881?ua=1&ua=1 (accessed on 26 February 2025).
  13. Razzaque, M.S. Magnesium: Are We Consuming Enough? Nutrients 2018, 10, 1863. [Google Scholar] [CrossRef]
  14. Sun, J.; Chu, Y.F.; Wu, X.; Liu, R.H. Antioxidant and Antiproliferative Activities of Common Fruits. J. Agric. Food Chem. 2002, 50, 7449–7454. [Google Scholar] [CrossRef] [PubMed]
  15. Kovač, A.; Babojelić, M.S.; Pavičić, N.; Voća, S.; Voća, N.; Dobričević, N.; Jagatić, A.M.; Šindrak, Z. Influence of Harvest Time and Storage Duration on “Cripps Pink” Apple Cultivar (Malus × Domestica Borkh) Quality Parameters Del Tiempo de Cosecha y Duración En Almacenamiento En Los Parámetros de Calidad de La Variedad de Manzana Cripps Pink (Malus × Domestica Borkh). CyTA—J. Food 2010, 8, 1–6. [Google Scholar] [CrossRef]
  16. Lorn, D.; Nguyen, T.K.C.; Ho, P.H.; Tan, R.; Licandro, H.; Waché, Y. Screening of Lactic Acid Bacteria for Their Potential Use as Aromatic Starters in Fermented Vegetables. Int. J. Food Microbiol. 2021, 350, 109242. [Google Scholar] [CrossRef] [PubMed]
  17. Xiang, H.; Sun-Waterhouse, D.; Waterhouse, G.I.N.; Cui, C.; Ruan, Z. Fermentation-Enabled Wellness Foods: A Fresh Perspective. Food Sci. Hum. Wellness 2019, 8, 203–243. [Google Scholar] [CrossRef]
  18. Bernardeau, M.; Guguen, M.; Vernoux, J.P. Beneficial Lactobacilli in Food and Feed: Long-Term Use, Biodiversity and Proposals for Specific and Realistic Safety Assessments. FEMS Microbiol. Rev. 2006, 30, 487–513. [Google Scholar] [CrossRef] [PubMed]
  19. Alan, Y.; Savcı, A.; Koçpınar, E.F.; Ertaş, M. Postbiotic Metabolites, Antioxidant and Anticancer Activities of Probiotic Leuconostoc pseudomesenteroides Strains in Natural Pickles. Arch. Microbiol. 2022, 204, 571. [Google Scholar] [CrossRef]
  20. Mocanu, G.D.; Nistor, O.V.; Constantin, O.E.; Andronoiu, D.G.; Barbu, V.V.; Botez, E. The Effect of Sodium Total Substitution on the Quality Characteristics of Green Pickled Tomatoes (Solanum lycopersicum L.). Molecules 2022, 27, 1609. [Google Scholar] [CrossRef] [PubMed]
  21. Khatri, D.; Chhetri, S.B.B. Reducing Sugar, Total Phenolic Content, and Antioxidant Potential of Nepalese Plants. Biomed. Res. Int. 2020, 2020, 7296859. [Google Scholar] [CrossRef]
  22. Yu, M.; Xia, Y.; Zhou, M.; Guo, Y.; Zheng, J.; Zhang, Y. Effects of Different Extraction Methods on Structural and Physicochemical Properties of Pectins from Finger Citron Pomace. Carbohydr. Polym. 2021, 258, 117662. [Google Scholar] [CrossRef]
  23. Saikia, S.; Mahnot, N.K.; Mahanta, C.L. Effect of Spray Drying of Four Fruit Juices on Physicochemical, Phytochemical and Antioxidant Properties. J. Food Process Preserv. 2015, 39, 1656–1664. [Google Scholar] [CrossRef]
  24. Aksay, S.; Arslan, R.; Tokbaş, H.; Eroğlu, E.Ç. Changes in Some Biochemical Properties of Brassica Vegetables (Cabbage, Cauliflower and Broccoli) Pickles and Brines. J. Raw Mater. Process. Foods 2022, 3, 26–34. [Google Scholar]
  25. Barbu, V. Phenotypical Characterization of Several Lactic Acid Bacteria Strains Isolated from Wheat’s Epiphyte Microbiota. Roum. Biotechnol. Lett. 2008, 13, 4074–4085. [Google Scholar]
  26. ISO 4833-2:2013(en); Microbiology of the Food Chain—Horizontal Method for the Enumeration of Microorganisms—Part 2: Colony Count at 30 Degrees C by the Surface Plating Technique. ISO: Geneva, Switzerland, 2013. Available online: https://www.iso.org/obp/ui/#iso:std:iso:4833:-2:ed-1:v1:en (accessed on 19 February 2025).
  27. ISO 21527-2:2008(en); Microbiology of Food and Animal Feeding Stuffs—Horizontal Method for the Enumeration of Yeasts And Moulds—Part 2: Colony Count Technique in Products with Water Activity Less Than or Equal to 0.95. ISO: Geneva, Switzerland, 2008. Available online: https://www.iso.org/obp/ui/#iso:std:iso:21527:-2:ed-1:v1:en (accessed on 19 February 2025).
  28. Rao, M.S.; Pintado, J.; Stevens, W.F.; Guyot, J.P. Kinetic Growth Parameters of Different Amylolytic and Non-Amylolytic Lactobacillus Strains Under Various Salt and PH Conditions. Bioresour. Technol. 2004, 94, 331–337. [Google Scholar] [CrossRef]
  29. Dastager, S.G. Isolation, Improvement, and Preservation of Microbial Cultures. In Fermentation Processes Engineering in the Food Industry; CRC Press: Boca Raton, FL, USA, 2013; pp. 46–71. [Google Scholar] [CrossRef]
  30. Moore, J.F.; DuVivier, R.; Johanningsmeier, S.D. Changes in the Free Amino Acid Profile of Pickling Cucumber during Lactic Acid Fermentation. J. Food Sci. 2022, 87, 599–611. [Google Scholar] [CrossRef] [PubMed]
  31. Lennox, J.A.; Efiuvwevwere, B.J.O. Microbial Dynamics of Fermenting Garden Egg (Solanum melongena). Int. J. Curr. Microbiol. App. Sci. 2014, 3, 950–957. [Google Scholar]
  32. Rollán, G.C.; Gerez, C.L.; Leblanc, J.G. Lactic Fermentation as a Strategy to Improve the Nutritional and Functional Values of Pseudocereals. Front. Nutr. 2019, 6, 447741. [Google Scholar] [CrossRef] [PubMed]
  33. Satora, P.; Skotniczny, M.; Strnad, S.; Piechowicz, W. Chemical Composition and Sensory Quality of Sauerkraut Produced from Different Cabbage Varieties. LWT 2021, 136, 110325. [Google Scholar] [CrossRef]
  34. Rao, Y.; Qian, Y.; Tao, Y.; She, X.; Li, Y.; Chen, X.; Guo, S.; Xiang, W.; Liu, L.; Du, H.; et al. Characterization of the Microbial Communities and Their Correlations with Chemical Profiles in Assorted Vegetable Sichuan Pickles. Food Control. 2020, 113, 107174. [Google Scholar] [CrossRef]
  35. Kim, D.W.; Kim, B.M.; Lee, H.J.; Jang, G.J.; Song, S.H.; Lee, J.I.; Lee, S.B.; Shim, J.M.; Lee, K.W.; Kim, J.H.; et al. Effects of Different Salt Treatments on the Fermentation Metabolites and Bacterial Profiles of Kimchi. J. Food Sci. 2017, 82, 1124–1131. [Google Scholar] [CrossRef]
  36. Palani, K.; Harbaum-Piayda, B.; Meske, D.; Keppler, J.K.; Bockelmann, W.; Heller, K.J.; Schwarz, K. Influence of Fermentation on Glucosinolates and Glucobrassicin Degradation Products in Sauerkraut. Food Chem. 2016, 190, 755–762. [Google Scholar] [CrossRef] [PubMed]
  37. Lin, X.; Bakyrbay, S.; Liu, L.; Tang, X.; Liu, Y. Microbiota Succession and Chemical Composition Involved in Lactic Acid Bacteria-Fermented Pickles. Fermentation 2023, 9, 330. [Google Scholar] [CrossRef]
  38. Wouters, D.; Grosu-Tudor, S.; Zamfir, M.; De Vuyst, L. Bacterial Community Dynamics, Lactic Acid Bacteria Species Diversity and Metabolite Kinetics of Traditional Romanian Vegetable Fermentations. J. Sci. Food Agric. 2013, 93, 749–760. [Google Scholar] [CrossRef]
  39. McMurtrie, E.K.; Johanningsmeier, S.D.; Breidt, F.; Price, R.E. Effect of Brine Acidification on Fermentation Microbiota, Chemistry, and Texture Quality of Cucumbers Fermented in Calcium or Sodium Chloride Brines. J. Food Sci. 2019, 84, 1129–1137. [Google Scholar] [CrossRef] [PubMed]
  40. Tang, Y.; Chen, G.; Wang, D.; Hu, R.; Li, H.; Liu, S.; Zhang, Q.; Ming, J.; Chi, Y. Effects of Dry-Salting and Brine-Pickling Processes on the Physicochemical Properties, Nonvolatile Flavour Profiles and Bacterial Community during the Fermentation of Chinese Salted Radishes. LWT 2022, 157, 113084. [Google Scholar] [CrossRef]
  41. Uthpala, T.G.G.; Marapana, R.A.U.J.; Jayawardana, S.A.S. Sensory Quality and Physicochemical Evaluation of Two Brine Pickled Cucumber (Cucumis sativus L.) Varieties. Int. J. Adv. Eng. Res. Sci. 2018, 5, 22–26. [Google Scholar] [CrossRef]
  42. Wang, Y.; Wu, J.; Lv, M.; Shao, Z.; Hungwe, M.; Wang, J.; Bai, X.; Xie, J.; Wang, Y.; Geng, W. Metabolism Characteristics of Lactic Acid Bacteria and the Expanding Applications in Food Industry. Front. Bioeng. Biotechnol. 2021, 9, 612285. [Google Scholar] [CrossRef]
  43. Ribeiro-Filho, N.; Linforth, R.; Bora, N.; Powell, C.D.; Fisk, I.D. The Role of Inorganic-Phosphate, Potassium and Magnesium in Yeast-Flavour Formation. Food Res. Int. 2022, 162, 112044. [Google Scholar] [CrossRef] [PubMed]
  44. Wang, E.; Lv, X.; Liu, S.; Dong, Q.; Li, J.; Li, H.; Su, B. A Selective Separation Mechanism for Mono/Divalent Cations and Properties of a Hollow-Fiber Composite Nanofiltration Membrane Having a Positively Charged Surface. Membranes 2024, 14, 1. [Google Scholar] [CrossRef] [PubMed]
  45. Panagou, E.Z.; Hondrodimou, O.; Mallouchos, A.; Nychas, G.J.E. A Study on the Implications of NaCl Reduction in the Fermentation Profile of Conservolea Natural Black Olives. Food Microbiol. 2011, 28, 1301–1307. [Google Scholar] [CrossRef]
  46. Kiczorowski, P.; Kiczorowska, B.; Samolińska, W.; Szmigielski, M.; Winiarska-Mieczan, A. Effect of Fermentation of Chosen Vegetables on the Nutrient, Mineral, and Biocomponent Profile in Human and Animal Nutrition. Sci. Rep. 2022, 12, 13422. [Google Scholar] [CrossRef] [PubMed]
  47. Knez, E.; Kadac-Czapska, K.; Grembecka, M. Effect of Fermentation on the Nutritional Quality of the Selected Vegetables and Legumes and Their Health Effects. Life 2023, 13, 655. [Google Scholar] [CrossRef] [PubMed]
  48. Mahidsanan, T.; Sittisart, P.; Phonanake, S. Characterization of Pickled Madan Made by Lactobacillus Plantarum NR-MD6-18 (K2) Fermentation. Songklanakarin J. Sci. Technol 2022, 44, 1412–1418. [Google Scholar]
  49. Kalinowska, M.; Gołebiewska, E.; Zawadzka, M.; Choińska, R.; Koronkiewicz, K.; Piasecka-Jóźwiak, K.; Bujak, M. Sustainable Extraction of Bioactive Compound from Apple Pomace through Lactic Acid Bacteria (LAB) Fermentation. Sci. Rep. 2023, 13, 19310. [Google Scholar] [CrossRef]
  50. Shenderov, B.A. Metabiotics: Novel Idea or Natural Development of Probiotic Conception. Microb. Ecol. Health Dis. 2013, 24, 20399. [Google Scholar] [CrossRef]
  51. Pérez-Díaz, I.M.; Breidt, F.; Buescher, R.W.; Arroyo-López, F.N.; Jiménez-Díaz, R.; Garrido-Fernández, A.; Bautista-Gallego, J.; Yoon, S.-S.; Johanningsmeier, S.D. Fermented and Acidified Vegetables. In Compendium of Methods for the Microbiological Examination of Foods; American Public Health Association: Washington, DC, USA, 2015. [Google Scholar] [CrossRef]
  52. Wouters, D.; Bernaert, N.; Conjaerts, W.; Van Droogenbroeck, B.; De Loose, M.; De Vuyst, L. Species Diversity, Community Dynamics, and Metabolite Kinetics of Spontaneous Leek Fermentations. Food Microbiol. 2013, 33, 185–196. [Google Scholar] [CrossRef]
  53. Karimi, R.; Mortazavian, A.M.; Karami, M. Incorporation of Lactobacillus Casei in Iranian Ultrafiltered Feta Cheese Made by Partial Replacement of NaCl with KCl. J. Dairy Sci. 2012, 95, 4209–4222. [Google Scholar] [CrossRef]
  54. Hystead, E.; Diez-Gonzalez, F.; Schoenfuss, T.C. The Effect of Sodium Reduction with and Without Potassium Chloride on the Survival of Listeria Monocytogenes in Cheddar Cheese. J. Dairy Sci. 2013, 96, 6172–6185. [Google Scholar] [CrossRef]
  55. Zhang, D.; Li, H.; Emara, A.M.; Wang, Z.; Chen, X.; He, Z. Study on the Mechanism of KCl Replacement of NaCl on the Water Retention of Salted Pork. Food Chem. 2020, 332, 127414. [Google Scholar] [CrossRef]
  56. Ndiaye, A.; Fliss, I.; Filteau, M. High-Throughput Characterization of the Effect of Sodium Chloride and Potassium Chloride on 31 Lactic Acid Bacteria and Their Co-Cultures. Front. Microbiol. 2024, 15, 1328416. [Google Scholar] [CrossRef]
  57. Pérez-Díaz, I.M.; Hayes, J.S.; Medina, E.; Webber, A.M.; Butz, N.; Dickey, A.N.; Lu, Z.; Azcarate-Peril, M.A. Assessment of the Non-Lactic Acid Bacteria Microbiota in Fresh Cucumbers and Commercially Fermented Cucumber Pickles Brined with 6% NaCl. Food Microbiol. 2019, 77, 10–20. [Google Scholar] [CrossRef] [PubMed]
  58. Aljahani, A.H. Microbiological and Physicochemical Quality of Vegetable Pickles. J. Saudi Soc. Agric. Sci. 2020, 19, 415–421. [Google Scholar] [CrossRef]
  59. Gu, Y.S.; Howard, L.R.; Wagner, A.B. Physicochemical factors affecting firmness of pasteurized jalapeno pepper rings. J. Food Qual. 1999, 22, 619–629. [Google Scholar] [CrossRef]
  60. Kim, H.-J.; Baik, M.-Y.; Kim, B.-Y. Permeation Rate of Salt and Sugar into Cabbage Pickles and Sensory Changes During Storage. Food Eng. Progress. 2018, 22, 366–373. [Google Scholar] [CrossRef]
  61. Llorca, E.; Puig, A.; Hernando, I.; Salvador, A.; Fiszman, S.M.; Lluch, M.A. Effect of Fermentation Time on Texture and Microstructure of Pickled Carrots. J. Sci. Food Agric. 2001, 81, 1553–1560. [Google Scholar] [CrossRef]
  62. Farouk, A.; El-Mageed, M.A.; Shaaban, H. Influence of Appropriate Starter Cultures on the Sensory Qualities and Volatiles of Fermented Broccoli and Onion Pickles. Egypt. J. Chem. 2022, 65, 93–101. [Google Scholar] [CrossRef]
  63. Shang, Z.; Ye, Z.; Li, M.; Ren, H.; Cai, S.; Hu, X.; Yi, J. Dynamics of Microbial Communities, Flavor, and Physicochemical Properties of Pickled Chayote during an Industrial-Scale Natural Fermentation: Correlation between Microorganisms and Metabolites. Food Chem. 2022, 377, 132004. [Google Scholar] [CrossRef]
  64. Sangija, F.; Martin, H.; Matemu, A. Effect of Lactic Acid Fermentation on the Nutritional Quality and Consumer Acceptability of African Nightshade. Food Sci. Nutr. 2022, 10, 3128–3142. [Google Scholar] [CrossRef]
  65. Ramírez, E.; Gandul-Rojas, B.; Romero, C.; Brenes, M.; Gallardo-Guerrero, L. Composition of Pigments and Colour Changes in Green Table Olives Related to Processing Type. Food Chem. 2015, 166, 115–124. [Google Scholar] [CrossRef]
Figure 1. Simplified method of brine-pickled apple preparation.
Applsci 15 03924 g001
Figure 2. pH changes in Granny Smith apples during fermentation.
Applsci 15 03924 g002
Figure 3. Changes in lactic acid production during apple fermentation.
Applsci 15 03924 g003
Figure 4. Linear correlation between LAB count and lactic acid content.
Applsci 15 03924 g004
Figure 5. Changes in reducing sugar content during apple fermentation.
Applsci 15 03924 g005
Figure 6. Changes in uronic acid content during apple fermentation.
Applsci 15 03924 g006
Figure 7. The dynamics of metallic ion concentrations during the experimental trial (n.s. = non significant).
Applsci 15 03924 g007
Figure 8. Antioxidant activity of pickled Granny Smith apples. Regarding the meaning of the grouping information rendered by the Tukey method, with 95% confidence, the letters from A–C indicate significant differences in the antioxidant activity results between the days of fermentation.
Applsci 15 03924 g008
Figure 9. Microbiota of pickled apple samples during the fermentation period: lactic acid bacteria (a), aerobic bacteria, (b) and yeast (c) counts.
Applsci 15 03924 g009
Table 1. Pearson correlation coefficients (r) between the samples’ physicochemical characteristics.
Salt SolutionVariablepHLactic AcidReducing SugarsUronic Acid
NaClpH1
KCl1
MgCl21
NaClLactic acid−0.87791
KCl−0.85401
MgCl2−0.88311
NaClReducing sugar0.8245−0.68731
KCl0.9549−0.76951
MgCl20.9868−0.89751
NaClUronic acid0.7043−0.53350.91041
KCl0.7296−0.34860.86041
MgCl20.7361−0.56180.80231
Table 2. The values of texture parameters.
ParameterFermentation Interval
0 Days7 Days14 Days21 Days28 Days35 Days
NaCl
Firmness, N4.69 ± 0.11 a4.33 ± 0.21 b5.74 ± 0.19 c1.75 ± 0.22 d1.70 ± 0.15 d1.74 ± 0.17 d
Cohesiveness0.69 ± 0.02 a0.48 ± 0.03 b0.53 ± 0.01 c0.49 ± 0.02 d0.46 ± 0.02 d0.44 ± 0.01 d
Springiness, mm4.64 ± 0.16 a2.95 ± 0.22 b3.27 ± 0.19 b2.66 ± 0.32 c2.92 ± 0.43 c3.15 ± 0.35 c
Chewiness, mJ5.55 ± 0.15 a1.43 ± 0.15 b1.19 ± 0.11 c0.96 ± 0.19 c0.66 ± 0.25 c0.71 ± 0.17 c
KCl
Firmness, N4.69 ± 0.11 a3.45 ± 0.18 b4.13 ± 0.23 c3.02 ± 0.22 d3.14 ± 0.19 d3.02 ± 0.15 d
Cohesiveness0.69 ± 0.02 a0.47 ± 0.01 b0.51 ± 0.01 c0.41 ± 0.03 d0.40 ± 0.02 d0.41 ± 0.01 d
Springiness, mm4.64 ± 0.16 a3.70 ± 0.19 b2.65 ± 0.21 c2.56 ± 0.17 c2.53 ± 0.23 c2.88 ± 0.16 c
Chewiness, mJ5.55 ± 0.15 a1.92 ± 0.14 b1.42 ± 0.15 c0.76 ± 0.12 d0.64 ± 0.21 d0.65 ± 0.14 d
MgCl2
Firmness, N4.69 ± 0.11 a4.29 ± 0.18 b5.35 ± 0.21 c4.42 ± 0.13 d4.98 ± 0.25 d4.76 ± 0.12 d
Cohesiveness0.69 ± 0.02 a0.51 ± 0.03 b0.46 ± 0.01 c0.48 ± 0.02 c0.46 ± 0.01 c0.46 ± 0.02 c
Springiness, mm4.64 ± 0.16 a3.47 ± 0.22 b2.61 ± 0.18 c2.84 ± 0.17 c2.95 ± 0.23 c3.04 ± 0.19 d
Chewiness, mJ5.55 ± 0.15 a1.69 ± 0.24 b1.61 ± 0.27 b1.29 ± 0.19 c1.34 ± 0.09 c1.31 ± 0.28 c
Values on the same line marked with different letters exhibited statistically significant differences (p < 0.05).
Table 3. Color values of fresh and pickled apples.
ParameterFermentation Interval
0 Days7 Days14 Days21 Days28 Days35 Days
NaCl
L*70.18 ± 0.65 a57.17 ± 1.28 b68.81 ± 0.30 c70.31 ± 1.47 d73.91 ± 0.86 d75.94 ± 0.63 e
a*1.14 ± 0.16 a−3.78 ± 0.76 b−0.49 ± 0.04 c−0.29 ± 0.04 d−0.27 ±0.05 d0.25 ± 0.03 e
b*15.34 ± 0.54 a16.47 ± 0.89 b15.57 ± 0.27 c14.46 ± 0.86 d13.67 ± 0.27 d13.25 ± 0.31 e
ΔE-13.96 ± 1.05 b2.14 ± 0.45 c1.68 ± 0.37 d4.32 ± 0.14 d6.19 ± 0.72 e
C*14.41 ± 0.79 a16.91 ± 0.99 b15.57 ± 0.27 c14.57 ± 0.83 d13.87 ± 0.28 d12.65 ± 0.93 e
h*84.38 ± 2.47 a−77.14 ± 2.17 b−88.20 ± 1.16 c−88.83 ± 1.22 d−88.85 ± 1.38 d88.93 ± 1.33 e
KCl
L*70.18 ± 0.65 a55.94 ± 0.53 b61.68 ± 0.86 c63.15 ± 1.45 d74.34 ± 1.48 d75.00 ± 1.65 e
a*1.14 ± 0.16 a−4.43 ± 0.53 b−1.50 ± 0.08 c−1.37 ± 0.09 d−1.11 ± 0.09 d0.69 ± 0.07 e
b*15.34 ± 0.54 a23.31 ± 1.21 b16.14 ± 0.23 c15.11 ± 0.87 d14.48 ± 0.82 d14.43 ± 0.24 e
ΔE-17.24 ± 1.17 b8.94 ± 0.63 c7.47 ± 0.83 d4.25 ± 0.86 d4.93 ± 0.34 e
C*14.41 ± 0.79 a23.73 ± 1.29 b16.21 ± 0.24 c15.18 ± 0.88 d14.52 ± 0.82 d14.46 ± 0.27 e
h*84.38 ± 2.47 a−79.26 ± 0.71 b−84.68 ± 1.28 c−84.84 ± 0.62 d−85.60 ± 0.79 d86.09 ± 1.21 e
MgCl2
L*70.18 ± 0.65 a53.42 ± 1.14 b71.39 ± 0.77 c72.56 ± 1.08 d73.10 ± 0.61 d74.79 ± 1.32 e
a*1.14 ± 0.16 a−5.56 ± 0.98 b−1.48 ± 0.16 c−0.78 ± 0.12 d−0.49 ± 0.03 d0.33 ± 0.02 e
b*15.34 ± 0.54 a17.46 ± 1.05 b15.55 ± 0.97 c14.65 ± 0.33 d13.57 ± 0.37 d13.41 ± 0.21 e
ΔE-18.17 ± 0.78 b2.89 ± 0.52 c3.13 ± 0.72 d3.78 ± 0.53 d5.06 ± 0.47 e
C*14.41 ± 0.79 a18.33 ± 1.33 b15.62 ± 0.98 c14.67 ± 0.33 d13.58 ± 0.36 d13.41 ± 0.23 e
h*84.38 ± 2.47 a−72.43 ± 2.01 b−84.59 ± 1.28 c−86.94 ± 0.67 d−87.92 ± 0.88 d88.59 ± 0.95 e
Values on the same line marked with different letters exhibited statistically significant differences (p < 0.05).
Disclaimer/Publisher’s Note: The statements, opinions and data contained in all publications are solely those of the individual author(s) and contributor(s) and not of MDPI and/or the editor(s). MDPI and/or the editor(s) disclaim responsibility for any injury to people or property resulting from any ideas, methods, instructions or products referred to in the content.